Projections of emissions from burning of biomass for use ...
16
91-128.4 Projections of Emissions from Burning of Biomass for Use in Studies of Global Climate and Atmospheric Chemistry Darold E. Ward Wei Min Hao USDA Forest Service Missoula, Montana //0 { ...... ==..J -- -- -- - AIR & WASTE MANAGEMENT ASSOCIATION • SINCE 1907 For Presentation at the 84th Annual Meeting & Exhibition Vancouver, British Columbia June 16- 21, 1991 This file was created by scanning the printed publication. Errors identified by the software have been corrected; however, some errors may remain.
Transcript of Projections of emissions from burning of biomass for use ...
91-128.4
Projections of Emissions from Burning of Biomass for Use in Studies of Global Climate
and Atmospheric Chemistry
Darold E. Ward Wei Min Hao
USDA Forest Service Missoula, Montana
//0 {......==..J - ------
AIR & WASTE MANAGEMENT ASSOCIATION
• SINCE 1907
For Presentation at the 84th Annual Meeting & Exhibition
Vancouver, British Columbia June 16- 21, 1991
This file was created by scanning the printed publication.Errors identified by the software have been corrected;
however, some errors may remain.
91-128.4
ABSTRACT
Projection of emissions from burning of biomass for use In studies of global climate and atmospheric chemistry. Darold E. Ward and Wei Min Hao, Intermountain Research Station, Fire Chemistry Project, USDA Forest Service, Missoula, MT 59807
Emissions of trace gases and particulate matter from burning of biomass are generally factored into global climate models. Models for improving the estimates of the global annual release of emissions from biomass fires are presented. Estimates of total biomass consumed on a global basis range from 2 to 10 Pg (1 petagram = 1015 g) per year. New data are now available for emission factors for a range of vegetation types and burning conditions for the tropical, mid-latitude, and boreal forest regions. We estimate the total emissions of CO, C02, CH4, non-methane hydrocarbons (NMHC), and particulate matter with a mean mass cut-point diameter of 2.5 ~tm (PM2.5) based on our algorithms for emission factors for different fuel type and burning condition variables. These emission factors are dependent on the efficibncy of the tire in oxidizing fuel carbon to C0
2-
combustlon efficiency (CE). For flaming combustion, the CE Is high. On the contrary, for smoldering combustion, the CE is low and emission factors for PM2.5, NMHC, CH
4, and CO are
high. With the exception of emission factors for C02, the emission factors for tropical savannah burning are lower than those used for many global estimates of emissions from biomass burning. Our total global estimates of emissions for PM2.5, NMHC, CH4, and CO are 48.7, 21. 1, 28.4, and 362 Tg per year (1 Teragram = 1012 g). One of the advantages of using algorithms based on a CE argument Is that the algorithms are dynamic in that they can account for the changing effect of climate and cultural practices on fire behavior and emissions production.
2

91-128.4
!. INTRODUCTION
The effect of smoke emissions on general air quality is well recognized and high concentrations of smoke from biomass fires are known to adversely effect human health. Radiation transfer through the atmosphere is affected by the particles and gases contained in the smoke which can lower the temperature near the earth's surface over the short-term (Roback 1989) and is hypothesized to have a net effect on raising the temperature over the long-term (Crutzen and Andreae 1990). Recently, the impact of smoke from tires in biomass fuels has been suggested as having a major impact on global atmospheric chemistry and to be one of the contributors to global climate change (Seiler and Crutzen 1980, Crutzen and Andreae 1990). According to Hao et al. (1990) and Crutzen and Andreae (1990), fires in biomass fuels consume approximately 1.8 to 4.7 Pg (l petagram = 1()1 5 g) ofcarboli per year. Global emissions of gases and particulate matter are generally calculated by multiplying the total biomass consumed by the appropriate emission factors for the gas and particle emissions of interest. Through the use of improved models for estimating emission factors for different ecosystems, we will demonstrate a method to improve the estimates of emissions from biomass fires. An emission factor is defined as the mass of gas or particulate matter emission released per unit mass of fuel consumed.
Most global estimates of emissions from the burning of biomass suffer from major limitations:
I) Often, a uniform emission ratio is used that in some cases is scaled to the C02 released from the fire.
2) The tests used for determining the emission rates are for a limited set of biomass types and fire behavior conditions which do not span the range of possible fires.
3) The system for estimating biomass consumption and emission factors is not dynamic. Hence, climate change cannot be factored into estimating the effect on biomass consumption or changes in the emission factors that result from changing fire and meteorological conditions.
4) Changing forestry and agricultural practices, i.e., deforestation, shifting cultivation, and crop rotation can affect the amount of biomass created and the fire behavior. This in turn affects the efficiency of the combustion process and the emission factors.
In this paper, we discuss the efficiency of the combustion process to oxidize the carbon released from the biomass during a tire. The combustion efticiency (CB) is defined as the p~rcent of the total carbon released from a fire in the form of CO~. The CE is high during the- flaming phase (90 to 98% complete), but during the smoldering combustion phase, emissions of CH4, CO, non-methane hydrocarbons (NMHC), and particulate matter (PM) increase in proportion to the CO released and inversely proportional to the C02• The CE drops significantly and ranges from 60 to 90% for the smoldering combustion process (Ward 1990). Many researchers have not quantified the CH4, NMHC and PM when measuring CO and C01 emissions. We use a modified combustion efficiency (MCE) as the independent variable to model the release of other carbon containing combustion products. The MCE is defined as the ratio of COr--C to the sum of CO--C plus C02-C (where "-C" signifies the mass of carbon). The MCE has been estimated for a number of fuel complexes based on measurements
3

91-128.4
made both in combustion laboratory facilities and in the field using sampling systems mounted on towers and others on airborne platforms. We will revise estimates of the total emissions released from the burning of biomass, globally. The improvement comes from refined models using MCE as the independent variable.
The results of our research (Ward and Hardy 1986, Ward et al., 199\a, Ward et al. 1991b, Ward and Hardy 1991, and Hao et al. 1991) are combined to form the generalized regression models tbr predicting emissions, Hao et al (1991) used a hood to collect samples of smoke for analyses of the content of the smoke. The work of Ward and Hardy (1986 and 1991) used tower and cable systems for supporting packages over fires In field situations. The results from the combustion hood, field ground measurements, and field airborne measurements are linked through the Independent variable MCE. Although the MCE measurement provides insight regarding the completeness of the combustion process, it does not explain all of the variances. Other factors, including the chemical composition of the fuel complex, the distribution of the mass of biomass within different size classes of fuels, the quantity of decomposed organic material within the fuel complex, the moisture content of the fuel components, are known to affect the way the fires burn (Rothermel 1974) and the gases released (Ward 1990).
2,0 MEASUREMENT TECHNIQUES
2.1 Tower measurements
Tower systems for supporting arrays of sampling devices above flames have been used for a number of different noar full-scale tire emissions experiments (Ward and Hardy 1991). A variety of fuel types, burning conditions, and methods of Ignition were studied (Ward et al. 1989, Susott eta!. 1990). Thirty-eight fires were studied in Oregon and Washington over a period of 8 years. The fires were in a variety of fuel types and burning conditions. Twenty-seven of the fires were of the broadcast type where area fires of a hectare or larger were ignited under sample packages. Eight test tires were burned of piled logging slash and the emissions sampled from each (Ward and Hardy 1986). Three individual tests were conducted for the chaparral fuels of southern California (Ward and Hardy 1989). Grab samples of the gases and particulate matter were collected simultaneously over predetermined times during the flaming combustion phase and subsequent samples collected during the smoldering combustion phase.
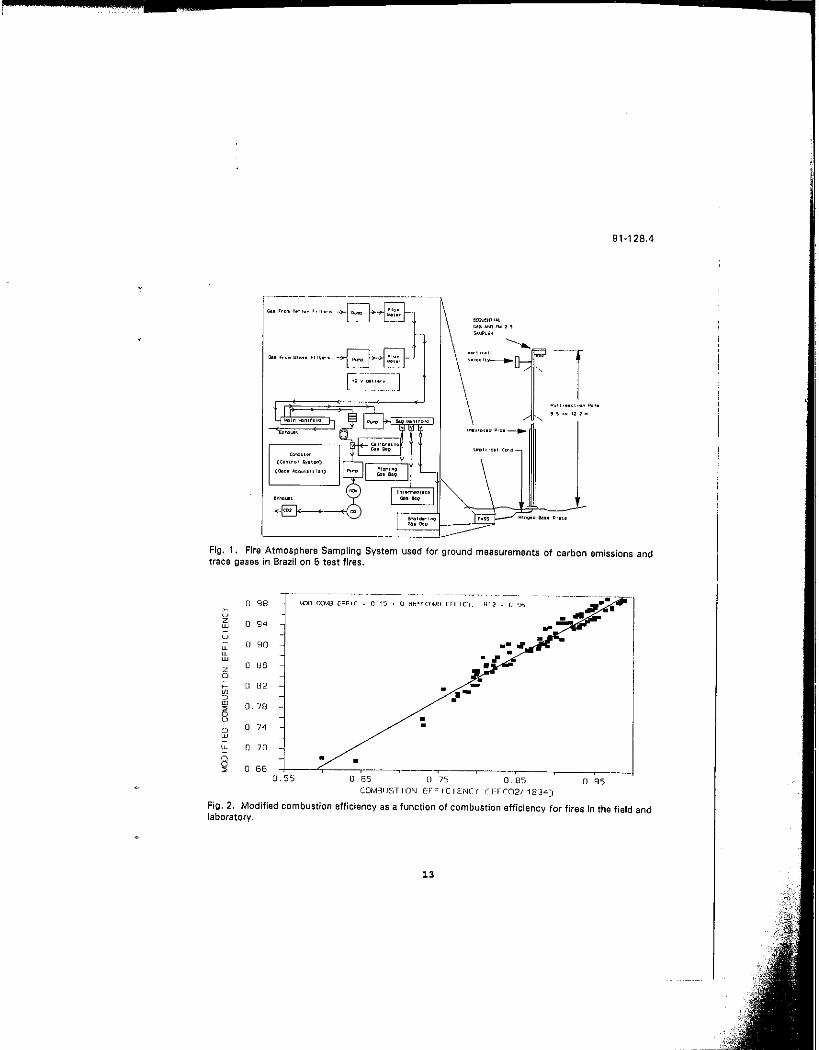
The sampling apparatus for ground sampling was configured to measure the concentration of emissions released and the vertical velocity of the stream of combustion products for different types of tires. In Oregon, Washington, and California, variations In the sampling method were used for tests of emissions from fuel types of broadcast tires, piled debris tires, and live brush tires (Ward and Hardy 1984). A modified system was used to acquire tire dynamics and_ chemistry measurements for 2 very large tires In Canada (Susott et al. 1990, Ward et al. 1990). The system illustrated in Fig. I was constructed for carrying as excess baggage Including the tower support systems and used on 5 tires In Brazil (Ward et al. in press), Other fires were sampled in North Carolina, but are not discussed in this paper.
These systems utilized real time measurements of the dominant carbon containing gases (CO and COJ, vertical velocity, and temperature to measure the release of carbon by phase of combustion (flaming and smoldering), A more detailed description of the methodology is given by Susott et al.
4
91-128.4
(1990) and Ward and Hardy (1991). These measurements, along with the grab samples of gases and particulate matter, for the flaming and smoldering combustion phases are used to weight the average emission factors for the fire. Additionally, the flux of carbon Is correlated with the rate of heat release and the rate of fuel consumption for the fire.
2.2 Combustion hood measurements
Another technique used for evaluating the emissions of trace gases employed a combustion hood inside a 3.0· x 2.2· x 2.15-m container. This system was configured so that about 0,5 kg, air-dried biomass, could be burned In a fuel bed tray (0.6- x 0.6-m). The slope of the tray was adjustable to allow the simulation of backing and heading tires (a backing fire Is a line of fire that moves Into new fuel in an upwind direction, whereas a heading fire moves Into new fuel In the same direction of the wind movement). The fuel bed tray was positioned on an automatic balance (E1210 and EB60, Mettler) to weigh the rate of fuel consumption during the time the fire was burning.
All the effluent gases were channelled through a stainless steel hood at 0.7 m above the tray. The hood is similar to an Inverted funnel with a base diameter of 1.2 m. Sampling probes for on~line instruments and grab samples were located at 2 m above the base of the hood. The weight loss, gas flow rates (Hoentzsch Exakt~ASD fan~wheel anemometer), temperatures (JENCO model 767 and 373 NiCr/Nl anemometer), and concentrations of CO and co,~ (Binos non~disperslve infrared analyzers) were monitored continuously every one or two seconds during the experiments, Grab samples were taken by passing effluent gases through a sampling probe and a glass fiber filter to evacuated stainless canisters. CH4 and NMHC in the canisters were analyzed within 24 hours after sampling. Other details of the experimental design are described by Hao et al. (1991),
3.0 RESULTS
Emission factor models were developed from the data for C02, CO, CH4, NMHC, PM, and PM2.5 as functions of CE (Ward and Hardy 1991, Hao et al. 1990). Results discussed in section 3.1 are tOr CO and C02• The results are applicable to a wide range of fuel and fire conditions. In section 3.2, CH4 is presented as a function of MCE which is affected by a variety of fuel variables. Hence, the NMHC, which are generally well-correlated with CH4, are likewise functions of these fuel and fire variables,
3.1 Emission factors for C02 and CO
The carbon mass balance method was employed exclusively for measuring the emissions produced per unit mass of carbon released (Ward et al. 1979, Nelson 1982, Ward and Hardy 1991). The carbon contained In the biomass fuel typically constitutes from 45 to SO% of the mass of the fuel. Generally, the carbon content Is assumed to be 50% of the mass of the fuel and Is represented chemically by the formula C6HQ04 (Byram 1959, Susott et al. 1990). We will not discuss the nitrogen or sulfur emissions, hence, the general formula is sufficient to provide the approximate ratio of elements In the consumed fuel.
CO and C02 make up 95% or more of the carbon released during the combustion of the fuels. We use a MCE variable to correlate with the emission factors. The ratio of CO to C02 has been used by
5

91-128.4
several investigators (Radke et al. 1990). The MCE, defined in section I, is linearly correlated with CE (Fig. 2), by the equation:
MCE = 0.15 + 0.86*(CE), R' = 0.96. (I)
Emission factors for C02 (EFCO~) can be calculated as a function of MCE by the following equation:
EFCO, = ((MCE-0.15)/0.86)'1834. (2)
EFC02 for 100% CE equals 1834 g/kg of biomass consumed (where the biomass is 50% carbon). Stated differently, the conversion of I kg of biomass fuel would release 1834 g of C02 from the 0.5 kg of carbon. From this relation, the EFC02 can be fixed for a given CE. The MCE can be used for calculating the emission factors for CO as follows:
CO,-C = EFCO,*(IZ/44),
CO-C = CO,-C'(I-MCE)/MCE.
(3)
(4)
The C02-C equals 450.0 g for aCE of0.9. Equation 1 would calculate a MCE of0.924. It follows that the CO-C accounts for 7.4% of the carbon released for a MCE of 0.924. The CO:rC plus the CO-C accounts for 97.4% of the total carbon released. The balance from the consumption of 1 kg of fuel, or 13 g of carbon, is distributed between the other carbon containing gases and particles. Other examples of CE, higher and lower than 90%, can be calculated to illustrate the distribution of carbon by following the same example.
3.2 Emission factors for CH4 and NMHC
The EFCH4 values were measured for a number of different fuel situations in North and South America. The least squares, linear regression model for the combined data using MCE as the independent variable has a very low R~ of 0.12, hardly of any predictive value. Upon further examination of the data collected during the burning hood experiments at the Max~Planck Institute (Hao et al. 1991), field experiments in the western United States (Ward and Hardy 1991), and field and airborne experiments in Brazil (Ward et al. 1990, Ward et al. in press), the data were stratified into three distinct fuel types: 1) grass and straw, 2) logging debris or woody material with an equal amount of decomposed litter and rotten wood, and 3) woody material with very little duff. Duff is defined as that material on the forest floor consisting of decomposed needles and woody materials that are no longer identifiable.
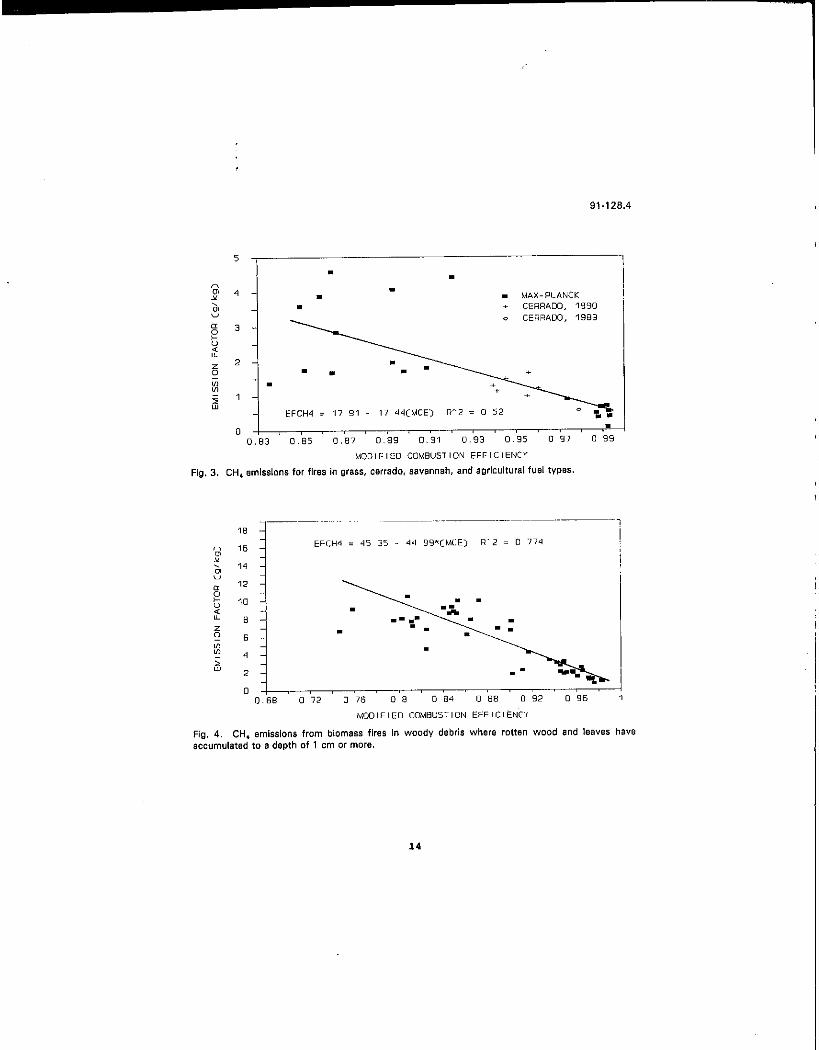
The model for the grass and straw and the fit of the linear regression model to the data generated from field tower, airborne, and laboratory studies is illustrated in Fig. 3. The best~fit, least-squares linear regression model for estimating EFCH4 is listed below:
EFCH, = 17.91- 17.44*(MCE), R2 = 0.52. (5)
Because of the large amount of burning that is done in the savannah and other grassland types, it is important that more research be done to refine the model expressed in Equation 5.
6
91-128.4
The model (Fig. 4) for logging debris and decomposed materials tits the broadcast burned slash with an R2 of 0.77. Further work is needed regarding the contribution of the decomposed organic horizon to the total available fuel. In some areas, consumption of the surface duff fuel is very light (Kauffman and Uh11990). On the other hand, for fuel complexes of the boreal and temperate regions, the duff component can make up 50% or more of the consumed biomass. Most of the duff layer of the fuel complex is consumed through smoldering combustion with resulting low CE and MCE values. The large emission factors for the products of incomplete combustion are a result of the high proportion of fuel consumption through smoldering combustion. All of the data used for the temperate and boreal zones are from test tires in the states of Washington and Oregon. The equation for this fuel type is as follows:
EFCH, = 45.35- 44.99'(MCE) R' = 0.77 (6)
The model (Fig. 5) for the woody fuels involves both burns in piled slash with little to no rotten material or duff and burns in Brazil of dead material including logs, leaves, etc. with little to no rotten or decomposed materials. The decomposition is extremely rapid in the tropical regions which increases the CE and resulting MCE. The model is as follows:
EFCH, = 87.25- 87.55'(MCE) R' = 0.71 (7)
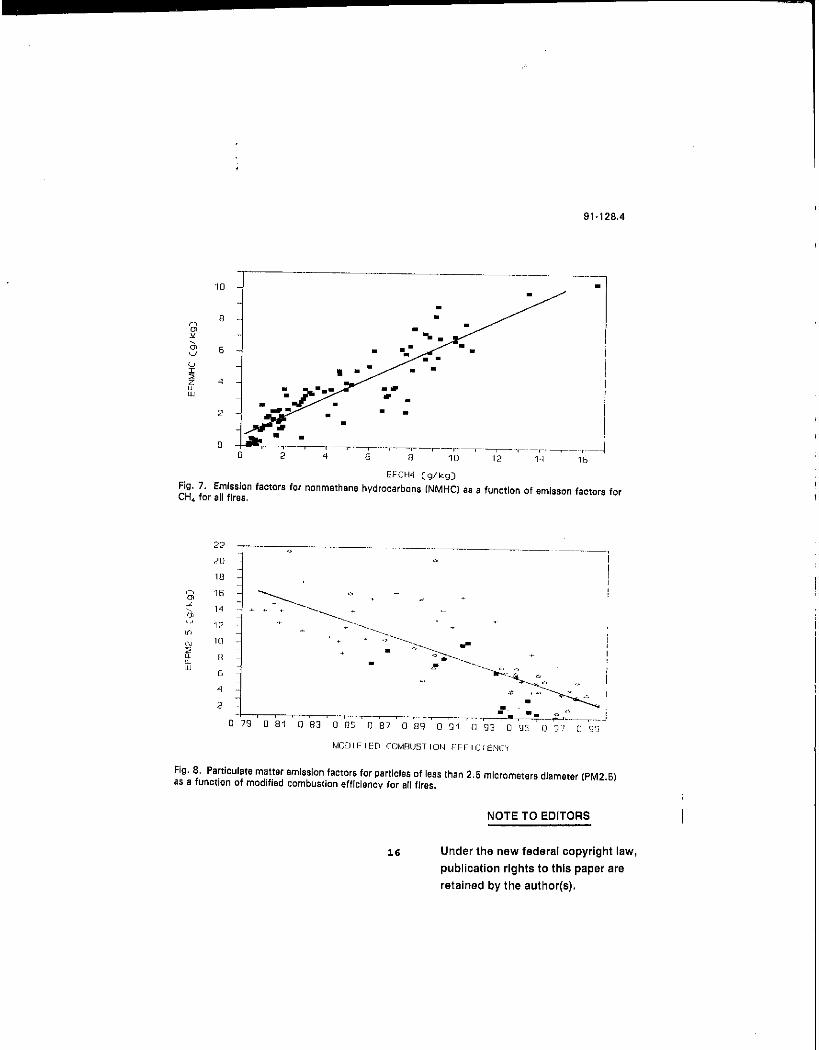
The different slope coefficients for regression models (Fig. 6) suggest different mechanisms involved for the different fuel types represented in the models. We have not attempted to correlate these findings with fuel chemica] properties of the biomass, but a major component of the research program at the Intermountain Fire Sciences Laboratory is directed toward this task. One possible explanation for the different models for different fuel types is the relative proportion of oxygen contained with the fuel molecules. The grass, hay, and straw are very high in cellulosic materials and likely have a higher proportion of oxygen than is found in the lignin-rich fuels of duff and downed logging debris. The NMHC compounds of the organic hydrocarbon fraction includes those hydrocarbons that are volatile at the temperature of collection. The EFNMHC turn out to be highly correlated with the EFCH4 as illustrated in Fig. 7 and expressed by the linear regression model,
EFNMHC = 0.50 + 0.63'(EFCH,) R' = 0,82 (8)
3.3 Emission factors for particles
The same stratification used for the EFCH4 model (Equations S to 7) did not help the performance of the EFPM2.5 model. In fact, the distribution of values of EFPM2.5 suggests one regression model for the composite set of data (Fig. 8). The least-squares model Is as follows:
E.FPM2.5 = 73.3 -7l.O'(MCE) R' = 0.60 (9)
4.0 GLOBAL EMISSIONS OF TRACE GASES AND PM2,5
One method for computing the global emissions released on an annuaJ basis is to perform an inventory of the biomass consumption and multiply this biomass by an appropriate emission factor. Hao et al. (1990) and Crutzen and Andreae (1990) reported global emissions based on the use of this
7
91-128.4
technique. We will use updated biomass consumption data compiled by Hao et al. (1990) and Hao (1991) with the best available estimates of MCE for estimating the appropriate emission factors.
4. I Biomass consumption
The amount of biomass burned per year (M) in each ecosystem is calculated by the following equation:
M = A*B*c:t*B (10)
where, A equals the area burned each year, B equals the loading of biomass fuel, a equals the fraction of the biomass that is above ground, and fl equals the fraction of above ground biomass that is consumed. The values used for the computation were derived from various published statistical data and have been discussed in detail by several authors (Seiler and Crutzen 1980, Hao et al. 1990, Crutzen and Andreae 1990, Hao 1991). The results are summarized In Table I, Most of the biomass burning occurs in the tropics in association with deforestation, shifting cultivation, savannah tires, and demand for energy from fuelwood and agricultural residues.
4.2 Emission factors
The emission factors are evaluated based on the CE and MCE for the different major classes of biomass consumption, Measurements of CE for the deforestation tires in the Amazon Region range from 83 to 95%, for cerrado tires from 92 to 97%, and for boreal and coniferous forest areas from 80 to 92% (Ward and Hardy 1991, Ward et al. 1990, Ward et al. 1991). The average CE (Table I) and MCE values (fable II) are used to calculate emission factors (calculated using Equations I to 9 and listed in Table II).
4.3 Emissions inventory
The emissions released by ecological type (Table III) are computed by multiplying the mass of biomass consumed (fable I) by the appropriate emission factor (Table II). The total emissions for the tropical regions account for 80 to 90% of the total emissions released from biomass burning on a global scale.
5,0 DISCUSSION OF RESULTS
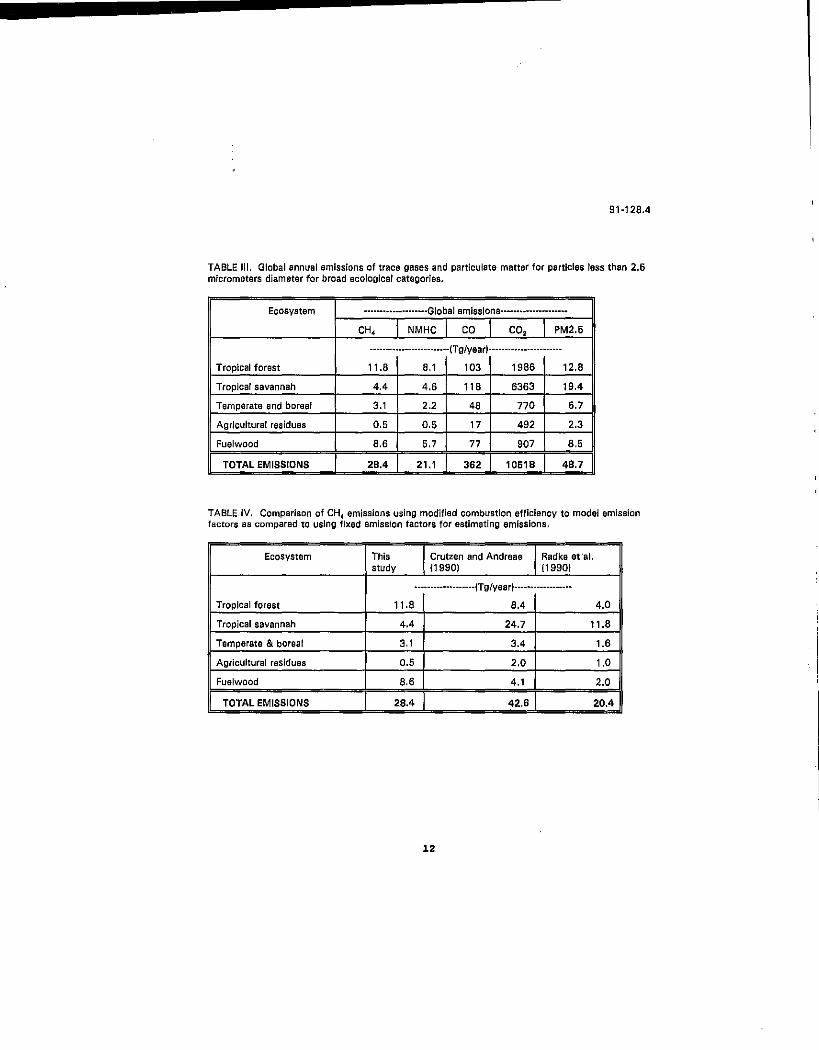
Comparison of our results with those of Hao et al. (1990), Crutzen and Andreae (1990), and Radke et aL (1990) are presented in Table IV for CH4• In general, when the emissions are calculated on an equal biomass consumption basis, the total emissions of CH4 are overesthpated by Crutzen and Andreae (1990) by 50% and underestimated by Radke eta!. (1990) by.28%, The differences are even more remarkable for the tropical savannah ecological type where our estimates are 18% of Crutzen and Andreae (1990) and less than 50% of the estimate calculated from the data of Radke et al, (1990), These large differences result from the wide variances in emission factors for the tropical ecosystems relative to the bor~al and temperate ecosystems (Equations 5 to 7).
The results of this study demonstrate the futility of making global estimates of emissions based on a limited data set. The prospects for developing models that predict emissions based on fuel parameters
8

91-128.4
and the influence of weather on the burning characteristics of the fire are good. Ratios of EFCO to other compounds, I.e., EFCH4, can be an effective method for extending a few measurements to a more extensive fuel type, but must be used with caution. The EFCH4 dependency on MCE in Equations 5 to 7 serves to illustrate the different response functions that can be obtained for different fuel complexes. Measurements made in North America seem to have excellent applications in the United States, but the models tOr predicting emissions from savannah fires and deforestation fires need further improvement. The EFCH, are different by a factor of 5 for the same MCE. For the tropical regions where about 80% of the biomass consumption occurs, this has serious implications regarding the accuracy of the estimates. Fortunately, the estimates for the deforestation fires have been low and the estimates for the savannah fires high which has compensated for the errors to some degree. However, the temporal distribution of fires between the savannah and deforestation fires is likely different so that the net emissions released into the atmosphere by season could be larger than previous estimates by a factor of 5 or more.
Our estimates of NMHC are higher than those of Radke et al. (1990) because of a generally higher EFNMHC ratio to EFCH4•
The estimate of global emissions of PM2.5 of nearly 50 Tg per year is the first estimate of the global emissions for the tine particle mode. The results are lower than those of Crutzen and Andreae (1990) for total particulate matter without regard to size by 50%. The fine particles remain suspended in the atmosphere for a longer period of time and affect the radiation transfer through the atmosphere to a greater extent than the coarse particle mode. The graphitic carbon content of the particulate matter is a function of the rate of heat release of the fires (Ward 1990). The higher intensity fires produce a higher percentage composition of graphitic carbon and inorganic content. Lower intensity fires produce particles of a higher organic composition. The fine particles are of additional significance because of the potential adverse health effects due to deposition within the pulmonary regions of the human lung.
6.0 CONCLUSIONS
We developed a set of equations relating the emission factors of trace gases and particulate matter to an independent variable MCE (COrC/(CO-C + C02-C)). The models are dynamic in the sense that variables (e.g., fuel moisture content, compaction of the fuel bed, loading of the fine fuels, etc.) that affect combustion efficiency also affect the emission factors for the products of incomplete combustion. This approach to modeling the appropriate emission factor for the ecosystems of interest is a significant improvement over conventional methods used for estimating global emissions from biomass burning. Our estimate of CH~ emissions on a global basis is lower than a recent estimate by Crutzen and Andreae (1990) by 33%. For the tropical savannah region, the emissions of CH4 may be 50 to 80% lower than previous estimates.
7.0 LITERATURE CITED
Byram, G.M. Combustion of forest fuels. In: Davis, K.P., ed. Forest fire: control and use. New York: McGraw Hill pp 61-89, 1959.
Crutzen, P. J. and M. 0. Andreae. Biomass burning in the tropics: impact on atmospheric chemistry and biogeochemical cycles.~. llQ, 1669-1678, 1990.
9
91-128.4
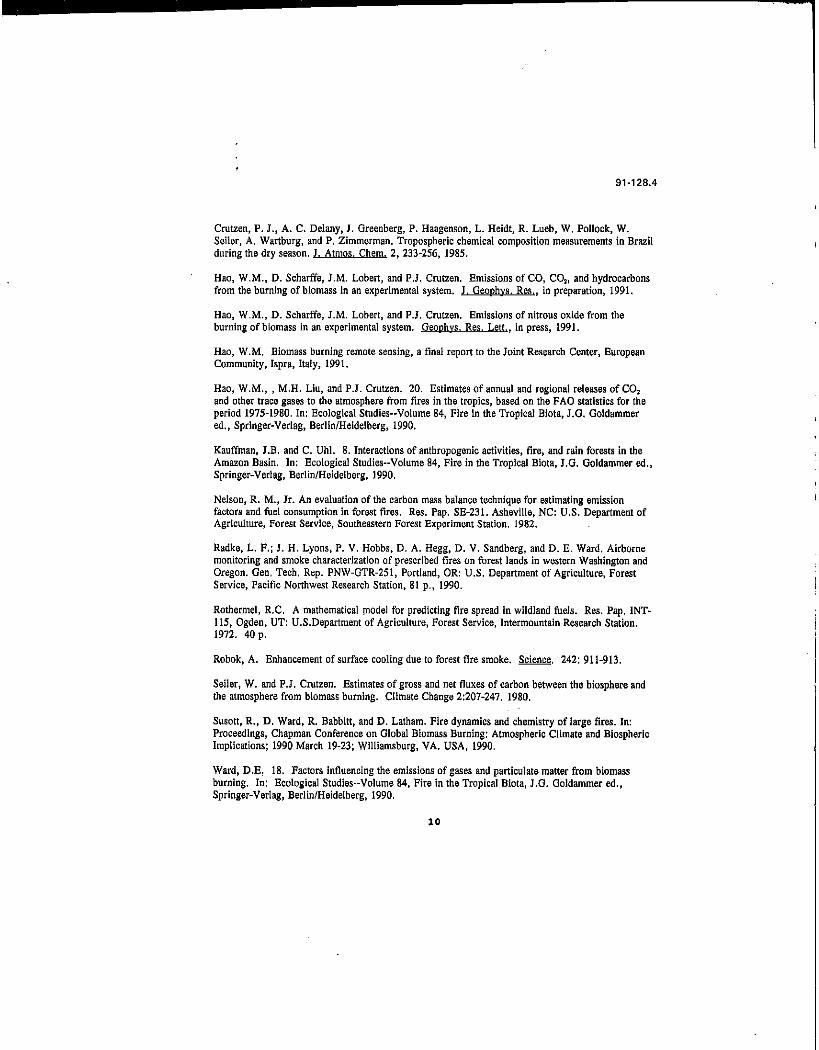
Crutzen, P. J., A. C. Delany, J. Greenberg, P. Haagenson, L. Heidt, R. Lueb, W. Pollock, W. Seiler, A. Wartburg, and P. Zimmerman. Tropospheric chemical composition measurements in Brazil during the dry season. J Atmos Chern 2, 233-256, 1985.
Hao, W.M., D. Scharffe, J.M. Lobert, and P.J. Crutzen. Emissions of CO, C02, and hydrocarbons from the burning of biomass in an experimental system. J Geophys Res , in preparation, 1991.
Hao, W.M., D. Scharffe, J.M. Lobert, and P.J. Crutzen. Emissions of nitrous oxide from the burning of biomass in an experimental system. Geophys. Res Lett, in press, 1991.
Hao, W .M. Biomass burning remote sensing, a final report to the Joint Research Center, European Community, Ispra, Italy, 1991.
Hao, W.M., , M.H. Liu, and P.J. Crutzen. 20. Estimates of annual and regional releases of C02
and other trace gases to the atmosphere from fires in the tropics, based on the FAO statistics for the period 1975~1980. In: Ecological Studies~~Volume 84, Fire in the Tropical Biota, J.G. Goldammer ed., Springer-Verlag, Berlin/Heidelberg, 1990.
Kauffman, J.B. and C. Uhl. 8. Interactions of anthropogenic activities, tire, and rain forests in the Amazon Basin. In: Ecological Studies--Volume 84, Fire in the Tropical Biota, J .G. Goldammer ed., Springer-Verlag, Berlin/Heidelberg, 1990.
Nelson, R. M., Jr. An evaluation of the carbon mass balance technique for estimating emission factors and fuel consumption in forest tires. Res. Pap. SE-231. Ashevllle, NC: U.S. Department of Agriculture, Forest Service, Southeastern Forest Experiment Station. 1982.
Radke, L. F.; J. H. Lyons, P. V. Hobbs, D. A. Hegg, D. V. Sandberg, and D. E. Ward. Airborne monitoring and smoke characterization of prescribed fires on forest lands in western Washington and Oregon. Gen. Tech. Rep. PNW-GTR-251, Portland, OR: U.S. Department of Agriculture, Forest Service, Pacific Northwest Research Station, 81 p., 1990.
Rothermel, R.C. A mathematical JDOdel for predicting fire spread in wildland fuels. Res. Pap. INT~ 115, Ogden, UT: U.S.Department of Agriculture, Forest Service, Intermountain Research Station. 1972. 40 p.
Robak, A. Enhancement of surface cooling due to forest tire smoke. Science. 242: 911-913.
Seiler, W. and P.J. Crutzen. Estimates of gross and net fluxes of carbon between the biosphere and the atmosphere from biomass burning. Climate Change 2:207-247. 1980.
Susott, R., D. Ward, R. Babbitt, and D. Latham. Fire dynamics and chemistry of large fires. In: Proceedings, Chapman Conference on Global Biomass Burning: Atmospheric Climate and Biospheric Implications; 1990 March 19-23; Williamsburg, VA. USA, 1990.
Ward, D.E. 18. Factors influencing the emissions of gases and particulate matter from biomass burning. In: Ecological Studies--Volume 84, Fire in the Tropical Biota, J.G. Goldammer ed., Springer-Verlag, Berlin/Heidelberg, 1990.
10

.
91-128.4
Ward, D. E., and C. C. Hardy. Advances in the characterization and control of emissions from prescribed fires, paper presented at 77th Annual Meeting, Air Pollut. Control Assoc., San Francisco, CA. 1984.
Ward, D. E., and C. C. Hardy. Smoke emissions from wildland fires. Environ lnt 17, 18 p., 1991.
Ward, D. E., R. M. Nelson, and D. F. Adams. Forest fire smoke plume documentation, paper presented at 72nd Annual Meeting, Air Pollution Control Association, Cincinati, OH. 1979.
Ward, D. E., A. Setzer, Y. Kaufman, and R. Rasmussen. Characteristics of smoke emissions from biomass fires of the Amazon region M BASE-A experiment. Chapman Conference on Biomass Burning, Williamsburg, VA. 1990.
TABLE I. Biomass consumption per year globally by broad ecological categories. The average combustion efficiency (percent of carbon released as CO:J as derived from field measurements and estimates based on laboratory and field observations in similar fuels.
Ecosystem Biomass burned
{Tg/year) Tropical forest Tropical savannah Temperate & boreal Agricultural residues Fuelwood
BURNED GLOBALLY • Hao et a1. 1~9u b Crutzen and Andreae 1990 • Hao 1991
1259' 3691"
500 298" 618"
6366
Combustion efficiency
{ratio) 0.860 0.940 0.840 0.900 0.800
TABLE 11. Modified combustion efficiency (ratio of C0 2 released divided by the sum of C02 plus the CO released) by major ecosystems on a global basis. The emission factors use the equations presented in the text as a function of the modified combustion efficiency
Ecosystem Modified combus· ··--·--·--·--·····-··Emission factors·--·--·--··-·--··
tion efficiency CH, NMHC co co, PM2.5
(ratio) ........................ (g/kg of fuel) ....................
Tropical forest 0.890 9.4 6.4 81.4 1577 10.1
Tropical savannah 0.958 1.2 1.3 31.9 1724 5.3
Temperate & boreal 0.872 6.1 4.3 95.3 1541 11.4
Agricultural residues 0.924 1.8 1.6 55.6 1651 7.7
Fuelwood 0.838 13.9 9.2 125.0 1467 13.8
1l
91-128.4
TABLE Ill. Global annual emissions of trace gases and particulate matter for particles tess than 2.5 micrometers diameter for broad ecological categories.
Ecosystem ··········-·········Global emissions·-···················
CH, NMHC co co, PM2.6
-·················-······(T g/yearl ········•·•············
Tropical forest 11.8 8.1 103 1986 12.8
Tropical savannah 4.4 4.6 118 6363 19.4
Temperate and boreal 3.1 2.2 48 770 6.7
Agricultural residues 0.5 0.5 17 492 2.3
Fuelwood 8.6 5.7 77 907 8.5
TOTAL EMISSIONS 28.4 21 '1 362 10618 48.7
TABLE IV. Comparison of CH4 emissions using modified combustion efficiency to model emission factors as compared to using fixed emission factors tor estimating emissions.
Ecosystem This Crutzen and Andreae Radke at ·ar. study 11990) 119901
···················(Tg/yea r)·······-----------
Tropical forest 11.8 8.4 4.0
Tropical savannah 4.4 24.7 11 .8
Temperate & boreal 3.1 3.4 1,6
Agricultural residues 0.5 2.0 1.0
Fuelwood 8.6 4.1 2.0
TOTAL EMISSIONS 28.4 42.6 20.4
12
...... '""' ....... -1~}...§J-'<>J\JfHlOAl
"'"'"""''' """""'
91-128.4
"'"""" ........ ..
Fig, 1. Fire Atmosphere Sampling System used for ground measurements of carbon emissions and trace gases in Brazil on 5 test fires.
·----~- - -------0 98 >.Oll CO.<B f.FFoc " 15 " en•rcr>MR ~FF I Ci. Jr2 " "" G z 0 94 w
u ~
0 90 .. w ~~
0 ll6 0
r 0 82
~-"' ~ "' 0. '")fJ ~ u • 0 0 74 w ... 0 70 0 • • 9 0 56 -~~
0.55 0 65 [) " 0 85 0 95 COMBIJST ION EI'I0 1CIENCf ' EFC0211834)
Fig. 2. Modified combustion efficiency as a function of combustion efficiency for fires in the field and laboratory.
13
91-128.4
5
• • n • " 4
" • MAX-PLANCK ;; • CERRA DO, 1990 v
0 CERRADO, 1989 a 3 0 >-u ~ ~
z 2 0
"' • "' ~ w
EFCH4 17 91 17 '-1'-l(MCE) R"2 "" 0 52 0
'lo•
0 • 0.83 0.85 0 . 87 0.89 0.91 0.93 0.95 0 97 0 99
MODIFIED COMBUSTION EFFICIENCY
Fig. 3. CH4
emissions for fires in grass, cerrado, savannah, and agricultural fuel types.
18
n
" 16 EFCH4 '-15 35 - «1•1 99"'(MCE) R. 2 = 0 774
" ' 14
" v
a 12 0 >- 10 u ~ ~ B z '? 6
"' "' 4 ~ w 2
. . •;..
··-:; ~-. . .. •
-~ 0
0.68 0 72 0 76 0 8 0 94 0 88 0 92 0 96
MODIFIED COMBUSTION EFFICIENO
Fig. 4. CH 4 emissions from biomass fires In woody debris where rotten wood and leaves have accumulated to a depth of 1 em or more.

.......... --------------------~----~~~
I
"
91-128.4
16 • ~ • PILES PNW
" 14 0 BRAZ AIRBORNE " BRAZ, TOWERS ); 12 u
" 10 • 0 >-- + u ~ 8 "- • z 6 • 0
"' 0++
"' ' ~ w 2
EFCH4 = 87 25 87 0
. SS*(MCE) R"2 = 0. 71
0 .86 0.88 0.9 0.92 0.94 D. 96 0. 98
MODIFIED COMBUSTION EFFICIENCY
Fig. 5. CH4 emissions from the combustion of biomass fuels where the fuels are primarily wood with very little rotten material.
24 n
" 7.25 -" 20 EFCH4 87. SS*(MCE) R"2 0. 71 ' " u
" f! 16
u ~ 12 "-z EFCH4 45. 44 99*(MCE) 0'2 0. 774 0
8
"' "' ~ 4 w
EFCH4 17 .91 17 .4"1*(MCE) R''2 '=" 0. 52 0 0 7 0 74 0 78 0 82 0 86 0 9 0 94 0 98
MODIFIED COMBUSTION EFFICIENCY
Fig. 6. Models for estimating emission factors for CH 4 by fuel type as a function of modified combustion efficiency.
15
'10
n 8
"' ~ <> 6 v u I ~
·1 z I •
~ w
• -:.L···.
2 -· • • •
0 0 2 4
• • ... ..
• .. • •
8
• • .. •
• . •
10
EFCH4 (g/kg)
• •
91-128.4
·----1
-~-.--1 12 16
Fig. 7. Emission factors for non methane hydrocarbons fNMHC) as a function of emlsson factors for CH4 for all fires.
.~
"' ~ ;;, " "' '-'~ ;;; u ~ w
22
?0
18
16
14
12
1()
" 6
4
2
---;c--·----.. -------------- --- -~-
MODIFIED CTJM8U5TIOH EFFICIENCr
-i I
Fig. 8. Particulate matter emission factors for particles of less than 2.5 micrometers diameter (PM2.5) as a function of modified combustion efficiency for all fires.
16
NOTE TO EOITOAS
Under the new federal copyright law,
publication rights to this paper are retained by the author(s).