DEVELOPMENT AND VALIDATION OF SHORT … kajian ini, 69-bp gen sitokrom b mitokondria dari spesies...
152
DEVELOPMENT AND VALIDATION OF SHORT AMPLICON-LENGTH PCR ASSAYS FOR THE DETECTION OF FELINE SPECIES IN PROCESSED FOODS MD. AL AMIN INSTITUTE OF GRADUATE STUDIES UNIVERSITY OF MALAYA KUALA LUMPUR 2015
Transcript of DEVELOPMENT AND VALIDATION OF SHORT … kajian ini, 69-bp gen sitokrom b mitokondria dari spesies...
DEVELOPMENT AND VALIDATION OF SHORT AMPLICON-LENGTH PCR ASSAYS FOR THE
DETECTION OF FELINE SPECIES IN PROCESSED FOODS
MD. AL AMIN
INSTITUTE OF GRADUATE STUDIES UNIVERSITY OF MALAYA
KUALA LUMPUR
2015

DEVELOPMENT AND VALIDATION OF SHORT AMPLICON-LENGTH PCR ASSAYS FOR THE
DETECTION OF FELINE SPECIES IN PROCESSED FOODS
MD. AL AMIN
INSTITUTE OF GRADUATE STUDIES UNIVERSITY OF MALAYA
KUALA LUMPUR
2015
DEVELOPMENT AND VALIDATION OF SHORT
AMPLICON-LENGTH PCR ASSAYS FOR THE
DETECTION OF FELINE SPECIES IN PROCESSED
FOODS
MD. AL AMIN
DESSERTATION SUBMITTED IN FULFILMENT OF
THE REQUIREMENTS FOR THE DEGREE OF MASTER
OF PHILOSHOPY
INSTITUTE OF GRADUATE STUDIES
UNIVERSITY OF MALAYA
KUALA LUMPUR
2015
i
UNIVERSITY OF MALAYA
ORIGINAL LITERARY WORK DECLARATION
Name of Candidate: MD. AL AMIN (I.C/Passport No: AE0815796)
Registration/Matric No: HGA120010
Name of Degree: MASTER OF PHILOSOPHY (M. Phil)
Title of Project Paper/Research Report/Dissertation/Thesis (“this Work”):
DEVELOPMENT AND VALIDATION OF SHORT AMPLICON-
LENGTH PCR ASSAYS FOR THE DETECTION OF FELINE
SPECIES IN PROCESSED FOODS
Field of Study: Biochemistry and Biology
I do solemnly and sincerely declare that:
(1) I am the sole author/writer of this Work;
(2) This Work is original;
(3) Any use of any work in which copyright exists was done by way of fair dealing
and for permitted purposes and any excerpt or extract from, or reference to or
reproduction of any copyright work has been disclosed expressly and
sufficiently and the title of the Work and its authorship have been
acknowledged in this Work;
(4) I do not have any actual knowledge nor do I ought reasonably to know that the
making of this work constitutes an infringement of any copyright work;
(5) I hereby assign all and every rights in the copyright to this Work to the
University of Malaya (“UM”), who henceforth shall be owner of the copyright
in this Work and that any reproduction or use in any form or by any means
whatsoever is prohibited without the written consent of UM having been first
had and obtained;
(6) I am fully aware that if in the course of making this Work I have infringed any
copyright whether intentionally or otherwise, I may be subject to legal action
or any other action as may be determined by UM.
Candidate’s Signature Date: March, 2015
Subscribed and solemnly declared before,
Witness’s Signature Date: March, 2015
Name:
Designation:

ii
ABSTRACT
Food falsification is a common concern, but has been mutually practiced in the
meat industry, especially for processing food products, for realizing an extra profit. The
everyday happenings such horse, porcine, rat and dog meats forgeries in various foods
have made consumers increasingly worried to safeguard their religious faith, health,
money and wildlife in natural habitats. The consumers of the Halal food market have
reached to 1.8 billion and turnover has crossed US Dollar 700 billion in 2012 and it has
been projected to reach at US$ 1.6 trillion by the 2030. Since the market is quite large
and opportunities in halal food business are huge, it has been targeted for adulteration for
a long time.
Consumption or mixing of feline ingredients in halal and kosher foods is
forbidden and various diseases such as SARS, anthrax and hepatitis could be transmitted
through feline meats. However, since feline species are abundant across the world without
market price and their meats are consumed in exotic foods, the chances of their
adulteration in common meats are very high. For meat specification, DNA-based
techniques are preferred over protein and lipid-based molecular identification schemes
since DNA biomarkers, especially the short-length one, is extremely stable even under
harsh processing condition (heat, pressure and additives chemicals) and compromised
states (natural decomposition) where most protein-based markers are denatured or
degraded.
Although several PCR assays have been proposed for feline species detection,
those assays are based on longer length target amplicon which are assumed to break down
under food processing treatments. Thus, a reliable detection of feline ingredients is crucial
for the safety of consumer health, religious faith and fair-trade economy. In this study, a
69-bp target of feline mitochondrial cytochrome b gene was selectively amplified using
iii
a pair of primers of the said species. The assay was specific for feline species under raw,
processed, admixed and commercial food matrices. The specificity of the developed assay
was checked against commercially important 14 terrestrial 5 aquatic and 5 plants species.
The target DNA stability under various food processing conditions such boiling,
autoclaving and microwaving that degrade DNA and exceptional constancy were found
in all treatments. The lower limit of detection of the assay was reflected by its ability to
detect 0.1 pg of feline DNA from raw meats, 0.01% (w/w) in different admixes and 0.1%
(w/w) of feline meats in burger as well as meatball formulations, respectively.
The PCR product was further authenticated by restriction digestion followed by
RFLP analysis in microfluidic-based lab-on a chip system. Theoretical analysis revealed
two RFLP fragments of length 43 and 26-bp which will be separated using a highly
sensitive microfluidic-based lab-on a chip system with a resolution of ≤10-bp. Very short
amplicon-length, extreme stability and high sensitivity suggested that this assay could be
used by the regulatory bodies for the routine assessments of feline species in food
forensics or archaeological investigations. Therefore, a short amplicon-length polymerase
chain reaction (PCR) was developed and validated it by restriction fragment length
polymorphism (RFLP) analysis for the authentication of feline meat in processed foods.

iv
ABSTRAK
Pemalsuan makanan merupakan kebimbangan umum, tetapi telah saling
diamalkan di dalam industri daging, terutama untuk hasil makanan, bertujuan mencapai
keuntungan lebih. Penipuan yang berlaku setiap hari melibatkan daging kuda, babi, tikus
dan anjing di dalam pelbagai makanan telah meningkatkan kebimbangan pengguna di
dalam menjaga larangan agama, kesihatan, kewangan dan hidupan liar di habitat asalnya.
Pengguna pasaran makanan Halal sudah mencecah 1.8 bilion dan perolehan telah
melampaui 700 bilion dolar AS pada 2012 dan disasarkan akan mencecah AS$1.6 trilion
menjelang 2030. Memandangkan pasaran yang meluas dan peluang perniagaan makanan
halal yang besar, ia telah menjadi sasaran pengadukan makanan sejak sekian lama.
Pengambilan atau pencampuran bahan berasaskan famili kucing ke dalam
makanan halal dan kosher adalah dilarang dan pelbagai penyakit seperti SARS, antraks
dan hepatitis boleh berjangkit melalui daging tersebut. Namun memandangkan spesies
famili kucing banyak terdapat di seluruh dunia tanpa harga pasaran dan dagingnya
dimakan di dalam makanan eksotik, peluang untuk pengadukan daging ini ke dalam
daging biasa sangat tinggi. Untuk spesifikasi daging, teknik-teknik berasaskan DNA lebih
cenderung digunakan berbanding skema pengesanan protein dan molekul berasaskan
lipid memandangkan penanda bio DNA, terutamanya amplikon yang bersaiz kecil
teramat stabil walau pun mengalami pemprosesan yang tinggi (tahap kepanasan, tekanan
dan bahan kimia tambahan) dan keadaan terkompromi (penguraian semulajadi) yang
mana kebanyakan penanda berasaskan protein akan ternyahasli atau ternyahgred.
Walaupun beberapa penilaian PCR telah dicadangkan untuk pengesanan spesies
famili kucing, penilaian-penilaian tersebut berasaskan saiz amplikon sasaran yang lebih
besar yang dijangka akan terurai apabila melalui pemprosesan makanan. Oleh yang
demikian, pengesanan campuran spesies famili kucing yang berkesan sangat penting
v
dalam menjamin keselamatan dan kesihatan pengguna, agama dan ekonomi perdagangan
adil. Dalam kajian ini, 69-bp gen sitokrom b mitokondria dari spesies famili kucing telah
diperincikan secara terpilih menggunakan sepasang primer daripada spesies tersebut.
Penilaian adalah spesifik kepada spesies famili kucing daripada matriks makanan mentah,
terproses, campuran dan komersial. Kekhususan penilaian yang dibangunkan telah
disemak dengan spesies yang penting secara komersial iaitu 14 spesies darat, 5 spesies
akuatik dan 5 spesies tumbuhan. Kestabilan DNA sasaran dalam pelbagai keadaan
pemprosesan makanan seperti pendidihan, pengautoklafan dan penggunaan gelombang
mikro yang mendegradasi DNA dan ketetapan luar biasa dilihat dalam semua rawatan.
Pengesanan had bawah untuk penilaian dilihat melalui kebolehan mengesan 0.1 pg DNA
spesies famili kucing dalam daging mentah, 0.01% (w/w) dalam pelbagai campuran
berbeza dan 0.1% (w/w), masing-masing dalam burger dan formulasi bebola daging.
Produk PCR seterusnya telah disahkan melalui pembatasan pencernaan diikuti
analisis RFLP dalam sistem cip makmal berasaskan mikro berbendalir. Analisis teori
mendedahkan dua cebisan RFLP berukuran 43 dan 26-bp yang akan dipisahkan
menggunakan sistem cip makmal berasaskan mikro berbendalir dengan peleraian ≤10-
bp. Amplikon bersaiz sangat kecil, kestabilan ekstrem dan sensitiviti tinggi
mencadangkan bahawa penilaian ini boleh digunapakai oleh badan kawal selia untuk
menjalankan ujian berkala terhadap spesies famili kucing di dalam forensik makanan dan
penyiasatan arkeologi. Dengan itu, satu reaksi rantai polimerase (PCR) amplikon bersaiz
kecil telah dihasilkan dan disahkan melalui analisis pembatasan panjang cebisan
polimorfisme (RFLP) untuk pengesahan kewujudan daging famili kucing di dalam
makanan terproses.

vi
ACKNOWLEDGEMENTS
Alhamdulillah, All Praises to Allah (SWT), The supreme Lord of the universe
who has given me enough strength and capability to complete my studies within my
expected time frame. Peace and blessing to Prophet Rasulullah (SAW), all the prophets
and families, his close friend and all Muslim.
I would like to express my deepest respect and gratitude to my supervisors,
Professor Dr. Sharifah bee Abd Hamid and Dr. Md. Eaqub Ali for their generous support,
outstanding guidance encouragement, advice and wisdom throughout my graduate study
at UM. Their willingness to sacrifice, their precious time to monitor and guide me during
the study periods in greatly appreciated. I also take this opportunity to thank Prof. Dr.
Shuhaimi Mustafa, Associate Prof. Dr. Jamil Ahmad Shilpi, Prof. Dr. AKM Mohiuddin
and Dr. Md. Mahfujur Rahman who shared their time and valuable knowledge for my
academic research. In line with this, I would like to extend my deepest gratitude Prof. Dr.
Jennifer Ann Harikrishna for her help to use the facilities in CEBAR, University Malaya.
To reach my destination, I was in need a handful of staff, colleagues and
laboratory personnel who have given their time, kind advises, technical assistance and
support during my research. Therefore, I’d like to thank all of them to make my dream
into a success. It was my great pleasure to get Dr. Zaira Zaman Chowduhry for making
the laboratory experiences enjoyable with strength. I was happy with my fellow lab-
members and friend, Md. Abdur Razzak, MA Motalib Hossain, Nur Raifana Binti Abdul
Rashid, Asing, Md. Ziaul Karim. SM Azad Hossain, Md. Motiar Rahman and Nina
Naquiah Binti Ahmad Nizar.
Thanks are also extended to all of my NANOCAT members and friends for their
input and cooperation during my study. Last but not least, I would like to thank my family
members especially my parents for their non-stop support, encouragement and love.

vii
TABLE OF CONTENTS
CONTENTS PAGE
ORIGINAL LITERARY WORK DECLARATION i
ABSTRACT ii
ABSTRAK iv
ACKNOWLEDGEMENT vi
TABLE OF CONTENTS vii
LIST OF FIGURES xi
LIST OF TABLES xiii
LIST OF SYMBOLS AND ABBREVIATIONS xiv
CHAPTER 1: INTRODUCTION 1
1.1 Background of the Study 1
1.2 Study Rational 4
1.3 Problem Statements 5
1.4 Research Objectives 5
1.5 Scopes of Work 6
1.6 Outline of the Present Work 7
CHAPTER 2: LITERATURE REVIEW 8
2.1 Prevalence of Meat Species Adulteration 8
2.2 Potentiality of Feline Meat Adulteration 9
viii
CONTENT PAGE
2.4 Risk of Cat Meat Consumption 11
2.5 Biomarkers in Species Detection 12
2.5.1 Mitochondrial DNA 12
2.5.2 Cytochrome B Gene (Cytb Gene) 13
2.6 Current Methods in Species Authentication 14
2.6.1 Protein Based Methods for Species Authentication 14
2.6.2 Lipid Based Methods for Species Authentication 17
2.6.3 DNA Based Methods for Species Authentication 17
2.6.3.1 Polymerase Chain Reaction (PCR) 18
2.6.3.2 PCR-Restriction Fragment Length Polymorphisms (PCR-RFLP) 24
2.6.3.3 Real Time PCR 28
2.7 Recent Meat Scandals in Processed Foods 36
2.8 Prospect of Processed Food Analysis 38
CHAPTER 3: MATERIALS AND METHODS 41
3.1 Sample Collection 41
3.2 DNA Extraction from Raw, Admixed, Heat Treated and Commercial
Products
43
3.3 Biomarker Development 44
3.3.1 Salient Features of Primer Designing 44
3.3.1.1 Length 44
3.3.1.2 Melting Temperature (Tm) and Mismatching 44
3.3.1.3 Secondary Structure 45
3.3.1.4 GC-Clamp 46
ix
CONTENT PAGE
3.4 Feline- Specific Primer Design 46
3.5 Pairwise Distance Analysis and Phylogenetic Tree Construction 48
3.6 PCR Assay Optimization and Gel Electrophoresis 48
3.7 Stability of Target DNA 49
3.7.1 Raw State 49
3.7.2 Compromised States 50
3.8 Specificity and Sensitivity of Target DNA 50
3.8.1 Ternary Mixed Background 50
3.8.2 Burger Formulations 51
3.8.3 Meatball Matrices 52
3.9 Restriction Fragment Length Polymorphisms (RFLP) Analysis 54
3.9.1 Restriction Enzyme Digestion 54
3.9.2 Products Authentication by RFLP Analysis 54
3.10 Summary of Methodology 56
CHAPTER 4: RESULTS 57
4.1 DNA Extraction and Quality Analysis 57
4.2 Feline Specificity Test 60
4.2.1 In-silico Analysis of Cross Specificity 60
4.2.2 In-silico Analysis of Feline Specificity in Commercial Products 66
4.3 PCR Optimization 66
4.4 Feline Specificity Test with Extracted DNA 67
4.5 DNA Stability Test under Compromised Conditions 68
4.6 Sensitivity of Target DNA 70
4.6.1. Raw State 70
x
CONTENT PAGE
4.6.2 Sensitivity Test in Ternary Mixtures 72
4.6.2.1 Cat-Beef-Chicken Admixes 72
4.6.2.2 Feline-Bovine-Wheat flour Admixes 73
4.6.2.3 Sensitivity in Burgers 74
4.6.2.4 Sensitivity in Meatball Matrices 77
4.7 Restriction Fragment Length Polymorphism (RFLP) Analysis 80
4.7.1 In-silico PCR-RFLP Digestion 80
4.7.2 Products Authentication by PCR-RFLP Analysis 81
CHAPTER 5: DISCUSSION 88
5.1 DNA Extraction 88
5.2 Biomarker Development 89
5.3 Feline Specificity 91
5.4 DNA Stability Test 92
5.5 Sensitivity Test 94
5.5.1 Raw and Ternary Background 94
5.5.2 Commercial Complex Background 96
5.6 PCR – RFLP Analysis 98
5.6.1 Restriction Enzyme Digestion 98
5.6.2 Products Authentication by RFLP Technique 99
CHAPTER 6: CONCLUSION 101
6.1 Conclusion 101
6.2 Recommendations for Future Work 103
REFERENCES 104
APPENDIX 119

xi
LIST OF FIGURES
FIGURE CAPTION PAGE
2.1 Recent meat scandal in food chain 10
2.2 Mammalian mitochondrial genome 14
2.3 Overall process of enzyme linked immune-sorbent assay
(ELISA) technique
16
2.4 Basic principles of PCR protocol 20
2. 5 Various steps of PCR-RFLP assay 25
2.6 Threshold cycle (Ct) or quantification cycle (Cq) and
calculation of target DNA copy number
29
3.1 Formation of secondary structure 46
4.1 Phylogenetic tree constructed using neighbor-joining method
with cytb gene sequences of land animals, fish and cob gene
sequence of plant species
63
4.2 3D plot showing mismatch and pairwise distance between cat
and others potential land animal, aquatic and plant species for
burger formulations
64
4.3 3D plot showing mismatch and pairwise distance between cat
and others potential land animal, aquatic and plant species for
burger formulations
65
4.4 3D plot showing mismatch and pairwise distance between cat
and others potential land animal, aquatic and plant species for
meatball formulations
65
4.5 Optimization of newly developed primer pairs on gradient
temperatures
67
4.6 Cross-amplification of feline-specific target (69 bp) 68
4.7 Stability of the feline target after autoclaving treatment 69
4.8 Stability of the feline target after boiling treatment 69
4.9 Stability of the feline target after microwave heating treatment 70
xii
FIGURE
CAPTION
PAGE
4.10 Sensitivity under 10-fold serially dilution target DNA from 10-
0.0001 ng respectively in raw or pure state
71
4.11 Sensitivity under 10-fold serially dilution target DNA from 10-
0.0001 ng respectively in autoclaving treatment
71
4.12 Sensitivity under 10-fold serially dilution target DNA from 10-
0.0001 ng respectively in boiling treatment
72
4.13 Sensitivity in cat: beef: chicken ternary admixture under raw,
autoclaved and oven heated states
73
4.14 Feline adulteration detection in feline, bovine and wheat flour
ternary mixtures
74
4.15 Feline meat detection in beef burger 75
4.16 Feline meat detection in chicken burger 75
4.17 Analysis of beef meatballs for feline adulteration under raw,
boiled and autoclaved treatment
77
4.18 Analysis of chicken meatballs for feline adulteration under
boiled and autoclaved treatment
78
4.19 In-silico digestion of feline species primer pairs with AluI
restriction enzyme
80
4.20 Products digested by RFLP analysis (gel image) 82
4.21 Products digested by RFLP analysis (electropherograms) 83
4.22 Screening of commercial products using PCR and RFLP
analysis (gel image)
84
4.23 Screening of commercial products using PCR and RFLP
analysis (electropherograms)
85

xiii
LIST OF TABLES
TABLE CAPTION PAGE
2.1 Key characteristics of the different DNA-based analytical
approaches
18
2.2 Identification of meat species using species-specific PCR assay 21
2.3 Identification of meat species using PCR-RFLP assay 26
2.4 Real-Time PCR in species detection 30
2.5 Recent meat scandal in burgers and meatballs 37
2.6 Percentages (%) of fraud labeling from different meat products 39
3.1 Sources of samples used in this study 42
3.2 Sequences of oligonucleotide used in this study 47
3.3 Ingredients used in the preparation beef, chicken and cat burgers
(100g)
52
3.4 A list of components commonly used to prepare beef, chicken
and cat meatballs (100g)
53
3.5 Primer pairs used in this experiment for product authentication
by RFLP analysis
55
4.1 DNA concentration and its purity obtained in this experiment 57
4.2 Mismatch comparison of the feline- specific forward and reverse
primers against commercially important species
61
4.3 Pairwise distances of 69 bp cytb site with common meat, fish,
and plant species used in this study
62
4.4 Screening of commercial beef and chicken burgers 76
4.5 Screening of commercial beef and chicken meatballs 79
4.6 Mismatch bases of studied species with feline specific primers
and the positions of AluI restriction sites of 69 bp-amplicon-
length
81
4.7 Statistics analysis of molecular size of lab-on-a chip based feline
specific PCR-RFLP assay before and after digested with
restriction enzyme
86
4.8 Analysis of feline meat in commercial burger and meatball
products
87

xiv
LIST OF SYMBOLS AND ABBREVIATIONS
$ : dollar
% : percent
: prime
C : degree celsius
g : microgram
l : microliter
M : micromolar
pg : picogram
≥ : greater than or equal to
3D : three dimensional
A : adenine
A260/A280 : ratio of UV at absorbance 260 nm and 280 nm
ABI : applied biosystem
AIDS : acquired immune deficiency syndrome
ATP 6 : ATPase subunit 6
BLAST : basic local alignment search tool
bp : base pairs
C : cytosine
COI : cytochrome c oxidase subunit I
Cq : quantification cycle
CE : capillary electrophoresis
Ct : threshold cycle
CTAB : Cetyl trimethyl ammonium bromide
cyt b : cytochrome b
DBKL : dewan bandaraya Kuala Lumpur
dH2O : distilled water
D-loop : displacement loop
DNA : deoxyribonucleic acid
dNTP : deoxyribonucleoside triphosphate
ds-DNA : double stranded- deoxyribonucleic acid
EC : European Commission
ELISA : enzyme-linked immunosorbant assay

xv
E-nose : electronic nose
FTIR : fourier transformed infrared
g : gram
G : guanine
GC-MS : gas chromatography-mass spectrometry
GHR : growth hormone receptor
h : hour
HIV : human immunodeficiency virus infection
HPLC : high performance liquid chromatography
IDT : integrated DNA technology
LC : liquid chromatography
LOD : limit of detection
MEGA5 : molecular evolutionary genetics analysis version 5
mg : milligram
MgCl2 : magnesium chloride
min : minute
ml : mililitre
mM : milimolar
mt : mitochondrial
mtDNA : mitochondrial deoxyribonucleic acid
NCBI : national center of biological information
ND2 : NADH dehydrogenase subunit 2
ND5 : NADH dehydrogenase subunit 5
ND6 : NADH dehydrogenase subunit 6
ng : nanogram
NI : not indicated
nt : nucleotide
NM : not mentioned
NR : not reported
PAGE : polyacrylamide gel electrophoresis
PCR : polymerase chain reaction
PCR-RFLP : polymerase chain reaction- restriction fragment length
polymorphism
psi : pounds per square inch
rpm : rotations per minute

xvi
rRNA : ribosomal ribonucleic acid
s : second
SARS : severe acute respiratory syndrome
T : thymine
Taq : Thermus aquaticus
Tm : melting temperature
UV : ultraviolet
w/w : weight/weight

CHAPTER ONE
INTRODUCTION
1
CHAPTER 1: INTRODUCTION
1.1 Background of the Study
Now a days consumers are over anxious about the ingredients of food which they are
purchasing and consuming from the food court, road side restaurant and groceries. A list
of factors including lifestyles (e.g. vegetarianism and organic food), diet (e.g. calories and
nutritional value), health hazardous issues (e.g. lack of allergens), and economic (e.g.
additional earnings) are potential reasons for differential values of various foods and
falsification of ingredients (Fajardo, González, Rojas, García, & Martín, 2010). More
importantly, consumers are not ready to accept minute level of tarnishing in their foods
regarding the spiritual devotion issues (e.g. pork is banned in some religious laws) (Arun,
Ciftcioglu, & Altunatmaz, 2014). Additionally, unlisted, misdescription, fake labeling, or
fraudulent ingredients in food products have been a serious issue having adverse effects
on humans in a several ways. The substituted materials appear very similar to the original
materials and thus it is really challenging to identify the false ingredients form the original
one (Ghovvati, Nassiri, Mirhoseini, Moussavi, & Javadmanesh, 2009). Moreover, mixing
of low-cost products as a substitute of original elements in high valued products is quite
a common practice in meat industry to cut down production cost and gain extra profit
(Hsieh and others, 1995). Thus the proper descriptions of food products has become a
mandatory to support a sustainable fair economy and prevent food forgery and restore
consumers trust (LMG, 1992; LMV, 1995 and TSV, 1995). It has been confirmed by
different food regulatory agencies and food control authorities that higher valued meats
have been replaced with lower valued ones in many countries (Liu, 2006).
2
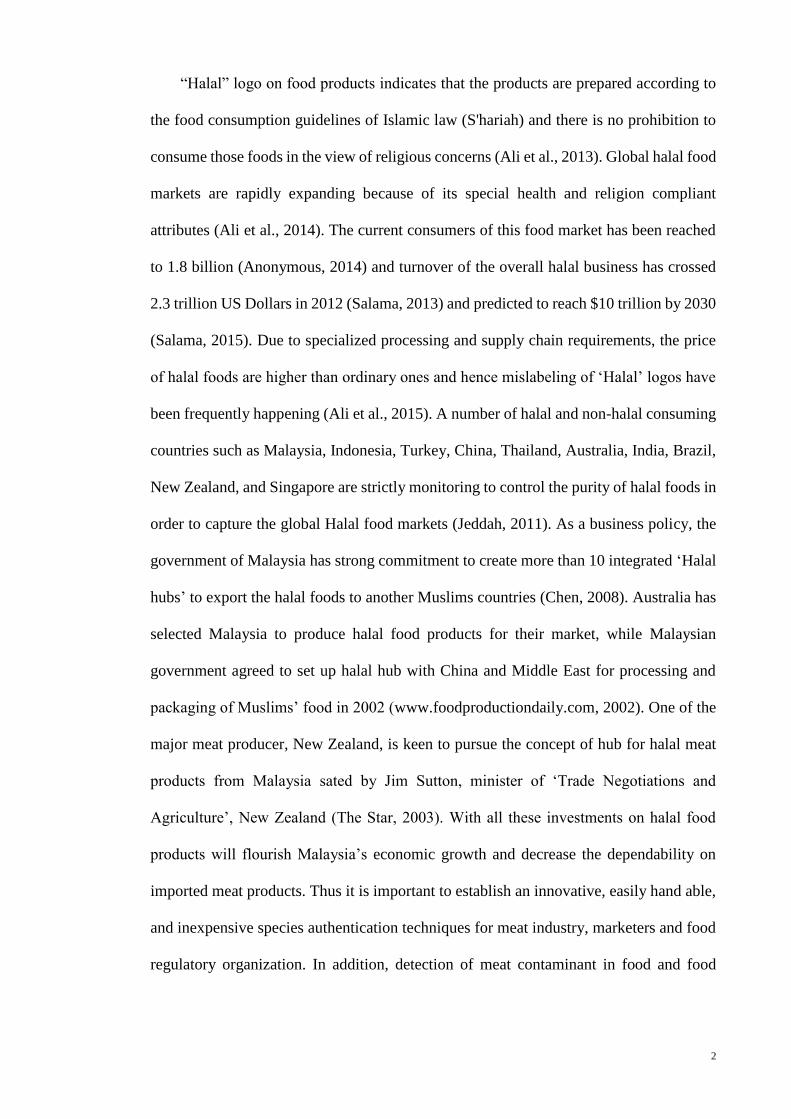
“Halal” logo on food products indicates that the products are prepared according to
the food consumption guidelines of Islamic law (S'hariah) and there is no prohibition to
consume those foods in the view of religious concerns (Ali et al., 2013). Global halal food
markets are rapidly expanding because of its special health and religion compliant
attributes (Ali et al., 2014). The current consumers of this food market has been reached
to 1.8 billion (Anonymous, 2014) and turnover of the overall halal business has crossed
2.3 trillion US Dollars in 2012 (Salama, 2013) and predicted to reach $10 trillion by 2030
(Salama, 2015). Due to specialized processing and supply chain requirements, the price
of halal foods are higher than ordinary ones and hence mislabeling of ‘Halal’ logos have
been frequently happening (Ali et al., 2015). A number of halal and non-halal consuming
countries such as Malaysia, Indonesia, Turkey, China, Thailand, Australia, India, Brazil,
New Zealand, and Singapore are strictly monitoring to control the purity of halal foods in
order to capture the global Halal food markets (Jeddah, 2011). As a business policy, the
government of Malaysia has strong commitment to create more than 10 integrated ‘Halal
hubs’ to export the halal foods to another Muslims countries (Chen, 2008). Australia has
selected Malaysia to produce halal food products for their market, while Malaysian
government agreed to set up halal hub with China and Middle East for processing and
packaging of Muslims’ food in 2002 (www.foodproductiondaily.com, 2002). One of the
major meat producer, New Zealand, is keen to pursue the concept of hub for halal meat
products from Malaysia sated by Jim Sutton, minister of ‘Trade Negotiations and
Agriculture’, New Zealand (The Star, 2003). With all these investments on halal food
products will flourish Malaysia’s economic growth and decrease the dependability on
imported meat products. Thus it is important to establish an innovative, easily hand able,
and inexpensive species authentication techniques for meat industry, marketers and food
regulatory organization. In addition, detection of meat contaminant in food and food
3
products beneficial to the consumers, patients and followers of faiths (Islam, Judaism,
Hindus, Vegetarians).
Minced meats are being frequently used in modern foods such as meatballs, burgers
and frankfurters (Ali, Hashim, Mustafa, & Man, 2012a) and its detection is extremely
difficult under the backgrounds of processed foods. For the detection of meat species in
the raw, processed and unprocessed foods, a number of analytical methods such as DNA
barcoding (Haye, Segovia, Vera, Gallardo, & Gallardo-Escárate, 2012), microarray chips
(Ali, Hashim, Mustafa, Che Man, & Islam, 2012d), PCR (Colgan et al., 2001), PCR-
RFLP (Ali et al., 2012a), real-time PCRs with SYBR green (Soares, Amaral, Oliveira, &
Mafra, 2013), Eva green (Santos et al., 2012), molecular beacon (Yusop, Mustafa, Man,
Omar, & Mokhtar, 2012) and TaqMan probe (Kesmen, Celebi, Güllüce, & Yetim, 2013;
Ulca, Balta, Cagin, & Senyuva, 2013), protein based methods includes electrophoretic
(Montowska & Pospiech, 2007), chromatographic (Chou et al., 2007) and spectroscopic
(Ellis, Broadhurst, Clarke, & Goodacre, 2005), FTIR (Rohman, Sismindari, Erwanto, &
Che Man, 2011), ELISA (Asensio, González, García, & Martín, 2008), nucleic acid
based biosensor (Ahmed, Hasan, Hossain, Saito, & Tamiya, 2010) and nanoparticle
sensors (Ali et al., 2011b) have been documented. Among all the methods, DNA based
molecular techniques have got preference since DNA is more stable under compromised
states and it provides universal information from all tissues and cells (Aida et al., 2005)
to enable authentication of minute amount of defile ingredients in processed and
unprocessed foods, especially of animal origins.
Cytochrome b (cytb) gene which is located in mitochondrial region of all species
having adequate inter-species polymorphisms (highly variable among other species)
(Asma, 2013) and intra-species conserved region (Hsieh, Chiang, Tsai, Lai, Huang,
Linacre & Lee, 2001; Linacre & Tobe, 2011; Matsuda et al., 2005; Parson et al., 2000)
and hence it has been extensively used for species identifications. A carefully chosen

4
sequence of cytb gene would generate distinctive restriction patterns following digest with
one or more restriction enzymes, allowing additional confirmation by RFLP analysis.
Species-specific PCR assay (Ali et al., 2013; Mane, Mendiratta, & Tiwari, 2012) have
been widely used to detect a single amount of target DNA in raw, processed and
unprocessed products because of its rapidity, simplicity, sensitivity and specificity
(Mafra, Ferreira, & Oliveira, 2007). Therefore, in this study a short-amplicon-length
feline-specific PCR assay was developed and validated by RFLP analysis using a lab-on-
a-chip based automated electrophoretic system.
1.2 Study Rationale
Feline meats have been consumed in many parts of the world such as Cambodia,
China, Thailand, and Vietnam for many years (Podberscek, 2009). Moreover, cat
population is huge in many countries and could be easily obtained without any offered
prices and having a significant chance to mix them in halal foods. Surely, cat meat
consumption is forbidden in Islam and Judaism and it is a potential carrier of hepatitis,
SARS, anthrax and some other deadly diseases (Anitei, 2006). It has been well believed
by researchers that the most incurable and transferrable disease, HIV (Human
Immunodeficiency Virus), AIDS (Acquired Immune Deficiency Syndrome), has been
transmitted to human race from African chimpanzee (Fajardo et al., 2010). On the other
hand, some meat scandal issue (i.e.: horse meat in Europe (Castle, 2013; Premanandh,
2013), pig and rat meat in China (Ali, Razzak, & Hamid, 2014) and cat meat in China and
UK (Phillips, 2013 and Chatterji, 2013)) have contributed to the concern of Muslim
consumers in defining the presence of forbidden biomaterials in the marketed foods (van
der Spiegel et al., 2012). Since feline ingredients in foods is a sensitive issue, hence a
5
method must be developed for its reliable detection under complex and processed food
matrices.
1.3 Problem Statements
Morphological, lipid and protein based species identification schemes is not
reliable for the analysis of processed foods. DNA based methods for species
authentication is reliable but most of the documented methods for feline species detection
involve very high amplicon-lengths which often break down under compromised
conditions. Thus the longer fragment might not be suitable for target species-detection in
processed foods. To the best my knowledge, this a first time report for a very short
amplicon-length (69-bp) PCR assay for the detection of feline meat in processed foods.
1.4 Research Objectives
The aim of this research is to develop a molecular techniques based on short
amplicon-length polymerase chain reaction (PCR) and validate its reliability by
restriction fragment length polymorphism (RFLP) analysis to identify the identity of
feline meats in processed foods. Therefore, the objectives of this study were:
I. To develop short-length PCR-biomarkers for feline species detection.
II. To characterize the developed biomarkers under complex matrices and food
processing conditions.
III. To apply the biomarker for the detection of the feline materials in processed
and commercial food products.
IV. To authenticate the amplified target product by RFLP analysis.
6
1.5 Scopes of Work
Short-length DNA markers are of enormous significance in biosensors (Jung,
Mun, Li, & Park, 2009), biochip (Iwobi, Huber, Hauner, Miller, & Busch, 2011) and
forensic applications (Aboud, Gassmann, & McCord, 2010). Short DNA markers offers
better target recovery from decayed samples, amplify efficiently, dispersed with higher
resolution and demonstrates extraordinary stability in harsh environments (Aboud et al.,
2010). Currently, a number of PCR based assays have been developed with long DNA
fragments which are not reliable for the verification of highly degraded mixed biological
and commercial specimens. Consequently, a short-amplicon-length PCR assay has a
countless demand in forensic investigations (Hird et al., 2006). However, developing a
short-length PCR assay needs extra care since within a short-sequence region, there
should be adequate species-specific fingerprints. PCR technique combined with
restriction fragment length polymorphism (RFLP) scheme can authenticate real PCR
products if the targets contain suitable restriction site within it (Aida, Che Man, Wong,
Raha, & Son, 2005; Murugaiah et al., 2009). Therefore, in this study, a PCR and PCR-
RFLP assay with short-amplicon-length was proposed containing DNA markers which
are present in multiple copies per cell (Murugaiah et al., 2009) and have proper restriction
sites inside it. Further, the assay will be optimized and validated under complex matrices
of commercial meat products to make them trustworthy for the screening of commercial
foods.
7
1.6 Outline of the Present Work
This dissertation comprises of six chapters. The contents of the individual chapters are
outlined as follows:
Chapter 1: This chapter has briefly described the background information regarding the
potential reasons and negative impact of adulteration, currently available meat
authentication techniques, significance of using mt-cytb gene as a target, research gap and
study objectives.
Chapter 2: A review of literature on existing methods to identify animal species in foods
and feeds, importance of mitochondrial gene, short length biomarker and prospect of
processed foods addressed in this chapter. The reasons to select short length DNA
biomarker as a target of my method is outlined.
Chapter 3: In this chapter, the materials, procedures, equipment, instruments,
bioinformatics tools used for designing biomarker and in-silico analysis of restriction sites
have been presented. Additionally, the details of specificity, sensitivity and target stability
under various matrices have also been stated.
Chapter 4: Out comes all the analytical and experimental of short length biomarker and
their application in raw, treatment, admixtures, processing and commercial meat products
are illustrated in this chapter.
Chapter 5: This chapter has discussed and compared all of the experimental analysis
with the previously published literatures.
Chapter 6: This is the last chapter and wraps up the dissertation with some concluding
remarks and recommendations for future works.

CHAPTER Two
LITERATURE REVIEW

8
CHAPTER 2: LITERATURE REVIEW
2.1 Prevalence of Meat Species Adulteration
Adulteration, i.e. substitution of more expensive materials with inexpensive
materials is a mutual global practice which is forbidden by the federal and state
regulations (Liu, 2006). Selling of fake meats in the name of pure meats as well as
fraudulent labeling of meat ingredients have been rampant in many countries such as
China, The United Kingdom, Turkey, Australia, Canada, the United States and across the
Europe (Ayaz, Ayaz, & Erol, 2006; Odumeru, Boulter, Knight, Lu, & McKellar, 2003).
Approximately, 19.4 % of meat products in the United States (Hsieh et al., 1995), 22 %
in Turkey (Ayaz et al., 2006) 15 % in Switzerland, and 8 % in the United Kingdom were
found to be mislabeled (Ballin, Vogensen, & Karlsson, 2009). In turkey undeclared
species was found in fermented sausages (39.2%), cooked salami (35.7%), frankfurters
(27.2%), meatballs (6.2%), and raw meats (22.2%) (Ayaz et al., 2006) and no beef was
found as 5% beef in sausage sample (Ali et al., 2014). Another survey was conducted on
the restaurant industries and it was confirmed that only 9 out of 37 samples contained
accurate ingredients of Mediterranean fish species (Asensio, 2008a). Additionally, Zha et
al. (2010) demonstrated that fraud labeling in deer products especially heart, blood, and
antler has been taken place frequently. More recently, in China, rat and pork meats were
sold as lamb and mutton and for involvement in this event 904 criminals were arrested by
Chinese police. They were involved in an illegal marketing of pork, rat, fox, mink, and
other meats after treating with additives like gelatin and sold them as a lamb (Ali et al.,
2014). Another thunder bold was fallen down on the Shaanxi state in China, where more
than 20 tons of fake beef which was processed with chemically treated pork were seized
by police (Jeanette, 2013). On the other hand, porcine DNA in Cadbury chocolates
(Rahman et al., 2014), even though it has been resolved by the religious department of

9
the Malaysian authority after its initial detection, and bread made up with pork, lard and
casings of pig intestine in sausages sample (Che Man, Aida, Raha, & Son, 2007) are an
alarming issues in Malaysia. These incidents and happenings have put us on red alert that
nothing could be granted for authenticity without proper testing and verification.
2.2 Potentiality of Feline Meat Adulteration
For ethical and sympathetic concerns, certain section of population does not like
to consume the meat of pigeon and pet animals (Haunshi et al., 2009) Islam and Judaism
do not permit a trace amount of pork meat according to the food consume guidelines in
their diet. Vegetarians and semi-vegetarians are another group of the culture who are
completely negative to eat any types of meats in their dishes. A large number of
consumers choose to take more chicken in the place of beef and pork while the
communities of Hindus and Buddhist religion do not prefer to consume beef meat as a
religious’ faith (Bonne & Verbeke, 2008). Similarly, feline meats or materials are not
permitted to consume in certain food consumptions guidelines such as Islam and Judaism
and undeclared feline meat as adulterant in another meat products might cause food
allergy. It has also been reported that cat meat was sold as a rabbit meats after repackaging
by slaughterers in eastern China (Phillips, 2013) and was served as Indian curry in the
UK restaurant in 2013 (Chatterji, 2013) (Figure 2.1). An illegal slaughter house was dig
up by the Chinese police since the mixing of thousands of domestic cat was unearthed as
a horrifying episode to the consumers (Phillips, 2013). A latest report indicated that, a
large number of dead body of stray and domesticated cat were sold as profitable and
illegal trading, whereas in Guangdong and Guangxi southern provinces of China it was
sold at 10 yuan (£1) for each animal to be used as contaminant in the regular food chain
system (Phillips, 2013).

10
Figure 2.1 Recent meat scandal in food chain. In (a), cat meat served as Indian curry in
UK restaurant in 2013. In (b), cat meat in a boiling pot to serve in China. In (c), horse
meat found in burgers in Europe. In (d), rat meat sold as lamb meat in China. (Source:
some public safety blog and http://www.guardian.co.uk/world/2013/may/03/china-fake-
meat-rat-mutton).
2.3 History of Feline Meat Consumption
From the ancient time to still now, regardless of the aim of domestication feline
meat has been used human consumption (Podberscek, 2009). In Cyprus, domestic cat was
consumed in the early period of 8,500 BCE (Vigne, Guilaine, Debue, Haye, & Gérard,
2004). Later, it was spread out to the United Kingdom in the 17th century (Thomas, 1991),
in China in the 14th century (Podberscek, 2009), and in France and Germany in the 18th
century (Ferrieres, 2006). Nowadays, though cat meat was out lawed in certain countries
11
and huge protection has been given by animal welfare group, consumption of feline meat
has been reported in Cambodia, China, Thailand, Vietnam, South Korea, some parts of
Europe, Russia, Africa and Latin America (Podberscek, 2009).
Historically, cat meat has been consumed as part of traditional cultures, health
benefits, and religious belief and in some countries its consumption has been reflected as
a symbol of national pride (Podberscek, 2009). For instances, cat meat is taken as an
aphrodisiac and used for a treatment of rheumatism and arthritis (Podberscek, 2009). It
has been estimated that about 100,000 cats are killed in South Korea, whereas 4 million
cats are eaten every year in China (Bartlett & Clifton, 2003). Additionally, a liquid or
‘juice’ was prepared from cats for consumption as a ‘tonic’ for health benefits in South
Korea and China (Podberscek, 2009), thus it is most popular for giving warming effect in
the winter seasons (Podberscek, 2009). Since there is no census data for cat population in
many parts of the world and there is no open market for selling cat meats, thus it could be
considered as a highly potential adulterant in halal foods and meat products.
2.4 Risk of Cat Meat Consumption
Feline meat are most potential carriers of hepatitis, SARS (Severe Acute
Respiratory Syndrome), anthrax and some other deadly zoonoses (Anitei, 2006).
Research shows that sourcing, farming, transporting, slaughtering and consumption of
cats can assist in the transmission of cholera, trichinellosis and rabies (Podberscek, 2009).
In addition, researchers have found that the animal originated ‘zoonotic’ threats like
severe acute respiratory syndrome (SARS) initiated from the live animal markets of China
via human to human transition (Anitei, 2006).
12
2.5 Biomarkers in Species Detection
Nucleic acids (i.e. DNA and RNA) are considered as the blue print of life and
proteins are as the building blocks of all living organisms. When nucleic acids (DNA and
RNA) and proteins work for biological indicators of the physiological state of all
organisms, they are termed as biomarkers (Vu, 2011). Biomarkers or genetic marker is
commonly used as a recognition elements for the precise detection of the sources of
biological materials (DNA, RNA, proteins). Thus biomarker based assays are the most
important advanced techniques to detect crime in forensic sciences (Andreasson, Nilsson,
Budowle, Lundberg, & Allen, 2006), control food contamination and animal consumption
(Maria. et al., 2011) and prevent the illegal trade of plant, animal and others endangered
species (Kyle and Wilson, 2007).
2.5.1 Mitochondrial DNA
Mitochondrial DNA has played a significant role both in the field of human and
animal forensics with numerous scientific applications (Matsuda et al., 2005; Nelson &
Melton, 2007; Rastogi et al., 2007). It has been also popularly used in population genetics
and phylogenetic analysis (Bataille, Crainic, Leterreux, Durigon, & de Mazancourt, 1999;
Nakaki et al., 2007; Pereira, Meirinhos, Amorim, & Pereira, 2006). A number of reasons
and benefits behind the using of mtDNA for the development of biomarkers over the
nuclear DNA are: (1) mitochondrial DNA found in all biological materials; (2)
Mitochondrial DNA is more abundant (100 – 1000x) than genomic DNA (Bellis, Ashton,
Freney, Blair, & Griffiths, 2003; Prado, Calo-Mata, Villa, Cepeda, & Barros-Velazquez,
2007); (3) provide more information due to the codon degeneracy; (4) protected by its
own mitochondrion organelle and thus preserved it from all degraded condition; (5)
mitochondrial DNA is highly variable (Prado et al., 2007) and mutation fixation is much
faster than nuclear DNA (Murugaiah et al., 2009).

13
2.5.2 Cytochrome B Gene (Cytb Gene)
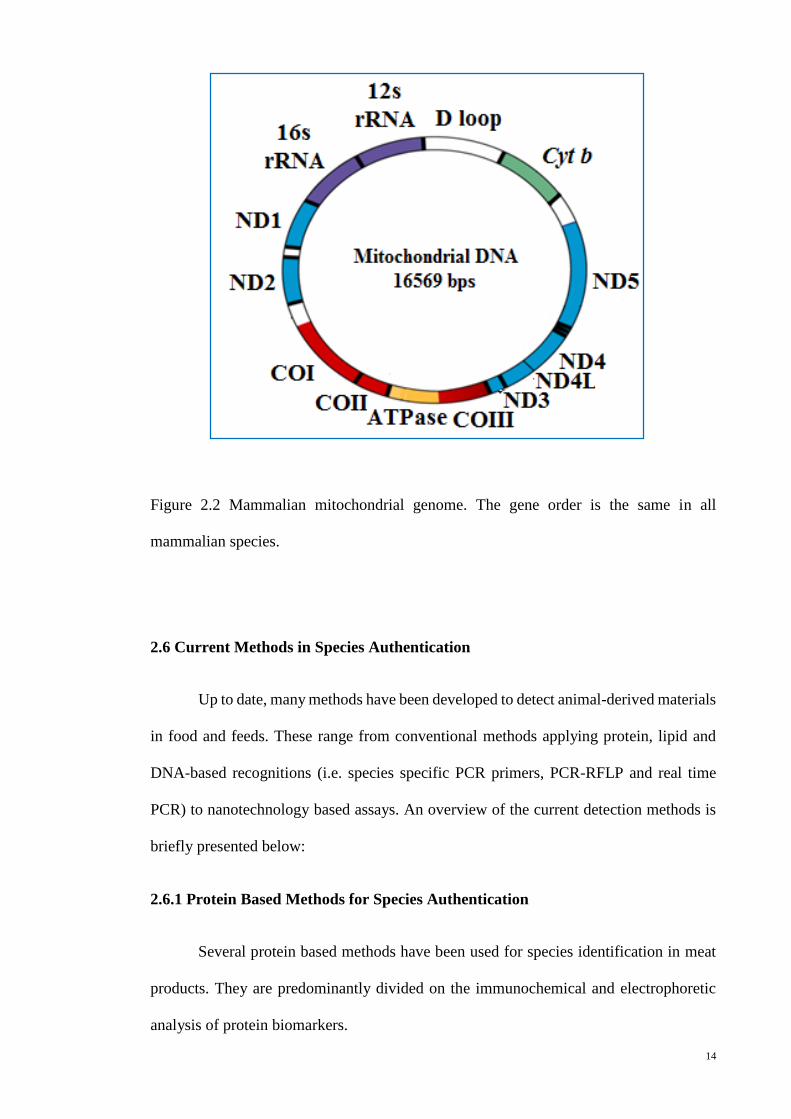
A number of mitochondrial genes or regions namely cytochrome b, cytochrome
oxidase (i.e. CO1, CO2 and CO3), ATP6, 12S rRNA, 16S rRNA, NADH dehydrogenase
subunit (i.e., ND1, ND2, ND3, ND4, ND4L, and ND5) and D-loop (Figure 2.2) can be
used for the design of biomarker for species identifications in food and food mixtures
(Vu, 2011). Among all the mitochondrial genes, cytochrome b is an ideal candidate which
is commonly used in species detection as it is species specific (Hsieh et al., 2001; Linacre
& Tobe, 2011; Matsuda et al., 2005; Parsons et al., 2000), and therefore, inter and intra
species relationships are additional advantageous to create molecular phylogeny
(Birstein, Doukakis, Sorkin, & DeSalle, 1998) and evolutionary study (Kvist, 2000).
Mitochondrial encoded cytochrome b gene is commonly used in phylogenetic work since
it contains both conserved and variable regions which are adequate to resolve divergence
at population level. However, cytochrome b gene was found to more informative than
others gene (Aida et al., 2005). It can be easily distinguish with relatively short-amplicon-
length fragment which survive under different compromised state (Tobe & Linacre,
2008).
14
Figure 2.2 Mammalian mitochondrial genome. The gene order is the same in all
mammalian species.
2.6 Current Methods in Species Authentication
Up to date, many methods have been developed to detect animal-derived materials
in food and feeds. These range from conventional methods applying protein, lipid and
DNA-based recognitions (i.e. species specific PCR primers, PCR-RFLP and real time
PCR) to nanotechnology based assays. An overview of the current detection methods is
briefly presented below:
2.6.1 Protein Based Methods for Species Authentication
Several protein based methods have been used for species identification in meat
products. They are predominantly divided on the immunochemical and electrophoretic
analysis of protein biomarkers.
15
Isoelectric focusing (IEF), gel electrophoresis can be used to separate protein
profile of minced meat mixtures on polyacrylamide gel based on PH gradient. The
separated proteins are stained with coomassie blue or silver staining reagents. IEF has
successfully been applied to discriminate meat and fish species in a raw state but it is not
applicable in heat or processed background since the heat soluble proteins are denatured
and degraded easily and quickly at extreme temperature and pressure. Furthermore,
isoelectric focusing technique cannot distinguish closely related species and often
provides identical protein profiles and require huge amount of high quality of proteins.
On the contrary, sodium dodecyl sulfate - capillary gel electrophoresis (SDS-CGE) is an
alternative form of protein analytical process as it can isolate hundreds of components
simultaneously and highly sensitive and easily automated (Vallejo-Cordoba & Cota-
Rivas, 1997).
Liquid chromatography (LC) and high performance liquid chromatography
(HPLC) protein based methods developed to focus on protein profiles and capable to
detect animal specific histidine dipeptides, carnosine, anserine, balenine, respectively in
ruminant feed (Aristoy & Toldra, 2004; Schönherr, 2002). Both of these methods are
sensitive and can identify as low as 1% (w/w) and ± 0.5% in pure binary mixtures of
chicken and turkey (Ashoor & Osman, 1987), and known animal mixtures (Aristoy &
Toldra, 2004; Schönherr, 2002) separately. However, these methods cannot specify the
exact source of animal derived proteins in a complex matrices (Aristoy & Toldra, 2004).
Although, mass spectrometry and gel digestion are of electrophoretic techniques
combined with novel proteomic tools which were successfully used to apply species-
specific sarcomeric proteins (myosin light chain) identifications in processed mixtures of
different species (Martinez & Jakobsen Friis, 2004; Pischetsrieder & Baeuerlein, 2009)
these techniques are laborious, costly, requires skilled personnel for handling and not
reliable for complex mixtures (Pischetsrieder & Baeuerlein, 2009).

16
Another protein based technology is suitable for testing species determination in
food and feed components through immunological approaches including enzyme linked
immune-sorbent assay (ELISA) technique (Figure 2.3). In this methods, antibodies rose
against a target antigen (a substance that produce an immune response) are immobilized
to a solid surface followed by the detection of antigen-antibody interactions by the virtue
of a labeled enzyme that converts a suitable substrate into a color product or releases an
ion which reacts with another reactant to generate a detectable change in color (Bonwick
& Smith, 2004). However, this approaches can be applied on site and result can be get
within 15 min (Muldoon, Onisk, Brown, & Stave, 2004) but it is time consuming, need
specially trained experts and sometimes give false result with blood contaminated meat
from other species.
Figure 2.3 Overall process of enzyme linked immune-sorbent assay (ELISA) technique.

17
2.6.2 Lipid Based Methods for Species Authentication
Lipid based analytical tools have limited applications in food and foodstuff for
species determinations and are less reliable. Fats and fatty acids components used in the
preparation of processed food products (Marikkar, Ng, & Man, 2011; M. Nurjuliana, Che
Man, Mat Hashim, & Mohamed, 2011b; Rohman et al., 2011) can be determined by
Fourier transform infrared (FTIR) spectroscopy. Moreover, gas chromatography-mass
spectrometry (GC-MS) is a powerful and sensitive technique that performs an important
role to identify the lard content which is used to replace vegetables oil in processed foods.
This techniques demands well trained experts to operate the instrument, more expensive
and time consuming; though it can produce precise and reliable results (M. Nurjuliana et
al., 2011b; M Nurjuliana, Man, & Hashim, 2011a). Electric nose which is also known as
e-nose is an up to date non-destructive, fast and easily operative analytical tool applied in
food industry to monitor quality control, processing, cleanliness, legitimacy and shelf-life
(Peris & Escuder-Gilabert, 2009). Conversely, e-nose finding has to be validated by a
more reliable methods such as GC-MS.
2.6.3 DNA Based Methods for Species Authentication
DNA based methods have been widely used and are becoming more popular for
the identification, quantification, detection and monitoring of adulterated species in food
and feeds due to its inexpensiveness, rapidity and accuracy (Ali et al., 2012b). The
advantages of DNA analysis are: (1) DNA-based approach are more appropriate for
analysis of heat-treated products as DNA is more stable to extreme temperature and
pressure (Lockley & Bardsley, 2000); (2) the presence and characteristics of DNA are
independent of the cell types, (i.e. Identical genetic information is contained in different
samples such as blood, muscle or bone); (3) DNA consists numerous information due to

18
the genetic code degeneracy. Table 2.1, represents a summary of the key characteristics
of the different DNA-based analytical approaches.
Table 2.1 Key characteristics of the different DNA-based analytical approaches
Features PCR PCR-RFLPs Real Time
PCR
Quantity of information Adequate Adequate High
Prerequisite of prior information Yes Yes Yes
Applicable to detection of admixtures Yes Yes Yes
Inter-laboratory reproducibility High Poor High
Sensitivity Moderate Moderate High
Throughout capacity Moderate Moderate High
Compulsion of end point detection Yes Yes No
Cost of equipments and reagents Cheap Cheap Expensive
Ease of use Simple Simple Difficult,
need trained
experts
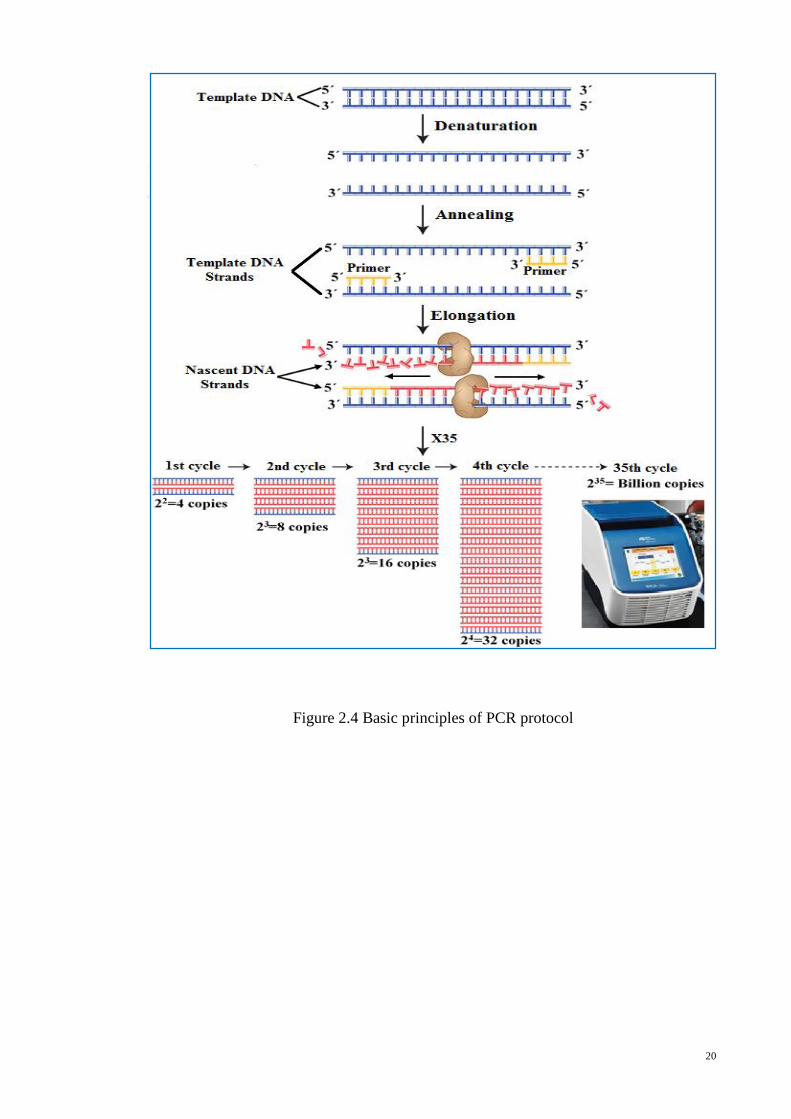
2.6.3.1 Polymerase Chain Reaction (PCR)
The polymerase chain reaction (PCR) methods used to amplify a segment of
specific DNA fragment present in a complex mixtures of a other DNA molecules thus
produce more than thousands of identical copies, and the technique was invented by Kary
Mullis in 1983. There are three fundamental steps involved in a PCR cycling reaction
known as (1) denaturation, (2) annealing and (3) elongation and every steps are completed
on the basis different temperatures. Denaturation is the first step of PCR reaction starts at
94C that breakdowns the double stranded DNA in to two single stranded DNA. During
annealing, the temperature is increased from 52C to 65C, enables to bind each primer
19
specifically to the 3´ end of the target sequence on the appropriate strands of DNA. At the
final or extension stage, the temperature is raised to 72 C to enable the synthesis of
nascent single stranded DNA from the template using the free nucleotides and the
enzymatic activity of Taq DNA polymerase prior to the start of next round denaturation
(Figure 2.4). Therefore, the amplified PCR products is run on agarose gel or
polyacrylamide by ethidium bromide or other non-carcinogenic DNA staining with an
appropriate molecular size marker after completion of all the desired cycles of
amplifications. The methods, polymerase chain reaction established itself to be more
accurate, highly sensitive, robust (Ali, Hashim, Mustafa, & Che Man, 2011a; Che Man,
Mustafa, Khairil Mokhtar, Nordin, & Sazili, 2012; Yusop et al., 2012), easy to handle
without any expensive equipment and chemicals (N.S. Karabasanavar, Singh, Kumar, &
Shebannavar, 2014) and is currently the most widely used for the detection of different
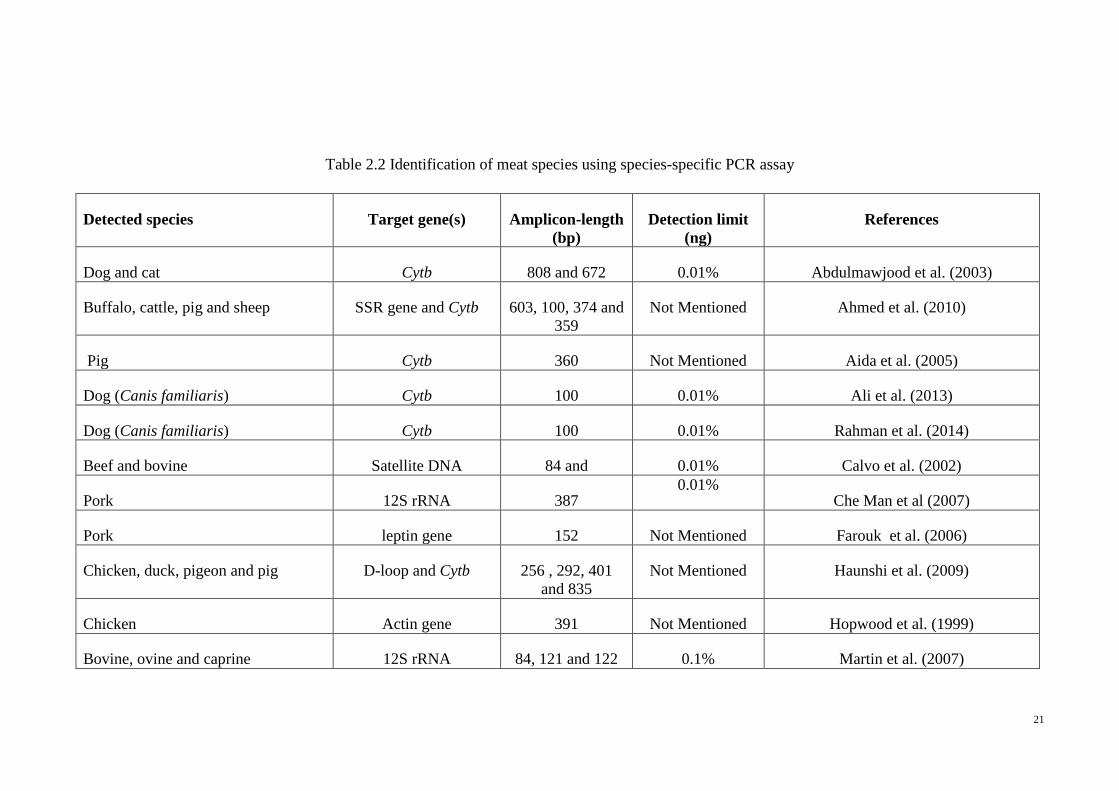
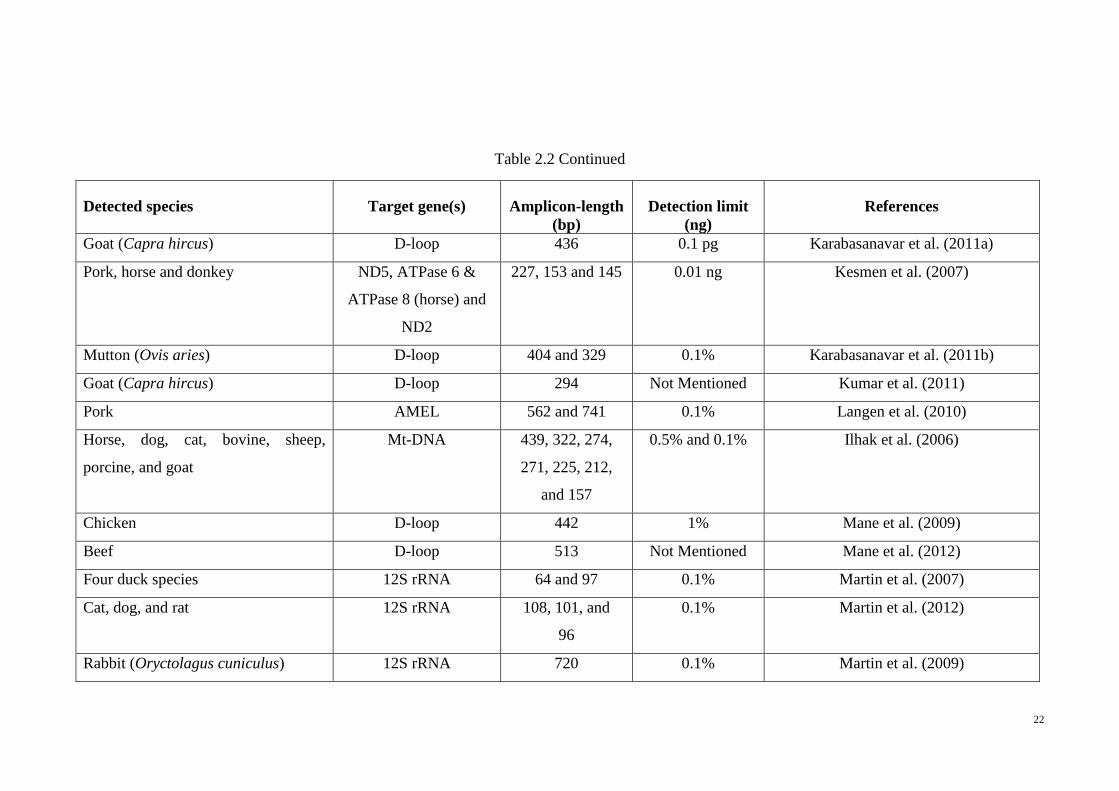
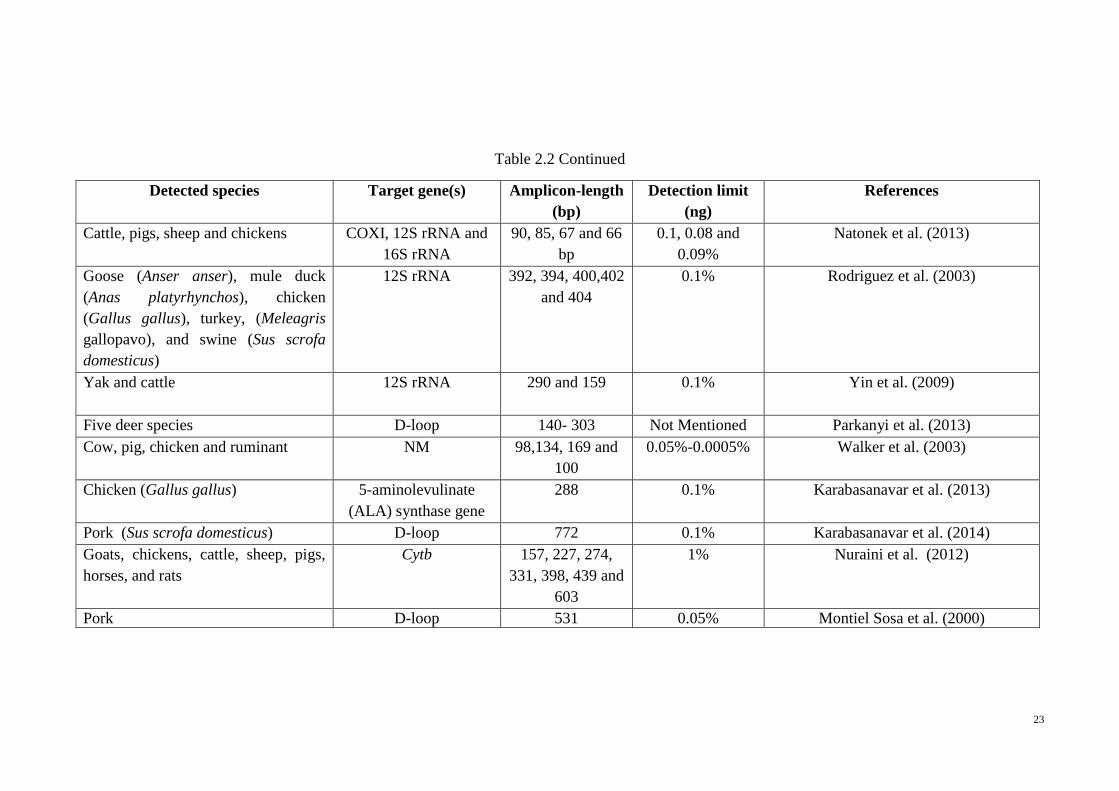
animal species in raw, processed and commercial food products. The brief history of
species-specific PCR assays in meat species verification is documented in Table 2.2.
20
Figure 2.4 Basic principles of PCR protocol
21
Table 2.2 Identification of meat species using species-specific PCR assay
Detected species Target gene(s) Amplicon-length
(bp)
Detection limit
(ng)
References
Dog and cat Cytb 808 and 672 0.01% Abdulmawjood et al. (2003)
Buffalo, cattle, pig and sheep SSR gene and Cytb 603, 100, 374 and
359
Not Mentioned Ahmed et al. (2010)
Pig Cytb 360 Not Mentioned Aida et al. (2005)
Dog (Canis familiaris) Cytb 100 0.01% Ali et al. (2013)
Dog (Canis familiaris) Cytb 100 0.01% Rahman et al. (2014)
Beef and bovine Satellite DNA 84 and 0.01% Calvo et al. (2002)
Pork 12S rRNA 387 0.01%
Che Man et al (2007)
Pork leptin gene 152 Not Mentioned Farouk et al. (2006)
Chicken, duck, pigeon and pig D-loop and Cytb 256 , 292, 401
and 835
Not Mentioned Haunshi et al. (2009)
Chicken Actin gene 391 Not Mentioned Hopwood et al. (1999)
Bovine, ovine and caprine 12S rRNA 84, 121 and 122 0.1% Martin et al. (2007)
22
Table 2.2 Continued
Detected species Target gene(s) Amplicon-length
(bp)
Detection limit
(ng)
References
Goat (Capra hircus) D-loop 436 0.1 pg Karabasanavar et al. (2011a)
Pork, horse and donkey ND5, ATPase 6 &
ATPase 8 (horse) and
ND2
227, 153 and 145 0.01 ng Kesmen et al. (2007)
Mutton (Ovis aries) D-loop 404 and 329 0.1% Karabasanavar et al. (2011b)
Goat (Capra hircus) D-loop 294 Not Mentioned Kumar et al. (2011)
Pork AMEL 562 and 741 0.1% Langen et al. (2010)
Horse, dog, cat, bovine, sheep,
porcine, and goat
Mt-DNA 439, 322, 274,
271, 225, 212,
and 157
0.5% and 0.1% Ilhak et al. (2006)
Chicken D-loop 442 1% Mane et al. (2009)
Beef D-loop 513 Not Mentioned Mane et al. (2012)
Four duck species 12S rRNA 64 and 97 0.1% Martin et al. (2007)
Cat, dog, and rat 12S rRNA 108, 101, and
96
0.1% Martin et al. (2012)
Rabbit (Oryctolagus cuniculus) 12S rRNA 720 0.1% Martin et al. (2009)
23
Table 2.2 Continued
Detected species Target gene(s) Amplicon-length
(bp)
Detection limit
(ng)
References
Cattle, pigs, sheep and chickens COXI, 12S rRNA and
16S rRNA
90, 85, 67 and 66
bp
0.1, 0.08 and
0.09%
Natonek et al. (2013)
Goose (Anser anser), mule duck
(Anas platyrhynchos), chicken
(Gallus gallus), turkey, (Meleagris
gallopavo), and swine (Sus scrofa
domesticus)
12S rRNA 392, 394, 400,402
and 404
0.1% Rodriguez et al. (2003)
Yak and cattle 12S rRNA 290 and 159 0.1% Yin et al. (2009)
Five deer species D-loop 140- 303 Not Mentioned Parkanyi et al. (2013)
Cow, pig, chicken and ruminant NM 98,134, 169 and
100
0.05%-0.0005% Walker et al. (2003)
Chicken (Gallus gallus) 5-aminolevulinate
(ALA) synthase gene
288 0.1% Karabasanavar et al. (2013)
Pork (Sus scrofa domesticus) D-loop 772 0.1% Karabasanavar et al. (2014)
Goats, chickens, cattle, sheep, pigs,
horses, and rats
Cytb 157, 227, 274,
331, 398, 439 and
603
1% Nuraini et al. (2012)
Pork D-loop 531 0.05% Montiel Sosa et al. (2000)
24
2.6.3.2 PCR- Restriction Fragment Length Polymorphisms (PCR-RFLP)
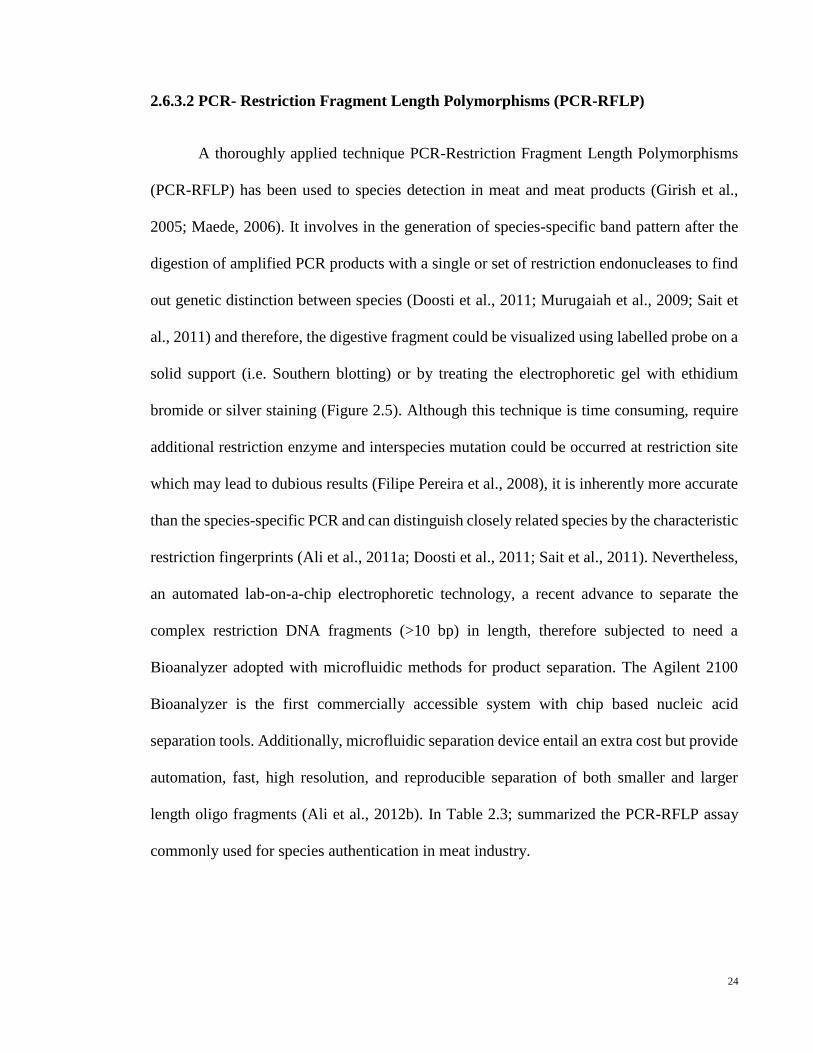
A thoroughly applied technique PCR-Restriction Fragment Length Polymorphisms
(PCR-RFLP) has been used to species detection in meat and meat products (Girish et al.,
2005; Maede, 2006). It involves in the generation of species-specific band pattern after the
digestion of amplified PCR products with a single or set of restriction endonucleases to find
out genetic distinction between species (Doosti et al., 2011; Murugaiah et al., 2009; Sait et
al., 2011) and therefore, the digestive fragment could be visualized using labelled probe on a
solid support (i.e. Southern blotting) or by treating the electrophoretic gel with ethidium
bromide or silver staining (Figure 2.5). Although this technique is time consuming, require
additional restriction enzyme and interspecies mutation could be occurred at restriction site
which may lead to dubious results (Filipe Pereira et al., 2008), it is inherently more accurate
than the species-specific PCR and can distinguish closely related species by the characteristic
restriction fingerprints (Ali et al., 2011a; Doosti et al., 2011; Sait et al., 2011). Nevertheless,
an automated lab-on-a-chip electrophoretic technology, a recent advance to separate the
complex restriction DNA fragments (>10 bp) in length, therefore subjected to need a
Bioanalyzer adopted with microfluidic methods for product separation. The Agilent 2100
Bioanalyzer is the first commercially accessible system with chip based nucleic acid
separation tools. Additionally, microfluidic separation device entail an extra cost but provide
automation, fast, high resolution, and reproducible separation of both smaller and larger
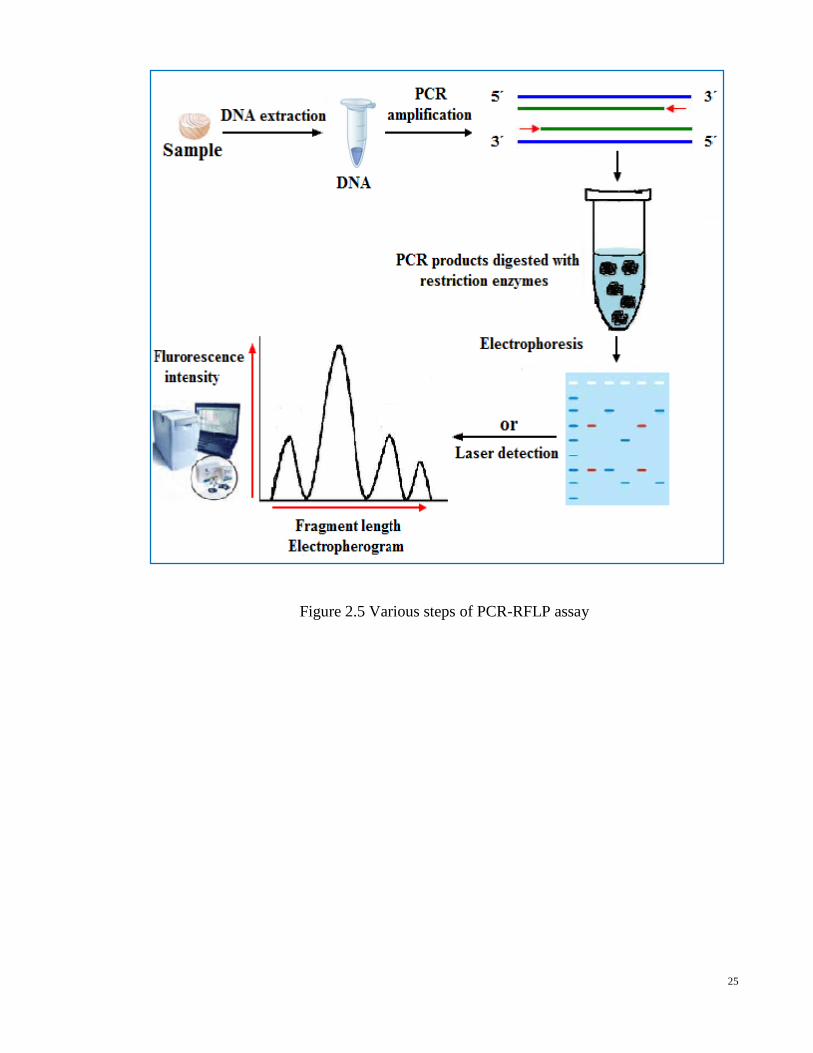
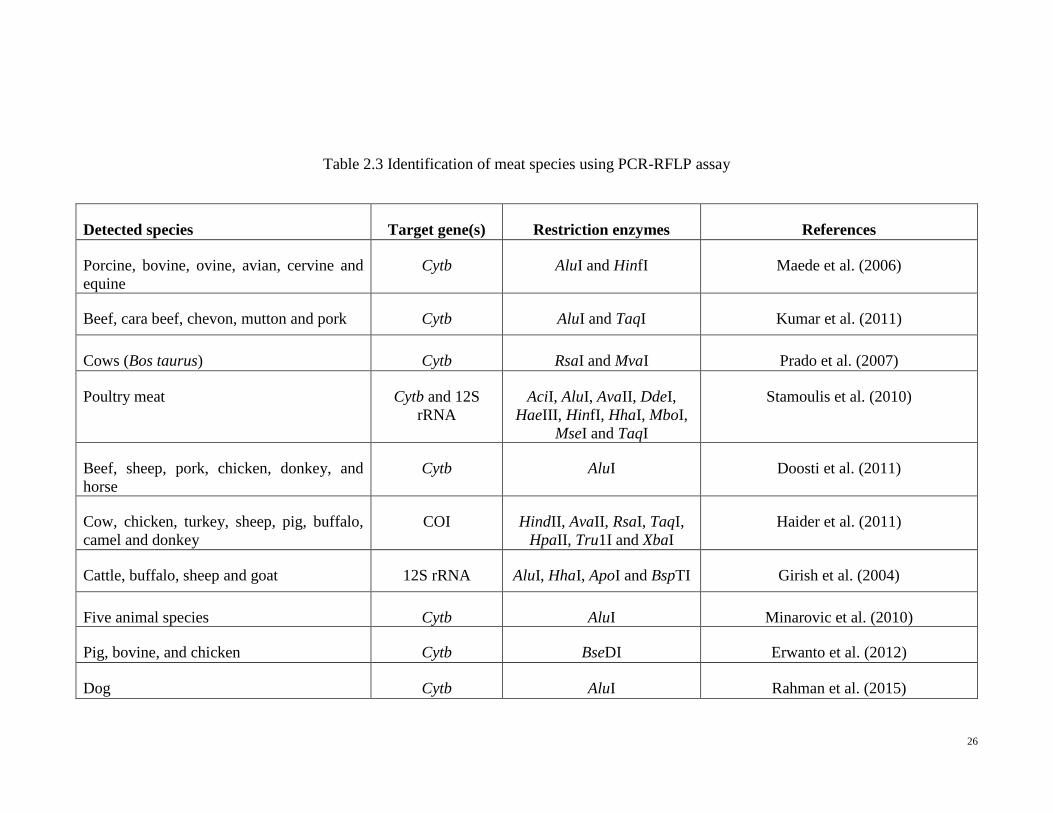
length oligo fragments (Ali et al., 2012b). In Table 2.3; summarized the PCR-RFLP assay
commonly used for species authentication in meat industry.
25
Figure 2.5 Various steps of PCR-RFLP assay
26
Table 2.3 Identification of meat species using PCR-RFLP assay
Detected species Target gene(s) Restriction enzymes References
Porcine, bovine, ovine, avian, cervine and
equine
Cytb AluI and HinfI Maede et al. (2006)
Beef, cara beef, chevon, mutton and pork Cytb AluI and TaqI Kumar et al. (2011)
Cows (Bos taurus) Cytb RsaI and MvaI Prado et al. (2007)
Poultry meat Cytb and 12S
rRNA
AciI, AluI, AvaII, DdeI,
HaeIII, HinfI, HhaI, MboI,
MseI and TaqI
Stamoulis et al. (2010)
Beef, sheep, pork, chicken, donkey, and
horse
Cytb AluI Doosti et al. (2011)
Cow, chicken, turkey, sheep, pig, buffalo,
camel and donkey
COI HindII, AvaII, RsaI, TaqI,
HpaII, Tru1I and XbaI
Haider et al. (2011)
Cattle, buffalo, sheep and goat 12S rRNA AluI, HhaI, ApoI and BspTI Girish et al. (2004)
Five animal species Cytb AluI Minarovic et al. (2010)
Pig, bovine, and chicken Cytb BseDI Erwanto et al. (2012)
Dog Cytb AluI Rahman et al. (2015)
27
Table 2.3 Continued
Detected species Target gene(s) Restriction enzymes References
Pork Cytb AluI Ali et al. (2011c)
Commercial beef 12S rRNA AluI and BfaI Chen et al. (2010)
Beef (Bos taurus), pork (Sus scrofa), buffalo
(Bubalus bubali), quail (Coturnix coturnix),
chicken (Gallus gallus), goat (Capra
hircus), rabbit (Oryctolagus cuniculus)
Cytb AluI, BsaJI, RsaI, MseI, and
BstUI
Murugaiah et al. (2009)
Chicken Actin gene BgI and HinfIII Hopwood et al. (1999)
Cattle, buffalo, goat and sheep 12S rRNA AluI, HhaI, BspTI and ApoI Mahajan et al. (2011)
Beef D-loop BamHI Mane et al. (2012)
28
2.6.3.3 Real Time PCR
A revolution has been made through the invention of real-time PCR because of its
specificity, sensitivity, rapidity, and automation in the era of PCR technology, in the field of
molecular biology, and molecular diagnostics without end point analysis (Ali et al., 2012b).
In real time PCR, two types of dye chemistries are adapted, (1) non-specific detection using
DNA binding dyes that introduces with double-stranded DNA in a blind way, and (2) specific
detection with target DNA specific probes containing oligonucleotides which are labeled
with a fluorescent reporter dye (R) on the 5´ end and a quencher (Q) on the 3´ end. The first
type of fluorescence chemistries of real time PCR using SYBR green I (Farrokhi and Jafari
Joozani, 2011) and Eva Green (Ihrig et al., 2006) that amplified both specific and nonspecific
double stranded (ds-DNA) and sometimes provide false detection. The second category of
fluorescent dye chemistry such as TaqMan probe (Fajardo et al., 2010; Koppel et al., 2011;
Rojas et al., 2010) and Molecular Beacon probe (Yusop et al., 2011), allows additional target
screening by the means of probe hybridization and are more specific in species determination
in terms of species-specific PCR approach (Ali et al., 2012b).
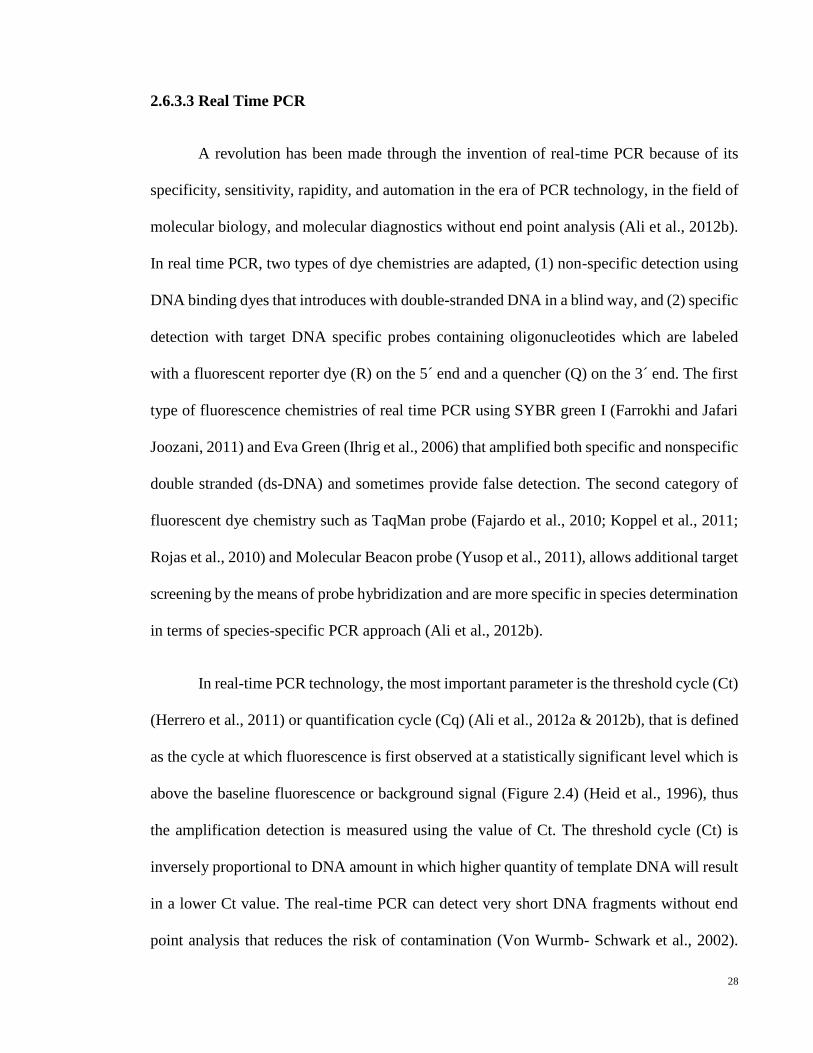
In real-time PCR technology, the most important parameter is the threshold cycle (Ct)
(Herrero et al., 2011) or quantification cycle (Cq) (Ali et al., 2012a & 2012b), that is defined
as the cycle at which fluorescence is first observed at a statistically significant level which is
above the baseline fluorescence or background signal (Figure 2.4) (Heid et al., 1996), thus
the amplification detection is measured using the value of Ct. The threshold cycle (Ct) is
inversely proportional to DNA amount in which higher quantity of template DNA will result
in a lower Ct value. The real-time PCR can detect very short DNA fragments without end
point analysis that reduces the risk of contamination (Von Wurmb- Schwark et al., 2002).
29
The assay works very well for the detection of single copy of quantities of a gene (Alonso et
al., 2013); though this technique is restricted by comparatively extra budget derived from
exclusive instruments and chemicals (Lopez-Andreo and others, 2005; Gizzi and others,
2003). An overall documentary in the field of Real Time PCR systems for different meat
species identification are presented in Table 2.4.
Figure 2.6 Threshold cycle (Ct) or quantification cycle (Cq) and calculation of target DNA
copy number. The quantity of DNA doubles at each cycle of the exponential phase and can
be calculated using the relative Ct values. Permission taken from Ali et al. (2014).

30
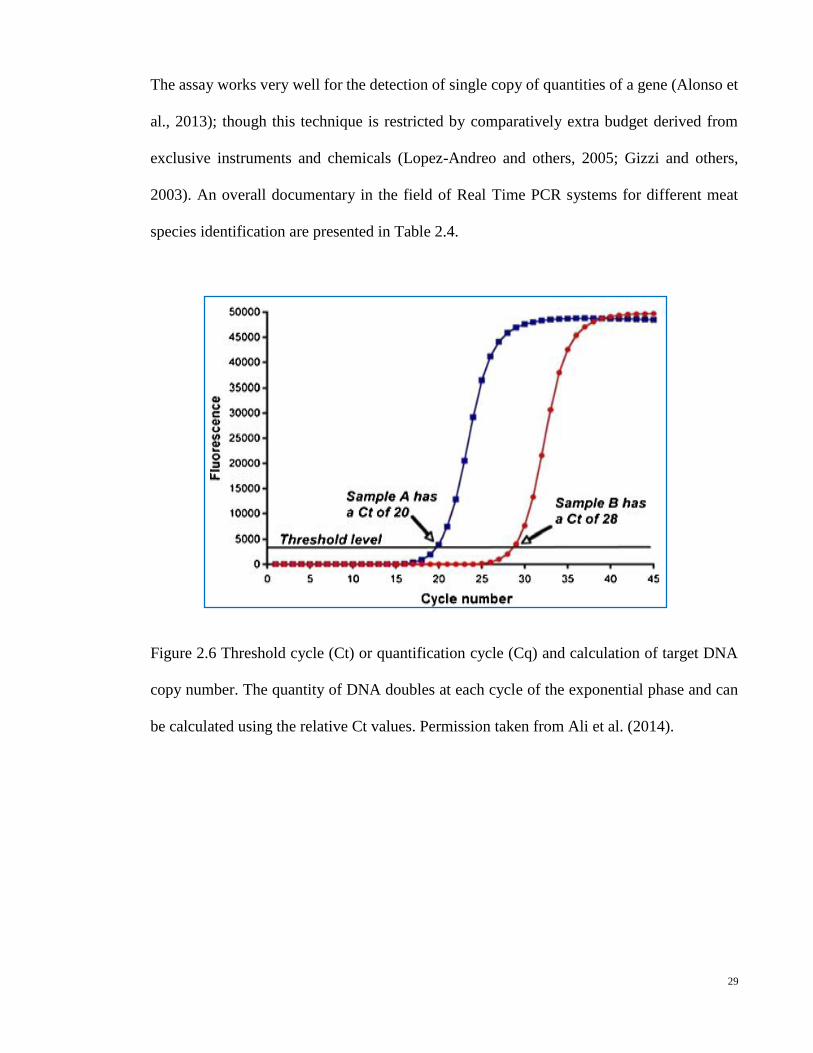
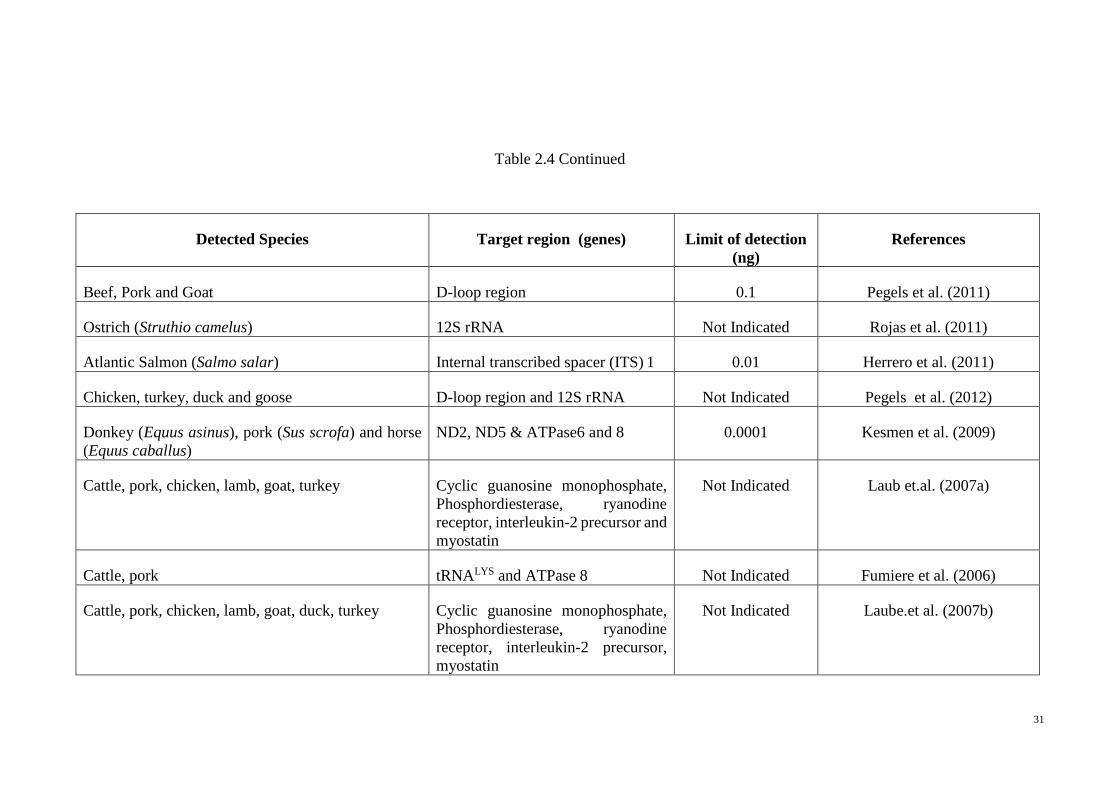
Table 2.4 Real-Time PCR in species detection. Permission taken from Ali et al. (2014)
Detected species Target region (genes) Limit of detection
(ng)
References
TaqMan Chemistry
Bovine (Bos taurus) and buffalo (Bubalus bubalis) Cytb, 16S rRNA Not Indicated Drummond et al. (2013)
Seagull (Larus michahellis) ND2 0.1 Kesmen et al. (2013)
Pork (Sus scrofa) Not Mentioned 0.1% Ulca et al. (2013)
Pork (Sus scrofa) Cytb 0.001 Ali et al. (2012a)
Pork (Sus scrofa), cattle (Bos taurus) Repetitive elements 0.001 Cai et al. (2012)
Sheep, pork, beef, chicken, turkey 16S rRNA and Cytb 0.00002-0.0008 Camma et al. (2012)
4 tuna species (Thunnus obesus, Thunnus orientalis,
Thunnus maccoyii, Thunnus albacares)
Cytb, 16S rRNA, D-loop region 0.08 Chuang et al. (2012)
Pork (Sus scrofa) Cytb Not Indicated Demirhan et al.(2012)
Beef (Bos taurus), pork (Sus scrofa) Cytb, t-Glu gene 0.001-0.3 Lopez-Andreo et al. (2012)
Fish species 12S rRNA 0.0002 Benedetto et al. (2011)
31
Table 2.4 Continued
Detected Species Target region (genes) Limit of detection
(ng)
References
Beef, Pork and Goat D-loop region 0.1 Pegels et al. (2011)
Ostrich (Struthio camelus) 12S rRNA Not Indicated Rojas et al. (2011)
Atlantic Salmon (Salmo salar) Internal transcribed spacer (ITS) 1 0.01 Herrero et al. (2011)
Chicken, turkey, duck and goose D-loop region and 12S rRNA Not Indicated Pegels et al. (2012)
Donkey (Equus asinus), pork (Sus scrofa) and horse
(Equus caballus)
ND2, ND5 & ATPase6 and 8 0.0001 Kesmen et al. (2009)
Cattle, pork, chicken, lamb, goat, turkey Cyclic guanosine monophosphate,
Phosphordiesterase, ryanodine
receptor, interleukin-2 precursor and
myostatin
Not Indicated Laub et.al. (2007a)
Cattle, pork tRNALYS and ATPase 8 Not Indicated Fumiere et al. (2006)
Cattle, pork, chicken, lamb, goat, duck, turkey Cyclic guanosine monophosphate,
Phosphordiesterase, ryanodine
receptor, interleukin-2 precursor,
myostatin
Not Indicated Laube.et al. (2007b)
32
Table 2.4 Continued
Detected Species Target region (genes) Limit of detection
(ng)
References
Duck, goose, chicken, turkey and pork 12S rRNA and Cytb Not Indicated Köppel et al. (2013)
Beef, pork, horse and sheep Prolactin receptor gene, growth
hormone receptor(GHR), Beta-
actin-gene
0.32 Köppel et al. (2011)
Beef, pork, turkey, chicken, horse, sheep, goat Beta-actin-gen, Prolactin receptor,
Target-Function
Globotriaosylceramide (TF-GB3),
Cytb
0.32 Köppel et al. (2009)
Horse, donkey Cytb 0.001 Chisholm et al. (2005)
Pork 12S rRNA 0.05 Rodriguez et al. (2005)
Beef, pork, lamb, chicken, turkey Cytb 0.01- 0.1 Dooley et al. (2004)
Mallard and Muscovy duck Cytb Not Indicated Hird et al. (2005)
Cattle, pork, lamb, chicken, turkey, and ostrich Cytb, t-glu, ND5, nuclear 18S rRNA
gene
0.000006-0.0008 Lopez-Andreo et al. (2005)

33
Table 2.4 Continued
Detected Species Target region (genes) Limit of detection
(ng)
References
Haddock Transferrin Not Indicated Hird et al. (2004)
Cattle Growth hormone 0.02 Brodmann and Moor (2003)
Cattle, pork Phosphodiesterase, ryanodine gene Not Indicated Laube et al. (2003)
Molecular Beacon Chemistry
Pork Cytb 0.0001 Hazim et al. (2012)
SYBR Green Chemistry
Tuna species (Thunnus obesus) ATPase 6, 16S rRNA 0.08 Chuang et al. (2012)
Pork Cytb 0.01 Soares et al. (2013)
Bovine (Bos taurus) and buffalo (Bubalus bubalis) Cytb, 16S rRNA Not Indicated Drummond et al. (2013)
Red deer (Cervus elaphus), fallow deer (Dama
dama), and roe deer (Capreolus capreolus)
12S rRNA 0.000004 Fajardo et al. (2008)
34
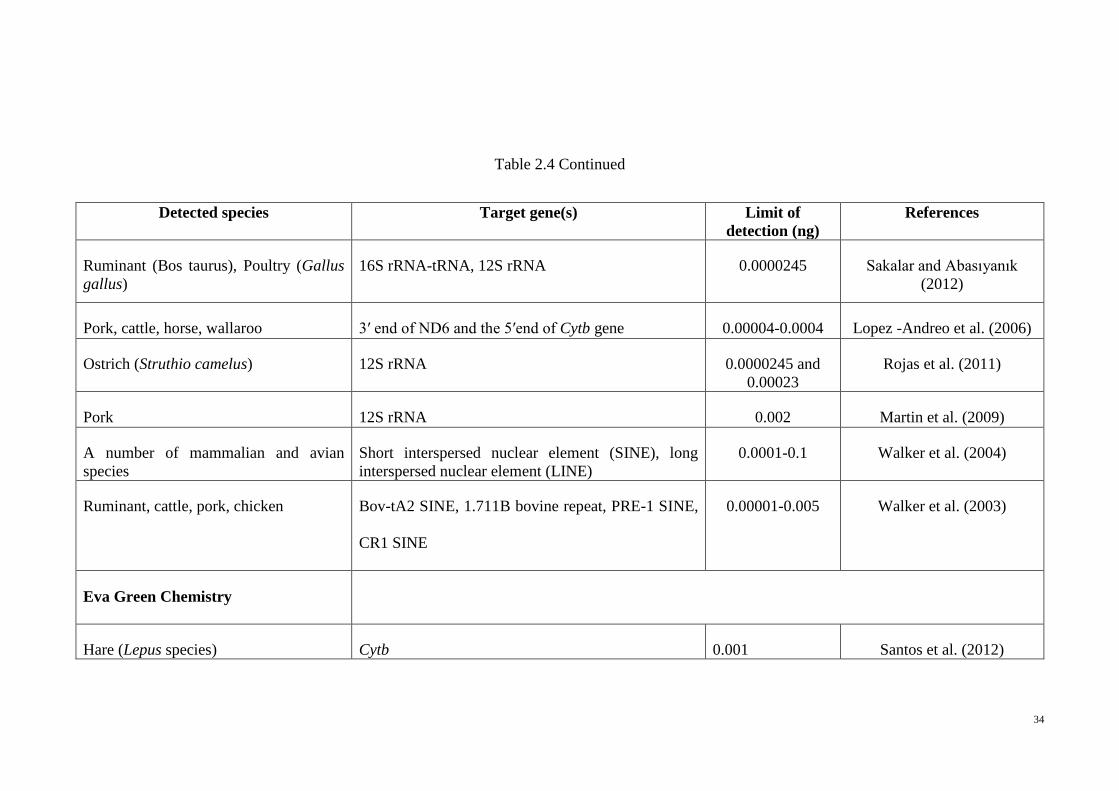
Table 2.4 Continued
Detected species Target gene(s) Limit of
detection (ng)
References
Ruminant (Bos taurus), Poultry (Gallus
gallus)
16S rRNA-tRNA, 12S rRNA 0.0000245 Sakalar and Abasıyanık
(2012)
Pork, cattle, horse, wallaroo 3′ end of ND6 and the 5′end of Cytb gene 0.00004-0.0004 Lopez -Andreo et al. (2006)
Ostrich (Struthio camelus) 12S rRNA 0.0000245 and
0.00023
Rojas et al. (2011)
Pork 12S rRNA 0.002 Martin et al. (2009)
A number of mammalian and avian
species
Short interspersed nuclear element (SINE), long
interspersed nuclear element (LINE)
0.0001-0.1 Walker et al. (2004)
Ruminant, cattle, pork, chicken Bov-tA2 SINE, 1.711B bovine repeat, PRE-1 SINE,
CR1 SINE
0.00001-0.005 Walker et al. (2003)
Eva Green Chemistry
Hare (Lepus species) Cytb 0.001 Santos et al. (2012)
35
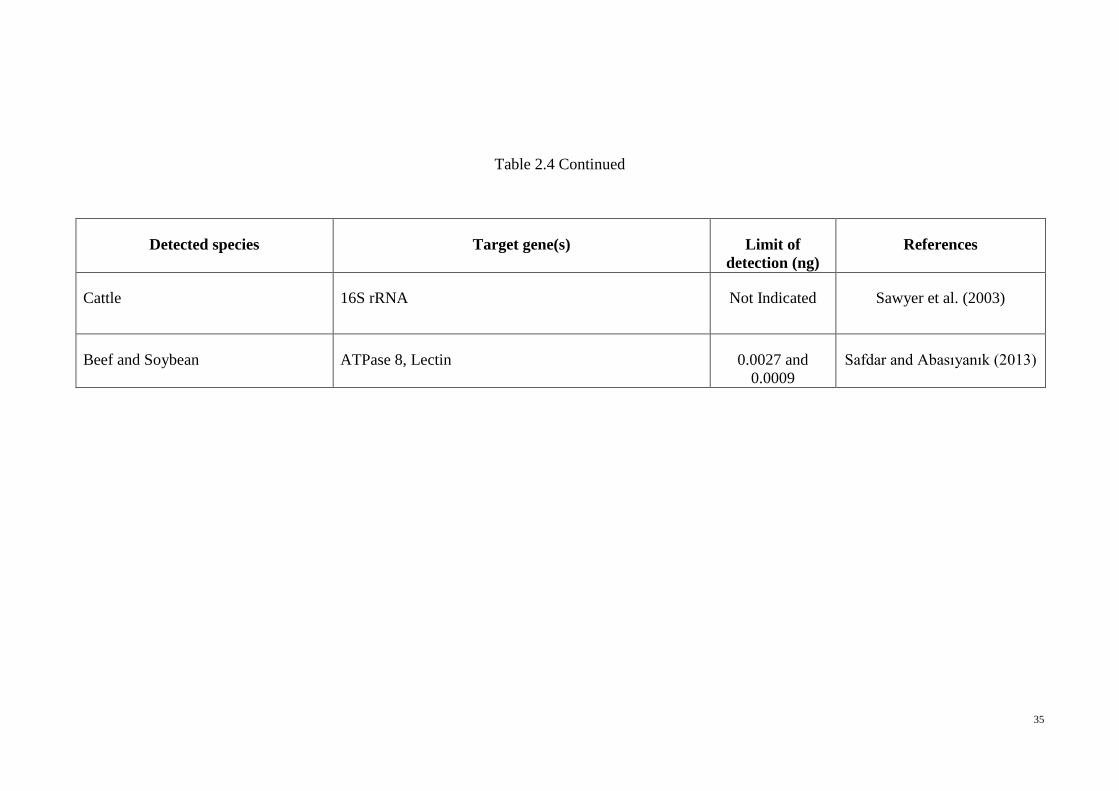
Table 2.4 Continued
Detected species Target gene(s) Limit of
detection (ng)
References
Cattle 16S rRNA Not Indicated Sawyer et al. (2003)
Beef and Soybean ATPase 8, Lectin 0.0027 and
0.0009
Safdar and Abasıyanık (2013)
36
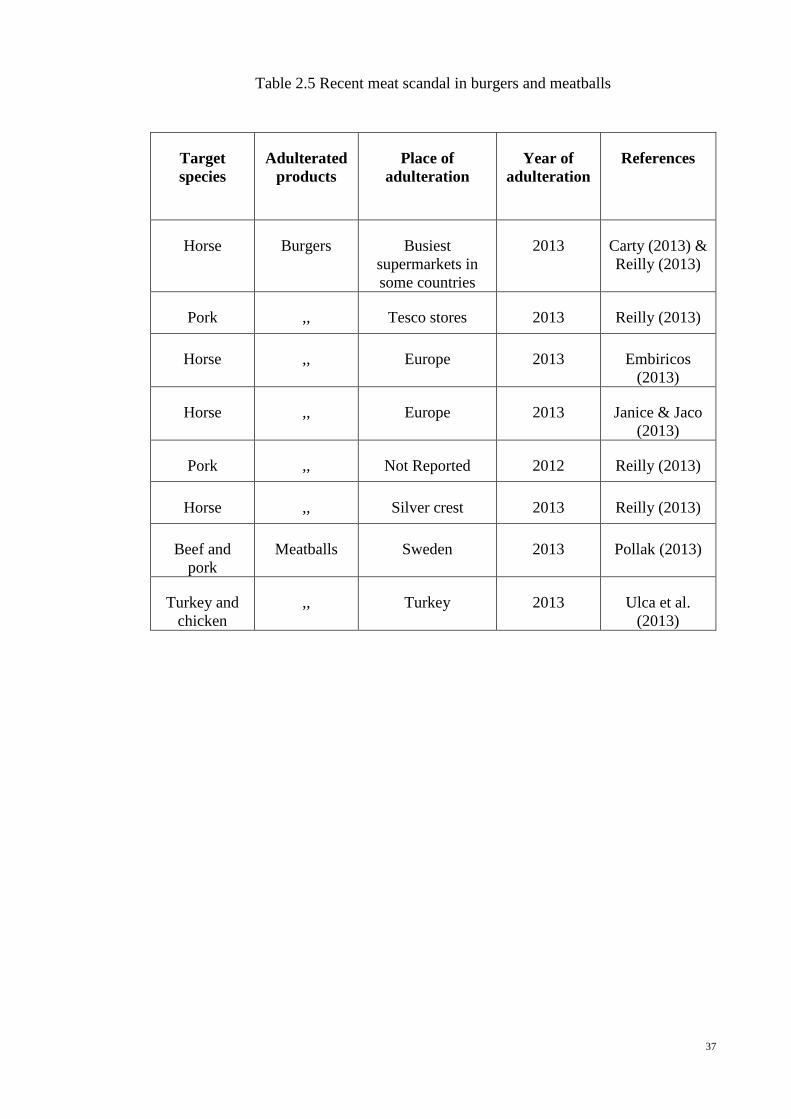
2.7 Recent Meat Scandals in Processed Foods
Addition of minced meat in commercial food products is a routine ill-practice of
adulteration which are being frequently used in modern foods (Ali et al., 2012a) and the
contamination rate of processed food is higher than the fresh food (Barai and others, 1992;
Patterson, 1985; Hsieh and others, 1996). The Food Safety Authority of Ireland (FSAI)
analyzed 27 beef burger products from ‘June 2013 to March 2014’ and found horse DNA
in 10 samples of 27 products (37%) and 85% was found to positive for pig DNA (Reilly,
2013) and, offending burgers were supplied from Tesco stores in Ireland and the UK.
More importantly, to survive in competitive markets and realize extra profit, lower valued
meats such as pig and horse meats were replaced in frozen meatballs in Sweden (Pollak,
2013) while chicken and turkey were substituted in pure beef meatballs in Turkey (Ulca
et al., 2013). However, the recent meat scandals in processed food such as horse meat
found in beef burger in Europe (Premanandh, 2013) and human meat in McDonald’s
burgers in the USA (Olumide, 2014), have raised consumers doubts on labeled foods as
well as their ingredients which they are consumed, hence they are now increasingly
worried to safeguard their religious faith, health, money and wildlife. A list of meat
scandal in commercial products such as burgers and meatballs are briefly summarized in
Table 2.5.
37
Table 2.5 Recent meat scandal in burgers and meatballs
Target
species
Adulterated
products
Place of
adulteration
Year of
adulteration
References
Horse Burgers Busiest
supermarkets in
some countries
2013 Carty (2013) &
Reilly (2013)
Pork ,, Tesco stores 2013 Reilly (2013)
Horse ,, Europe 2013 Embiricos
(2013)
Horse ,, Europe 2013 Janice & Jaco
(2013)
Pork ,, Not Reported 2012 Reilly (2013)
Horse ,, Silver crest 2013 Reilly (2013)
Beef and
pork
Meatballs Sweden 2013 Pollak (2013)
Turkey and
chicken
,, Turkey 2013 Ulca et al.
(2013)

38
2.8 Prospect of Processed Food Analysis
Misdescription of food components in processed meat products has been occurred
both intentionally and unintentionally due to improper processing or handling, to survive
in competitive market and realize more economic gain. It violets not only the food
labelling acts but also put consumers at the risk of health and ethical compromise. A
survey was made by Hsieh and others (1995) in Florida retail markets in the USA revealed
adulteration rates for processed meats and raw meats are 23% and 16%, respectively. A
recent test on the British food industry for horse meat adulteration in beef pasta revealed
29 samples out of 2,501 contained more than 1 % horse meat merged with beef (Castle,
2013), while turkey and chicken was found in 100% beef meatballs (Ulca et al., 2013)
and pork were being served in Halal chicken sausages in west London in 2013 (Webb S.,
2013). Therefore, it is more challenging to isolate substituted ingredients in processed
products after grinding, cooking, smashing, salting, or mixing. Furthermore, the origin of
species is easy to be buried in the meat mixture owing to the change of meat texture,
color, appearance, or even flavor. Therefore, it is subjected to develop an easy, fast and
reliable PCR assays for the analysis of feline materials in processed foods and meat
products under complex matrices.
39
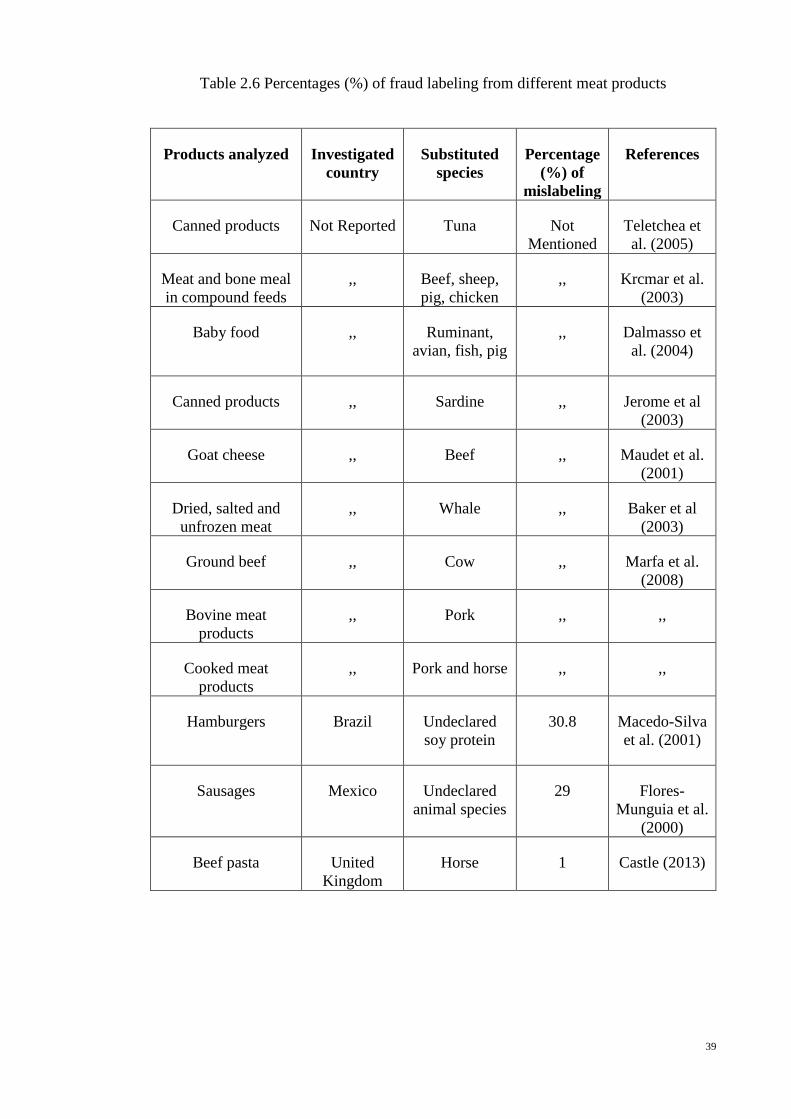
Table 2.6 Percentages (%) of fraud labeling from different meat products
Products analyzed Investigated
country
Substituted
species
Percentage
(%) of
mislabeling
References
Canned products Not Reported Tuna Not
Mentioned
Teletchea et
al. (2005)
Meat and bone meal
in compound feeds
,, Beef, sheep,
pig, chicken
,, Krcmar et al.
(2003)
Baby food
,, Ruminant,
avian, fish, pig
,, Dalmasso et
al. (2004)
Canned products ,, Sardine ,, Jerome et al
(2003)
Goat cheese ,, Beef ,, Maudet et al.
(2001)
Dried, salted and
unfrozen meat
,, Whale ,, Baker et al
(2003)
Ground beef ,, Cow ,, Marfa et al.
(2008)
Bovine meat
products
,, Pork ,, ,,
Cooked meat
products
,, Pork and horse ,, ,,
Hamburgers
Brazil Undeclared
soy protein
30.8 Macedo-Silva
et al. (2001)
Sausages Mexico Undeclared
animal species
29 Flores-
Munguia et al.
(2000)
Beef pasta United
Kingdom
Horse 1 Castle (2013)

40
Table 2.6 Continued
Products analyzed Investigated
country
Substituted
species
Percentage
(%) of
mislabeling
References
Meat products United
Kingdom
Thawed meat
declared as
fresh
8 Anon (1996)
Halal chicken
sausages
United
Kingdom
Pork Not
Mentioned
,,
Chicken nuggets Greece Horse ,, Embiricos
(2013)
Hamburgers
Mexico Undeclared
animal species
39 Flores-
Munguia et
al. (2000)
Meat products United States
of America
Undeclared
animal species
22.9 Hsieh et al.
(1995)
Meat products Turkey Undeclared
animal species
22 Ayaz et al.
(2006)
Meat products Switzerland Thawed meat
declared as
fresh
15 Anon (2001))

CHAPTER THREE
MATERIALS AND METHODS
41
CHAPTER 3: MATERIALS AND METHODS
3.1 Sample Collection
Fresh meat samples of beef (Bos taurus and Bos indicus), water buffalo (Bubalus
bubalis), chicken (Gallus gallus), domestic duck (Anas platyrhynchos), turkey (Meleagris
gallopavo), sheep (Ovis aries), goat (Capra hircus), Malaysian box turtle (Cuora
amboinensis), monkey (Macaca fascicularis sp.), rat (Rattus norvegicus), lamb (Ovis
aries), pegion (Columba livia), pig (Sus scrofa), cuttle (Sepia officinalis), carp (Cyprinus
carpio), tilapia (Oreochomis aureus), shrimp (Litopenaeus vannamei), Atlantic cod
(Gadus morhua), onion (Allium cepa), tomato (Solanum lycopersicum), cucumber
(Cucumis sativus), potato (Solanum tuberosum) and wheat (Triticum aestivum) were
collected in triplicates on three different days from various wet markets and super markets
across Malaysia (Table 3.1). Dog (Canis familiaris) and cat (Felis catus) meat samples
from three different animals were collected from Jabatan Kesihatan, Dewan Bandaraya
Kuala Lumpur (DBKL) after euthanized according to animal usage guidelines by
authorized personnels, Air Panas Kuala Lumpur and Faculty of Veterinary Sciences in
University of Putra Malaysia in Selangor, Malaysia. For commercial products screening
raw and processed samples of different halal branded commercial products like burgers
and meatballs were procured from different selling-spots supermarket at Petaling Jaya
and Kuala Lumpur in Malaysia in triplicates on three different days. All the collected
samples were then transported to the laboratory under ice-chilled atmosphere (4C) and
kept at (-20C) up to further use.
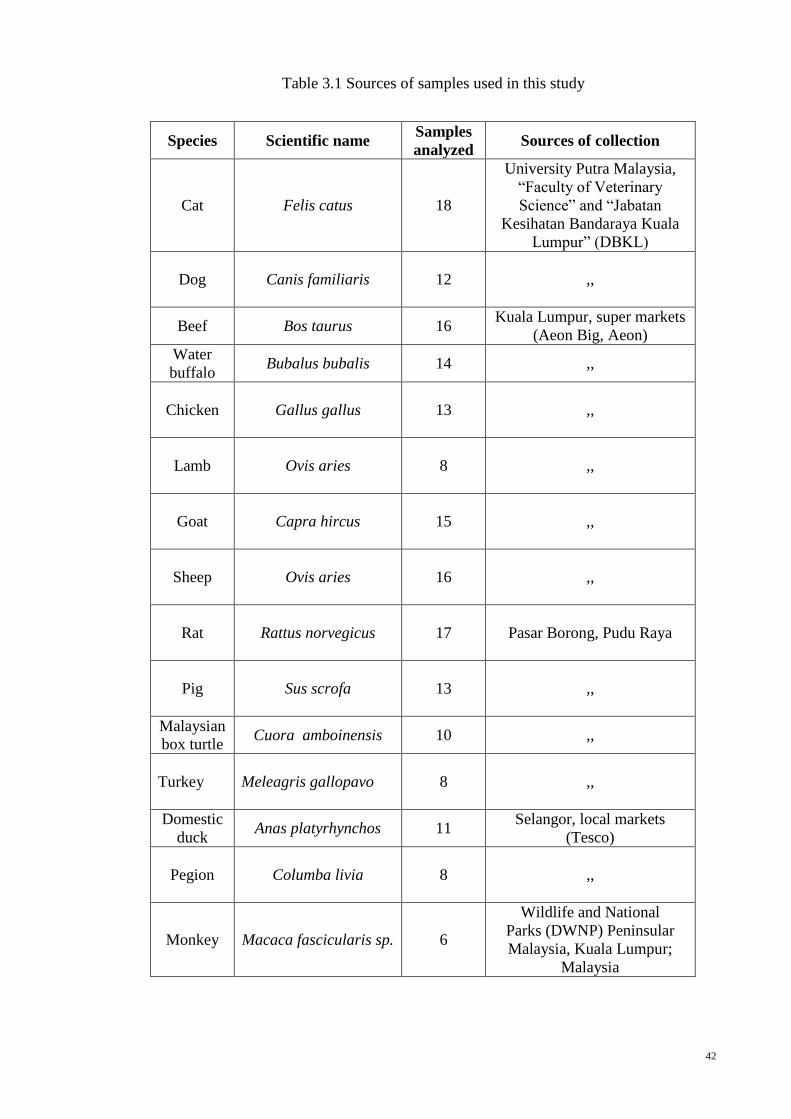
42
Table 3.1 Sources of samples used in this study
Species Scientific name Samples
analyzed Sources of collection
Cat Felis catus 18
University Putra Malaysia,
“Faculty of Veterinary
Science” and “Jabatan
Kesihatan Bandaraya Kuala
Lumpur” (DBKL)
Dog
Canis familiaris
12 ,,
Beef Bos taurus 16 Kuala Lumpur, super markets
(Aeon Big, Aeon)
Water
buffalo Bubalus bubalis 14 ,,
Chicken
Gallus gallus
13 ,,
Lamb
Ovis aries
8 ,,
Goat
Capra hircus
15 ,,
Sheep
Ovis aries
16 ,,
Rat
Rattus norvegicus
17 Pasar Borong, Pudu Raya
Pig
Sus scrofa
13 ,,
Malaysian
box turtle Cuora amboinensis 10 ,,
Turkey
Meleagris gallopavo 8 ,,
Domestic
duck Anas platyrhynchos 11
Selangor, local markets
(Tesco)
Pegion
Columba livia
8 ,,
Monkey Macaca fascicularis sp. 6
Wildlife and National
Parks (DWNP) Peninsular
Malaysia, Kuala Lumpur;
Malaysia
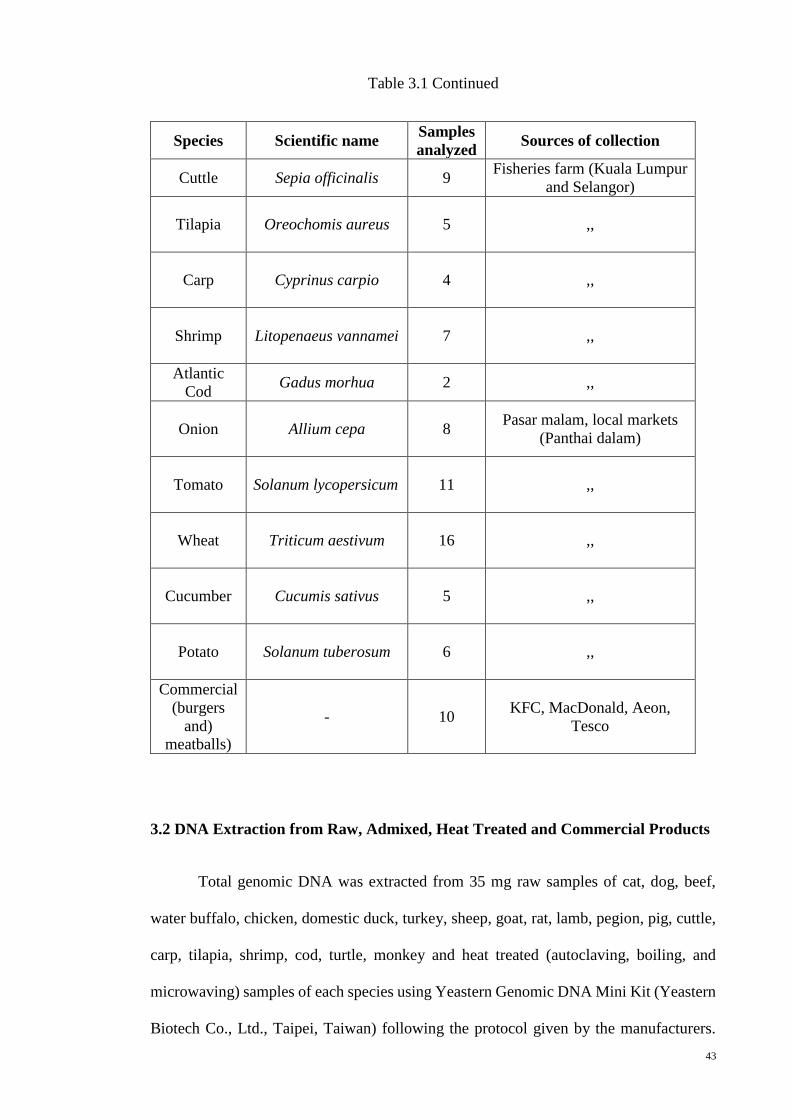
43
Table 3.1 Continued
Species Scientific name Samples
analyzed Sources of collection
Cuttle Sepia officinalis 9 Fisheries farm (Kuala Lumpur
and Selangor)
Tilapia
Oreochomis aureus
5 ,,
Carp
Cyprinus carpio
4 ,,
Shrimp
Litopenaeus vannamei
7 ,,
Atlantic
Cod Gadus morhua 2 ,,
Onion
Allium cepa
8 Pasar malam, local markets
(Panthai dalam)
Tomato
Solanum lycopersicum
11 ,,
Wheat
Triticum aestivum
16 ,,
Cucumber
Cucumis sativus
5 ,,
Potato
Solanum tuberosum
6 ,,
Commercial
(burgers
and)
meatballs)
- 10 KFC, MacDonald, Aeon,
Tesco
3.2 DNA Extraction from Raw, Admixed, Heat Treated and Commercial Products
Total genomic DNA was extracted from 35 mg raw samples of cat, dog, beef,
water buffalo, chicken, domestic duck, turkey, sheep, goat, rat, lamb, pegion, pig, cuttle,
carp, tilapia, shrimp, cod, turtle, monkey and heat treated (autoclaving, boiling, and
microwaving) samples of each species using Yeastern Genomic DNA Mini Kit (Yeastern
Biotech Co., Ltd., Taipei, Taiwan) following the protocol given by the manufacturers.
44
Isolation of DNA from 35 mg of plant sources (onion, tomato, cucumber, potato and
wheat) and 1g of 2 set of ternary model mixed ((i) cat: beef: chicken and (ii) feline:
bovine: wheat flour), lab made (Tables 3.4 & 3.5) and commercial burgers (beef and
chicken burger), and meatballs (beef and chicken meatballs) was performed using CTAB
method (Cetyl Trim methyl Ammonium Bromide) according to Ma et al. (2000).
3.3 Biomarker Development
3.3.1 Salient Features of Primer Designing
There are some important key parameters that were considered to design a pair of in-silico
primers are described below:
3.3.1.1 Length
Length of primers is the fundamental criteria for the specificity and annealing to
the accurate targets. Cross positive amplification and lower specificity may possibly come
to pass because of too short primer's’ length, while too longer primer is the complex
features to reduce the template-binding efficacy at standard annealing temperature
(Judelson, 2000). The standard length of primers is 18-28 nucleotides base pairs and
could be longer in terms of compulsion.
3.3.1.2 Melting Temperature (Tm) and Mismatching
Since annealing in a PCR takes place for both forward and reverse primers
simultaneously, primer pairs should have comparable melting temperatures (Tm). A
miniature difference of Tm of primer pairs may enhances the inefficiency of multiplex
PCR platforms and lead to mis-hybridization and increase at an incorrect region of DNA
to amplify. Specificity to target and non-specificity to non-target species depend on

45
mismatching between primers and DNA template. Each 1% mismatching of the bases in
a double-stranded (ds) DNA reduces melting temperature (Tm) by 1 to 1.5C (Cheng et
al., 2014; Ishii & Fukui, 2001; Köppel et al., 2013; Matsunaga et al., 1999; Sambrook et
al., 1989; Zhang et al., 2014). The percentage of mismatch of newly designed primers for
multiplex PCR should not be less than 15% between a species-specific primer and the
other species sequences.
Therefore, to calculate melting temperature of primer only nucleotides
homologous to the template are considered. The approximate melting temperature (Tm)
of primers containing less than 25 nucleotides and calculated with the equation: Tm = 4
(G + C) + 2 (A + T), where G, C, A and T are number of nucleotides in the primer. If the
primer have more than 25 nucleotides an online based Tm calculator from Promega,
(http://www6.appliedbiosystems.com/support/techtools/calc/) is account for interactions
of adjacent bases, effect of salt concentration thus the Tm’s of forward and reverse primers
must be similar (2 to 5C differences accepted).
3.3.1.3 Secondary Structure
A minimum of intra-molecular or inter-molecular homology is important for
designing primer pairs may causes for secondary structure formation (hairpins or primer
dimerization (Figure 3.1)) which may lead to poor or no amplification. In a standard
primer designing intra-primer homologies of 3 bp of 3´ end or more should be escaped
due to “primer-dimer” formation (Figure 3.1b). Hence the internal inter-molecular
interactions should also be minimized.

46
Figure 3.1 Formation of secondary structure (a) hairpin; (b) primer-dimer.
3.3.1.4 GC-Clamp
Ideally a primer has a near random mix of nucleotides and the presence of G or C
within the last 4 bases from the 3' end of primers is appropriate to increase yield and to
inhibit mis-priming. Nonetheless, primers with long polyG or polyC stretches essential to
avoid despite of possibility to encourage non-specific annealing. Although having one or
two G and/or C at 3' is acceptable but additional of Gs or Cs might badly effect the total
specificity of the primers.
3.4 Feline-Specific Primer Design
Feline-specific primers (Forward-5′ ACTATTATTTACAGTCATAGCCACAGC-
3′ and Reverse-5′CAGAAGGACATTTGGCCTCA-3′) were developed targeting a 69-bp
site of mitochondrial gene using Primer3plus software (www.bioinformatics.nl/cgi-
bin/primer3plus/primer3plus.cgi). The selected primers were screened for primer
specificity in an in-silico analysis using online Basic Local Alignment Tool (BLAST)
against non-redundant nucleic acid sequences in NCBI data base
(http://blast.ncbi.nlm.nih.gov/Blast.cgi). The expected target sequence was multiple
aligned with 6 common halal animal meat species like beef (Bos taurus and Bos indicus),
(a)
(b)
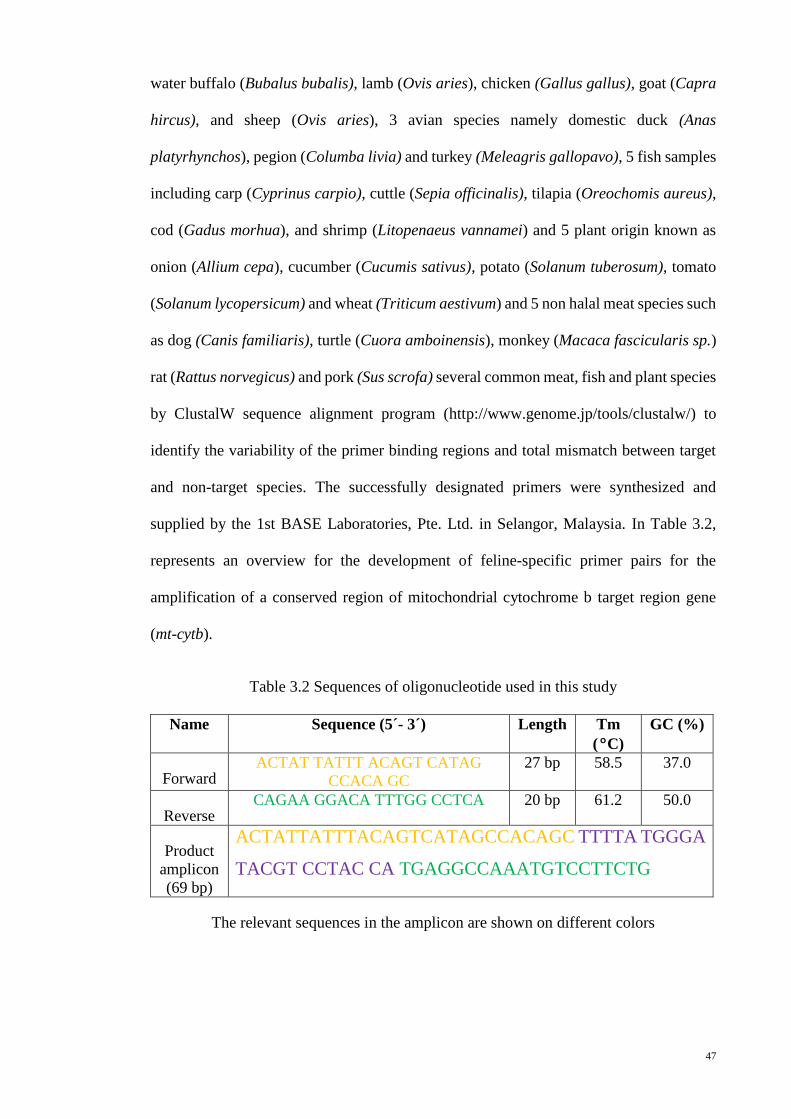
47
water buffalo (Bubalus bubalis), lamb (Ovis aries), chicken (Gallus gallus), goat (Capra
hircus), and sheep (Ovis aries), 3 avian species namely domestic duck (Anas
platyrhynchos), pegion (Columba livia) and turkey (Meleagris gallopavo), 5 fish samples
including carp (Cyprinus carpio), cuttle (Sepia officinalis), tilapia (Oreochomis aureus),
cod (Gadus morhua), and shrimp (Litopenaeus vannamei) and 5 plant origin known as
onion (Allium cepa), cucumber (Cucumis sativus), potato (Solanum tuberosum), tomato
(Solanum lycopersicum) and wheat (Triticum aestivum) and 5 non halal meat species such
as dog (Canis familiaris), turtle (Cuora amboinensis), monkey (Macaca fascicularis sp.)
rat (Rattus norvegicus) and pork (Sus scrofa) several common meat, fish and plant species
by ClustalW sequence alignment program (http://www.genome.jp/tools/clustalw/) to
identify the variability of the primer binding regions and total mismatch between target
and non-target species. The successfully designated primers were synthesized and
supplied by the 1st BASE Laboratories, Pte. Ltd. in Selangor, Malaysia. In Table 3.2,
represents an overview for the development of feline-specific primer pairs for the
amplification of a conserved region of mitochondrial cytochrome b target region gene
(mt-cytb).
Table 3.2 Sequences of oligonucleotide used in this study
Name Sequence (5´- 3´) Length Tm
(C)
GC (%)
Forward ACTAT TATTT ACAGT CATAG
CCACA GC
27 bp 58.5 37.0
Reverse CAGAA GGACA TTTGG CCTCA 20 bp 61.2 50.0
Product
amplicon
(69 bp)
ACTATTATTTACAGTCATAGCCACAGC TTTTA TGGGA
TACGT CCTAC CA TGAGGCCAAATGTCCTTCTG
The relevant sequences in the amplicon are shown on different colors
48
3.5 Pairwise Distance and Phylogenetic Tree Construction
Feline specificity was confirmed through theoretical analysis using bioinformatics
software prior to any experimental trial in the lab. Therefore, the retrieved cytb gene
sequences of animal and cob gene sequences of plant were aligned along with the primer
sequences using molecular evolutionary and phylogenetic analysis software, MEGA
version 5 (Tamura et al., 2011) and ClustalW alignment tool for mismatch calculation.
Moreover, the experimental analysis was done in an actual PCR reaction against fourteen
land animal, five fish, and five plant species. Finally, the purified PCR product was
sequenced (MyTACG Bioscience Enterprise, Selangor, Malaysia) and the sequences
were matched through BLAST (Basic Local Alignment Search Toll) analysis in NCBI
data base. All the theoretical data revealed that developed primers were highly specific to
feline cytb gene.
3.6 PCR Assay Optimization and Gel Electrophoresis
The PCR reaction was carried out using 5µl of 5x Green GoTaq Flexi Buffer
(Promega, Corporation, Madison, USA), 1.5 µl of 25mM of MgCl2 (Promega), 0.5µl of
0.2 mM of 150 each dNTPs mix (sodium salts of dATP, dCTP, dGTP and dTTP 10 mM
each in water (40 mM Promega, Madison, USA), 100 nM each primers (IDT, Inc.), 50
units/ml of Taq polymerase (Promega), 20 ng of total DNA in 25μl of reaction volumes.
All the PCR reaction was performed on the Veriti 96-Well gradient Thermal cycler
system (Veriti® Thermal Cycler, Applied Biosystems; Foster City, California, USA)
under the following conditions: an initial denaturation at 95C for 3 min followed by 35
cycles of denaturation at 95C for 20s, annealing at 58C for 20s and extension at 72C
for 30s and the final extension was completed by 72C for 5 min and hold at a 4C for 2

49
min. Finally, negative control was developed by adding nuclease free water in the
replacement of template DNA for experimental validation of all PCR reaction and the
amplified PCR products were kept at -20C for further analysis.
For PCR products analysis 2% agarose gel was prepared in a horizontal agarose
gel electrophoresis chamber (SUB13, Hoefer, Inc., California, and USA) with FloroSafe
DNA Stain (1st Base Laboratories, Selangor, Malaysia). After that, the electrophoresis
experiment was conducted at 70 min for 120V along with 50 bp DNA molecular weight
marker (Fermentas, USA), passing an electrical current though the gel towards anode
from cathode to separate the amplified products on the basis of molecular size. The
banding pattern of PCR products was shown under UV transilluminator-gel
documentation system (Alpha Imager HP; Alpha InfoTech Corp., San Leandro, CA,
USA). All the chemicals and reagents for PCR products amplification and gel
electrophoresis visualization were received from 1st BASE Laboratories Pte. Ltd
(Selangor, Malaysia).
3.7 Stability of Target DNA
3.7.1 Raw State
The sensitivity of the target DNA was determined by 10 fold serially diluted DNA
extracted from raw and pure state (10, 1, 0.1, 0.01, 0.001 and 0.0001 ng/µl). Therefore,
the sensitivity of the autoclaved and boiled feline DNA was also confirmed against 10
fold (10 ng/µl - 0.0001 ng/µl) serial dilution methods. The limit of detection was 0.0001
ng/µl feline DNA from raw, autoclaved and boiling treatment.
50
3.7.2 Compromised States
Compromised states mean degradation of DNA either by natural decomposition
or forced physical treatments. Different types of processing and cooking treatments were
applied to the collected meat samples to verify the stability of the target amplicon.
Therefore, the targeted meat samples were cut into smaller pieces for various processing
treatments. Approximately 3-5 g of cat meats were boiled at 80C, 100C and 110C for
30, 90 and 30 min, respectively (Ali et al., 2013 & Karabasanavar et al., 2014) to simulate
traditional cooking system. The autoclave treatment was performed at 120C for 50 min
at 14.5-psi, 110C for 2 h at 14.5-psi, and 133C for 20 min under 43.51-psi according to
the European legislation (Comission, 2002). In addition, to verify target DNA stability
under extreme processing treatments, extensive autoclaving was done at 120C for 2.5 h
under 45-psi (Ali et al., 2013). Finally, another heat treatment was carried out on raw
meat using microwave oven on three different stages namely low (300W), medium
(500W) and high (700W) for 10 to 30 min, respectively. All the heat treated samples were
kept at 20C up to further use.
3.8 Specificity and Sensitivity of Target DNA
3.8.1 Ternary Mixed Background
In order to evaluate the sensitivity and specificity of the ternary meat mixed, fresh
cat meat was spiked with raw beef and chicken, respectively, at four adulteration levels:
10%, 1%, 0.1%, and 0.01% (w/w); and also mixed with wheat flour at another four
different levels: 10%, 5%, 0.2% and 0.01% (w/w). Briefly, to obtain 10%, 1%, 0.1%, and
0.01% (w/w) cat meat spiked ternary admixed was prepared by adjusting cat, beef and
chicken in the ratio of 10:45:45, 1:49.5:49.5, 0.1:49.95:49.95 and 0.01:49.995:49.995,
51
respectively. Additionally, 10%, 5%, 0.2% and 0.01% (w/w) ternary mixtures was
constructed by mixing feline, bovine, and wheat flour in the percentages of 10:45:45,
5:47.5:47.5, 0.2:49.9:49.9 and 0.01:49.995:49.995, respectively. Each of admixed
samples was prepared in a 100g specimen and thoroughly mixed and homogenized in a
separate container and blender. Therefore, homogenous semi solid slurry was formed by
adding 100 ml distilled water and grinding in a food processing blender. Henceforth, in
order to examine the effect of standard cooking and autoclaving condition each parts of
admixed mixtures were treated with different heating conditions namely boiling (100C
for 90 min), extensive autoclaving (120C for 2.5 h under 45-psi) and oven heating (180C
for 30 min). All admixtures were prepared on three different days by three independent
analysts, thus the DNA extraction was performed using CTAB methods, and the isolated
samples were preserved at -20C for further experimental analysis.
3.8.2 Burger Formulations
Burgers were prepared according to the Ali et al. (2012a) with an appropriate
amount of deboned chicken, beef and cat minced meats and others burger ingredients as
given in Table 3.3. For adulteration analysis, 100g of beef and chicken meat were mixed
with specified amount in to 10%, 5%, 1% and 0.1% (w/w) of cat meat to formulate cat
meat contaminated burgers in the amounts of 10:45:45, 5:47.5:47.5, 1:49.5:49.5 and
0.1:49.95:49.95, respectively. Finally, all the ingredients were mixed properly and
divided into four different parts and each part was given into a burger shape (Ali et al.,
2012a). Therefore, the raw burger meats were cooked in an electrical oven for 15 min
under 220C and the prepared burger were autoclaved at 120C for 2.5 h in 45-psi pressure
and oven heated at 180C for 30 min separately on three different days and kept at20C.

52
Table 3.3 Ingredients used in the preparation beef, chicken and cat burgers (100g)
Components Beef burger Chicken burger Cat burger
Sliced beef meat 100 g - -
Sliced chicken meat - 100 g -
Sliced cat meat - - 100 g
Fresh breadcrumbs 15 g - 7.5 g
Dry breadcrumbs - 7 g -
Brown onion paste 0.5 g 0.5 g 0.5 g
Eggs 0.4 g - 0.4 g
Sliced cheese 0.9 g 0.9 g 0.9 g
Olive oil - 0.3 g 0.3 g
Tomato paste 0.35 g 0.35 g 0.35 g
Red pepper powder 0.2 g - 0.2 g
Lettuce leaves extracts - 0.05 g 0.05 g
3.8.3 Meatball Matrices
Pure meatballs were prepared according to the Rohman et al. (2011) by mixing
a proper amount of ground beef, chicken and cat meat with tapioca starch, cooking salt,
garlic and other spices as described in Table 3.4. Thus, 100g of beef and chicken meat
were mixed with an appropriate amount (10%, 5%, 1%, 0.1% and 0.01%) of cat meat to
formulate cat meat contaminated meatballs in the proportions of 10:45:45, 5:47.5:47.5,
1:49.5:49.5, 0.1:49.95:49.95 and 0.01:49.995:49.995, respectively. Finally, all the
ingredients were blended properly and divided into four parts and mechanically each part
was given into a ball shape (Ali, Hashim, Mustafa, & Man, 2012a). To mimic standard
boiling and extensive autoclaving effect thus prepared raw meatballs were subjected to
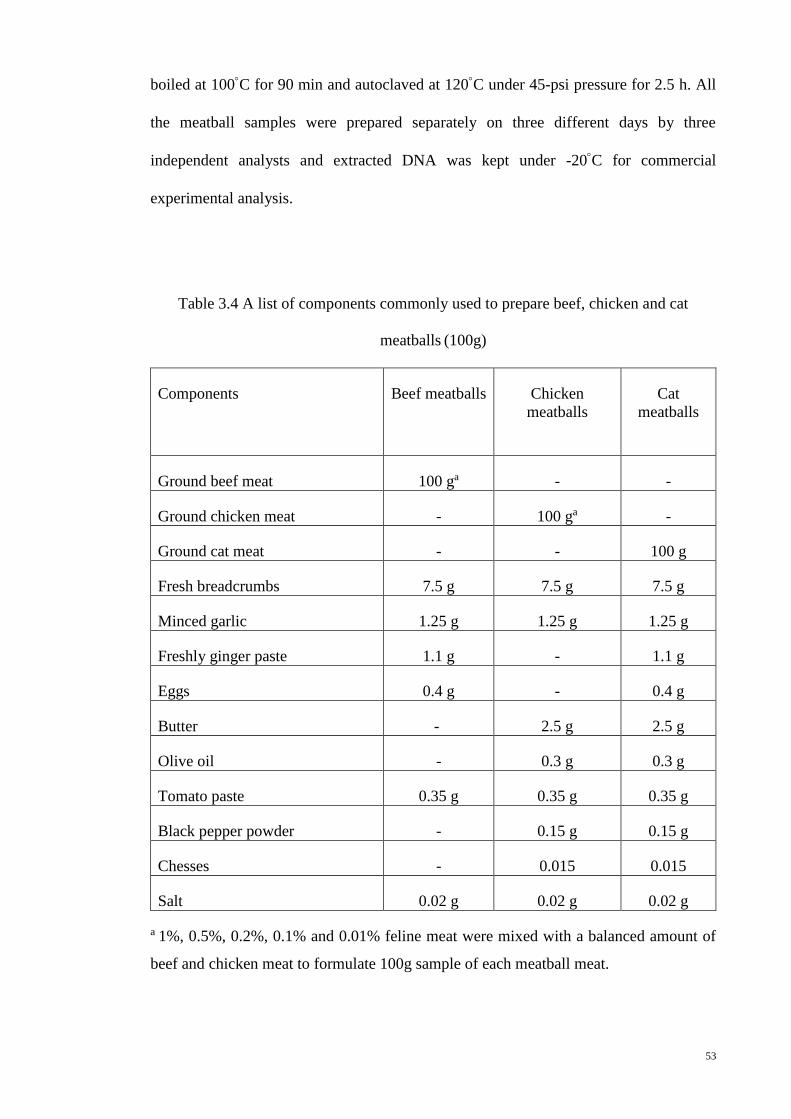
53
boiled at 100C for 90 min and autoclaved at 120C under 45-psi pressure for 2.5 h. All
the meatball samples were prepared separately on three different days by three
independent analysts and extracted DNA was kept under -20C for commercial
experimental analysis.
Table 3.4 A list of components commonly used to prepare beef, chicken and cat
meatballs (100g)
Components Beef meatballs Chicken
meatballs
Cat
meatballs
Ground beef meat 100 ga - -
Ground chicken meat - 100 ga -
Ground cat meat - - 100 g
Fresh breadcrumbs 7.5 g 7.5 g 7.5 g
Minced garlic 1.25 g 1.25 g 1.25 g
Freshly ginger paste 1.1 g - 1.1 g
Eggs 0.4 g - 0.4 g
Butter - 2.5 g 2.5 g
Olive oil - 0.3 g 0.3 g
Tomato paste 0.35 g 0.35 g 0.35 g
Black pepper powder - 0.15 g 0.15 g
Chesses - 0.015 0.015
Salt 0.02 g 0.02 g 0.02 g
a 1%, 0.5%, 0.2%, 0.1% and 0.01% feline meat were mixed with a balanced amount of
beef and chicken meat to formulate 100g sample of each meatball meat.
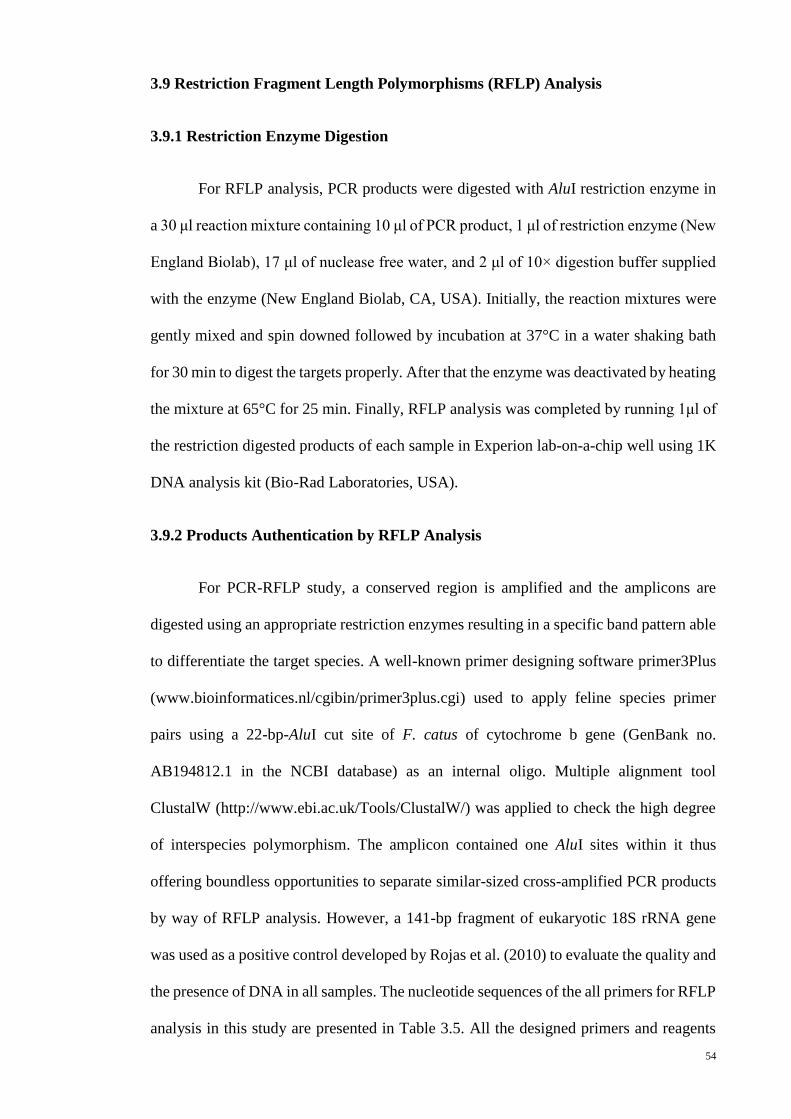
54
3.9 Restriction Fragment Length Polymorphisms (RFLP) Analysis
3.9.1 Restriction Enzyme Digestion
For RFLP analysis, PCR products were digested with AluI restriction enzyme in
a 30 μl reaction mixture containing 10 μl of PCR product, 1 μl of restriction enzyme (New
England Biolab), 17 μl of nuclease free water, and 2 μl of 10× digestion buffer supplied
with the enzyme (New England Biolab, CA, USA). Initially, the reaction mixtures were
gently mixed and spin downed followed by incubation at 37°C in a water shaking bath
for 30 min to digest the targets properly. After that the enzyme was deactivated by heating
the mixture at 65°C for 25 min. Finally, RFLP analysis was completed by running 1μl of
the restriction digested products of each sample in Experion lab-on-a-chip well using 1K
DNA analysis kit (Bio-Rad Laboratories, USA).
3.9.2 Products Authentication by RFLP Analysis
For PCR-RFLP study, a conserved region is amplified and the amplicons are
digested using an appropriate restriction enzymes resulting in a specific band pattern able
to differentiate the target species. A well-known primer designing software primer3Plus
(www.bioinformatices.nl/cgibin/primer3plus.cgi) used to apply feline species primer
pairs using a 22-bp-AluI cut site of F. catus of cytochrome b gene (GenBank no.
AB194812.1 in the NCBI database) as an internal oligo. Multiple alignment tool
ClustalW (http://www.ebi.ac.uk/Tools/ClustalW/) was applied to check the high degree
of interspecies polymorphism. The amplicon contained one AluI sites within it thus
offering boundless opportunities to separate similar-sized cross-amplified PCR products
by way of RFLP analysis. However, a 141-bp fragment of eukaryotic 18S rRNA gene
was used as a positive control developed by Rojas et al. (2010) to evaluate the quality and
the presence of DNA in all samples. The nucleotide sequences of the all primers for RFLP
analysis in this study are presented in Table 3.5. All the designed primers and reagents
55
and chemicals for target digestion were synthesized and purchased from the 1st Base
Laboratories (1st Base Laboratories, Sdn. Bhd., Selangor, and Malaysia).
Table 3.5 Primer pairs used in this experiment for product authentication by RFLP
analysis
Primer identity Sequence (5´ - 3´) Length
(bp)
Feline forward primer ACT ATT ATT TAC AGT CAT AGC CAC
AGC
27
Feline reverse primer CAG AAG GAC ATT TGG CCT CA 20
Eukaryotic forward
primer
GGT AGT GAC GAA AAA TAA CAA TAC
AGG AC
29
Eukaryotic reverse
primer
ATA CGC TAT TGG AGC TGG AAT TAC C 25
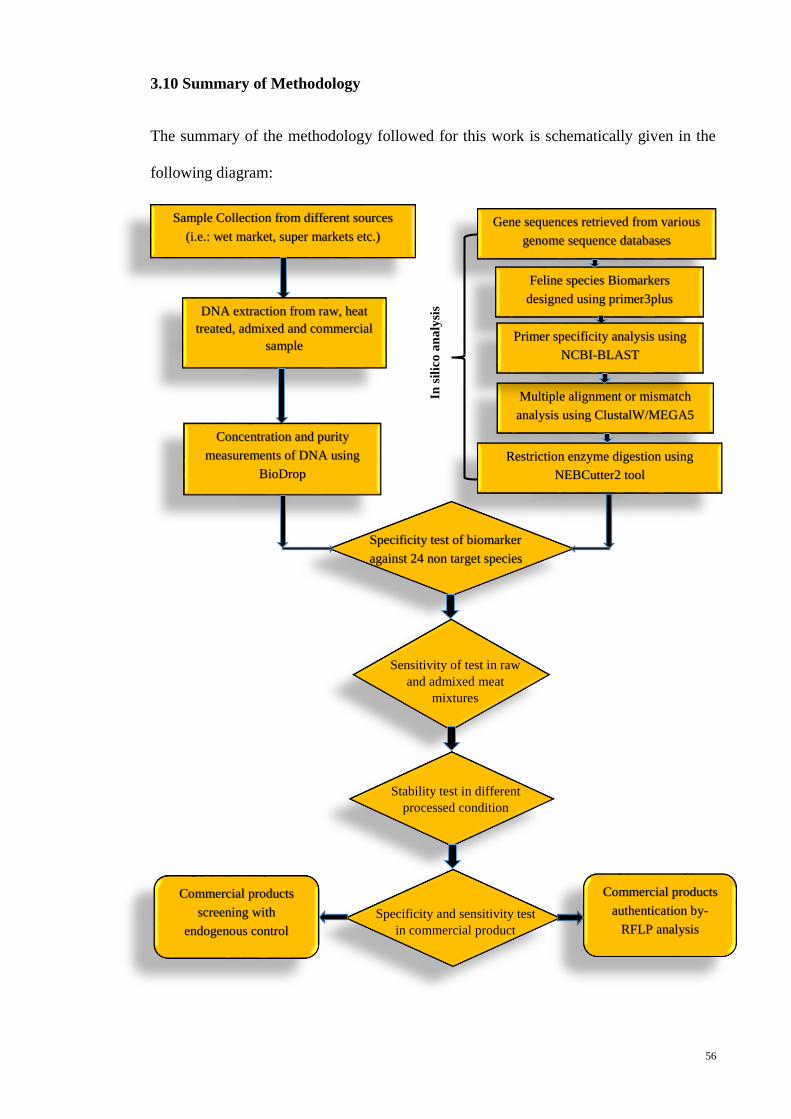
56
3.10 Summary of Methodology
The summary of the methodology followed for this work is schematically given in the
following diagram:
Sample Collection from different sources
(i.e.: wet market, super markets etc.)
DNA extraction from raw, heat
treated, admixed and commercial
sample
Concentration and purity
measurements of DNA using
BioDrop
Gene sequences retrieved from various
genome sequence databases
Feline species Biomarkers
designed using primer3plus
Multiple alignment or mismatch
analysis using ClustalW/MEGA5
Primer specificity analysis using
NCBI-BLAST
Restriction enzyme digestion using
NEBCutter2 tool
Specificity test of biomarker
against 24 non target species
Sensitivity of test in raw
and admixed meat
mixtures
Stability test in different
processed condition
Specificity and sensitivity test
in commercial product
Commercial products
screening with
endogenous control
Commercial products
authentication by-
RFLP analysis
In s
ilic
o a
na
lysi
s

CHAPTER FOUR
RESULTS
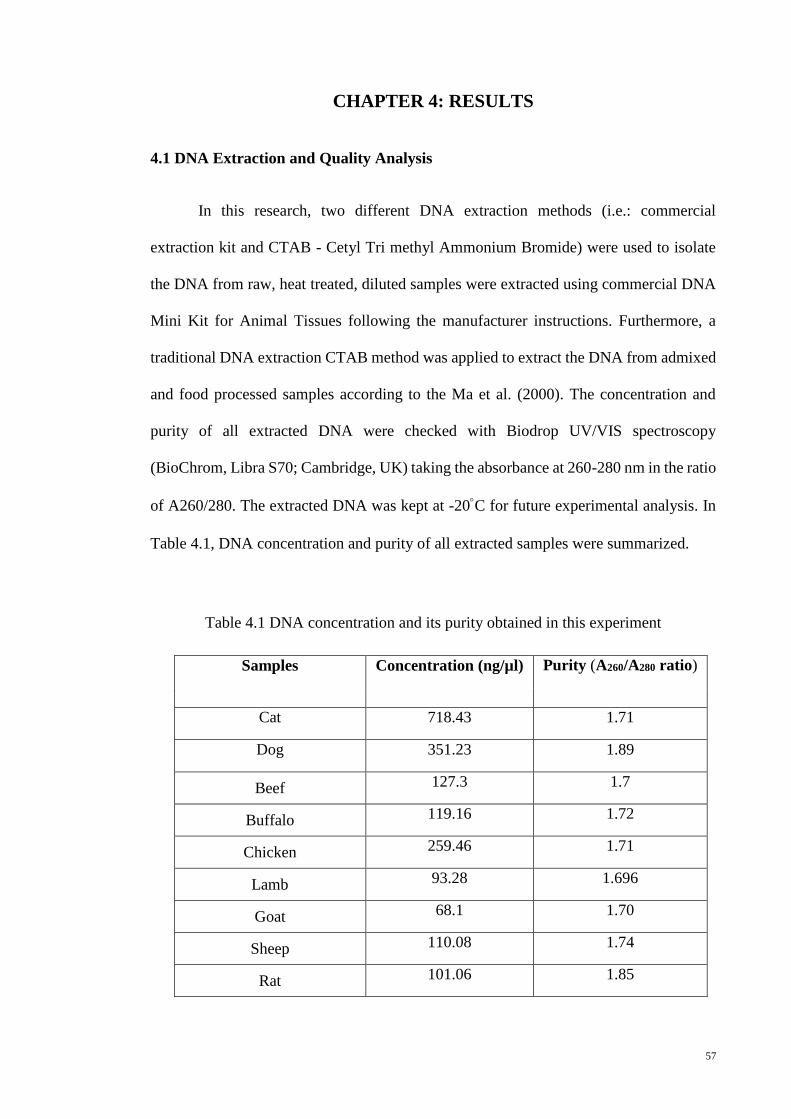
57
CHAPTER 4: RESULTS
4.1 DNA Extraction and Quality Analysis
In this research, two different DNA extraction methods (i.e.: commercial
extraction kit and CTAB - Cetyl Tri methyl Ammonium Bromide) were used to isolate
the DNA from raw, heat treated, diluted samples were extracted using commercial DNA
Mini Kit for Animal Tissues following the manufacturer instructions. Furthermore, a
traditional DNA extraction CTAB method was applied to extract the DNA from admixed
and food processed samples according to the Ma et al. (2000). The concentration and
purity of all extracted DNA were checked with Biodrop UV/VIS spectroscopy
(BioChrom, Libra S70; Cambridge, UK) taking the absorbance at 260-280 nm in the ratio
of A260/280. The extracted DNA was kept at -20C for future experimental analysis. In
Table 4.1, DNA concentration and purity of all extracted samples were summarized.
Table 4.1 DNA concentration and its purity obtained in this experiment
Samples Concentration (ng/µl) Purity (A260/A280 ratio)
Cat 718.43 1.71
Dog 351.23 1.89
Beef 127.3 1.7
Buffalo 119.16 1.72
Chicken 259.46 1.71
Lamb 93.28 1.696
Goat 68.1 1.70
Sheep 110.08 1.74
Rat 101.06 1.85

58
Table 4.1 Continued
Samples Concentration (ng/µl) Purity (A260/A280 ratio)
Pig 100.6 1.77
Turtle 330.91 1.73
Turkey 193.25 1.705
Duck 91.05 1.82
Pegion 248.3 1.715
Monkey 276.4 1.739
Cuttle 158.2 1.812
Tilapia 62.15 1.99
Carp 89.86 1.86
Shrimp 177.05 2.02
Cod fish 117.7 1.92
Onion 316.2 1.73
Tomato 154.9 1.75
Wheat 210.01 2.03
Cucumber 59.98 1.98
Potato 101.4 1.88
10-fold diluted DNA Concentration (ng/µl) Purity (A260/A280 ratio)
10 ng 146.29 1.99
1 ng 234.02 2.02
0.1 ng 128.82 1.87
0.01 ng 114.03 1.92
0.001 ng 156.19 1.72
0.0001 ng 131.9 1.97
Heat treatments
Autoclaving Concentration (ng/µl) Purity (A260/A280 ratio)
110C for 2 h 129.25 1.83
120C for 50 min 137.26 1.72

59
Table 4.1 Continued
Autoclaving Concentration (ng/µl) Purity (A260/A280 ratio)
133C for 20 min 114.09 1.79
120C for 2.5 h 227.3 1.705
Boiling
100C for 90 min 512.7 1.91
Microwaving
300W for 10 min 485.5 1.85
500W for 20 min 561.03 1.71
700W for 30 min 494.21 1.96
Ternary complex matrices
Admixed matrices Concentration (ng/µl) Purity (A260/A280 ratio)
Raw admixed 554.09 1.74
Boiled admixed 469.66 1.77
Oven heated 531.32 1.75
Autoclaved admixed 691.86 1.98
Processed foods Concentration (ng/µl) Purity (A260/A280 ratio)
Beef burgers
339.33 1.78
Chicken burgers 200.2 2.02
Beef meatballs 238.40 1.82
Chicken meatballs 369.79 1.89
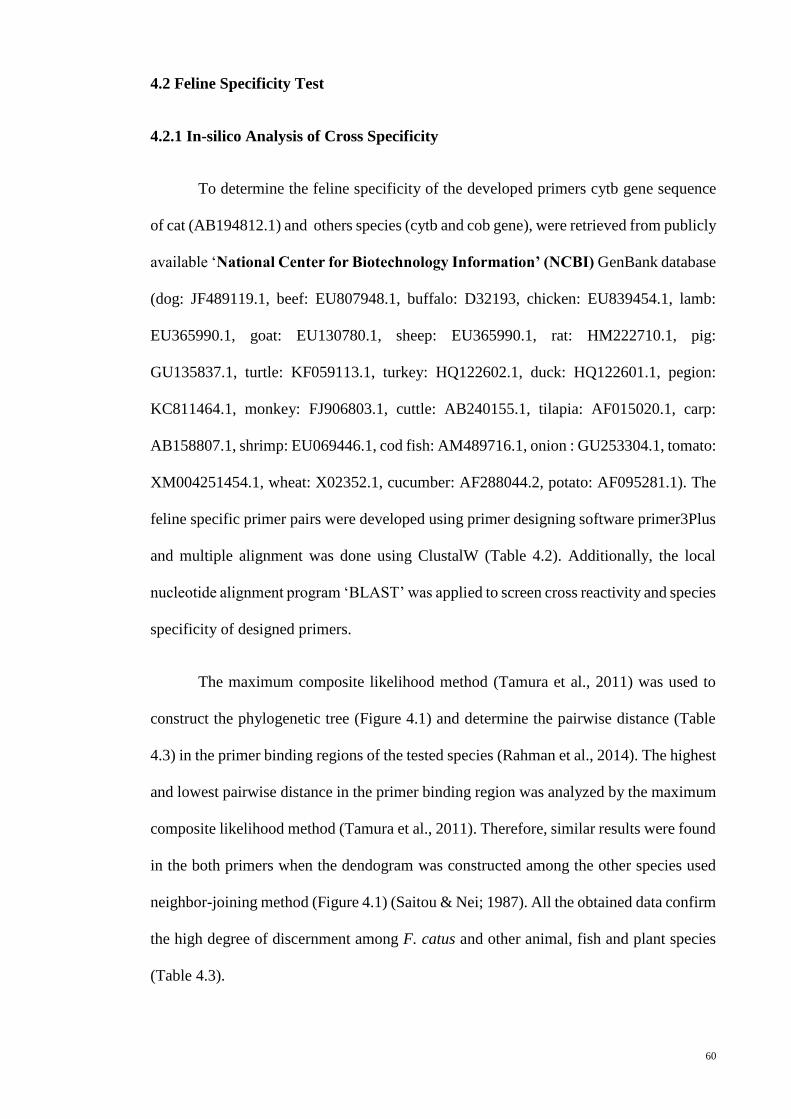
60
4.2 Feline Specificity Test
4.2.1 In-silico Analysis of Cross Specificity
To determine the feline specificity of the developed primers cytb gene sequence
of cat (AB194812.1) and others species (cytb and cob gene), were retrieved from publicly
available ‘National Center for Biotechnology Information’ (NCBI) GenBank database
(dog: JF489119.1, beef: EU807948.1, buffalo: D32193, chicken: EU839454.1, lamb:
EU365990.1, goat: EU130780.1, sheep: EU365990.1, rat: HM222710.1, pig:
GU135837.1, turtle: KF059113.1, turkey: HQ122602.1, duck: HQ122601.1, pegion:
KC811464.1, monkey: FJ906803.1, cuttle: AB240155.1, tilapia: AF015020.1, carp:
AB158807.1, shrimp: EU069446.1, cod fish: AM489716.1, onion : GU253304.1, tomato:
XM004251454.1, wheat: X02352.1, cucumber: AF288044.2, potato: AF095281.1). The
feline specific primer pairs were developed using primer designing software primer3Plus
and multiple alignment was done using ClustalW (Table 4.2). Additionally, the local
nucleotide alignment program ‘BLAST’ was applied to screen cross reactivity and species
specificity of designed primers.
The maximum composite likelihood method (Tamura et al., 2011) was used to
construct the phylogenetic tree (Figure 4.1) and determine the pairwise distance (Table
4.3) in the primer binding regions of the tested species (Rahman et al., 2014). The highest
and lowest pairwise distance in the primer binding region was analyzed by the maximum
composite likelihood method (Tamura et al., 2011). Therefore, similar results were found
in the both primers when the dendogram was constructed among the other species used
neighbor-joining method (Figure 4.1) (Saitou & Nei; 1987). All the obtained data confirm
the high degree of discernment among F. catus and other animal, fish and plant species
(Table 4.3).
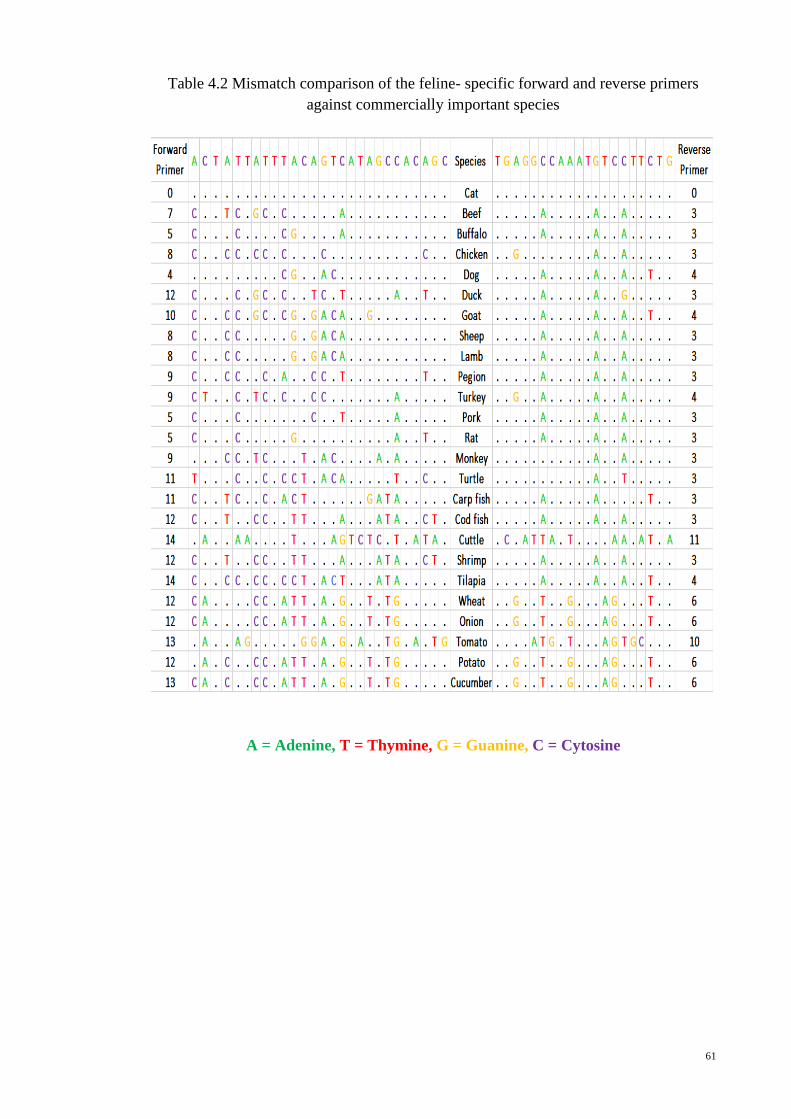
61
Table 4.2 Mismatch comparison of the feline- specific forward and reverse primers
against commercially important species
1A = Adenine, C = Cytosine, T = Thymine, G = Guanine
A = Adenine, T = Thymine, G = Guanine, C = Cytosine
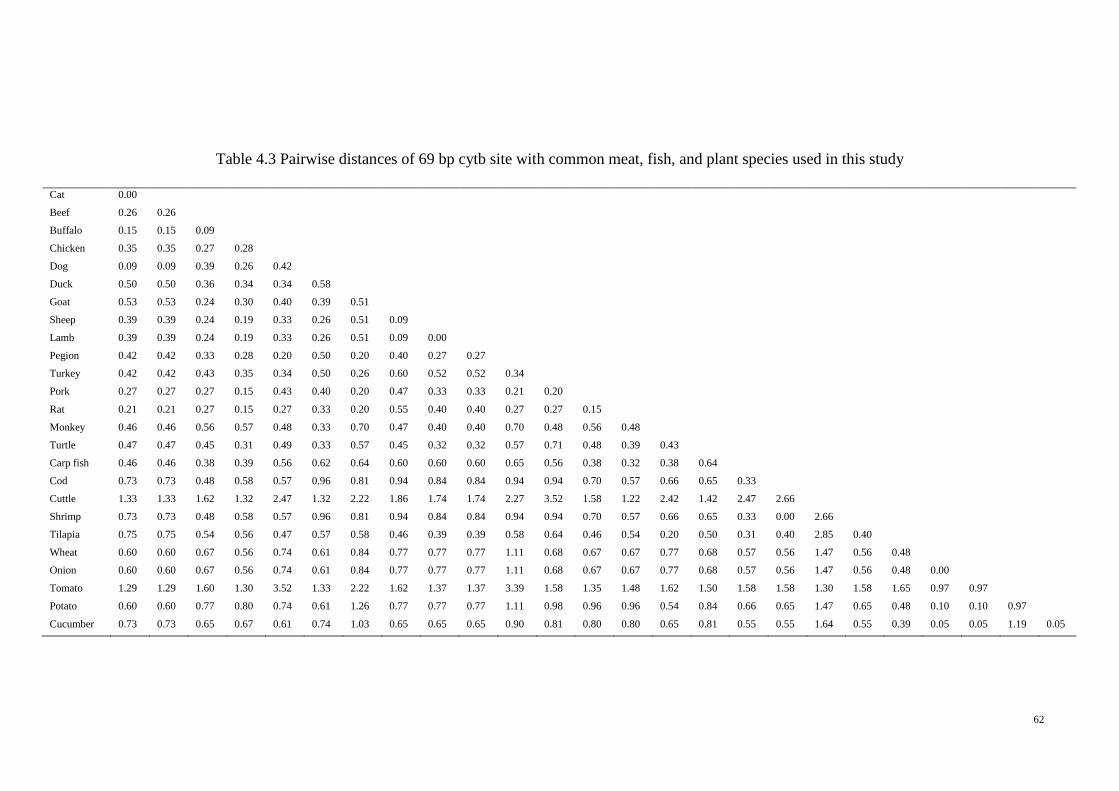
62
Table 4.3 Pairwise distances of 69 bp cytb site with common meat, fish, and plant species used in this study
Cat 0.00
Beef 0.26 0.26
Buffalo 0.15 0.15 0.09
Chicken 0.35 0.35 0.27 0.28
Dog 0.09 0.09 0.39 0.26 0.42
Duck 0.50 0.50 0.36 0.34 0.34 0.58
Goat 0.53 0.53 0.24 0.30 0.40 0.39 0.51
Sheep 0.39 0.39 0.24 0.19 0.33 0.26 0.51 0.09
Lamb 0.39 0.39 0.24 0.19 0.33 0.26 0.51 0.09 0.00
Pegion 0.42 0.42 0.33 0.28 0.20 0.50 0.20 0.40 0.27 0.27
Turkey 0.42 0.42 0.43 0.35 0.34 0.50 0.26 0.60 0.52 0.52 0.34
Pork 0.27 0.27 0.27 0.15 0.43 0.40 0.20 0.47 0.33 0.33 0.21 0.20
Rat 0.21 0.21 0.27 0.15 0.27 0.33 0.20 0.55 0.40 0.40 0.27 0.27 0.15
Monkey 0.46 0.46 0.56 0.57 0.48 0.33 0.70 0.47 0.40 0.40 0.70 0.48 0.56 0.48
Turtle 0.47 0.47 0.45 0.31 0.49 0.33 0.57 0.45 0.32 0.32 0.57 0.71 0.48 0.39 0.43
Carp fish 0.46 0.46 0.38 0.39 0.56 0.62 0.64 0.60 0.60 0.60 0.65 0.56 0.38 0.32 0.38 0.64
Cod 0.73 0.73 0.48 0.58 0.57 0.96 0.81 0.94 0.84 0.84 0.94 0.94 0.70 0.57 0.66 0.65 0.33
Cuttle 1.33 1.33 1.62 1.32 2.47 1.32 2.22 1.86 1.74 1.74 2.27 3.52 1.58 1.22 2.42 1.42 2.47 2.66
Shrimp 0.73 0.73 0.48 0.58 0.57 0.96 0.81 0.94 0.84 0.84 0.94 0.94 0.70 0.57 0.66 0.65 0.33 0.00 2.66
Tilapia 0.75 0.75 0.54 0.56 0.47 0.57 0.58 0.46 0.39 0.39 0.58 0.64 0.46 0.54 0.20 0.50 0.31 0.40 2.85 0.40
Wheat 0.60 0.60 0.67 0.56 0.74 0.61 0.84 0.77 0.77 0.77 1.11 0.68 0.67 0.67 0.77 0.68 0.57 0.56 1.47 0.56 0.48
Onion 0.60 0.60 0.67 0.56 0.74 0.61 0.84 0.77 0.77 0.77 1.11 0.68 0.67 0.67 0.77 0.68 0.57 0.56 1.47 0.56 0.48 0.00
Tomato 1.29 1.29 1.60 1.30 3.52 1.33 2.22 1.62 1.37 1.37 3.39 1.58 1.35 1.48 1.62 1.50 1.58 1.58 1.30 1.58 1.65 0.97 0.97
Potato 0.60 0.60 0.77 0.80 0.74 0.61 1.26 0.77 0.77 0.77 1.11 0.98 0.96 0.96 0.54 0.84 0.66 0.65 1.47 0.65 0.48 0.10 0.10 0.97
Cucumber 0.73 0.73 0.65 0.67 0.61 0.74 1.03 0.65 0.65 0.65 0.90 0.81 0.80 0.80 0.65 0.81 0.55 0.55 1.64 0.55 0.39 0.05 0.05 1.19 0.05
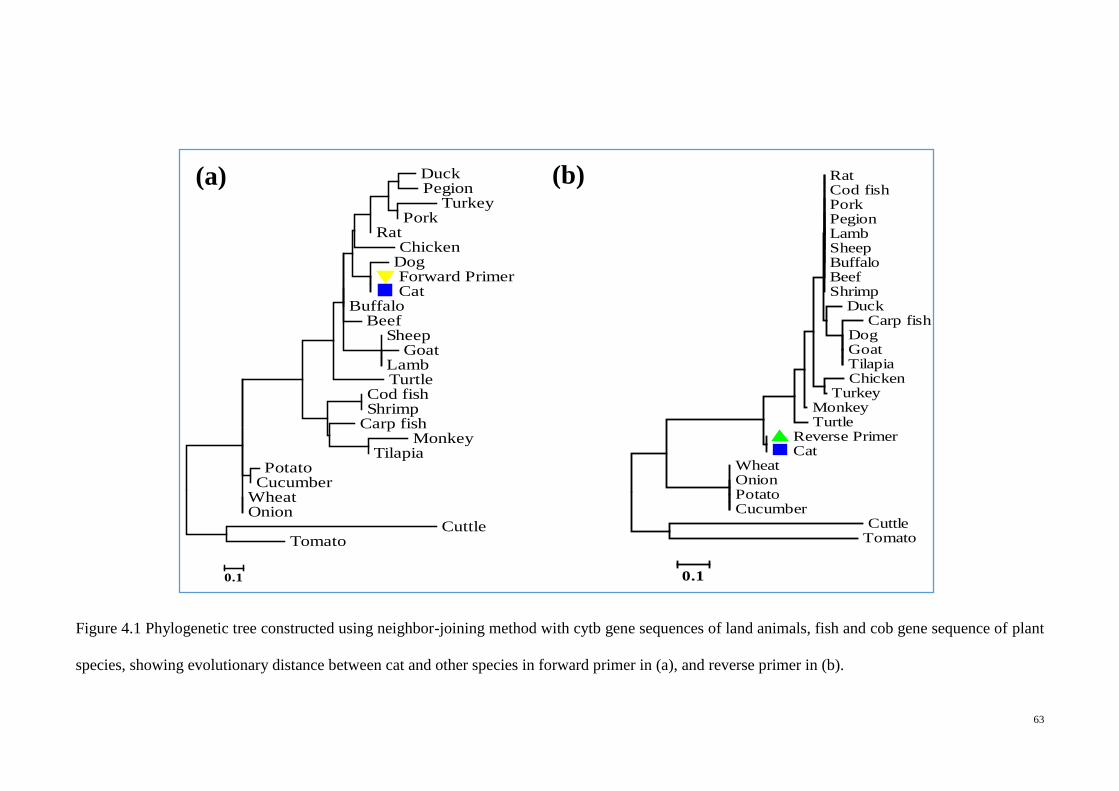
63
Figure 4.1 Phylogenetic tree constructed using neighbor-joining method with cytb gene sequences of land animals, fish and cob gene sequence of plant
species, showing evolutionary distance between cat and other species in forward primer in (a), and reverse primer in (b).
(b) Rat Cod fish Pork Pegion Lamb Sheep Buffalo Beef Shrimp
Duck Carp fish
Dog Goat Tilapia Chicken
Turkey Monkey Turtle
Reverse Primer Cat
Wheat Onion Potato Cucumber
Cuttle Tomato
0.1
Duck Pegion
Turkey Pork
Rat Chicken
Dog Forward Primer Cat
Buffalo Beef
Sheep Goat
Lamb Turtle
Cod fish Shrimp
Carp fish Monkey
Tilapia Potato
Cucumber Wheat Onion
Cuttle Tomato
0.1
(a)
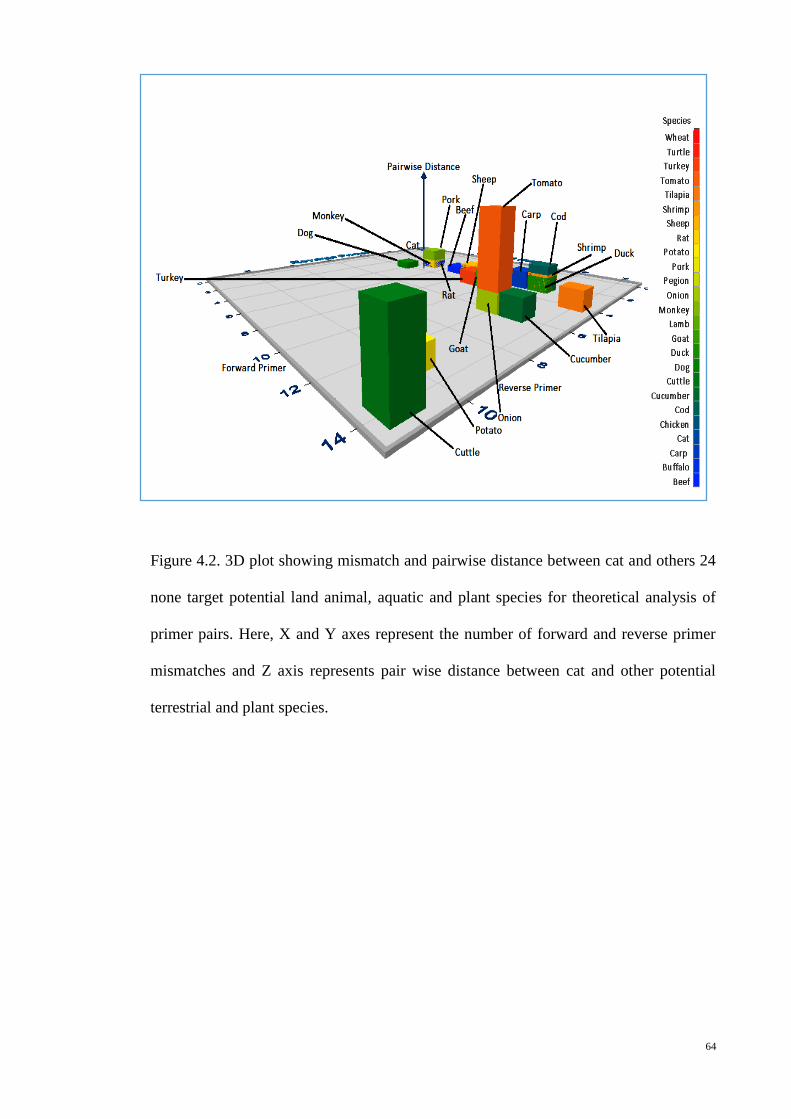
64
Figure 4.2. 3D plot showing mismatch and pairwise distance between cat and others 24
none target potential land animal, aquatic and plant species for theoretical analysis of
primer pairs. Here, X and Y axes represent the number of forward and reverse primer
mismatches and Z axis represents pair wise distance between cat and other potential
terrestrial and plant species.
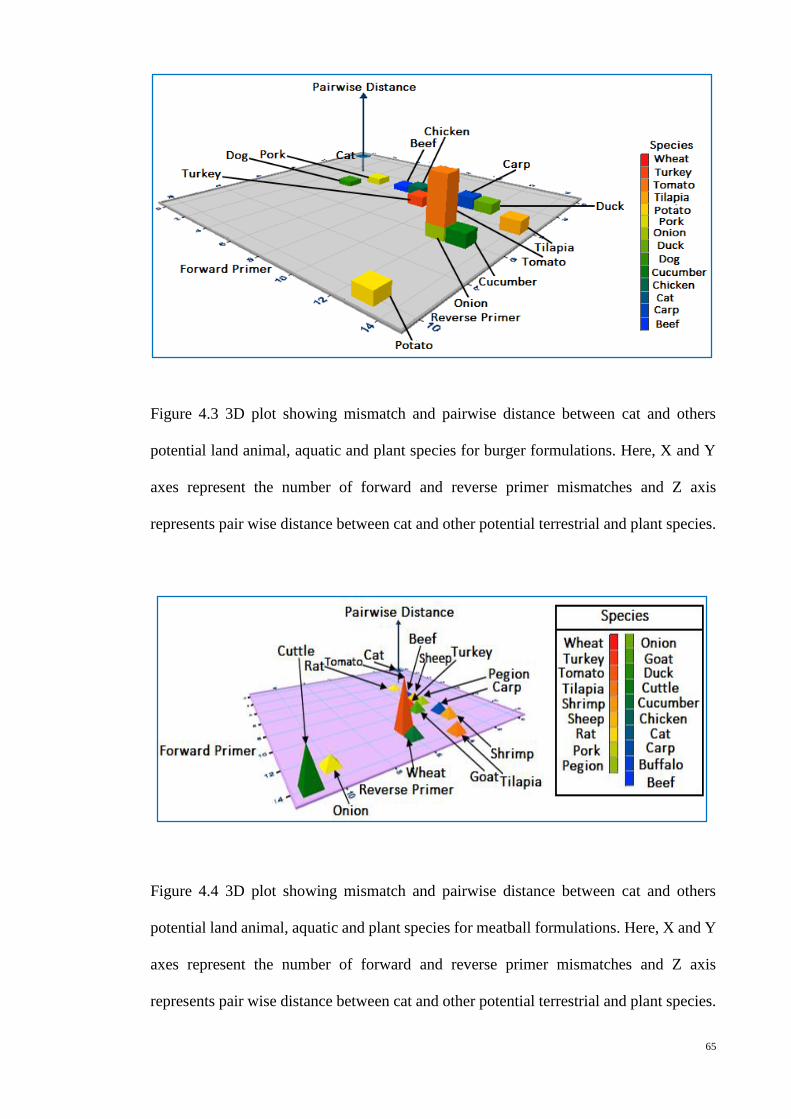
65
Figure 4.3 3D plot showing mismatch and pairwise distance between cat and others
potential land animal, aquatic and plant species for burger formulations. Here, X and Y
axes represent the number of forward and reverse primer mismatches and Z axis
represents pair wise distance between cat and other potential terrestrial and plant species.
Figure 4.4 3D plot showing mismatch and pairwise distance between cat and others
potential land animal, aquatic and plant species for meatball formulations. Here, X and Y
axes represent the number of forward and reverse primer mismatches and Z axis
represents pair wise distance between cat and other potential terrestrial and plant species.
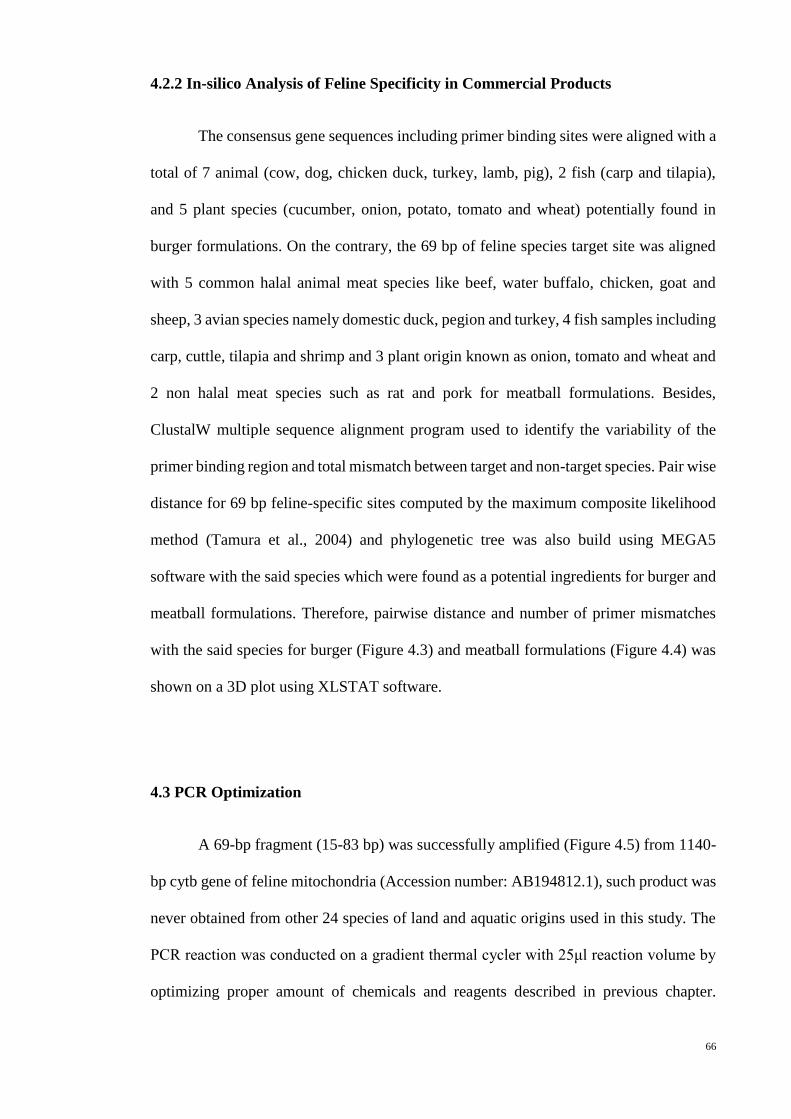
66
4.2.2 In-silico Analysis of Feline Specificity in Commercial Products
The consensus gene sequences including primer binding sites were aligned with a
total of 7 animal (cow, dog, chicken duck, turkey, lamb, pig), 2 fish (carp and tilapia),
and 5 plant species (cucumber, onion, potato, tomato and wheat) potentially found in
burger formulations. On the contrary, the 69 bp of feline species target site was aligned
with 5 common halal animal meat species like beef, water buffalo, chicken, goat and
sheep, 3 avian species namely domestic duck, pegion and turkey, 4 fish samples including
carp, cuttle, tilapia and shrimp and 3 plant origin known as onion, tomato and wheat and
2 non halal meat species such as rat and pork for meatball formulations. Besides,
ClustalW multiple sequence alignment program used to identify the variability of the
primer binding region and total mismatch between target and non-target species. Pair wise
distance for 69 bp feline-specific sites computed by the maximum composite likelihood
method (Tamura et al., 2004) and phylogenetic tree was also build using MEGA5
software with the said species which were found as a potential ingredients for burger and
meatball formulations. Therefore, pairwise distance and number of primer mismatches
with the said species for burger (Figure 4.3) and meatball formulations (Figure 4.4) was
shown on a 3D plot using XLSTAT software.
4.3 PCR Optimization
A 69-bp fragment (15-83 bp) was successfully amplified (Figure 4.5) from 1140-
bp cytb gene of feline mitochondria (Accession number: AB194812.1), such product was
never obtained from other 24 species of land and aquatic origins used in this study. The
PCR reaction was conducted on a gradient thermal cycler with 25μl reaction volume by
optimizing proper amount of chemicals and reagents described in previous chapter.

67
Conversely, 58C (Figure 4.5) was found to more appropriate annealing temperature for
the amplification of desired products.
Figure 4.5 Optimization of newly developed primer pairs on gradient temperatures. Lanes
1 to 6 represents target DNA amplified at different annealing temperatures (57C to 62C).
Lane L: 50 bp DNA ladder, Lane 1: 57C, Lane 2: 58C, Lane 3:59C, Lane 4: 60C, Lane
5: 61C, Lane 6: 62C, respectively.
4.4 Feline Specificity Test with Extracted DNA
To verify the feline specificity of the designed primers species specific PCR assay
was performed along with twenty four non target species. The species-specific primers
(69 bp) successfully amplified only from cat DNA template and no cross-species
amplification was identified ( Figure 4.6) with others fourteen animals, five fish and five
plant species confirming the in-silico or theoretical analysis.
69 bp 50 bp
100 bp
800 bp
500 bp
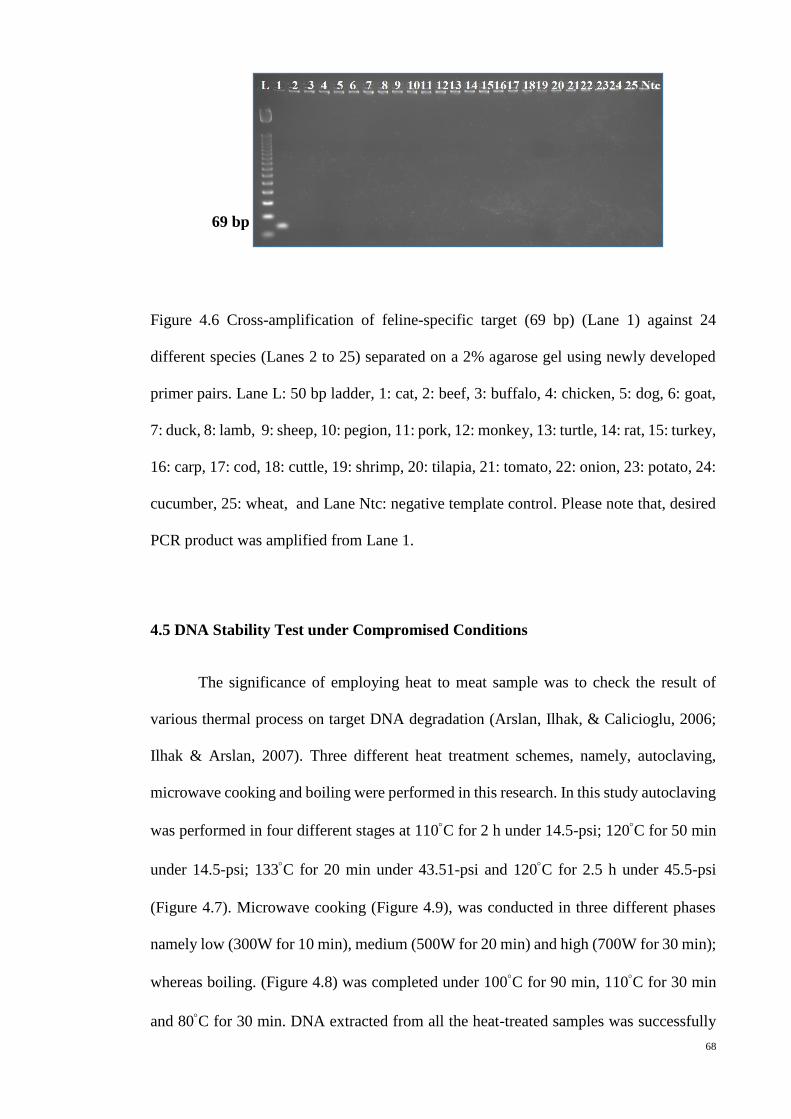
68
Figure 4.6 Cross-amplification of feline-specific target (69 bp) (Lane 1) against 24
different species (Lanes 2 to 25) separated on a 2% agarose gel using newly developed
primer pairs. Lane L: 50 bp ladder, 1: cat, 2: beef, 3: buffalo, 4: chicken, 5: dog, 6: goat,
7: duck, 8: lamb, 9: sheep, 10: pegion, 11: pork, 12: monkey, 13: turtle, 14: rat, 15: turkey,
16: carp, 17: cod, 18: cuttle, 19: shrimp, 20: tilapia, 21: tomato, 22: onion, 23: potato, 24:
cucumber, 25: wheat, and Lane Ntc: negative template control. Please note that, desired
PCR product was amplified from Lane 1.
4.5 DNA Stability Test under Compromised Conditions
The significance of employing heat to meat sample was to check the result of
various thermal process on target DNA degradation (Arslan, Ilhak, & Calicioglu, 2006;
Ilhak & Arslan, 2007). Three different heat treatment schemes, namely, autoclaving,
microwave cooking and boiling were performed in this research. In this study autoclaving
was performed in four different stages at 110C for 2 h under 14.5-psi; 120C for 50 min
under 14.5-psi; 133C for 20 min under 43.51-psi and 120C for 2.5 h under 45.5-psi
(Figure 4.7). Microwave cooking (Figure 4.9), was conducted in three different phases
namely low (300W for 10 min), medium (500W for 20 min) and high (700W for 30 min);
whereas boiling. (Figure 4.8) was completed under 100C for 90 min, 110C for 30 min
and 80C for 30 min. DNA extracted from all the heat-treated samples was successfully
69 bp
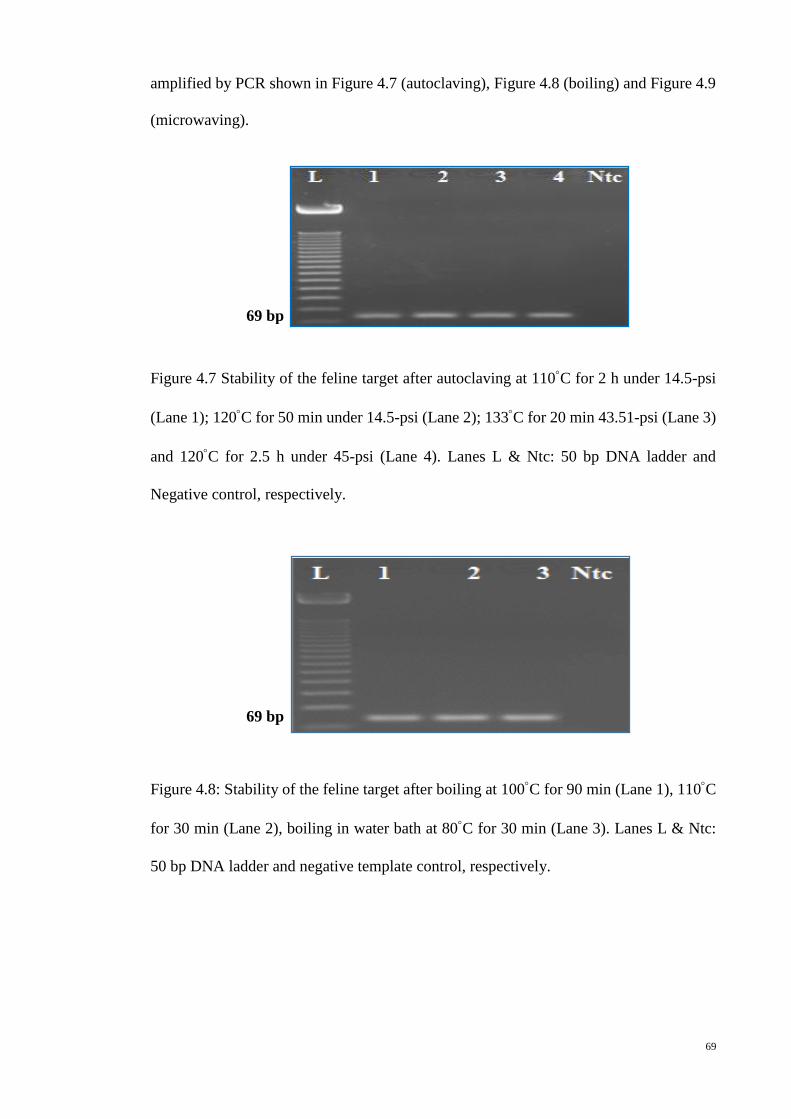
69
amplified by PCR shown in Figure 4.7 (autoclaving), Figure 4.8 (boiling) and Figure 4.9
(microwaving).
Figure 4.7 Stability of the feline target after autoclaving at 110C for 2 h under 14.5-psi
(Lane 1); 120C for 50 min under 14.5-psi (Lane 2); 133C for 20 min 43.51-psi (Lane 3)
and 120C for 2.5 h under 45-psi (Lane 4). Lanes L & Ntc: 50 bp DNA ladder and
Negative control, respectively.
Figure 4.8: Stability of the feline target after boiling at 100C for 90 min (Lane 1), 110C
for 30 min (Lane 2), boiling in water bath at 80C for 30 min (Lane 3). Lanes L & Ntc:
50 bp DNA ladder and negative template control, respectively.
69 bp
69 bp

70
Figure 4.9 Stability of the feline target after microwave heating at 300W for 10 min (Lane
1), 500W for 20 min (Lane 2) and 700W for 30 min (Lane 3). Clear 69 bp PCR product
was obtained from all lanes (1 to 3), except the lane (4). Feline meat cooked at above
700W and 30 min (not amplified) in lane 4. Lanes L & Ntc: 50 bp DNA ladder & negative
control, respectively.
4.6 Sensitivity of Target DNA
4.6.1 Raw State
The sensitivity of raw and pure sample of extracted target DNA was checked by
10-fold (10, 1, 0.1, 0.01, 0.001, and 0.0001 ng) serial dilution method by three
independent analysts on three different days. Sensitivity for the heat treated samples were
studied in a similar way and, we clearly detected 69 bp PCR products from 0.0001ng
feline DNA template both in raw and heat treated (autoclaved and boiled) and therefore
defined the limit of detection (LOD) for this assay under raw and treating conditions
(Figures 4.10, 4.11 and 4.12).
69 bp
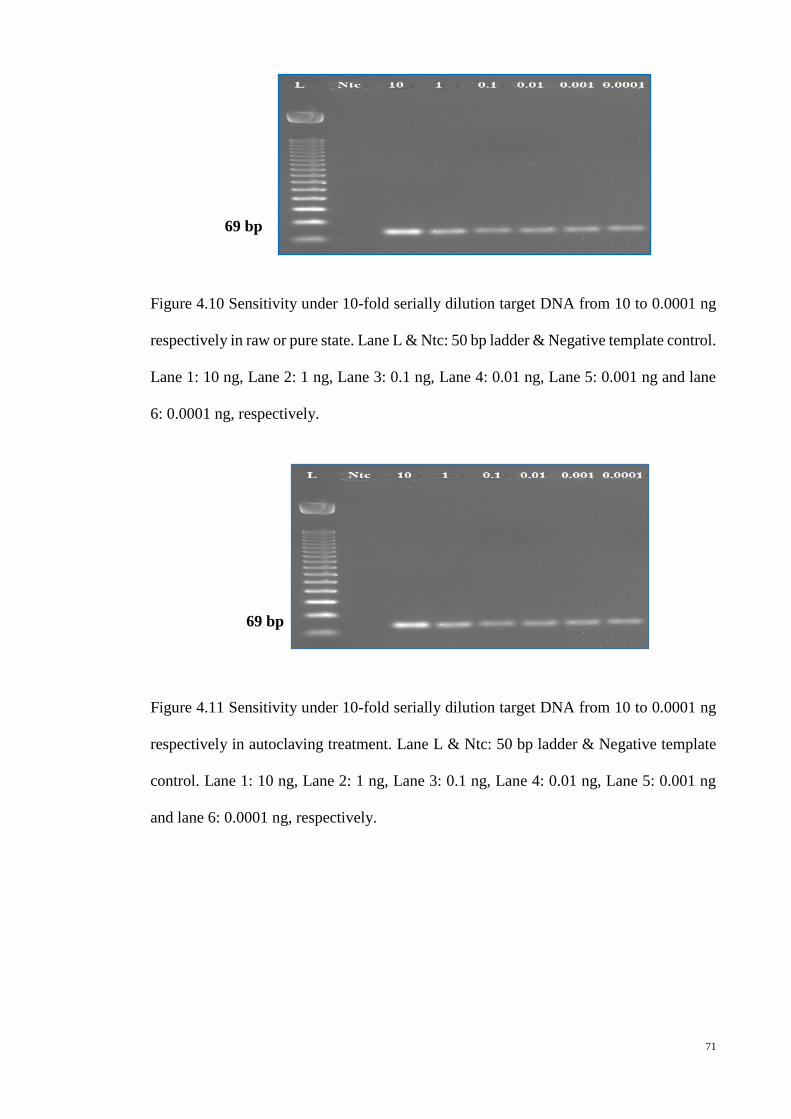
71
Figure 4.10 Sensitivity under 10-fold serially dilution target DNA from 10 to 0.0001 ng
respectively in raw or pure state. Lane L & Ntc: 50 bp ladder & Negative template control.
Lane 1: 10 ng, Lane 2: 1 ng, Lane 3: 0.1 ng, Lane 4: 0.01 ng, Lane 5: 0.001 ng and lane
6: 0.0001 ng, respectively.
Figure 4.11 Sensitivity under 10-fold serially dilution target DNA from 10 to 0.0001 ng
respectively in autoclaving treatment. Lane L & Ntc: 50 bp ladder & Negative template
control. Lane 1: 10 ng, Lane 2: 1 ng, Lane 3: 0.1 ng, Lane 4: 0.01 ng, Lane 5: 0.001 ng
and lane 6: 0.0001 ng, respectively.
69 bp
69 bp
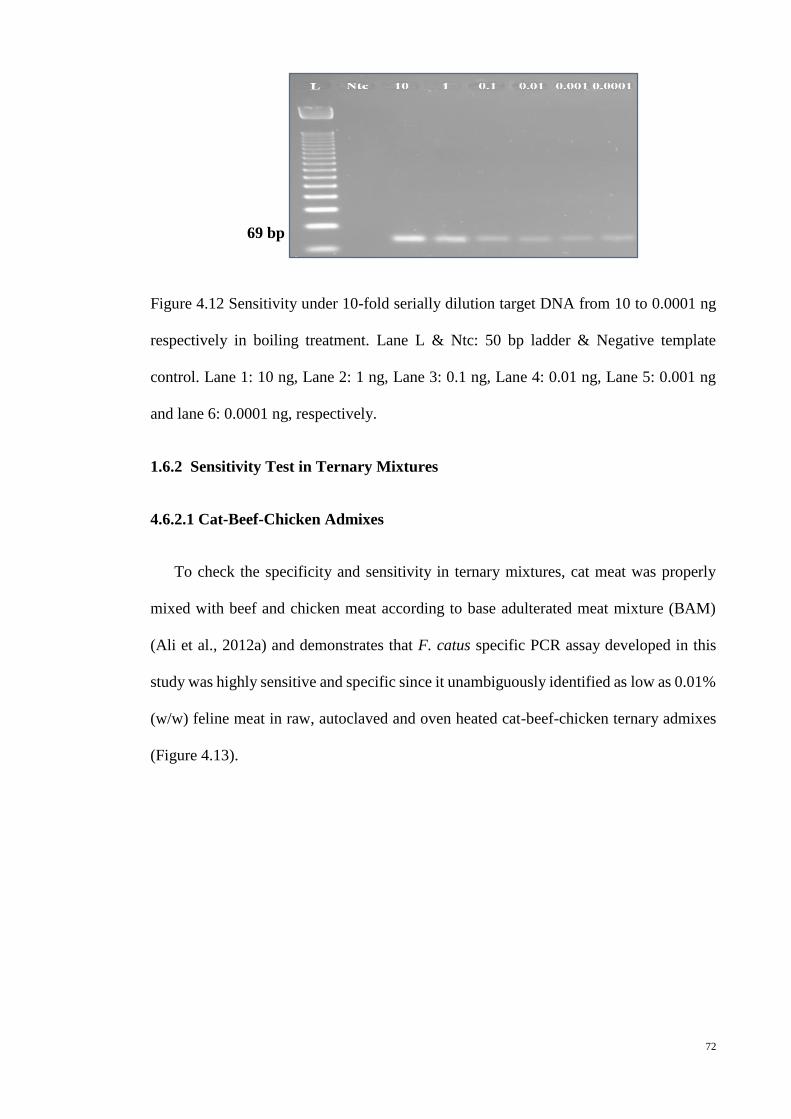
72
Figure 4.12 Sensitivity under 10-fold serially dilution target DNA from 10 to 0.0001 ng
respectively in boiling treatment. Lane L & Ntc: 50 bp ladder & Negative template
control. Lane 1: 10 ng, Lane 2: 1 ng, Lane 3: 0.1 ng, Lane 4: 0.01 ng, Lane 5: 0.001 ng
and lane 6: 0.0001 ng, respectively.
1.6.2 Sensitivity Test in Ternary Mixtures
4.6.2.1 Cat-Beef-Chicken Admixes
To check the specificity and sensitivity in ternary mixtures, cat meat was properly
mixed with beef and chicken meat according to base adulterated meat mixture (BAM)
(Ali et al., 2012a) and demonstrates that F. catus specific PCR assay developed in this
study was highly sensitive and specific since it unambiguously identified as low as 0.01%
(w/w) feline meat in raw, autoclaved and oven heated cat-beef-chicken ternary admixes
(Figure 4.13).
69 bp

73
Figure 4.13 Sensitivity in cat: beef: chicken ternary admixture under raw (Lanes 2 to 5),
autoclaved (Lanes 6 to 9) and oven heated (Lanes 11 to 14) states. However, Lanes 2 to
5: Raw admixtures (10, 1, 0.1 and 0.01%); Lanes 6 to 9: admixtures (10, 1, 0.1 and 0.01%)
autoclaved at (120C for 2.5 h in 45-psi); Lanes 11 to 14: admixtures (10, 1, 0.1 and
0.01%) oven heated at 180C for 30 min. Lane 1: 100% beef and Lane 10: 100% chicken
under raw states. Lanes L & Ntc: 50 bp ladder and negative template control, respectively.
4.6.2.2 Feline-Bovine-Wheat flour Admixes
On the other hand, to identify the specificity and sensitivity of cat-beef-wheat flour
ternary mixtures that was composed of bovine and wheat flour contaminated with 10%,
5%, 0.2% and 0.01% (w/w) of cat meat and validated that the newly developed short-
amplicon-length PCR assay was highly sensitive and more appropriate to track out the
trace amount of DNA in complex matrices and thus able to detect feline DNA as low
as 0.01% (w/w) in raw, autoclaved and boiled feline-bovine-wheat flour ternary
background (Figure 4.14).
69 bp
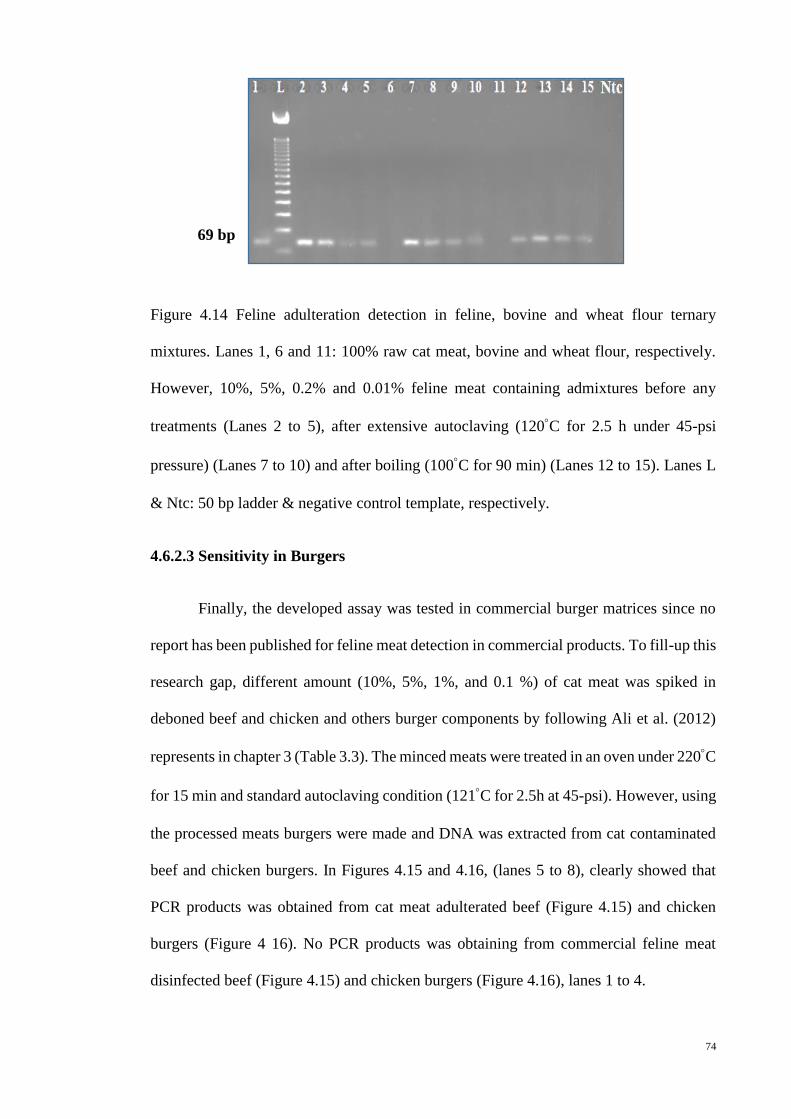
74
Figure 4.14 Feline adulteration detection in feline, bovine and wheat flour ternary
mixtures. Lanes 1, 6 and 11: 100% raw cat meat, bovine and wheat flour, respectively.
However, 10%, 5%, 0.2% and 0.01% feline meat containing admixtures before any
treatments (Lanes 2 to 5), after extensive autoclaving (120C for 2.5 h under 45-psi
pressure) (Lanes 7 to 10) and after boiling (100C for 90 min) (Lanes 12 to 15). Lanes L
& Ntc: 50 bp ladder & negative control template, respectively.
4.6.2.3 Sensitivity in Burgers
Finally, the developed assay was tested in commercial burger matrices since no
report has been published for feline meat detection in commercial products. To fill-up this
research gap, different amount (10%, 5%, 1%, and 0.1 %) of cat meat was spiked in
deboned beef and chicken and others burger components by following Ali et al. (2012)
represents in chapter 3 (Table 3.3). The minced meats were treated in an oven under 220C
for 15 min and standard autoclaving condition (121C for 2.5h at 45-psi). However, using
the processed meats burgers were made and DNA was extracted from cat contaminated
beef and chicken burgers. In Figures 4.15 and 4.16, (lanes 5 to 8), clearly showed that
PCR products was obtained from cat meat adulterated beef (Figure 4.15) and chicken
burgers (Figure 4 16). No PCR products was obtaining from commercial feline meat
disinfected beef (Figure 4.15) and chicken burgers (Figure 4.16), lanes 1 to 4.
69 bp
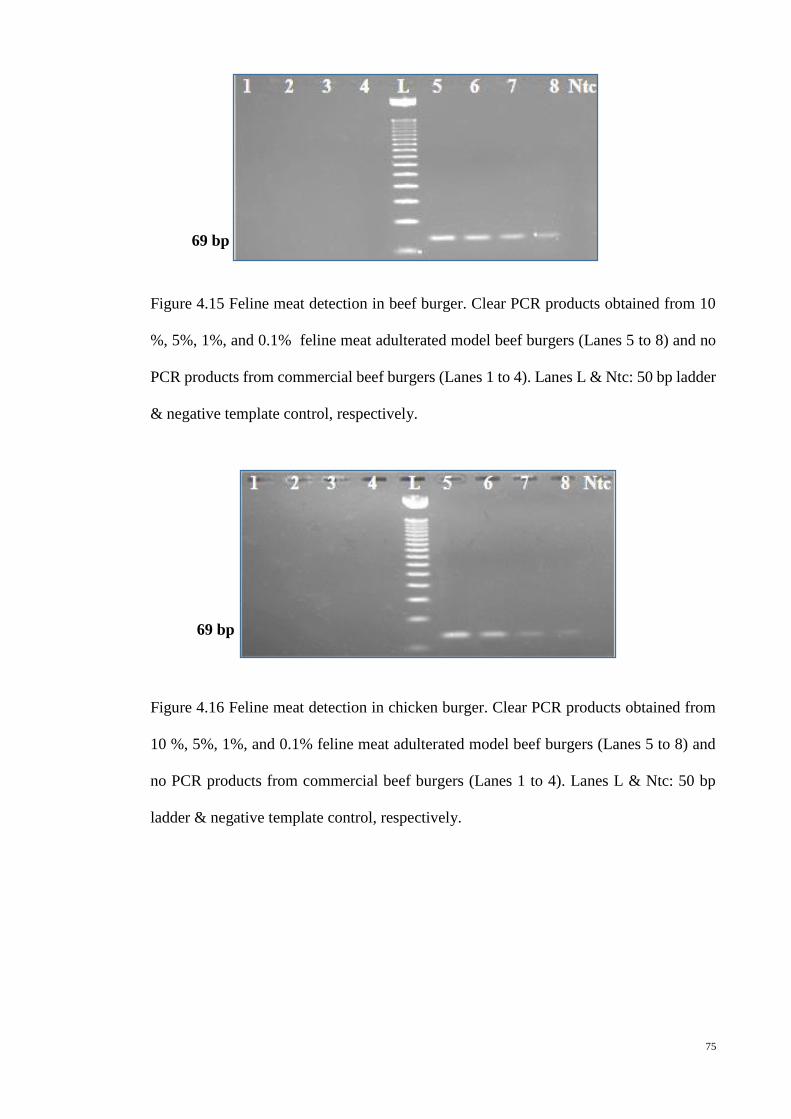
75
Figure 4.15 Feline meat detection in beef burger. Clear PCR products obtained from 10
%, 5%, 1%, and 0.1% feline meat adulterated model beef burgers (Lanes 5 to 8) and no
PCR products from commercial beef burgers (Lanes 1 to 4). Lanes L & Ntc: 50 bp ladder
& negative template control, respectively.
Figure 4.16 Feline meat detection in chicken burger. Clear PCR products obtained from
10 %, 5%, 1%, and 0.1% feline meat adulterated model beef burgers (Lanes 5 to 8) and
no PCR products from commercial beef burgers (Lanes 1 to 4). Lanes L & Ntc: 50 bp
ladder & negative template control, respectively.
69 bp
69 bp

76
Table 4.4 Screening of commercial beef and chicken burgers
Days Pure
beef
burger
Pure
chicken
burger
Pure
cat
burger
Cat meat
spiked
beef
burgers
Cat meat
spiked
chicken
burgers
Autoclaved
burgers
Oven
heated
burgers
Commercial beef
burgers
Commercial
chicken burgers
Detection
probaility
(%) A B C D E F G H
Day-1 3/3 3/3 3/3 3/3 3/3 3/3 3/3 0/3 0/3 0/3 0/3 0/3 0/3 0/3 0/3 100
Day-2 3/3 3/3 3/3 3/3 3/3 3/3 3/3 0/3 0/3 0/3 0/3 0/3 0/3 0/3 0/3 100
Day-3 3/3 3/3 3/3 3/3 3/3 3/3 3/3 0/3 0/3 0/3 0/3 0/3 0/3 0/3 0/3 100
Day-4 3/3 3/3 3/3 3/3 3/3 3/3 3/3 0/3 0/3 0/3 0/3 0/3 0/3 0/3 0/3 100
Day-5 3/3 3/3 3/3 3/3 3/3 3/3 3/3 0/3 0/3 0/3 0/3 0/3 0/3 0/3 0/3 100
Numerator denotes feline positive samples and denominator reflects total number of analyzed samples
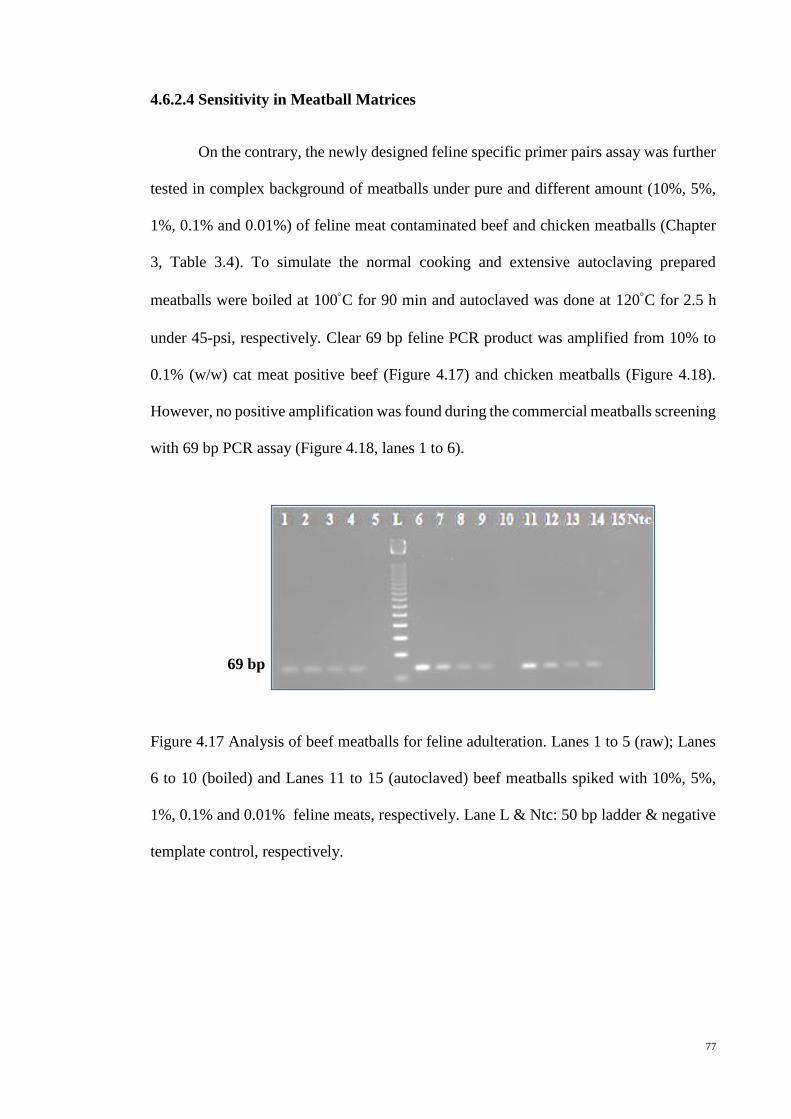
77
4.6.2.4 Sensitivity in Meatball Matrices
On the contrary, the newly designed feline specific primer pairs assay was further
tested in complex background of meatballs under pure and different amount (10%, 5%,
1%, 0.1% and 0.01%) of feline meat contaminated beef and chicken meatballs (Chapter
3, Table 3.4). To simulate the normal cooking and extensive autoclaving prepared
meatballs were boiled at 100C for 90 min and autoclaved was done at 120C for 2.5 h
under 45-psi, respectively. Clear 69 bp feline PCR product was amplified from 10% to
0.1% (w/w) cat meat positive beef (Figure 4.17) and chicken meatballs (Figure 4.18).
However, no positive amplification was found during the commercial meatballs screening
with 69 bp PCR assay (Figure 4.18, lanes 1 to 6).
Figure 4.17 Analysis of beef meatballs for feline adulteration. Lanes 1 to 5 (raw); Lanes
6 to 10 (boiled) and Lanes 11 to 15 (autoclaved) beef meatballs spiked with 10%, 5%,
1%, 0.1% and 0.01% feline meats, respectively. Lane L & Ntc: 50 bp ladder & negative
template control, respectively.
69 bp
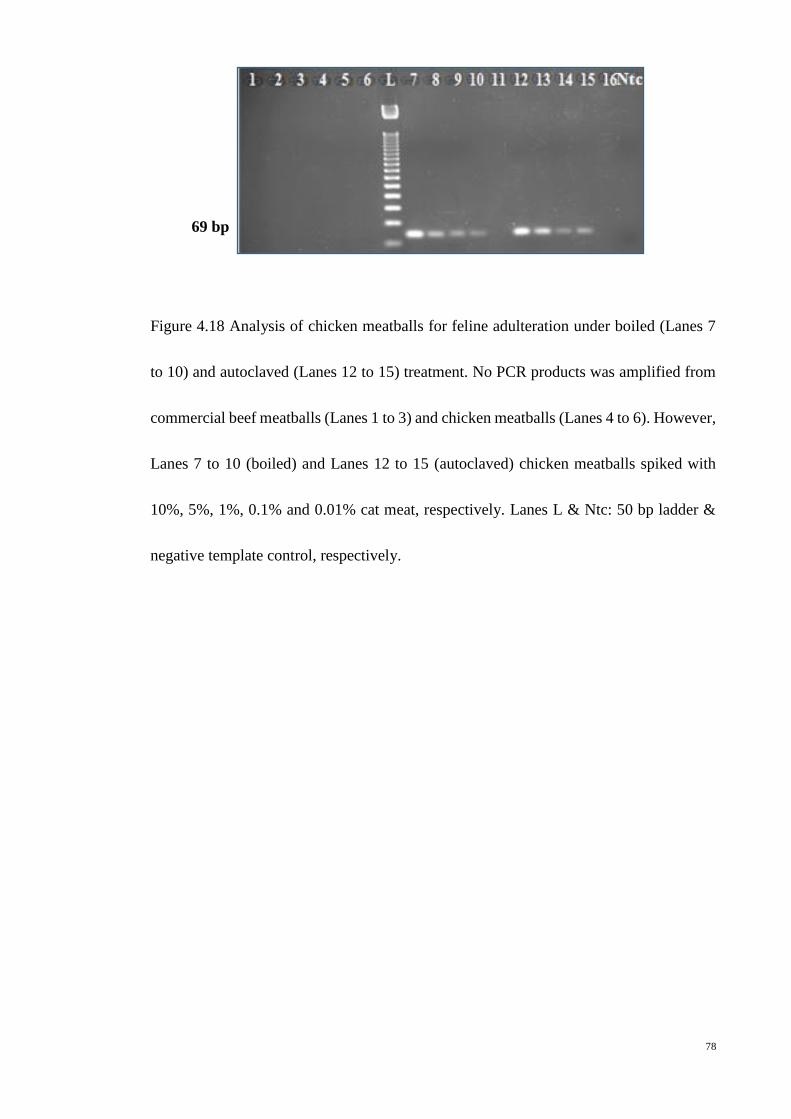
78
Figure 4.18 Analysis of chicken meatballs for feline adulteration under boiled (Lanes 7
to 10) and autoclaved (Lanes 12 to 15) treatment. No PCR products was amplified from
commercial beef meatballs (Lanes 1 to 3) and chicken meatballs (Lanes 4 to 6). However,
Lanes 7 to 10 (boiled) and Lanes 12 to 15 (autoclaved) chicken meatballs spiked with
10%, 5%, 1%, 0.1% and 0.01% cat meat, respectively. Lanes L & Ntc: 50 bp ladder &
negative template control, respectively.
69 bp

79
Table 4.5 Screening of commercial beef and chicken meatballs
Numerator reflects the total number of positive detection and denominator demonstrates
total number of samples analyzed
Meatball samples Day 1 Day 2 Day 3
Feline
meat
detection
up to 0.1%
(w/w)
Detection
probaility
(%)
Ready to eat pure beef meatball 3 3 3 0/9 100
Ready to eat pure chicken
meatball 3 3 3 0/9 100
Ready to eat pure cat meatball 3 3 3 9/9 100
Ready-to-eat cat meat spiked
beef meatballs 9 9 9 27/27 100
Ready-to-eat cat meat spiked
chicken meatballs 9 9 9 27/27 100
Commercial beef meatballs
A 9 9 9 0/9 100
B 9 9 9 0/9 100
C 9 9 9 0/9 100
Commercial chicken meatballs
A´ 9 9 9 0/9 100
B´ 9 9 9 0/9 100
C´ 9 9 9 0/9 100
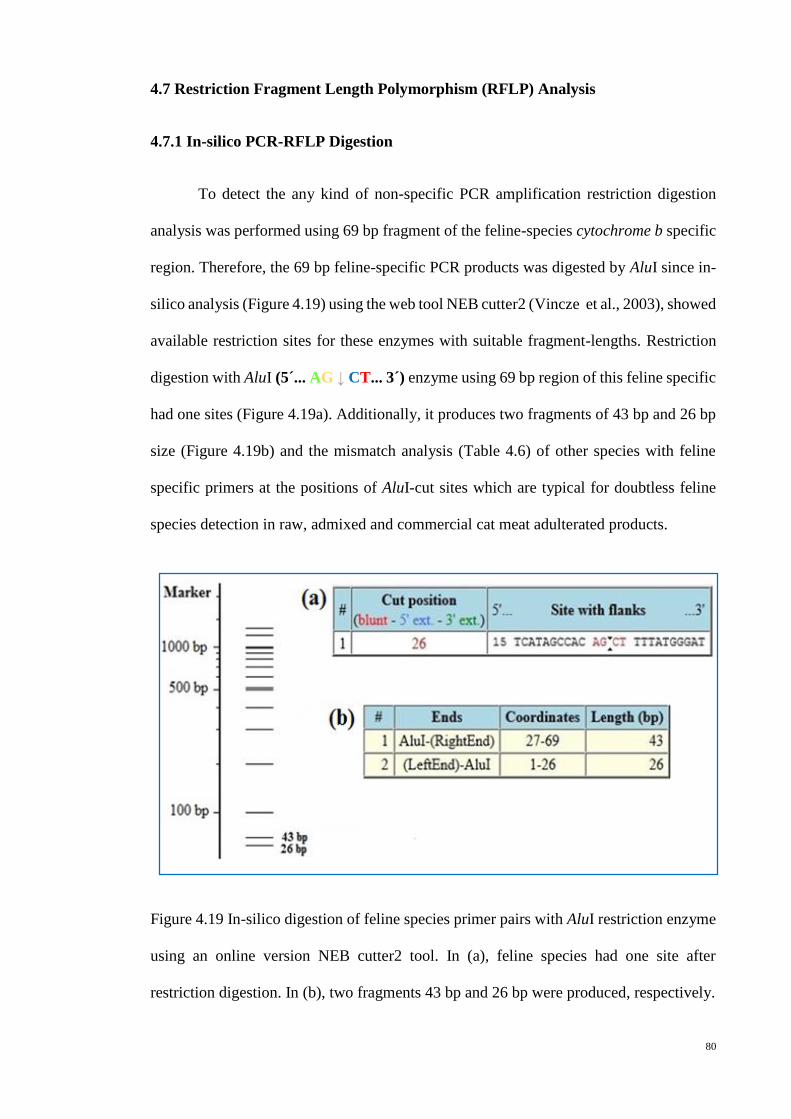
80
4.7 Restriction Fragment Length Polymorphism (RFLP) Analysis
4.7.1 In-silico PCR-RFLP Digestion
To detect the any kind of non-specific PCR amplification restriction digestion
analysis was performed using 69 bp fragment of the feline-species cytochrome b specific
region. Therefore, the 69 bp feline-specific PCR products was digested by AluI since in-
silico analysis (Figure 4.19) using the web tool NEB cutter2 (Vincze et al., 2003), showed
available restriction sites for these enzymes with suitable fragment-lengths. Restriction
digestion with AluI (5´... AG ↓ CT... 3´) enzyme using 69 bp region of this feline specific
had one sites (Figure 4.19a). Additionally, it produces two fragments of 43 bp and 26 bp
size (Figure 4.19b) and the mismatch analysis (Table 4.6) of other species with feline
specific primers at the positions of AluI-cut sites which are typical for doubtless feline
species detection in raw, admixed and commercial cat meat adulterated products.
Figure 4.19 In-silico digestion of feline species primer pairs with AluI restriction enzyme
using an online version NEB cutter2 tool. In (a), feline species had one site after
restriction digestion. In (b), two fragments 43 bp and 26 bp were produced, respectively.
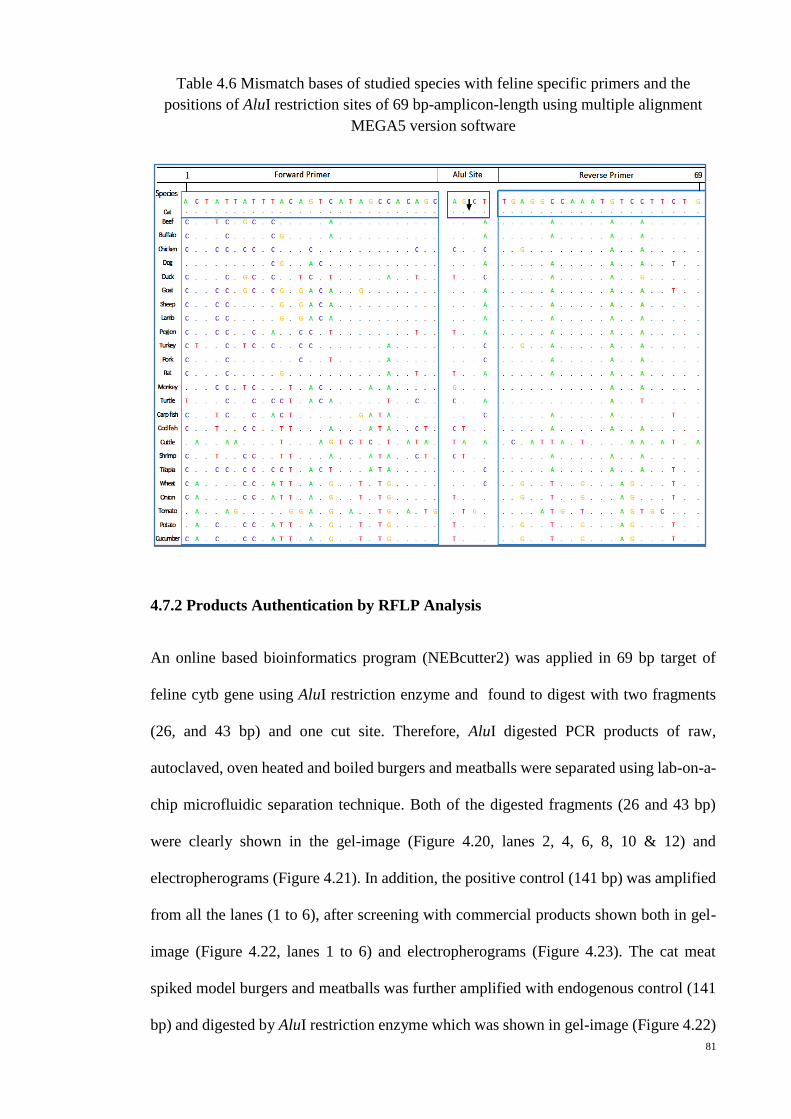
81
Table 4.6 Mismatch bases of studied species with feline specific primers and the
positions of AluI restriction sites of 69 bp-amplicon-length using multiple alignment
MEGA5 version software
4.7.2 Products Authentication by RFLP Analysis
An online based bioinformatics program (NEBcutter2) was applied in 69 bp target of
feline cytb gene using AluI restriction enzyme and found to digest with two fragments
(26, and 43 bp) and one cut site. Therefore, AluI digested PCR products of raw,
autoclaved, oven heated and boiled burgers and meatballs were separated using lab-on-a-
chip microfluidic separation technique. Both of the digested fragments (26 and 43 bp)
were clearly shown in the gel-image (Figure 4.20, lanes 2, 4, 6, 8, 10 & 12) and
electropherograms (Figure 4.21). In addition, the positive control (141 bp) was amplified
from all the lanes (1 to 6), after screening with commercial products shown both in gel-
image (Figure 4.22, lanes 1 to 6) and electropherograms (Figure 4.23). The cat meat
spiked model burgers and meatballs was further amplified with endogenous control (141
bp) and digested by AluI restriction enzyme which was shown in gel-image (Figure 4.22)
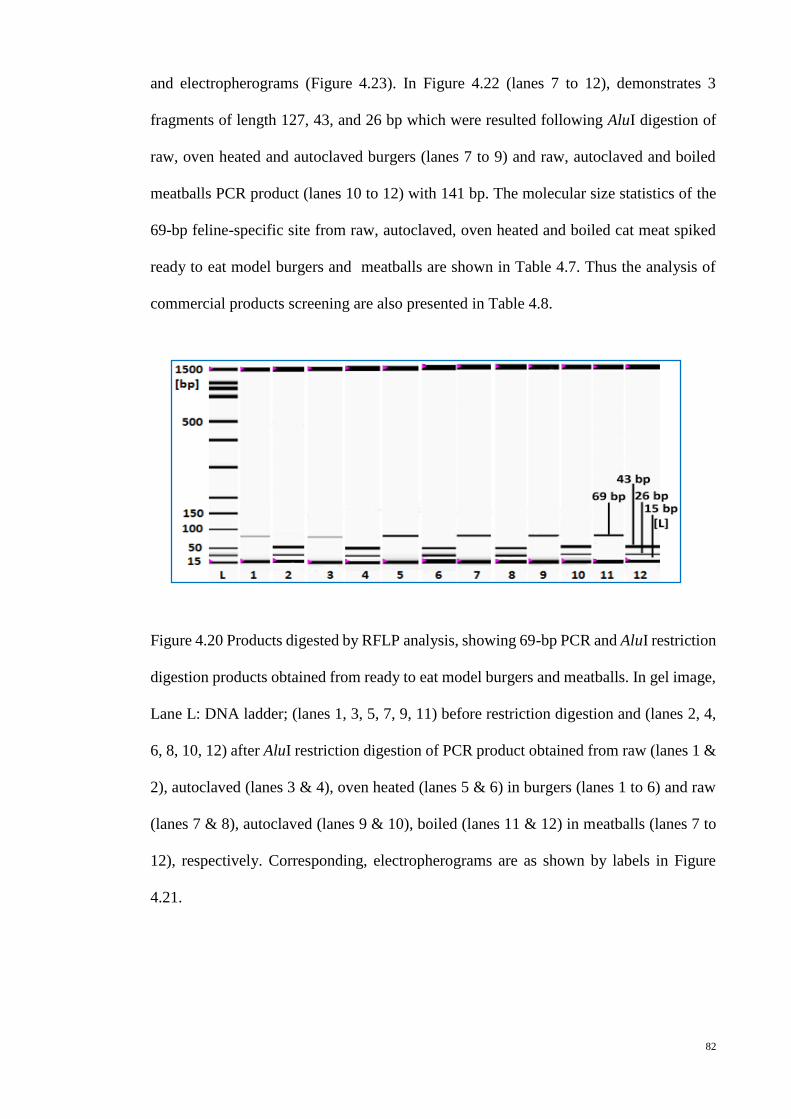
82
and electropherograms (Figure 4.23). In Figure 4.22 (lanes 7 to 12), demonstrates 3
fragments of length 127, 43, and 26 bp which were resulted following AluI digestion of
raw, oven heated and autoclaved burgers (lanes 7 to 9) and raw, autoclaved and boiled
meatballs PCR product (lanes 10 to 12) with 141 bp. The molecular size statistics of the
69-bp feline-specific site from raw, autoclaved, oven heated and boiled cat meat spiked
ready to eat model burgers and meatballs are shown in Table 4.7. Thus the analysis of
commercial products screening are also presented in Table 4.8.
Figure 4.20 Products digested by RFLP analysis, showing 69-bp PCR and AluI restriction
digestion products obtained from ready to eat model burgers and meatballs. In gel image,
Lane L: DNA ladder; (lanes 1, 3, 5, 7, 9, 11) before restriction digestion and (lanes 2, 4,
6, 8, 10, 12) after AluI restriction digestion of PCR product obtained from raw (lanes 1 &
2), autoclaved (lanes 3 & 4), oven heated (lanes 5 & 6) in burgers (lanes 1 to 6) and raw
(lanes 7 & 8), autoclaved (lanes 9 & 10), boiled (lanes 11 & 12) in meatballs (lanes 7 to
12), respectively. Corresponding, electropherograms are as shown by labels in Figure
4.21.

83
Figure 4.21 Products digested by RFLP analysis, showing 69-bp PCR and AluI restriction
digestion obtained from ready to eat model burgers and meatballs are shown in
electropherograms are demonstrated with labels in insets in above.
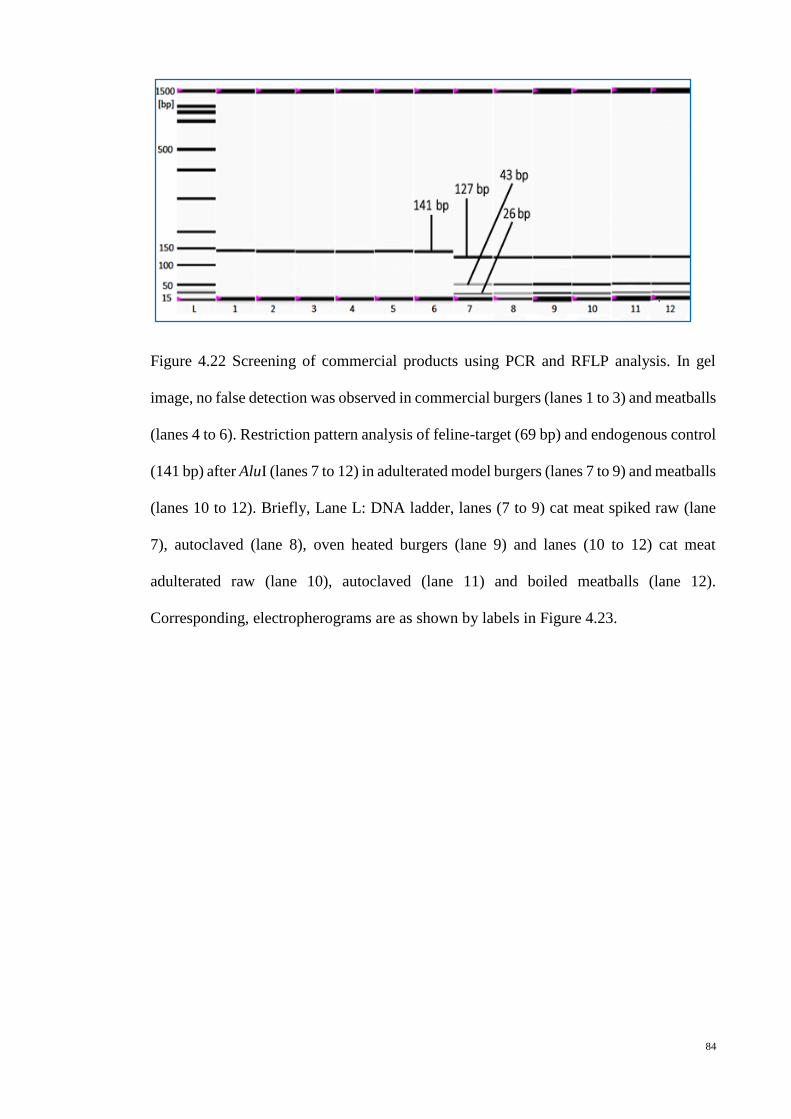
84
Figure 4.22 Screening of commercial products using PCR and RFLP analysis. In gel
image, no false detection was observed in commercial burgers (lanes 1 to 3) and meatballs
(lanes 4 to 6). Restriction pattern analysis of feline-target (69 bp) and endogenous control
(141 bp) after AluI (lanes 7 to 12) in adulterated model burgers (lanes 7 to 9) and meatballs
(lanes 10 to 12). Briefly, Lane L: DNA ladder, lanes (7 to 9) cat meat spiked raw (lane
7), autoclaved (lane 8), oven heated burgers (lane 9) and lanes (10 to 12) cat meat
adulterated raw (lane 10), autoclaved (lane 11) and boiled meatballs (lane 12).
Corresponding, electropherograms are as shown by labels in Figure 4.23.
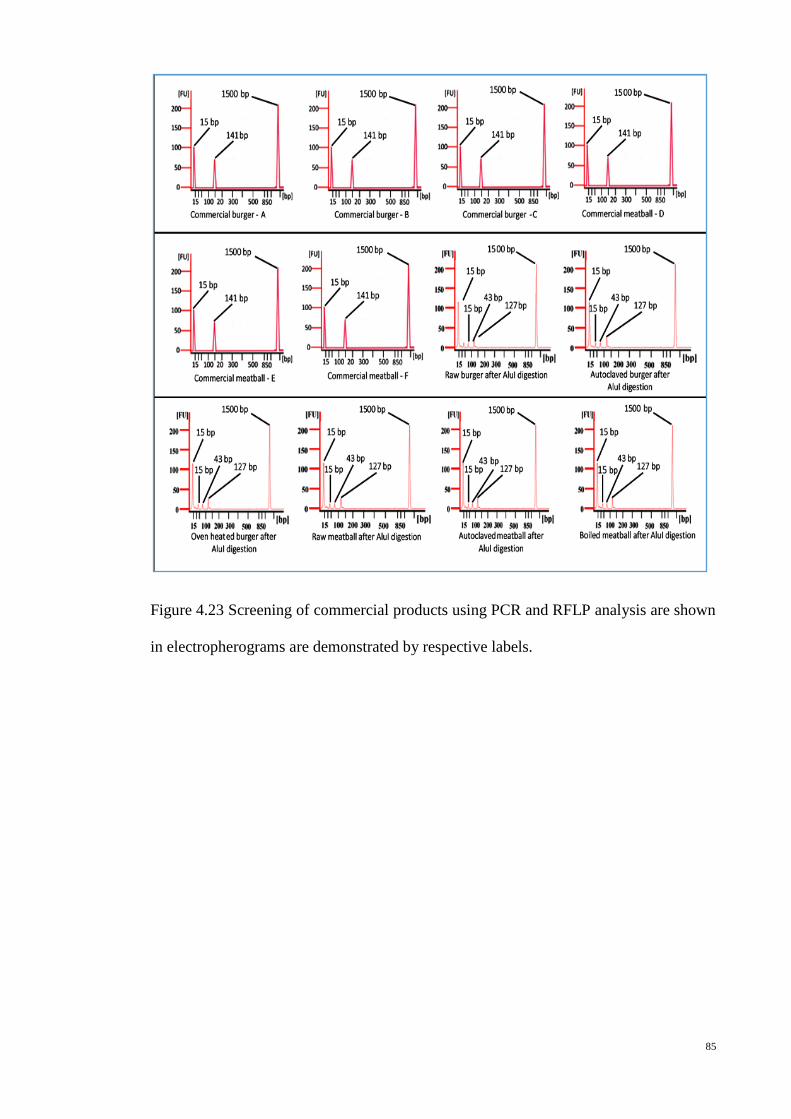
85
Figure 4.23 Screening of commercial products using PCR and RFLP analysis are shown
in electropherograms are demonstrated by respective labels.
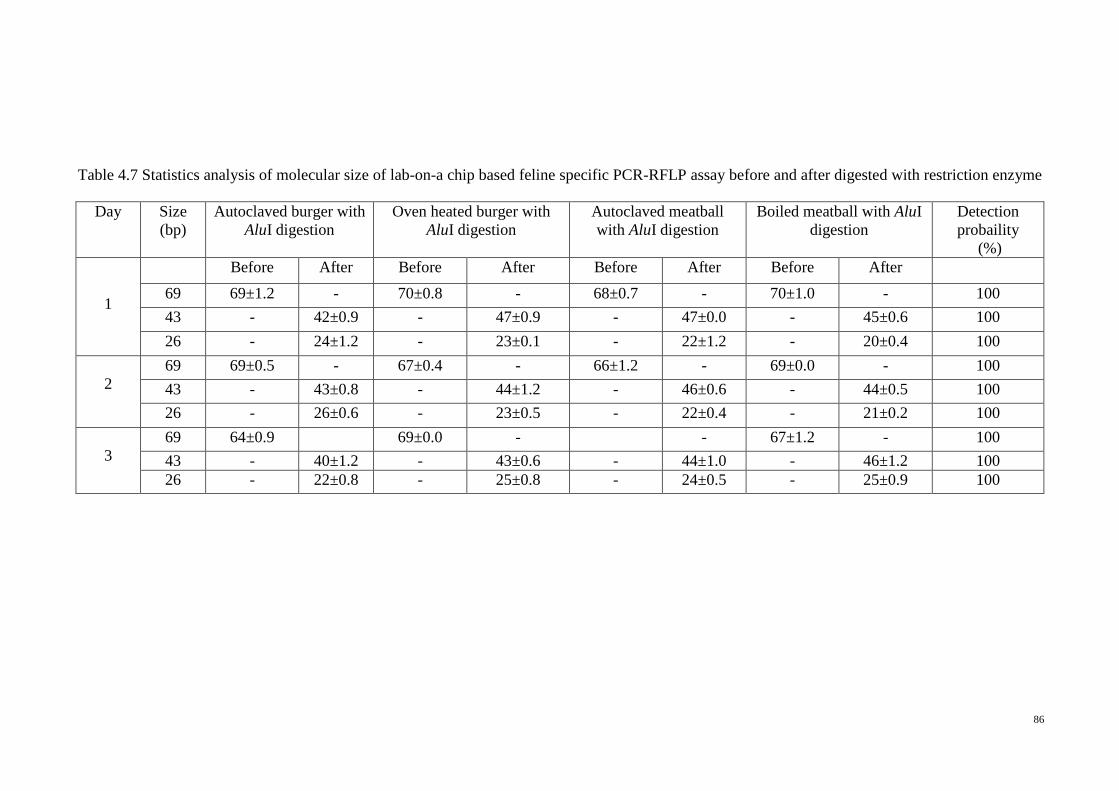
86
Table 4.7 Statistics analysis of molecular size of lab-on-a chip based feline specific PCR-RFLP assay before and after digested with restriction enzyme
Day Size
(bp)
Autoclaved burger with
AluI digestion
Oven heated burger with
AluI digestion
Autoclaved meatball
with AluI digestion
Boiled meatball with AluI
digestion
Detection
probaility
(%)
1
Before After Before After Before After Before After
69 69±1.2 - 70±0.8 - 68±0.7 - 70±1.0 - 100
43 - 42±0.9 - 47±0.9 - 47±0.0 - 45±0.6 100
26 - 24±1.2 - 23±0.1 - 22±1.2 - 20±0.4 100
2
69 69±0.5 - 67±0.4 - 66±1.2 - 69±0.0 - 100
43 - 43±0.8 - 44±1.2 - 46±0.6 - 44±0.5 100
26 - 26±0.6 - 23±0.5 - 22±0.4 - 21±0.2 100
3
69 64±0.9 69±0.0 - - 67±1.2 - 100
43 - 40±1.2 - 43±0.6 - 44±1.0 - 46±1.2 100
26 - 22±0.8 - 25±0.8 - 24±0.5 - 25±0.9 100
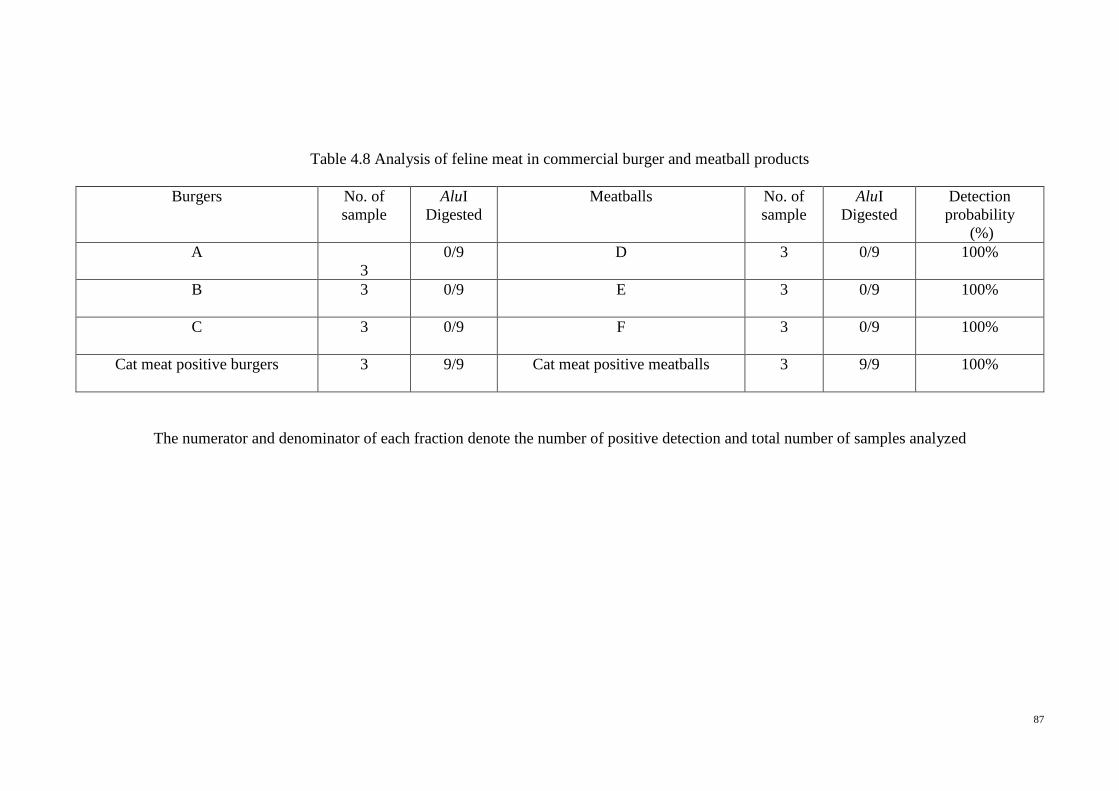
87
Table 4.8 Analysis of feline meat in commercial burger and meatball products
Burgers No. of
sample
AluI
Digested
Meatballs No. of
sample
AluI
Digested
Detection
probability
(%)
A
3
0/9 D 3 0/9 100%
B 3 0/9 E 3 0/9 100%
C 3 0/9 F 3 0/9 100%
Cat meat positive burgers 3 9/9 Cat meat positive meatballs 3 9/9 100%
The numerator and denominator of each fraction denote the number of positive detection and total number of samples analyzed

CHAPTER FIVE
DISCUSSION
88
CHAPTER 5: DISCUSSION
5.1 DNA Extraction
Before primer pairs was tested a selection of twenty four species including animal,
aquatic and plant species was collected from various super markets and wet markets in
Selangor, Petaling Jaya and Kuala Lumpur in Malaysia as stated in Chapter 3. The identity
of the collected animals, fish and plant species was verified by the veterinarian, fishery
and taxonomist experts from the Department of Animal Science and Crop Science under
the faculty of Agriculture in the University Putra Malaysia.
Total genomic DNA was extracted from raw, heat treated (autoclaved, boiled and
microwaved) meat samples using commercial DNA extraction kit and the amount of
yields varies depend on the quantity of starting material, sample materials and extraction
protocols (van Woerkom, 2008). Commercial Mini Kit (Yeastern Biotech Co. Ltd.,
Taiwan) provided higher yields of DNA from raw (59-718 ng/µl) and treated meat
samples (114-561 ng/µl) than the conventional liquid-liquid extraction techniques which
reduced high yield of DNA during the aqueous and organic phases of this technique
(Karabasanavar et al., 2011). In addition, commercial DNA extraction kit was safe for
handling to extract DNA with minimal damage while sample was preparing
(Karabasanavar et al., 2011). The concentration and quality of the extraction DNA
required to be checked and optimized for the test. To check the presence and amount of
targets in the eluate, concentration of the extracted DNA was estimated by taking an
absorbance readings at 260nm and the purity of DNA was checked by taking ratio of
absorbance readings at 260 nm and 280 nm in triplicates using Bio drop UV/VIS
spectroscopy (BioChrom, Libra S70; Cambridge, UK). The concentration of DNA was
used 10 ng/µl initially, thus a dilution series calculation was made on these samples in
which the DNA concentration of pure samples was diluted with distilled water or nuclease
89
free water. The A260: A280 value of all extracted DNA was 1.7 to 2.0 which reflected good
quality of yields (Adams, 2013) indicated no contamination was happening during the
extraction period. However, a higher sample size (1g) was used to extract DNA from
admixed meat (ternary complex) and commercial meat products (burgers and meatballs)
using a modified CTAB method, popularly known to give higher yield of DNA. The yield
of DNA from two set of admixed ((i) cat: beef: chicken and (ii) feline: bovine: wheat
flour) samples was 554-714 ng/µl, whereas from burgers (beef and chicken burgers) was
200-340 ng/µl), and meatballs (beef and chicken meatballs) was 150-373 ng/µl),
respectively. The lower yield of DNA from commercial meat products such as burgers
and meatballs might be due to the presence of some PCR inhibitors compounds such as
plant, spices, salts and oil that were used to formulate beef and chicken burgers and
meatballs (Chapter 3; Tables 3.3 and 3.4). Moreover, heat treatments also increases the
number of cells in per unit of weight of tissue though the dehydration process
(Karabasanavar et al., 2011b).
5.2 Biomarker Development
Since the short-length DNA biomarkers are extraordinarily stable under
processing conditions (Arslan et al., 2006) as it can detect the target DNA in raw, dry or
processed condition of complex background of commercial products. In this study, intra-
species conserved and interspecies hyper variable regions of mitochondrial cytb gene was
used to design a set of feline species primers to amplify a short-length amplicons (69 bp).
Based on literature study, short-length biomarker was developed by a group of researchers
(Calvo et al., (2002) (84 bp), Ali et al., (2011) (109 bp), Natonek et al., (2013) (66 bp),
Ali et al., (2013) (100 bp), and Rahman et al., (2014) (100 bp)) and successfully amplified
their targets in the complex matrices of different compromised states. On the other hand
90
longer-size biomarker (≥150 bp), are not favourable in perspective of degradation.
Rodriguez and his co-workers (2003) developed a 411 bp of swine-specific primers and
detected in standard autoclaving condition (121C for 20 min) but in an extensive
autoclaving system (120C for 2.5 h under 45-psi) no band was shown from the same
target tested by Ali et al. (2011). Therefore, the short length amplicon 69 bp has great
advantage while degraded sample material has to be analyzed.
The maximum composite likelihood method (Tamura et al., 2011) was used to
analyze the phylogenetic tree (Figure 4.1) and pairwise distance (Table 4.3) in the primer
binding regions of the tested species (Rahman et al., 2014). The highest pairwise distance
(1.33) was observed between cat and cuttle fish in and the lowest (0.09) found between
cat and dog (Table 4.3) (Tamura et al., 2011) demonstrating enough genetic distance and
unlikelihood of cross-species amplification in a real PCR experiment. Similar results were
found when dendogram was created among other species (Figure 4.1) (Saitou & Nei,
1987). However, 3D (Figure 4.2) plot was constructed with the number of mismatches
and pairwise distance (Table 4.3) data to find the discriminating properties and molecular
orbit of the primers using XLSTAT version 2014.1.01 (Addinsoft, 2013). All the obtained
data represented high degree of discernment among F. catus and other terrestrial, fish and
plant species. Additionally, the maximum (19 nt) and the minimum (3 nt) mismatches in
the primer binding regions (Table 4.2, and Figure 4.2) pointed that there is no-probability
of cross positive-reaction even among the closely matched species while handling the
PCR in real experiment. It has been quoted that a single mismatch in the primer binding
region might be sufficient to cause amplification failure in PCR reaction (Ali et al., 2012;
Smith &Vigilant et al., 2002; Wu et al., 2009). All the obtained data in in-silico analysis
supporting the theoretical conclusion that the newly developed assay was highly specific
for the feline species. In a real PCR experiment amplified 69-bp target only from F. catus
DNA template (Figure 4.6), confirming the in-silico or theoretical results.
91
5.3 Feline Specificity
Species-specific PCR assays (Ali et al., 2013; Mane, Mendiratta, & Tiwari, 2012)
have been widely used to detect even a minute amount of defilement in raw, processed
and commercial food products because of its rapidity, simplicity, sensitivity and
specificity (Mafra, Ferreira, & Oliveira, 2007). Multiplex PCR (Dalmasso et al., 2004;
Köppel, Ruf, & Rentsch, 2011) is a most recent development in the field of PCR
technology. It is theoretically interesting and can distinguish many species in a single
assay platform but the optimization of multiplex PCR reactions in a single tube is a
challenging job (Ali, Razzak, & Hamid, 2014).
In this study, a 69-bp fragment was successfully amplified only from feline
species (Figure 4.6, Lane 1) when the primers were cross-challenged against 24 other
species of terrestrial (beef, buffalo, chicken, duck, goat, pig, sheep, lamb, turkey, pigeon,
turtle, monkey, dog and rat) and aquatic (cod, carp, tilapia, shrimp and tilapia), and plant
(onion, wheat, cucumber, potato and tomato) origins. An optimum primer concentration
of 20 picomoles and preheating temperature of 95C for 3 min, denaturation at 95C for
20s containing 35 cycles, annealing at 58C for 20s, and 30s of extension at 72C and 5
min of final extension at 72C were found suitable for the amplification of desired
products. No-cross species positives detection was found in repeated PCR run along with
24 non-target species. A higher annealing temperature increases primer specificity and
reduces non-specific PCR amplification (Ali, Hashim, Mustafa, & Man, 2012a; Wu,
Hong, & Liu, 2009). The optimized annealing temperature of 58C (Figure 4.5) was
favourable for the detection of 69 bp feline target in all experimental analysis. Previously,
six feline species PCR assay have been developed based on different mitochondrial genes
(Abdulmawjood et al., (2003), (672 bp), Abdel Rahman et al., (2009), (672 bp); Ilhak et
al., (2007), (274 bp); Martine et al., (2007), (108 bp); Tobe et al., (2008), (180 bp) and
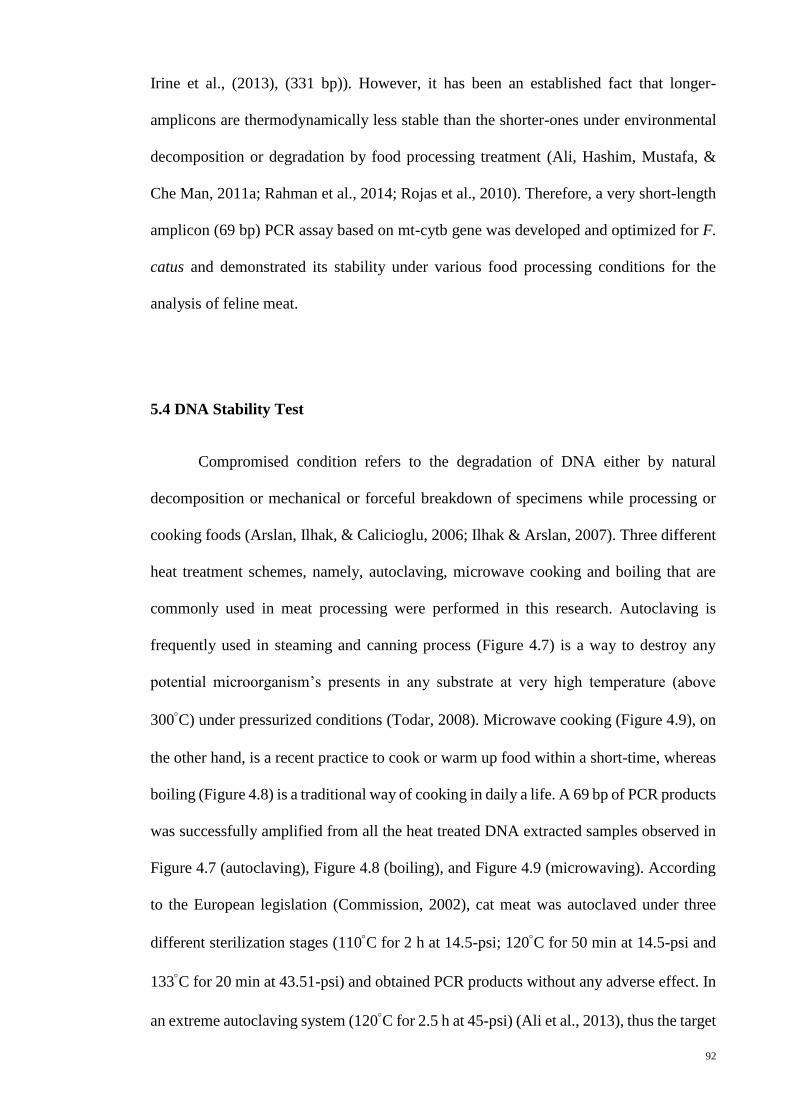
92
Irine et al., (2013), (331 bp)). However, it has been an established fact that longer-
amplicons are thermodynamically less stable than the shorter-ones under environmental
decomposition or degradation by food processing treatment (Ali, Hashim, Mustafa, &
Che Man, 2011a; Rahman et al., 2014; Rojas et al., 2010). Therefore, a very short-length
amplicon (69 bp) PCR assay based on mt-cytb gene was developed and optimized for F.
catus and demonstrated its stability under various food processing conditions for the
analysis of feline meat.
5.4 DNA Stability Test
Compromised condition refers to the degradation of DNA either by natural
decomposition or mechanical or forceful breakdown of specimens while processing or
cooking foods (Arslan, Ilhak, & Calicioglu, 2006; Ilhak & Arslan, 2007). Three different
heat treatment schemes, namely, autoclaving, microwave cooking and boiling that are
commonly used in meat processing were performed in this research. Autoclaving is
frequently used in steaming and canning process (Figure 4.7) is a way to destroy any
potential microorganism’s presents in any substrate at very high temperature (above
300C) under pressurized conditions (Todar, 2008). Microwave cooking (Figure 4.9), on
the other hand, is a recent practice to cook or warm up food within a short-time, whereas
boiling (Figure 4.8) is a traditional way of cooking in daily a life. A 69 bp of PCR products
was successfully amplified from all the heat treated DNA extracted samples observed in
Figure 4.7 (autoclaving), Figure 4.8 (boiling), and Figure 4.9 (microwaving). According
to the European legislation (Commission, 2002), cat meat was autoclaved under three
different sterilization stages (110C for 2 h at 14.5-psi; 120C for 50 min at 14.5-psi and
133C for 20 min at 43.51-psi) and obtained PCR products without any adverse effect. In
an extreme autoclaving system (120C for 2.5 h at 45-psi) (Ali et al., 2013), thus the target
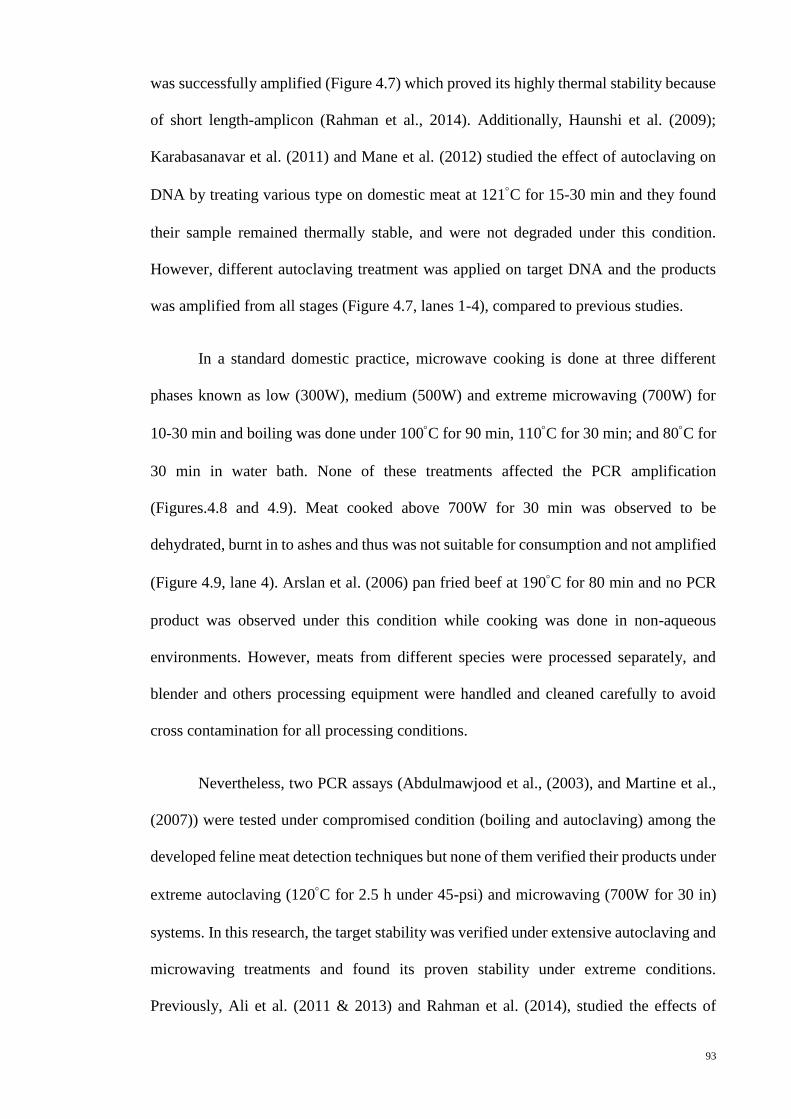
93
was successfully amplified (Figure 4.7) which proved its highly thermal stability because
of short length-amplicon (Rahman et al., 2014). Additionally, Haunshi et al. (2009);
Karabasanavar et al. (2011) and Mane et al. (2012) studied the effect of autoclaving on
DNA by treating various type on domestic meat at 121C for 15-30 min and they found
their sample remained thermally stable, and were not degraded under this condition.
However, different autoclaving treatment was applied on target DNA and the products
was amplified from all stages (Figure 4.7, lanes 1-4), compared to previous studies.
In a standard domestic practice, microwave cooking is done at three different
phases known as low (300W), medium (500W) and extreme microwaving (700W) for
10-30 min and boiling was done under 100C for 90 min, 110C for 30 min; and 80C for
30 min in water bath. None of these treatments affected the PCR amplification
(Figures.4.8 and 4.9). Meat cooked above 700W for 30 min was observed to be
dehydrated, burnt in to ashes and thus was not suitable for consumption and not amplified
(Figure 4.9, lane 4). Arslan et al. (2006) pan fried beef at 190C for 80 min and no PCR
product was observed under this condition while cooking was done in non-aqueous
environments. However, meats from different species were processed separately, and
blender and others processing equipment were handled and cleaned carefully to avoid
cross contamination for all processing conditions.
Nevertheless, two PCR assays (Abdulmawjood et al., (2003), and Martine et al.,
(2007)) were tested under compromised condition (boiling and autoclaving) among the
developed feline meat detection techniques but none of them verified their products under
extreme autoclaving (120C for 2.5 h under 45-psi) and microwaving (700W for 30 in)
systems. In this research, the target stability was verified under extensive autoclaving and
microwaving treatments and found its proven stability under extreme conditions.
Previously, Ali et al. (2011 & 2013) and Rahman et al. (2014), studied the effects of
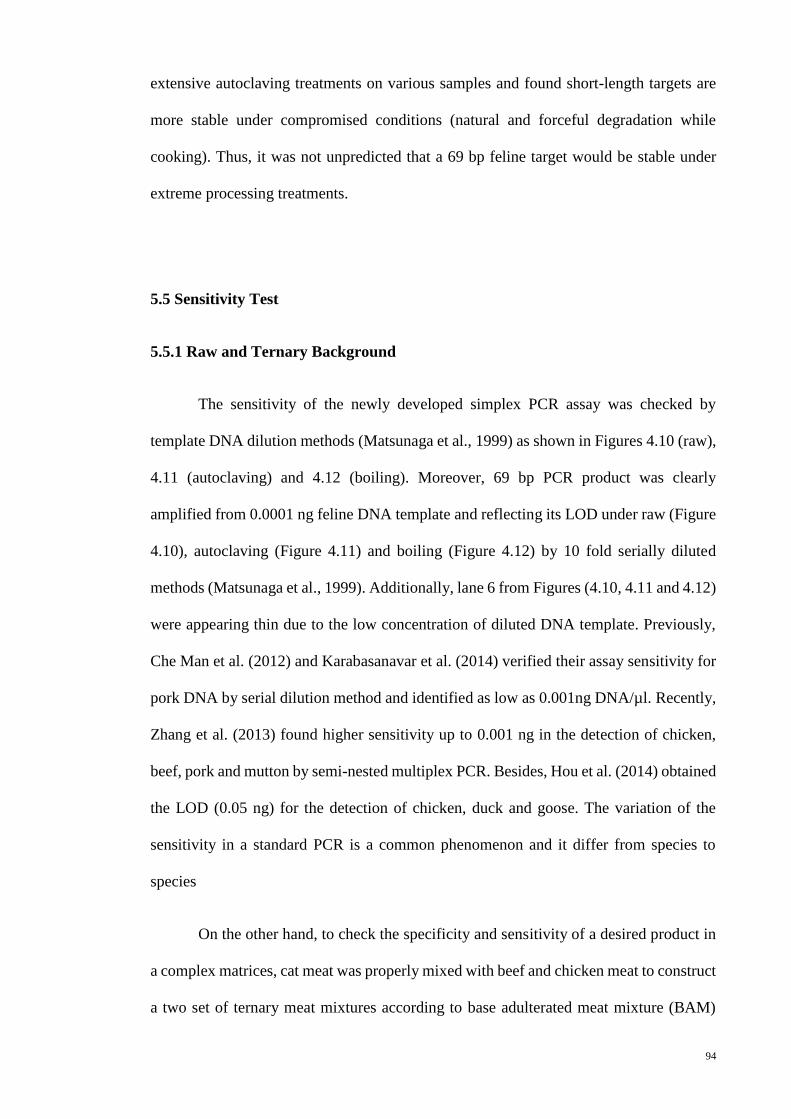
94
extensive autoclaving treatments on various samples and found short-length targets are
more stable under compromised conditions (natural and forceful degradation while
cooking). Thus, it was not unpredicted that a 69 bp feline target would be stable under
extreme processing treatments.
5.5 Sensitivity Test
5.5.1 Raw and Ternary Background
The sensitivity of the newly developed simplex PCR assay was checked by
template DNA dilution methods (Matsunaga et al., 1999) as shown in Figures 4.10 (raw),
4.11 (autoclaving) and 4.12 (boiling). Moreover, 69 bp PCR product was clearly
amplified from 0.0001 ng feline DNA template and reflecting its LOD under raw (Figure
4.10), autoclaving (Figure 4.11) and boiling (Figure 4.12) by 10 fold serially diluted
methods (Matsunaga et al., 1999). Additionally, lane 6 from Figures (4.10, 4.11 and 4.12)
were appearing thin due to the low concentration of diluted DNA template. Previously,
Che Man et al. (2012) and Karabasanavar et al. (2014) verified their assay sensitivity for
pork DNA by serial dilution method and identified as low as 0.001ng DNA/µl. Recently,
Zhang et al. (2013) found higher sensitivity up to 0.001 ng in the detection of chicken,
beef, pork and mutton by semi-nested multiplex PCR. Besides, Hou et al. (2014) obtained
the LOD (0.05 ng) for the detection of chicken, duck and goose. The variation of the
sensitivity in a standard PCR is a common phenomenon and it differ from species to
species
On the other hand, to check the specificity and sensitivity of a desired product in
a complex matrices, cat meat was properly mixed with beef and chicken meat to construct
a two set of ternary meat mixtures according to base adulterated meat mixture (BAM)
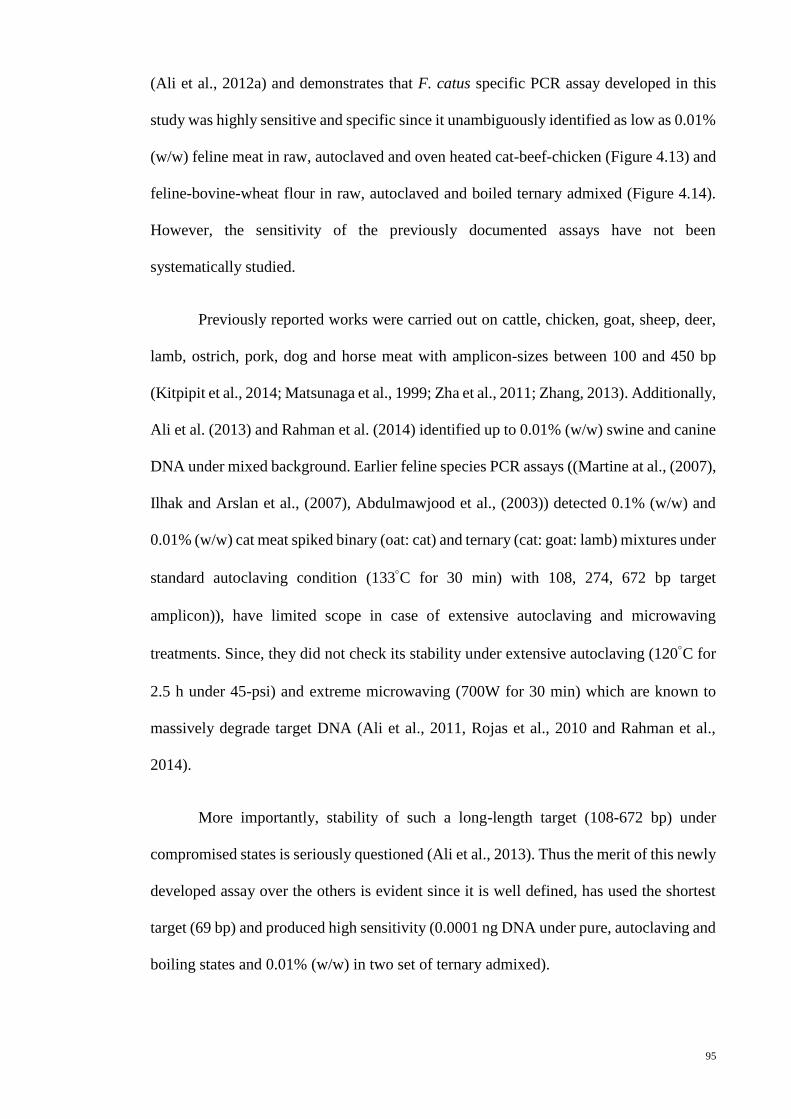
95
(Ali et al., 2012a) and demonstrates that F. catus specific PCR assay developed in this
study was highly sensitive and specific since it unambiguously identified as low as 0.01%
(w/w) feline meat in raw, autoclaved and oven heated cat-beef-chicken (Figure 4.13) and
feline-bovine-wheat flour in raw, autoclaved and boiled ternary admixed (Figure 4.14).
However, the sensitivity of the previously documented assays have not been
systematically studied.
Previously reported works were carried out on cattle, chicken, goat, sheep, deer,
lamb, ostrich, pork, dog and horse meat with amplicon-sizes between 100 and 450 bp
(Kitpipit et al., 2014; Matsunaga et al., 1999; Zha et al., 2011; Zhang, 2013). Additionally,
Ali et al. (2013) and Rahman et al. (2014) identified up to 0.01% (w/w) swine and canine
DNA under mixed background. Earlier feline species PCR assays ((Martine at al., (2007),
Ilhak and Arslan et al., (2007), Abdulmawjood et al., (2003)) detected 0.1% (w/w) and
0.01% (w/w) cat meat spiked binary (oat: cat) and ternary (cat: goat: lamb) mixtures under
standard autoclaving condition (133C for 30 min) with 108, 274, 672 bp target
amplicon)), have limited scope in case of extensive autoclaving and microwaving
treatments. Since, they did not check its stability under extensive autoclaving (120C for
2.5 h under 45-psi) and extreme microwaving (700W for 30 min) which are known to
massively degrade target DNA (Ali et al., 2011, Rojas et al., 2010 and Rahman et al.,
2014).
More importantly, stability of such a long-length target (108-672 bp) under
compromised states is seriously questioned (Ali et al., 2013). Thus the merit of this newly
developed assay over the others is evident since it is well defined, has used the shortest
target (69 bp) and produced high sensitivity (0.0001 ng DNA under pure, autoclaving and
boiling states and 0.01% (w/w) in two set of ternary admixed).
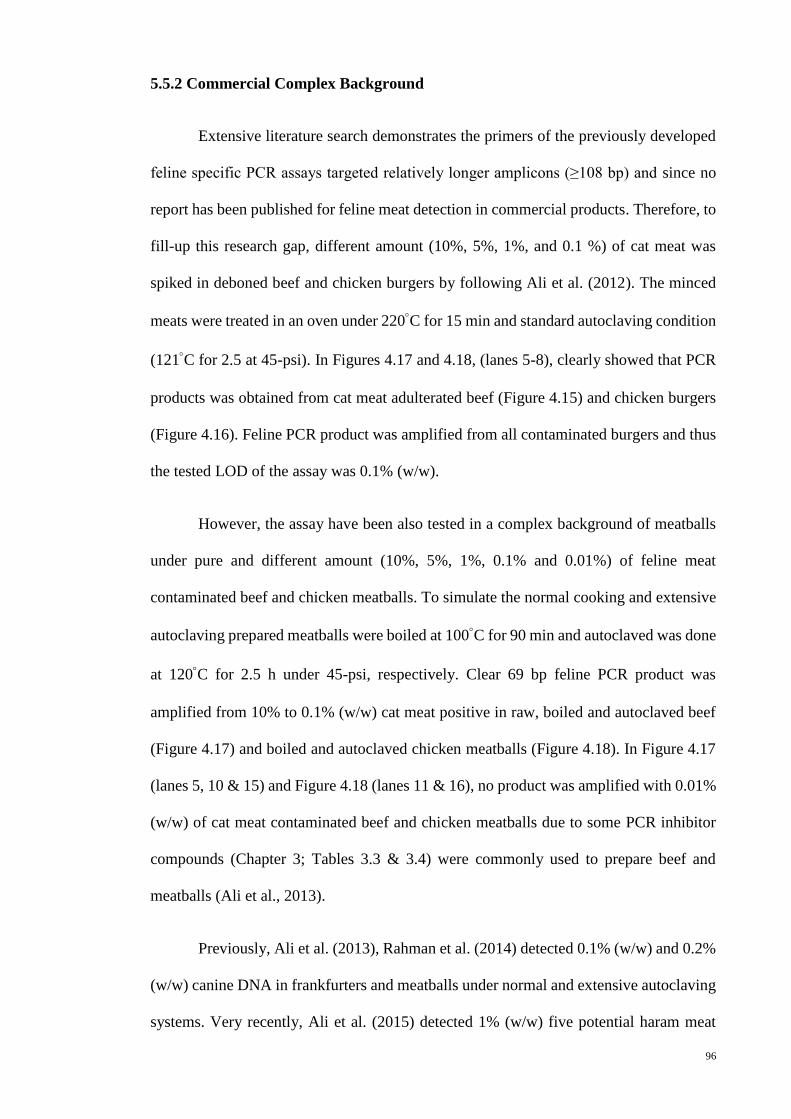
96
5.5.2 Commercial Complex Background
Extensive literature search demonstrates the primers of the previously developed
feline specific PCR assays targeted relatively longer amplicons (≥108 bp) and since no
report has been published for feline meat detection in commercial products. Therefore, to
fill-up this research gap, different amount (10%, 5%, 1%, and 0.1 %) of cat meat was
spiked in deboned beef and chicken burgers by following Ali et al. (2012). The minced
meats were treated in an oven under 220C for 15 min and standard autoclaving condition
(121C for 2.5 at 45-psi). In Figures 4.17 and 4.18, (lanes 5-8), clearly showed that PCR
products was obtained from cat meat adulterated beef (Figure 4.15) and chicken burgers
(Figure 4.16). Feline PCR product was amplified from all contaminated burgers and thus
the tested LOD of the assay was 0.1% (w/w).
However, the assay have been also tested in a complex background of meatballs
under pure and different amount (10%, 5%, 1%, 0.1% and 0.01%) of feline meat
contaminated beef and chicken meatballs. To simulate the normal cooking and extensive
autoclaving prepared meatballs were boiled at 100C for 90 min and autoclaved was done
at 120C for 2.5 h under 45-psi, respectively. Clear 69 bp feline PCR product was
amplified from 10% to 0.1% (w/w) cat meat positive in raw, boiled and autoclaved beef
(Figure 4.17) and boiled and autoclaved chicken meatballs (Figure 4.18). In Figure 4.17
(lanes 5, 10 & 15) and Figure 4.18 (lanes 11 & 16), no product was amplified with 0.01%
(w/w) of cat meat contaminated beef and chicken meatballs due to some PCR inhibitor
compounds (Chapter 3; Tables 3.3 & 3.4) were commonly used to prepare beef and
meatballs (Ali et al., 2013).
Previously, Ali et al. (2013), Rahman et al. (2014) detected 0.1% (w/w) and 0.2%
(w/w) canine DNA in frankfurters and meatballs under normal and extensive autoclaving
systems. Very recently, Ali et al. (2015) detected 1% (w/w) five potential haram meat
97
species in meatball under raw and extensive autoclaving state. However, the chances of
adulteration below 0.1% is minimal since adulteration at this level is not profitable
weighing the risk of reputation damage.
Addition of minced meat in commercial food products is a routine practice
(Tanabe et al., 2007) and meat replacement under mixed background and processed
conditions are frequently taking place everywhere (Ali et al., 2012b). Meanwhile,
inaccurate labelling description on products is a routine repeated exercise in most
countries of the world (Doosti, Dehkordi, & Rahimi, 2011; Fajardo, González, Rojas,
García, & Martín, 2010). Recently, the ‘Administration of Czech State Veterinary Unit’
discovered horsemeat in frozen meatballs marketed as beef and pork meatballs in Sweden
(Pollak, 2013), while turkey and chicken were found in 100% beef meatballs in Turkey
(Ulca, Balta, Cagin, & Senyuva, 2013) and horse meat was found in European burger
(Premanandh 2013). Therefore, four commercial halal branded beef and chicken burgers
and three of beef and chicken meatballs were collected in triplicates on three different
days from, KFC, MacDonald, Aeon, Tesco and other outlets across Malaysia. In a blind
experiment, four commercial brands of beef (A - D) and chicken (E - H) burgers were
screened against 0.1% cat meat spiked burgers on five different days (Table 4.4). In
addition, 0.1 % cat meat contaminated ready to eat meatballs was used as a positive
control and screened thee halal logo containing commercial beef (A - C) and chicken (A´-
C´) meatballs on three separate days (Table 4.5) to avoid any biasness and to bring
variation in sampling sources thus proven itself as a highly specific with feline cytb gene.
PCR products of feline specific mt-cytb gene successfully amplified from all cat meat
spiked burgers and meatballs, whereas no product was amplified from commercial
burgers (Figures 4.15 and 4.16; lanes 1 to 4) and meatballs in Figure 4.18 (lanes 1 to 6);
ensuring no cat-meat are being contaminated in burger and meatball formulations in
Malaysia.

98
5.6 PCR – RFLP Analysis
5.6.1 Restriction Enzyme Digestion
Although, species-specific PCR assays are often conclusive, authentication of
amplified PCR products definitely increases the assay reliability. PCR-RFLP has been
extensively used to distinguish two or more closest species using simple instrumentation
(Ong, Cheah, Robin, Wolmon Gunsalam, Mat Isaa, Chai, Yuli, Mohamad Ghazali and
Radu, 2007, Verkaar, Nijman, Boutaga and Lenstra, 2002). PCR-RFLP technique was
successfully used for the differentiation of species due to its inexpensive and exactitude
features, and it allows the validation of the authentic PCR products though the analysis
of the restriction-digested PCR products (Ali et al., 2012a). It comprises of the generation
of species-specific band profiles through restriction-digestion with one or more restriction
endonucleases (Pereira et al., 2008). These restriction enzymes cleave DNA molecule at
recognition sites, originating a set of fragments with different lengths that could be
separated according to their molecular size by electrophoresis (Pereira, Carneiro and
Amorim, 2008). Thus PCR-RFLP has been proven to be a practical, highly repeatable
and reliable technique for meat species identification in food and meat industry (Haider
et al., 2012).
Therefore, 69 bp feline-specific PCR products was digested by AluI since in-silico
analysis showed available restriction sites for these enzymes with suitable fragment-
lengths (New England Biolabs; seehttp://nc2.neb.com/NEBcutter2/). Two sites for AluI
were found within the amplified sequence (69 bp) (Figure 20). More importantly, lanes
(2, 4, 6, 8, 10 & 12) in Figure 4.20 demonstrated two fragments of length 43 and 26 bp,
which resulted following AluI digestion of the PCR amplification of commercial
products. On the other hand, an endogenous control (141 bp) produced two AluI (127 and
14 bp) fragments in Figure 4.22 (lanes 7 to 12) from cat meat adulterated raw, autoclaved,

99
oven heated and boiled burgers and meatballs and shown both in gel image (Figure 22)
and electropherograms (Figure 23). Nonetheless, a 14 bp fragment of digested eukaryotic
primers (141 bp) which was below the resolution capacity of the instrument (15 bp) could
not be detected.
5.6.2 Products Authentication by RFLP Technique
In food industry, replacement of costly meats by cheaper products is quite a
common practice to secure high profit, and is very frequently performed in processed
meat products such as burgers, meatballs, sausages, nugget, frankfurters and others (Ali
et al., 2012a). Among these items, burgers and meatballs are very common fast foods in
all mainland of the world (Ali et al., 2012a). Therefore, commercial burger and meatball
samples digested with AluI restriction enzyme after preparing model burgers and
meatballs according to Ali et al. (2012b) and Rohman et al. (2011). Total three different
Halal branded commercial burgers (A-C) and meatballs (D-F) were purchased from
different outlets in Malaysia and were tested (Table 4.9) and no commercial burger and
meatball were found to be positive for feline meat reflecting that no cat meat is present in
burgers and meatballs in Malaysia. Amplification of endogenous eukaryotic control 141-
bp, reflected good quality and presence of DNA in all tubes (Figure 4.21) and eliminating
the chances of any false-negative detection. The findings are acceptable in Malaysian
perspectives since the country is committed to develop ‘Halal-hub’ industry and has been
strictly monitoring the ‘Halal’ status of foods.
Abdulmawjood et al. (2003) developed PCR-RFLP assay with longer amplicon
length (672-bp) to detect feline species in raw or pure state among the six documented
assays. However, he did not verify his assay in the complex background of any
commercial food products and such a longer-size had the chance of fragmentation during
the food processing scheme. Therefore, the assay was evaluated to detect the feline

100
biomaterials in the pure and contaminated state of commercial burgers and meatballs.
Thus, the advantage of the newly developed RFLP technique is easily understandable and
distinguishable in terms of specificity, amplicon-size, and stability.

CHAPTER SIX
CONCLUSION AND RECOMMENDATIONS FOR FUTURE WORK
101
CHAPTER 6: CONCLUSION
6.1. Conclusion
In this research, two types of DNA based specification methods was successfully
developed for the detection of shorter feline-mitochondrial DNA in processed mixed
meats and commercial food products. The first one was the species-specific PCR assay
which itself is conclusive and feline material identification under raw, pure, admixed and
commercial matrices. The primers were designed targeting a 69-bp sites of cytochrome b
gene which is present in multiple copies in each cells. The feline specificity was ensured
by alignment analysis, mismatch comparison, phylogenetic tree and 3D plot. The primers
set were challenged against 24-potential species and accurate target was amplified only
from the feline targets, confirming the specificity and self-standing ability of the designed
primers. Since the breakdown of target is quite common under food processing
conditions, therefore the feline meats were treated under boiling (100C for 90 min, 110C
for 30 min, boiling in water bath at 80C for 30 min), autoclaving (110C for 2 h under
14.5-psi; 120C for 50 min under 14.5-psi; 133C for 20 min 43.51-psi and 120 for 2.5 h
under 45-psi) and microwaving (300W for 10 min, 500W for 20 min and 700W for 30
min) conditions. Extraordinary stability were revealed under all treatment conditions,
reflecting the reliability of the targets under any compromised states such as natural
decomposition or force full degradation of DNA by physical or chemical shocks of food
processing. Therefore, the specificity of the biomarkers was further checked under ternary
admixed and matrices of commercial foods such as burgers and meatballs and satisfactory
results were obtained since feline targets were amplified from all backgrounds.

102
Secondly, shorter targets often compromise specificity since number of species-
specific fingerprints is reduced within a shorter-sequence regime and verified the
authentic PCR targets by RFLP analysis. The PCR product was amplified in the presence
of 141bp universal site of eukaryotic 18SrRNA gene and digested with AluI restriction
enzymes since in-silico analysis by NEB cutter demonstrated one restriction site with
fragments lengths of 43 and 26 bp within the 69 bp targets. The digests were separated in
a microfluidic-based lab-on-a-chip automated electrophoresis system incorporated in
Experion Bioanalyzer. The fragments were separated with good resolution and it was
reflected both in gel-image and electropherograms. The tested limit of detection was 0.1
pg feline DNA under raw states, 0.01% (w/w) feline meats in ternary admixtures and
0.1% (w/w) feline meats in commercial food products such as burgers and meatballs.
To the best of my knowledge, it is the first systematic study for feline meat
adulteration detection under complex matrices and compromised states as well as
commercial meat based products. No study has developed a PCR assay with as low as 69
bp target with enough fingerprints for feline species. The extraordinary stability and well-
established sensitivity of the study reflects its application in food authentication or
archeological studies of feline species.
103
6.2. Recommendations for Future Work
Recently, real-time PCR has got popularity over other PCR-based methods because
of its automation, rapidity and sensitivity and ability to quantify potential targets.
Thus there is a clear scope to develop various real-time PCR assays such as SYBR
green, Eva Green, Molecular Beacon and TaqMan probe real-time PCRs.
Most of the PCR assays have not been validated under various food matrices. It is
also difficult to extract DNA from various matrices such as fat, dairy products,
chocolates etc. Therefore, appropriate DNA extraction protocol should be
developed, optimized and adapted for various food matrices.
The PCR targets we developed here should be validated by comparing it with other
exiting targets.
Multiplex PCR assays are highly promising since they allow the detection of
multiple species in a single assay platform, reducing cost and time. Therefore, the
opportunity to develop such assays for multiple haram species could be explored

REFERENCES

104
REFERENCES
Abdel-Rahman, S. M., El-Saadani, M. A., Ashry, K. M., & Haggag, A. S. (2009).
Detection of adulteration and identification of cat's, dog's, donkey's and horse's
meat using species-specific PCR and PCR-RFLP techniques. Australian Journal
of Basic and Applied Sciences, 3(3), 1716-1719.
Abdulmawjood, A., Schönenbrücher, H., & Bülte, M. (2003). Development of a
polymerase chain reaction system for the detection of dog and cat meat in meat
mixtures and animal feed. Journal of food science, 68(5), 1757-1761.
Aboud, M. J., Gassmann, M., & McCord, B. R. (2010). The development of mini
pentameric STR loci for rapid analysis of forensic DNA samples on a microfluidic
system. Electrophoresis, 31(15), 2672-2679.
Adams DS (2013) Lab math: a handbook of measurements, calculations, and other
quantitative skills for use at the bench, 2nd edn. Cold Spring Harbor 361
Laboratory Press, New York 11724, United States, p 323.
Addinsoft, S. (2007). XLSTAT-PLSPM. Paris, France.
Ahmed, M. U., Hasan, Q., Hossain, M., Saito, M., & Tamiya, E. (2010). Meat species
identification based on the loop mediated isothermal amplification and
electrochemical DNA sensor. Food Control, 21(5), 599-605.
Ahmed, M. U., Hasan, Q., Hossain, M. M., Saito, M., & Tamiya, E. (2010). Meat species
identification based on the loop mediated isothermal amplification and
electrochemical DNA sensor. Food Control, 21(5), 599-605.
Aida, A. A., Che Man, Y. B., Wong, C. M., Raha, A. R., & Son, R. (2005). Analysis of
raw meats and fats of pigs using polymerase chain reaction for Halal
authentication. Meat Sci, 69(1), 47-52. doi: 10.1016/j.meatsci.2004.06.020
Ali, M. E., Hashim, U., Dhahi, T. S., Mustafa, S., Man, Y. B. C., & Latif, M. A. (2011).
Analysis of Pork Adulteration in Commercial Burgers Targeting Porcine-Specific
Mitochondrial Cytochrome B Gene by TaqMan Probe Real-Time Polymerase
Chain Reaction. Food Analytical Methods, 5(4), 784-794. doi: 10.1007/s12161-
011-9311-4
Ali, M. E., Hashim, U., Mustafa, S., & Che Man, Y. B. (2011a). Swine-Specific PCR-
RFLP Assay Targeting Mitochondrial Cytochrome B Gene for Semiquantitative
Detection of Pork in Commercial Meat Products. Food Anal Method, 5(3), 613-
623. doi: 10.1007/s12161-011-9290-5
Ali, M. E., Hashim, U., Mustafa, S., Che Man, Y. B., Dhahi, T. S., Kashif, M., & Abd
Hamid, S. B. (2012b). Analysis of pork adulteration in commercial meatballs
targeting porcine-specific mitochondrial cytochrome b gene by TaqMan probe
real-time polymerase chain reaction. Meat Sci, 91(4), 454-459. doi:
10.1016/j.meatsci.2012.02.031
105
Ali, M. E., Hashim, U., Mustafa, S., Che Man, Y. B., & Islam, K. N. (2012d). Gold
Nanoparticle Sensor for the Visula Detection of Pork Adulteration in Meatball
Formulation. J Nanomater, 2012, 7. doi: 10.1155/2012/103607
Ali, M. E., Hashim, U., Mustafa, S., Che Man, Y. B., Yusop, M. H. M., Bari, M. F., &
Hasan, M. F. (2011b). Nanoparticle sensor for label free detection of swine DNA
in mixed biological samples. Nanotechnology, 22, 8. doi: 10.1088/0957-
4484/22/19/195503
Ali, M. E., Hashim, U., Mustafa, S., Che Man, Y. B., Yusop, M. H. M., Kashif, M., &
Latif, M. A. (2011c). Nanobiosensor for Detection and Quantification of DNA
Sequences in Degraded Mixed Meats. J Nanomater, 2011, 1-11. doi:
10.1155/2011/781098
Ali, M. E., Hashim, U., Mustafa, S., & Man, Y., B, C. (2012a). Swine-specific PCR-
RFLP assay targeting mitochondrial cytochrome B gene for semiquantitative
detection of pork in commercial meat products. Food Analytical Methods, 5(3),
613-623.
Ali, M. E., Kashif, M., Uddin, K., Hashim, U., Mustafa, S., & Man, Y. B. (2012b). Species
Authentication Methods in Foods and Feeds: the Present, Past, and Future of Halal
Forensics. Food Analytical Methods, 5(5), 935-955. doi: DOI 10.1007/s12161-
011-9357-3
Ali, M. E., Rahman, M. M., Hamid, S. B. A., Mustafa, S., Bhassu, S., & Hasim, U. (2013).
Canine-Specific PCR Assay Targeting Cytochrome b Gene for the Detection of
Dog Meat Adulteration in Commercial Frankfurters. Food Anal Method. doi:
10.1007/s12161-013-9672-y
Ali, M. E., Razzak, M. A., & Hamid, S. B. A. (2014). Multiplex PCR in Species
Authentication: Probability and Prospects—A Review. Food Analytical Methods,
1-17.
Ali, M. E., Razzak, M. A., Hamid, S. B. A., Rahman, M. M., Amin, M. A., Rashid, N. R.
A., & Rakhine A. (2015). Multiplex PCR Assay for the Detection of Five Meat
Species Forbidden in Islamic Foods. Food chemistry.177:214–224.
Andréasson, H., Nilsson, M., Budowle, B., Lundberg, H., & Allen, M. (2006). Nuclear
and mitochondrial DNA quantification of various forensic materials. Forensic
Science International, 164(1), 56-64.
Anitei, S. (2006). The Origin of SARS Epidemics Found in Civet Cat Meat Consumption
in Southern China (Online newspaper). Retrieved 4 November 2014
http://news.softpedia.com/news/The-Origin-of-SARS-Epidemics-Found-in-
Civet-Cat-Meat-Consumption-in-Southern-China-40897.shtml
Anonymous. (2014). Malaysia: marketing to Muslim consumers. Retrieved 20
November 2014 http://economists-pick-research.hktdc.com/business-
news/article/Research-Articles/Malaysia-marketing-to-Muslim
consumers/rp/en/1/1X000000/1X09XTD8.htm
Aristoy, M. C., & Toldra, F. (2004). Histidine dipeptides HPLC-based test for the
detection of mammalian origin proteins in feeds for ruminants. Meat Sci, 67(2),
211-217. doi: 10.1016/j.meatsci.2003.10.008
106
Arslan, A., Ilhak, O. I., & Calicioglu, M. (2006). Effect of method of cooking on
identification of heat processed beef using polymerase chain reaction (PCR)
technique. Meat Sci, 72(2), 326-330. doi: 10.1016/j.meatsci.2005.08.001
Arun, O. O., Ciftcioglu, G., & Altunatmaz, S. (2014). Effect of Processing on PCR
Detection of Animal Species in Meat Products. Kafkas Üniversitesi Veteriner
Fakültesi Dergisi, 20(6), 945-950.
Asensio, L. (2008a). Application of multiplex PCR for the identification of grouper meals
in the restaurant industry. Food Control, 19(11), 1096-1099. doi:
10.1016/j.foodcont.2007.11.002
Asensio, L., González, I., García, T., & Martín, R. (2008). Determination of food
authenticity by enzyme-linked immunosorbent assay (ELISA). Food Control,
19(1), 1-8. doi: 10.1016/j.foodcont.2007.02.010
Ashoor, S., & Osman, M. (1987). Liquid chromatographic quantitation of chicken and
turkey in unheated chicken-turkey mixtures. Journal-Association of Official
Analytical Chemists, 71(2), 403-405.
Asma, N. M., El Sheikha, A. F., Mustafa, S., & Mokhtar, N. F. K. (2013). Comparison of
gene nature used in real-time PCR for porcine identification and quantification: a
review. Food Research International, 50(1), 330-338.
Ayaz, Y., Ayaz, N., & Erol, I. (2006). Detection of species in meat and meat products
using Enzyme‐Linked Immunosorbent Assay. Journal of Muscle Foods, 17(2),
214-220.
Ballin, N. Z., Vogensen, F. K., & Karlsson, A. H. (2009). Species determination - Can
we detect and quantify meat adulteration? Meat Sci, 83(2), 165-174. doi:
10.1016/j.meatsci.2009.06.003
Bartlett, K., & Clifton, M. (2003). How many dogs and cats are eaten in Asia. Animal
People, 12(7).
Bataille, M., Crainic, K., Leterreux, M., Durigon, M., & de Mazancourt, P. (1999).
Multiplex amplification of mitochondrial DNA for human and species
identification in forensic evaluation. Forensic Science International, 99(3), 165-
170.
Bellis, C., Ashton, K. J., Freney, L., Blair, B., & Griffiths, L. R. (2003). A molecular
genetic approach for forensic animal species identification. Forensic Science
International, 134(2), 99-108.
Benedetto, A., Abete, M. C., & Squadrone, S. (2011). Towards a quantitative application
of real-time PCR technique for fish DNA detection in feedstuffs. Food Chem,
126(3), 1436-1442. doi: 10.1016/j.foodchem.2010.11.131
Birstein, V. J., Doukakis, P., Sorkin, B., & DeSalle, R. (1998). Population Aggregation
Analysis of Three Caviar‐Producing Species of Sturgeons and Implications for
the Species Identification of Black Caviar. Conservation Biology, 12(4), 766-775.
Bonne, K., & Verbeke, W. (2008). Muslim consumer trust in halal meat status and control
in Belgium. Meat Sci, 79(1), 113-123.
107
Bonwick, G. A., & Smith, C. J. (2004). Immunoassays: their history, development and
current place in food science and technology. International journal of food science
& technology, 39(8), 817-827.
Brodmann, P. D., & Moor, D. (2003). Sensitive and semi-quantitative TaqMan™ real-
time polymerase chain reaction systems for the detection of beef (Bos taurus) and
the detection of the family Mammalia in food and feed. Meat Sci, 65(1), 599-607.
doi: 10.1016/s0309-1740(02)00253-x
Cai, H., Gu, X., Scanlan, M. S., Ramatlapeng, D. H., & Lively, C. R. (2012). Real-time
PCR assays for detection and quantitation of porcine and bovine DNA in gelatin
mixtures and gelatin capsules. J Food Com Anal, 25(1), 83-87. doi:
10.1016/j.jfca.2011.06.008
Calvo, J. H., Rodellar, C., Zaragoza, P., & Osta, R. (2002). Beef-and bovine-derived
material identification in processed and unprocessed food and feed by PCR
amplification. Journal of agricultural and food chemistry, 50(19), 5262-5264.
Cammà, C., Di Domenico, M., & Monaco, F. (2012). Development and validation of fast
Real-Time PCR assays for species identification in raw and cooked meat
mixtures. Food Control, 23(2), 400-404. doi: 10.1016/j.foodcont.2011.08.007
Castle, S. (2013). Nestlé Removes 2 Products in Horse Meat Scandal, The New York
Times. Retrieved from www.nytimes.com/2013/02/20/world/europe/nestle-pulls-
2-products-in-horse-meat-scandal.html?_r=0&pagewanted=print
Chatterji, A. (2013). Dog or Cat Meat Suspected in Mystery Indian 'Lamb' Curry,
International Buisness TImes. Retrieved from http://www.ibtimes.co.uk/dog-cat-
meat-horse-india-lamb-curry-451343
Che Man, Y. B., Aida, A. A., Raha, A. R., & Son, R. (2007). Identification of pork
derivatives in food products by species-specific polymerase chain reaction (PCR)
for halal verification. Food Control, 18(7), 885-889. doi:
10.1016/j.foodcont.2006.05.004
Che Man, Y. B., Mustafa, S., Khairil Mokhtar, N. F., Nordin, R., & Sazili, A. Q. (2012).
Porcine-specific polymerase chain reaction assay based on mitochondrial d-loop
gene for identification of pork in raw meat. International Journal of Food
Properties, 15(1), 134-144.
Che Man, Y. B., Mustafa, S., Mokhtar, K., Fadhilah, N., Nordin, R., & Sazili, A. Q.
(2012). Porcine-Specific Polymerase Chain Reaction Assay Based on
Mitochondrial D-Loop Gene for Identification of Pork in Raw Meat. Int J Food
Prop, 15(1), 134-144. doi: 10.1080/10942911003754692
Chen, C. L. A. (2008). Development of polymerase chain reaction-restriction fragment
length polymorphism (PCR-RFLP) based techniques for meat identification.
(Masters of Science ), University Malysia Sabah.
Chisholm, J., Conyers, C., Booth, C., Lawley, W., & Hird, H. (2005). The detection of
horse and donkey using real-time PCR. Meat Sci, 70(4), 727-732. doi:
10.1016/j.meatsci.2005.03.009
108
Chou, C.-C., Lin, S.-P., Lee, K.-M., Hsu, C.-T., Vickroy, T. W., & Zen, J.-M. (2007).
Fast differentiation of meats from fifteen animal species by liquid
chromatography with electrochemical detection using copper nanoparticle plated
electrodes. Journal of Chromatography B, 846(1), 230-239.
Chuang, P.-S., Chen, M.-I., & Shiao, J.-C. (2012). Identification of tuna species by a real-
time polymerase chain reaction technique. Food Chem, 133(3), 1055-1061. doi:
10.1016/j.foodchem.2012.01.076
Colgan, S., O'Brien, L., Maher, M., Shilton, N., McDonnell, K., & Ward, S. (2001).
Development of a DNA-based assay for species identification in meat and bone
meal. Food Res Int, 34, 409-414.
Comission, E. (2002). Regulation (ec) no 178/2002 of the european parliament and of the
council of 28 January 2002 laying down the general principles and requirements
of food law, establishing the European Food Safety Authority and laying down
procedures in matters of food safety. Off J Eur Comm
Dalmasso, A., Fontanella, E., Piatti, P., Civera, T., Rosati, S., & Bottero, M. T. (2004). A
multiplex PCR assay for the identification of animal species in feedstuffs. Mol
Cell Probes, 18(2), 81-87. doi: 10.1016/j.mcp.2003.09.006
Demirhan, Y., Ulca, P., & Senyuva, H. Z. (2012). Detection of porcine DNA in gelatine
and gelatine-containing processed food products-Halal/Kosher authentication.
Meat Sci, 90(3), 686-689. doi: 10.1016/j.meatsci.2011.10.014
Dooley, J. J., Paine, K. E., Garrett, S. D., & Brown, H. M. (2004). Detection of meat
species using TaqMan real-time PCR assays. Meat Sci, 68(3), 431-438. doi:
10.1016/j.meatsci.2004.04.010
Doosti, A., Dehkordi, P. G., & Rahimi, E. (2011). Molecular assay to fraud identification
of meat products. J Food Sci Technol. doi: 10.1007/s13197-011-0456-3.
Drummond, M. G., Brasil, B. S. A. F., Dalsecco, L. S., Brasil, R. S. A. F., Teixeira, L.
V., & Oliveira, D. A. A. (2013). A versatile real-time PCR method to quantify
bovine contamination in buffalo products. Food Control, 29(1), 131-137. doi:
10.1016/j.foodcont.2012.05.051
Ellis, D. I., Broadhurst, D., Clarke, S. J., & Goodacre, R. (2005). Rapid identification of
closely related muscle foods by vibrational spectroscopy and machine learning.
Analyst, 130(12), 1648-1654.
Fajardo, V., Gonzalez, I., Martin, I., Rojas, M., Hernandez, P. E., Garcia, T., & Martin,
R. (2008). Real-time PCR for detection and quantification of red deer (Cervus
elaphus), fallow deer (Dama dama), and roe deer (Capreolus capreolus) in meat
mixtures. Meat Sci, 79(2), 289-298. doi: 10.1016/j.meatsci.2007.09.013
Fajardo, V., González, I., Rojas, M., García, T., & Martín, R. (2010). A review of current
PCR-based methodologies for the authentication of meats from game animal
species. Trends Food Sci Tech, 21(8), 408-421. doi: 10.1016/j.tifs.2010.06.002

109
Farouk, A.-E., Batcha, M. F., Greiner, R., Salleh, H. M., Salleh, M. R., & Sirajudin, A.
R. (2006). The use of a molecular technique for the detection of porcine
ingredients in the Malaysian food market. Saudi medical journal, 27(9), 1397-
1400.
Ferrières, M. (2006). Sacred cow, mad cow: a history of food fears: Columbia University
Press.
Fumiere, O., Dubois, M., Baeten, V., von Holst, C., & Berben, G. (2006). Effective PCR
detection of animal species in highly processed animal byproducts and compound
feeds. Anal Bioanal Chem, 385(6), 1045-1054. doi: 10.1007/s00216-006-0533-z
Ghovvati, S., Nassiri, M. R., Mirhoseini, S. Z., Moussavi, A. H., & Javadmanesh, A.
(2009). Fraud identification in industrial meat products by multiplex PCR assay.
Food Control, 20(8), 696-699. doi: 10.1016/j.foodcont.2008.09.002
Girish, P. S., Anjaneyulu, A. S. R., Viswas, K. N., Anand, M., Rajkumar, N., Shivakumar,
B. M., & Bhaskar, S. (2004). Sequence analysis of mitochondrial 12S rRNA gene
can identify meat species. Meat Sci, 66(3), 551-556. doi: 10.1016/s0309-
1740(03)00158-x
Haider, N., Nabulsi, I., & Al-Safadi, B. (2012). Identification of meat species by PCR-
RFLP of the mitochondrial COI gene. Meat Sci, 90(2), 490-493.
Haunshi, S., Basumatary, R., Girish, P., Doley, S., Bardoloi, R., & Kumar, A. (2009).
Identification of chicken, duck, pigeon and pig meat by species-specific markers
of mitochondrial origin. Meat Sci, 83(3), 454-459.
Haye, P. A., Segovia, N. I., Vera, R., Gallardo, M. d. l. Á., & Gallardo-Escárate, C.
(2012). Authentication of commercialized crab-meat in Chile using DNA
Barcoding. Food Control, 25(1), 239-244. doi: 10.1016/j.foodcont.2011.10.034
Hazim, M. M. Y., Mustafa, S., Che Man, Y. B., Omar, A. R., & Mokhtar, N. F. K. (2012).
Detection of Raw Pork Targeting Porcine-Specific Mitochondrial Cytochrome B
Gene by Molecular Beacon Probe Real-Time Polymerase Chain Reaction. Food
Anal Method, 5, 422-429. doi: 10.1007/s12161-011-9260-y
Herrero, B., Vieites, J. M., & Espiñeira, M. (2011). Authentication of Atlantic salmon
(Salmo salar) using real-time PCR. Food Chem, 127(3), 1268-1272. doi:
10.1016/j.foodchem.2011.01.070
Hird, H. J., Chisholm, J., & Brown, J. (2005). The detection of commercial duck species
in food using a single probe-multiple species-specific primer real-time PCR assay.
Eur Food Res Technol, 221(3-4), 559-563. doi: 10.1007/s00217-005-1197-1
Hird, H. J., Hold, G. L., Chisholm, J., Reece, P., Russell, V. J., Brown, J., MacArthur, R.
(2004). Development of a method for the quantification of haddock
(Melanogrammus aeglefinus) in commercial products using real-time PCR. Eur
Food Res Technol, 220(5-6), 633-637. doi: 10.1007/s00217-004-1050-y
Hopwood, A. J., Fairbrother, K. S., Lockley, A. K., & Bardsley, R. G. (1999). An actin
gene-related polymerase chain reaction (PCR) test for identification of chicken in
meat mixtures. Meat Sci, 53(4), 227-231.
110
Hsieh, H.-M., Chiang, H.-L., Tsai, L.-C., Lai, S.-Y., Huang, N.-E., Linacre, A., & Lee, J.
C.-I. (2001). Cytochrome b gene for species identification of the conservation
animals. Forensic Science International, 122(1), 7-18.
Hsieh, Y. H. P., Woodward, B. B., & Ho, S. H. (1995). Detection of species substitutioln
in raw and cooked meats using immunoassays. J Food Prot, 58(5), 555-559.
Ilhak, O. I., & Arslan, A. (2007). Identification of Meat Species by Polymerase Chain
Reaction (PCR) Techniques. Turk. J. Vet. Anim. Sci., 31(3), 159-163.
Irine, I., Nuraini, H., & Sumantri, C. (2013). Species Authentication of Dog, Cat, and
Tiger Using Cytochrome β Gene. Media Peternakan, 36(3), 171-178. doi:
10.5398/medpet.2013.36.3.171
Iwobi, A. N., Huber, I., Hauner, G., Miller, A., & Busch, U. (2011). Biochip Technology
for the Detection of Animal Species in Meat Products. Food Anal Method, 4(3),
389-398. doi: 10.1007/s12161-010-9178-9
Jeanette, T. (2013). Chinese police seize more than 20,000kg of fake beef. Retrieved 14
September, 2013, from http://my.news.yahoo.com/blogs/what-is-
buzzing/chinese-police-seize-more-20-000kg-fake-beef-035448883.html
Jeddah. (2011). Halal food products: Lucrative business amid strong demand. Retrieved
31 July, 2011, from http://saudigazette.com.sa/index.cfm?method=home.
recon&c ontentID=2011073110641
Judelson,H.(2000). Guidelines for Desiging Primers. http://oomyceteworld.net/protocols/
primer%20designing2.pdf
Jung, C., Mun, H. Y., Li, T., & Park, H. G. (2009). A simple gold nanoparticle-mediated
immobilization method to fabricate highly homogeneous DNA microarrays
having higher capacities than those prepared by using conventional techniques.
Nanotechnology, 20(3), 035607.
Karabasanavar, N. S., Singh, S., Kumar, D., & Shebannavar, S. N. (2014). Detection of
pork adulteration by highly-specific PCR assay of mitochondrial D-loop. Food
chemistry, 145, 530-534.
Karabasanavar, N. S., Singh, S., Umapathi, V., Kumar, D., & Shebannavar, S. N. (2011a).
Identification of goat meat using highly species‐specific polymerase chain
reaction. Journal of Food Quality, 34(2), 142-149.
Karabasanavar, N. S., Singh, S. P., Kumar, D., & Shebannavar, S. N. (2013).
Development and application of highly specific PCR for detection of chicken
(Gallus gallus) meat adulteration. European Food Research and Technology,
236(1), 129-134.
Karabasanavar, N. S., Singh, S. P., Umapathi, V., Kumar, D., Patil, G., & Shebannavar,
S. N. (2011b). A highly specific PCR assay for identification of raw and heat
treated mutton (Ovis aries). Small Ruminant Research, 100(2-3), 153-158. doi:
10.1016/j.smallrumres.2011.07.009

111
Kesmen, Z., Celebi, Y., Güllüce, A., & Yetim, H. (2009). Identification of meat species
by TaqMan-based real-time PCR assay. Meat Sci, 82(4), 444-449. doi:
10.1016/j.meatsci.2009.02.019
Kesmen, Z., Celebi, Y., Güllüce, A., & Yetim, H. (2013). Detection of seagull meat in
meat mixtures using real-time PCR analysis. Food Control, 34(1), 47-49. doi:
10.1016/j.foodcont.2013.04.006
Kesmen, Z., Sahin, F., & Yetim, H. (2007). PCR assay for the identification of animal
species in cooked sausages. Meat Sci, 77(4), 649-653. doi:
10.1016/j.meatsci.2007.05.018
Köppel, R., Daniels, M., Felderer, N., & Brünen-Nieweler, C. (2013). Multiplex real-time
PCR for the detection and quantification of DNA from duck, goose, chicken,
turkey and pork. Eur Food Res Technol, 236(6), 1093-1098. doi: 10.1007/s00217-
013-1973-2
Köppel, R., Ruf, J., & Rentsch, J. (2011). Multiplex real-time PCR for the detection and
quantification of DNA from beef, pork, horse and sheep. Eur Food Res Technol,
232(1), 151-155. doi: 10.1007/s00217-010-1371-y
Köppel, R., Zimmerli, F., & Breitenmoser, A. (2009). Heptaplex real-time PCR for the
identification and quantification of DNA from beef, pork, chicken, turkey, horse
meat, sheep (mutton) and goat. Eur Food Res Technol, 230(1), 125-133. doi:
10.1007/s00217-009-1154-5
Krcmar, P., & Rencova, E. (2003). Identification of species-specific DNA in feedstuffs.
Journal of agricultural and food chemistry, 51(26), 7655-7658.
Kumar, D., Singh, S. P., Singh, R., & Karabasanavar, N. S. (2011). A highly specific PCR
assay for identification of goat (Capra hircus) meat. Small Ruminant Research,
97(1-3), 76-78. doi: 10.1016/j.smallrumres.2011.01.013
Kvist, L. (2000). Phylogeny and phylogeography of European Parids: University of Oulu.
Kyle, C. J., & Wilson, C. C. (2007). Mitochondrial DNA identification of game and
harvested freshwater fish species. Forensic Science International, 166(1), 68-76.
Laube, I., Spiegelberg, A., Butschke, A., Zagon, J., Schauzu, M., Kroh, L., & Broll, H.
(2003). Methods for the detection of beef and pork in foods using real-time
polymerase chain reaction. Int J Food Sci Technol, 38(2), 111-118. doi: DOI
10.1046/j.1365-2621.2003.00651.
Linacre, A., & Tobe, S. S. (2011). An overview to the investigative approach to species
testing in wildlife forensic science. Investig Genet, 2(2), b14.
Liu, L. (2006). Monoclonal antibody-based sandwich ELISA for the detection of ovine
muscle in cooked meat. (Master of Science), The Florida State University, USA.
Retrieved from http://diginole.lib.fsu. edu/etd
LMG. 1992. Swiss food law. Revision of May 7, 2002.
LMV. 1995. Swiss food ordinance. Revision of April 30, 2002.
112
Lockley, A. K., & Bardsley, R. G. (2000). DNA-based methods for food authentication.
Trends Food Sci Tech, 11, 67-77.
López-Andreo, M., Aldeguer, M., Guillén, I., Gabaldón, J. A., & Puyet, A. (2012).
Detection and quantification of meat species by qPCR in heat-processed food
containing highly fragmented DNA. Food Chem, 134(1), 518-523. doi:
10.1016/j.foodchem.2012.02.111
Lopez-Andreo, M., Garrido-Pertierra, A., & Puyet, A. (2006). Evaluation of post-
polymerase chain reaction melting temperature analysis for meat species
identification in mixed DNA samples. J Agric Food Chem, 54(21), 7973-7978.
Lopez-Andreo, M., Lugo, L., Garrido-Pertierra, A., Prieto, M. I., & Puyet, A. (2005).
Identification and quantitation of species in complex DNA mixtures by real-time
polymerase chain reaction. Anal Biochem, 339(1), 73-82. doi:
10.1016/j.ab.2004.11.045
Maede, D. (2006). A strategy for molecular species detection in meat and meat products
by PCR-RFLP and DNA sequencing using mitochondrial and chromosomal
genetic sequences. Eur Food Res Technol, 224(2), 209-217.
Mafra, I., Ferreira, I. M. P. L. V. O., & Oliveira, M. B. P. P. (2007). Food authentication
by PCR-based methods. Eur Food Res Technol, 227(3), 649-665. doi:
10.1007/s00217-007-0782-x
Mane, B. G., Mendiratta, S. K., & Tiwari, A. K. (2009). Polymerase chain reaction assay
for identification of chicken in meat and meat products. Food chemistry, 116(3),
806-810. doi: 10.1016/j.foodchem.2009.03.030
Mane, B. G., Mendiratta, S. K., & Tiwari, A. K. (2012). Beef specific polymerase chain
reaction assay for authentication of meat and meat products. Food Control, 28(2),
246-249. doi: 10.1016/j.foodcont.2012.05.031
Marikkar, J., Ng, S., & Man, Y. C. (2011). Composition and thermal analysis of lipids
from pre-fried chicken nuggets. Journal of the American Oil Chemists' Society,
88(6), 749-754.
Martin, I., Garcia, T., Fajardo, V., Lopez-Calleja, I., Hernandez, P. E., Gonzalez, I., &
Martin, R. (2007). Species-specific PCR for the identification of ruminant species
in feedstuffs. Meat Sci, 75(1), 120-127. doi: 10.1016/j.meatsci.2006.06.019
Martin, I., Garcia, T., Fajardo, V., Rojas, M., Hernandez, P. E., Gonzalez, I., & Martin,
R. (2007). Technical note: Detection of cat, dog, and rat or mouse tissues in food
and animal feed using species-specific polymerase chain reaction. J Anim Sci,
85(10), 2734-2739. doi: 10.2527/jas.2007-0048
Martin, I., Garcia, T., Fajardo, V., Rojas, M., Pegels, N., Hernandez, P. E., & Martin, I.
G. (2009). SYBR-Green real-time PCR approach for the detection and
quantification of pig DNA in feedstuffs. Meat Sci, 82(2), 252-259. doi:
10.1016/j.meatsci.2009.01.023
Martinez, I., & Jakobsen Friis, T. (2004). Application of proteome analysis to seafood
authentication. Proteomics, 4(2), 347-354.

113
Matsuda, H., Seo, Y., Kakizaki, E., Kozawa, S., Muraoka, E., & Yukawa, N. (2005).
Identification of DNA of human origin based on amplification of human-specific
mitochondrial cytochrome b region. Forensic Science International, 152(2), 109-
114.
Matsunaga, T., Chikuni, K., Tanabe, R., Muroya, S., Shibata, K., Yamada, J., &
Shinmura, Y. (1999). A quick and simple method for the identification of meat
species and meat products by PCR assay. Meat Sci, 51, 143-148.
Minarovič, T., Trakovická, A., Rafayová, A., & Lieskovská, Z. (2010). Animal Species
Identification by PCR–RFLP of Cytochrome b. Scientific Papers Animal Science
and Biotechnologies, 43(1), 296-299.
Montiel-Sosa, J. F., Ruiz-Pesini, E., Montoya, J., Roncales, P., Lopez-Perez, M. J., &
Perez-Martos, A. (2000). Direct and highly species-specific detection of pork
meat and fat in meat products by PCR amplification of mitochondrial DNA. J
Agric Food Chem, 48(7), 2829-2832.
Montowska, M., & Pospiech, E. (2007). Species identification of meat by electrophoretic
methods. ACTA Scientiarum Polonorum-Technologia Alimentaria, 6(1), 5-16.
Muldoon, M. T., Onisk, D. V., Brown, M. C., & Stave, J. W. (2004). Targets and methods
for the detection of processed animal proteins in animal feedstuffs. International
journal of food science & technology, 39(8), 851-861.
Murugaiah, C., Noor, Z. M., Mastakim, M., Bilung, L. M., Selamat, J., & Radu, S. (2009).
Meat species identification and Halal authentication analysis using mitochondrial
DNA. Meat Sci, 83(1), 57-61. doi: 10.1016/j.meatsci.2009.03.015
Nakaki, S.-i., Hino, D., Miyoshi, M., Nakayama, H., Moriyoshi, H., Morikawa, T., &
Itohara, K. (2007). Study of animal species (human, dog and cat) identification
using a multiplex single-base primer extension reaction in the cytochrome b gene.
Forensic Science International, 173(2), 97-102.
Natonek-Wiśniewska, M., Krzyścin, P., & Piestrzyńska-Kajtoch, A. (2013). The species
identification of bovine, porcine, ovine and chicken components in animal meals,
feeds and their ingredients, based on COX I analysis and ribosomal DNA
sequences. Food Control, 34(1), 69-78.
Nelson, K., & Melton, T. (2007). Forensic Mitochondrial DNA Analysis of 116 Casework
Skeletal Samples. Journal of forensic sciences, 52(3), 557-561.
Nuraini, H., Primasari, A., Andreas, E., & Sumantri, C. (2012). The Use of Cytochrome
b Gene as a Specific Marker of the Rat Meat (Rattus norvegicus) on Meat and
Meat Products. Media Peternakan, 35(1), 15-20. doi:
10.5398/medpet.2012.35.1.15
Nurjuliana, M., Che Man, Y. B., Mat Hashim, D., & Mohamed, A. K. (2011b). Rapid
identification of pork for halal authentication using the electronic nose and gas
chromatography mass spectrometer with headspace analyzer. Meat Sci, 88(4),
638-644. doi: 10.1016/j.meatsci.2011.02.022
114
Nurjuliana, M., Man, Y. C., & Hashim, D. M. (2011a). Analysis of lard’s aroma by an
electronic nose for rapid Halal authentication. Journal of the American Oil
Chemists' Society, 88(1), 75-82.
Odumeru, J., Boulter, J., Knight, K., Lu, X., & McKellar, R. (2003). Assessment Of A
Wash Treatment With Warm Chlorinated Water To Extend The Shelf–Life Of
Ready–To–Use Lettuce. Journal of Food Quality, 26(3), 197-209.
Olumide. (2014). Human Meat Discovered In McDonald’s Meat Factory. Retrieved 12
December 2014 http://www.informationng.com/2014/08/human-meat-
discovered-in-mcdonalds-meat-factory.html
Parkanyi, V., Ondruska, L., Vasicek, D., & Slamecka, J. (2014). Multilevel D-loop PCR
identification of hunting game. Applied & Translational Genomics, 3(1), 1-7.
Parsons, J. T., Martin, K. H., Slack, J. K., Taylor, J. M., & Weed, S. A. (2000). Focal
adhesion kinase: a regulator of focal adhesion dynamics and cell movement.
Oncogene, 19(49), 5606-5613.
Pegels, N., Gonzalez, I., Lopez-Calleja, I., Fernandez, S., Garcia, T., & Martin, R. (2012).
Evaluation of a TaqMan real-time PCR assay for detection of chicken, turkey,
duck, and goose material in highly processed industrial feed samples. Poult Sci,
91(7), 1709-1719. doi: 10.3382/ps.2011-01954
Pegels, N., González, I., Martín, I., Rojas, M., García, T., & Martín, R. (2011).
Applicability assessment of a real-time PCR assay for the specific detection of
bovine, ovine and caprine material in feedstuffs. Food Control, 22(8), 1189-1196.
doi: 10.1016/j.foodcont.2011.01.015
Pereira, F., Meirinhos, J., Amorim, A., & Pereira, L. (2006). Analysis of inter-specific
mitochondrial DNA diversity for accurate species identification. Paper presented
at the International Congress Series.
Peris, M., & Escuder-Gilabert, L. (2009). A 21st century technique for food control:
electronic noses. Anal Chim Acta, 638(1), 1-15. doi: 10.1016/j.aca.2009.02.009
Phillips, T. (2013). Chinese police find slaughterhouse selling cat meat, The Telegraph.
Retrievedfromhttp://www.telegraph.co.uk/news/worldnews/asia/china/10417032
/Chinese-police-find-slaughterhouse-selling-cat-meat.html
Pischetsrieder, M., & Baeuerlein, R. (2009). Proteome research in food science. Chemical
Society Reviews, 38(9), 2600-2608.
Podberscek, A. L. (2009). Good to pet and eat: The keeping and consuming of dogs and
cats in South Korea. Journal of Social Issues, 65(3), 615-632.
Pollak, S. (2013). Horsemeat scandal spreads to Ikea Swedish Meatballs, Time World.
Retrieved from http://world.time.com/2013/02/26/horsemeat-scandal-spreads-to-
ikea-swedish-meatballs
Prado, M., Calo-Mata, P., Villa, T., Cepeda, A., & Barros-Velázquez, J. (2007). Co-
amplification and sequencing of a cytochrome b fragment affecting the
identification of cattle in PCR-RFLP food authentication studies. Food chemistry,
105(1), 436-442.
115
Premanandh, J. (2013). Horse meat scandal–A wake-up call for regulatory authorities.
Food Control, 34(2), 568-569.
Rahman, M. M., Ali, M. E., Hamid, S. B. A., Mustafa, S., Hashim, U., & Hanapi, U. K.
(2014). Polymerase chain reaction assay targeting cytochrome b gene for the
detection of dog meat adulteration in meatball formulation. Meat Sci, 97(4), 404-
409.
Rastogi, G., Dharne, M. S., Walujkar, S., Kumar, A., Patole, M. S., & Shouche, Y. S.
(2007). Species identification and authentication of tissues of animal origin using
mitochondrial and nuclear markers. Meat Sci, 76(4), 666-674.
Reilly, A. (2013, 05/02/2013). CEO Statement to the Joint Oireachtas Committee on
Agriculture, Food and the Marine, Food Safety Authority of Ireland News.
Retrieved from http://www.fsai.ie/news_centre/oireachtas_05.02.2013.html
Rodriguez, M. A., Garcia, T., Gonzalez, I., Asensio, L., Mayoral, B., & Lopez-Calleja, I.
(2004). Quantitation of mule duck in goose foie gras using TaqMan real-time
polymerase chain reaction. J Agric Food Chem, 52(6), 1478-1483.
Rodriguez, M. A., Garcia, T., Gonzalez, I., Asensio, L., Mayoral, B., López-Calleja, I.,
Martín, R. (2003). Identification of goose, mule duck, chicken, turkey, and swine
in foie gras by species-specific polymerase chain reaction. Journal of agricultural
and food chemistry, 51(6), 1524-1529.
Rodriguez, M. A., Garcia, T., Gonzalez, I., Hernandez, P. E., & Martin, R. (2005).
TaqMan real-time PCR for the detection and quantitation of pork in meat
mixtures. Meat Sci, 70(1), 113-120. doi: 10.1016/j.meatsci.2004.12.005
Rohman, A., Sismindari, Erwanto, Y., & Che Man, Y. B. (2011). Analysis of pork
adulteration in beef meatball using Fourier transform infrared (FTIR)
spectroscopy. Meat Sci, 88(1), 91-95.
Rojas, M., González, I., Pavón, M. Á., Pegels, N., Hernández, P. E., García, T., & Martín,
R. (2011). Application of a real-time PCR assay for the detection of ostrich
(Struthio camelus) mislabelling in meat products from the retail market. Food
Control, 22(3-4), 523-531. doi: 10.1016/j.foodcont.2010.09.039
Rojas, M., Gonzalez, I., Pavon, M. A., Pegels, N., Lago, A., Hernandez, P. E., Martin, R.
(2010). Novel TaqMan real-time polymerase chain reaction assay for verifying
the authenticity of meat and commercial meat products from game birds. Food
Addit Contam Part A Chem Anal Control Expo Risk Assess, 27(6), 749-763. doi:
10.1080/19440040903503070
Safdar, M., & Abasıyanık, M. F. (2013). Development of fast multiplex real-time PCR
assays based on EvaGreen fluorescence dye for identification of beef and soybean
origins in processed sausages. Food Research International, 54(2), 1652-1656.
doi: 10.1016/j.foodres.2013.09.013
Saitou, N., & Nei, M. (1987). The neighbor-joining method: a new method for
reconstructing phylogenetic trees. Molecular biology and evolution, 4(4), 406-
425.
116
Şakalar, E., & Abasıyanık, M. F. (2012). The devolopment of duplex real-time PCR based
on SYBR Green florescence for rapid ıdentification of ruminant and poultry
origins in foodstuff. Food Chem, 130(4), 1050-1054. doi:
10.1016/j.foodchem.2011.07.130
Salama. (2013). Global Halal Traders Gather in Malaysia Amid Muslim Population
Growth. Retrieved 10 Januray, 2014, from http://halalfocus.net/global-halal-
traders-gather-in-malaysia-amid-muslim-population-growth/
Salama. (2015). Halal World Food highlights breakthroughs in the global market, Halal
Focus. Retrieved from http://halalfocus.net/uae-halal-world-food-highlights-
breakthroughs-in-the-global-market/
Sambrook, J., Fritsch, E. F., & Maniatis, T. (1989). Molecular Cloning: A Laboratory
Manual (2nd Edition ed.). New York: Cold Spring Harbour Laboratory Press.
Santos, C. G., Melo, V. S., Amaral, J. S., Estevinho, L., Oliveira, M. B., & Mafra, I.
(2012). Identification of hare meat by a species-specific marker of mitochondrial
origin. Meat Sci, 90(3), 836-841. doi: 10.1016/j.meatsci.2011.10.018
Sawyer, J., Wood, C., Shanahan, D., Gout, S., & McDowell, D. (2003). Real-time PCR
for quantitative meat species testing. Food Control, 14(8), 579-583. doi:
10.1016/s0956-7135(02)00148-2
Schönherr, J. (2002). Analysis of products of animal origin in feeds by determination of
carnosine and related dipeptides by high-performance liquid chromatography. J
Agric Food Chem, 50, 1945-1950.
Smith, S., & Vigilant, L. (2002). The effects of sequence length and oligonucleotide
mismatches on 5′ exonuclease assay efficiency. 30(20), e111.
Soares, S., Amaral, J. S., Oliveira, M. B., & Mafra, I. (2013). A SYBR Green real-time
PCR assay to detect and quantify pork meat in processed poultry meat products.
Meat Sci, 94(1), 115-120. doi: 10.1016/j.meatsci.2012.12.012
Stamoulis, P., Stamatis, C., Sarafidou, T., & Mamuris, Z. (2010). Development and
application of molecular markers for poultry meat identification in food chain.
Food Control, 21(7), 1061-1065.
Tamura, K., Nei, M., & Kumar, S. (2004). Prospects for inferring very large phylogenies
by using the neighbor-joining method. Proceedings of the National Academy of
Sciences of the United States of America, 101(30), 11030-11035.
Tamura, K., Peterson, D., Peterson, N., Stecher, G., Nei, M., & Kumar, S. (2011).
MEGA5: molecular evolutionary genetics analysis using maximum likelihood,
evolutionary distance, and maximum parsimony methods. Molecular biology and
evolution, 28(10), 2731-2739.
Tanabe, S., Hase, M., Yano, T., Sato, M., Fujimura, T., & Akiyama, H. (2007). A real-
time quantitative PCR detection method for pork, chicken, beef, mutton, and
horseflesh in foods. Biosci Biotechnol Biochem, 71(12), 3131-3135.
Teletchea, F., Maudet, C., & Hänni, C. (2005). Food and forensic molecular
identification: update and challenges. Trends in biotechnology, 23(7), 359-366.
117
Thomas, K. (1991). Man and the natural world: Changing attitudes in England 1500-
1800: Penguin UK.
Tobe, S. S., & Linacre, A. M. (2008). A multiplex assay to identify 18 European mammal
species from mixtures using the mitochondrial cytochrome b gene.
Electrophoresis, 29(2), 340-347. doi: 10.1002/elps.200700706
Todar, K. (2008). Control of Microbial Growth Todar's Online Textbook of Bacteriology.
TSV. 1995. Swiss epizootic ordinance. Revision of June 27, 1995 (status of December
28, 2001).
Ulca, P., Balta, H., Cagin, I., & Senyuva, H. Z. (2013). Meat species identification and
Halal authentication using PCR analysis of raw and cooked traditional Turkish
foods. Meat Sci, 94(3), 280-284. doi: 10.1016/j.meatsci.2013.03.008
Vallejo-Cordoba, B., & Cota-Rivas, M. (1997). Meat species identification by linear
discriminant analysis of capillary electrophoresis protein profiles. Journal of
capillary electrophoresis, 5(5-6), 171-175.
van der Spiegel, M., van der Fels-Klerx, H. J., Sterrenburg, P., van Ruth, S. M., Scholtens-
Toma, I. M. J., & Kok, E. J. (2012). Halal assurance in food supply chains:
Verification of halal certificates using audits and laboratory analysis. Trends Food
Sci Tech, 27(2), 109-119. doi: 10.1016/j.tifs.2012.04.005
Vigne, J.-D., Guilaine, J., Debue, K., Haye, L., & Gérard, P. (2004). Early taming of the
cat in Cyprus. Science, 304(5668), 259-259.
Vu, B. V. (2011). PCR-based biomolecular detection (PhD), University of Houston
Walker, J. A., Hughes, D. A., Anders, B. A., Shewale, J., Sinha, S. K., & Batzer, M. A.
(2003). Quantitative intra-short interspersed element PCR for species-specific
DNA identification. Anal Biochem, 316(2), 259-269. doi: 10.1016/s0003-
2697(03)00095-2
Walker, J. A., Hughes, D. A., Hedges, D. J., Anders, B. A., Laborde, M. E., Shewale, J.,
Batzer, M. A. (2004). Quantitative PCR for DNA identification based on genome-
specific interspersed repetitive elements. Genomics, 83(3), 518-527. doi:
10.1016/j.ygeno.2003.09.003
Wu, J.-H., Hong, P.-Y., & Liu, W.-T. (2009). Quantitative effects of position and type of
single mismatch on single base primer extension. Journal of microbiological
methods, 77(3), 267-275.
Yin, R. H., Bai, W. L., Wang, J. M., Wu, C. D., Dou, Q. L., Yin, R. L., Luo, G. B. (2009).
Development of an assay for rapid identification of meat from yak and cattle using
polymerase chain reaction technique. Meat Sci, 83(1), 38-44.
Yusop, M. H. M., Mustafa, S., Man, Y. B. C., Omar, A. R., & Mokhtar, N. F. K. (2012).
Detection of raw pork targeting porcine-specific mitochondrial cytochrome B
gene by molecular beacon probe real-time polymerase chain reaction. Food
Analytical Methods, 5(3), 422-429.

118
Zhang, C.-L., Fowler, M. R., Scott, N. W., Lawson, G., & Slater, A. (2007). A TaqMan
real-time PCR system for the identification and quantification of bovine DNA in
meats, milks and cheeses. Food Control, 18(9), 1149-1158. doi:
10.1016/j.foodcont.2006.07.018

APPENDIX
LIST OF PUBLICATIONS AND PAPERS PRESENTED
119
a) Research Articles:
Ali, M.E., Amin, M.A., Hamid, S.B.A., Hossain, M.M., Mustafa, S., (2015). Lab-on-
a-chip-based PCR-RFLP assay for confirmed detection of short length feline
DNA in foods. Food Additives & Contaminant: Part A, (PUBLISHED),
ISI/Scopus cited publication.
Ali, M.E., Amin, M.A., Hamid, S.B.A., Rahman, M.M., Razzak, M.A., Rashid, N.R.A.,
Asing (2015). Short Amplicon-Length PCR Assay Targeting Mitochondrial
Cytochrome b Gene for the Detection of Feline Meats in Burger Formulation.
Food Analytical Methods, (PUBLISHED), ISI/Scopus cited publication.
Amin, M.A., Ali, M.E., Hamid, S.B.A., Rahman, M.M., Razzak, M.A., Asing, Rashid,
N.R.A (2015). A suitable method for the detection of potential fraud of bringing
feline meats in food chain. International Journal of Food Properties,
(UNDER REVIEW), ISI/Scopus cited Publication.
b) Conference Proceedings:
Amin, M.A., Ali, M.E., Hamid, S.B.A., Razzak, M.A. (2014). Primer design targeting
mitochondrial ND5 gene for cat meat detection in halal foods: INNOVAFOOD-
2014, 27−29th August 2014, PARKROYAL Penang Resort; Penang, Malaysia.
(ISI/Scopus cited publications).
Hamid, S.B.A., Amin, M.A., and Ali, M.E.: Zeolite Supported Ionic Liquid catalyst for
the Synthesis of Nanocellulose from Palm Tree biomass: BOND21 Joint
International Conference on Nanoscience, Engineering, and Management, 19-
21th August 2013, Bay view Beach Resort, Penang; Malaysia. Advanced
Materials Research Vol. 925 (2014) pp 52-56, (ISI/Scopus cited publications).

APPENDIX
FRONT PAGES OF PUBLISHED PAPERS

120
121

APPENDIX
ATTENDED CONFERENCES FROM THISTHESIS WORKS
122

123