Development and Validation of a Concept Test in ... · Development and Validation of a Concept Test...
19
Development and Validation of a Concept Test in Introductory Physics for Biology Students Marie Paz E. Morales Department of Physical Sciences, College of Science, Philippine Normal University [email protected] This study is focused on the development and validation of a concept test in Introductory Physics for Biology students as a diagnostic tool, a misconception test, a formative assessment tool, and a summative test. Its final form is a 50-item multiple-choice concept test in Introductory Physics for Biology 1 st term (Mechanics, Fluids & Heat) students wherein each item has four choices. One among the choices serves as the correct answer while the rest are considered distracters. It was originally developed as a 67-item multiple-choice concept test in Introductory Physics for Biology students covering all the topics specified in the syllabus of the course offered at the Philippine Normal University. Classical test item analysis and validation were conducted to establish test validity while item reliability was tested using Cronbach’s Alpha, which was 0.67, and K-R 21, which was 0.70. Analysis of the distracters was done to determine the Physics misconceptions that can be diagnosed by the instrument. The misconception diagnostic capability of the test is a feature, which can be of help to Physics teachers for better concept understanding of students. Keywords – Misconception test, Assessment tool, Physics for Biology, Concept Test, Validity “You can’t enjoy a game unless you know its rules. Likewise, you can’t fully appreciate your surroundings until you understand the rules of nature. Physics is a study of these rules, which will show you how everything in nature is beautifully connected. You will see the mathematical structure of physics in frequent equations, but more than being recipes for computation, you’ll see the equations as guides to thinking” (Hewitt, n.d., http://eshs- generalphysics.wikispaces.com/) It was asserted by McDermott (1990) that traditional Physics courses do not offer all the necessary aspects of Physics. Particularly, one of those missing is the conceptual Physics part. As mentioned by Arons (1997), understanding the ideas of conceptual Physics hopefully leads to better conceptual understanding of the whole field of Physics. The aim of instilling conceptual understanding in Physics is very difficult to establish. However, as claimed by Engelhardt (2009), high-quality conceptual multiple-choice tests may be able to diagnose students’ misconceptions and might later on lead to better understanding of the Physics concepts. She further stated that high quality conceptual multiple-choice tests greatly differ from the traditional multiple-choice tests in the process of development. The former involves a series of processes, which brings about the basic qualities of a high quality conceptual multiple- choice test. This paper is intended to present the process of development of a conceptual
-
Upload
truonghanh -
Category
Documents
-
view
218 -
download
0
Transcript of Development and Validation of a Concept Test in ... · Development and Validation of a Concept Test...

Development and Validation of a Concept Test in
Introductory Physics for Biology Students
Marie Paz E. Morales
Department of Physical Sciences, College of Science, Philippine Normal University
This study is focused on the development and validation of a concept test in Introductory
Physics for Biology students as a diagnostic tool, a misconception test, a formative assessment
tool, and a summative test. Its final form is a 50-item multiple-choice concept test in Introductory
Physics for Biology 1st term (Mechanics, Fluids & Heat) students wherein each item has four
choices. One among the choices serves as the correct answer while the rest are considered
distracters. It was originally developed as a 67-item multiple-choice concept test in Introductory
Physics for Biology students covering all the topics specified in the syllabus of the course offered
at the Philippine Normal University. Classical test item analysis and validation were conducted
to establish test validity while item reliability was tested using Cronbach’s Alpha, which was
0.67, and K-R 21, which was 0.70. Analysis of the distracters was done to determine the Physics
misconceptions that can be diagnosed by the instrument. The misconception diagnostic
capability of the test is a feature, which can be of help to Physics teachers for better concept
understanding of students.
Keywords – Misconception test, Assessment tool, Physics for Biology, Concept Test, Validity
“You can’t enjoy a game unless you know
its rules. Likewise, you can’t fully appreciate
your surroundings until you understand the
rules of nature. Physics is a study of these
rules, which will show you how everything in
nature is beautifully connected. You will see
the mathematical structure of physics in
frequent equations, but more than being recipes
for computation, you’ll see the equations as
guides to thinking” (Hewitt, n.d., http://eshs-
generalphysics.wikispaces.com/)
It was asserted by McDermott (1990) that
traditional Physics courses do not offer all the
necessary aspects of Physics. Particularly, one
of those missing is the conceptual Physics part.
As mentioned by Arons (1997), understanding
the ideas of conceptual Physics hopefully leads
to better conceptual understanding of the whole
field of Physics.
The aim of instilling conceptual
understanding in Physics is very difficult to
establish. However, as claimed by Engelhardt
(2009), high-quality conceptual multiple-choice
tests may be able to diagnose students’
misconceptions and might later on lead to better
understanding of the Physics concepts. She
further stated that high quality conceptual
multiple-choice tests greatly differ from the
traditional multiple-choice tests in the process
of development. The former involves a series
of processes, which brings about the basic
qualities of a high quality conceptual multiple-
choice test. This paper is intended to present the
process of development of a conceptual
Physics
© 2012 De La Salle University - Manila, Philippines
Physics
7
Physics
The Manila Journal of Science :2 (2012) pp. 26-44
SEM

multiple-choice test in Introductory Physics for
Biology students.
Methodology
The whole process involved three major
phases: (i) Preparation stage; (ii) Development
of the Conceptual Test in Physics 41:
Introductory Physics for Biology students; and
(iii) Validation stage.
Phase 1: Preparation Stage
In the preparation stage, reviews,
observations, and literature were considered,
together with the necessary inputs such as
syllabus and observations. These were
collected to serve as base data in the
development of the conceptual test.
Phase 2: Development Stage
The development stage commences with the
preparation of the specific objectives based on
the syllabus of Physics 41, which included
major topics as Mechanics, Work and Energy,
Solids, Fluids, and Heat. The concept test
covered about 90% of the topics in the subject
as specified by the course syllabus. Using the
specific objectives in each topic, a table of
specifications was prepared. The first version
(v.1) included more items in the cognitive
domain that promote Higher-Order-Thinking-
Skills (HOTS) such as analysis, application,
evaluation, and creation. Also, to ensure that
the distracters serve their purpose, literature and
previous answers of students from other Physics
41 classes were used in the construction.
The first version resulted in an 80-item
multiple-choice concept test (v.1). Commonly,
final examinations and other standard
examinations in the Philippines are in 80 to 100
item format. Further, there is a direct relation
between length of test and reliability of the test.
Thus, these were the considerations in the
development of version 1 of the test.1 In
1 Barnette (2006) mentioned the direct relation of test length and
reliability in the presentation entitled Assessing Data Collection Instrument
consultation with three professors handling the
course in the 1st semester, SY 2010-2011,
specific topics for inclusion were identified if
the test would serve as a diagnostic as well as
an achievement test or a final examination for
students taking the course. The professors
identified 13 of the 80 questions as not to be
considered as part of the final exam.
Accordingly, these 13 questions are part of the
optional topics in the syllabus for enrichment
purposes. The professors made it clear that the
final examination will only cover the basic
competencies of the introductory physics
course. This consequently resulted in having 67
items in the table of specifications version 2
(see Appendix B).
Phase 3: Validation Stage
Three content evaluators and face
validators were tasked to establish the content
and face validity of the 67-item multiple-choice
conceptual test (v.2). Two were professors of
the subject in the 1st semester, SY 2010-2011.
The last member of the group had already
taught the subject in previous semesters. All
three evaluators are content experts being
Physics majors and having already obtained
their Master’s degree in Physics. A standard
checklist (Ebel, 1980) for content and face
validity was provided to ensure that all of three
evaluators were using the same bases in the
evaluation process. The 67-item multiple-
choice conceptual test was then revised based
on the suggestions and comments made by the
evaluators resulting in a 67-item multiple-
choice concept test (version 3).
Version 3 (v. 3) of the test was
administered to 103 pre-service students who
are specializing in biology and were enrolled in
Physics 41: Introductory Physics for Biology
Students in March of SY 2010. All the
participants were in their second year of pre-
service college and were 17 or 18 years old.
The teachers of these classes were requested to
proctor the test and all of them agreed that the
test be considered as the final examination of
the students. This procedure ensured that
SEM
Physics
27 The Manila Journal of Science
Physics
VOL. 7 NO. 2
validity and reliability of the test would not be
affected by the way the students took the test.
Item analysis was done to establish the indices
of difficulty and discrimination, as well as other
constructs of a high-quality test. As a result of
the item analysis, the conceptual test was
revised and reformatted, resulting to version 4
(v. 4) of the concept test that included 49-item
multiple-choice format.
Results and Discussion
The development project had two major
goals: (i) to develop a multiple-choice concept
test and (ii) to come up with a standardized
paper-and-pencil test in Physics 41:
Introductory Physics for Biology students.
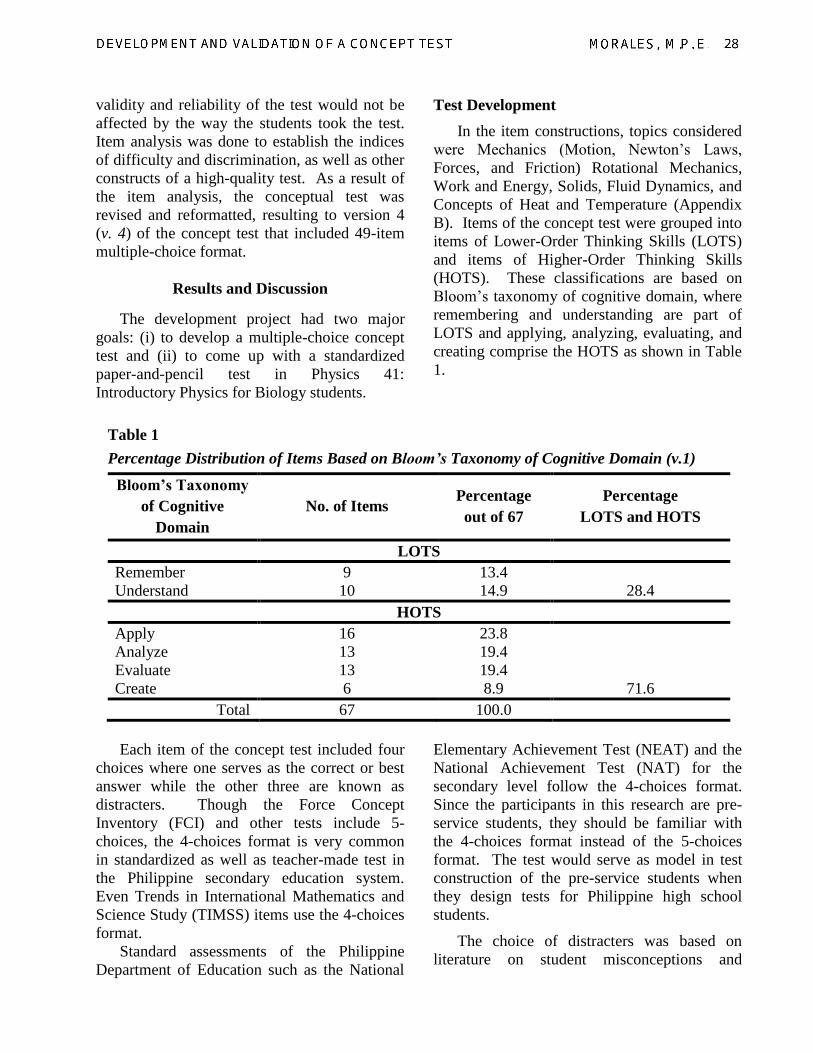
Test Development
In the item constructions, topics considered
were Mechanics (Motion, Newton’s Laws,
Forces, and Friction) Rotational Mechanics,
Work and Energy, Solids, Fluid Dynamics, and
Concepts of Heat and Temperature (Appendix
B). Items of the concept test were grouped into
items of Lower-Order Thinking Skills (LOTS)
and items of Higher-Order Thinking Skills
(HOTS). These classifications are based on
Bloom’s taxonomy of cognitive domain, where
remembering and understanding are part of
LOTS and applying, analyzing, evaluating, and
creating comprise the HOTS as shown in Table
1.
Table 1
Percentage Distribution of Items Based on Bloom’s Taxonomy of Cognitive Domain (v.1)
Bloom’s Taxonomy
of Cognitive
Domain
No. of Items Percentage
out of 67
Percentage
LOTS and HOTS
LOTS
Remember 9 13.4
Understand 10 14.9 28.4
HOTS
Apply 16 23.8
Analyze 13 19.4
Evaluate 13 19.4
Create 6 8.9 71.6
Total 67 100.0
Each item of the concept test included four
choices where one serves as the correct or best
answer while the other three are known as
distracters. Though the Force Concept
Inventory (FCI) and other tests include 5-
choices, the 4-choices format is very common
in standardized as well as teacher-made test in
the Philippine secondary education system.
Even Trends in International Mathematics and
Science Study (TIMSS) items use the 4-choices
format.
Standard assessments of the Philippine
Department of Education such as the National
Elementary Achievement Test (NEAT) and the
National Achievement Test (NAT) for the
secondary level follow the 4-choices format.
Since the participants in this research are pre-
service students, they should be familiar with
the 4-choices format instead of the 5-choices
format. The test would serve as model in test
construction of the pre-service students when
they design tests for Philippine high school
students.
The choice of distracters was based on
literature on student misconceptions and
SEM
Physics
DEVELOPMENT AND VALIDATION OF A CONCEPT TEST
Physics
MORALES, M.P. E.
Physics
28

previous observations made when the
proponent earlier handled the course. Further,
based on Table 1, about 71% of the questions
belong to the higher-order thinking skills
(HOTS) continuum and only about 29% are on
the lower-order thinking skills (LOTS). The
percentage on the 3rd
column denotes
percentage per cognitive domain with a total of
100%. The percentage on the 4th
column
denotes percentage for Lower-Order Thinking
Skills domain (28.4) and HOTS domain (71.6).
Validation and Pilot-Testing
The 67-item v.1 test was subjected to two
methods of content validation by the experts: (i)
descriptive and (ii) quantitative content
validation. Only descriptive validation was
done for face validation. Descriptive validation
highlights the use of phrases or words to
describe the assessment of the items. These are
presented as comments, remarks, or suggestions
of the experts. Quantitative content validation
made use of the 20-item validation checklist
(Appendix A). The results of the validation are
shown in Tables 2 and 3 with the comments and
suggestion of the experts.
Table 2
Content Validity of Version 2 (v.2)
Expert 1 Expert 2 Expert 3
Mean 4.90 4.75 4.95
Comments items 49 and 57 have
three alternatives only,
the rest have four
cool questions
consistency in formatting,
some items are typed in bold
face (#s 42-50)
items 7 & 44 –visibility of
figures
#s 13 & 64 – typo errors
diagrams should be made
clearer like those in #s 7, 44,
and 46
calibrations are not clear
the choices in #15 should
be changed to cm/s
(answer is 81.5 cm/s)
Over-all
Mean 4.87 out of 5
Version 2 of the test was validated by three
experts who are teaching or have taught the
course.
A 5-point Likert-scale evaluation
checklist was used for validation purposes
(Morales, 2003). The 5-point Likert evaluation
scale is a checklist consisting of the
characteristics of a good and valid test. This
was developed following a series of steps: (i)
use of literature to identify the constructs and
characteristics of a good and valid test; (ii)
development of the 5-point Likert scale
checklist; (iii) establishment of content validity
and reliability; and (iv) revision and finalization
of the checklist. Shown in Table 2 are the
individual and over all means of the three
experts. The means of the individual experts
were determined by getting the ratio of the sum
of the ratings per expert and the total number of
items in the checklist. For a more reliable
computation, Statistical Package for Social
SEM
Physics
29 The Manila Journal of Science
Physics
VOL. 7 NO. 2
Sciences (SPSS) generated output was used
instead of manual calculations. All three
evaluators have rated the developed test 4.87
out of to 5.0 (Table 2), suggesting that the raters
evaluated the tests within the highest continuum
of the Likert scale. This suggests a good
quality test in construction and valid content
wise. Comments and suggestions in the 3rd
column were also used as bases for item
revision.
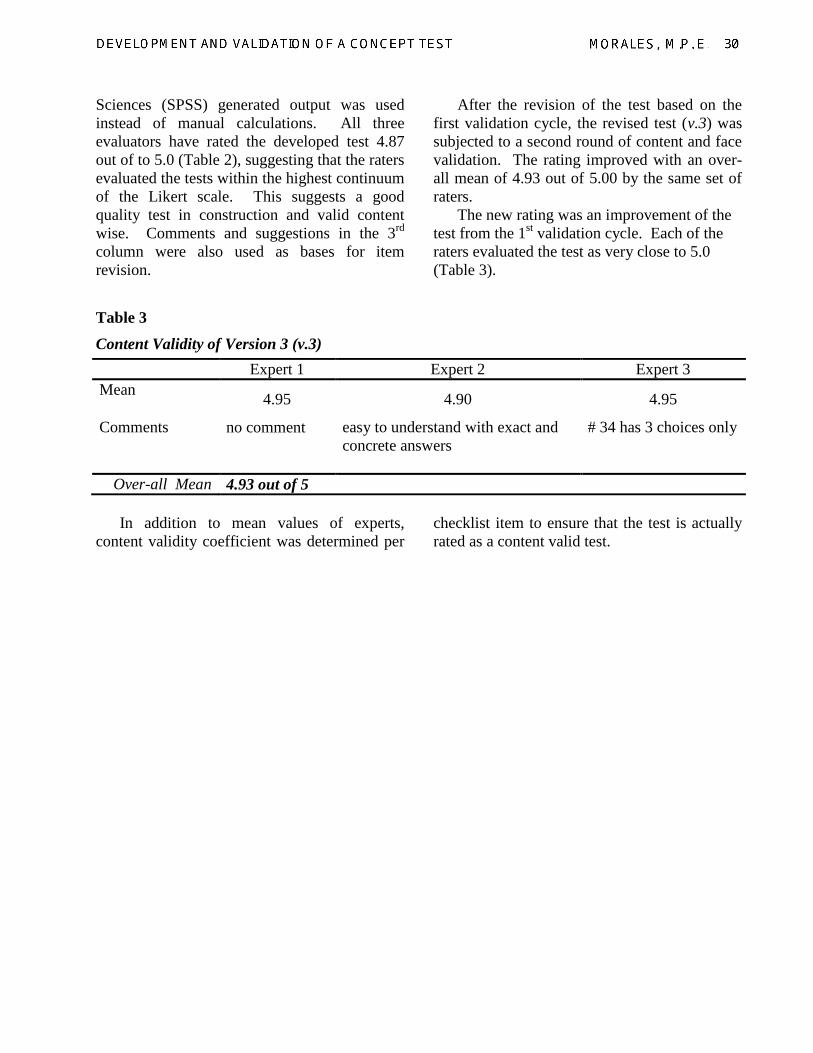
After the revision of the test based on the
first validation cycle, the revised test (v.3) was
subjected to a second round of content and face
validation. The rating improved with an over-
all mean of 4.93 out of 5.00 by the same set of
raters.
The new rating was an improvement of the
test from the 1st validation cycle. Each of the
raters evaluated the test as very close to 5.0
(Table 3).
Table 3
Content Validity of Version 3 (v.3)
Expert 1 Expert 2 Expert 3
Mean 4.95 4.90 4.95
Comments no comment
easy to understand with exact and
concrete answers
# 34 has 3 choices only
Over-all Mean 4.93 out of 5
In addition to mean values of experts,
content validity coefficient was determined per
checklist item to ensure that the test is actually
rated as a content valid test.
Physics
30
Physics
DEVELOPMENT AND VALIDATION OF A CONCEPT TEST
SEM
Physics
MORALES, M.P. E.
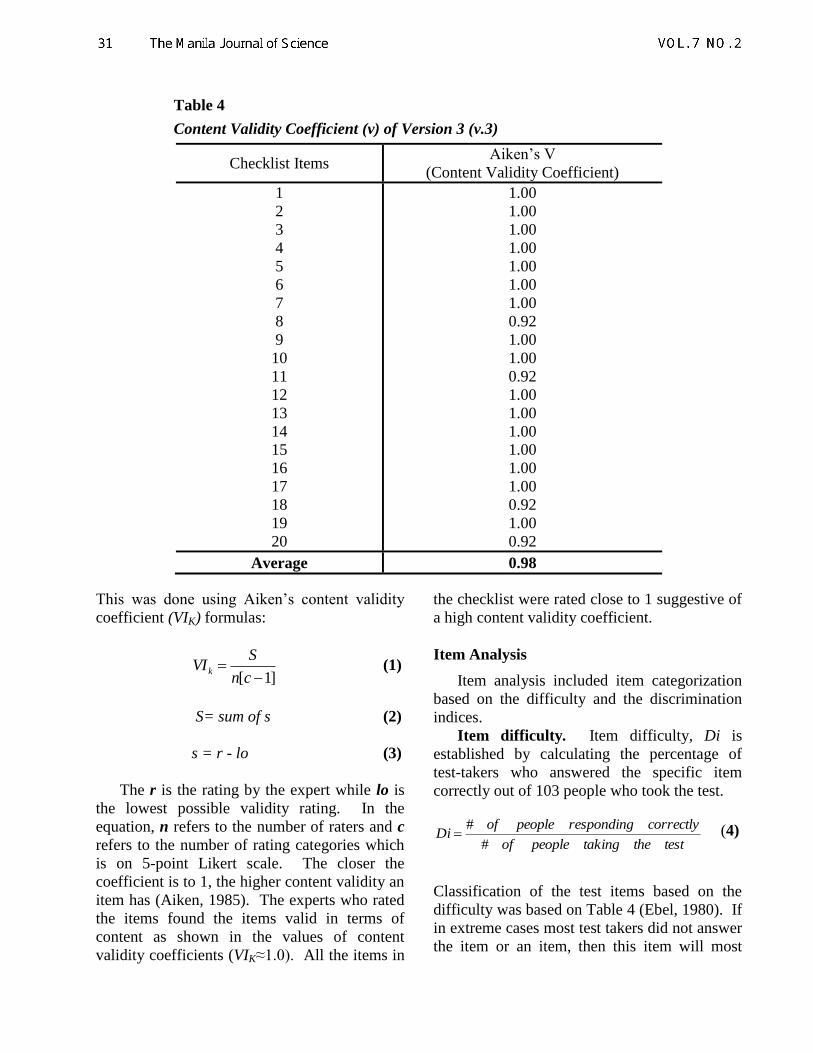
Table 4
Content Validity Coefficient (v) of Version 3 (v.3)
Checklist Items Aiken’s V
(Content Validity Coefficient)
1
2
3
4
5
6
7
8
9
10
11
12
13
14
15
16
17
18
19
20
1.00
1.00
1.00
1.00
1.00
1.00
1.00
0.92
1.00
1.00
0.92
1.00
1.00
1.00
1.00
1.00
1.00
0.92
1.00
0.92
Average 0.98
This was done using Aiken’s content validity
coefficient (VIK) formulas:
]1[
cn
SVI k (1)
S= sum of s (2)
s = r - lo (3)
The r is the rating by the expert while lo is
the lowest possible validity rating. In the
equation, n refers to the number of raters and c
refers to the number of rating categories which
is on 5-point Likert scale. The closer the
coefficient is to 1, the higher content validity an
item has (Aiken, 1985). The experts who rated
the items found the items valid in terms of
content as shown in the values of content
validity coefficients (VIK≈1.0). All the items in
the checklist were rated close to 1 suggestive of
a high content validity coefficient.
Item Analysis
Item analysis included item categorization
based on the difficulty and the discrimination
indices.
Item difficulty. Item difficulty, Di is
established by calculating the percentage of
test-takers who answered the specific item
correctly out of 103 people who took the test.
testthetakingpeopleof
correctlyrespondingpeopleofDi
#
# (4)
Classification of the test items based on the
difficulty was based on Table 4 (Ebel, 1980). If
in extreme cases most test takers did not answer
the item or an item, then this item will most
SEM
Physics
31 The Manila Journal of Science
Physics
VOL. 7 NO. 2
likely be classified as discarded items in the
item-difficulty analysis.
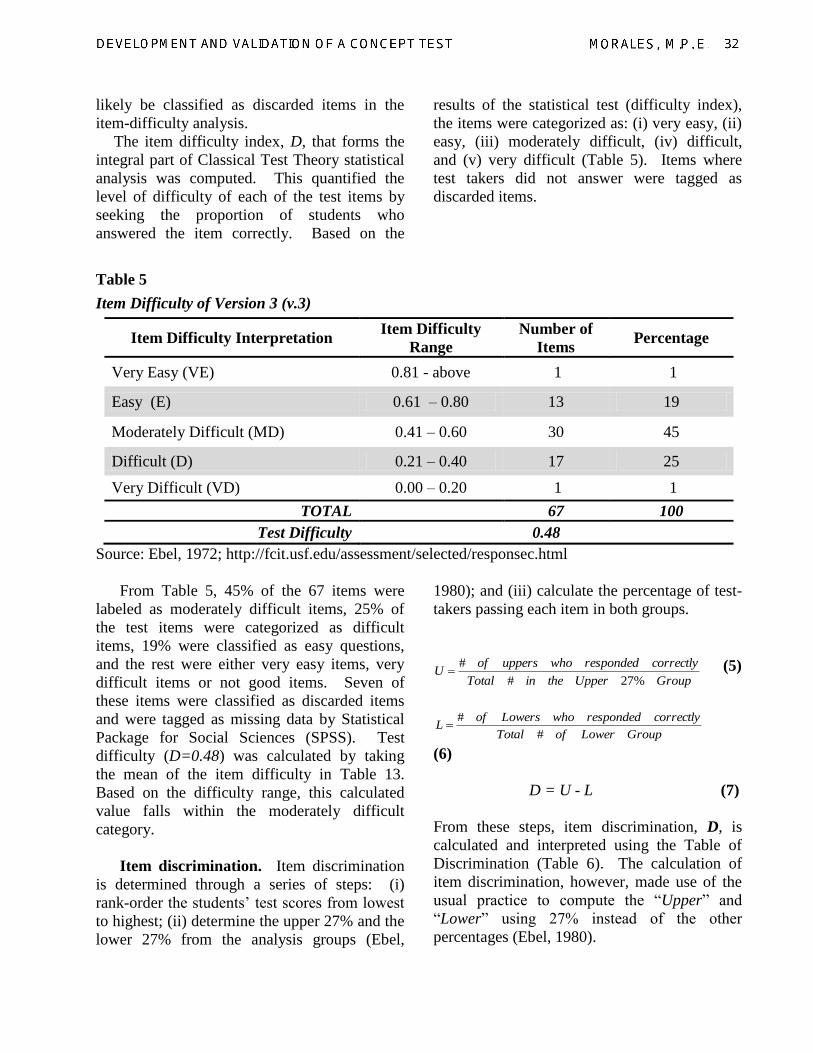
The item difficulty index, D, that forms the
integral part of Classical Test Theory statistical
analysis was computed. This quantified the
level of difficulty of each of the test items by
seeking the proportion of students who
answered the item correctly. Based on the
results of the statistical test (difficulty index),
the items were categorized as: (i) very easy, (ii)
easy, (iii) moderately difficult, (iv) difficult,
and (v) very difficult (Table 5). Items where
test takers did not answer were tagged as
discarded items.
Table 5
Item Difficulty of Version 3 (v.3)
Item Difficulty Interpretation Item Difficulty
Range
Number of
Items Percentage
Very Easy (VE) 0.81 - above 1 1
Easy (E) 0.61 – 0.80 13 19
Moderately Difficult (MD) 0.41 – 0.60 30 45
Difficult (D) 0.21 – 0.40 17 25
Very Difficult (VD) 0.00 – 0.20 1 1
TOTAL 67 100
Test Difficulty 0.48
Source: Ebel, 1972; http://fcit.usf.edu/assessment/selected/responsec.html
From Table 5, 45% of the 67 items were
labeled as moderately difficult items, 25% of
the test items were categorized as difficult
items, 19% were classified as easy questions,
and the rest were either very easy items, very
difficult items or not good items. Seven of
these items were classified as discarded items
and were tagged as missing data by Statistical
Package for Social Sciences (SPSS). Test
difficulty (D=0.48) was calculated by taking
the mean of the item difficulty in Table 13.
Based on the difficulty range, this calculated
value falls within the moderately difficult
category.
Item discrimination. Item discrimination
is determined through a series of steps: (i)
rank-order the students’ test scores from lowest
to highest; (ii) determine the upper 27% and the
lower 27% from the analysis groups (Ebel,
1980); and (iii) calculate the percentage of test-
takers passing each item in both groups.
(5)
GroupLowerofTotal
correctlyrespondedwhoLowersofL
#
#
(6)
D = U - L (7)
From these steps, item discrimination, D, is
calculated and interpreted using the Table of
Discrimination (Table 6). The calculation of
item discrimination, however, made use of the
usual practice to compute the “Upper” and
“Lower” using 27% instead of the other
percentages (Ebel, 1980).
GroupUppertheinTotal
correctlyrespondedwhouppersofU
%27#
#
Physics
32
Physics
MORALES, M.P. E.
SEM
Physics
DEVELOPMENT AND VALIDATION OF A CONCEPT TEST

Table 6
Item Discrimination of Version 3 (v.3)
Item Discrimination
Interpretation Range Number of Items Percentage
Questionable (Q) -1.00 - -0.60 5 7
Not Discriminating (ND) -0.59 - 0.09 11 16
Moderately Discriminating (MDs) 0.10 – 0.20 17 26
Discriminating (Ds) 0.21 – 0.60 34 51
Very Discriminating (VDs) 0.61 – 1.00 0 0
Total 67 100
Source: http://fcit.usf.edu/assessment/selected/responsec.html
From Table 6, discriminating capability of
the items was determined using the classical
test analysis. The discrimination index refers to
how well the item differentiates between high
and low scores. From this classical test
analysis, it is expected that high performing
students would select the correct answer for
each of the question more often than the low
performing students. This is termed as positive
discrimination. A negative discrimination is
shown when more from the lower group
selected the correct answer for the items. From
the computation of the discrimination indices
(Table 6), 51% of the 67 items were rated
discriminating, 26% were identified as
moderately discriminating items, and 16% and
7% were found to be not discriminating and
questionable items respectively.
Likewise, pairing the difficulty index with
the discrimination index determined the
category of the items as (1) accept the item; (2)
revise the item; and (3) reject the item (Table
12).
Table 7
Item Classification Based on Item Analysis of Version 3 (v.3)
Number of Items Percentage
Accept 19 28
Revise 31 46
Reject 17 26
Total 67 100
The percentage distribution of the 67-item
multiple-choice concept test using the difficulty
and discrimination indices (Table 7) resulted in
28% of the 67 items as accepted, 46% were
tagged as needing revision, and 26% were
rejected. About 31 items were revised and 19
were accepted as is. This completes version 4
(v.4) of the concept test that includes 50
multiple-choice items in Physics 41:
Introductory Physics for Biology students.
Reliability
Reliability is an indicator of a test’s
consistency. It can indicate the stability of the
test scores or data sets across applications or
across time. There are different types of
reliability such as test-retest and split half.
However, internal consistency reliability is
most appropriate for a test administered once.
It indicates the extent to which the examinees’
observed scores are similar to their true scores.
The suggested appropriate measures for a
SEM
Physics
33 The Manila Journal of Science
Physics
VOL. 7 NO. 2

dichotomously scored test (i.e. correct or
incorrect) are KR-21 or Cronbach’s Alpha.
2
2
11
21SD
n
MM
n
nKR
(8)
where n refers to the number of items in the
test, M stands for the mean score and SD is for
the standard deviation. KR-21 is easy to
compute as it requires less information. On the
other hand, Cronbach’s Alpha is an alternative
to KR-21.
2
2
11
i
n
n (9)
The Cronbach’s Alpha (Eqn. 9) is determined
by getting the ratio of the number of items (n)
and the number of items minus 1 (n-1) and
multiplying this by the difference of 1 and the
ratio of sum of the item variances (2-
) and the
variance of the total score (2).
Table 8
Reliability Statistics (Cronbach’s Alpha) of Version 3 (v.3)
Cronbach’s Alpha KR-21 Number of Items
0.67 0.70 62
Using the Statistical Package for Social
Sciences (SPSS) software, the computed
reliability Cronbach’s Alpha was 0.67 (Table
8). There were only 62 items automatically
detected by the software. Five out of 67 items
were excluded by the software and were
automatically labelled as missing data. Missing
data were identified by the software when
students were not able to provide answers to
such items because of non-clarity of the image
accompanying the item. According to the
standard set by University of Washington
(Table 9), reliability (Cronbach’s Alpha or KR-
21) within the range of 0.6 to 0.7 is within the
range of low and good.
Table 9
SCOREPAK Standard Interpretation of Reliability
Reliability
0.50 or below 0.50–0.60 0.60–0.70 0.70–0.80 0.80–0.90 0.90 and above
Questionable
reliability.
This test should
not contribute
heavily to the
course grade,
and it needs
revision.
Suggests need for
revision of test,
unless it is quite
(10 or fewer
items).
The test
definitely needs
to be
supplemented by
other measures
(e.g. more tests)
for grading.
Somewhat low.
This test needs to
be supplemented
by other
measures (e.g.,
more tests) to
determine grades.
There are
probably some
items which
could be
improved.
Good for a
classroom test;
in the range of
most.
There are
probably a few
items which
could be
improved.
Very good for
a classroom
test
Excellent
reliability, at
the level of the
best
standardized
tests
Source: “SCOREPAK®: Item Analysis”, 2005
Physics
34
Physics
MORALES, M.P. E.
SEM
Physics
DEVELOPMENT AND VALIDATION OF A CONCEPT TEST
However, since the lower range of
reliability (0.67) is classified as low, probable
reasons cited by the University of Washington
include (1) the test items not exactly fitting the
respondents, which may mean that the test
measures more than the student’s knowledge of
the subject matter and (2) the content of the
items being very diverse. The low reliability of
the test could be attributed to the inclusion of
ALL the topics in the course syllabus.
Suggestions to improve reliability include
increasing the number of respondents or having
supplementary or alternative assessments in
order to improve the test scores of the students
for the purpose of grading them.
A KR-21 of 0.7, however, reflects a higher
reliability which falls within the range of a good
classroom test (Table 9). But as noted, there
are some more items that need to be improved
to attain a higher reliability coefficient.
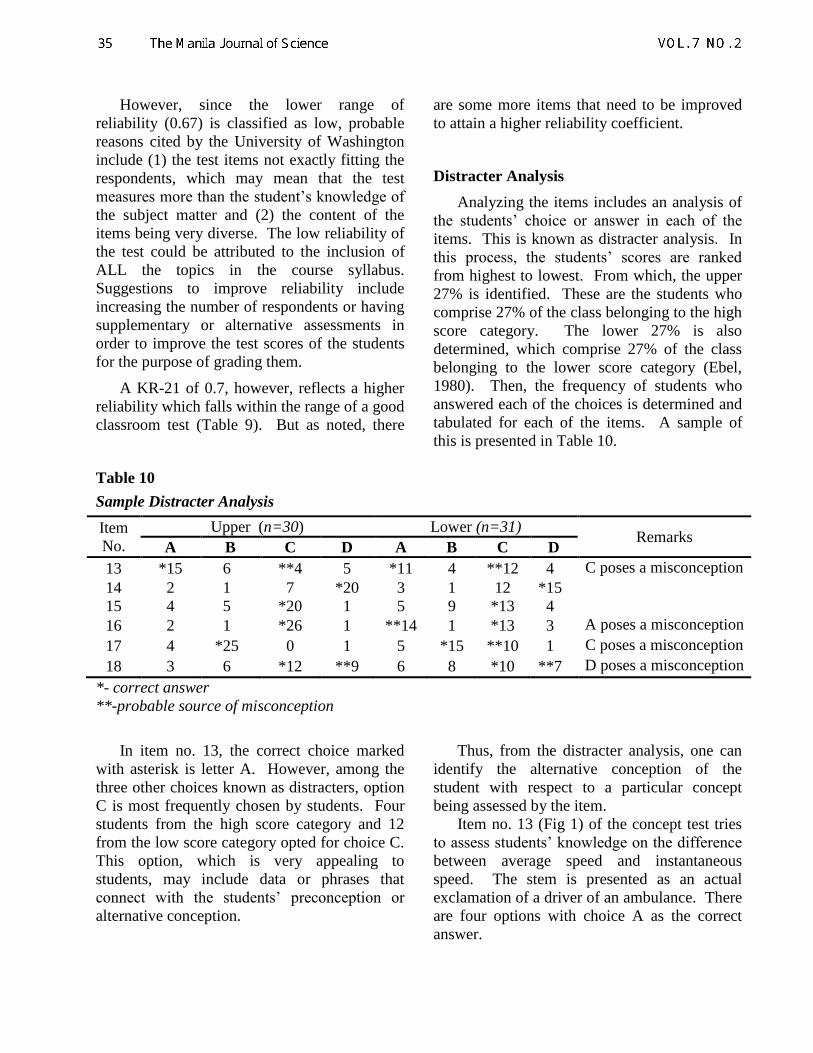
Distracter Analysis
Analyzing the items includes an analysis of
the students’ choice or answer in each of the
items. This is known as distracter analysis. In
this process, the students’ scores are ranked
from highest to lowest. From which, the upper
27% is identified. These are the students who
comprise 27% of the class belonging to the high
score category. The lower 27% is also
determined, which comprise 27% of the class
belonging to the lower score category (Ebel,
1980). Then, the frequency of students who
answered each of the choices is determined and
tabulated for each of the items. A sample of
this is presented in Table 10.
Table 10
Sample Distracter Analysis
Item
No.
Upper (n=30) Lower (n=31) Remarks
A B C D A B C D
13 *15 6 **4 5 *11 4 **12 4 C poses a misconception
14 2 1 7 *20 3 1 12 *15
15 4 5 *20 1 5 9 *13 4
16 2 1 *26 1 **14 1 *13 3 A poses a misconception
17 4 *25 0 1 5 *15 **10 1 C poses a misconception
18 3 6 *12 **9 6 8 *10 **7 D poses a misconception
*- correct answer
**-probable source of misconception
In item no. 13, the correct choice marked
with asterisk is letter A. However, among the
three other choices known as distracters, option
C is most frequently chosen by students. Four
students from the high score category and 12
from the low score category opted for choice C.
This option, which is very appealing to
students, may include data or phrases that
connect with the students’ preconception or
alternative conception.
Thus, from the distracter analysis, one can
identify the alternative conception of the
student with respect to a particular concept
being assessed by the item.
Item no. 13 (Fig 1) of the concept test tries
to assess students’ knowledge on the difference
between average speed and instantaneous
speed. The stem is presented as an actual
exclamation of a driver of an ambulance. There
are four options with choice A as the correct
answer.
SEM
Physics
35 The Manila Journal of Science
Physics
VOL. 7 NO. 2

Figure 1. Sample item.
A total of 16 students opted to answer C
(double asterisk) from both (high and low)
category. These students could not simply
identify the difference between an average
speed and an instantaneous speed. From the
literature, this alternative concept of the
students detected in item no. 13 is an identified
misconception of most students in physics
(Sequeira & Leite, 1991).
Following the same analytical process led to
the following misconceptions as diagnosed by
the concept test using the distracter analysis: (1)
Students interchange the definition of
equilibrant and vector; (2) They tend to mix up
the meaning of velocity and acceleration; (3)
They believe that stationary objects do have the
same velocity and acceleration, which are zero;
(4) They think that hanging weights only
exhibit gravitational force and not
acknowledging concurrent forces; (5) The one
that counteracts gravity is the net force; (6)
They are having difficulty in distinguishing
Law of Inertia and Law of Gravitation; (7) They
attribute more speed to lesser weight and not to
lesser frictional force; (8) They attribute
vehicular accidents and seatbelt use to Law of
Interaction; (9) They are unfamiliar with
streamlining as a method of decreasing friction;
(10) They believe that work is the product of
force and a perpendicular displacement instead
of parallel displacement; (11) They do not
include light as part of the conserved energy;
(12) Students only attribute pressure to volume
and not with depth; (13) Fever for them is not
related to energy release or heat release; and
(14) They are not able to distinguish the
differences of the ways of heat transfer.
Conclusion and Recommendation
Conclusion
The process of the development and
validation of a concept test in Physics 41:
Introductory Physics for Biology students
presented an alternative to the teacher-made test
construction and item analysis. From the given
method, educators and teachers can design
assessments of the same kind and be able to
extract information about their students’
conceptions and alternative conception
(misconceptions).
13. The ambulance driver in an interview
exclaimed, “We were so fast, I was actually
hitting 120 kph the whole time.” Which is
referred to by the ambulance the driver?
A. Average speed
B. Average velocity
C. Instantaneous speed
D. Instantaneous velocity
Physics
36
Physics
MORALES, M.P. E.
SEM
Physics
DEVELOPMENT AND VALIDATION OF A CONCEPT TEST

Table 11
Summary
Criteria v.1 v.2 v.3 v.4
n (no. of items) 80 67 62 50
Content Validity (out of 5) 4.87 4.93 - -
Test Difficulty
0.48
Aiken’s Vaidity - - 0.98 -
Item Discrimination
- - Questionable (7%)
Not Discriminating (16%)
Moderately Discriminating
(26%)
Discriminating (51%)
Item Difficulty
Very Easy (1%)
Easy (19%)
Moderately Difficult (45%)
Difficult (25%)
Very Difficult (1%)
Discarded (7%)
Item Classification
Revise (46%)
Reject (26%)
Accept (28%)
KR-21 0.70
Cronbach’s Alpha 0.67
*n (no. of items)
From Table 11, version 1 included 80
questions. As rated by content experts, the
over-all mean for content validity was 4.87 out
of 5.00. Revisions done based on the comments
and suggestion of the content experts in the first
validation cycle led to version 2 of the test with
67 items. Second cycle of content validation
resulted in an over-all mean of 4.93 out of 5.00
which is a slight improvement over the first
cycle. Further, Aiken’s content validation
coefficient average (V=0.98) was indicative of
a high content validity coefficient. Revision
was done on version 2 based on comments and
suggestions gathered from the 2nd
cycle of
validation. This resulted in version 3, which
was administered to 103 pre-service biology
students.
Item analysis of the version 3 resulted in
selecting 62 items and five were discarded. For
item discrimination, 7% were classified as
Questionable items, 26% are Moderately
Discriminating items, and 51% were
Discriminating items. The items were also
categorized according to difficulty: Very Easy
(1%); Easy (19%); Moderately Difficult (45%);
Difficult (25%); Very Difficult (1%); and
SEM
Physics
37 The Manila Journal of Science
Physics
VOL. 7 NO. 2

Discarded (7%). In summary, 19 out of the 67
items were accepted, while 31 others were
revised so as to meet and improve on certain
criterion such as discrimination capability of the
test. The rest of the items (n=17) were rejected
for being either too difficult or too easy or for
not being able to discriminate between students.
As for the reliability of version 3,
Cronbach’s Alpha was used to quantify the
internal consistency of the test items. This
index is suited to 1- time administration test.
The Cronbach’s Alpha of the 67-item test was
0.67 while KR-21 computation gave a 0.70
coefficient of reliability. With the revisions
done with the 31 items, of version 4, a higher
reliability index could be expected.
Scrutiny of the item choices led to identified
alternative conceptions of the students who took
the test. From literature, these are comparable
to the usual misconceptions of students in
physics in other countries
(http://fcit.usf.edu/assessment/selected/response
c.html).
Recommendations
The concept test after going through the
development and validation processes can be
utilized as diagnostic assessment, formative
assessment, and summative assessment. Its
development involved a series of steps, which is
part of the protocol in developing good quality
tests with high indices and coefficients
(difficulty index, discrimination index, content
validity coefficient, and reliability index). It is
then suggested that to establish a high-quality
concept test, make sure that there are a good
number of respondents or test-takers. This will
compensate for the diversity of the topics
included in the test. A re-test for the 50-item
version should be conducted to determine the
reliability index of the revised version of the
test (Version 4). Further, a similar effort may
be undertaken to come up with concept tests in
other subject areas or Physics topics, for
example, Electricity, magnetism, optics, and
modern physics which are the topics for the
Physics course of term 2.
References
Aiken, L. R. (1985). Three coefficients for
analyzing the reliability and validity of
ratings. Educational and Psychological
Measurement, 45(1), 131-142.
Arons, A. B. (1997). Teaching introductory
physics. New York: John Wiley & Sons,
Inc.
Barnette, J. J. (2006). Assessing data collection
instrument [Lecture presentation handout].
Summer Evaluation Institute at University
of Alabama, Birmingham. Retrieved June
20, 2012 from
http://www.eval.org/summerinstitute/06SIH
andouts/SI06.Barnette.BO24.Online.pdf
Ebel, R. L. (1972). Item analysis. Retrieved
March 15, 2012 from
http://xnet.rrc.mb.ca/tomh/item_analysis.htm
Ebel, R. L. (1980). Practical problems in
educational measurement. Lexington, MA:
Heath.
Engelhardt, V. (2009). An introduction to
classical test theory as applied to conceptual
multiple-choice tests: Getting started in
physics education research, American
Journal of Physics, 2(1), 1–40.
McDermott, L. (1990). A perspective on
teacher preparation in physics and other
sciences: The need for special science
courses for teachers. American Journal of
Physics, 58(8), 734–742.
Morales, M. P. E. (2003). Development and
validation of a two-tier test in Natsci 13
(Ecology). Philippines: De La Salle-College
of Saint Benilde-Center for Learner
Centered Instruction and Research, Manila
Sequeira, M., & Leite, L. (1991). Alternative
conceptions and history of science in
physics teacher education. Science
Education Journal, 75(1), 135-141.
SCOREPAK®: Item Analysis. (2005). Office
of Educational Assessment, University of
Washington. Retrieved March 15, 2012
from
http://www.washington.edu/oea/pdfs/resour
ces/item_analysis.pdf
Physics
38
Physics
MORALES, M.P. E.
SEM
Physics
DEVELOPMENT AND VALIDATION OF A CONCEPT TEST

APPENDIX A
EVALUATION CHECKLIST
Dear Evaluator:
This checklist (Morales, 2003) is intended for use by test evaluators to determine the extent
of content validity of the test. It aims to help in the development of a valid multiple-choice type of
test in Introductory Physics for Biology Students. Please tick on the appropriate scale.
5 - Strongly Agree
4 - Agree
3 - Undecided
2 - Disagree
1 - Strongly Disagree
Criteria 5 4 3 2 1
1. The items are constructed to assess single written objectives.
2. Each item is based on a specific problem stated clearly in the stem.
3. The items include as much as possible information in the stem, but do not
include irrelevant materials.
4. In general, the stem of the items is stated in positive form.
5. The alternatives are stated or worded clearly and concisely.
6. The alternatives of the items are kept mutually exclusive.
7. Homogenous alternatives in terms of content are included in the items.
8. The alternatives are free from clues as to which response is correct.
9. The grammar of each alternative is consistent with the stem.
10. The alternatives are kept in parallel form.
11. As much as possible the alternatives are kept at similar length.
12. Verbatim and textbook phrasing is avoided in stating the stem and the
alternatives.
13. There is a general avoidance of inclusion of specific determiners and key
terms.
14. Almost all the alternatives in each of the items are plausible.
15. In general, “all of the above” and “none of the above” are avoided as
alternatives.
16. Each item includes one and only one correct or clearly best answer in each
item.
17. The answer in each of the alternative positions approximately has an equal
number of times, in a random order.
18. Lay-out and format of the items are clear and in a consistent manner.
19. Proper use of grammar, punctuation, and spelling is observed.
20. In general, unnecessary difficult vocabulary is avoided.
General comments on the revision:
______________________________
Evaluator
(Signature over printed name)
SEM
Physics
39 The Manila Journal of Science
Physics
VOL. 7 NO. 2
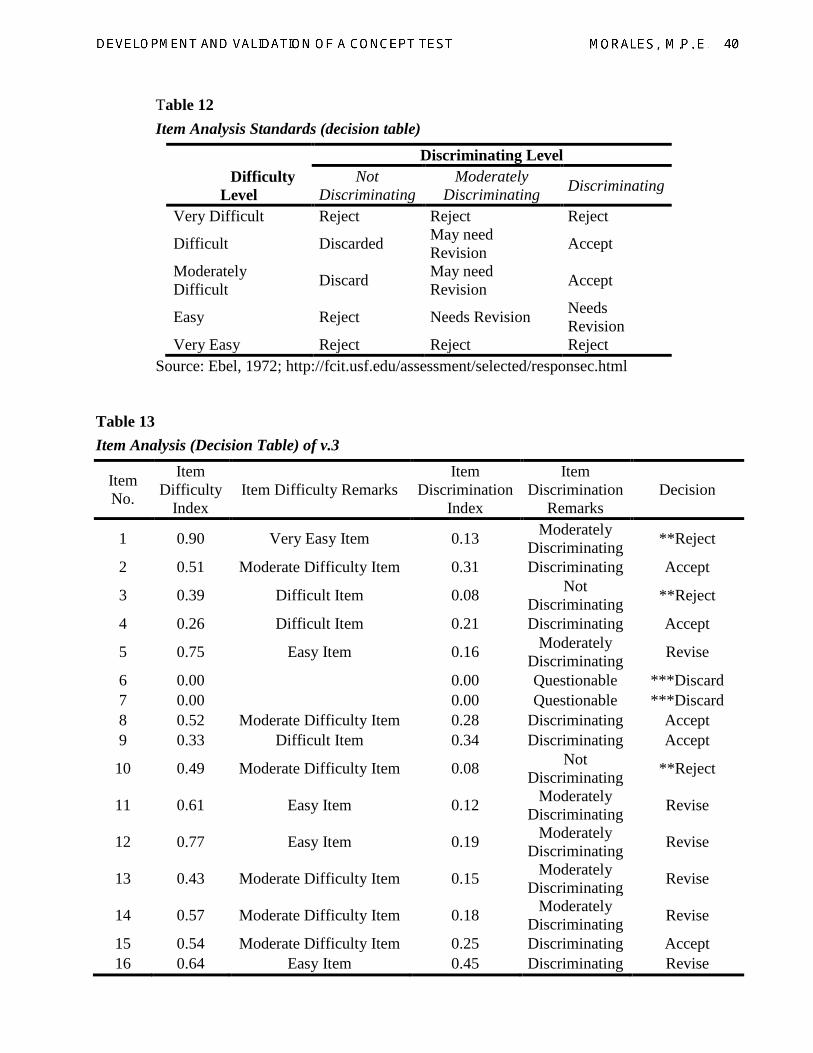
Table 12
Item Analysis Standards (decision table)
Difficulty
Level
Discriminating Level
Not
Discriminating
Moderately
Discriminating Discriminating
Very Difficult Reject Reject Reject
Difficult Discarded May need
Revision Accept
Moderately
Difficult Discard
May need
Revision Accept
Easy Reject Needs Revision Needs
Revision
Very Easy Reject Reject Reject
Source: Ebel, 1972; http://fcit.usf.edu/assessment/selected/responsec.html
Table 13
Item Analysis (Decision Table) of v.3
Item
No.
Item
Difficulty
Index
Item Difficulty Remarks
Item
Discrimination
Index
Item
Discrimination
Remarks
Decision
1 0.90 Very Easy Item 0.13 Moderately
Discriminating **Reject
2 0.51 Moderate Difficulty Item 0.31 Discriminating Accept
3 0.39 Difficult Item 0.08 Not
Discriminating **Reject
4 0.26 Difficult Item 0.21 Discriminating Accept
5 0.75 Easy Item 0.16 Moderately
Discriminating Revise
6 0.00
0.00 Questionable ***Discard
7 0.00
0.00 Questionable ***Discard
8 0.52 Moderate Difficulty Item 0.28 Discriminating Accept
9 0.33 Difficult Item 0.34 Discriminating Accept
10 0.49 Moderate Difficulty Item 0.08 Not
Discriminating **Reject
11 0.61 Easy Item 0.12 Moderately
Discriminating Revise
12 0.77 Easy Item 0.19 Moderately
Discriminating Revise
13 0.43 Moderate Difficulty Item 0.15 Moderately
Discriminating Revise
14 0.57 Moderate Difficulty Item 0.18 Moderately
Discriminating Revise
15 0.54 Moderate Difficulty Item 0.25 Discriminating Accept
16 0.64 Easy Item 0.45 Discriminating Revise
Physics
40
Physics
MORALES, M.P. E.
SEM
Physics
DEVELOPMENT AND VALIDATION OF A CONCEPT TEST

17 0.66 Easy Item 0.35 Discriminating Revise
18 0.26 Difficult Item 0.07 Not
Discriminating **Reject
19 0.48 Moderate Difficulty Item -0.08 Not
Discriminating **Reject
20 0.33 Difficult Item 0.01 Not
Discriminating **Reject
21 0.41 Moderate Difficulty Item 0.37 Discriminating Accept
22 0.38 Difficult Item 0.18 Moderately
Discriminating Revise
23 0.69 Easy Item 0.09 Not
Discriminating **Reject
24 0.31 Difficult Item 0.17 Moderately
Discriminating Revise
25 0.41 Moderate Difficulty Item 0.11 Moderately
Discriminating Revise
26 0.52 Moderate Difficulty Item 0.21 Discriminating Revise
27 0.26 Difficult Item -0.06 Not
Discriminating **Reject
28 0.43 Moderate Difficulty Item 0.08 Not
Discriminating **Reject
29 0.52 Moderate Difficulty Item 0.35 Discriminating Accept
30 0.21 Difficult Item 0.30 Discriminating Accept
31 0.38 Difficult Item 0.18 Moderately
Discriminating Revise
32 0.43 Moderate Difficulty Item 0.28 Discriminating Accept
33 0.26 Difficult Item 0.07 Not
Discriminating **Reject
34 0.52 Moderate Difficulty 0.35 Discriminating Accept
35 0.69 Easy 0.28 Discriminating Revise
36 0.67 Easy 0.32 Discriminating Revise
37 0.51 Moderate Difficulty 0.38 Discriminating Accept
38 0.52 Moderate Difficulty Item 0.15 Moderately
Discriminating Revise
39 0.41 Moderate Difficulty Item 0.37 Discriminating Accept
40 0.25 Difficult Item 0.17 Moderately
Discriminating Revise
41 0.08 Very Difficult -0.10 Not
Discriminating **Reject
42 0.36 Difficult Item 0.14 Moderately
Discriminating Revise
43 0.26 Difficult Item 0.40 Discriminating Accept
44 0.00
0.00 Questionable ***Discard
45 0.49 Moderate Difficulty Item 0.21 Discriminating Accept
46 0.00
0.00 Questionable **Reject
47 0.00
0.00 Questionable **Reject
SEM
Physics
41 The Manila Journal of Science
Physics
VOL. 7 NO. 2

48 0.79 Easy Item 0.16 Moderately
Discriminating Revise
49 0.52 Moderate Difficulty Item 0.21 Discriminating Accept
50 0.44 Moderate Difficulty Item 0.38 Discriminating Accept
51 0.23 Difficult Item -0.06 Moderately
Discriminating Revise
52 0.46 Moderate Difficulty Item 0.47 Discriminating Accept
53 0.46 Moderate Difficulty Item 0.02 Moderately
Discriminating Revise
54 0.66 Easy Item 0.48 Discriminating Revise
55 0.66 Easy Item 0.55 Discriminating Revise
56 0.49 Moderate Difficulty 0.48 Discriminating Accept
57 0.44 Moderate Difficulty -0.02 Not
Discriminating Reject
58 0.54 Moderate Difficulty 0.44 Discriminating Accept
59 0.52 Moderate Difficulty 0.41 Discriminating Accept
60 0.62 Easy 0.41 Discriminating Revise
61 0.34 Difficult 0.31 Discriminating Accept
62 0.56 Moderate Difficulty 0.22 Discriminating Accept
63 0.56 Moderate Difficulty 0.41 Discriminating Accept
64 0.33 Difficult 0.08 Moderately
Discriminating Revise
65 0.64 Easy 0.38 Discriminating Revise
66 0.56 Moderate Difficulty 0.28 Discriminating Accept
67 0.56 Moderate Difficulty 0.35 Discriminating Accept
Physics
42
Physics
MORALES, M.P. E.
SEM
Physics
DEVELOPMENT AND VALIDATION OF A CONCEPT TEST
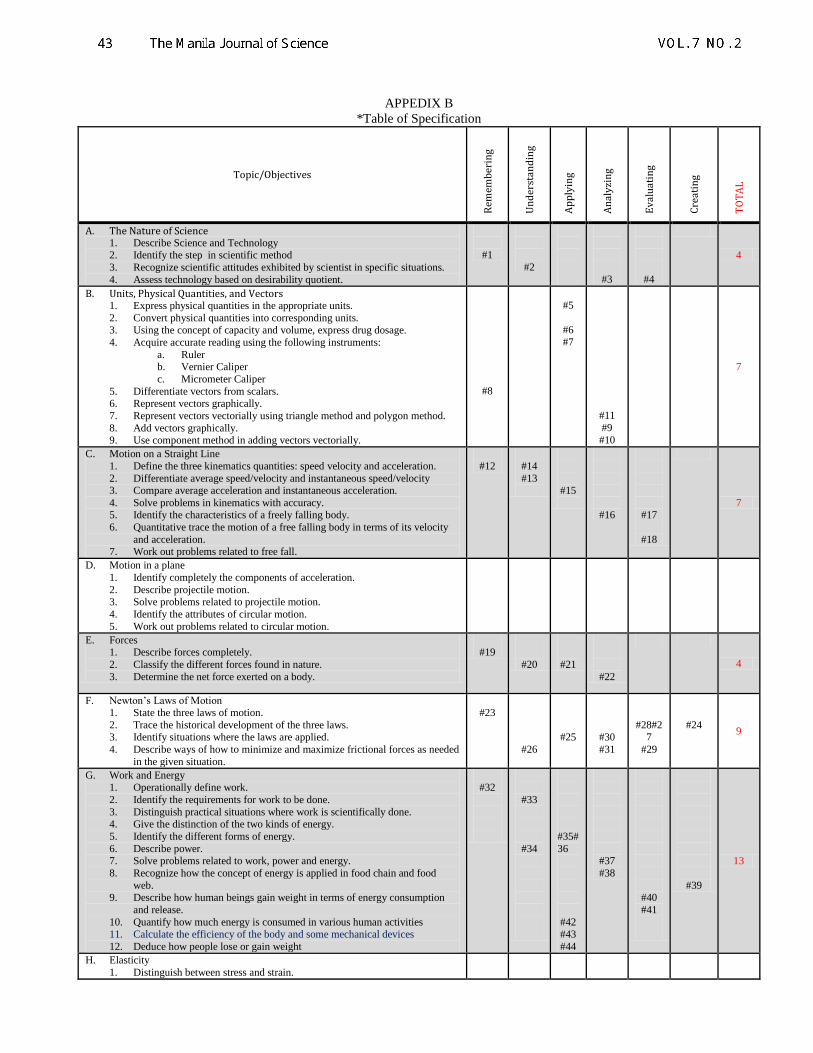
APPEDIX B
*Table of Specification
Topic/Objectives
Rem
emb
erin
g
Un
der
stan
din
g
Ap
ply
ing
An
aly
zin
g
Ev
alu
atin
g
Cre
atin
g
TO
TA
L
A. The Nature of Science 1. Describe Science and Technology 2. Identify the step in scientific method
3. Recognize scientific attitudes exhibited by scientist in specific situations.
4. Assess technology based on desirability quotient.
#1
#2
#3
#4
4
B. Units, Physical Quantities, and Vectors 1. Express physical quantities in the appropriate units.
2. Convert physical quantities into corresponding units.
3. Using the concept of capacity and volume, express drug dosage.
4. Acquire accurate reading using the following instruments:
a. Ruler b. Vernier Caliper
c. Micrometer Caliper
5. Differentiate vectors from scalars. 6. Represent vectors graphically.
7. Represent vectors vectorially using triangle method and polygon method.
8. Add vectors graphically. 9. Use component method in adding vectors vectorially.
#8
#5
#6 #7
#11
#9
#10
7
C. Motion on a Straight Line
1. Define the three kinematics quantities: speed velocity and acceleration.
2. Differentiate average speed/velocity and instantaneous speed/velocity 3. Compare average acceleration and instantaneous acceleration.
4. Solve problems in kinematics with accuracy. 5. Identify the characteristics of a freely falling body.
6. Quantitative trace the motion of a free falling body in terms of its velocity
and acceleration. 7. Work out problems related to free fall.
#12
#14
#13
#15
#16
#17
#18
7
D. Motion in a plane
1. Identify completely the components of acceleration.
2. Describe projectile motion. 3. Solve problems related to projectile motion.
4. Identify the attributes of circular motion.
5. Work out problems related to circular motion.
E. Forces 1. Describe forces completely.
2. Classify the different forces found in nature.
3. Determine the net force exerted on a body.
#19
#20
#21
#22
4
F. Newton’s Laws of Motion 1. State the three laws of motion.
2. Trace the historical development of the three laws. 3. Identify situations where the laws are applied.
4. Describe ways of how to minimize and maximize frictional forces as needed
in the given situation.
#23
#26
#25
#30
#31
#28#27
#29
#24 9
G. Work and Energy
1. Operationally define work.
2. Identify the requirements for work to be done.
3. Distinguish practical situations where work is scientifically done. 4. Give the distinction of the two kinds of energy.
5. Identify the different forms of energy.
6. Describe power. 7. Solve problems related to work, power and energy.
8. Recognize how the concept of energy is applied in food chain and food
web. 9. Describe how human beings gain weight in terms of energy consumption
and release.
10. Quantify how much energy is consumed in various human activities 11. Calculate the efficiency of the body and some mechanical devices
12. Deduce how people lose or gain weight
#32
#33
#34
#35#
36
#42 #43
#44
#37
#38
#40
#41
#39
13
H. Elasticity
1. Distinguish between stress and strain.
SEM
Physics
43 The Manila Journal of Science
Physics
VOL. 7 NO. 2

2. Operationally define Hooke’s law.
3. Explain the significance of modulus of intensity.
4. Describe the strength of materials using modulus of intensity.
I. Hydrostatics
1. Define density operationally.
2. Manipulate/read hydrometers to determine the density of several liquids.
3. Perform simple activity to determine the behavior of common liquids and
solid in water.
4. Conduct simple experiment to observe relation of specific gravity and
capability of solids and liquids to float in other liquids.
5. Inferring from simple experiments how fluid pressure is affected by the
density of the liquid, acceleration due to gravity and depth of the liquid.
6. Solve problems related to Pressure and Pascal’s principle
7. Identify applications of buoyancy and pressure
8. Describe surface tension.
9. Identify applications of surface tension.
10. Completely illustrate Bernoulli’s principle.
11. Conduct simple experiments to verify Bernoulli’s principle.
#45
#52
#47
#53
#49
#46
#48
#50
#51
9
J. Temperature and Heat
1. Differentiate Heat from temperature.
2. Describe the different thermometric scales.
3. Identify the different kinds of thermometers
4. Determine the thermometric readings of different substances.
5. Convert temperature readings from one thermometric scale to another.
6. Determine the different effects of heat on substances:
a. Expansion
b. Phase change
7. Work out problems related to expansion and phase changes.
#54
#65
#55
#67
#56
#63
#64
#57 #58
#59
#61
#62
#66
#60
14
TOTAL 67
# - item number
*The course does not include topics on electricity and magnetism, modern physics, optics and sound. These are topics for the next
Physics course (Physics 42)
Physics
44
Physics
MORALES, M.P. E.
SEM
Physics
DEVELOPMENT AND VALIDATION OF A CONCEPT TEST