Development and implementation of a method to predict the air traffic in Africa for the year 2020...
92
Studienarbeit Aus dem Prüfungsfach Flugsicherung Development and implementation of a method to predict the air traffic in Africa for the year 2020 and its impact on the upper airspace using RAMS Plus RAMS Plus is a software designed by ISA Software Ltd St. George’s House 38 215-219 Chester Road M15 4JE Manchester United Kingdom Betreuer: Prof. Dr.-Ing. Gerhard Hüttig Dipl.-Ing. Björn Appel vorgelegt an der Technischen Universität Berlin Fachgebiet Flugführung und Luftverkehr von: Tobias Wulff Trützschlerstraße 2 12487 Berlin Matrikelnummer: 30 06 58 Abgabetermin: 05.04.2011
-
Upload
tobiaswulff -
Category
Documents
-
view
100 -
download
0
description
This thesis is aimed at identifying the present situation of airspace usage in EAC and SADC countries and making a prediction for the year 2020. RAMS Plus is used for the simulation process and the subsequent analyses. Air traffic is seen as a strong contributor to economic development and is therefore of major importance for the countries in the geographical area covered. Airspace capacity does not solely relate to dimension. Restrictions are imposed by operational and safety aspects. The question that has to be answered finally: Is ATC in the EAC and SADC able to handle the traffic grow that can be expected in the coming years?
Transcript of Development and implementation of a method to predict the air traffic in Africa for the year 2020...
Studienarbeit
Aus dem Prüfungsfach
Flugsicherung
Development and implementation of a method
to predict the air traffic in Africa for the year 2020 and
its impact on the upper airspace
using RAMS Plus
RAMS Plus is a software designed by
ISA Software Ltd St. George’s House 38 215-219 Chester Road M15 4JE Manchester
United Kingdom
Betreuer:
Prof. Dr.-Ing. Gerhard Hüttig
Dipl.-Ing. Björn Appel
vorgelegt an der Technischen Universität Berlin
Fachgebiet Flugführung und Luftverkehr
von: Tobias Wulff Trützschlerstraße 2
12487 Berlin Matrikelnummer: 30 06 58 Abgabetermin: 05.04.2011

PAGE II
TABLE OF CONTENTS
TABLE OF CONTENTS
TABLE OF CONTENTS ....................................................................... II
LIST OF FIGURES ............................................................................ V
LIST OF TABLES .......................................................................... VIII
ABBREVIATIONS ............................................................................ IX
ABSTRACT .................................................................................... XI
EXTRAKT ...................................................................................... XI
1 INTRODUCTION .............................................................................. 13
1.1 Motivation .......................................................................................................... 13
1.2 Background ....................................................................................................... 13
1.2.1 Air traffic in Africa .......................................................................................... 13
1.2.2 Geographical area covered ........................................................................... 14
1.2.3 Navigation ..................................................................................................... 15
1.2.4 Surveillance .................................................................................................. 17
1.3 Requirements .................................................................................................... 17
2 METHODOLOGY ............................................................................ 19
2.1 RAMS Plus 5.0 .................................................................................................. 19
2.1.1 Data integration............................................................................................. 23
2.1.2 Aircraft performance ..................................................................................... 23
2.2 Scenario ............................................................................................................ 25
2.2.1 Airspace ........................................................................................................ 25
2.2.1.1 Special use airspace ................................................................................ 29
2.2.1.2 Navigation data ........................................................................................ 30
2.2.2 Airport operations .......................................................................................... 30
2.2.3 Controllers .................................................................................................... 32
2.2.3.1 Rulebase definition ................................................................................... 32
2.2.3.2 Detection geometry models ...................................................................... 36
2.2.3.3 Detection multipliers ................................................................................. 37

PAGE III
TABLE OF CONTENTS
2.2.4 Traffic ............................................................................................................ 37
2.2.4.1 Traffic data ............................................................................................... 37
2.2.4.2 Traffic growth ........................................................................................... 41
3 ANALYSIS AND RESULTS ................................................................ 46
3.1 Restrictions ........................................................................................................ 47
3.2 Traffic flow ......................................................................................................... 49
3.3 Initial Situation (2010) ........................................................................................ 50
3.3.1 Planning controllers ...................................................................................... 50
3.3.2 Tactical controllers ........................................................................................ 54
3.4 Adjustment of scenario ...................................................................................... 57
3.5 Predicted Situation (2020) ................................................................................. 59
3.5.1 Antananarivo ................................................................................................. 59
3.5.2 Beira ............................................................................................................. 60
3.5.3 Dar es Salaam .............................................................................................. 60
3.5.4 Entebbe ........................................................................................................ 63
3.5.5 Gaborone ...................................................................................................... 63
3.5.6 Harare ........................................................................................................... 64
3.5.7 Kinshasa ....................................................................................................... 66
3.5.8 Lilongwe ........................................................................................................ 68
3.5.9 Luanda .......................................................................................................... 69
3.5.10 Lusaka .......................................................................................................... 69
3.5.11 Matsapha ...................................................................................................... 70
3.5.12 Mauritius ....................................................................................................... 71
3.5.13 Nairobi .......................................................................................................... 71
3.5.14 Seychelles..................................................................................................... 73
3.5.15 Windhoek ...................................................................................................... 74
4 VALIDATION .................................................................................. 75
4.1 RAMS Plus ........................................................................................................ 75
4.2 Scenario ............................................................................................................ 76
5 SUMMARY .................................................................................... 78
PAGE IV
TABLE OF CONTENTS
REFERENCES ................................................................................ 79
APPENDIX 1 .................................................................................. 83
APPENDIX 2 .................................................................................. 84
APPENDIX 3 .................................................................................. 85
APPENDIX 4 .................................................................................. 86
APPENDIX 5 .................................................................................. 86
APPENDIX 6 .................................................................................. 87
APPENDIX 7 .................................................................................. 89
APPENDIX 8 .................................................................................. 90
APPENDIX 9 .................................................................................. 92

PAGE V
LIST OF FIGURES
LIST OF FIGURES
Figure 1 : ESAF ................................................................................................................... 14
Figure 2 : Geographical area covered .................................................................................. 15
Figure 3 : Areas of routing12
................................................................................................. 16
Figure 4: Actual state of surveillance capabilities12
.............................................................. 18
Figure 5: Controller windows................................................................................................ 21
Figure 6 : Detection geometry models ................................................................................. 22
Figure 7: Separation priorities .............................................................................................. 22
Figure 8: True air speed ...................................................................................................... 24
Figure 9: Rate of climb ......................................................................................................... 24
Figure 10: Rate of descent .................................................................................................. 25
Figure 11: Traffic load with single Nairobi control sector ...................................................... 27
Figure 12: Traffic load with splitted Nairobi control sectors .................................................. 27
Figure 13: Restricted airspaces ........................................................................................... 30
Figure 14: Controller rule Level_Off_Lower_Flight_In_Crossing_Conflict ........................... 35
Figure 15: Geometric conflict classification diagram ............................................................ 36
Figure 16: Number of international non-scheduled flights .................................................... 38
Figure 17: Number of international scheduled flights ........................................................... 39
Figure 18: Number of international scheduled flights of selected airlines ............................. 40
Figure 19: Departing and arriving seats per hour at O.R. Tambo International Airport ......... 40
Figure 20: Departing and arriving seats per hour at Jomo Kenyatta Intl. Airport .................. 41
Figure 21: Comparison of different growth rates .................................................................. 42
Figure 22: Comparison of GDP per capita growth versus Inflation ....................................... 43
Figure 23: Movement growth calculation per country ........................................................... 45
Figure 24: Traffic distribution by sector entries .................................................................... 46
Figure 25: Sectors excessing workload of 55% 2010 ........................................................... 47
Figure 26: Sectors excessing workload of 55% 2020 ........................................................... 48
Figure 27: Main traffic flows (RAMS screenshot) ................................................................. 49
Figure 28: Taskload of planning controllers 2010 ................................................................ 50
Figure 29: Segmentation of workload Dar es Salaam East Planning Controller ................... 51
Figure 30: Trafficflow Gaborone and Harare ACC per sliding hour ...................................... 52
Figure 31: Comparison of workload and traffic peaks in Nairobi ACC2 ................................ 53
Figure 32: Entry and exit of flights to and from Nairobi ACC2 .............................................. 53

PAGE VI
LIST OF FIGURES
Figure 33: Tasks of Nairobi ACC 2 planning controller ........................................................ 54
Figure 34: Taskload of tactical controllers 2010 ................................................................... 54
Figure 35: Sector entry and exit to and from Dar es Salaam East ....................................... 55
Figure 36: Tasks and conflict situations between 18:00 and 19:00 of Dar es Salaam East tactical controller .................................................................................................................. 56
Figure 37: Gaborone and Harare sector tasks and traffic .................................................... 56
Figure 38: Distribution of tasks Dar es Salaam East planning controller .............................. 57
Figure 39: Comparison of taskloads before and after adjustment ........................................ 58
Figure 40: Comparison of taskloads Antananarivo............................................................... 59
Figure 41: Comparison of taskloads Beira ........................................................................... 60
Figure 42: Comparison of taskloads Dar es Salaam East .................................................... 61
Figure 43: Movements at major airports Dar es Salaam East (18:00-22:30) ........................ 61
Figure 44: Comparison of taskloads Dar es Salaam West ................................................... 62
Figure 45: Traffic by entry and exit FL Dar es Salaam West (arranged by sector entry times) ............................................................................................................................................ 62
Figure 46: Comparison of taskloads Entebbe ...................................................................... 63
Figure 47: Traffic by intention Entebbe ................................................................................ 63
Figure 48: Comparison of taskloads Gaborone .................................................................... 64
Figure 49: New flights crossing Gaborone ........................................................................... 64
Figure 50: Comparison of taskloads Harare ........................................................................ 65
Figure 51: Comparison of taskloads Kinshasa ..................................................................... 66
Figure 52: Comparison of taskloads Kisangani .................................................................... 67
Figure 53: Comparison of taskloads Lubumbashi ................................................................ 67
Figure 54: Comparison of taskloads Lilongwe ..................................................................... 68
Figure 55: Number of flights crossing Lilongwe sector ......................................................... 68
Figure 56: Comparison of taskloads Luanda........................................................................ 69
Figure 57: Comparison of taskloads Lusaka ........................................................................ 69
Figure 58: Taskload of tactical controller vs. traffic entering Lusaka sector ......................... 70
Figure 59: Comparison of taskloads Matsapha .................................................................... 70
Figure 60: Comparison of taskloads Mauritius ..................................................................... 71
Figure 61: Comparison of taskloads Nairobi ACC1 .............................................................. 72
Figure 62: Comparison of taskloads Nairobi ACC2 .............................................................. 72
Figure 63: Comparison of taskloads Nairobi ACC3 .............................................................. 73
Figure 64: Comparison of taskloads Seychelles .................................................................. 73
Figure 65: Comparison of taskloads Windhoek North .......................................................... 74

PAGE VII
LIST OF TABLES
Figure 66: Comparison of taskloads Windhoek South ......................................................... 74
Figure 67: Route usage 2020 (more than 20 flights per day) ............................................... 76

PAGE VIII
LIST OF TABLES
LIST OF TABLES
Table 1: Airport capacity (examples) .................................................................................... 31
Table 2: Tactical controller rulegroups ................................................................................. 34
Table 3: Flights crossing Harare .......................................................................................... 65

PAGE IX
ABBREVIATIONS
ABBREVIATIONS
ACAS Airborne Collision Avoidance System
ACT Activation Message
ADS Automatic Dependent Surveillance
ADS-B ADS Broadcast
ADS-C ADS Contract
AFI Africa-Indian Ocean Region
AICD Africa Infrastructure Country Diagnostic
ANSP Air Navigation Service Provider
APIRG AFI Planning and Implementation Regional Group
APV Approach with Vertical Guidance
ASECNA L'Agence pour la Sécurité de la Navigation aérienne en Afrique et à Madagascar
ASK Available Seat Kilometers
ATC Air Traffic Control
ATFM Air Traffic Flow Management
ATM Air Traffic Management
ATS Air Traffic Services
BADA Base of Aircraft Data
CNS Communications, Navigation, Surveillance
CPDLC Controller Pilot Datalink Communications
DRC Democratic Republic of the Congo
EAC East African Community
ESAF Eastern and Southern African Office of the ICAO, Nairobi, Kenya
FIR Flight Information Region
FL Flight Level
FY Fiscal Year
GANP Global Air Navigation Plan, Doc 9750, ICAO
GDP Gross Domestic Product
ICAO International Civil Aviation Organization
MSP Multi Sector Planner
NOTAM Notice To Airmen
PBN Performance Based Navigation
PAGE X
ABSTRACT
PPP Purchasing Power Parity
RF Radius-to-Fix
RNAV Area Navigation
RNP Required Navigation Performance
ROC Rate Of Climb
ROD Rate Of Descent
RPK Revenue Passenger Kilometres
RVSM Reduced Vertical Separation Minima
RWY Runway
SADC Southern African Development Community
SBAS Satellite Based Augmentation System
SID Standard Instrument Departure Route
STAR Standard Arrival Route
SUA Special Use Airspace
TAS True Air Speed
TMA Terminal Area
TWY Taxiway
UTC Universal Time Coordinated
VHF Very High Frequency
VNAV Vertical Navigation
WACAF Western and Central African Office of the ICAO, Dakar, Senegal

PAGE XI
ABSTRACT
ABSTRACT
This thesis is aimed at identifying the present situation of airspace usage in EAC and SADC countries and making a prediction for the year 2020. RAMS Plus is used for the simulation process and the subsequent analyses in order to evaluate its suitability for this kind of anal-yses. Air traffic is seen as a strong contributor to economic development and is therefore of major importance for the countries in the geographical area covered. Airspace capacity does not solely relate to dimension. Restrictions are imposed by operational and safety aspects. The question that has to be answered finally: Is ATC in the EAC and SADC able to handle the traffic grow that can be expected in the coming years?
EXTRAKT
Diese Arbeit verfolgt zwei Ziele. Bevor näher darauf eingegangen wird, ist es notwendig, ein übergreifendes Problem, welches bereits in der Vorbereitung der Simulationen festgestellt wurde, zu erwähnen. Die Datengrundlage für fast alle Aspekte der Arbeit ist Beschränkun-gen unterworfen. Diese ergeben sich in erster Linie aus der unzureichenden statistischen Arbeit und den Beschränkungen in der Informationspolitik der beteiligten Akteure. Daher war es notwendig, wiederholt bergründete Annahmen zu treffen. Eine Bewertung ob der Güte der Annahmen kann, unter der Voraussetzung zur Verfügung stehender Daten, erst im Nachhinein erfolgen.
Das erste Ziel der Arbeit soll eine Bewertung von RAMS Plus als Simulationsprogramm in Hinblick auf die vorliegende und weiterführende Untersuchungen erfolgen. Im Laufe der Si-mulationen wurde die Komplexität der Simulationsumgebung sukzessive gesteigert. Die Möglichkeiten der Software sind damit bei weitem noch nicht erschöpft. Es ist festzustellen, dass zu Beginn eine Entscheidung hinsichtlich des Umfangs notwendig ist. Dieser Umfang orientiert sich stark an den Zielen, die zu erreichen, angestrebt wird. Auch wenn grundsätz-lich die Möglichkeit besteht, Lufträume und Flughäfen mit hohem Detailgrad zu simulieren, sollte dies den Notwendigkeiten angepasst werden. Einerseits reduziert dies den Aufwand in der Vorbereitung der Datenbasis, andererseits wird die Übersichtlichkeit der am Ende zur Auswertung bereitgestellten Daten gewährleistet. Eine große Datenmenge führt leicht zu Fehlinterpretationen oder Überbewertungen einzelner Aspekte.
In der vorliegenden Arbeit wird ein Mittelweg angestrebt indem der zu untersuchende Luft-raum vertikal beschränkt wird. Ein Zugeständnis wird jedoch bezüglich der Flughafenkapazi-tät gemacht. Dies geschieht in der Absicht eine übermäßige Belastung durch an- und abflie-gende Verkehre zu verhindern. Im Rahmen der Analyse ergibt sich jedoch, dass dies keine ausreichende Maßnahme darstellt. Dem wird dahingehend Rechnung getragen, dass ent-sprechende Situationen identifiziert und Auswertungsergebnisse als überbewertet gekenn-zeichnet werden. Die Einbeziehung von An- und Abflugrouten mit definierten Staffelungen widerspricht dem Ansatz, die Simulation auf ein Mittelmaß an Detailliertheit zu beschränken. Darüber hinaus sind qualitative Schlussfolgerungen ohne weiteres möglich. Des Weiteren sind Luftraumgrenzen sehr detailliert implementiert. Dies ist grundsätzlich nicht notwendig. In diesem Fall wird es jedoch als sinnvoll angesehen, da im Vorfeld ein Einfluss auf die Arbeits-last vermutet wurde. Die Untersuchungsergebnisse bestätigen die Vermutung. Auch wenn kurzzeitige Sektoreinflüge zumeist auf Grundlage von bilateralen Absprachen ohne den Übergang der taktischen Kontrolle über ein Luftfahrzeug bearbeitet werden, stellt die Über-wachung dieses Verkehrs dennoch eine Arbeitsbelastung dar.
Eine wesentliche Erweiterung zur Datengrundlage die RAMS Plus zur Verfügung stellt, ist die Einführung von Flugverkehrskontrolllotsen, denen ausschließlich nicht radargestütze Staffelungsverfahren zur Verfügung stehen. Dazu wurden Anpassungen in der Beschrei-bung der simulierten Arbeitsweisen durchgeführt.

PAGE XII
EXTRAKT
Das zweite Ziel ist die Analyse der Verkehrs- und Luftraumsituation für einen Vorhersage-zeitraum von etwa zehn Jahren. Hierfür ist zunächst die Erstellung einer hinreichend validen Datenbasis notwendig. Auf Beschränkungen, die hinsichtlich der Datenakquise bestehen, wurde oben hingewiesen.
Die am kritischsten zu hinterfragenden Datensätze betreffen zum einen die Arbeitsweise der Flugverkehrskontrolllotsen. Lokale Absprachen, wie oben erwähnt, sind nicht öffentlich zu-gängig und können daher nicht in der Simulation berücksichtigt werden. Dies ist insbesonde-re im Hinblick auf die Situation im Luftraum Südafrikas problematisch. Die Auswertungser-gebnisse stellten sich als unzuverlässig und unrealistisch heraus. Daher wurde auf eine wei-tere Analyse dieses Luftraumes verzichtet. Der südafrikanische Flugsicherungsanbieter ist darüber hinaus operationell und technisch das am weitesten entwickelte Unternehmen im Untersuchungsgebiet. Daher ist anzunehmen, dass existierende und zukünftige Engpässe, die sich vornehmlich im nationalen Verkehr ergeben, nicht im Rahmen von regionalen Ko-operationen gelöst werden und somit für die Gesamtsituation des Untersuchungsgebietes von geringer Relevanz sind.
Zum anderen ist auch die Prognose für die Steigerung des Verkehrs bis zum Jahr 2020 kri-tisch zu bewerten. Es wird versucht, einen vertretbaren Ansatz zu finden. Verlässliche Zah-len seitens der Flugsicherungsanbieter existieren nicht. Daher wird auf einer sicheren Grundlage eine neue Vorhersagestrategie entworfen. Dies kann in zweierlei Hinsicht vertre-ten werden.
Prognosen über einen Zeitraum von zehn Jahren für einen volatilen Markt wie den Luftverkehr in einem volatilen Umfeld wie Süd- und Ostafrika können nur eine be-grenzte Belastbarkeit aufweisen.
Das Erreichen der Kapazitätsgrenze eines Luftraumes kann entweder über einen Zeit-punkt (vgl. Bemerkung zu Verlässlichkeit von Prognosen) oder eine maximal be-herrschbare Verkehrssteigerung ausgedrückt werden.
Das Ergebnis der Arbeit zeigt, dass für den Verkehrszuwachs in den kommenden Jahren ausreichend Kapazitäten zur Verfügung stehen. Diese Kapazitäten sind jedoch sehr ungleich verteilt und die Grenzen werden in einigen Bereichen in absehbarer Zeit erreicht sein. Daher sind Veränderungen in der Struktur der Luftraumorganisation und Kontrolle unabdingbar. Untersuchungen zu möglichen Alternativen wären wünschenswert und im Sinne der beteilig-ten Staaten, Luftraumnutzer und Passagiere.

INTRODUCTION PAGE 13
MOTIVATION
1 INTRODUCTION
1.1 MOTIVATION
In June 2003 the fourteenth meeting of the Africa-Indian Ocean Region (AFI) Planning and Implementation Regional Group (APIRG) considered the concept of a “single sky” for the AFI region. What does that mean?
“Harmonization of air traffic management systems and procedures, including human resource and training plans and programmes;
Rationalization of areas of service;
Establishment of cooperative arrangements between ATS providers;
Eventual consolidation of cooperative models for the provision of air traffic services […]”
1.
Since then progress has been made. ATS routes have been and continue to be aligned with user requests
2. During APIRG/17 held 2-6 August 2010 the PBN Task Force was mandated
with the development of an airspace concept based on the AFI PBN regional implementation plan
3, in order to design and implement a trunk route network, connecting major city pairs in
the upper airspace and for transit to and from aerodromes, on the basis of PBN, e.g. RNAV 10 and RNAV 5 taking into account interregional harmonization
4 within the timeframe 2009 –
2012. So far no assessment of restrictions due to airspace and ATC capacity has been con-ducted. This is one objective of this thesis, the other one being to determine the suitability of RAMS Plus 5.0 for this and similar analyses.
1.2 BACKGROUND
1.2.1 AIR TRAFFIC IN AFRICA
Africa is the continent with the least share of world’s air traffic. Only 2.6% of international and domestic scheduled services are conducted by African airlines. Regarding international ser-vices only that share increases to 4%. Taking into account the fact that most African coun-tries are less densely populated than Europe or even North America it is noticeable that do-mestic air traffic obviously plays a minor role. African airlines offered 155 Billion seat kilome-tres on international and domestic routes in 2008
5, more than half of these on intra-African
flights. Total air traffic added up to around 330 Billion ASK6. Europe maintains to be the most
important intercontinental destination accounting for two-thirds of the traffic7. Both major air-
craft manufactures forecast a traffic growth above world average. Airbus expects the African
1 APIRG/14, Conclusion 14/30
2 PRND WG/1
3 AFI PBN Regional Implementation Plan, WP/7
4 APIRG/17, WP/7
5 ICAO: Annual Report of the Council, 2008, (p.98)
6 Boeing: Current Market Outlook, 2009-2028, (p.20)
7 Airbus: Global Market Forecast 2009-2028, (p.136)

INTRODUCTION PAGE 14
BACKGROUND
market to grow at 5.6% over the next 20 years8 with the Middle East and Asian markets to
be the most vibrant.
1.2.2 GEOGRAPHICAL AREA COVERED
The geographical area covered in this thesis includes the continental and oceanic airspaces of the Southern African Development Community (SADC) and East African Community (EAC) states. These communities are formed by the following countries: Angola, Botswana, Burundi, Democratic Republic of the Congo, Kenya, Lesotho, Madagascar, Malawi, Mauri-tius, Mozambique, Namibia, Rwanda, Seychelles, South Africa, Swaziland, Tanzania, Ugan-da, Zambia and Zimbabwe. They are marked black in Figure 2. Additionally the airspace above the Union of the Comoros will be included as it is located between Madagascar and Tanzania and therefore is closing a gap in the area examined.
Figure 1 : ESAF9
This has as well some congruency with the area of responsibility of the Eastern and South-ern African Office of the ICAO (ESAF). In cooperation with the Western and Central African Office (WACAF) their member states are working together in the APIRG. This group has been established to develop a regional plan for air navigation systems in accordance with the Global Air Navigation Plan
10 (GANP) of the ICAO as a step towards a global ATM sys-
tem. Planning and implementation is prepared by different sub-groups and by task forces for distinct problems.
Madagascar and the Comoros are member states of the Agency for Aerial Navigation Safety in Africa and Madagascar (ASECNA). ASECNA is the joint ATS provider for these two coun-tries and 15 West and Central African francophone states and has strong relations to France which is still a consultant member. Their airspaces have been restructured to operational needs for example by reducing the number of FIRs to six
11. But this did not take place in
interaction with an adjustment of ATS-routes to the requirements of airlines.
The high level of cooperation in the Western and Central parts of Africa is not implemented in the geographical area covered in this thesis making this region more interesting in regard to possible future airspace structure. The countries in the North of the continent share a common cultural and historical background. Basically relations are stronger to the Mediterra-nean region than to the countries of Sub-Saharan Africa. Taking these facts into account the selected area may be recognized as being somewhat self-contained.
Before going into the details of the scenario a general description of the technical and opera-tional situation of ATS in the geographical area covered shall be given, followed by an out-line of the goals pursued by the APIRG for the future.
8 Airbus: Global Market Forecast 2009-2028, (p.138)
9 ESAF
10 ICAO: Doc 9750, Appendix A
11 AIP ASECNA, ENR-2-1-01

INTRODUCTION PAGE 15
BACKGROUND
Figure 2 : Geographical area covered12
1.2.3 NAVIGATION
Navigation and routing in many African countries is still based on ground aids like VOR, DME and NDB. A reason for that is partly the equipage of aircraft used in commercial ser-vice within Africa. That causes two major problems. On the one hand it reduces the number of possible routings to direct connections between these facilities that often show considera-ble differences to economically and ecologically optimized great circle routes. On the other hand it requires high financial efforts to maintain the availability and accuracy of those facili-ties. Therefore ICAO set up the Performance Based Navigation (PBN) Programme
13 and the
Africa-Indian Ocean Region (AFI) States agreed on the implementation of these concepts on the 16
th APIRG meeting
14 by establishing a task force to develop an implementation plan.
Work on this plan has gone forward and the latest draft was accepted at the Second Joint Meeting of the APIRG Performance Based Navigation and Global Navigation Satellite Sys-tem Implementation Task Forces in Dakar, Senegal, 2-4 March 2010
15. The implementation
is planned to be divided into three phases: Near Term (2008-2012), Mid Term (2013-2016) and Long Term (2017 and Beyond).
It is important to notice that RVSM is fully implemented in the AFI Region since 25 Septem-ber 2008
16. Therefore only lateral navigation specifications are covered in this program.
12 Map
13 ICAO: PBN Programme
14 APIRG/16, Decision 16/2
15 AFI En-Route - Systems Evolution 1999-2010, Appendix A
16 ICAO: AFI Regional Report 2009, (p.25-29)

INTRODUCTION PAGE 16
BACKGROUND
1. Near Term (2008-2012)
RNAV 10/5 or RNP 4 where operationally required by 2010 for en-route oceanic and remote continental airspace
RNAV 5 or RNAV 1 where operationally required for continental airspace
RNAV 1 or RNP 1 in terminal airspace
RNP Approaches with barometrical VNAV or SBAS
The separation minima will consequently be reduced in correlation with safety assess-ments. The actual state of en-route navigation was presented at the Third Meeting of the APIRG Communications, Navigation and Surveillance Sub-Group in Nairobi, Kenya, 26-30 April 2010
17 and listed in Appendix 1. Areas of routing have been defined alongside
the most relevant flows of traffic in the GANP. The areas affected in this thesis are illus-trated in Figure 3.
Figure 3 : Areas of routing12
For many of the countries funding and issuing of associated policies is regarded challeng-ing. Especially airlines are requested to enhance their navigation equipment to be able to operate in the satellite based navigation environment. This can be supported by establish-ing more RNAV and RNP procedures at airports and en-route benefiting aircraft opera-tions and reducing communication workload because of seamless transitions to and from the ATS route system.
2. Mid Term (2013-2016)
Further increase in the required precision for en-route navigation to RNAV 5/2 or RNAV 1 in continental airspace
17 CNS/SG/3, WP/38

INTRODUCTION PAGE 17
REQUIREMENTS
Expand RNAV and RNP procedures in terminal airspaces and approaches
En-route airspace should be reviewed by the end of this phase and flexible use of air-space implemented. Benefits from assigning three-dimensional clearances in fuel-economics and conflict predictability will evolve. In terminal airspaces the establishment of satellite-based arrival and approach procedures will not only make conventional naviga-tion aids dispensable and thereby reduce maintenance costs for ANSPs but also allow departure and arrival management systems to be installed.
3. Long Term (2017 and beyond)
RNAV and RNP operations mandatory
The increased level of information exchange between aircraft and ATC will allow real air traffic management reducing the workload of controllers to monitoring the traffic flow and only taking action when required. This may be the case when a separation infringement is identified by the system or due to airspace usage restriction linked to meteorological con-ditions.
An overview of the implementation strategy is given in the table Appendix 2.
1.2.4 SURVEILLANCE
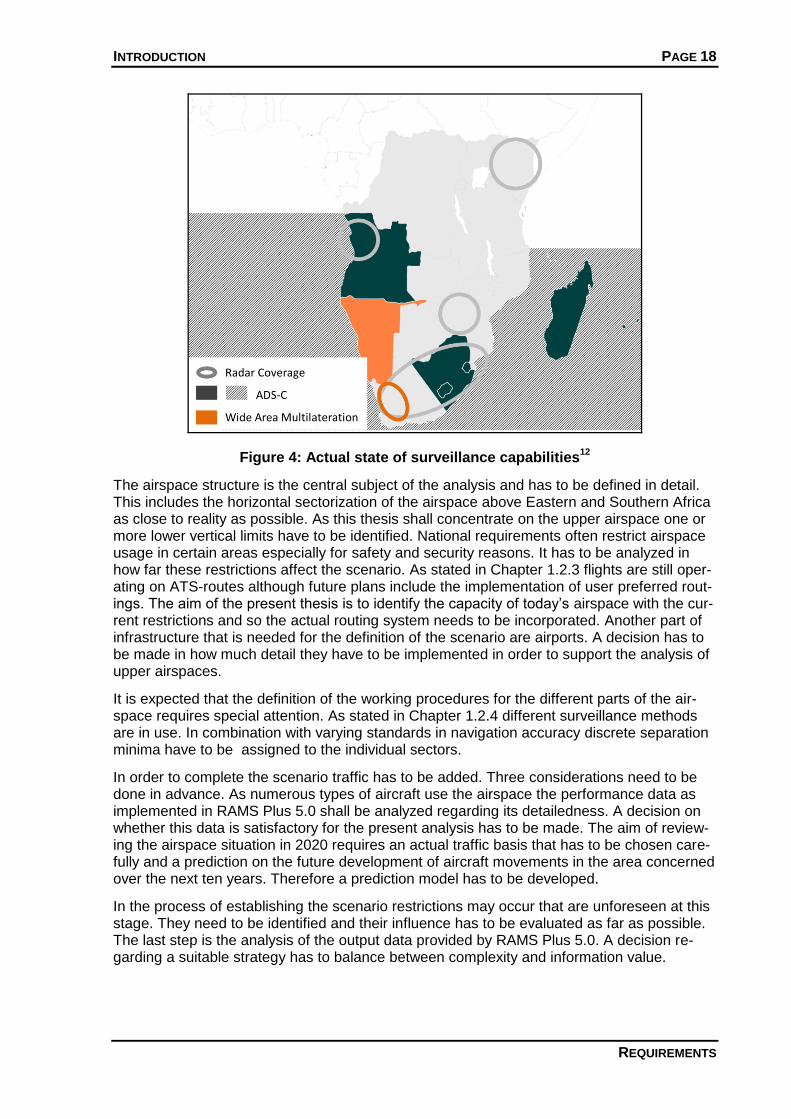
ATC in Africa is mostly performed by conventional control due to a lack of surveillance sys-tems. But progress has been made during recent years. This can be derived from the Infor-mation presented in the AFI En-Route - Systems Evolution 1999-2010 (cf. reference 17). Figure 4 shows the current state of surveillance capabilities in the area covered. Conven-tional ATC is based on time and/or distance to certain navigation points. For safety reasons separation between aircraft is increased in comparison to airspace covered and controlled with radar.
Surveillance of the South Atlantic is backed upon ADS. South Africa commenced trials with a prototype system in 1999. That system became operational in 2004
18. Until 2006 the oceanic
part of Luanda FIR was planned to be covered by ADS but implementation has been de-layed. The project is now scheduled for completion in mid-2010
19.
The north eastern part of the examined area is controlled mostly by conventional means. Only the Kenyan airspace is radar-covered to a recognisable extent
20.
The AFI Strategy for Aeronautical Surveillance21
is presented in Appendix 3.
1.3 REQUIREMENTS
Due to the dimension of the geographical area covered a large amount of data has to be assembled and prepared for usage in the scenario. At the same time the level of complexity should be restricted in order to facilitate the analysis process. The more complex the data input the more influences have to be taken into account when drawing conclusions from data output.
18 ADS-C/CPDLC implementation situation of the SAT States/FIRs 2006, Appendix D
19 SITA Highlights, Air Traffic Management (p.9)
20 Kenya Airspace Master Plan (p.40-42)
21 AFI Strategy for Aeronautical Surveillance, Appendix F
INTRODUCTION PAGE 18
REQUIREMENTS
Figure 4: Actual state of surveillance capabilities12
The airspace structure is the central subject of the analysis and has to be defined in detail. This includes the horizontal sectorization of the airspace above Eastern and Southern Africa as close to reality as possible. As this thesis shall concentrate on the upper airspace one or more lower vertical limits have to be identified. National requirements often restrict airspace usage in certain areas especially for safety and security reasons. It has to be analyzed in how far these restrictions affect the scenario. As stated in Chapter 1.2.3 flights are still oper-ating on ATS-routes although future plans include the implementation of user preferred rout-ings. The aim of the present thesis is to identify the capacity of today’s airspace with the cur-rent restrictions and so the actual routing system needs to be incorporated. Another part of infrastructure that is needed for the definition of the scenario are airports. A decision has to be made in how much detail they have to be implemented in order to support the analysis of upper airspaces.
It is expected that the definition of the working procedures for the different parts of the air-space requires special attention. As stated in Chapter 1.2.4 different surveillance methods are in use. In combination with varying standards in navigation accuracy discrete separation minima have to be assigned to the individual sectors.
In order to complete the scenario traffic has to be added. Three considerations need to be done in advance. As numerous types of aircraft use the airspace the performance data as implemented in RAMS Plus 5.0 shall be analyzed regarding its detailedness. A decision on whether this data is satisfactory for the present analysis has to be made. The aim of review-ing the airspace situation in 2020 requires an actual traffic basis that has to be chosen care-fully and a prediction on the future development of aircraft movements in the area concerned over the next ten years. Therefore a prediction model has to be developed.
In the process of establishing the scenario restrictions may occur that are unforeseen at this stage. They need to be identified and their influence has to be evaluated as far as possible. The last step is the analysis of the output data provided by RAMS Plus 5.0. A decision re-garding a suitable strategy has to balance between complexity and information value.

METHODOLOGY PAGE 19
RAMS PLUS 5.0
2 METHODOLOGY
2.1 RAMS PLUS 5.0
RAMS Plus (Reorganized ATC Mathematical Model Simulator) is a gate-to-gate fast-time simulation tool. This means that all processes regarding air traffic management connected to a flight apart from discrete ground-handling events can be analyzed. Although not relevant for this thesis, a short description of the tools available within RAMS Plus for the simulation of ground traffic shall be given.
Therefore airports have to be specified in more detail than present by default in the software package. Default data incorporates the Aerodrome Reference Points of many airports with a clear emphasis on Europe and the United States. There are two possible airport layers that can be used for analysis. The Airport Delay Model does not require any further descriptions but covers ground movements by using mathematical distributions incorporating standard movement times and allocatable variances.
The Airport Operational Model in addition to that can be refined by implementing runways in a first step. There are manifold properties that can be defined. Runway occupancy is either configured by time distributions or aircraft performance whichever is seen applicable. Anoth-er aspect influencing aircraft performance is the airport elevation. Also lock times before landing and after take-off may be incorporated. Due to different physical requirements con-nected to aircraft performance a runway usage strategy for multiple runway systems may be defined. Where a highly sophisticated environment is deemed necessary touchdown vari-ances and runway widths which may influence runway crossing times may be assigned.
The sequencing of flights using the same runway can be adjusted by using different resolu-tion strategies. In general arrivals are prioritized over departures. Resolution action of the controllers can be influenced by defining runway scheduling options, by identifying alternate runways or by assigning holdstacks to runways. The installation of SIDs and STARs to con-nect the initial approach fixes with the runways is another feature of the software that allows the detailed description and analysis of surrounding airspaces. Holdstacks are normally part of the arrival routes used for the runway. Flights using SIDs and STARs belonging to a run-way can of course be separated by time intervals depending on the capacity of the TMA air-space.
Connections between runways and gates are represented by ground links. They are defined between two ground nodes and may include different properties. By defining the physical properties and usage types they can represent normal taxiways, high-speed turn-offs, park-ing positions or even parallel taxiways. Especially the length influences ground movements as shortest paths are assigned to flights by default.
Gates may be used independent of aircraft type or airline or assigned exclusively to airlines or aircraft types. The least sophisticated approach would be to define a single gate for the whole airport which is used by all flights by allowing more than one aircraft at the gate. In opposition to that it is possible to make gate availability dependent on the neighbouring air-craft stands, e.g. a gate may be blocked if the adjacent is used by a Boeing 747 due to insuf-ficient separation values. Gate allocation can be done according to first available gate, clos-est gate to the runway or discrete gate-flight allocation. Turn-around times can be defined according to the requirements or prerequisites of the simulation.
The present thesis does not intend to incorporate airport-related restrictions. This is due to two facts. On the one hand airport capacity is not seen critical at most airports in the geo-

METHODOLOGY PAGE 20
RAMS PLUS 5.0
graphical area covered22
. On the other hand the analysis shall be limited to upper airspace traffic and in accordance with that refers to only a manageable number of airports. Any ca-pacity restrictions that might evolve from layout deficiencies are implemented by defining an operational capacity (chapter 2.2.2). All other airports used in the simulation, mainly depar-ture and arrival airports for flights to and from the EAC and SADC countries are not restrict-ed in capacity as flights to and from these airports will enter the analyzed airspace with re-stricted separation already. Therefore the Airport Delay Model is deemed sufficient for this analysis.
Before going into the details of the simulation environment developed for this thesis in chap-ter 2.2.1 a more general overview of the applications provided by RAMS Plus for simulating airspace shall be given at this point.
It is convenient to begin with the establishment of navigation facilities. Depending on the number of navigation aids required one can either draw navigation aids in the radar window and refine specifications via the menu or import them from external files. Navigation aids are defined by name, position and type. Further refinement can be done by denoting whether aircraft shall fly by or fly over the facilities. In addition separation values can be allocated to single facilities. This feature may be used for example in TMAs to simulate capacity re-strictions without defining detailed runway configurations. The sector skip functionality may be used where a discrete point for the hand-off of control between two adjacent sectors is required or a sector pierce shall not include a hand-off to the sector crossed.
Airways normally connect navigation aids. They are not required to define flight plans but useful to integrate actual flight plans. There are three files used to define airways. The route.dat file includes all navigation aids belonging to an airway in the sequence required. Airway.dat is used to restrict operations on this route to a certain level and/or speed band. For further detailedness or where it is useful to implement it in that way it is possible to use the routesegment.dat file to assign separation values to segments between two navigation aids. This could be used for example on the North Atlantic Track System where the obliga-tion of separation may be delegated to the pilots in the future.
The central part of the simulation is formed by the definition of airspaces. Here again it is possible to use the RAMS Plus interface to create centres and sectors. As this tool is not used for the thesis the general composition of the data shall be described bottom-up at this point.
Airspaces are geographically identified by corners and boundaries between those. All air-spaces outside defined areas are declared as Null airspace where no conflict detection or resolution takes place. A closed polygon of boundaries forms a sector that is monitored by a tactical and a planning controller. The vertical extension has to be defined as well. Adjacent sectors may be combined to control centres that are defined by a schedule representing the operational times. Nevertheless a control centre can consist of only a single sector if no fur-ther sectorization is necessary. For both default values are given that have to be adjusted to scenario assumptions. The simulation especially of the tactical controller, which is normally supposed to be using radar, can be refined by using different rulebases. This topic will be addressed later when describing the thesis’ simulation (chapter 2.2.3.1).
Controllers are monitoring flights upon entry into their controller windows. The planning con-troller is provided with an information window. The tactical controller uses an information and a hand-off window. These windows contain lists of flight. Depending on the scenario the in-formation windows may be but do not necessarily have to be equal for both controllers. The information window can be regarded as the strip holder. Adjustment to the dimension of the information window is done by editing the time values before entry and after exit of the sec-tor. Especially the time before sector pierce is important for the planning controller to be able
22 AICD: Background Paper 16, (p.xi-xii)

METHODOLOGY PAGE 21
RAMS PLUS 5.0
to solve conflicts in advance. The hand-off window of the tactical controller is used for radar control mainly and defines the area horizontally and vertically visible to the controller on the screen. A control hand-off time before sector pierce can be defined and is common practice to allow early contact with the pilots and therefore eases conflict resolution for the controller. By default aircraft that pass along a sector boundary possibly affecting separation values in the adjacent airspace will not enter the hand-off window. This should normally not be the case but is helpful for the present analysis as radar coverage in the geographical area se-lected is not available at all locations and airspace infringements like that remain unidenti-fied.
Figure 5: Controller windows
Detection of conflicts and application of resolution manoeuvres is based on adjustable val-ues, multipliers and rulegroups. Depending on the detection geometry model used in the scenario (rectangle, circle, ellipse, diamond) lateral and longitudinal separation values have to or can be set. Longitudinal separation may also be applied in minutes. Wake turbulence separation will be maintained independent of the discrete separation values set. Automatical-ly the greatest applicable value of those defined will be used by the controllers. Vertical sep-arations may differ from each other for planning and tactical controllers.
As conflict situations should normally be detected and solved by ATC before infringement of the given separation values, this should be implemented in the simulation. RAMS Plus uses separation multipliers to do so. Multipliers greater than 1 enlarge the level of awareness alt-hough it has to be kept in mind that depending on the volume of traffic and the equipment available certain limits to the cognitive skills of controllers are set. For example an approach controller at a busy airport monitors a relatively small area but achieves a high work load. Setting the detection multiplier to 10 might result in an overload situation as the controller would try to solve conflict situations before the entry of these flights into his area of respon-sibility and therefore significantly increasing the number of flights handled at one time. Be-yond that it is possible to set the detection multipliers to a value between 0 and 1. This can be useful in TMA simulations as well. Approaches to or departures from independently oper-ated parallel runways intentionally infringe standard lateral separation as ICAO Annex 14 prescribes a distance in between of 1035 m. Setting the multiplier to 0.2 where a standard separation of 3 NM has to be maintained could prevent the controller from considering this kind of approaches as conflict situations and consequently reducing the workload.

METHODOLOGY PAGE 22
RAMS PLUS 5.0
As a last step traffic has to be implemented. Flights can be assigned categories like Normal, Military, Ambulance, VIP, etc. that do not directly affect the simulation. When defining con-troller rules priority rules may be assigned to different categories or the separation minima may be adjusted, e.g. state aircraft may not be subject to RVSM regulations and therefore have to be separated by 2000 ft inside upper airspace from other traffic. A database included in the software provides aircraft performance data. Speeds, climb and descend rates are adjustable. Also fuelburn can be analyzed if an economical or ecological study has to be performed. The navigation equipment on board the aircraft has to be defined as well and includes horizontal and vertical separation values. During the simulation always the greatest of all specified values is used in conflict determination and resolution. In order to make use of the surveillance and control capabilities the separation values attached to the navigation equipment should be set to lower values.
Figure 7: Separation priorities
Figure 6 : Detection geometry models
METHODOLOGY PAGE 23
RAMS PLUS 5.0
As a special feature multi sector planners may be added to scenarios. This position is able to reduce traffic peaks in certain sectors by issuing trajectory modifications. This feature is not used in the current scenario as this concept is not implemented in the geographical area covered and no flow management which is to a certain extent equivalent to that takes place.
2.1.1 DATA INTEGRATION
Instead of integrating data using the menus or the import/export functionality it is possible and especially in case of extensive amounts of data more appropriate to write these directly into to the associated files. Care has to be taken on the implementation to be in compliance with RAMS Plus formats. This approach has also been used for the present analysis. An overview of the data structure is given in Appendix 8.
2.1.2 AIRCRAFT PERFORMANCE
Although aircraft performance is expected of subordinate relevance when analysing upper airspace an overview of the implementation of this data in RAMS Plus shall be given. There-fore the Boeing 767-300ER is used as an example and the data is compared with the Euro-control BADA
23 database.
Within RAMS Plus aircraft performance is derived from seven files:
acperf.dat includes the aircraft type, performance group, description of the aircraft model, altitude cruise upper level, altitude cruise lower level, altitude cruise optimal level, long range distance, length, wing span and wake turbulence category.
acmodelrange.dat includes the base aircraft model, range for the base model, short range aircraft model and associated range, medium range aircraft model and associ-ated range, long range aircraft model and associated range. The aircraft model appro-priate for the relevant flight distance is chosen.
fuelburn.dat defines fuel burn rates in kilogram per minute for every performance group. These values are adjustable to level bands. For cruise, climb and descent min-imum, nominal and maximum values are given.
groundperf.dat includes acceleration and deceleration rates for dry and wet runways, lift-off and landing speeds, runway blocking times as well as runway exit speeds for normal and high speed turn-offs for each performance group.
lookup.dat defines the flight performance by level bands, cruise, climb and descent speeds and climb and descent rates.
performancelowhigh.dat allows a refinement of the data specified in lookup.dat by de-fining minima and maxima for these values.
performancevariance.dat is another method of influencing the basic performance data by percentages of difference allowed in certain level bands.
23 Eurocontrol: BADA

METHODOLOGY PAGE 24
RAMS PLUS 5.0
Figure 8: True air speed
Performance as provided by BADA includes further information such as speeds in Mach number, aircraft mass and configuration and their influence on performance (e.g. stall speeds). Fuel burn rates for climb and descent are only available in nominal values. RAMS Plus is going beyond that. In general performance data is given for different level bands. Default data in the simulation is limited to five level bands but a refinement can be done if required. Therefore the Eurocontrol data results in smoother curves as can be seen in the figures. Nevertheless this data could be implemented easily into the RAMS Plus software.
The data comparison for the Boeing 767-300ER reveals acceptable differences for TAS and ROC in the two curves. Figure 8 shows a large discrepancy in the values up to 3,000 ft. This is due to the fact that data is arranged differently between the two databases. For cruise speed no values are defined in BADA below this level but they are included in the climb and descent speeds. RAMS Plus uses 250 kt in the database but this value is actually not used as it is overruled by the ground performance data including the take-off and landing speeds.
The rate of climb implemented in RAMS Plus is a bit more conservative than the nominal value in the BADA database and is located between this curve and the curve representing performance for operations at maximum mass.
Figure 9: Rate of climb
Figure 10 reveals that between FL160 and FL290 a much higher rate of descent is expected by the simulation software. This is in correlation with the descent speeds that also differ sig-

METHODOLOGY PAGE 25
SCENARIO
nificantly. While RAMS Plus expects the aircraft to decelerate from 455 to 420 kt the BADA model’s rate of descent is based on a speed reduction from 440 to 360 kt.
Figure 10: Rate of descent
Major differences in performance data between RAMS Plus 5.0 and BADA at higher operat-ing levels can only be identified in the rate of descent below FL300. This thesis is concentrat-ing on upper airspace and the effort of implementing the more detailed BADA data for all types of aircraft used in the scenario in order to refine the rate of descent is not seen justi-fied.
2.2 SCENARIO
The main problem to be addressed when creating a scenario is the reliability and compre-hensiveness of the data that is used in order to fulfil the requirements that were stated in chapter 1.3.
2.2.1 AIRSPACE
The airspace data for the present thesis is derived from the AFI Region eANP which was implemented after the Eleventh Air Navigation Conference
24. Unfortunately the data on
which this tool is based is not extractable in toto and therefore all elements defining airspace have to be copied step by step and transferred into RAMS Plus 5.0 format.
As previously mentioned many airspace boundaries are still congruent with countries’ boundaries. Every change in direction results in a new corner and boundary element. In the end around 1,900 data sets defined by latitude and longitude are added to the corner.dat file. The corners are consecutively numbered in the eANP which is helpful when creating sector boundaries as one boundary is formed by two corners. For the boundary.dat file therefore two columns with the corner identifiers of which the second is displaced by one row can be used. After the implementation this has to be verified as corners of adjacent airspaces are always defined twice for each sector and mismatches do occur. Two more files have to be created to completely define a sector. Centreschedule.dat defines the operating hours of the centres implemented in the scenario. It has to be remembered that each centre may consist of more than one sector and the operating hours are therefore applicable to all sectors be-longing to that sector. For the present scenario no centre closure is planned. In the last step
24 AN-Conf/11, Recommendation 1/14

METHODOLOGY PAGE 26
SCENARIO
the lateral borders are amended with vertical limitations. This is done in the centresector.dat file bringing together centre, sector, boundary identifier, lower and upper limit.
As identified in the requirements a lower level has to be defined and FL245 is chosen. This is the lower limit of most upper airspaces in the geographical area covered although some of the sectors are reaching down to lower levels in order to be adjacent to the TMAs. Another consideration was made regarding the performance data of regional aircraft, especially tur-boprops, which has improved over the years. Nowadays they are able to operate above FL245 if the flight profile (relating mostly to distance) commends it. Nevertheless the inten-tion to reduce the mixture of traffic operating at different speeds shall be maintained and small aircraft in commercial air traffic to secondary or tertiary airports shall be eliminated. The lower level of upper airspace does also depend on geographical considerations but as no widespread mountain ranges of exceptional height are located in the area no adjustment is seen necessary. This shall not exclude possible considerations regarding a rearrangement of the airspace configuration as a whole for the future. The upper level is set to FL660 which is well above normal air traffic operations and therefore ensures inclusion of all movements.
A short description of the airspaces as introduced to the scenario shall be given to facilitate the understanding of analysis results later in the thesis:
Angola
The Angolan FIR extends over most of the continental area and out to the Mid-Atlantic. Some parts of the airspace are delegated to or from other FIRs, e.g. Kinshasa and Lusaka.
Botswana
Botswana has not delegated any part of its airspace. The route structure is characterised by the geographical position of the country. All flights arriving from Europe, North America as well as West and Central Africa with destination Johannesburg merge in the Southeast of Botswana especially overhead Gaborone although some disentanglement has been per-formed in recent years.
Burundi
The upper airspace of Bujumbura FIR is controlled by Dar es Salaam ACC.
Democratic Republic of the Congo
The boundaries to the FIRs Brazzaville, Kigali and Bujumbura are following the official bor-ders. The other boundaries are straightened in some areas. Therefore some ATS routes like UA406 and UB527 skip some sector changes and remain under control of one ATC unit.
Kenya
The Kenyan airspace in opposition to the previously stated usage of the AFI Region eANP database
25 is further divided into smaller sectors according to the Kenya Airspace Master
Plan (cf. reference 20), Chapter 6.3.3. This is done due to the extreme values in traffic load that are encountered without that sectorization as can be seen in the graphs below (Figure 11 and Figure 12). Comparison with the traffic load in the revised airspace layout shows a considerably smoother distribution. The traffic volume for Dar es Salaam East Sector goes up as the capacity and therefore the throughput of traffic of Kenyan airspace is increased by adding additional controllers. This has to be taken into account in the analysis later on. Nai-robi ACC2 is extending down to FL145 is opposition to the general lower limit of FL245 cho-sen for the thesis.
25 eANP

METHODOLOGY PAGE 27
SCENARIO
Figure 12: Traffic load with splitted Nairobi control sectors
Lesotho
The complete airspace of Lesotho is controlled by South Africa.
Madagascar
The Comoros’ airspace is part of Antananarivo FIR. For the scenario also the control sector of the island of Réunion is included in this FIR.
Malawi
Lilongwe FIR is comparably small but positioned on an imaginable line between the Middle East, Addis Ababa, Nairobi and Johannesburg.
Figure 11: Traffic load with single Nairobi control sector

METHODOLOGY PAGE 28
SCENARIO
Mauritius
Mauritius FIR extends from 5°S to 45°S and longitudinally as far as 70°E (half way between Africa and Australia).
Mozambique
The boundary of Beira FIR proceeds along the Mozambican border. Flights crossing through this airspace are mainly operating between South Africa and Asia.
Namibia
Windhoek FIR is strongly subject to airspace delegation. The oceanic part is delegated to Johannesburg Oceanic above FL245, the Caprivi Strip is controlled by Gaborone ACC and the southern part of the airspace is rearranged to the needs of Namibia and South Africa.
Réunion
The airspace belongs to Antananarivo FIR but is controlled within a 180 NM radius around St. Dénis by local controllers. As crossing traffic is expected marginal (only flights between South Africa and Southeast Asia) these control positions are omitted in the scenario as their main task is to manage approaches to the French overseas department and traffic coordina-tion for over-flights is supposed to be up to the Madagascan and Mauritian ATC units.
Rwanda
The upper airspace of Kigali FIR is controlled by Dar es Salaam ACC.
Seychelles
The Seychelles FIR is crossed by flights from India and the Far East to all countries located south of Kenya.
South Africa
The South African airspace is divided into three FIRs: Johannesburg, Johannesburg Ocean-ic and Cape Town and is the most fragmented due to the high amount of domestic traffic. The airport of Johannesburg alone is surrounded by four sectors handling over-flights as well as approaches and departures. For the scenario these sectors are limited to a lower level of FL245 in order to avoid the complexity that is added by this kind of operations.
The Oceanic sector also controls the oceanic part of Windhoek FIR above FL245.
Swaziland
Matsapha TCA extends up to FL460 and is part of Johannesburg FIR. Nevertheless no offi-cial airspace delegation regarding control of over-flights to South Africa has been performed yet although flights stay within that airspace for considerably less than 100 NM.
Tanzania
The Dar es Salaam FIR is divided into two sectors, one covering the continental and oceanic airspace in the east with the merging point overhead the capital and the other one in west that is also responsible for the upper airspaces of Burundi and Rwanda.
Uganda
The northern and western boundaries of Entebbe FIR with Kinshasa and Khartoum airspac-es have been straightened.
Zambia
FIR boundaries with Angola and the Democratic Republic of the Congo are straightened as mentioned before (cf. DRC).

METHODOLOGY PAGE 29
SCENARIO
Zimbabwe
Traffic flows are concentrated at Harare. Equivalent to Malawi this country is situated on the great circle line and expected to be crossed by all flights between South Africa and Nairobi, Addis Ababa and the Middle East.
2.2.1.1 SPECIAL USE AIRSPACE
SUA can significantly reduce airspace capacity by limiting the range of ATC to obtain sepa-ration to conventional means such as vertical and time or distance based longitudinal sepa-ration in order to not violate these areas. Additionally the assignment of direct routings to meet user requirements regarding flight economy is prevented.
The scenario compiled for this thesis does not incorporate SUA. Figure 13 shows all restrict-ed and danger areas affecting the airspace analysed. In the following list areas tangent to ATS routes are described for each FIR:
FIR Kinshasa
restricted areas reach up to FL240 and therefore do not impose restrictions on the scenario
restricted areas are of non-permanent character and are activated by NOTAM
FIR Entebbe
restricted areas are of non-permanent character and are activated by NOTAM
FIR Nairobi
HKD23 “YATTA” (GND-29000MSL) is affecting the routing between Nairobi and the Seychelles. Overflights are expected to operate at higher levels and approaches or departures to and from Nairobi are normally circumnavigating the area according to STAR and SID routings. Therefore no restrictions of relevance to the scenario are im-posed.
other areas are of non-permanent character and are activated by NOTAM
FIR Gaborone
FBR20 “Francistown” reaches up to FL220 and therefore does not impose restrictions on the scenario
FIR Antananarivo
restricted areas are permitted to cross upon approval by Madagascan government26
FIR Beira
there are many small danger, prohibited and restricted areas located close to the air-port of Maputo but no information could be obtained on their status and therefore they are not included in the scenario
Note that restrictions affecting departures and arrivals are not within the scope of this thesis as lower airspaces and TMAs are not simulated.
The other areas are not affecting the use of ATS routes in their lateral extension. As radar or radar-like surveillance is not yet implemented to a large extent (cf. chapter 1.2.4) in the geo-
26 AIP ASECNA ENR-5-1-01

METHODOLOGY PAGE 30
SCENARIO
graphical area covered vectoring of aircraft will not be performed by ATC and flights there-fore follow their prescribed routings. It is also the aim of the research to analyse the capacity of the airspace at normal operations and therefore non-permanent restriction are not incor-porated. Also civil-military cooperation is encouraged within APIRG 17
27.
Figure 13: Restricted airspaces
2.2.1.2 NAVIGATION DATA
Navigation data such as navigation aids and ATS routes is implemented as available in ARINC 424 standard
28. Due to the already tabulated form it is easier to arrange it according
to RAMS Plus 5.0 requirements. The lateral extension of the geographical area covered and the need to also implement navigation aids beyond that area to define ATS routes for long-haul traffic necessitated the extension of navigation aid names by the two-letter ICAO coun-try identifier as duplications were found leading to errors in the routing structure. After the implementation into the scenario further faults were identified resulting from wrong sequenc-es of waypoints in the ATS route definition that had to be corrected by hand. Therefore the route.dat file can be used that was also derived from the ARINC database and incorporates the routing details. Rather operational requirements are covered by the airway.dat file defin-ing minimum and maximum usable flight levels and speeds. It was adjusted to match the scenario. This could be further elaborated by the routesegment.dat file putting restrictions on certain parts of ATS routes.
2.2.2 AIRPORT OPERATIONS
Airports, as is described below, are not defined in detail (cf. Chapter 2.1) but assumptions regarding capacity are made and included in the scenario using the airport delay model. In particular this means the allocation of movements per hour to each airport within the geo-
27 APIRG, WP/25 and WP/41
28 ARINC

METHODOLOGY PAGE 31
SCENARIO
graphical area covered. Not all airports in the geographical area are available in the default data of the software. But as this thesis only surveys international traffic only the major air-ports are required.
Therefore the layout of the runway and taxiway system is analyzed and the Advisory Circular
on Airport Capacity and Delay29
is used as basis for a simplified method. Table 1 illustrates
the relevant data. Suitable runways are defined as at least 30 m wide and 1,800 m long with
a paved surface to accommodate modern jet aircraft. In opposition to ICAO Annex 14, Vol-
ume I, Chapter 3.1.12 the distance between parallel runways required for independent oper-
ations is not considered but the only application, Johannesburg, is supposed to be beyond
the specified lower limits. The column parallel taxiway includes the runway plus the parallel
taxiway for calculation reasons and as they both can accommodate at least one aircraft at
the same time. The exit factor is assigned according to the FAA Advisory Circular, Figure 3-
43 (cf. Appendix 4) in reference to the number of suitable runway exits. The basic number of
movements is also taken from the FAA Advisory Circular for single runways although cross-
ing runways may exist at the airports. This simplification can be made due to the fact that the
crossing runways are mostly not suitable for the traffic implemented in the scenario. In gen-
eral only smaller aircraft affected stronger by crosswinds and not using instrument approach
procedures use them but are not taking part in upper airspace traffic and are therefore omit-
ted in the scenario.
Airport ICAO Code
No. of suitable RWYs
No. of parallel RWYs
parallel TWY
Exit Fac-tor
FAA hourly
capacity base
parallel TWY com-pen-
sation
MOV/hr
Capetown FACT 2 1 2 0,92 52 0,5 48
Johannes-burg FAJS 2 2 2 0,92 52 0,5 96
Lanseria FALA 1 1 2 0,91 54 0,5 49
Nelspruit FANS 1 1 1 0,77 54 0,5 21
Maun FBMN 1 1 1 0,83 28 0,5 12
Lilongwe FWKI 1 1 2 0,91 28 0,5 25
Entebbe HUEN 2 1 2 0,92 28 0,5 26
Table 1: Airport capacity (examples)
Three different capacity bases are chosen. Airports that have a significant number of inter-
continental traffic have a slightly lower capacity base (52) than airports with a predominating
regional traffic due to the higher mix index in accordance with the larger aircraft operating on
these routes. That index also influences the exit factor which differs for similar airport lay-
outs. For all airports a balanced percentage of arrivals (50:50) is assumed.
The column parallel TWY compensation compensates for the additional counting of the run-
way in the column parallel TWY. To consider the existence or absence of ATS surveillance
29 FAA, Advisory Circular 150/5060-5

METHODOLOGY PAGE 32
SCENARIO
systems Chapter 4-3 of the FAA Advisory Circular determines the hourly capacity in the ab-
sence of radar coverage for different runway configurations. The layout of the taxiway sys-
tem is not incorporated in these figures and calculated according to Figure 3-43. Approaches
without radar coverage have a capacity of approximately 28 movements per hour as deter-
mined from Figure 4-15 (cf. Appendix 5). As the approach procedures are not known in de-
tail for all airports the value for straight-in approaches is used.
This value cannot be reached in reality as runways are often blocked for backtracking. ICAO
Doc 4444, Chapter 6.5.6.2.2 (interval between successive approaches) states: “In determin-
ing the time interval or longitudinal distance to be applied between successive approaching
aircraft, the relative speeds between succeeding aircraft, the distance from the specified
point to the runway, the need to apply wake turbulence separation, runway occupancy times,
the prevailing meteorological conditions as well as any condition which may affect runway
occupancy times shall be considered.” In order to validate the number of movements calcu-
lated in the table in Appendix 6 the following considerations are done.
If an average approach speed of 150 kt is assumed and the spacing between successive
approaches shall not be less than the minimum separation of 5 NM for radar environments a
time interval of 2 minutes has to be applied. As backtracking is required in most cases an
additional minute for the turnaround of the aircraft and two minutes for the backtracking itself
and the runway vacation are added. To make maximum use of the available capacity a de-
parting aircraft should line-up as soon as the arriving aircraft has passed the runway entry
point of the departing aircraft. Adding another 2 minutes for the take-off two movements can
be handled in 7 minutes at airports with insufficient access of taxiways. There is no safety
margin considered yet and therefore one more minute is added. This results in two move-
ments per eight minute interval or 15 movements per hour for alternating approaches and
departures or less in case of successive approaches. This is consistent with the results of
the calculation and is used for the simulation.
2.2.3 CONTROLLERS
2.2.3.1 RULEBASE DEFINITION
In order to determine the workload of the controllers the sectorization of the airspace and the separation minima according to the surveillance capabilities have to be defined. As airspace definition has been described in chapter 2.2.1 concentration here will be on the working pro-cedures.
Separation minima
The separation minima are defined on the basis of data made available at the Third Meeting of the APIRG Communications, Navigation and Surveillance Sub-Group in Nairobi, Kenya, 26-30 April 2010 (cf. reference 17). The longitudinal separation minimum is set to 10 minutes and RVSM can be applied in all airspaces covered in the scenario.
In all non-radar environments the separation values are based on the procedures standard-ized by ICAO Doc 4444 Procedures for Air Navigation Services – Air Traffic Management and Doc 9613 Manual on Required Navigation Performance. The lateral separation is de-fined in compliance with the RNP values specified for the area of routing and is in most cas-es ensured by the distance between different ATS routes. Use of the lateral separation val-
METHODOLOGY PAGE 33
SCENARIO
ues can be made by the tactical controller when clearing an aircraft to a parallel offset track in order to climb through a flight level presently blocked by another aircraft.
Areas covered by radar may use lower separation minima.
The airspace of the Republic of South Africa is covered by radar nearly in full. The Air Traffic Services Standards and Procedures Manual
30 as published by the South African
Civil Aviation Authority at 22 July 2009 defines the minimum radar separation between identified radar targets as 5 NM (ib.: Section 6, Chapter 6, 1.1). For planning control-lers separation minima are specified as 20 NM lateral according to RNP provisions and 20 NM longitudinal also in accordance with the Air Traffic Services Standards and Pro-cedures Manual (ib.: Section 6, Chapter4, 5.7.1).
The status of the radar systems installed in Zimbabwe is unclear. As safety is the overall priority in ATC the higher values for a non-radar environment are used.
The Namibian airspace is monitored by a combination of two radar antennas installed at the international airport of Windhoek and a wide area multilateration system
31 will be
implemented soon. The separation minima are not available. But as position accuracy of the multilateration system is presented as being 150 m or better the longitudinal and lateral separation minima are also adjusted to 5 NM
32. This decision can be empha-
sized by the better system performance of multilateration systems in comparison to primary and secondary radar surveillance systems (ref. additional reading, Wide Area Multilateration, Report on EATMP TRS 131/04).
The system capabilities and relating separation minima of Kenya’s surveillance radars is unknown but is set to 20 NM for the continental part in order to acknowledge the ra-dar coverage as described in the Kenya Airspace Master Plan
33.
All specifications defining a working position are included in the controller.dat file. Beyond the entry and exit distributions for the information and hand-off windows as described in chapter 2.1 and the separation minima applicable for the sectors the scope of actions that may be used is added.
Rulegroups for controllers
The resolution manoeuvres that can be applied by the different controllers (planning, tactical radar and tactical non-radar) are defined separately. The rulesystem incorporates controller rules, the rulebase manager and zone rules. For the given scenario solely the controller rules have to be adjusted as the rulebase manager influences all rules defined in general and zone rules are used to configure multi-use airspace etc. which is not included in the present scenario.
Planning rules and tactical rules are predefined. The comparably long names of the rules simplify the understanding of the realted action performed by the controller. As the tactical rules are based on the assumption of a radar environment an additional rulegroup Tactical-NonRadarRules has to be implemented. This rulegroup omits manoeuvres that are in gen-eral carried out only with assistance of a situation display. For example Head-ing_Further_Behind_Crossing_Conflict is only applicable if the controller has a situation dis-play allowing precise determination of separation and heading instructions. The comparison between the rulegroups for tactical controllers with and without radar is shown in Table 2.
30 SACAA, ATCIs
31 AZ Namibia, 12 March 2010
32 SRA Company resentation
33 Kenya Airspace Master Plan, (p.27-30)

METHODOLOGY PAGE 34
SCENARIO
RULEGROUP Identify_Tactical _Action_for_a_Candidate
RULEGROUP Identify_Tactical_Non_Radar _Action_for_a_Candidate
Level_Off_Lower_Flight_In_Crossing_Conflict Level_Off_Lower_Flight_In_Crossing_Conflict
Level_Off_Upper_Flight_In_Crossing_Conflict Level_Off_Upper_Flight_In_Crossing_Conflict
Reduce_Speed _of_Flight_Behind_in_Track_No_WakeTurbulance
Reduce_Speed _of_Flight_Behind_in_Track_No_WakeTurbulance
LevelOff_Descent_Behind_in_Track_With_WakeTurbulance LevelOff_Descent_Behind_in_Track_With_WakeTurbulance
LevelOff_Climb_Behind_in_Track_With_WakeTurbulance LevelOff_Climb_Behind_in_Track_With_WakeTurbulance
Heading_to_Climb_Opposing_Descent
Heading_to_Climb_going_to_Higher_FL_than_Other
Heading_to_Climb_going_to_same_level_Short_Term_conflict
Heading_Further_Behind_Crossing_Conflict
Level_Off_Climb_that_will_Descend_again_soon Level_Off_Climb_that_will_Descend_again_soon
Heading_parallel_to_other_for_short_term_narrow_angle_conflict Heading_parallel_to_other_for_short_term_narrow_angle_conflict
Consider_Descending_Cruise_about_to_Descend Consider_Descending_Cruise_about_to_Descend
Consider_Descending_high_cruise_nearer_to_airport Consider_Descending_high_cruise_nearer_to_airport
Hold_Flight_On_Ground Hold_Flight_On_Ground
Reduce_Speed_Of_Inbound_Flight Reduce_Speed_Of_Inbound_Flight
Monitor_Conflict_with_No_Crossover_and_Very_Short_Duration
Increase_Speed_of_Flight_InFront Increase_Speed_of_Flight_InFront
ParallelOffsetForCruiseConflictEndingWithDiverge ParallelOffsetForCruiseConflictEndingWithDiverge
Consider_Climbing_Opposite_Cruise_with_LongWay_to_go Consider_Climbing_Opposite_Cruise_with_LongWay_to_go
Consider_Climbing_InTrack_Cruise_with_LongWay_to_go Consider_Climbing_InTrack_Cruise_with_LongWay_to_go
Delay_Descent_For_HighCruise_shorttermConflict Delay_Descent_For_HighCruise_shorttermConflict
Table 2: Tactical controller rulegroups
The non-radar equipped sectors are working according to the conventional separation meth-ods and minima based on time and distance as specified in ICAO Doc 4444 Procedures for Air Navigation Services – Air Traffic Management, Chapter 5. In addition to these standard procedures two resolution rules are permitted to controllers based on the advanced flight guidance equipment installed on board modern aircraft. Heading_parallel_to_other_for _short_term_narrow_angle_conflict is a feasible procedure to climb or descent one aircraft through a level blocked by other traffic. ACAS systems as described in ICAO Annex 10, Vol-ume IV, provide a good situational awareness for the pilots and allow an offset on a parallel heading without risking an infringement of safety. A similar procedure is the ParallelOffset-ForCruiseConflictEndingWithDiverge. In this case the aircraft are not directed onto parallel headings but on parallel tracks. Modern flight management systems allow an offset to the planned route and an automatic alignment to the original track when clear of traffic.
The different rules are composed of conditions and actions. Using prefixes like GIVEN, AND or NOT, conditions under which a certain manoeuvre may be applied can be defined. An extensive list of relations like Current Altitude, Distance from Airport, Relative Position etc. specifies these prerequisites. To illustrate the composition of controller rules an example is given:

METHODOLOGY PAGE 35
SCENARIO
Level_Off_Lower_Flight_In_Crossing_Conflict
CONDITIONS
GIVEN Candidate (conflict, flight_x, flight_y)
NOT ConflictAngle (conflict, Parallel_Opposite)
NOT ConflictAngle (conflict, Parallel_Same)
CurrentAttitude (flight_x, AttitudeClimb)
NOT ConflictAttitude (conflict, flight_y, AttitudeDescent)
GT (CurrentAltitude (flight_y), CurrentAltitude (flight_x))
ACTIONS
FirstChoice (conflict, flight_x, TempFlightLevelBelow)
In a first step the conflicting aircraft (flight_x and flight_y) are identified according to the sep-aration standards specified. As this resolution rule is developed to solve conflicts between aircraft on crossing tracks the angle of conflict must not be the same or opposite. The con-flict angles can be adjusted. By default same and parallel include angles of ± 10° (cf. Figure 15) represented by the red area in Figure 14. In case flight_x is the aircraft intending to climb through the level of flight_y the attitude will be climb (passing FL210 for higher in this exam-ple). To apply this manoeuvre flight_y must not be in a descent. If this would be the case another rule would have to be applied. The prefix GT returns TRUE if the first value in the brackets is greater than the second and FALSE otherwise. As in the given example flight_y is restricting the climb of flight_x as it is operating at FL250 and therefore TRUE is returned.
The action performed by the controller will now be to level of flight_x below the level blocked by flight_y until sufficient separation is provided.
Figure 14: Controller rule
Level_Off_Lower_Flight_In_Crossing_Conflict
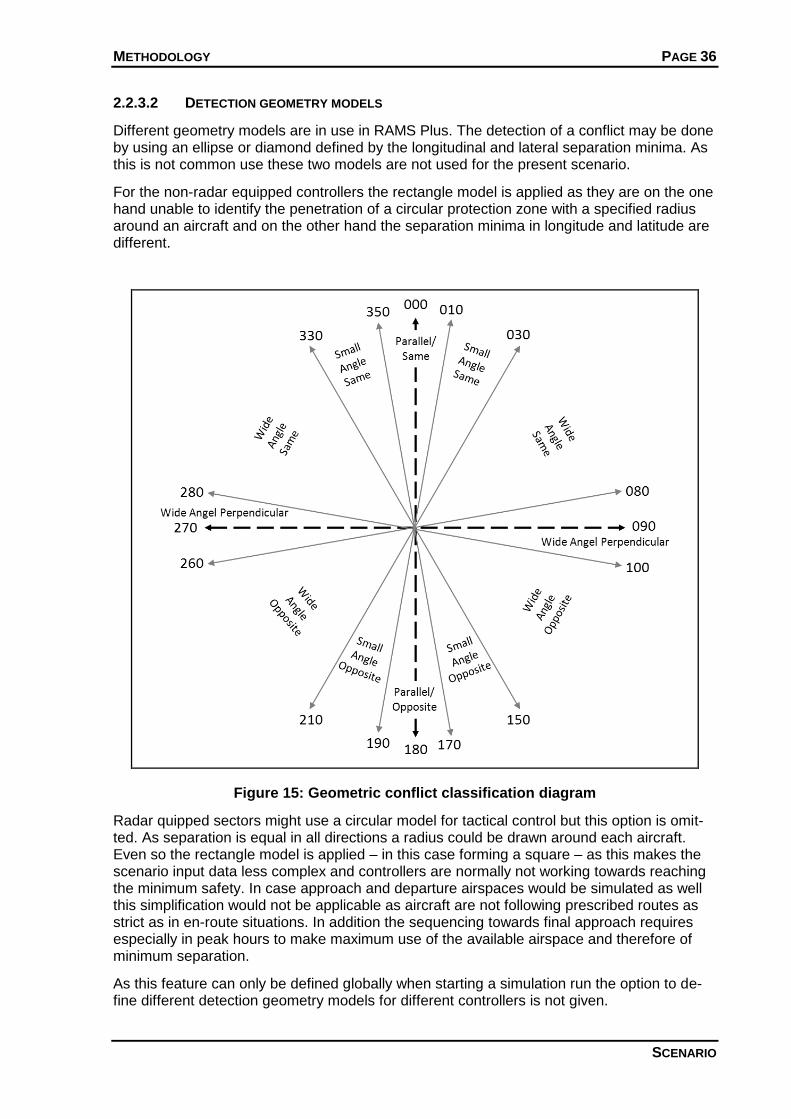
METHODOLOGY PAGE 36
SCENARIO
2.2.3.2 DETECTION GEOMETRY MODELS
Different geometry models are in use in RAMS Plus. The detection of a conflict may be done by using an ellipse or diamond defined by the longitudinal and lateral separation minima. As this is not common use these two models are not used for the present scenario.
For the non-radar equipped controllers the rectangle model is applied as they are on the one hand unable to identify the penetration of a circular protection zone with a specified radius around an aircraft and on the other hand the separation minima in longitude and latitude are different.
Figure 15: Geometric conflict classification diagram
Radar quipped sectors might use a circular model for tactical control but this option is omit-ted. As separation is equal in all directions a radius could be drawn around each aircraft. Even so the rectangle model is applied – in this case forming a square – as this makes the scenario input data less complex and controllers are normally not working towards reaching the minimum safety. In case approach and departure airspaces would be simulated as well this simplification would not be applicable as aircraft are not following prescribed routes as strict as in en-route situations. In addition the sequencing towards final approach requires especially in peak hours to make maximum use of the available airspace and therefore of minimum separation.
As this feature can only be defined globally when starting a simulation run the option to de-fine different detection geometry models for different controllers is not given.

METHODOLOGY PAGE 37
SCENARIO
2.2.3.3 DETECTION MULTIPLIERS
For each controller it is possible to define specific detection multipliers in the dynamicdetec-tion.dat file. These values define the critical separation for conflict identification. If set to the default value ‘1’ a conflict is detected when the predefined separation values are infringed. For example two aircraft at same level on opposing tracks in a radar controlled sector will be considered in conflict by the tactical controller first when one aircraft enters the 5 NM separa-tion minimum of the other. In this case it is nearly impossible to take appropriate action. The detection multipliers increase the detection range.
For radar control positions the values are set to ‘5’. The controllers are now scanning at a radius of 25 NM and ± 5,000 ft around every aircraft for possible conflicting traffic. For non-radar control positions (tactical and planning) the values in longitude, latitude and altitude differ for varying conflict positions. Conflicts between aircraft on the same track or converg-ing at small angle will be detected 20 min ahead as the multiplier is set to ‘2’ for longitudinal separation (10 min controller separation defined) but no lateral expansion (50 NM controller separation defined) of the detection range is implemented as aircraft on a parallel ATS route sufficiently separated according to RNP standards would unnecessarily be considered a con-flict. Conflicts resulting from climb versus cruise situations are subject to resolution 3,000 ft before reaching the blocked level (detection multiplier set to ‘3’ in combination with RVSM). Aircraft on crossing tracks are considered to be in possible conflict at twice the separation values in all directions (20 min longitudinal and 100 NM lateral).
2.2.4 TRAFFIC
The traffic is based on 2010 figures and only includes scheduled traffic although non-scheduled flights especially in the cargo sector may be performed to a certain extent. As for the reference day around 800 flights are identified a number of 10 to 20 unscheduled aircraft operations is seen of minor influence on the workload of controllers. Beyond that non-scheduled flights are often operated due to missing scheduled connections and for that rea-son rarely affect highly frequented routes and sectors. Therefore they may be ignored in a thesis aiming to identify congested and overcrowded airspaces.
2.2.4.1 TRAFFIC DATA
Before it is possible to analyse the traffic situation and the resulting airspace capacity in the year 2020 it is inevitable to define a traffic basis to have a reliable and reasonable starting point. As a 24 hour period shall be used a day with high traffic volume needs to be identified. This does not necessarily have to be the maximum peak experienced as this would lead to miscalculations. For example using July 12
th 2010, the day after the FIFA World Cup final in
South Africa would mark a peak that is way beyond normal traffic and would provide a wrong or at least questionable basis for the scenario regarding volume and direction of traffic.
The relevant ANSPs in the geographical area covered do not publish the day with the high-est workload for each year as well as monthly statistics so that determination of the required data has to be performed via other sources. With the aim to reach the highest possible com-parability the ICAO database
34 is used to analyze the traffic volumes of airports and airlines.
Again deficiencies in reporting practices by the entities concerned make assumptions and unsteadinesses inevitable.
First of all the airport traffic shall be examined. The integration of domestic air traffic did not prove useful for the identification process. Although domestic flights in larger countries like South Africa do penetrate the upper airspace that is part of this thesis, there are little vari-
34 ICAOData

METHODOLOGY PAGE 38
SCENARIO
ances in schedule over the year. All-cargo flights are not operating scheduled at significant numbers and are therefore not included in the identification process as well. Non-scheduled flights, tourist charter operations as well as ad-hoc cargo requests, depend largely upon un-predictable and non-influenceable circumstances. The global economic downturn following the financial crisis in 2008 demonstrated the vulnerability of the airfreight market resulting in considerable losses. Exchange rates do not just affect the cost-benefit-analyses of cargo handling agents but also private persons in their decision to travel or not. Especially the choice of destination when planning vacations tends to be sensitive to prices. Nevertheless non-scheduled traffic represents between 10% (southern hemisphere winter) and 15% (southern hemisphere summer) of total traffic. The graph in Figure 16 shows how incon-sistent data for 2004 and 2009 is and therefore stress is laid on international scheduled flights.
Figure 16: Number of international non-scheduled flights
Data for 2004 and 2009 is chosen for reasons of availability and comparability. The airports included are Beira and Maputo in Mozambique, Gillot (St. Dénis) on the French island of Réunion, Plaisance on the Seychelles, Cape Town, Durban and Johannesburg in South Afri-ca, the Ugandan capital Entebbe and the international airport of Addis Ababa, Ethiopia which is located outside the geographical area analyzed but acts as a major hub for flights to and from Eastern and Southern Africa. A significant drawback is the lack of data for the airports in Nairobi, Mombasa, Luanda and Dar es Salaam. For those airports no or only annual data is available.
Figure 17 shows the distribution of aircraft departures for the years 2004 and 2009 and the arithmetic mean. The trend lines until May for both years proceed similarly. After overcoming the economic crisis in mid 2009 traffic rises considerably. The highest number of aircraft departures is reached in October.
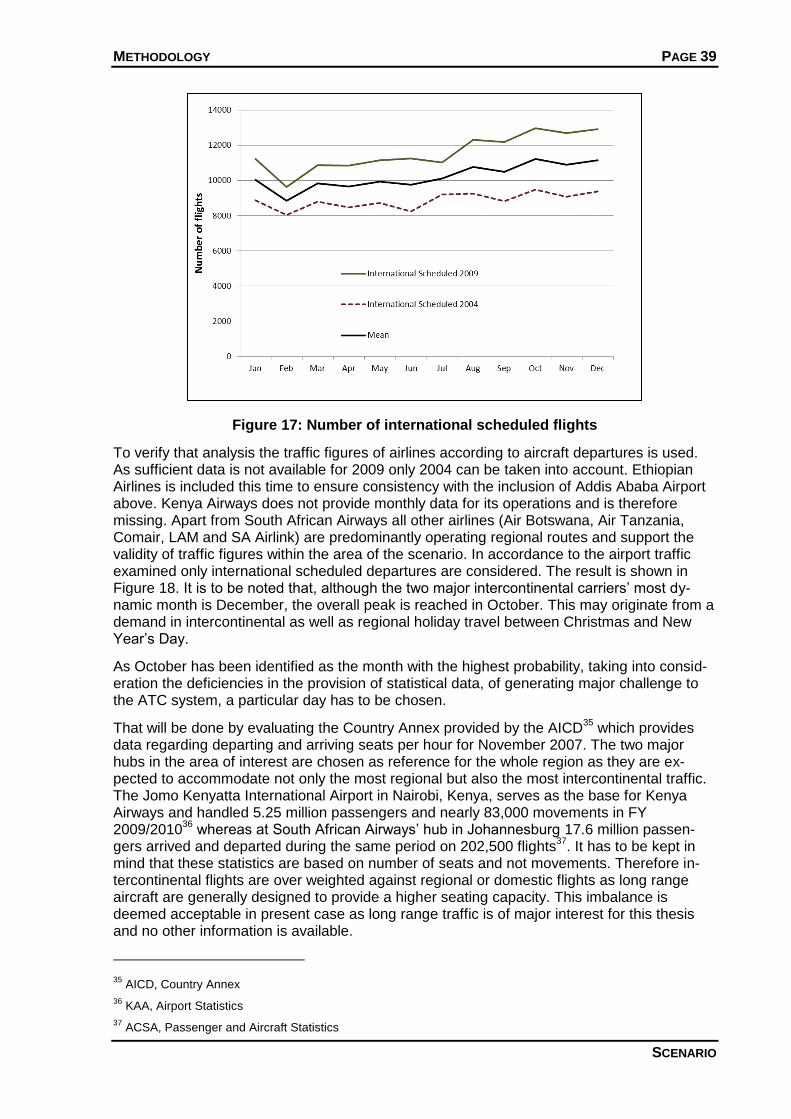
METHODOLOGY PAGE 39
SCENARIO
Figure 17: Number of international scheduled flights
To verify that analysis the traffic figures of airlines according to aircraft departures is used. As sufficient data is not available for 2009 only 2004 can be taken into account. Ethiopian Airlines is included this time to ensure consistency with the inclusion of Addis Ababa Airport above. Kenya Airways does not provide monthly data for its operations and is therefore missing. Apart from South African Airways all other airlines (Air Botswana, Air Tanzania, Comair, LAM and SA Airlink) are predominantly operating regional routes and support the validity of traffic figures within the area of the scenario. In accordance to the airport traffic examined only international scheduled departures are considered. The result is shown in Figure 18. It is to be noted that, although the two major intercontinental carriers’ most dy-namic month is December, the overall peak is reached in October. This may originate from a demand in intercontinental as well as regional holiday travel between Christmas and New Year’s Day.
As October has been identified as the month with the highest probability, taking into consid-eration the deficiencies in the provision of statistical data, of generating major challenge to the ATC system, a particular day has to be chosen.
That will be done by evaluating the Country Annex provided by the AICD35
which provides data regarding departing and arriving seats per hour for November 2007. The two major hubs in the area of interest are chosen as reference for the whole region as they are ex-pected to accommodate not only the most regional but also the most intercontinental traffic. The Jomo Kenyatta International Airport in Nairobi, Kenya, serves as the base for Kenya Airways and handled 5.25 million passengers and nearly 83,000 movements in FY 2009/2010
36 whereas at South African Airways’ hub in Johannesburg 17.6 million passen-
gers arrived and departed during the same period on 202,500 flights37
. It has to be kept in mind that these statistics are based on number of seats and not movements. Therefore in-tercontinental flights are over weighted against regional or domestic flights as long range aircraft are generally designed to provide a higher seating capacity. This imbalance is deemed acceptable in present case as long range traffic is of major interest for this thesis and no other information is available.
35 AICD, Country Annex
36 KAA, Airport Statistics
37 ACSA, Passenger and Aircraft Statistics

METHODOLOGY PAGE 40
SCENARIO
Figure 18: Number of international scheduled flights of selected airlines
Figure 19: Departing and arriving seats per hour at O.R. Tambo International Airport38
The traffic distribution at Johannesburg airport is comparatively balanced. Only one peak per day between 10 and 11 a.m. is visible for every day of the week. A qualitative analysis of the diagram in the Figure 19 shows that the maximum capacities are offered on Friday and Sun-day. This observation is also consistent with the considerations made above. Intercontinental trips, being for private or business reasons, in general are planned to last longer than one or two days. Business travellers will rather stay from Sundays to Fridays to attend meetings and appointments during the week. Tourists in opposition to that might want to make maxi-mum use of their vacation and arrive on Fridays and return on Sundays.
38 AICD, Country Annex, (p.277)

METHODOLOGY PAGE 41
SCENARIO
Figure 20: Departing and arriving seats per hour at Jomo Kenyatta Intl. Airport39
Comparing traffic figures for these two days of the week at Jomo Kenyatta International Air-port shows a slightly higher traffic volume on Sunday. When looking at traffic distribution at smaller airports in the region that preferably concentrate on regional air traffic, like Kigali and Entebbe, the selection of Sunday as the day providing a suitable basis for the analysis is fostered.
The traffic at 31 October 2010 is integrated into the simulation as made available at flightstats.com and departure times are converted to UTC. Again this data is not extractable in whole but has to be copied step by step and rearranged to fulfil the data requirements of RAMS Plus 5.0. As traffic data need to be written into different files within the scenario this time the import tool provided by the software is used. All relevant information (departure time, flight number, departure and destination aerodrome, aircraft type, requested flight lev-el, routing, etc.) is combined in the trafficexchange.dat file and the import function automati-cally distributes the information to the target files.
A significant drawback in this process was the lack of a route finding algorithm. All routes had to be implemented by hand based on assumption regarding the shortest distance. As mentioned at the beginning of this chapter this had to be done for approximately 800 flights.
2.2.4.2 TRAFFIC GROWTH
As it is the main aim of this thesis to analyse the situation of the upper airspace of the SADC and EAC countries in 2020 a prediction of traffic has to be performed. There are different approaches in use and different outcomes. The main challenge is normally to create a relia-ble database and to correctly identify the manifold influences on demand and offer. Another difficulty appears as predictions are in general focussing on air traffic economics and there-fore forecast changes in RPK or passengers transported. There is a relation between these figures and the number of aircraft movements and the challenge is to establish a justifiable factorization to correspond to the requirements of this thesis. Therefore the methodology of the Long-Term Forecast as produced by Eurocontrol
40 is used as a guideline.
Aiming to proof the choice of a more sophisticated approach an increase in traffic at an equal growth rate as predicted by Boeing’s Current Market Outlook 2009-2028 (cf. reference 6) for all traffic flows is assumed and the results of the simulation are presented in Figure 21
39 AICD, Country Annex, (p.153)
40 LTF 2010

METHODOLOGY PAGE 42
SCENARIO
(red line). Without going into detailed analysis of these results the insufficiency of this ap-proach can easily be identified.
The graph shows an increase in imbalances in traffic distribution over the simulation period creating significant peaks at 15:30, 17:30 and 20:30. This is something complicated to han-dle for ATC. On the one hand it is a human factor problem by forcing the controllers to raise attention rapidly and for a short time (high vigilance required). On the other hand it necessi-tates the ANSPs to provide systems and procedures able to manage these traffic peaks. This is economically questionable. For example an advanced flight data management sys-tem is acquired in order to handle 450 flights per hour as required by the figures in the graph. Supposing it is a reasonable approach to declare it a profitable investment when uti-lized to 70% of its capacity or more this would be the case for only 9 out of 24 hours. This does not even take into account the differing situations in the variety sectors. Therefore it will not be considered an option.
Figure 21: Comparison of different growth rates
As air traffic in Africa differs significantly from Europe also the prediction method used by Eurocontrol has to be adjusted. For example the influence of a high-speed train network is not existent in Africa. Another reason is the lack of historic data that is often extrapolated for future scenarios. As basic data the World Economic Outlook as of October 2010
41 provided
by the International Monetary Fund is chosen. It provides data for all countries covered by this thesis and the methodology used is identical for all numbers.
41 IMF, WEO April 2010

METHODOLOGY PAGE 43
SCENARIO
One of the main factors driving air traffic is the GDP. In how far this element influences air traffic differs between regions and countries. Countries with a strong position in export mar-kets rely more on international air traffic than countries producing goods solely for their own requirements. Countries concentrating on the development of the tertiary sector generate more business travel. Typical vacation destinations experience a lot of income traffic that is additionally limited to certain seasons and even one or two days of the week.
The progression of traffic is related to the overall GDP development as an increase in busi-ness activities results in an increased demand for travel. But as business travel is not form-ing the sole driver to air traffic and with growing income of the people personal travel be-comes more and more important this development requires consideration as well. This is also a difference to the Eurocontrol method as the income of European households is much higher than in the geographical area covered and therefore the effect of Low Cost Carriers may be less pronounced.
The GDP per capita identifies the productivity of the people and is directly related to the state of wealth of the households. A restricting factor in most of the countries is inflation as the mean value is not expected to fall below 5% within the forecast period. A comparison with the evolution of the GDP per capita shows a constraining effect.
Figure 22: Comparison of GDP per capita growth versus Inflation
Discrete numbers of GDP and GDP per capita differ significantly from each other within the region. Even the equalized data according to PPP measurement is not of sufficient explana-tory power as prices for air travel only form a small part of the International Comparison Pro-gram. In fact it is just 1 of 222 items accounted for in the GDP
42.
In recognition of this fact only the changes over the forecasted years are used. First the arithmetic mean of the GDP change for the predicted timeframe 2011-2015 as available in the World Economic outlook data, the GDP per capita change and the forecasted inflation rate is calculated. In a second step the values are integrated in to one representing the de-mand for passenger air transport. This is done by adding the GDP per capita increase re-
42 Worldbank, ICP Methodological Handbook

METHODOLOGY PAGE 44
SCENARIO
duced by the inflation influence (overweighting the first value) to the overall GDP growth. As shown in the formula below. The mean growth factor is 7%.
Another influence incorporated by Eurocontrol’s forecast is the business strategy of airlines. Especially the mean seats per aircraft may have an effect on the number of movements. For example South African Airways announced to introduce wide body aircraft on the Johannes-burg-Nairobi route in March 2011
43 which offers more seats without increasing the number of
movements. The Airbus Global Market Forecast 2009-2028 (cf. reference 7) predicts a 1,5 times stronger growth in the twin aisle fleets of African airlines than in the single aisle mar-ket. Therefore for the larger economies in the geographical area covered (larger GDP than half of the mean value of the region) some routes are expected to be served by larger air-craft in the prediction period and the growth rate is reduced by 0.15% which is one tenth of the value of the expected change in available seats per movement. This low reduction is presumed due to the fact that stronger growth rates on intercontinental flights are predicted and most of the twin aisle segment increase will be used on these long haul routes.
With this reduction applied the mean increase in air traffic is now predicted at 6.9%. This shall be validated by the data provided in the Airbus Global Market Forecast. Intra Sub-Saharan air traffic is assumed there to increase by 6.1%. The traffic between Sub-Saharan States and South Africa is expected to grow at 8.2%. The calculated growth rate is situated in the middle of these two figures although it may be a little bit high. It has to be taken into account that the negative effect of increasing oil prices are not evaluated as the commodity markets are seen to viable to be predicted and the influence of riding oil production in Sub-Saharan countries is hard to predict. On the other hand the market entrance of Low Cost Carriers which normally boosts traffic numbers is also omitted.
This figure is representing the expected growth in RPK and therefore an adjustment to the number of movements has to be done.
Two different factors for this adjustment are used for domestic and regional predictions. Some of the countries in the geographical area covered are very small like Swaziland or Bu-rundi. Others have a considerable extension but are little populated like Namibia or Angola. Only a few have more than one metropolitan area like South Africa or Kenya. In countries belonging to the first two categories either no domestic air traffic is offered or it is performed with small propeller aircraft and therefore not affecting upper airspace. Countries in the latter category do have significant domestic air traffic but that is concentrated on a few routes. The connection between Johannesburg and Cape Town belongs to the most frequented air routes in the world with about 100 flights per day. At a lower level (more than 30 flights per day) the route between Nairobi and Mombasa is of importance for national business. Com-parison of predictions for RPK and movement growth between the Airbus Global Market Forecast and the Eurocontrol Long-Term Forecast identifies a factor of approximately 0.6 for air traffic movement growth in smaller regions. Therefore this factor is use for domestic growth.
With a growing cooperation between businesses and companies in the region the demand for air travel between the countries is likely to grow stronger. Another supporting factor is the insufficient railway and road infrastructure. In combination with the long distances that have to be bridged air traffic is the only suitable means of transport. Also a further political and economic integration of the states including customs and free trade agreements will increase demand for air transport connections. That is also an important factor in Eurocontrol’s fore-
43 African Aviation News, 2 March 2011
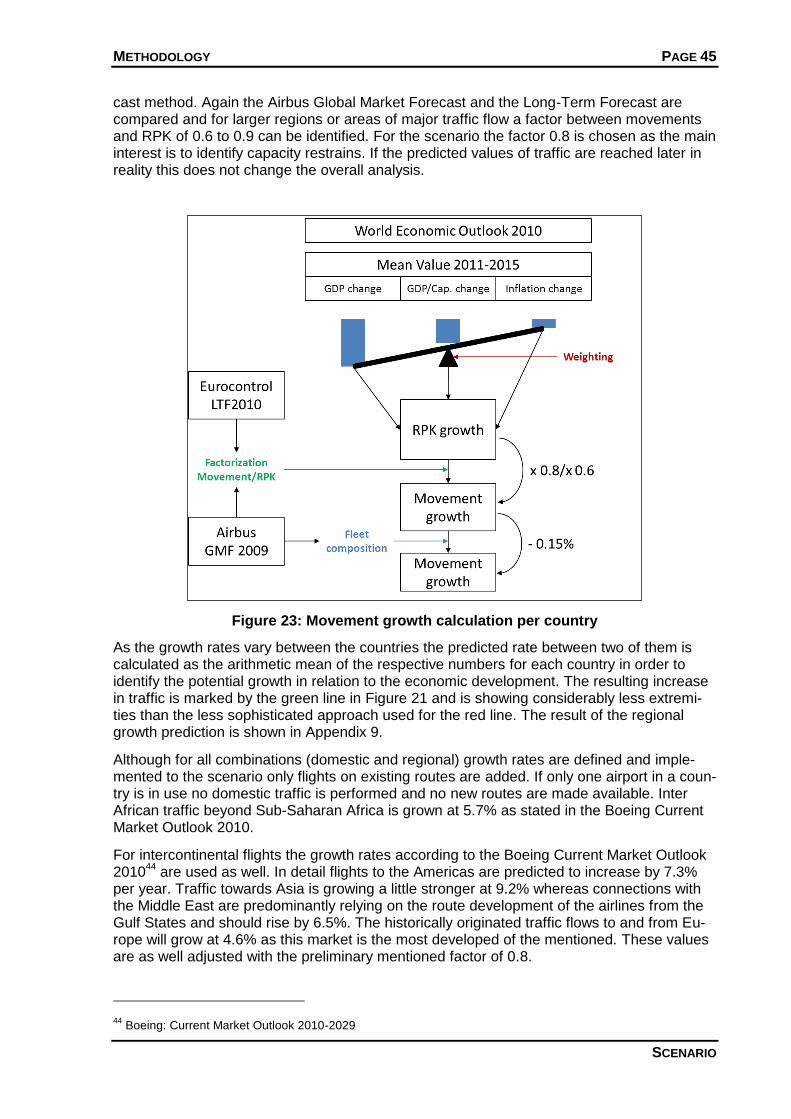
METHODOLOGY PAGE 45
SCENARIO
cast method. Again the Airbus Global Market Forecast and the Long-Term Forecast are compared and for larger regions or areas of major traffic flow a factor between movements and RPK of 0.6 to 0.9 can be identified. For the scenario the factor 0.8 is chosen as the main interest is to identify capacity restrains. If the predicted values of traffic are reached later in reality this does not change the overall analysis.
As the growth rates vary between the countries the predicted rate between two of them is calculated as the arithmetic mean of the respective numbers for each country in order to identify the potential growth in relation to the economic development. The resulting increase in traffic is marked by the green line in Figure 21 and is showing considerably less extremi-ties than the less sophisticated approach used for the red line. The result of the regional growth prediction is shown in Appendix 9.
Although for all combinations (domestic and regional) growth rates are defined and imple-mented to the scenario only flights on existing routes are added. If only one airport in a coun-try is in use no domestic traffic is performed and no new routes are made available. Inter African traffic beyond Sub-Saharan Africa is grown at 5.7% as stated in the Boeing Current Market Outlook 2010.
For intercontinental flights the growth rates according to the Boeing Current Market Outlook 2010
44 are used as well. In detail flights to the Americas are predicted to increase by 7.3%
per year. Traffic towards Asia is growing a little stronger at 9.2% whereas connections with the Middle East are predominantly relying on the route development of the airlines from the Gulf States and should rise by 6.5%. The historically originated traffic flows to and from Eu-rope will grow at 4.6% as this market is the most developed of the mentioned. These values are as well adjusted with the preliminary mentioned factor of 0.8.
44 Boeing: Current Market Outlook 2010-2029
Figure 23: Movement growth calculation per country
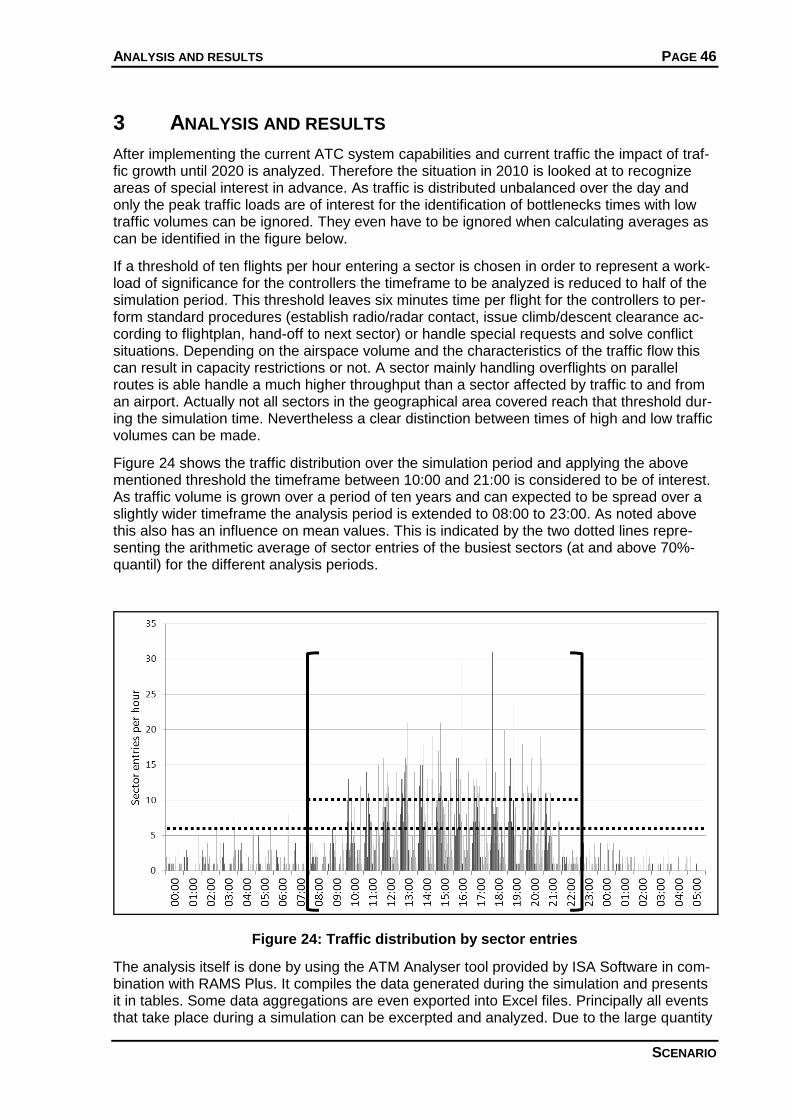
ANALYSIS AND RESULTS PAGE 46
SCENARIO
3 ANALYSIS AND RESULTS
After implementing the current ATC system capabilities and current traffic the impact of traf-fic growth until 2020 is analyzed. Therefore the situation in 2010 is looked at to recognize areas of special interest in advance. As traffic is distributed unbalanced over the day and only the peak traffic loads are of interest for the identification of bottlenecks times with low traffic volumes can be ignored. They even have to be ignored when calculating averages as can be identified in the figure below.
If a threshold of ten flights per hour entering a sector is chosen in order to represent a work-load of significance for the controllers the timeframe to be analyzed is reduced to half of the simulation period. This threshold leaves six minutes time per flight for the controllers to per-form standard procedures (establish radio/radar contact, issue climb/descent clearance ac-cording to flightplan, hand-off to next sector) or handle special requests and solve conflict situations. Depending on the airspace volume and the characteristics of the traffic flow this can result in capacity restrictions or not. A sector mainly handling overflights on parallel routes is able handle a much higher throughput than a sector affected by traffic to and from an airport. Actually not all sectors in the geographical area covered reach that threshold dur-ing the simulation time. Nevertheless a clear distinction between times of high and low traffic volumes can be made.
Figure 24 shows the traffic distribution over the simulation period and applying the above mentioned threshold the timeframe between 10:00 and 21:00 is considered to be of interest. As traffic volume is grown over a period of ten years and can expected to be spread over a slightly wider timeframe the analysis period is extended to 08:00 to 23:00. As noted above this also has an influence on mean values. This is indicated by the two dotted lines repre-senting the arithmetic average of sector entries of the busiest sectors (at and above 70%-quantil) for the different analysis periods.
Figure 24: Traffic distribution by sector entries
The analysis itself is done by using the ATM Analyser tool provided by ISA Software in com-bination with RAMS Plus. It compiles the data generated during the simulation and presents it in tables. Some data aggregations are even exported into Excel files. Principally all events that take place during a simulation can be excerpted and analyzed. Due to the large quantity

ANALYSIS AND RESULTS PAGE 47
RESTRICTIONS
of data it is not always easy to access the relevant data especially if required in particular combination. Basically the data is sorted by flights, sectors, routes, conflicts, taskload and special reports. Different kinds of reports are used in this thesis but it did not prove reasona-ble to concentrate on just a few to draw conclusions for the very different situations. Thus the presentation of a list of reports is omitted here.
Some general information regarding the analysis has to be given in advance. As mentioned above only the timeframe between 08:00 and 23:00 is subject to investigation. If deemed useful even smaller intervals are examined. This may be the case for peak hours. As often as possible sliding hours are used as this data is more precise and representing reality bet-ter than fixed time periods. Peaks are identified according to limits for taskload used by Eu-rocontrol in different studies and capacity assessments
45:
Severe peak hour in excess of 70%
Heavy peak loading in excess of 55%.
3.1 RESTRICTIONS
The first analysis results in some deteriorating numbers. Figure 25 shows that some sectors are already working beyond their capacity. This would lead to significant delays in the whole system. This situation is even increased for the simulation of 2020 traffic numbers.
Figure 25: Sectors excessing workload of 55% 2010
Apparently there are mistakes and arguable occurrences in the simulation that have to be identified and are outlined below before further results can assessed.
The highest workloads are identified for South African airspace especially in the sec-tors affected by traffic between Cape Town and Johannesburg. The controller working beyond 100% in Figure 25 is the Cape Town West planning position.
45 Eurocontrol: CEATS, (p.12)

ANALYSIS AND RESULTS PAGE 48
RESTRICTIONS
Other sectors with significant workload are Dar es Salaam East and Nairobi ACC1 and ACC2. In all three cases it is the planning controller that is encountering the highest workload. At this point it has to be remembered that the sectorization of Kenyan air-space is already changed according to the prospects made in the Kenyan Airspace Master Plan.
South African sectors are reduced in the vertical dimension to a lower limit of FL245. In reality they extend down to the upper limits of the TMAs (FL105 and FL145).
As excessive workloads occur only at planning controller positions the rulebase defini-tion for these may be false. Although this may be the case it is seen more likely that procedures are used in reality – especially in radar controlled airspaces – that cannot be implemented into the scenario. Coordination that takes place between tactical con-trollers by point-out procedures and approval requests on separation situations man-ageable by tactical but not in compliance with planning rules is not realizable with the software and is therefore influencing analysis results.
The South African airspace is subject to flow management procedures. This system could be implemented to a certain degree by using the MSP tool included in RAMS Plus. As ATFM is a very complex topic and the exact measures taken by the relevant unit are not known the results to be evaluated would be doubtful.
The reduction of the analyzed airspace to FL245 and above with the only external re-strictions resulting from defined airport capacities also omits SIDs and STARs. This leads to the situation that departures from airports enter the ATS route system at any point as soon as climbing trough FL245 and no separation is applied to those flights due to inexistent ATC units.
On ATS routes with dense traffic like Cape Town – Johannesburg and Nairobi – Mom-basa special procedures might be in use to handle higher traffic volumes than possible with standard procedures. For example a parallel offset procedure in order to separate traffic laterally with less interference between aircraft in climb, cruise and descent can be common practice without being laid down in official procedures.
Figure 26: Sectors excessing workload of 55% 2020

ANALYSIS AND RESULTS PAGE 49
TRAFFIC FLOW
For these reasons the approach to the analysis has to be redefined. As the South African ANSP is the most progressive company in the geographical area covered in terms of proce-dures and usage of advanced technologies it is regarded to be able to handle the challenges emerging from traffic growth and even to assist other states covered in the analysis in up-grading their systems technically and operationally. Therefore the analysis will concentrate on the airspaces apart from South Africa.
3.2 TRAFFIC FLOW
Prior to detailed analysis the main traffic flows shall be illustrated as it can be expected that restrictions will be located along these. Figure 27 shows a screenshot of the simulation at around 18:00. This picture is exemplary for all situations with high traffic load. Approximately 80% of the traffic (squares representing single flights) can be enclosed by a shape formed like a banana. Thus it is expected that the airspaces in the east and south of the continent are experiencing exhausted capacity first. Traffic growth is applied to all connexions but it is not likely that the basic situation will change dramatically over the next years as the predic-tion figures show.
Figure 27: Main traffic flows (RAMS screenshot)

ANALYSIS AND RESULTS PAGE 50
INITIAL SITUATION (2010)
3.3 INITIAL SITUATION (2010)
In a first step today’s situation is analyzed. Therefore the workload of sectors separately for planning and tactical controllers is utilized to identify points of interest. In accordance with the previously mentioned Eurocontrol study the limit for peak loading is set to 55%. If this limit is applied and all sectors not reaching this value are left out at the moment five planning controller positions remain to be subject to detailed analysis.
3.3.1 PLANNING CONTROLLERS
Figure 28: Taskload of planning controllers 2010
Dar es Salaam East
This position reaches the highest workload of all sectors. The value of 91.4% implies in line with the measuring method of RAMS Plus that the controller is occupied with different tasks for 55 minutes of the hour starting at 18:00. If this graph is set into relation to the sector en-tries conformity can be identified. As planning controllers are monitoring the traffic situation that has to be expected in the sector up to 20 minutes ahead it is of no surprise that the ac-tual traffic peak is reached short time after the 60 minute timeframe with the maximum work-load of the controller starts. This is emphasized when looking at the tasks performed by the controller during this period. Summing up the workload for each task except PlanningCon-flictSearch this does not even add to the value of this single task (cf. Figure 29).
What can be concluded is that although there is a high traffic load not many possible conflict situations occurred. This was reviewed using the simulation and the respective timeframe showed many northbound overflights already separated by previous sectors and a mention-able number of departures from Dar es Salaam airport also separated by sufficient intervals between take-off times. The ATS route structure with tracks merging overhead Dar es Sa-laam and Nairobi requires continuous monitoring of the situation especially as long as verti-

ANALYSIS AND RESULTS PAGE 51
INITIAL SITUATION (2010)
cal separation does not exist. Traffic to and from the Middle East is grown in the simulation at a high rate and this is one of the most affected airspaces. It can be expected that although the current situation may be overestimated this is or will become a bottleneck.
Figure 29: Segmentation of workload Dar es Salaam East Planning Controller
Gaborone
This sector encounters two significant extremities shortly after noon and in the afternoon. The maximum number of flights in the respective peak sliding hours is 16 and correspond-ingly lower than in the previously covered sector but the lateral extension is comparable. An airspace description is given in Chapter 2.2.1 with a point out of the special route structure.
The first peak results from an outbound phase in Johannesburg. Nearly all northbound flights cross Botswana. The second peak is formed by inbound traffic to Johannesburg. The remarkable fact is that it is not the merging point overhead Gaborone VOR that has to cope with most of the traffic in these peaks as could be assumed from the ATS route layout but the small extension to the southeast in the area of Francistown. Obviously the regional traffic is creating the highest traffic load. As traffic in the peak hours is concentrated to a small area the traffic congestion and therefore the workload is raised.
Harare
There is a strong correlation between the airspaces of Botswana and Zimbabwe regarding the traffic peaks as flights proceeding via Francistown cross Zimbabwean airspace prior to or after that (cf. Figure 30). The additional flights result from departures and arrivals in Harare and overflights mainly towards South Africa proceeding further to the east on UA405. Harare and Gaborone planning controllers remain below a workload of 70% which is seen as the next critical limit above the 55% that were used to identify the sector regarded here and are therefore considered manageable. Manageable is meaning the availability of capacity in or-der to cope with higher traffic volumes. Nevertheless an allocation of additional traffic should be done in a way to spread the volume to a wider timeframe.

ANALYSIS AND RESULTS PAGE 52
INITIAL SITUATION (2010)
Figure 30: Trafficflow Gaborone and Harare ACC per sliding hour
Kinshasa
At the peak hour between 14:00 and 15:00 there are no more than 14 aircraft in the sector at a time. It is again the ATS route structure causing high workload as flights cross between the Democratic Republic of the Congo and Congo-Brazzaville at a single point. Particularly the oil production driven economy of Nigeria is creating a significant demand for air travel and the most direct routing between West and South eastern Africa is through Congolese Air-space. The restrictions in capacity caused by the ATS routing system between the two Con-golese states have been dealt with by adding direct routings to East Africa and by the im-plementation of the Red Carpet routes between Europe and South Africa. Significant pro-gress in cutting the Gordon Knot between Kinshasa and Brazzaville sectors depends on the resolution in the dispute on the undefined border between the countries.
Nairobi ACC2
As mentioned above it is normally to be expected that workload of the planning controller rises a certain time ahead of traffic. The figure below shows the workload of the planning controller in sliding hours on a 10 minutes grid and the number of flights in the sector. Five peaks in the traffic flow can be identified and are marked by black dots. The peaks in work-load closest to the traffic peaks are marked by black bars.
Obviously the expected position of the marked bars and dots is met at the first, third and fourth peak. But two observations have to be analyzed in further detail. On the one hand the fact that the workload peak is reached slightly after or at the point of highest traffic amount at peaks two and five. On the other hand the incongruity of the ratio between traffic and work-load peaks.
Both problems appear to have the same reason. If the traffic flow of peak two and five is examined one can clearly identify that the workload is strongly influenced by the sector en-tries from Null airspace. Illustrated in Figure 32 is the Kenyan airspace and apparently no lateral border to Null airspace exists with Nairobi ACC2. The source of entries from Null air-space is marked with a black circle pointing to Jomo Kenyatta airport. In fact these flights are departures from this airport.

ANALYSIS AND RESULTS PAGE 53
INITIAL SITUATION (2010)
Figure 31: Comparison of workload and traffic peaks in Nairobi ACC2
This is also consistent with the data provided in the next figure showing the tasks carried out by the planning controller within the relevant timeframe in the early afternoon (peak two). Comparing this data with the one presented above for Dar es Salaam East the Kenyan con-troller is much more tasked with the identification of a safe initial flight level for the depar-tures because there is conflicting traffic restricting the flights to lower levels than requested. The high value for the planning conflict search appears again. This observation will be ad-dressed later.
Figure 32: Entry and exit of flights to and from Nairobi ACC2
The planning controller can start to react to a departing flight not earlier than its take-off. No preplanning 20 minutes ahead can take place and therefore workload rises in conjunction with traffic numbers.
The incongruity between traffic load and workload results from the complexity of the traffic situation. In the time interval between 20:00 and 21:00 236 possible conflict situation are identified by the planning and tactical controllers of Nairobi ACC2. However only on four oc-casions a resolution manoeuver is deemed necessary and is executed.
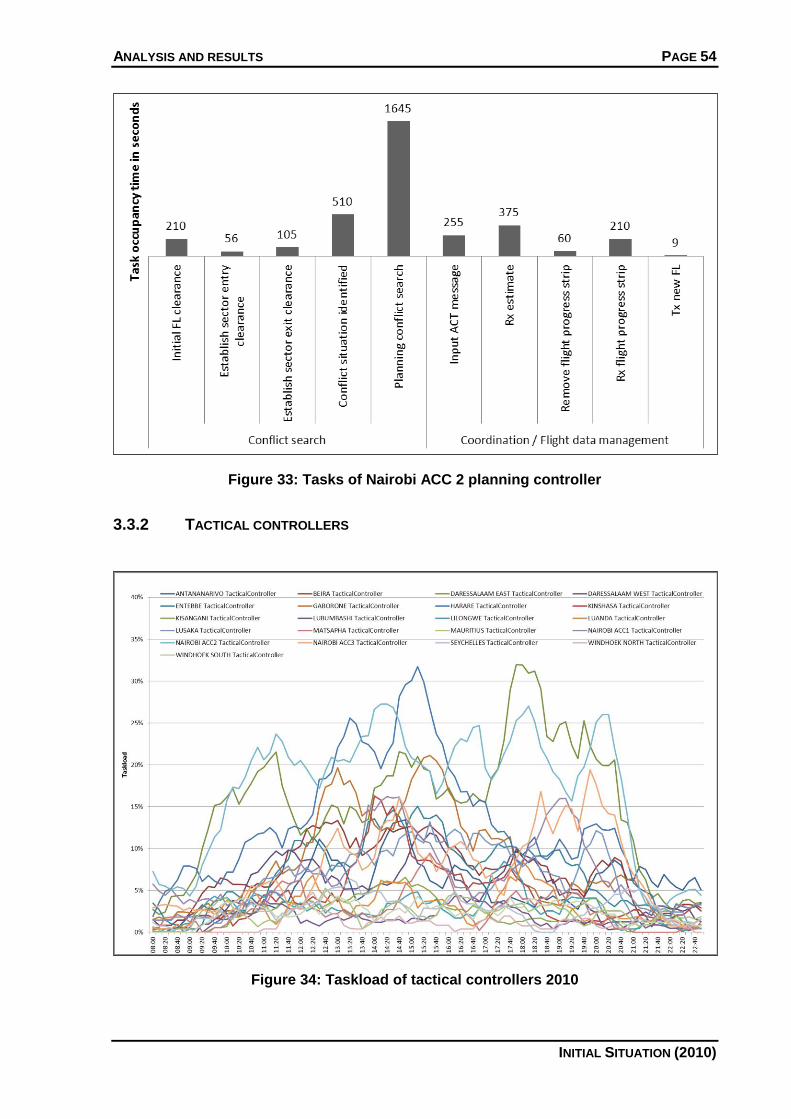
ANALYSIS AND RESULTS PAGE 54
INITIAL SITUATION (2010)
Figure 33: Tasks of Nairobi ACC 2 planning controller
3.3.2 TACTICAL CONTROLLERS
Figure 34: Taskload of tactical controllers 2010

ANALYSIS AND RESULTS PAGE 55
INITIAL SITUATION (2010)
Figure 34 shows the distribution of taskload of the tactical controllers in the analyzed timeframe. A first observation shows that the values are significantly lower than for the plan-ning controllers. Presumably this is related to the fact that only conventional control measures can be used by most of the sectors due to a lack of situation displays and many conflicts are solved in advance by the planning controllers. Again the analysis shall be fo-cussed on a few selected positions. In this case the sectors encountering a taskload of 20% or more shall be reviewed and in addition to that Nairobi ACC1 and ACC3 as they cross the 15% line in the evening and it is considered of interest as in how far this is related to the ACC2 sector.
Figure 35: Sector entry and exit to and from Dar es Salaam East
Dar es Salaam East
As can be seen in Figure 33 there is a period of high taskload around 18:00. This is congru-ent with the analysis previously made for the planning controller. Actually 20 flights are in the sector at 18:30 which is more than 10% of total sector crossings per day. Figure 35 can be interpreted in a way that many flights arrive from all different directions in order to land at a Tanzanian airport. One could expect this to cause numerous conflict situations.
Actually this is not the case. Figure 36 below shows the distribution of the taskload between different task groups. The communication that takes place is predominantly limited to initial calls. Only twelve conflict situations appear between 18:00 and 19:00. On the right hand side of Figure 36 the type and the resolution manoeuvre applied for these conflicts is shown in combination with the distance at the closest point of approach between the conflicting air-craft. In fact only five resolution manoeuvres are required and the distances between the aircraft are comparably large. This is very typical for non-radar controlled operations. The extraordinary taskload of the planning controller in this sector bolsters the tactical action that would have to be conducted otherwise.

ANALYSIS AND RESULTS PAGE 56
INITIAL SITUATION (2010)
Figure 36: Tasks and conflict situations between 18:00 and 19:00 of
Dar es Salaam East tactical controller
Gaborone and Harare
As it has become clear when analysing the planning controllers there is an interaction be-tween these two sectors. Figure 37 (left) illustrates this as well identifying the traffic flows from (12:20 onwards) and to (14:40 onwards) South Africa through these airspaces. For this timeframe the traffic volumes are presented on the right hand side of this figure by arrows whose size is corresponding to the number of aircraft crossing the border. Stress is laid on visualising the small area this traffic is crossing. Obviously there is numerous opposite traffic. This is not easy to handle in a non-radar environment. Although the overall volume is still not high enough to cause restrictions due to workload and also the planning controllers do have surplus capacity this area can be expected to become one of the bottlenecks in ATC in the geographical area covered.
Figure 37: Gaborone and Harare sector tasks and traffic
Nairobi
In order to analyse the workload of the Kenyan sectors the interval between 17:30 and 21:00 is reviewed in the simulation as all three sectors are of interest. The first peak in this interval is caused by traffic between Nairobi and Mombasa. As flights are flying in both directions at the same time there are a lot of opposite conflicts. The second peak results from heavy traf-fic on the route between Dar es Salaam and Nairobi, a departure wave at Nairobi airport and southbound traffic crossing the airspace or with destinations in Kenya and Tanzania. Espe-cially the opposite traffic problem requires many altitude changes. Hereby additional atten-

ANALYSIS AND RESULTS PAGE 57
ADJUSTMENT OF SCENARIO
tion of the ACC2 tactical controller is required regarding the issuance of initial flight level clearances for departing traffic conflicting with inbound traffic. Some of these situations are solved in advance by the planning controller. Here the large lateral extension of the airspace is problematic. Flights have normally not reached the top of descent point before entering the sector. Thus – although aircraft arriving from Dar es Salaam cross the ACC3 sector be-fore entering ACC2 – ACC3 tactical controller is not able to assist his colleague in establish-ing vertical separation. It has to be noticed that lateral separation methods like vectoring or parallel offset are not used by the controllers in the simulation.
3.4 ADJUSTMENT OF SCENARIO
As previously mentioned in the analysis of the Dar es Salaam East and Nairobi ACC2 plan-ning controllers the value for conflict search is extremely high in comparison to other tasks. This value is created by two configurations in the scenario. At which interval is the planning controller checking flight progress strips for possible conflicts and which weight is given to that task. For the scenario a monitoring interval of three minutes is assumed and the task weight is predefined as five seconds. Obviously this results in unrealistic values. In case of the mentioned controllers they spend half an hour on checking flight progress strips for pos-sible conflict situations. This is unrealistic because they should constantly have a mental picture of the traffic situation 20 minutes ahead. Upon receipt of a new flight progress strip or an estimate revising flight data this picture is updated and modified. In order to do that the strip bay is checked. Depending on the configuration of the sector all flights within a certain time interval have to be checked or it can be concentrated on a few if different independent traffic flows cross the sector. These considerations cannot be reproduced in the simulation environment.
The intention before carrying on with the analysis for 2020 traffic is to equalize the weight of the different tasks performed by planning controllers. Figure 36 exemplarily shows balanced weights for tasks of the tactical controller. Therefore no adjustments are performed in the task weight of tactical controllers.
Figure 38: Distribution of tasks Dar es Salaam East planning controller
In order to accomplish this intention either the scanning interval or the task weight can be reduced. For the present scenario the second method is chosen. This represents the fact of constant awareness of the traffic situation of the planning controller by maintaining the moni-

ANALYSIS AND RESULTS PAGE 58
ADJUSTMENT OF SCENARIO
toring interval at a high level. As this should not require revising all flight progress strips at every interval the task weight can significantly be reduced, in this case to two seconds. The previously used task weight of five seconds allowed scanning for all possible conflict situa-tions a certain flight might experience. With the reduction this scan is simulated to be per-formed every seven to eight minutes which is deemed closer to reality. The percentages in Figure 38 present the results of this adjustment.
The modified task weight for conflict search influents the Dar es Salaam planning controller in a way that the time spent on identification and solution of conflicts (first bar in Figure 38) is approximately equal to the time spent on monitoring the traffic situation for possible conflicts. Also the coordination processes that are either standard procedures (e.g. input of ACT mes-sages to the flight data processing system) or connected to the solution of conflicts are in line with the other values.
Figure 39: Comparison of taskloads before and after adjustment
As the adjustment is made in a linear way the conclusions drawn from the previous results for 2010 traffic remain valid. A change has to be done in the expectation of the instant of time when sector capacity is reached. As Dar es Salaam East’s taskload has been consid-ered to reach an extreme value of 91.4% only a small number of additional flights could be handled. This peak is now reduced to 63.5% and therefore the increase in traffic that is pre-dicted for the scenario may be expected to be manageable. Figure 39 exemplarily shows the graphs for taskloads of Dar es Salaam East (green curves) and Nairobi ACC2 (red curves) planning controllers before and after the adjustment to the task weight. The characteristics of the curves do not change but are solely displaced to a lower level. The reduced extremities of the amplitudes are not changing the overall statement and the consequential conclusions as well.
The revised task weight will be used in the analysis of 2020 traffic and comparison of task-loads is done in relation to the adjusted values.

ANALYSIS AND RESULTS PAGE 59
PREDICTED SITUATION (2020)
3.5 PREDICTED SITUATION (2020)
Analysis will be done for each of the sectors with special attention paid to the situation and the developments in the sectors already examined for 2010.
3.5.1 ANTANANARIVO
The taskload curves for the planning and tactical controllers for 2010 and 2020 show signifi-cant differences. It has to be noticed that the planning controller encounters around double the taskload of the tactical controller. At some points the taskload value of 2010 is higher than the value for 2020. This results from differences in the simulation caused by stochastic variations and action applied by the entities simulated. Two interesting observations can be made.
Figure 40: Comparison of taskloads Antananarivo
The extreme values the planning position reaches in the morning (four times the value of 2010) result predominantly from the high traffic growth that is expected for traffic be-tween Africa and Asia (+9.2%). The first peak is formed by the inbound traffic from Asia to South Africa. As for the traffic growth only city pairs that exist in the basic sce-nario are cloned there may be an overestimation as not only existing routes will en-counter denser traffic. Nevertheless it should also be taken into account that new city pairs can lead to more complex situations as different routings are used and therefore the establishment of separation is more demanding than in a scenario where all flights arrive separated on a single route. In the present case the time interval between the cloned flights is very small and thus affecting the sector more than it is expected. The second peak can be derived from the traffic mix. Whereas at the first peak only two traffic flows (Réunion – Europe and Asia – South Africa) have to be handled around 15:00 flights in all directions as well as departures and arrivals from and to Réunion are crossing the airspace requiring more careful preplanning. This peak is not signifi-cantly increased over 2010. The third peak is formed by the reversed traffic flow seen in the morning. No extremities as in the morning are observed here. This is due to the fact that the cloned flights are distributed over longer intervals. This peak is therefore regarded as more realistic than the first in respect to amplitude.
The time difference between the peak taskloads for the planning (10:00 and 14:40) and the tactical controllers (12:40) can be explained by the good preplanning that is performed resulting in a reduced taskload for the tactical controller when taking over responsibility for the flights. The comparably late peak at 12:40 is based on the dimen-

ANALYSIS AND RESULTS PAGE 60
PREDICTED SITUATION (2020)
sion of the controlled airspace. It results from the same flights causing the high work-load situation for the planning controller about two hours before but now sector exit separation has to be established and this is done by the tactical controller. Due to the preplanning before sector entry the task of establishing sector exit separation is less demanding and the value is not higher than in 2010 in comparison to the fourfold in-crease in the planning controller’s taskload.
3.5.2 BEIRA
The airspace of Mozambique is closely related to the Madagascan. The traffic peak at 12:00 is resulting from the same flights from Asia to South Africa that cause the peak Antananarivo ACC encounters around 10:00. As ATS routes merge overhead Maputo and Beira the tacti-cal controller is challenged more with the same flights than the tactical controller in Antana-narivo. An equivalent situation occurs in the evening but at lower scale.
Figure 41: Comparison of taskloads Beira
3.5.3 DAR ES SALAAM
Dar es Salaam East
As expected Dar es Salaam East sector is significantly affected by the increase in traffic. Mainly in the early afternoon workload rises in comparison to 2010 figures but remarkable is the extreme value at 18:00 for the planning controller. A short time later a less significant increase for the tactical position is observed. The new peak marked by a taskload of 112.4% for the planning controller is located at 19:20. Therefore the relevant timeframe is reviewed in the scenario.
This review identifies the reason for the high workload in the traffic from and to the airports at Dar es Salaam and Kilimanjaro. Figure 43 shows departures and arrivals at these two airports in the respective timeframe. In the beginning a departure phase at Kilimanjaro can be observed followed by a departure phase at Dar es Salaam. After 22:00 an arrival peak at Kilimanjaro can be observed. The phases are very dense and therefore require a lot of coor-dination and preplanning by the respective controller.
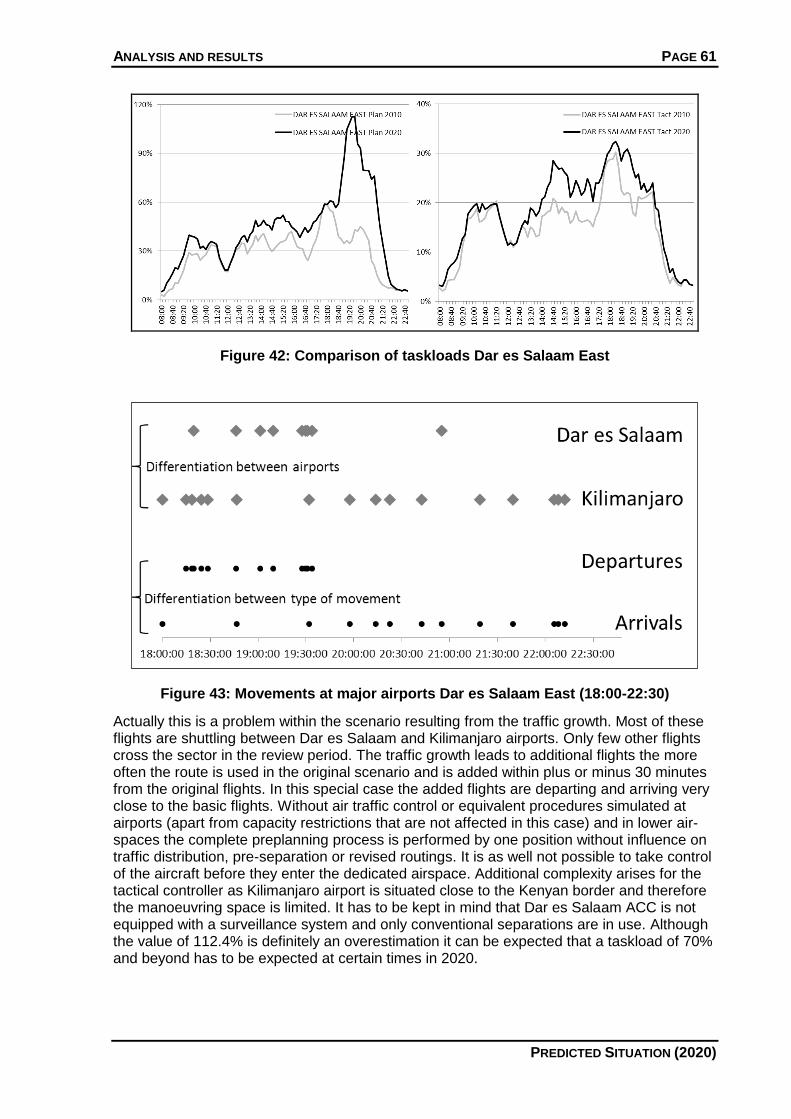
ANALYSIS AND RESULTS PAGE 61
PREDICTED SITUATION (2020)
Figure 42: Comparison of taskloads Dar es Salaam East
Figure 43: Movements at major airports Dar es Salaam East (18:00-22:30)
Actually this is a problem within the scenario resulting from the traffic growth. Most of these flights are shuttling between Dar es Salaam and Kilimanjaro airports. Only few other flights cross the sector in the review period. The traffic growth leads to additional flights the more often the route is used in the original scenario and is added within plus or minus 30 minutes from the original flights. In this special case the added flights are departing and arriving very close to the basic flights. Without air traffic control or equivalent procedures simulated at airports (apart from capacity restrictions that are not affected in this case) and in lower air-spaces the complete preplanning process is performed by one position without influence on traffic distribution, pre-separation or revised routings. It is as well not possible to take control of the aircraft before they enter the dedicated airspace. Additional complexity arises for the tactical controller as Kilimanjaro airport is situated close to the Kenyan border and therefore the manoeuvring space is limited. It has to be kept in mind that Dar es Salaam ACC is not equipped with a surveillance system and only conventional separations are in use. Although the value of 112.4% is definitely an overestimation it can be expected that a taskload of 70% and beyond has to be expected at certain times in 2020.

ANALYSIS AND RESULTS PAGE 62
PREDICTED SITUATION (2020)
Figure 44: Comparison of taskloads Dar es Salaam West
Dar es Salaam West
This sector is not experiencing high traffic and taskloads although the peak around 15:20 is remarkably increasing from 2010 to 2020. At some points during the day the taskload is even reducing from 2010 to 2020. This results from a varying traffic distribution.
Figure 45 shows two dots per every flight crossing the sector representing the sector entry and exit FL. If two dots are located at the same position this indicates that the flight does not perform a level change. Obviously most flights are only crossing the sector at their cruising altitude. Due to scaling effects the increased spacing between flights at the first peak is not visible resulting in slightly lower taskload for the planning controller. The major peak can be identified clearly by the increase in flights crossing the sector and the increase in FL used in the interval between 15:00 and 17:00. The lower taskload in the period afterwards is also based on increased spacing (vertical and horizontal) between the relevant flights which is distinguishable from the figure as well.
Figure 45: Traffic by entry and exit FL Dar es Salaam West
(arranged by sector entry times)

ANALYSIS AND RESULTS PAGE 63
PREDICTED SITUATION (2020)
3.5.4 ENTEBBE
Entebbe ACC’s taskload distribution is comparable to that of Dar es Salaam West but most traffic is crossing between Congolese and Kenyan airspace on UA609. There are some sig-nificant increases in traffic load but the overall taskload remains low.
Figure 46: Comparison of taskloads Entebbe
Figure 47 illustrates the timely distribution of flights crossing the sector. At the highest peak an increase in density of overflights is observed. The dint following that peak in 2010 figures is almost in total levelled by additional flights. As can be seen only overflights are causing significant changes in taskload in this sector.
Figure 47: Traffic by intention Entebbe
3.5.5 GABORONE
The increase in taskload in this sector is another good example for the cloning process and emphasizes the observations made for 2010. Figure 48 suggests additional traffic at the be-ginning of the analysis period and in the afternoon. Figure 49 confirms that. In 2020 37 flights cross the eastern corner of Botswana airspace in the time interval between 08:00 and 23:00 that was identified as a possible bottleneck when analysing 2010 data. This conclusion is also consistent with the peaks observed in the taskload. In comparison only 28 flights cross the sector on routes like UG853, UN184, UM731 or UM998 from northwest to south-

ANALYSIS AND RESULTS PAGE 64
PREDICTED SITUATION (2020)
east and vice versa. The busy route between Gaborone and Johannesburg (45 flights per day) does not affect the airspace examined here as flights do not reach FL245 before leav-ing Botswana’s airspace.
It has to be admitted that the figures shown include some overestimation as no sector skip times are implemented in the scenario. This leads to short sector pierces at the boundary between Botswana and Zimbabwe due to the meander like character of the border requiring tasks to be performed.
Figure 48: Comparison of taskloads Gaborone
Figure 49: New flights crossing Gaborone
3.5.6 HARARE
30 flights are predicted to be operated between Harare and Johannesburg every day. This is an increase of 100% compared to 2010 and the foremost reason for the higher taskload. In this context it shall again be noted that the offer of more capacity is likely to be provided by the use of larger aircraft in similar situations. Especially with regard to Zimbabwe another deficiency in the traffic growth calculation has to be noted. The political situation in some of the countries in the geographical area covered may be a hindrance to traffic growth on a

ANALYSIS AND RESULTS PAGE 65
PREDICTED SITUATION (2020)
regional basis as well in a way that instabilities cause incertitude for businesses and subse-quent air traffic predictability.
Figure 50: Comparison of taskloads Harare
Sector Entry Time
[hhmmss] Call Sign ADEP ADES
Entry FL
Exit FL
182927 4Z8164 FAJS FLLS 310 310
184119 ZJ503 FLLS FVHA 245 245
190236 4Z8102 FAJS FVHA 270 245
190600 ZO424 FVHA FVFA 245 245
190706 SA6776x1 FAJS FVHA 310 245
191306 ZO419 FQBR FVHA 250 250
191910 SA6776x2 FAJS FVHA 310 245
192249 4Z8102x1 FAJS FVHA 270 245
192557 UM232x1 FVBU FVHA 245 245
194347 UM232 FVBU FVHA 245 245
194549 4Z8102x2 FAJS FVHA 270 245
195201 SA6776 FAJS FVHA 310 245
200018 UM361x1 FVHA FAJS 245 310
200028 UM232x2 FVBU FVHA 245 245
201119 UM361 FVHA FAJS 245 310
201333 ZJ234 FAJS FLLS 310 260
202532 UM361x2 FVHA FAJS 245 280
202743 SA185 HKNA FAJS 390 390
203348 LH8297 FAJS HKNA 390 390
203540 4Z8165 FLLS FAJS 310 310
204413 UM361x3 FVHA FAJS 245 310
205060 ZO425 FVFA FVHA 245 245
205423 UM361x4 FVHA FAJS 245 310
205719 4Z8103 FVHA FAJS 245 270
Table 3: Flights crossing Harare
Table 3 lists all flights crossing the sector between 18:30 and 21:00. In this time period the taskload steps up considerably. In the first part many flights are proceeding inbound Harare. Call signs ending with x1, x2 and so forth are clones representing the traffic increase. The

ANALYSIS AND RESULTS PAGE 66
PREDICTED SITUATION (2020)
interval between these sector entries is relatively small. Reviewing the tasks performed by the controllers a significant number of FL related transmissions are performed (clearance issuance and reaching level report). This is also required in order to establish sector exit separation as times of arrival in Harare are concentrated to a short period (8 landings be-tween 19:50 and 20:15).
The obvious conflict situation between SA185 and LH8297 shall be analyzed in detail as an example for resolutions applied by tactical controllers within the simulation (cf.
Appendix 7). At 20:26:03 communication is established with SA185 and at 20:32:08 with LH8297. Three minutes later the conflict situation is identified. A new FL clearance is trans-mitted to LH8297 at 20:47:48 and the FL is reached at 20:50:52. A few minutes later the conflict situation is solved and LH8297 is cleared back to its original FL at 20:58:58 which is reached at 21:02:03. The handling of both flights sums up to a taskload of 339 seconds. Without the conflict only 272 seconds of tasks would have to be accounted for the two flights. This is equivalent to an increase in taskload of 25%.
3.5.7 KINSHASA
Kinshasa
The interval between 10:40 and 12:40 shows lower taskloads for 2020 than for 2010. As there is no change in total traffic volume this is just due to stochastic distributions within the scenario. The only significant increase for both control positions is seen in the afternoon. This results from the cloning of two flights (KL591 and KL597) from Amsterdam to Johan-nesburg and Cape Town. The highest peak is reached when flights to and from West Africa cross the sector in the early afternoon. The overall taskload remains low.
Figure 51: Comparison of taskloads Kinshasa
Kisangani
There are no additional flights in the time period covered in the analysis. The differences in taskload result from variations within the scenario. The overall taskload is very small.

ANALYSIS AND RESULTS PAGE 67
PREDICTED SITUATION (2020)
Figure 52: Comparison of taskloads Kisangani
Lubumbashi
The taskload encountered by the controllers is negligible and no significant changes over 2010 figures can be observed.
Figure 53: Comparison of taskloads Lubumbashi

ANALYSIS AND RESULTS PAGE 68
PREDICTED SITUATION (2020)
3.5.8 LILONGWE
No additional flights cross the sector. There is only one peak observable in the late after-noon. The traffic load would even be lower if the sector skip option would be included in the scenario. Figure 55 illustrates the traffic flows through the sector. Most of the flights are sole-ly crossing the north-western end of Malawi airspace. The time inside the sector is approxi-mately two minutes. This results in comparably high taskload figures as for each flight a flight progress strip is received and removed, a hand-off is performed and an initial call takes place. This is weighted with circa 90 seconds for both controllers. In case the flights would enter at shorter intervals a very high taskload would be encountered.
Figure 54: Comparison of taskloads Lilongwe
Figure 55: Number of flights crossing Lilongwe sector
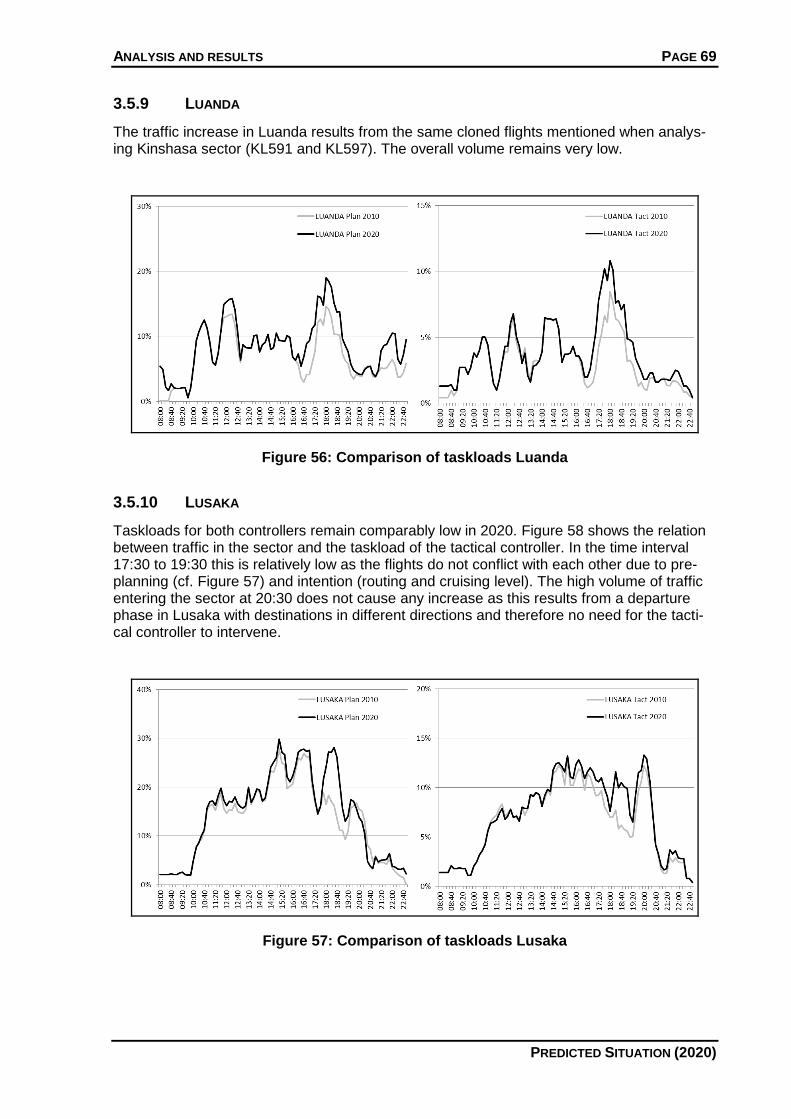
ANALYSIS AND RESULTS PAGE 69
PREDICTED SITUATION (2020)
3.5.9 LUANDA
The traffic increase in Luanda results from the same cloned flights mentioned when analys-ing Kinshasa sector (KL591 and KL597). The overall volume remains very low.
Figure 56: Comparison of taskloads Luanda
3.5.10 LUSAKA
Taskloads for both controllers remain comparably low in 2020. Figure 58 shows the relation between traffic in the sector and the taskload of the tactical controller. In the time interval 17:30 to 19:30 this is relatively low as the flights do not conflict with each other due to pre-planning (cf. Figure 57) and intention (routing and cruising level). The high volume of traffic entering the sector at 20:30 does not cause any increase as this results from a departure phase in Lusaka with destinations in different directions and therefore no need for the tacti-cal controller to intervene.
Figure 57: Comparison of taskloads Lusaka

ANALYSIS AND RESULTS PAGE 70
PREDICTED SITUATION (2020)
Figure 58: Taskload of tactical controller vs. traffic entering Lusaka sector
3.5.11 MATSAPHA
There are three traffic peaks. The first is formed by arrivals from Asia to Johannesburg. The second and third peaks result from traffic from Johannesburg to Asia. As flights do not re-main longer than three minutes in the sector considerations made in the description of the Swazi airspace and on the above mentioned sector skipping option are valid in this case as well.
Figure 59: Comparison of taskloads Matsapha

ANALYSIS AND RESULTS PAGE 71
PREDICTED SITUATION (2020)
3.5.12 MAURITIUS
The characteristic of the graph for the planning controller’s position illustrates problems that may occur when setting up a scenario. In the morning hour six additional flights from Asia to Johannesburg enter the sector from Null airspace. In this case the reduction of the analysis timeframe to 08:00 until 23:00 cuts off the ascent in taskload of the controllers. As separa-tion values for Null airspace are not defined these flights enter within a few minutes and separation has to be established by the Mauritian controller. This is not a realistic scenario as flights would normally enter the sector well separated and therefore the loss of infor-mation at the beginning of the analysis timeframe is negligible.
In the evening six additional flights from Johannesburg to Asia cross the airspace. As these flights are previously handled by other defined sectors with separation established between them the increase in taskload is low. This situation is also expected for the morning peak.
Figure 60: Comparison of taskloads Mauritius
3.5.13 NAIROBI
Nairobi ACC1
An increase in flights crossing the sector in the analysis period of 16% takes place. This ad-ditional traffic is evenly allocated to the scenario and does not cause inconvenience for the controllers.

ANALYSIS AND RESULTS PAGE 72
PREDICTED SITUATION (2020)
Figure 61: Comparison of taskloads Nairobi ACC1
Nairobi ACC2
Interestingly the first two of the significant peaks cover ten additional flights and the third one only eight. The respective time periods are reviewed for detailed analysis.
Figure 62: Comparison of taskloads Nairobi ACC2
The first peak is characterized by numerous departures and arrivals from and to Nairo-bi airport. Especially the departures of cloned flights are unevenly distributed and often take place coincidentally. Again the absence especially of departure procedures leads to the identification of multiple conflict situations that would otherwise not exist. This is the reason for the doubling of taskload with an increase of traffic of only one third. The crossing traffic does not cause problems as it is low in number and not conflicting due to the availability of sufficient unoccupied FLs.
The second peak is similar to the first one. Again a departure phase with short inter-vals between flights requires pre-planning. Especially flights leaving the sector to the south-east cause separation problems as an arrival phase with flights mainly arriving from the south is subsequent to it. 17 aircraft enter the sector within 45 minutes of which seven are cloned. This also leads to the situation that arrivals are descended early and operate uneconomically.
The third peak incorporates departures and arrivals as well as numerous overflights. This leads to a higher complexity than before and therefore nearly triples the taskload
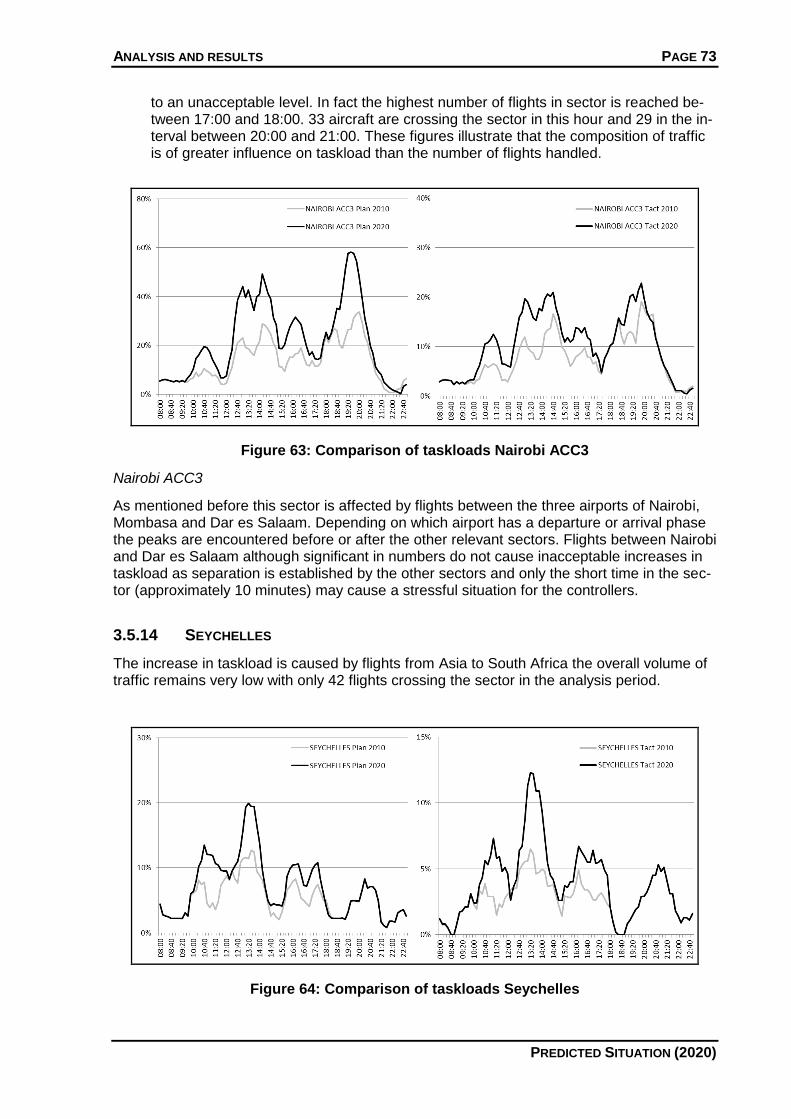
ANALYSIS AND RESULTS PAGE 73
PREDICTED SITUATION (2020)
to an unacceptable level. In fact the highest number of flights in sector is reached be-tween 17:00 and 18:00. 33 aircraft are crossing the sector in this hour and 29 in the in-terval between 20:00 and 21:00. These figures illustrate that the composition of traffic is of greater influence on taskload than the number of flights handled.
Figure 63: Comparison of taskloads Nairobi ACC3
Nairobi ACC3
As mentioned before this sector is affected by flights between the three airports of Nairobi, Mombasa and Dar es Salaam. Depending on which airport has a departure or arrival phase the peaks are encountered before or after the other relevant sectors. Flights between Nairobi and Dar es Salaam although significant in numbers do not cause inacceptable increases in taskload as separation is established by the other sectors and only the short time in the sec-tor (approximately 10 minutes) may cause a stressful situation for the controllers.
3.5.14 SEYCHELLES
The increase in taskload is caused by flights from Asia to South Africa the overall volume of traffic remains very low with only 42 flights crossing the sector in the analysis period.
Figure 64: Comparison of taskloads Seychelles
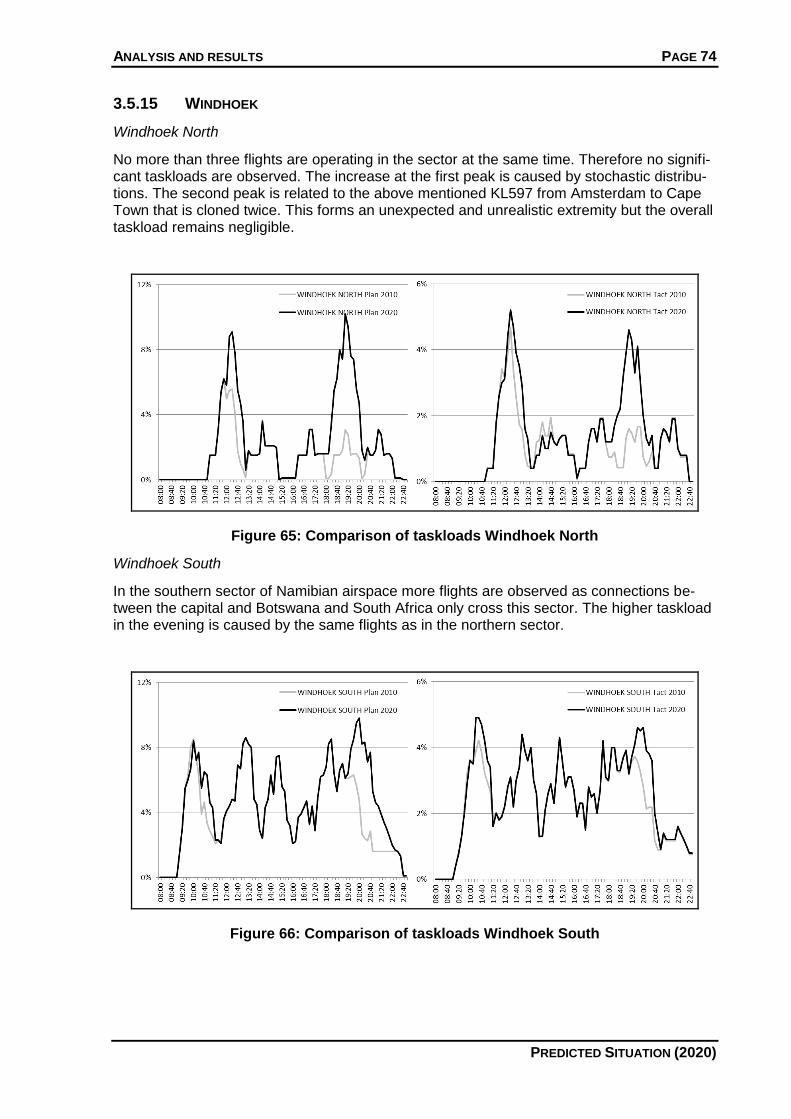
ANALYSIS AND RESULTS PAGE 74
PREDICTED SITUATION (2020)
3.5.15 WINDHOEK
Windhoek North
No more than three flights are operating in the sector at the same time. Therefore no signifi-cant taskloads are observed. The increase at the first peak is caused by stochastic distribu-tions. The second peak is related to the above mentioned KL597 from Amsterdam to Cape Town that is cloned twice. This forms an unexpected and unrealistic extremity but the overall taskload remains negligible.
Figure 65: Comparison of taskloads Windhoek North
Windhoek South
In the southern sector of Namibian airspace more flights are observed as connections be-tween the capital and Botswana and South Africa only cross this sector. The higher taskload in the evening is caused by the same flights as in the northern sector.
Figure 66: Comparison of taskloads Windhoek South

VALIDATION PAGE 75
RAMS PLUS
4 VALIDATION
4.1 RAMS PLUS
Before answering the question whether RAMS Plus is a suitable tool to conduct comparable analyses the following questions may arise. Is it reasonable to simulate and analyse air-space as large and heterogeneous as the one covered in the present thesis?
The dimension is not seen problematic as it is only extending the effort to be put ahead and the amount of calculations to be performed by the software. The heterogeneity does cause difficulties. Complexity of the input data is a minor constraint. The validity of results and es-pecially the conclusions drawn have to be proven for each of the different environments. The differences between sectors are dimension of airspace, means of surveillance and control (radar, procedural), traffic characteristics (overflights, departures and arrivals, congestions in area and time) and procedures established with adjacent entities (separation, hand-off pro-cedures, sector entry and exit points).
For clarification Lilongwe and Nairobi ACC2 sectors shall be compared. Lilongwe sector is relatively small and flights are subject to procedural control. Traffic to and from Malawi air-ports is limited and therefore overflights cause most of the traffic load. These flights cross the airspace predominantly in the north and only remain in responsibility of the tactical con-troller for two minutes. It is arguable whether a hand-off for this short interval is reasonable. It has to be mentioned again that hand-off and coordination procedures established on bilat-eral basis are not included in the scenario due to a lack of information. Nairobi ACC2 in con-trast to that is approximately twice as big and controlled by radar. Although more overflights are accounted in this sector the workload is closer related to airport traffic as. These flights are additionally congested in time. The resulting figures for Nairobi ACC2 illustrate well the predominance of situation complexity over total traffic load. Also a geographical concentra-tion in the triangle formed by Nairobi, Mombasa and Dar es Salaam can be observed. These considerations shall underline the inapplicability of restricting the analysis methods to a lim-ited number of repeatedly exercised calculations.
RAMS Plus is offering an extensive range of definable values. Heterogeneity is therefore not problematic on the input side if sufficient data is available. The large amount of data requires the user of the software to implement the data directly to the database. Nevertheless this approach should be performed with care in order to prevent mismatches as troubleshooting in the raw data is very complex. Adjustment of values is often performed faster and easier using the graphic interface.
Scenario complexity and extent is heavily influencing simulation performance. Due to this fact it is recommended to either reduce the complexity or the number of sectors subject to analysis. For the scenario developed the complexity can be esteemed moderate. The num-ber of sectors simulated is very high. As South African airspace is side lined only in the anal-ysis but not in the scenario this is expected to have a major impact on simulation perfor-mance.
In summary RAMS Plus is seen a well suited tool for this analysis as the detailedness is ad-justable to the needs. Also for other investigations such as TMA related analyses the soft-ware properties are expected to be beneficial. The interface is showing some drawbacks. Although the graphic editor is easy to handle it is not suitable to implement large databases. The import/export functionality is helpful but direct access to the database using an interface instead of rewriting single files would be considered advantageous.
The most interesting observation made during the analysis is the fact that most conflicts are solved by the planning controllers resulting in an imbalance between the workload of the two controller positions. In reality one would expect that as soon as the planning controller

VALIDATION PAGE 76
SCENARIO
reaches a certain limit in workload conflicts are not solved any more but handled to an extent that the tactical controller is able to manage the situation. For example Nairobi ACC2 it was observed that the planning controller’s workload exceeds 100% at certain times while the tactical controller’s workload remains below 40%. Beside overestimations included in the analyzed data an uneven distribution of tasks that distinct would not be acceptable and prac-ticable in reality.
4.2 SCENARIO
First of all it has to be stated that most airspaces are not expected to reach capacity limits by 2020 although traffic growth is predicted high. Another statement applicable to all airspaces is the existence of pronounced peaks.
The occurrence of the peaks at certain times of the day is closely related to the geographical position of the airspace. This has become clear when reviewing the interdependency of Gaborone and Harare sectors. The merging area for flights to and from Johannesburg was expected to become a bottleneck. Although traffic via this small area is increasing the result-ing workload is not identifying any restrictions. Primarily for crossing traffic not originating in Botswana or Zimbabwe the establishment of separation is performed by previous sectors and therefore not causing more than linear increase in tasks in relation to the number of air-craft. This fact stresses the observation of higher taskloads in sectors above busy airports. At this point it shall also be mentioned that airport capacity as defined in chapter 2.2.2 has never been identified an influencing factor to the number of movements (cf. reference 22). On the contrary the lack of restrictions is identified as the source of many traffic peaks.
As traffic is concentrated on comparably few routings also the number of sectors affected is low. This result may be heightened by the assignment of routings. As no route finding tool is available in RAMS Plus 5.0 possibly not all flights used the shortest routes due to wrong identifications during the preparation of the scenario.
Figure 67: Route usage 2020 (more than 20 flights per day)
Some of the busiest routings are very short in comparison to the dimension of the African continent. The distances between Gaborone, Harare and Johannesburg, between Nairobi and Dar es Salaam, Mombasa as well as between Kilimanjaro and Dar es Salaam are short-er than 500 NM. For some of these routes it may be applicable to either create special pro-

VALIDATION PAGE 77
SCENARIO
cedures or designated airspaces as already presented in the Kenya Airspace Master Plan46
. Especially the creation of new sectors can be expected to significantly reduce workload for the controllers. This shall be elucidated in more detail.
As mentioned in chapter 2.2.1 the Kenyan airspace has been sectorized according to the proposals in the Kenya Airspace Master Plan. Apart from the extremities previously men-tioned the mean values of planning controller taskload shall be sufficient for clarification: ACC1 (13.4%), ACC2 (54.9%) and ACC3 (22.2%). As taskload is equivalent to the time spent on performing certain activities it is seen inevitable to divide the sector into smaller parts as summing up these values results in a mean taskload of more than 90%. What has to be seen critical is the imbalance (approximately factor ‘2’) between the sectors and there-fore this specific partitioning is not recommended. As ACC2 extends down to FL145 a verti-cal split-up to separate overflights at high levels from aircraft departing from or arriving at Nairobi airport may be of benefit. A suitable solution could be to assign the ACC2 airspace above FL300 (depending on average aircraft performance higher values may be used) to ACC1 as flights crossing the Kenyan border from the north in order to continue via Nairobi in south-westerly direction would only be handled by a single sector. Aircraft with the destina-tion Nairobi would then be descended and handed over to ACC2. Nevertheless the assump-tion made on the separation minimum of 20 NM for Nairobi sectors instead of 5 NM for other radar controlled airspaces did not prove to be a problem as the excessive workloads do not show up at the tactical positions.
Another problem resulting from the sectorization of Kenyan Airspace as used in the scenario is the increase in possible throughput of flights. This is convenient for the Kenyan airspace but the adjacent sectors have to be taken into account as well. The most extreme values in taskload encountered by Nairobi ACC2 and Dar es Salaam East are correlating. As de-scribed in the motivation (chapter 1.1) the idea of a “single sky” would considerably facilitate the required adjustments.
For the Tanzanian airspace the same observation of imbalance in the share of workload be-tween the sectors can be observed. This disproportion would be even bigger without the delegation of UA609 to Nairobi ACC3 airspace. As this route towards islands in the southern part of the Indian Ocean is crossed by routes connecting Southern Africa and the Middle East off the East African coast it requires constant monitoring.
The delegation of upper airspaces of Burundi and Rwanda to Dar es Salaam ACC and boundary alignments as just mentioned and described in chapter 2.2.1 is to be looked upon favourably. But still – regarding the overall small number of traffic – pilots are in contact with numerous different ground stations. As VHF coverage is not as extensive as in other areas of the world frequency changes may cause difficulties. Therefore the implementation of ADS-C and in a longer term ADS-B in combination with datalink for controller-pilot communi-cation is seen as a big step forward. The combination of situational awareness enhanced by ADS-systems and an orientation of controlled airspaces along traffic flows reduce the work-load for both sides: flight crew and ATC.
As it was figured out in the analysis some sectors operate at a very low level. One interesting airspace in this context is Windhoek FIR. The implementation of a multilateration system – although the applied separation minimum of 5 NM may be too low – is not justified by the traffic load identified in upper airspace in the scenario. As already mentioned in chapter 2.2.4.2 a balance between costs and benefits has to be found when investing in new infra-structure. The justification for that system may be found in lower airspace which is not part of the analysis.
46 Kenya Airspace Master Plan, (p.15 and p.70)
SUMMARY PAGE 78
SCENARIO
5 SUMMARY
The present thesis aimed to evaluate the suitability of RAMS Plus 5.0 for the analysis of air-space capacity in Sub-Saharan Africa. As this is a geographical area not as well known to many readers as for example Europe or North America the first chapter provides background information on the existing airspace situation. This includes an insight into the air traffic flows as well as the technical abilities regarding navigation and surveillance.
Prior to the implementation methodology as described in the second chapter the require-ments for the simulation and analysis are listed. This list is used as guidance when describ-ing the process of data integration into the software. The background information previously given is rendered more precisely for airspace, navigation, surveillance and traffic character-istics. During this process the relevant requirements are met. Nevertheless a number of as-sumptions are made which to a certain degree are proven in the second chapter already.
Other assumptions are analyzed during the analysing process that is described in chapter three. The scenario that was developed as described in the previous chapter shows defi-ciencies already in the present situation (cf. chapter 3.3). Therefore an adjustment has to be performed that also provides a deeper insight into the RAMS Plus programming philosophy.
As now a suitable basis has been defined the superordinate objective of analysing a predict-ed traffic situation’s influence on the airspace capacity can be tackled. Chapter 3.5 provides an analysis of differing detailedness for all sectors. Airspaces that are predicted to encounter severe taskloads are given more attention than sectors with low traffic volume.
Chapter 4 describes briefly the challenges and problems as well as the positive and encour-aging results of the thesis. This is done separately for the software and the developed sce-nario. The final result has to be described as follows:
By rearranging the sectors according to ATS routes and allocating some of these sectors to controllers presently underchallenged with their duties capacity in high load sectors could be set free and used for traffic growth. States in the geographical area covered are pushing towards this solution. EAC
47 and SADC
48 are projecting consolidated airspaces and ACCs.
This is the right direction for the future as economic and ecological considerations are of increasing importance. RAMS Plus can be a tool to assist the implementation of these vi-sionary goals.
47 APIRG/16, UFIR Project
48 Special AFI RAN Meeting, UACC Project

SUMMARY PAGE 79
SCENARIO
REFERENCES
Note: References where data has been derived from are written in black, references to additional information and further reading are written in grey.
All APIRG documents are available at: http://www.icao.int/wacaf/apirg/index.html
/1/ APIRG: “Single sky” concept in air traffic management in the AFI region, Report of the fourteenth meeting of the AFI Planning and Implementation Regional Group, Conclusion 14/30, Yaounde, Cameroon, 23-27 June 2003, (p.18)
/2/ PRND: First Meeting of the PBN Route Netword Development Working Group (PRND WG/1) and ATS Routes Development Coordination, Johannesburg, South Africa, 13-16 July 2010
/3/ APIRG: Seventeeth Meeting of APIRG (APIRG/17), AFI PBN Regional Implementa-tion Plan, Ouagadougou, Burkina Faso, 2–6 August 2010, WP/7, Appendix G
/4/ APIRG: Seventeeth Meeting of APIRG (APIRG/17), Ouagadougou, Burkina Faso, 2–6 August 2010, WP/7, APPENDIX E2
/5/ ICAO: Doc 9916, Annual Report of the Council, 2008, Appendix 1, Table 4. (p.98), published 2009
/6/ Boeing: Current Market Outlook, 2009-2028, World Regions, Africa, (p.20), pub-lished 2008
/7/ Airbus: Global Market Forecast 2009-2028, Demand for passenger aircraft, Africa, (p.136), published 2008
/8/ Airbus: Global Market Forecast 2009-2028, Demand for passenger aircraft, Africa, (p.138), published 2008
/9/ ESAF: International Civil Aviation Organization Eastern and Southern African Office, URL: http://www.icao.int/esaf/ (visited 2010-06-16)
/10/ ICAO: Doc 9750, Global Air Navigation Plan, Appendix A, (p.47-48), third edition published 2007
/12/ Blank map, URL: http://commons.wikimedia.org/wiki/File:BlankMap-Africa.svg (vis-ited 2010-06-14)
/11/ ASECNA: AIP ASECNA, 0 ENR 2.1 - 01, URL: http://www.ais-asecna.org/pdf/enr/2-enr/enr2-1/00enr2-1-01.pdf (visited 2010-06-19)
/13/ ICAO: ICAO Performance Based Navigation (PBN) Programme website, URL: http://www2.icao.int/en/pbn/Pages/default.aspx (visited 2010-06-11)
/14/ APIRG: Establishment of an APIRG Performance Based Navigation Task Force (APIRG/PBN/TF), Report of the sixteenth meeting of the AFI Planning and Imple-mentation Regional Group, Decision 16/2, Rubavu, Rwanda, 19-23 November 2007, (p.19)
SUMMARY PAGE 80
SCENARIO
/15/ APIRG: Second Joint Meeting of the APIRG Performance Based Navigation and Global Navigation Satellite System Implementation Task Forces (Joint PBN & GNSS/I TFs), Dakar, Senegal, 2-4 March 2010, Agenda Item 3: Status of imple-mentation of PBN in the AFI Region, Appendix A, (p.6-29)
/16/ ICAO: Africa/Indian Ocean Regional Report – 2009, RVSM: An AFI success story, edited by ICAO Coordination, Revenue and Communications Office, ISSN 0018 8778, (p.25-29), published in Montreal, Canada, 2009
/17/ APIRG: Third Meeting of the APIRG Communications, Navigation and Surveillance Sub-Group (CNS/SG/3), Nairobi, Kenya, 26-30 April 2010, Agenda Item 3: Follow up on APIRG/16, CNS/SG/2 and SP AFI RAN Conclusions, Decisions and Recom-mendations, Appendix A, (p.3-7)
/18/ ICAO WACAF: First Meeting of the SAT FANS 1/A Interoperability Team (SAT FIT/1), Canary Island, Spain, 20-22 April 2006, ADS-C/CPDLC implementation situ-ation of the SAT States/FIRs, Appendix D, (p.16-18)
/19/ SITA: Highlights | Air Traffic Management, Global Highlights, (p.9), published 2010
/20/ KCAA: Kenya Airspace Master Plan, Final Report, June 2005 – V6.0, (p.40-42)
/21/ APIRG: Report of the First Meeting of AFI Surveillance Task Force, Johannesburg, South Africa, 17-18 September 2009, Appendix F, (p.31-32)
/22/ AICD: Africa Infrastructure Country Diagnostic, Background Paper 16 (Phase II), An Unsteady Course: Challenges to Growth in Africa’s Air Transport Industry, Heinrich C. Bofinger, July 2009, (p.xi-xii)
/23/ BADA: Aircraft Performance Model developed by the Eurocontrol Validation Infra-structure Centre of Expertise located at Eurocontrol Experimental Centre (EEC) in Brétigny-sur-Orge, France, URL: http://www.eurocontrol.int/eec/public/standard_page/proj_BADA.html (visited 2011-03-19)
/24/ ICAO: Eleventh Air Navigation Conference (AN-Conf/11), Montreal, 22 September–3 October 2003, Report on Agenda Item 1, Recommendation 1/14: Development of an ICAO air navigation plan database and associated Web-based information and charting service
/25/ eANP: URL: http://192.206.28.81/AFIREGION/default.aspx (visited 2010-11-08)
/26/ AIP ASECNA ENR 5-1-01: Prohibited, Restricted and Danger Areas, URL: http://www.ais-asecna.org/pdf/enr/5-enr/enr5-1/09enr5-1-01.pdf (visited 2010-11-09)
/27/ APIRG: Seventeeth Meeting of APIRG (APIRG/17), Ouagadougou, Burkina Faso, 2–6 August 2010, WP/25: Civil/Military Cooperation – In Support of Optimum Air-space Use, WP/41: Outcome of the AFI Search & Rescue and Civil/Military Coordi-nation and Cooperation seminar (Niamey, Niger 02-03 June 2010)
/28/ ARINC: ARINC 424 Navigation System Data Base, Cycle 1103, effective 10 March 2011
/29/ FAA: Airport Capacity and Delay, Advisory Circular 150/5060-5, published by US Department of Transportation, September 1983

SUMMARY PAGE 81
SCENARIO
/30/ SACAA: South African Civil Aviation Authority, Air Traffic Services Standards and Procedures Manual (ATCIs), effective as of 22 July 2009, URL: http://www.caa.co.za/resource%20center/AirTrafficServices/ATS%20Standards%20and%20Procedures%20manual.htm (visited 2011-01-06)
/31/ AZ Namibia: Luftraum bald ganz überwacht, Dirk Heinrich, 12 March 2010, URL: http://www.az.com.na/lokales/luftraum-bald-ganz-berwacht.103580.php (visited 2010-03-12)
/32/ SRA: MSS - MLAT & ADS-B Surveillance, Improving Aircraft Tracking in the Air and on the Ground, company presentation, URL: http://www.sra.com/era/mss/index.php (visited 2011-02-08)
/33/ KCAA: Kenya Airspace Master Plan, Final Report, June 2005 – V6.0, (p.27-30)
/34/ ICAOData: URL: http://icaodata.com/ (visited 2010-12-07)
/35/ AICD: Africa Infrastructure Country Diagnostic, Background Paper 16 (Phase II), An Unsteady Course: Challenges to Growth in Africa’s Air Transport Industry, Country Annex, Heinrich C. Bofinger, July 2009
/36/ KAA: Kenya Airports Authority, Airport Statistics, URL: http://www.kenyaairports.co.ke/kaa/about/airport_statistics.html (visited 2010-12-07)
/37/ ACSA: Airports Company South Africa, Passenger and Aircraft Statistics, URL: http://www.acsa.co.za/home.asp?pid=119 (visited 2010-12-07)
/38/ AICD: Africa Infrastructure Country Diagnostic, Background Paper 16 (Phase II), An Unsteady Course: Challenges to Growth in Africa’s Air Transport Industry, Country Annex, Heinrich C. Bofinger, July 2009, (p.277)
/39/ AICD: Africa Infrastructure Country Diagnostic, Background Paper 16 (Phase II), An Unsteady Course: Challenges to Growth in Africa’s Air Transport Industry, Country Annex, Heinrich C. Bofinger, July 2009, (p.153)
/40/ Eurocontrol: Long-Term Forecast (LFT2010): IFR Flight Movements 2010 – 2030, STATFOR, the EUROCONTROL Statistics and Forecast Service, 2010
/41/ IMF: International Monetary Fund, World Economic Outlook (WEO), April 2010, URL: http://www.imf.org/external/pubs/ft/weo/2010/01/index.htm (visited 2011-02-27)
/42/ Worldbank: ICP Methodological Handbook, Chapter 3, Annex 1, Spreadsheet for Weights, URL: http://web.worldbank.org/WBSITE/EXTERNAL/DATASTATISTICS/ICPEXT/0,,contentMDK:22407349~menuPK:6782529~pagePK:60002244~piPK:62002388~theSitePK:270065,00.html (visited 2011-03-01)
/44/ Boeing: Current Market Outlook, 2010-2029, forecast data, URL: http://active.boeing.com/commercial/forecast_data/index.cfm (visited 2011-03-01)
/43/ African Aviation News: URL: http://www.african-aviation.com/index.php?option=com_content&view=article&id=685:south-african-airways-introduces-wide-body-aircraft-on-the-johannesburg-nairobi-route&catid=16:africa (visited 2011-03-04)

SUMMARY PAGE 82
SCENARIO
/45/ Eurocontrol: Comparison of Different Workload and Capacity Measurement Meth-ods Used in CEATS Simulations, Edition 1.0, Renée Schuen-Medwed, November 2003, (p.12)
/46/ KCAA: Kenya Airspace Master Plan, Final Report, June 2005 – V6.0, (p.15 and p. 70)
/47/ APIRG: Sixteenth Meeting of APIRG (APIRG/16), Kigali, Rwanda 19-23 November 2007, IP/12: East Africa Upper Flight Information Region (UFIR) Project
/48/ AFI-RAN: Special Africa-Indian Ocean (AFI) Regional Air Navigation (RAN) Meet-ing, Durban, South Africa, 27-29 November 2008, IP/23: Upper Airspace Control Centre (UACC) Project
Will ASECNA meet the needs of African air navigation for the 21st Century?, An
analysis of ASECNA’s strategy for adopting advanced CNS/ATM, Francis Ntongo, MSc Thesis, Cranfield University, 2005
Future of Civil Aviation in Africa, Dora-Anne A. Asinjo, Honors Thesis, Southern Illi-nois University Carbondale, 2006
African air transport in the 21st century: A case study of the contrasting experience of Nigeria and Kenya, Oladele Samson Fatokun, MSc Thesis, Cranfield University, 2005
Wide Area Multilateration: Report on EATMP TRS 131/04, Version 1.1, W.H.L. Ne-ven (NLR), T.J. Quilter (RMR), R. Weedon (RMR), R.A. Hogendoorn (HITT), Na-tionaal Lucht- en Ruimtevaartlaboratorium, August 2005

PAGE 83
APPENDIX 1
APPENDIX 1
Area of
RoutingAirspace and Traffic Management Navigation
Reduction of longitudinal separation to 10 minutes (2000) RNP 10 (2000)
Random routing (2005) GNSS as primary means
RVSM (2005)
Fixed RNAV routes coexisting with conventional routes (1999) RNP 10 (2000)
Full ATC service on all ATS routes above FL 245 and 150NM
from international airports (1999)
RNP 5 (2001 onwards)
GNSS as primary means
Longitudinal separation 10 minutes (2000)
Lateral separation: progressive introduction of 30 NM in line
with RNP 5 in the upper airspace (2001)
Random RNAV routes above FL 350 (2001 onwards)
RVSM (2005)
Fixed RNAV routes coexisting with conventional routes (1995) RNP 5 (2001 onwards)
Full ATC service on all ATS routes above FL 245 and 150NM
from international airports (1999)
GNSS as primary means
Longitudinal separation 10 minutes (2000)
Lateral separation: gradual introduction of 30 NM in line with
RNP 5 in the upper airspace (2001)
Random RNAV routes above FL 350 (2001 onwards)
RVSM (2005)
Fixed RNAV routes coexisting with conventional routes (1999) RNP 5 environment (2001)
Full ATC service on all ATS routes above FL 245 and 150NM
from international airports (1999)
GNSS as primary means
Longitudinal separation 10 minutes (2000)
Lateral separation 30 NM in an RNP 5 environment (2001
onwards)
RVSM initially between FL350-FL390 (2003 onwards)
Random routing initially above FL350 (2001 onwards)
Random routing in selected portions of the airspace (1999) RNP 10 (2000)
Full ATC service on all ATS routes above FL 245 and 150NM
from international airports (1999)
GNSS as primary means
Reduction of longitudinal separation to 10 minutes (2000)
Reduction of lateral separation to 50 NM coinciding with RNP
10 (2000 onwards)
RVSM (2005 onwards)
AR-8
AR-10
AR-2
AR-3
AR-4

PAGE 84
APPENDIX 2
APPENDIX 2
AirspaceEn-Route Oceanic En-Route Remote
Continental
En-Route
Continental
TMA
Arrival/Departure
Approach
Navigation
Specifications
RNAV 10 RNAV 10 RNAV 5 RNAV 1 in a
surveillance
environment,
Basic RNP 1 in
non-surveillance
environment
RNP APCH with
Baro-VNAV or
SBAS, or RNP AR
APCH if required
where
operationally
required
RNP 4 RNP 4 RNAV 1
Implementation
Targets
▼ ▼ ▼ ▼ ▼
AirspaceEn-Route Oceanic En-Route Remote
Continental
En-Route
Continental
TMA
Arrival/Departure
Approach
Navigation
Specifications
RNAV 10 RNAV 10 RNAV 2, RNAV 5 Expand RNAV 1,
or RNP-1
application,
Mandate RNAV 1,
or RNP-1 in high
density TMAs
Expand RNP APCH
with Baro-VNAV or
SBAS, expand RNP
AP APCH where
there are
operational
benefits
where
operationally
required
RNP 4 RNP 4 RNAV 1
Implementation
Targets
▼ ▼ ▼ ▼ ▼
AirspaceTMA
Navigation
Specifications
Overall system
responsiveness
achieved through
flexible routing
and wellinformed,
distributed
decision-making
Systems ability to
adapt rapidly to
changing
meteorological
and airspace
conditions
System leverages
through advanced
navigation
capabilities such
as fixed radius
transitions, RF
legs, and RNP
offsets
Ground-based
tactical merging
capabilities in
terminal airspace,
RNP-based arrival
and departure
structure for
greater
predictability
En-Route
a)RNP APCH with Baro-VNAV or SBAS for 30% of instrument runways by 2010 and 50% by 2012
b) RNAV 1 SID/STAR for 30% of instrument runways by 2010 and 50% by 2012
a) RNP APCH with Baro-VNAV or SBAS (APV) in 100% of instrument runways by 2016
b) RNAV 1 or RNP 1 SID/STAR for 100% of international airports by 2016
c) RNAV 1 or RNP 1 SID/STAR for 70% of busy domestic airports where there are operational
benefits d) Implementation
of additional RNAV/RNP Routes as required
Long Term (2017 and beyond)
Near Term (2008-2012)
Mid Term (2013-2016)

PAGE 85
APPENDIX 3
APPENDIX 3
PB
N N
av
iga
tio
nS
ho
rt-t
erm
Mid
-te
rmL
on
g –
te
rm
Sp
ec
ific
ati
on
s(2
00
8-2
01
2)
(20
13
-20
16
)(2
01
7a
nd
be
yo
nd
)
RN
AV
-10/R
NP
-10
AD
S-C
AD
S-C
AD
S-C
RN
P-4
AD
S-C
AD
S-C
AD
S-C
RN
AV
-10/R
NP
-10
AD
S-C
AD
S-C
AD
S-C
RN
P-4
AD
S-C
AD
S-C
AD
S-C
AD
S-C
AD
S-C
AD
S-C
, A
DS
-B (
prim
ary
)
AD
S-B
(tr
ials
)A
DS
-B (
gra
dually
)M
LA
T (
supple
menta
l)
MLA
T (
tria
ls)
MLA
T (
gra
dually
)
AD
S-C
AD
S-C
AD
S-B
, A
DS
-B (
prim
ary
)
AD
S-B
(tr
ials
)A
DS
-B (
gra
dually
)M
LA
T (
supple
menta
l)
MLA
T (
tria
ls)
MLA
T (
gra
dually
)
PS
R (
where
justifie
d)
PS
R (
where
justifie
d)
AD
S-B
(prim
ary
)
SS
R (
where
im
ple
mente
d)
SS
R (
where
im
ple
mente
d)
MLA
T (
supple
menta
l)
AD
S-B
(tr
ials
)A
DS
-B (
gra
dually
)
MLA
T (
tria
ls)
MLA
T (
gra
dually
)
PS
R (
where
justifie
d)
PS
R (
where
justifie
d)
AD
S-B
(prim
ary
)
SS
R (
where
im
ple
mente
d)
SS
R (
where
im
ple
mente
d)
MLA
T (
supple
menta
l)
AD
S-B
(tr
ials
)A
DS
-B (
gra
dually
)
MLA
T (
tria
ls)
MLA
T (
gra
dually
)
TM
A T
ype 1
Basic
RN
P-1
in n
on-
surv
eill
ance e
nvi
ronm
ent
Voic
e r
eport
ing
Voic
e r
eport
ing
Voic
e r
eport
ing
PS
R (
where
justifie
d)
PS
R (
where
justifie
d)
AD
S-B
(prim
ary
)
SS
R (
where
im
ple
mente
d)
SS
R (
where
im
ple
mente
d)
MLA
T (
supple
menta
l)
AD
S-B
(tr
ials
)A
DS
-B (
gra
dually
)
MLA
T (
tria
ls)
MLA
T (
gra
dually
)
PS
R (
where
justifie
d)
PS
R (
where
justifie
d)
AD
S-B
(prim
ary
)
SS
R (
where
im
ple
mente
d)
SS
R (
where
im
ple
mente
d)
MLA
T (
supple
menta
l)
AD
S-B
(tr
ials
)A
DS
-B (
gra
dually
)
MLA
T (
tria
ls)
MLA
T (
gra
dually
)
Aero
dro
me
Type 1
Voic
e r
eport
ing
Voic
e r
eport
ing
Voic
e r
eport
ing
RN
AV
-1 in a
surv
eill
ance
envi
ronm
ent
RN
P A
R A
PC
H if re
quired
RN
P A
PC
H w
ith B
aro
-
VN
AV
or
En-R
oute
Oceanic
En-R
oute
Rem
ote
Continenta
l
En-R
oute
Continenta
l
Air
sp
ac
e
RN
AV
-5
RN
AV
-1
RN
AV
-1 in a
surv
eill
ance
envi
ronm
ent
Appro
ach
TM
A T
ype 3
TM
A T
ype 2
Aero
dro
me
Type 3
Aero
dro
me
Type 2
TM
A A
rriv
al/
Depart
ure

PAGE 86
APPENDIX 4
APPENDIX 4

PAGE 87
APPENDIX 5
APPENDIX 5

PAGE 88
APPENDIX 6
APPENDIX 6
AirportICAO
Code
No. of
suitable
RWYs
No. of
parallel
RWYs
parallel
TWY
Exit
Factor
FAA hourly
capacity
base
parallel
TWY
compen-
sation
MOV/hr
Bloemfontein FABL 2 1 2 0,91 54 0,5 49
Capetown FACT 2 1 2 0,92 52 0,5 48
Durban FADN 1 1 2 0,91 54 0,5 49
East London FAEL 2 1 2 0,91 54 0,5 49
Johannesburg FAJS 2 2 2 0,92 52 0,5 96
Lanseria FALA 1 1 2 0,91 54 0,5 49
Nelspruit FANS 1 1 1 0,77 54 0,5 21
Port Elizabeth FAPE 2 1 2 0,83 54 0,5 45
Pietermaritzburg FAPM 1 1 1 0,77 54 0,5 21
Upington FAUP 1 1 1 0,83 54 0,5 22
Francistown FBFT 1 1 1 0,77 28 0,5 11
Gaborone FBGR 1 1 2 0,91 28 0,5 25
Maun FBMN 1 1 1 0,83 28 0,5 12
Manzini FDMS 1 1 1 0,77 28 0,5 11
Mauritius FIMP 1 1 1 0,86 28 0,5 12
Livingstone FLLI 1 1 1 0,83 28 0,5 12
Lusaka FLLS 1 1 2 0,91 28 0,5 25
Mfuwe FLMF 1 1 1 0,83 28 0,5 12
Ndola FLND 1 1 1 0,91 28 0,5 13
Moroni FMCH 1 1 1 0,77 28 0,5 11
Mayotte FMCV 1 1 1 0,77 28 0,5 11
Saint Denis FMEE 2 1 1 0,86 28 0,5 12
Antananarivo FMMI 1 1 1 0,83 28 0,5 12
Tamatave FMMT 1 1 1 0,77 28 0,5 11
Mahajanga FMNM 1 1 1 0,83 28 0,5 12
Huambo FNHU 1 1 1 0,77 28 0,5 11
Luanda FNLU 2 1 1 0,77 54 0,5 21
Beira FQBR 1 1 1 0,83 28 0,5 12
Maputo FQMA 1 1 2 0,91 28 0,5 25
Praslin FSPP 1 1 1 0,77 28 0,5 11
Mahe FSIA 1 1 1 0,80 28 0,5 11
Bulawayo FVBU 1 1 2 0,91 28 0,5 25
Victoria Falls FVFA 1 1 1 0,77 28 0,5 11
Harare FVHA 1 1 2 0,91 54 0,5 49
Blantyre FWCL 1 1 1 0,83 28 0,5 12
Lilongwe FWKI 1 1 2 0,91 28 0,5 25
Maseru FXMM 1 1 1 0,83 28 0,5 12
Windhoek FYWH 1 1 2 0,91 54 0,5 49
Walvis Bay FYWB 1 1 1 0,83 54 0,5 22
Kinshasa FZAA 1 1 1 0,83 28 0,5 12
Kisangani FZIC 1 1 1 0,77 28 0,5 11
Lubumbashi FZQA 1 1 1 0,83 28 0,5 12
Bujumbura HBBA 1 1 1 0,83 28 0,5 12
Eldoret HKEL 1 1 1 0,77 54 0,5 21
Nairobi HKNA 1 1 2 0,92 52 0,5 48
Kisumu HKKI 1 1 1 0,77 54 0,5 21
Mombasa HKMO 1 1 2 0,92 52 0,5 48
Kigali HRYR 1 1 1 0,83 28 0,5 12
Dar es Salaam HTDA 1 1 2 0,92 28 0,5 26
Kilimanjaro HTKJ 1 1 1 0,83 28 0,5 12
Mwanza HTMW 1 1 1 0,77 28 0,5 11
Zanzibar HTCA 1 1 1 0,83 28 0,5 12
Arua HUAR 1 1 1 0,83 28 0,5 12
Entebbe HUEN 2 1 2 0,92 28 0,5 26
Male VRMM 1 1 1 0,80 28 0,5 11

PAGE 89
APPENDIX 7
APPENDIX 7
Time Call Sign Controller Task Group TaskTask
Weight
195243 SA185 PlanningController FlightDataManagement RxFlightProgressStrip 10
195243 SA185 TacticalController FlightDataManagement RxFlightProgressStrip 5
195728 SA185 PlanningController Coordination RxTimeLevelEstimate 15
195733 SA185 PlanningController ConflictSearch CFSToEstablishSectorEntryClearance 8
195733 SA185 TacticalController ConflictSearch CFSToEstablishSectorEntryClearance 5
195738 SA185 PlanningController ConflictSearch CFSToEstablishSectorExitClearance 5
195738 SA185 TacticalController ConflictSearch CFSToEstablishSectorExitClearance 5
195743 SA185 PlanningController Coordination InputACTMessageToComputer 15
195743 SA185 PlanningController ConflictSearch PlanningConflictSearch 2
195848 LH8297 PlanningController FlightDataManagement RxFlightProgressStrip 10
195848 LH8297 TacticalController FlightDataManagement RxFlightProgressStrip 5
195902 SA185 PlanningController ConflictSearch PlanningConflictSearch 2
200202 SA185 PlanningController ConflictSearch PlanningConflictSearch 2
200333 LH8297 PlanningController Coordination RxTimeLevelEstimate 25
200338 LH8297 PlanningController ConflictSearch CFSToEstablishInitialFLClearance 15
200338 LH8297 TacticalController ConflictSearch CFSToEstablishInitialFLClearance 10
200343 LH8297 PlanningController ConflictSearch CFSToEstablishSectorExitClearance 5
200343 LH8297 TacticalController ConflictSearch CFSToEstablishSectorExitClearance 5
200348 LH8297 PlanningController Coordination InputACTMessageToComputer 15
200348 LH8297 PlanningController ConflictSearch PlanningConflictSearch 2
200502 LH8297 PlanningController ConflictSearch PlanningConflictSearch 2
200502 SA185 PlanningController ConflictSearch PlanningConflictSearch 2
200802 LH8297 PlanningController ConflictSearch PlanningConflictSearch 2
200802 SA185 PlanningController ConflictSearch PlanningConflictSearch 2
201102 LH8297 PlanningController ConflictSearch PlanningConflictSearch 2
201102 SA185 PlanningController ConflictSearch PlanningConflictSearch 2
201402 LH8297 PlanningController ConflictSearch PlanningConflictSearch 2
201402 SA185 PlanningController ConflictSearch PlanningConflictSearch 2
201702 LH8297 PlanningController ConflictSearch PlanningConflictSearch 2
201702 SA185 PlanningController ConflictSearch PlanningConflictSearch 2
202002 LH8297 PlanningController ConflictSearch PlanningConflictSearch 2
202002 SA185 PlanningController ConflictSearch PlanningConflictSearch 2
202302 LH8297 PlanningController ConflictSearch PlanningConflictSearch 2
202302 SA185 PlanningController ConflictSearch PlanningConflictSearch 2
202543 SA185 TacticalController RTCommunication RxHandoff 5
202602 LH8297 PlanningController ConflictSearch PlanningConflictSearch 2
202602 SA185 PlanningController ConflictSearch PlanningConflictSearch 2
202603 SA185 TacticalController RTCommunication Rx1stCall 10
202902 LH8297 PlanningController ConflictSearch PlanningConflictSearch 2
202902 SA185 PlanningController ConflictSearch PlanningConflictSearch 2
203148 LH8297 TacticalController RTCommunication RxHandoff 5
203202 LH8297 PlanningController ConflictSearch PlanningConflictSearch 2
203202 SA185 PlanningController ConflictSearch PlanningConflictSearch 2
203208 LH8297 TacticalController RTCommunication Rx1stCall 10
203502 LH8297 PlanningController ConflictSearch PlanningConflictSearch 2
203502 LH8297 PlanningController ConflictSearch ConflictSituationIdentified 15
203502 SA185 PlanningController ConflictSearch PlanningConflictSearch 2
203802 LH8297 PlanningController ConflictSearch PlanningConflictSearch 2
203802 SA185 PlanningController ConflictSearch PlanningConflictSearch 2
204102 SA185 PlanningController ConflictSearch PlanningConflictSearch 2
204402 SA185 PlanningController ConflictSearch PlanningConflictSearch 2
204702 SA185 PlanningController ConflictSearch PlanningConflictSearch 2
204748 LH8297 TacticalController RTCommunication TxNewFL 10
204758 LH8297 PlanningController RTCommunication TxNewFL 1
205002 SA185 PlanningController ConflictSearch PlanningConflictSearch 2
205052 LH8297 TacticalController RTCommunication RxFlightLevelReachedReport 5
205239 LH8297 TacticalController RTCommunication RxFlightLevelReachedReport 5
205302 SA185 PlanningController ConflictSearch PlanningConflictSearch 2
205602 SA185 PlanningController ConflictSearch PlanningConflictSearch 2
205858 LH8297 TacticalController RTCommunication TxNewFL 10
205902 SA185 PlanningController ConflictSearch PlanningConflictSearch 2
205908 LH8297 PlanningController RTCommunication TxNewFL 1
210202 SA185 PlanningController ConflictSearch PlanningConflictSearch 2
210203 LH8297 TacticalController RTCommunication RxFlightLevelReachedReport 5
210502 SA185 PlanningController ConflictSearch PlanningConflictSearch 2
210802 SA185 PlanningController ConflictSearch PlanningConflictSearch 2
211102 SA185 PlanningController ConflictSearch PlanningConflictSearch 2
211402 SA185 PlanningController ConflictSearch PlanningConflictSearch 2
211702 SA185 PlanningController ConflictSearch PlanningConflictSearch 2
212002 SA185 PlanningController ConflictSearch PlanningConflictSearch 2

PAGE 90
APPENDIX 8
APPENDIX 8
airportoperation.dat
Adjustment of departure, arrival and total movement rate
FYWH.0.00.60.00.49.00.49.00.49.00.0.0..x..x..x..x.0.00.86400.00
navaid.dat
Navaid name extended with ICAO country code, coordinates in decimal format and definition of navaid type
ABALO_LP...............32.3310309967.......-18.1303356149..WPT
airway.dat
Adjustment of minimum and maximum usable flight level to scenario requirements
UA405................245.00..660.00..111.00..555.00..11.00..
route.dat
Correct sequencing of navaids in route definition
UA572......LGI_GF.
UA572......EGAGA_GF.
UA572......NAMIB_GF.
UA572......TINIS_GO.
UA572......ERTOX_GO.
UA572......BITEX_GO.
corner.dat
Airspace corners defined by coordinates in decimal format
C12554.......-37.0000000000........15.0000000000

PAGE 91
APPENDIX 8
boundary.dat
Closed polygon of corners defines sector boundary
B22.C12554.C12555.
B22.C12555.C12568.
B22.C12568.C12571.
B22.C12571.C12614.
B22.C12614.C12553.
B22.C12553.C12554.
centreschedule.dat
Centre may be restricted to certain operating times
WINDHOEK.WindhoekFIR.SunToSat.000000.240000
centresector.dat
Assignment of boundary identifier to particular sector with lower and upper limit
WINDHOEK.WindhoekFIR.WINDHOEKACCNORTH.B42......245.0.....660.0
sector.dat
Assignment of planning and tactical controllers to sector with extended foresight values in lateral and vertical direction
WINDHOEKAC-
CNORTH.PlanWINDHOEKACCNORTH.TactWINDHOEKACCNORTH..20.0..20.0.0
controller.dat
Controller definition with hand-off times, vertical separation minimum, lateral and longitudinal separation minimum in NM and sec, rulegroup and conflict detection interval
TactWINDHOEKAC-CNORTH.03Minute.03Minute.RVSMSeparation.TACT.RADAR.5.0000..0.00..5.0000..600.00.
.TacticalRules.2.60.00.180.00
trafficexchange.dat
Traffic description by scenario entry time, call sign, departure and arrival aerodrome, aircraft type and equipment, entry, cruise and exit flight level, routing defined by navaids and air-ways
094500;SW707;FAJS;RWY;FYWH;RWY;B737S;Normal;RVSMEquip;0;310;0;JSV_FA;UL435;HBV_FA;UG653;WHV_FY;

PAGE 92
APPENDIX 9
APPENDIX 9
Angola
Botswana
Burundi
DRC
Kenya
Lesotho
Madagascar
Malawi
Mauritius
Mozambique
Namibia
Rwanda
Seychelles
South Africa
Swaziland
Tanzania
Uganda
Zambia
Zimbabwe
$9
1,06
01,
042
1,04
21,
059
1,05
61,
029
1,04
61,
052
1,02
71,
056
1,03
51,
047
1,03
51,
035
1,02
41,
049
1,03
81,
053
1,04
9
An
gola
1,06
0
Bo
tsw
ana
1,04
21,
051
Bu
run
di
1,04
21,
051
1,04
2
DR
C1,
059
1,06
01,
051
1,05
1
Ke
nya
1,05
61,
058
1,04
91,
049
1,05
8
Leso
tho
1,02
91,
045
1,03
61,
036
1,04
41,
043
Mad
agas
car
1,04
61,
053
1,04
41,
044
1,05
31,
051
1,03
8
Mal
awi
1,05
21,
056
1,04
71,
047
1,05
61,
054
1,04
11,
049
Mau
riti
us
1,02
71,
044
1,03
51,
035
1,04
31,
042
1,02
81,
037
1,04
0
Mo
zam
biq
ue
1,05
61,
058
1,04
91,
049
1,05
81,
056
1,04
31,
051
1,05
41,
042
Nam
ibia
1,03
51,
048
1,03
91,
039
1,04
71,
046
1,03
21,
041
1,04
41,
031
1,04
6
Rw
and
a1,
047
1,05
41,
045
1,04
51,
053
1,05
21,
038
1,04
71,
050
1,03
71,
052
1,04
1
Seyc
he
lle
s1,
035
1,04
81,
039
1,03
91,
047
1,04
61,
032
1,04
11,
044
1,03
11,
046
1,03
51,
041
Sou
th A
fric
a1,
035
1,04
81,
039
1,03
91,
047
1,04
61,
032
1,04
11,
044
1,03
11,
046
1,03
51,
041
1,03
5
Swaz
ilan
d1,
024
1,04
21,
033
1,03
31,
042
1,04
01,
027
1,03
51,
038
1,02
61,
040
1,03
01,
036
1,03
01,
030
Tan
zan
ia1,
049
1,05
51,
046
1,04
61,
054
1,05
31,
039
1,04
81,
051
1,03
81,
053
1,04
21,
048
1,04
21,
042
1,03
7
Uga
nd
a1,
038
1,04
91,
040
1,04
01,
049
1,04
71,
034
1,04
21,
045
1,03
31,
047
1,03
71,
043
1,03
71,
037
1,03
11,
044
Zam
bia
1,05
31,
057
1,04
81,
048
1,05
61,
055
1,04
11,
050
1,05
31,
040
1,05
51,
044
1,05
01,
044
1,04
41,
039
1,05
11,
046
Zim
bab
we
1,04
91,
048
1,04
41,
044
1,04
81,
047
1,04
11,
045
1,04
61,
040
1,04
71,
042
1,04
51,
042
1,04
21,
039
1,04
21,
042
1,04
2
Co
ntr
ibu
tio
n t
o
regi
on
al g
row
th