Development and application of novel proteomics methods in ...
160
This document is downloaded from DR‑NTU (https://dr.ntu.edu.sg) Nanyang Technological University, Singapore. Development and application of novel proteomics methods in proteomics research Hao, Piliang 2015 Hao, P. (2015). Development and application of novel proteomics methods in proteomics research. Doctoral thesis, Nanyang Technological University, Singapore. https://hdl.handle.net/10356/62181 https://doi.org/10.32657/10356/62181 Downloaded on 10 Dec 2021 02:28:30 SGT
Transcript of Development and application of novel proteomics methods in ...

This document is downloaded from DR‑NTU (https://dr.ntu.edu.sg)Nanyang Technological University, Singapore.
Development and application of novel proteomicsmethods in proteomics research
Hao, Piliang
2015
Hao, P. (2015). Development and application of novel proteomics methods in proteomicsresearch. Doctoral thesis, Nanyang Technological University, Singapore.
https://hdl.handle.net/10356/62181
https://doi.org/10.32657/10356/62181
Downloaded on 10 Dec 2021 02:28:30 SGT

DEVELOPMENT AND APPLICATION OF
NOVEL PROTEOMICS METHODS IN
PROTEOMICS RESEARCH
PILIANG HAO
SCHOOL OF BIOLOGICAL SCIENCES
SINGAPORE CENTER ON ENVIRONMENTAL
LIFE SCIENCES ENGINEERING
2014
Development and application of novel proteomics
methods in proteomics research
Piliang Hao
School of Biological Sciences
Singapore Centre on Environmental Life Sciences Engineering
A thesis submitted to the Nanyang Technological University
in fulfillment of the requirement of the degree of
Doctor of Philosophy
2014
Acknowledgements
i
Acknowledgements
It would not be possible to write this doctoral thesis without the generous help and
support from the people around me. I would like to express my sincere gratitude to all of
them.
First, my deepest gratitude goes to Dr. Siu Kwan Sze, my Ph.D. supervisor, for his expert
guidance and inspiration. His aspiration for novel ideas and persistence in technical
innovation has been very important to the success of my research projects. More
importantly, it inspires my creativity in solving scientific problems. It is invaluable
experience to learn mass spectrometry and proteomics from him during the past five
years as a research associate and a Ph.D. student.
I would like to acknowledge the Singapore Centre on Environmental Life Sciences
Engineering (SCELSE) for offering me the Ph.D. scholarship to support my studies and
life in Singapore. My sincere gratitude goes to many people from SCELSE: Prof. Staffan
Kjelleberg has been very supportive in my Ph.D. application and studies; Prof. Yehuda
Cohen and Prof. Sanjay Swarup have been very kind to me and teach me how to get
along well with people around me; Dr. Grace Chong Hui Ying has been very kind,
helpful and timely in processing many issues related to my Ph.D. studies.
I would like to thank my thesis advisory committee, Dr. Zbynek Bozdech and Dr. Rohan
Benjamin Hugh Williams, for their constructive criticism and good suggestions during
the TAC meetings. I would also like to express my sincere gratitude to Prof. Gerhard
Gruber and Prof. Ho Sup Yoon for their fairness and friendly attitude in solving
controversial problems. I also thanks Ms. Chong Chye Hong May from graduate office
for her kind support during my Ph.D. studies.
Acknowledgements
ii
I would also like to acknowledge the kind support from my current and former laboratory
colleagues, such as Wei Meng, Jingru Qian, Dr. Xin Li, Dr. Tiannan Guo, Dr. Yi Zhu,
Sim Kae Hwan, Cheow Sok Hwee Esther, Dr. Hongbin Zhu, Dr. Yang Sun, Qi Zhang,
Dr. Aida Serra Maqueda, Gallart Palau Xavier, Dr. Bamaprasad Dutta, Dr. Arnab Datta,
Dr. Sunil Adav, for their kind help and discussion.
Last, my most gratitude goes to my family for their continuous support and
encouragement during my Ph.D. studies. Dr. Yan Ren, my wife, has given me many
invaluable comments, suggestions and insightful discussions on my research projects.
More importantly, she has spent nearly all of her spare time on taking care of our two
kids so that I can spend most of my time on my research work. Ren Yan’s parents have
also spent most of their time in helping to take care of our kids in the past 5 years. The
love and encouragement from my parents have accompanied me and made me a
righteous and strict person.
Table of Contents
iii
Table of Contents
Acknowledgements i
Contents iii
List of figures viii
List of tables xi
Abbreviations xii
Abstract xiv
Chapter 1 1
1 General Introduction 2
1.1 Recent Development in Proteomics and Existing Challenges 2
1.2 Biological Significance of Protein Post-translational Modifications (PTMs) 4
1.3 Current Status of PTM Studies in Proteomics 5
1.4 Protein Deamidation 6
1.4.1 General Proteomics Workflow for Studying Protein Deamidation 7
1.4.2 Challenges in Proteome-scale Study of Protein Deamidation 9
1.5 Objectives and the Overview of the Thesis 11
Chapter 2 13
2 Detection, Evaluation and Minimization of Nonenzymatic Deamidation in
Proteomic Sample Preparation 13
2.1 Abstract 14
2.2 Introduction 14
2.3 Materials and Methods 17
2.3.1 Reagents 17
2.3.2 Sample preparation 17
2.3.3 Traditional In-Gel Trypsin digestion and PNGase F Treatment 17
2.3.4 Improved In-Gel Trypsin digestion and PNGase F Treatment 18
2.3.5 LC-MS/MS 18
2.3.6 Data Analysis 19
2.3.7 Evaluation of the Ratio of Deamidation in 5 Groups of Proteomic Data 20
2.3.8 Evaluation of Factors Potentially Effecting Deamidation during Sample
Preparation 21
Table of Contents
iv
2.3.9 Comparison of the Digestion Efficiency of Trypsin at pH6 and pH8 using
bovine serum albumin (BSA) as the Substrate 22
2.3.10 Comparison of the Deamidation Rate at pH6 and pH8 using Synthetic
Peptides 22
2.3.11 Comparison of the Traditional and Improved Sample Preparation Protocol 23
2.3.12 Enhanced Detection of Nonenzymatic Deamidation from Complex
Samples 23
2.4 Results and Discussion 23
2.4.1 The Reliable Identification of Deamidated Peptides in Database Searches 23
2.4.2 Evaluation of the Ratio of Deamidation in 5 Groups of Proteomic Data 26
2.4.3 Evaluation of Factors Potentially Affecting Deamidation during Sample
Preparation 27
2.4.4 Improved Protocol for N-Glycosylation Site Determination from Complex
Samples 29
2.4.5 Comparison of the Digestion Efficiency of Trypsin at pH6 and pH8 using
Bovine Serum Albumin (BSA) as the Substrate 30
2.4.6 Comparison of the Deamidation Rate at pH6 and pH8 using Synthetic
Peptides 31
2.4.7 Comparison of the Traditional and Improved Sample Preparation Protocol
using Complex Samples 33
2.4.8 Comparison of the Motifs of Asn Deamidation and Gln Deamidation 35
2.5 Conclusion 37
Chapter 3 38
3 Evaluation of the Effect of Digestion Buffers on Artificial Deamidation in In-
solution Trypsin Digestion 38
3.1 Abstract 39
3.2 Introduction 39
3.3 Materials and Methods 41
3.3.1 Reagents 41
3.3.2 Sample Preparation 41
3.3.3 iTRAQ Labeling 42
Table of Contents
v
3.3.4 ERLIC Fractionation of iTRAQ Labeled Peptides 42
3.3.5 ERLIC Fractionation of Label-free Peptides 42
3.3.6 LC-MS/MS 43
3.3.7 Data Analysis 43
3.3.8 Determination of the Half-time of Asn Deamidation in the Four Buffers
Using Synthetic Peptides 44
3.4 Results and Discussion 45
3.4.1 iTRAQ Based Relative Quantification of Asn-deamidated Peptides and Gln-
deamidated Peptides Digested in the Four Buffers 45
3.4.2 Identification of Asn-deamidated Peptides, Gln-deamidated Peptides and
Artificial N-glycopeptides in Label-free Experiments 46
3.4.3 The Distribution of Asn deamidation and Gln deamidation while Using the
Four Trypsin Digestion Buffers 48
3.4.4 Protein and Peptide Identifications and Tryptic Miscleavages in Label-free
Experiments 49
3.4.5 Determination of the Half-time of Asn deamidation in the Four Buffers
Using Synthetic Peptides 50
3.5 Conclusion 51
Chapter 4 53
4 Enhanced Separation and Characterization of Deamidated Peptides with RP-
ERLIC-based Multidimensional Chromatography Coupled with Tandem Mass
Spectrometry
53
4.1 Abstract 54
4.2 Introduction 54
4.3 Materials and Methods 57
4.3.1 Reagents 57
4.3.2 Sample Preparation 57
4.3.3 RPLC Fractionation 58
4.3.4 ERLIC Fractionation 59
4.3.5 RP-LC-MS/MS 59
4.3.6 ERLIC-LC-MS/MS 60

Table of Contents
vi
4.3.7 Data Analysis 60
4.4 Results and Discussion 61
4.4.1 A Novel Strategy for Large-scale Study of Protein Deamidation 61
4.4.2 Evaluation of RPLC and ERLIC for Separation of Synthetic Peptides 62
4.4.3 Application of ERLIC-MS/MS to the Simple Tryptic Digest from Two
Model Proteins 64
4.4.4 Application of RP-ERLIC-MS/MS to Tryptic Peptides from Rat liver Tissue 70
4.4.5 Considerations for Optimizing RP-ERLIC-MS/MS in the Future 74
4.4.6 Calculation of the Intensity Ratio of the isomeric isoAsp and n-Asp peptides 74
4.5 Conclusion 75
Chapter 5 76
5 Application of the Developed Technologies into the Study of Protein
Deamidation in Human Atherosclerotic Plaques for Predicting Secondary
Cerebrovascular Events
76
5.1 Abstract 77
5.2 Introduction 77
5.3 Materials and Methods 80
5.3.1 Reagents 80
5.3.2 Patient Information 80
5.3.3 Sample Preparation 81
5.3.4 ERLIC Fractionation of Label-free Peptides from Pooled Plaque Lysates 81
5.3.5 LC-MS/MS for Shotgun Proteomics 82
5.3.6 LC-MS/MS for Parallel Reaction Monitoring (PRM) 83
5.3.7 Analysis of Data from Shotgun Proteomics 83
5.3.8 Analysis of Data from Parallel reaction monitoring (PRM) 84
5.4 Results and Discussion 84
5.4.1 The Strategy for Proteomic Study of Protein Deamidation in Human Carotid
Atherosclerotic Plaques for Predicting Secondary Cerebrovascular Events 84
5.4.2 Protein Identification from Human Carotid Atherosclerotic Plaques 86
5.4.3 Pathway Analysis of the Identified Proteins from Human Carotid
Atherosclerotic Plaques 87
Table of Contents
vii
5.4.4 Identification of Potential Biomarkers and Low-abundance Proteins with
Important Functions from Human Carotid Atherosclerotic Plaques 89
5.4.5 Label-free Quantification of Protein Groups and Deamidated Peptides from
Pooled Human Carotid Atherosclerotic Plaques between Patients with and
without Secondary Cerebrovascular Events
90
5.4.5.1 Gene Ontology Analysis of Up-regulated Proteins in the Pooled Test
Group with Secondary Cerebrovascular Events 92
5.4.5.2 Analysis of Up-regulated Deamidated Peptides in the Pooled Test Group
with Secondary Cerebrovascular Events 94
5.4.6 Application of Parallel Reaction Monitoring (PRM) to the Validation of the
Up-regulated Proteins and Up-regulated Deamidated Peptides in Individual
Plaques as Biomarker Candidates
95
5.4.6.1 Application of PRM to the Validation of the Deamidated Peptides in
Simple Tryptic Digests 96
5.4.6.2 Selection and Refinement of Biomarker Candidates of Proteins and
Deamidated Peptides for PRM Validation 98
5.4.6.3 Application of PRM to the Validation of the Biomarker Candidates in
Pooled Plaque Samples 99
5.4.6.4 Application of PRM to the Validation of the Biomarker Candidates in
Individual Plaque Samples 101
5.4.7 Fate of Deamidated Proteins in the Ageing Process 106
5.5 Conclusion 106
Chapter 6 108
6.1 Conclusion and future perspective 109
References 113
Appendix A 140
Appendix B 142

List of figures
viii
List of figures
Chapter 1
Figure 1.1: Deamidation of asparaginyl residues and isomerization of aspartyl residues
through a succinimide intermediate 7
Figure 1.2: A flowchart of multidimensional LC-MS/MS for large-scale analysis of protein
deamidation in proteomics 8
Figure 1.3: Schematic work flow of my PhD works 12
Chapter 2
Figure 2.1: The reliable identification of deamidated peptides 25
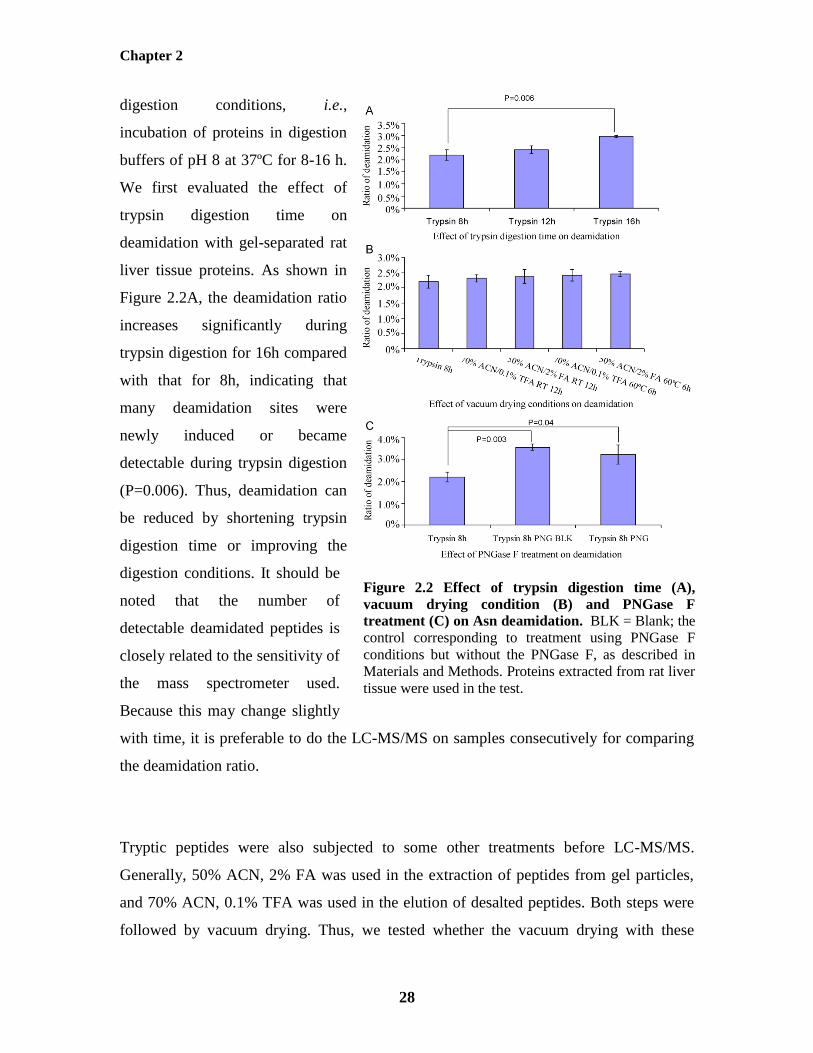
Figure 2.2: Effect of trypsin digestion time, vacuum drying condition and PNGase F
treatment on Asn deamidation 28
Figure 2.3: Proposed improved trypsin digestion and PNGase F treatment protocol for N-
glycosylation site determination 29
Figure 2.4: SDS-PAGE images of trypsin digested BSA at pH 6 and pH 8 for different time
periods using urea or SDS as the denaturant 31
Figure 2.5: Monitoring the deamidation of the synthetic peptide DGNGYISAAELR at pH 6
and pH 8 by HPLC and MALDI-TOF 32
Figure 2.6: Comparison of the traditional and improved trypsin digestion and PNGase F
treatment protocol 34
Figure 2.7: Comparison of the incidence of Asn deamidation and Gln deamidation in
proteomic samples 36
Chapter 3
Figure 3.1: The summed area of the reporter ions of Asn-deamidated peptides and Gln-
deamidated peptides under different digestion conditions from iTRAQ experiments 46
Figure 3.2: Number of unique Asn-deamidated peptides, Gln-deamidated peptides and
artificial N-glycopeptides identified from rat kidney tissue digested in 50 mM of ammonium
acetate (pH 6), Tris-HCl (pH 8), ABB and TEAB from three technical replicates of label-free
experiments
47
Figure 3.3: Comparison of the distribution of Asn deamidation and Gln deamidation in rat 48
List of figures
ix
kidney tissue digested in the four buffers
Figure 3.4: Determination of the half-time of Asn deamidation using the synthetic peptide
DGNGYISAAELR by HPLC 51
Chapter 4
Figure 4.1: RPLC chromatogram of tryptic peptides from rat liver 59
Figure 4.2: Proposed strategy for characterization of whole proteome and deamidated
peptides using RP-ERLIC-MS/MS 62
Figure 4.3: Comparison of RPLC and ERLIC for Separation of Synthetic Peptides 63
Figure 4.4: ERLIC chromatograms of the triad of the deamidation peptides 65
Figure 4.5: Separation and identification of two groups of deamidation products containing
an asparaginyl, aspartyl or isoaspartyl residue at the same position from the tryptic digest of
BSA and chicken ovalbumin
71
Figure 4.6: XICs of the triads of deamidation-related peptides showing the reason why only
one or two of them are identified 73
Chapter 5
Figure 5.1: The strategy for proteomic study of protein deamidation in human carotid
atherosclerotic plaques for predicting secondary cerebrovascular events 85
Figure 5.2: Proteome coverage of human carotid atherosclerotic plaques 86
Figure 5.3: Number of identified proteins in 24 canonical pathways related to the
development and progression of atherosclerosis according to IPA classification 88
Figure 5.4: The proteins identified in the pathway of inhibition of matrix metalloproteinases 88
Figure 5.5: Comparison of the identification of protein groups and deamidated peptides
between test and control group 91
Figure 5.6: Schematic mass spectrum of the MS2 fragments of an unmodified peptide and its
corresponding deamidated peptide 92
Figure 5.7: Gene ontology annotations of up-regulated proteins in test group according to
their cellular components, molecular function and protein class 93
Figure 5.8: Effect of AGC targets , NCE, isolation width and resolution on PRM transitions 96
Figure 5.9: The y10 transition of LGEYGFQ(de)NALIVR extracted at the mass tolerance of 97
List of figures
x
350 mmu (A), 30 mmu (B) and 5 mmu (C) using Xcalibur 2.2
Figure 5.10: The concentration of VCL (A) and AKAP12 (B) in all individual patients with
or without secondary events 102
Figure 5.11: The concentration of MPO (A) and MMP7 (B) in all individual patients with or
without secondary cerebrovascular events 104
Figure 5.12: The XIC areas of the deamidated peptides from TIMP1 (A) and TIMP3 (B) in
all individual patients with or without secondary cerebrovascular events 104
List of tables
xi
List of tables
Chapter 2
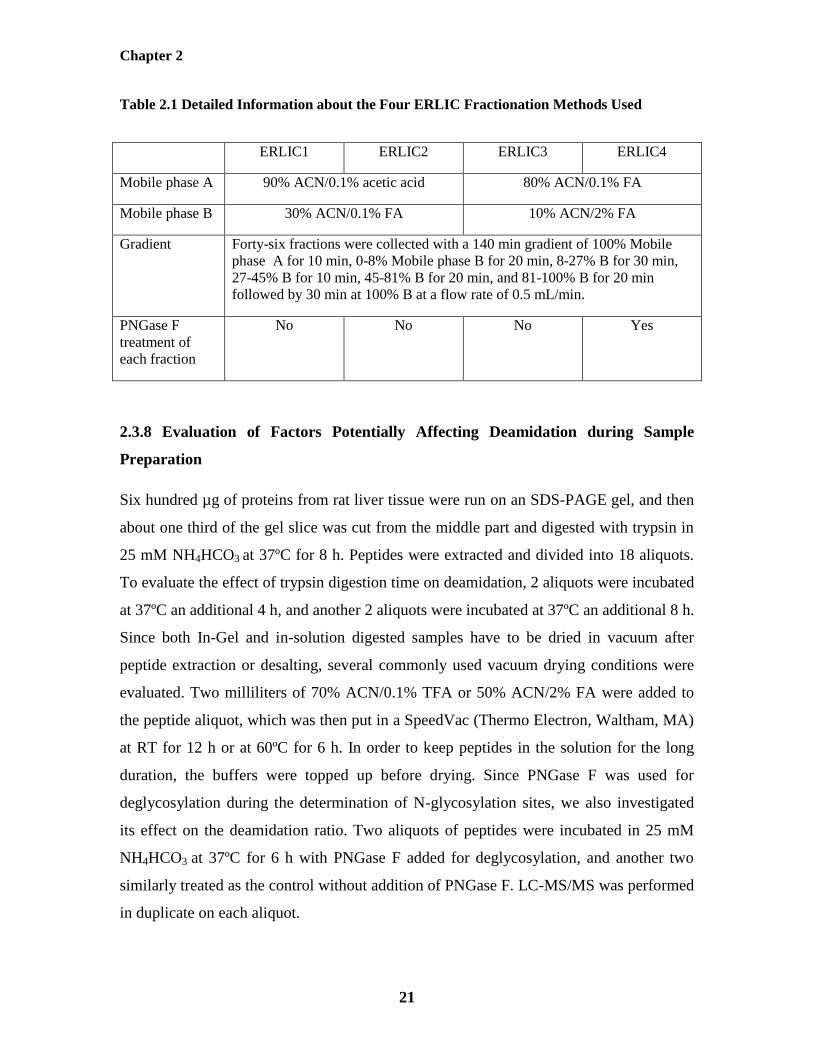
Table 2.1: Detailed Information about the Four ERLIC Fractionation Methods Used 21
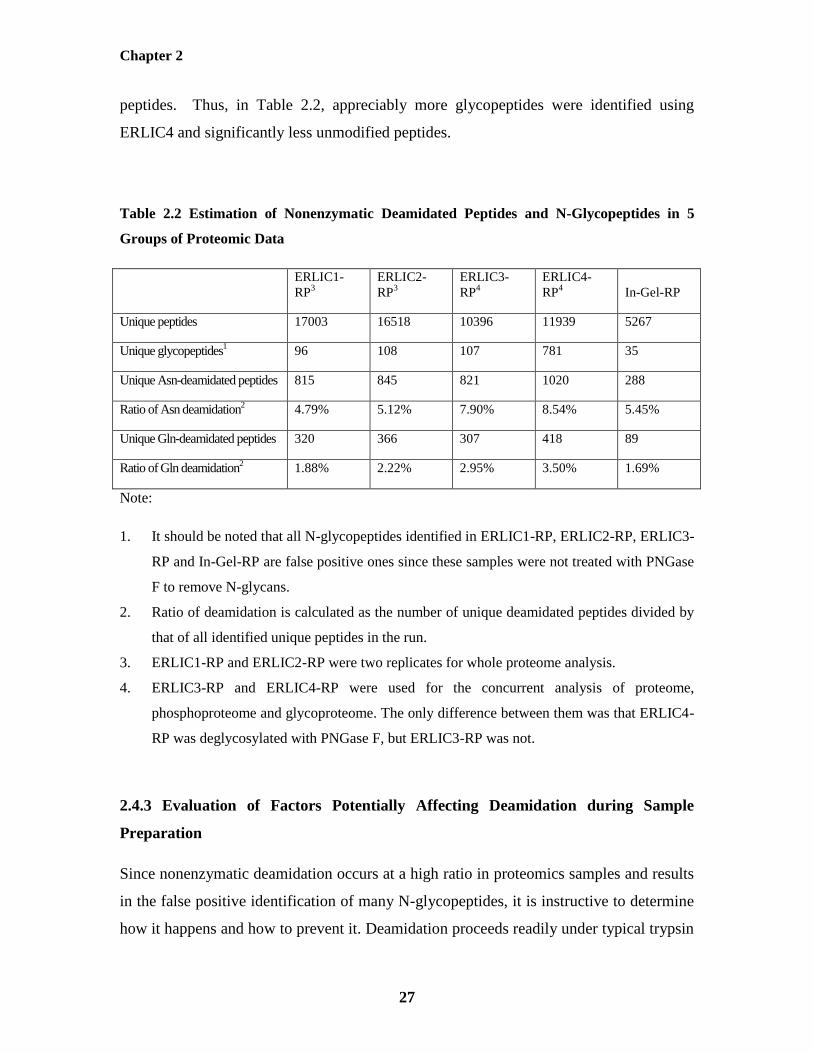
Table 2.2: Statistics about Nonenzymatic Deamidated Peptides and N-Glycopeptides in 5
Groups of Proteomic Data 27
Chapter 3
Table 3.1: Number of Protein and Peptide Identifications and Percentage of
Miscleavaged Peptides from Rat Kidney Tissue Digested in the Four Buffers 49
Chapter 4
Table 4.1: The triads of deamidation-related peptides identified from BSA and chicken
ovalbumin 66
Chapter 5
Table 5.1: Summary of the identified potential biomarkers and low-abundance
proteins involved in atherosclerosis from human atherosclerotic plaques 89
Table 5.2: Summary about quantification of protein biomarker candidates from
label-free quantification and validation of them using PRM 100
Table 5.3: Summary about quantification of peptide biomarker candidates from
label-free quantification and validation of them using PRM 101
Table 5.4: The AUCs of biomarker candidates of proteins and deamidated
peptides from ROC curve analysis 103
Table 5.5: Ratio of deamidation for deamidated peptides from TIMP1 and TIMP3
in individual plaque samples 105
Abbreviations
xii
Abbreviations
2-DE Two Dimensional gel Electrophoresis
ABB Ammonium Bicarbonate
ACN Acetonitrile
AUC Area Under the Curve
BCA BicinChoninic Acid
BSA Bovine Serum Albumin
CEA Carotid Endarterectomy
CID Collision-Induced Dissociation
DTT Dithiothreitol
ECM Extracellular Matrix
EDTA Ethylenediaminetetraacetic Acid
ELISA Enzyme-Linked Immunosorbent Assay
ERLIC Electrostatic Repulsion-Hydrophilic Interaction Chromatography
FDR False Discovery Rate
FWHM Full Width at Half-Maximum
GO Gene Ontology
HCD Higher-energy Collisional Dissociation
HILIC Hydrophilic Interaction Liquid Chromatography
HPLC High Performance Liquid Chromatography
ICAT Isotope Coded Affinity Tag
IAA Iodoacetamide
IPA Ingenuity Pathway Analysis
IPI International Protein Index
iTRAQ Isobaric Tags for Relative and Absolute Quantification
LC Liquid Chromatography
LC-MS/MS Liquid Chromatography coupled to Tandem Mass Spectrometry
LTQ Linear Quadrupole ion Trap
MALDI Matrix-Assisted Laser Desorption/Ionization
MDLC Multidimensional Liquid Chromatography
Abbreviations
xiii
MGF Mascot Generic File
MMP Matrix Metalloproteinases
MMTS Methyl Methanethiosulfonate
MRM Multiple reaction monitoring
mRNA Messenger RNA
MS Mass Spectrometry
MudPIT Multidimensional Protein Identification Technology
NCE Normalized Collision Energy
NH4Ace Ammonium Acetate
PBS Phosphate-Buffered Saline
pI Isoelectric Point
PIMT Protein L-isoaspartyl-O-methyltransferase
PRM Parallel Reaction Monitoring
PSM Peptide Spectrum Match
PTM Post-Translational Modification
ROC Receiver Operating characteristic
RPLC Reverse-phase Liquid Chromatography
RT Room Temperature
SAX Strong Anion Exchange
SCX Strong Cation Exchange
SDS-PAGE Sodium Dodecyl Sulfate Polyacrylamide Gel Electrophoresis
SILAC Stable Isotope Labeling by Amino Acids in Cell Culture
SRM Selected Reaction Monitoring
TCEP Tris 2-Carboxyethyl Phosphine Hydrochloride
TEAB Triethylammonium Bicarbonate
TFA Trifluoroacetic Acid
TMT Tandem Mass Tags
TOF Time-of-Flight
Tris 2-Amino-2-hydroxymethyl-propane-1, 3-diol
WAX Weak Anion Exchange
XIC Extracted Ion Chromatogram
Abstract
xiv
Abstract
The sensitivity, throughput and accuracy of proteomics have improved considerably in
the past years due to the development of novel technologies. However, characterization
of protein post-translational modifications remains challenging, especially those less
studied ones. Protein deamidation is reported to be involved in aging and many diseases,
but so far is less studied due to technical challenges. The existing challenges for
accurately identifying and quantifying protein deamidation sites in proteomics include
tremendous false positive identifications of deamidated peptides from database searches,
substantial interference of artificial deamidation from sample preparation, difficulties in
differentiating and quantifying the isomeric n-Asp and isoAsp deamidation products in
proteome scale, and inability of validating quantification of deamidated peptides by either
ELISA or multiple reaction monitoring. In this thesis, novel proteomic methods were
developed to overcome these challenges and facilitate the large-scale characterization of
protein deamidation. The accurate and reliable characterization of endogenous protein
deamidation becomes feasible with both false positive identifications and artificial
deamidation minimized while using our new data analysis strategy and sample
preparation protocols. High-resolution parallel reaction monitoring enables the accurate
validation of deamidated peptides in unfractionated individual samples. In addition to the
validation of these methods using both model proteins and complex tissue samples, we
also applied them to the study of protein deamidation in human carotid atherosclerotic
plaques from aged patients for predicting secondary cerebrovascular events. The
biomarker candidates of deamidated peptides and proteins obtained from label-free
quantification on pool samples were validated in 38 individual plaques using parallel
reaction monitoring for their applicability as biomarkers. None of them reached the
criterion as a clinically usable biomarker possibly due to the small sample size and high
individual variation. However, these newly developed technologies open a door for
scientists who are interested in understanding the role of protein deamidation in aging
and many diseases.

Chapter 1
1
Chapter 1
General Introduction
Chapter 1
2
1 General Introduction
1.1 Recent Development in Proteomics and Existing Challenges
The term “proteomics” was first coined in 1997 and was defined as the large-scale
characterization of the entire protein complement of a cell line, tissue, or organism.(1)
Proteome is the entire set of proteins produced or modified by an organism or system. (2,
3) Proteomics has developed quickly since the complete sequencing of human genome
was achieved in 2003. Database search has been the most prevalent peptide and protein
identification methods in proteomics, (4) and it relies on a complete protein database
predicted from the genome sequences. De novo peptide and protein sequencing is also
used under certain circumstance, (5) but it does not become a commonly used method
since peptides do not fragment sequentially, and it is generally impossible to get a
complete set of b ions and y ions (fragment ions generated by cleavages at the peptide
CO-NH bonds) in an MS/MS spectrum.
Proteomics has many unique advantages over traditional protein analytical methods and
other “omics” technologies. For example, it can sequence a single protein in a
dramatically shorter time than Edman sequencing and identify hundreds of proteins from
a complex samples; (6) it can quantify several thousand protein groups among a group of
samples with different treatments, which cannot be achieved by genomics or
transcriptomics due to the inconsistence between mRNA and protein expression; (7) it
can simultaneously identify and quantify thousands of site-specific protein post-
translational modifications (PTMs) from complex samples, while the antibody-based
PTM studies generally can only study one site-specific PTM at a time. (8) Protein PTMs
cannot be studied using other “omics” technologies because they are not encoded by the
genome or mRNA.
Two dimensional gel electrophoresis (2-DE) followed by protein identification using
Matrix-Assisted Laser Desorption/Ionization Time-of-Flight (MALDI-TOF) was the first
widely used proteomics method, and it was believed to be able to resolve the complete
proteome in the early days of proteomics. (9, 10) However, after a few years of practice,
Chapter 1
3
many researchers realized that mainly high-abundance proteins were repeatedly identified
from the 2-DE method with hydrophobic proteins and low-abundance proteins always
missing. (11) To overcome these limitations, shotgun proteomics was developed, in
which protein identification and quantification were based on peptides derived from
proteolytic digestion of intact proteins. (12, 13) In shotgun proteomics, online or offline
multidimensional liquid chromatography (MDLC) can be used to reduce sample
complexity and increase dynamic range and sensitivity of peptide identification. (14) For
offline MDLC, reverse phase liquid chromatography is mostly used as the last dimension
before mass spectrometry (MS) analysis due to its outstanding resolving power and high
compatibility with MS. (15)
Nowadays, it is achievable to identify 4000 to 5000 protein groups from a single reverse
phase liquid chromatography coupled to tandem mass spectrometry (LC-MS/MS) using
mass spectrometers with high sensitivity and high scanning speed, (16, 17) and over
10,000 protein groups can be identified via MDLC-MS/MS. (18) Relative quantification
of several thousand proteins between controls and samples can be achieved using label-
free quantification, SILAC, ICAT, iTRAQ, TMT, and so on. (19-23) However, it rarely
leads to the successful identification of biomarkers suitable for clinical use. (24, 25) A
good biomarker can be used as an endpoint to predict clinical benefit or harm for clinical
decision-making. The possible reasons include, 1) the relatively insufficient sensitivity of
shotgun proteomics in comparison to the extremely low concentration of most clinically
used biomarkers; 2) the mask of low-abundance proteins by high-abundance proteins due
to the wide dynamic range of complex samples; 3) the low reproducibility of shotgun
proteomics; 4) the lack of validation methods for potential biomarkers without ELISA
(enzyme-linked immunosorbent assay) kits.
To overcome or alleviate the above-mentioned challenges in biomarker discovery and
validation, targeted proteomics with improved sensitivity and reproducibility, such as
selected reaction monitoring (SRM) and parallel reaction monitoring (PRM), have been
widely used in the area of proteomics in recent years. (26-28) In addition to the change of
protein expression, protein PTMs are also found to be related to the progression and
Chapter 1
4
development of various diseases, such as cancer, diabetes, neurodegenerative disease and
atherosclerosis, (29-34) which may potentially be more specific biomarkers than protein
abundance. Shotgun proteomics can identify and quantify thousands of novel site-specific
PTMs in one study, (35-37) and targeted proteomics with high sensitivity and specificity
is the method of choice for further validation. In contrast, the traditional antibody based
assays, such as Western Blot and ELISA, cannot be used in the discovery and validation
of novel PTMs due to the lack of commercially available antibodies with high specificity.
1.2 Biological Significance of Protein Post-translational Modifications (PTMs)
Post-translational modifications (PTMs) are covalent processing events that change the
properties of a protein by addition of a modifying group to one or more amino acids or by
proteolytic cleavage of regulatory subunits or degradation of entire proteins after proteins
have been completely translated and released from the ribosome. (8) By now, over 400
different types of PTMs have been reported. The most common PTM is the enzymatic or
nonenzymatic addition of a functional group to proteins in vivo, such as phosphorylation
and glycosylation; (38) some artificial PTMs can be added nonenzymatically in vitro;
some PTMs add other proteins or peptides to proteins, such as SUMOylation and
ubiquitination; (39, 40) some PTMs can change the chemical nature/composition of
amino acids, such as citrullination, deamidation and carbamylation; (41, 42) some PTMs
can change the structure of proteins, such as the formation of disulfide bridges between
two cysteines and proteolytic cleavage. (43)
PTMs extend the functions and diversity of proteins and can influence almost all aspects
of normal cell biology and pathogenesis. Kinases, phosphatases, transferases and ligases
can add functional groups, such as proteins, lipids and sugars, to amino acid side chains
or remove them, and proteases can cleave peptide bonds to remove specific sequences or
regulatory subunits. PTMs play an important role in functional proteomics, because they
regulate cellular activity, localization and interaction with other cellular molecules such
as proteins, nucleic acids, lipids, and cofactors. For example, phosphorylation is a
dynamic and reversible modification involved in the regulation of many biological
processes including metabolism, cell division, signal transduction and enzymatic activity;
Chapter 1
5
(44-46) glycosylation plays important roles in many biological processes including
embryonic development, cell-to-cell interactions, cell division, and protein regulation and
interaction. (47) Aberrant glycosylation has been found to be related to various diseases,
such as cancer, inflammation and metabolic disorders. (48-50) Acetylation occurs in
nearly all eukaryotic proteins through both irreversible and reversible mechanisms.
Acetylation at the ε-NH2 of lysine (termed lysine acetylation) on histone N-termini
regulates gene transcription, and it also occurs on cytoplasmic proteins. (51) Furthermore,
crosstalk between acetylation and other post-translational modifications, including
phosphorylation, ubiquitination and methylation, can modify the biological function of
the acetylated protein. (52, 53) However, the functions of most other PTMs remain to be
uncovered.
1.3 Current Status of PTM Studies in Proteomics
The analysis of PTMs is particularly important for the study of heart disease, cancer,
neurodegenerative diseases and diabetes. (29, 54-56) However, the characterization of
PTMs is very challenging due to their low stoichiometry and dynamic changes, but it
may provide invaluable insight into the cellular functions underlying etiological
processes. The main technical challenges in studying post-translationally modified
proteins are the development of specific purification, enrichment and detection methods.
In the past years, many novel proteomics technologies have been developed to study
different PTMs.
Although over 400 different types of protein PTMs have been reported, only a few of
them have been extensively studied due to the low throughput of traditional biological
methods and technical limitations in proteomics methods. Since most PTMs occur on
some specific amino acids on their target proteins, the modified proteins or peptides have
to be enriched before MS analysis in order to avoid the interference from unmodified
proteins or peptides. (27) Generally, immunoprecipitation can be used to enrich proteins
with known PTMs using commercially available antibodies, but it cannot be used for
enriching proteins with novel PTMs due to the lack of antibodies. (57) In addition,
according to the physicochemical property of the PTM, affinity chromatography or other

Chapter 1
6
chromatographic methods, such as strong cation exchange (SCX), strong anion exchange
(SAX), weak anion exchange (WAX) and hydrophilic interaction liquid chromatography
(HILIC), may be used to enrich or separate modified peptides. (58-63)
According to the statistics about protein PTMs in Swiss-Prot knowledgebase from PTM
Statistics Curator, (64) phosphorylation, acetylation and N-glycosylation are the top 3
PTMs with experimental evidences, i.e. validation with traditional biological methods
other than proteomics methods. Data from large-scale proteomics analysis are not
regarded as experimental evidences without further validation. However, most other
PTMs are insufficiently studied. For example, s-nitrosylation and deamidation are the
19th and 20th most extensively studied PTMs, respectively, but only 81 s-nitrosylation
sites and 63 deamidation sites are reported with experimental evidences. Therefore, there
is an urgent need to study PTMs other than phosphorylation and N-glycosylation since
many of these less studied PTMs have been reported to have important biological
functions. (65-68)
1.4 Protein Deamidation
Deamidation is a chemical reaction in which an amide functional group is removed from
an organic compound. Protein deamidation occurs nonenzymatically both in vivo and in
vitro with the conversion of asparagine and glutamine into aspartic acid and glutamic
acid, respectively. Deamidation occurs relatively slowly in intact proteins with the half-
time of 1-500 days for Asn and 100-5000 days for Gln. (69) However, the rate of
deamidation can increase dramatically when amino acid residues are exposed under
denatured condition during proteolytic digestion. (70) In vivo, protein deamidation has
been reported to be related to Alzheimer’s disease (AD) and cataracts. (65-67) In vitro,
deamidation affects the purity and stability of therapeutic proteins during production and
storage. (71, 72)
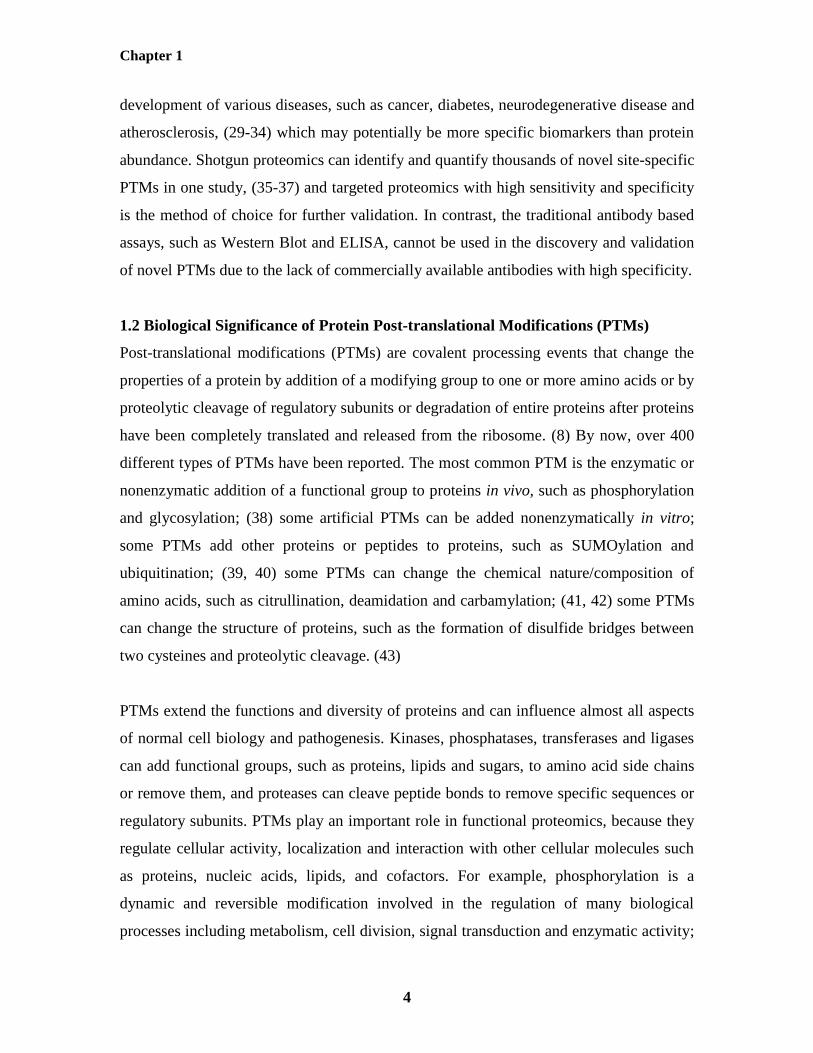
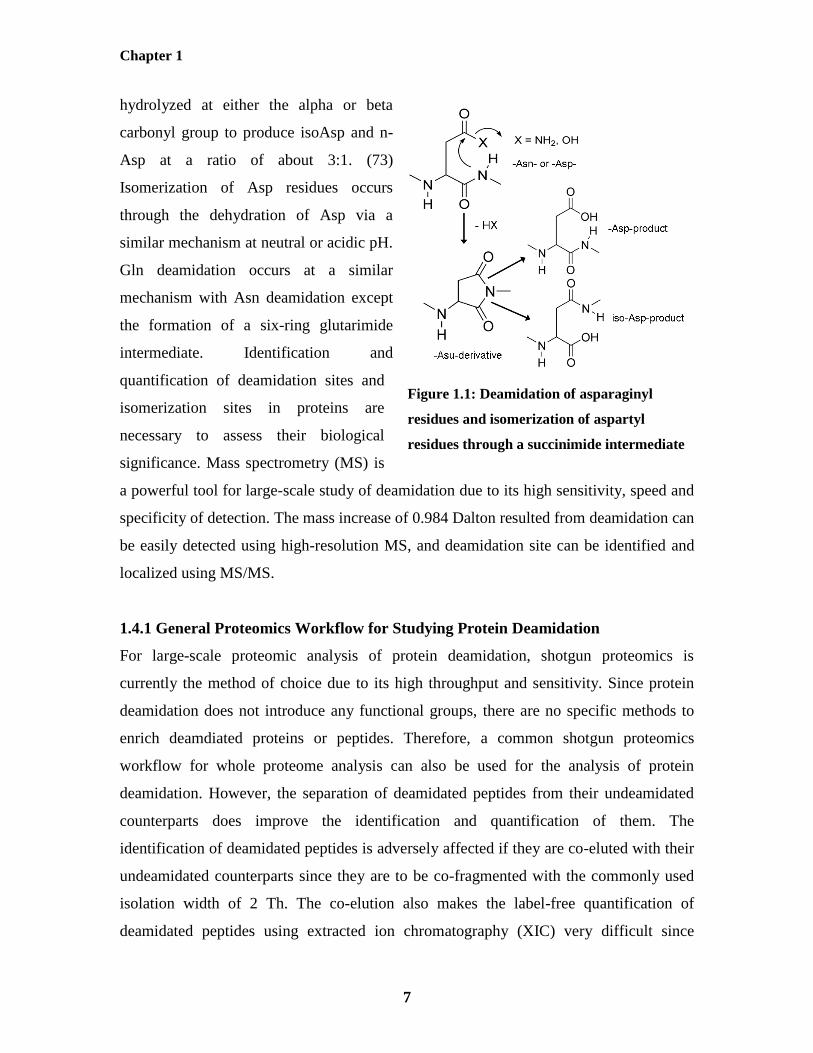
As shown in Figure 1.1, under physiological conditions or at elevated pH, the peptide
bond nitrogen (reactive anion) of the N + 1 amino acid attacks the carbonyl carbon of the
asparagine or aspartate side chain forming a succinimide ring intermediate that is quickly
Chapter 1
7
Figure 1.1: Deamidation of asparaginyl
residues and isomerization of aspartyl
residues through a succinimide intermediate
hydrolyzed at either the alpha or beta
carbonyl group to produce isoAsp and n-
Asp at a ratio of about 3:1. (73)
Isomerization of Asp residues occurs
through the dehydration of Asp via a
similar mechanism at neutral or acidic pH.
Gln deamidation occurs at a similar
mechanism with Asn deamidation except
the formation of a six-ring glutarimide
intermediate. Identification and
quantification of deamidation sites and
isomerization sites in proteins are
necessary to assess their biological
significance. Mass spectrometry (MS) is
a powerful tool for large-scale study of deamidation due to its high sensitivity, speed and
specificity of detection. The mass increase of 0.984 Dalton resulted from deamidation can
be easily detected using high-resolution MS, and deamidation site can be identified and
localized using MS/MS.
1.4.1 General Proteomics Workflow for Studying Protein Deamidation
For large-scale proteomic analysis of protein deamidation, shotgun proteomics is
currently the method of choice due to its high throughput and sensitivity. Since protein
deamidation does not introduce any functional groups, there are no specific methods to
enrich deamdiated proteins or peptides. Therefore, a common shotgun proteomics
workflow for whole proteome analysis can also be used for the analysis of protein
deamidation. However, the separation of deamidated peptides from their undeamidated
counterparts does improve the identification and quantification of them. The
identification of deamidated peptides is adversely affected if they are co-eluted with their
undeamidated counterparts since they are to be co-fragmented with the commonly used
isolation width of 2 Th. The co-elution also makes the label-free quantification of
deamidated peptides using extracted ion chromatography (XIC) very difficult since
Chapter 1
8
deamidated peptides only has a slight mass difference of 19.34 mDa with the 13
C peaks of
the corresponding unmodified peptides.
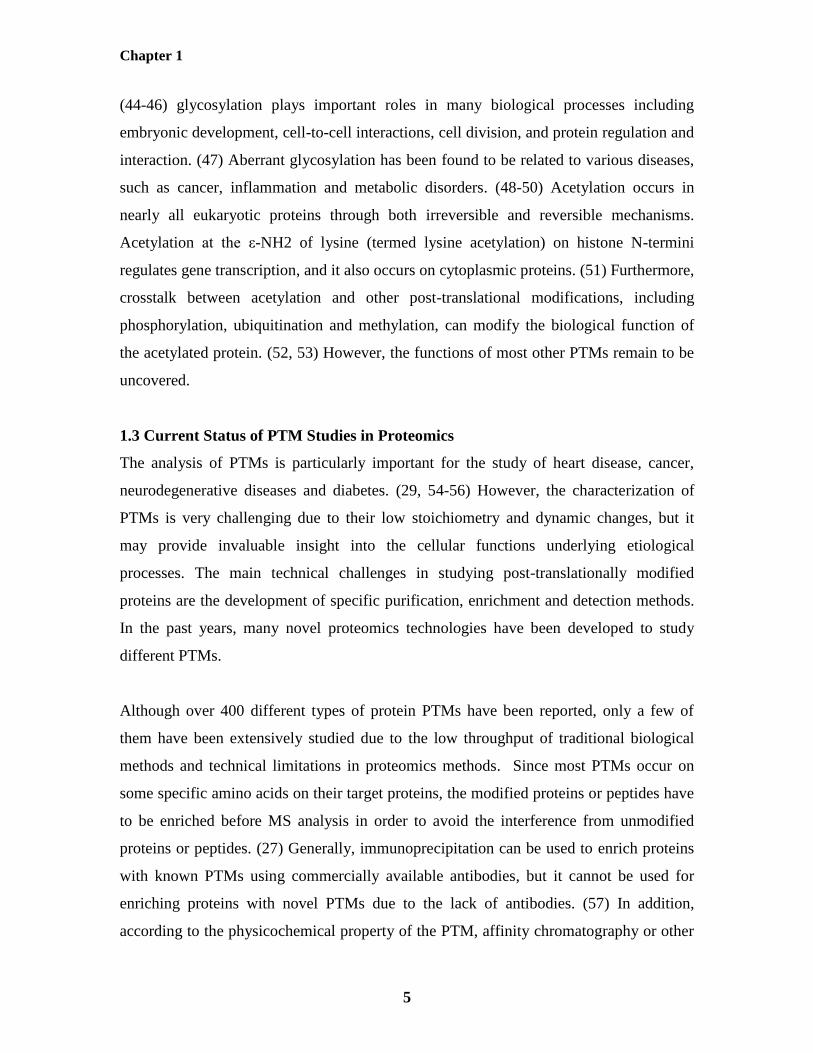
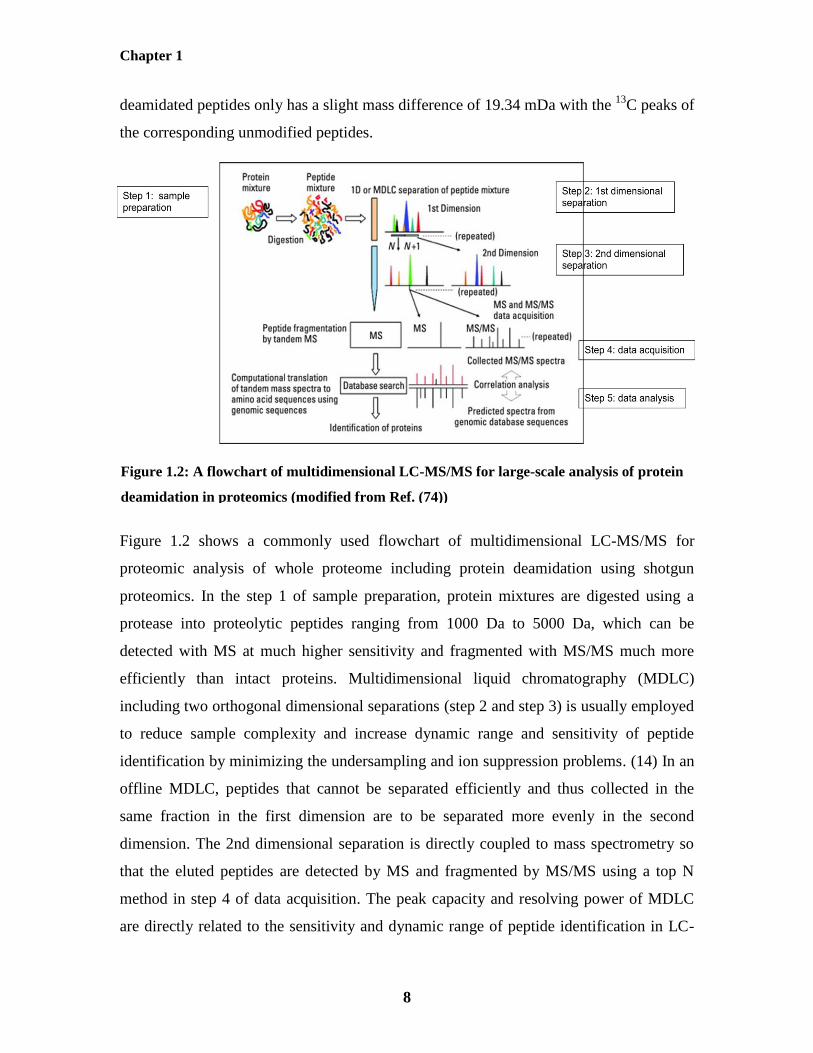
Figure 1.2 shows a commonly used flowchart of multidimensional LC-MS/MS for
proteomic analysis of whole proteome including protein deamidation using shotgun
proteomics. In the step 1 of sample preparation, protein mixtures are digested using a
protease into proteolytic peptides ranging from 1000 Da to 5000 Da, which can be
detected with MS at much higher sensitivity and fragmented with MS/MS much more
efficiently than intact proteins. Multidimensional liquid chromatography (MDLC)
including two orthogonal dimensional separations (step 2 and step 3) is usually employed
to reduce sample complexity and increase dynamic range and sensitivity of peptide
identification by minimizing the undersampling and ion suppression problems. (14) In an
offline MDLC, peptides that cannot be separated efficiently and thus collected in the
same fraction in the first dimension are to be separated more evenly in the second
dimension. The 2nd dimensional separation is directly coupled to mass spectrometry so
that the eluted peptides are detected by MS and fragmented by MS/MS using a top N
method in step 4 of data acquisition. The peak capacity and resolving power of MDLC
are directly related to the sensitivity and dynamic range of peptide identification in LC-
Figure 1.2: A flowchart of multidimensional LC-MS/MS for large-scale analysis of protein
deamidation in proteomics (modified from Ref. (74))
Chapter 1
9
MS/MS as it simplifies the complexity of peptide ions entering mass spectrometry to
minimize undersampling. (74) In step 5 of data analysis, the collected MS/MS spectra
were generally compared with the predicted MS/MS spectra from protein sequences
deduced from genome sequences using database search software, such as Mascot,
Sequest and Andomeda so that the sequence and deamidation site of deamidated peptides
can be identified (75-78). The false discovery rate (FDR) of peptide identification can be
evaluated using either the target-decoy method or Percolator. (79, 80) The accuracy of
deamidation site localization can be evaluated automatically using MaxQuant. (77) The
relative quantification of deamidated peptides between different samples can be achieved
using label-free quantification based on extracted ion chromatography (XIC).
1.4.2 Challenges in Proteome-scale Study of Protein Deamidation
As a less studied PTM, there are still many challenges in studying protein deamidation
using large-scale proteomic methods. Database search may return the identification of
many false positive deamidated peptides due to the incapability to differentiate the slight
mass difference of 19.34 mDa between deamidated peptides and the 13
C peaks of their
undeamidated counterparts. Since deamidation occurs nonenzymatically both in vivo and
in vitro, artificial deamidation occurring during proteomic sample preparation may
prevent the accurate identification and quantification of endogenous deamidation. Now, it
is still a challenging task to distinguish between the n-Asp and isoAsp deamidation
products using large-scale proteomics methods since they are structural isomers with
identical composition, mass and charge (Figure 1.1).
During the identification of deamidated peptides, database searches usually return many
false-positive identifications due to the wrong assignment of the 13
C peaks of unmodified
peptides as the corresponding deamidated peptides. (81, 82) The possible reason is that
the 13
C or 13
C2 peaks of unmodified peptides are selected as the precursor masses by
peak-picking software, and the MS/MS is not accurate enough to differentiate them from
corresponding deamidated ones unambiguously. This is still a serious problem for data
acquired with a high resolution mass spectrometer. (83) This issue compromises the LC-
MS/MS method for accurate characterization of protein deamidation.

Chapter 1
10
Deamidation takes place relatively slowly in intact proteins with a half life of 1-500 days
for Asn and 100-500 days for Gln.(69) However, nonenzymatic deamidation occurs
readily under the condition of trypsin digestion, i.e. prolonged incubation in mildly
alkaline buffers at 37ºC, which results in the identification of many artificial Asn-
deamidation sites and N-glycosylation sites when N-glycosylation site assignment is
based on the detection of Asn deamidation in the consensus sequence N-X-S/T (with X
not proline).(84-86) Shotgun proteomics is powerful in detecting deamidation sites in
proteome scale due to its high sensitivity, accuracy and throughput, (27, 87) and trypsin
has been the most widely used protease in proteomics research. Under mildly alkaline
conditions, Asn deamidation happens mainly through the formation of a succinimide ring
intermediate that is quickly hydrolyzed to d,l-Asp and d,l-isoAsp with isoAsp
predominating.(73) Deamidation of Gln (Gln deamidation) is as much as ten times slower
because it is thermodynamically less favorable to form a six-member glutarimide ring.(88)
Therefore, to accurately identify and quantify Asn deamidation sites occurring in vivo,
there is an urgent need to develop a novel sample preparation protocol to minimize the
occurrence of artificial Asn deamidation during sample preparation.
Different tandem MS peptide sequencing methods, such as collisional activated
dissociation (CAD), higher-energy collisional dissociation (HCD) and negative
electrospray ionization have occasionally been observed to distinguish between the
isomeric n-Asp and isoAsp products based on specific reporter ions, but the results are
non-specific, highly variable and unreliable. The powerful soft peptide backbone-
fragmenting techniques electron capture dissociation (ECD) and electron transfer
dissociation (ETD) are reported to be capable of distinguishing between the isomeric Asp
and isoAsp peptides based on a pair of c+57 and z-57 reporter ions, but the limitation is
that the reporter ions of isoAsp are usually very weak and buried in the background noise,
which results in many false positive identifications.(89) More challenging is that under
typical RP-MS/MS conditions, the isomeric Asp and isoAsp peptides coelute from RP
columns, making their quantification rather difficult.(90)
Because of the unavailability of commercial antibodies with high specificity, the quantification
Chapter 1
11
of novel PTM sites is usually validated using multiple reaction monitoring (MRM). (91,
92) However, protein deamidation cannot be validated using MRM due to the slight mass
difference of 19.34 mDa between deamidated peptides and the 13
C peaks of their
undeamidated counterparts. Generally, deamidation does not occur at 100% on most
deamidation sites. When triple quadrupole mass spectrometers collects precursor and
product ions for each transition in validating deamidated peptides, the 13
C peaks of their
undeamidated counterparts are also collected with the commonly used isolation width of
0.7 Th. However, it is impossible to differentiate them at the low resolution of triple
quadrupole mass spectrometers. Therefore, the quantification of deamidated peptides
cannot be validated using the low-resolution MRM. It is necessary to develop novel
technologies to validate the quantification of deamidated peptides.
1.5 Objectives and the Overview of the Thesis
Protein deamidation has been reported to be related to many diseases, such as cataracts,
celiac disease, heart diseases, neurodegenerative diseases and atherosclerosis. (54, 66, 93-
95) It is essential to identify and quantify deamidation sites in proteins in order to better
understand their biological roles. However, as mentioned above, there are currently many
challenges in accurately identifying and quantifying deamidation sites in proteins, 1.
Database search returns many false positive identifications of deamidated peptides; 2.
Proteomic sample preparation results in much artificial deamidation; 3, It is challenging
to differentiate and quantify the isomeric n-Asp and isoAsp deamidation products in
proteome scale; 4. The quantification of deamidated peptides cannot be validated using
either ELISA or MRM. In the present thesis, in order to overcome these obvious
challenges, novel proteomic methods are to be developed and applied to the study of
protein deamidation in human carotid atherosclerotic plaques for predicting secondary
cerebrovascular events.
To achieve these objectives, my PhD research work is divided into five phases as
described in Figure 1.3. In the phase I, a new database search strategy and a novel

Chapter 1
12
Figure1.3: Schematic work flow of my PhD works
proteomic sample preparation protocol were developed to minimize false positive
identification of deamidated peptides and artificial deamidation from sample preparation
so that endogenous protein deamidation can be identified and quantified accurately. In
the phase II, the newly developed trypsin digestion buffer was compared with 3
commonly used trypsin digestion buffers in in-solution digestion of rat kidney tissues on
peptide identification and artificial deamidation; In the phase III, a novel RP-ERLIC-
MS/MS strategy was developed to separate, identify and quantify the triad of
deamidation-derived products, i.e. unmodified peptides and the isomers of n-Asp and
isoAsp containing deamidated peptides; In the phase IV, the recently introduced parallel
reaction monitoring (PRM) were applied to the validation of the quantification of
deamidated peptides. In the phase V, with the challenges in large-scale analyzing
deamidation overcome, the developed technologies were applied to the study of protein
deamidation in human carotid atherosclerotic plaques for predicting secondary
cerebrovascular events. Similarly, the developed technologies can also be applied to the
proteomic study of protein deamidation in any other samples or diseases in the future.
Chapter 2
13
Chapter 2
Detection, Evaluation and Minimization of Nonenzymatic
Deamidation in Proteomic Sample Preparation
Chapter 2
14
2.1 Abstract
Identification of N-linked glycosylation sites generally depends on the detection of Asn
deamidation in the consensus sequence N-X-S/T. Characterization of protein deamidation
is also important to evaluate its in vivo biological roles. Nonenzymatic deamidation
occurs readily on peptides under the commonly used proteomic sample preparation
conditions, but its impact has not been evaluated systematically. In addition, database
search returns many false positive deamidated peptides due to the misassignment of the
13C peaks of unmodified peptides as deamidated peptides. In this chapter, the 19.34 mDa
mass difference between them is proposed to be used to minimize the resulting false
positive identifications in large-scale proteomic analysis. We evaluated 5 groups of
proteomic data and found that nonenzymatic asparagine deamidation occurred on 4-9%
of the peptides, resulting in the identification of many false positive N-glycosylation
sites. With a comprehensive study of the potential factors in proteomic sample
preparations, the mild alkaline pH and prolonged incubation at 37ºC were proven to be
the major causes of nonenzymatic deamidation. Thus, an improved protocol of trypsin
digestion at pH 6 and deglycosylation at pH 5 was proposed, and significant decrease of
nonenzymatic asparagine deamidation was achieved without affecting peptide
identification. In addition, we found that the sensitivity of deamidation detection can be
improved significantly by increasing the sample loading amount in LC-MS/MS. This
greatly increased the identification of glutamine deamidation sites, which tended to occur
with sequence motifs different from those for asparagine deamidation: -Q-V-, -Q-L- and -
Q-G- and, to a lesser extent, -Q-A- and -Q-E-.
2.2 Introduction
Accurate identification of protein deamidation sites is important to understanding its role
in human diseases and aging and in the correct localization of N-glycosylation using the
PNGase F deglycosylation method. However, determination of protein deamidation with
LC-MS/MS is compromised by current methods of proteomics sample preparation and
database searching. Nonenzymatic deamidation of Asn and Gln occurs spontaneously on
Chapter 2
15
proteins and peptides both in vivo and in vitro. In vivo, deamidation is reported to be
related to Alzheimer’s disease (AD) and cataracts.(65-67) It has also been proposed as a
molecular clock in studies of aging.(96, 97) In vitro, deamidation leads to the degradation
of therapeutic proteins during production and storage.(71, 72) It takes place relatively
slowly in intact proteins with a half life of 1-500 days for Asn and 100-5000 days for
Gln.(69) However, the deamidation rate of peptides increases significantly under
conditions typical of trypsin digestion, i.e., incubation in digestion buffers at pH 8 for 8-
16 h at 37ºC.(85) Under mildly alkaline conditions, Asn deamidation happens mainly
through the formation of a succinimide ring intermediate that is quickly hydrolyzed to
d,l-Asp and d,l-isoAsp with isoAsp predominating.(73) Deamidation of Gln (Gln
deamidation) is as much as ten times slower because it is thermodynamically less
favorable to form a six-member glutarimide ring.(88)
Most of the published papers about deamidation have focused on its mechanism and how
to detect it in specific proteins.(98-100) Recently, several papers have been published
about distinguishing deamidation in vivo from that happening during sample
preparation.(101, 102) Interest is also increasing in distinguishing l-isoAsp from l-Asp in
synthesized peptides or biological samples.(89, 90) The deamidation of peptides with -
Asn-Gly- sequences has been evaluated during proteomic sample preparation(70) but the
general impact of nonenzymatic deamidation has not been evaluated comprehensively,
although it is known to be facilitated by the conditions of trypsin digestion, the
workhorse digestion method of proteomics.
Since nonenzymatic deamidation could potentially occur on every Asn and Gln residue at
various rates,(98, 103) all peptides containing either residue could exhibit deamidated
counterparts after trypsin digestion, which would reduce the intensities of native peptides
and complicate peptide identification. It is especially harmful when the peptides
containing either residue are of low abundance. In addition, for large-scale proteomic
analysis, the convention for identification of N-linked glycosylation sites generally
depends on the detection of Asn deamidation in the consensus sequence N-X-S/T (with X
not proline) in peptides after PNGase F treatment. Since nonenzymatic deamidation can
Chapter 2
16
also occur on the Asn in the consensus sequence if it is not occupied by a glycan prior to
PNGase F treatment (which is also customarily performed at pH 8), this results in the
identification of some artificial N-glycosylation sites. H218
O has been used in
differentiating native deamidation sites from those occurring during sample
preparation,(101, 102) but this approach cannot distinguish the nonenzymatic
deamidation that occurs in the consensus sequence during the PNGase F treatment from
the real glycosylation sites. Our preliminary inspection of a large data set (Table 2.2)
revealed that the incidence of such false positive identifications was not negligible.
There is a pressing need, then, to reduce this artifact in proteomic sample preparation.
The pH of digestion buffers, the temperature and the digestion time are three major
factors that control the deamidation rate during proteolytic digestion.(85) To minimize
digestion-induced deamidation, two improved digestion protocols have been proposed.
Endoproteinase Lys-C digestion at pH 6.0 and 4ºC for 24-120 h was used to reduce
nonenzymatic deamidation for several model proteins.(104) The protocol is effective but
is difficult to apply to routine proteomic sample preparation due to the prolonged
digestion time and the impact of the 4ºC temperature on the digestion efficiency for
complex samples. Another protocol minimized nonenzymatic deamidation by reducing
the trypsin digestion time to 0.5h with detergents for denaturing proteins omitted.(85)
However, this also has not been widely used in proteomic sample preparation, due
perhaps to the same consideration of digestion efficiency for complex samples. Since the
temperature and incubation time are essential for efficient digestion, we proposed to
solve the problem by digesting samples at lower pH in this study.
During the identification of deamidated peptides, database searches usually return many
false-positive identifications due to the wrong assignment of the 13
C peaks of unmodified
peptides as the corresponding deamidated peptides.(81, 82) A possible reason is that the
13C or
13C2 peaks of unmodified peptides are selected for matching by peak-picking
software, and the MS/MS is not accurate enough to differentiate them from
corresponding deamidated ones unambiguously. This is still a serious problem for data
acquired with a high resolution mass spectrometer. This issue further compromises the
Chapter 2
17
LC-MS/MS method for accurate characterization of Asn deamidation. Here, the resulting
false-positive identifications were eliminated based on the accurate mass difference
between the 13
C peaks of unmodified peptides and the corresponding deamidated ones.
We have also evaluated a number of factors that might affect the deamidation rate and
proposed an improved protocol for sample preparation.
2.3 Materials and Methods
2.3.1 Reagents
Unless indicated, all reagents used in this study were purchased from Sigma-Aldrich,
USA. Protease inhibitor (Cat no.: 05 892 791 001) was purchased from Roche, Basel,
Switzerland; Modified sequencing grade trypsin (V5111) was purchased from Promega,
Madison, WI; Unmodified trypsin (T8802) was purchased from Sigma-Aldrich, St.
Louis, MO. Sep-Pak C18 cartridges were purchased from Waters, Milford, MA; PNGase
F was purchased from New England Biolabs, Ipswich, MA; Bicinchoninic acid (BCA)
assay kit was purchased from Pierce, Rockford, IL.
2.3.2 Sample Preparation
Male Sprague Dawley rats were handled in accordance with the guidelines of NTU
Institutional Animal Care and Use Committee (NTU-IACUC), NTU, Singapore. Rat
livers were snap-frozen in liquid nitrogen immediately after collection and kept at -80ºC
until use. The tissue was cut into small pieces and ground into fine powder in liquid
nitrogen with a pestle. The powder was then suspended in 4% SDS. The suspension was
sonicated for 10 s thrice on ice and centrifuged at 20000 X g at room temperature (RT)
for 30 min. The protein concentration of the supernatant was then determined by the
bicinchoninic acid (BCA) assay. Rat kidneys were treated in the same way as rat livers.
2.3.3 Traditional In-Gel Trypsin Digestion and PNGase F Treatment
Chapter 2
18
Rat liver samples were run on an SDS-PAGE gel. Protein bands were cut out and
transferred to Eppendorf tubes. They were washed with Milli-Q water, mixed with 50%
ACN/50% 25mM NH4HCO3 via vigorous vortexing for 30 min and dehydrated with
100% ACN until the gel particles became white. They were then reduced with 10 mM
DTT at 56ºC for 1 h and alkylated with 55 mM IAA at room temperature for 45 min in
the dark followed by successive washes with 25 mM NH4HCO3 and 50% ACN/50%
25mM NH4HCO3. Finally, they were dehydrated with 100% ACN and dried in vacuum.
Trypsin (V5111, Promega, Madison, WI) was added in the approximate weight ratio of
1:30. V5111 is modified (side-chain protected) sequencing grade porcine trypsin. All of
the trypsin used in this chapter is from Promega unless otherwise specified. After the
trypsin solution was completely absorbed by gel particles, 25 mM NH4HCO3 was added
to completely cover the particles. They were then incubated at 37ºC overnight.
Peptides were extracted from gel particles with 50% ACN containing 0.1% TFA under
sonication for 20 minutes twice. The combined extracts were dried in vacuum and
redissolved in 25 mM NH4HCO3. To the solution, PNGase F (P0705L, New England
Biolabs Inc.) was added as per the manufacturer’s instructions and incubated at 37ºC for
6h for complete deglycosylation.
2.3.4 Improved In-Gel Trypsin digestion and PNGase F Treatment
The improved In-Gel trypsin digestion and PNGase F treatment were conducted using the
same procedures as the traditional one except that 50 mM CH3COONH4, pH 6 and 50
mM CH3COONH4, pH 5 were used instead of 25 mM NH4HCO3, respectively.
2.3.5 LC-MS/MS
LC-MS/MS was done as previously described.(105) Briefly, peptides were separated and
analyzed on a Shimadzu UFLC system coupled to a LTQ-FT Ultra (Thermo Electron,
Chapter 2
19
Bremen, Germany). Mobile phase A (0.1% formic acid [FA] in H2O) and mobile phase B
(0.1% FA in ACN) were used to establish the 60 min gradient comprised of 45 min of 8-
35% B, 8 min of 35-50% B and 2 min of 80% B followed by re-equilibration at 5% B for
5 min. Peptides were then analyzed on LTQ-FT with an ADVANCE™ CaptiveSpray™
Source (Michrom BioResources) at an electrospray potential of 1.5 kV. A gas flow of 2,
ion transfer tube temperature of 180C and collision gas pressure of 0.85 mTorr were
used. The LTQ-FT was set to perform data acquisition in the positive ion mode as
previously described (25). Briefly, a full MS scan (350-1600 m/z range) was acquired in
the FT-ICR cell at a resolution of 100,000 and a maximum ion accumulation time of
1000 msec. The AGC target for FT was set at 1e+06 and precursor ion charge state
screening was activated. The linear ion trap was used to collect peptides and to measure
peptide fragments generated by collision-activated dissociation (CAD). The default AGC
setting was used (full MS target at 3.0e+04, MSn1e+04) in linear ion trap. The 10 most
intense ions above a 500 counts threshold were selected for fragmentation in CAD (MS2),
which was performed concurrently with a maximum ion accumulation time of 200 msec.
Dynamic exclusion was activated for the process, with a repeat count of 1 and exclusion
duration of 20 s. Single charged ions were excluded from MS/MS. Isolation width was 2
Da, and default charge state was 5. For CAD, normalized collision energy was set to
35%, activation Q was set to 0.25, and activation time 30 ms. Spectra were acquired in
centroid format in raw data files with XCalibur (version 2.0 SR2).
2.3.6 Data Analysis
The raw data were first converted into the dta format using the extract_msn (version 4.0)
in Bioworks Browser (version 3.3, Thermo Fisher Scientific, Inc.), and then the dta files
were converted into Mascot Generic File (MGF) format using an in-house program.
Intensity values and fragment ion m/z ratios were not manipulated. The IPI rat protein
database (version 3.40, 40381 sequences, 20547209 residues) and its reversed
complement were combined and used for database searches. The database search was
performed using an in-house Mascot server (version 2.2.04, Matrix Science, Boston, MA,
USA) with MS tolerance of 5.1 ppm, #13
C of 2 and MS/MS tolerance of 0.5 Da. Two
Chapter 2
20
missed cleavage sites of trypsin were allowed. Carbamidomethylation (C) was set as a
fixed modification, and oxidation (M), phosphorylation (S, T and Y) and deamidation (N
and Q) were set as variable modifications. The obtained peptide/protein list for each
fraction was exported to Microsoft Excel or processed using an in-house script for further
analysis. The dta files of peptides for which the Mascot score was over 20 in each
fraction were combined and converted into Mascot generic file format using an in-house
program. It was then searched again using Mascot to generate the protein and peptide list.
For high confidence peptide identification, only peptides with an E-value of less than
0.05 were used for statistical calculation. The FDR of peptide identification was
estimated to be less than 1% (FDR = 2.0 × decoy_hits/total_hits). The FDR rate is based
on the assigned spectra. Peptides identified with a consensus N-X-S/T (with X not
proline) and a modification of deamidation at the asparagine were regarded as N-linked
glycopeptides, and those identified with a modification of deamidation at glutamine or at
asparagine but not in the consensus sequence were regarded as nonenzymatically
deamidated peptides.
2.3.7 Evaluation of the Ratio of Deamidation in 5 Groups of Proteomic Data
Electrostatic Repulsion-Hydrophilic Interaction Chromatography (ERLIC) has recently
been shown to be both effective and convenient for fractionation of complex tryptic
digests in a sequence with RP.(105) The ratio of deamidation was evaluated in 5 groups
of proteomic data obtained from rat kidney tissue, i.e. ERLIC1-RP, ERLIC2-RP,
ERLIC3-RP, ERLIC4-RP and In-Gel-RP. For ERLIC-RP, tryptic peptides were obtained
as described. (105) Each of 2 mg peptides were fractionated using a PolyWAX LP anion-
exchange column (4.6 × 200 mm, 5 μm, 300 Å, PolyLC, Columbia, MD) using the
ERLIC gradients in Table 2.1, and one third of the collected fractions was used for LC-
MS/MS. For In-Gel-RP, 300 µg proteins were run on a SDS-PAGE gel, which was then
cut into 21 slices. In-Gel trypsin digestion was done as described above using the
traditional protocol.
Chapter 2
21
Table 2.1 Detailed Information about the Four ERLIC Fractionation Methods Used
ERLIC1 ERLIC2 ERLIC3 ERLIC4
Mobile phase A 90% ACN/0.1% acetic acid 80% ACN/0.1% FA
Mobile phase B 30% ACN/0.1% FA 10% ACN/2% FA
Gradient Forty-six fractions were collected with a 140 min gradient of 100% Mobile
phase A for 10 min, 0-8% Mobile phase B for 20 min, 8-27% B for 30 min,
27-45% B for 10 min, 45-81% B for 20 min, and 81-100% B for 20 min
followed by 30 min at 100% B at a flow rate of 0.5 mL/min.
PNGase F
treatment of
each fraction
No No No Yes
2.3.8 Evaluation of Factors Potentially Affecting Deamidation during Sample
Preparation
Six hundred µg of proteins from rat liver tissue were run on an SDS-PAGE gel, and then
about one third of the gel slice was cut from the middle part and digested with trypsin in
25 mM NH4HCO3 at 37ºC for 8 h. Peptides were extracted and divided into 18 aliquots.
To evaluate the effect of trypsin digestion time on deamidation, 2 aliquots were incubated
at 37ºC an additional 4 h, and another 2 aliquots were incubated at 37ºC an additional 8 h.
Since both In-Gel and in-solution digested samples have to be dried in vacuum after
peptide extraction or desalting, several commonly used vacuum drying conditions were
evaluated. Two milliliters of 70% ACN/0.1% TFA or 50% ACN/2% FA were added to
the peptide aliquot, which was then put in a SpeedVac (Thermo Electron, Waltham, MA)
at RT for 12 h or at 60ºC for 6 h. In order to keep peptides in the solution for the long
duration, the buffers were topped up before drying. Since PNGase F was used for
deglycosylation during the determination of N-glycosylation sites, we also investigated
its effect on the deamidation ratio. Two aliquots of peptides were incubated in 25 mM
NH4HCO3 at 37ºC for 6 h with PNGase F added for deglycosylation, and another two
similarly treated as the control without addition of PNGase F. LC-MS/MS was performed
in duplicate on each aliquot.
Chapter 2
22
2.3.9 Comparison of the Digestion Efficiency of Trypsin at pH6 and pH8 using
bovine serum albumin (BSA) as the Substrate
BSA was dissolved in 8M urea and 1% SDS at a concentration of 8 mg/mL. The protein
was reduced with 10mM DTT at 56ºC for 1 h and alkylated with 55mM IAA for 45 min
at room temperature in the dark. The concentration of urea was diluted to 1M with 25
mM NH4HCO3, pH 8, or 50 mM CH3COONH4, pH 6, before trypsin was added in a
weight ratio of 1:30. Similarly, the concentration of SDS was diluted to 0.1% before
trypsin was added. It was then incubated at 37ºC for 2h, 4h, 8h and 24h, respectively.
Each portion of 5 µg protein digest was run on an SDS-PAGE gel in order to compare the
difference in trypsin digestion efficiency at different time points. For comparison,
unmodified trypsin (T8802) from Sigma-Aldrich (St. Louis, MO) was also tested in the
same way.
2.3.10 Comparison of the Deamidation Rate at pH6 and pH8 using Synthetic
Peptides
The peptide DGNGYISAAELR was synthesized at the Peptide Synthesis Core Facility,
Nangyang Technological University. It was incubated in 25 mM NH4HCO3, pH 8, or 50
mM CH3COONH4, pH 6, for 2h, 4h, 8h and 24h at 37ºC. The mass spectra of the
untreated and treated peptide were acquired with an ABI 4800 MALDI-TOF/TOF
(Applied Biosystems). Both the untreated and treated peptides were analyzed using a
PolySULFOETHYL A column (4.6 × 200 mm, 5 µm, 200 Å, PolyLC, Columbia, MD)
on a Shimadzu Prominence UFLC system. Buffer A was 0.1% FA in 80% ACN and
buffer B was 30 mM CH3COONH4 in 30% ACN. Twenty fractions were collected during
a 30 min gradient: 5-50% buffer B for 5 min, 50-100% buffer B for 20 min, and 100% B
for 5 min at a flow rate of 1 mL/min. The absorbance was monitored at 280 nm. The
identifications of the peptide and two deamidated products were verified with MALDI-
TOF/TOF. The reporter ion of yn – 46 is used to distinguish between the two deamidated
products. (106)
Chapter 2
23
2.3.11Comparison of the Traditional and Improved Sample Preparation Protocol
One hundred µg of proteins from rat liver tissue were run on each lane of an SDS-PAGE
gel, and about one tenth of the gel was cut from the middle part and transferred to
Eppendorf tubes. To evaluate the effect of pH 6 on trypsin digestion efficiency and the
deamidation ratios, gel particles were digested in 50mM CH3COONH4, pH 6, and 25mM
NH4HCO3, pH 8, for both 8h and 16h time courses. To evaluate whether the
deglycosylation at pH 5 reduces the deamidation ratio significantly compared with that at
pH 8, tryptic peptides were treated with PNGase F for 6h in 50mM CH3COONH4, pH 5,
or 25mM NH4HCO3, pH 8. Each test was performed in duplicate, and LC-MS/MS was
performed in duplicate on each test sample.
2.3.12 Enhanced Detection of Nonenzymatic Deamidation from Complex Samples
Two mg of proteins from rat kidney tissue were run on an SDS-PAGE gel which was
then cut into 20 slices. In-Gel trypsin digestion and PNGase F treatment were done as
described above using the traditional protocol. LC-MS/MS was done as described above;
the loading amount was about 100 µg per injection. This approach is hereafter referred to
as In-Gel-RP-En.
2.4 Results and Discussion
2.4.1 The Reliable Identification of Deamidated Peptides in Database Searches
LC-MS/MS is the method of choice for determination of protein deamidation. However,
database searches can return some false-positive identification of deamidated peptides
since the 13
C peaks of unmodified peptides can be wrongly assigned as the monoisotopic
peaks of the corresponding deamidated peptides. This problem is still severe even when
deamidated peptides are identified from complex proteomic samples using mass
spectrometers with high resolution. Thus, we need to find a way to differentiate the real
deamidated peptides from such false positive ones. In this study, LC-MS/MS was done
Chapter 2
24
on an LTQ-FT Ultra with sufficiently good mass accuracy to solve the problem based on
the mass difference between the 13
C peaks of unmodified peptides and the corresponding
deamidated ones. As shown in Figure 2.1A, the mass difference between the first isotopic
peak M and the 13
C peak M’ of an unmodified peptide is 1.00335 Da; the mass difference
between peak M and the first isotopic peak N of the corresponding deamidated peptide is
0.98401 Da; the mass difference between peak M’ and N is 19.34 mDa. In order to
differentiate peak N from peak M’ in database searches, a mass error of 5.1 ppm was
used here. Thus, deamidated peptides with mass of less than 3868 Da (19.34 mDa/5.1
ppm) could be identified unambiguously. The lower limit of mass error that can be used
depends on the mass accuracy of the mass spectrometer in use. Please be noted that #13
C
must be set to 2 in Mascot in order to correctly identify 13
C or 13
C2 peaks and reduce the
mismatch of them as deamidated peptides. The 19.34 mDa mass difference has been used
in differentiating the unmodified and deamidated forms of synthetic peptides or intact
proteins using FTMS.(81, 107) In this study we have extended its application to
automated database searches in large-scale proteomic analysis. Jung et al has also
developed several programs to aid the accurate assignment of monoisotopic precursor
masses to MS/MS data.(108)
Since nonenzymatic deamidation usually does not run to completion with peptides, the
experimental mass difference between the unmodified peptides and the corresponding
deamidated ones can also be used in determining the false positive identification of
deamidated peptides. An example of wrong assignment of the 13
C peak of the unmodified
peptide as deamidated peptides is shown in Figure 2.1B. It was determined based on the
mass difference between the experimental mass of the assumed deamidated peptide and
the unmodified one, i.e. 3118.4132-3117.4159 = 0.9973. This is nearer to 1.00335 than
0.98401, so the putative deamidated peptide is actually the 13
C peak of the unmodified
peptide. The mass difference can also be used in determining false positive identifications
of deamidated peptides over 3868 Da. An example of a correctly assigned deamidated
peptide is shown in Figure 2.1C. The mass difference between the experimental masses
of the assumed deamidated peptide and the unmodified one was 0.9831 Da, which is

Chapter 2
25
Figure 2.1: The reliable identification of deamidated peptides. (A) Schematic mass spectrum
of an unmodified peptide and its corresponding deamidated peptide. Peak M is the first isotopic
peak of the unmodified peptide; M’ and M’’ are its 13
C and 13
C2 peaks, respectively. Peak N is the
first isotopic peak of the corresponding deamidated peptide. The mass difference between M’ and
N is 19.34 mDa. (B) An example of the wrong assignment of the 13
C peak as the Asn deamidation
product in Mascot database searches; (C) An example of correctly assigned Asn deamidation in
Mascot database searches; (D) The XICs of the peptides identified in Fig 2.1B and 2.1C, in the
form of a chromatogram obtained via reversed-phase.
nearer to 0.98401 than 1.00335. In addition, the identification of deamidated peptides can
also be confirmed based on the retention time. As shown in Figure 2.1D, an unmodified

Chapter 2
26
peptide and its 13
C peak have the same retention time in RP chromatography, but a
deamidated peptide has a different retention time than that of the corresponding
unmodified peptide. This has been used in the reliable identification of deamidated
peptides.(70, 109) However, the method we propose here is decidedly more convenient
since it can be achieved easily by merely changing the parameters in database searches.
2.4.2 Evaluation of the Ratio of Deamidation in 5 Groups of Proteomic Data
To investigate the effect of nonenzymatic deamidation on proteomic sample preparation,
the extent of deamidation was evaluated in 5 groups of proteomic data using the above-
mentioned data analysis method. As shown in Table 2.2, Asn deamidation occurs to
some extent with 4-9% of all peptides, evidence of a significant effect of proteomic
sample preparation conditions. Gln deamidation occurs at a lower ratio: 1-4%. Since Gln
deamidation happens via a mechanism similar to Asn deamidation (formation of a
glutarimide ring intermediate) but at a slower rate, we focus mainly on Asn deamidation
here. It is worthy of notice that all N-glycopeptides identified in ERLIC1-RP, ERLIC2-
RP, ERLIC3-RP and In-Gel-RP are false positive ones since these samples were not
treated with PNGase F to remove N-glycans. As the only difference between ERLIC3-RP
and ERLIC4-RP was that each fraction from ERLIC was deglycosylated with PNGase F
in ERLIC4-RP, the number of their false positive N-glycopeptides should be nearly
identical. Thus, about 13.7% (107/781) of the N-glycopeptides in ERLIC4-RP are false
positive identifications due to nonenzymatic deamidation, confirming the desirability of
reducing the occurrence of this artifact in the identification of N-glycopeptides. To the
best of our knowledge, this is the first report about the large-scale evaluation of
nonenzymatically deamidated peptides in complex proteomic samples. The information
listed in Table 2.2 can be obtained from them using an in-house PERL program.
It may be noted that the modifications to the mobile phase that distinguish ERLIC3 and
ERLIC4 from ERLIC1 and ERLIC2 conditions were designed to improve the isolation
and identification of peptides with PTM’s at the expense of resolution of unmodified
Chapter 2
27
peptides. Thus, in Table 2.2, appreciably more glycopeptides were identified using
ERLIC4 and significantly less unmodified peptides.
Table 2.2 Estimation of Nonenzymatic Deamidated Peptides and N-Glycopeptides in 5
Groups of Proteomic Data
ERLIC1-
RP3
ERLIC2-
RP3
ERLIC3-
RP4
ERLIC4-
RP4 In-Gel-RP
Unique peptides 17003 16518 10396 11939 5267
Unique glycopeptides1 96 108 107 781 35
Unique Asn-deamidated peptides 815 845 821 1020 288
Ratio of Asn deamidation2 4.79% 5.12% 7.90% 8.54% 5.45%
Unique Gln-deamidated peptides 320 366 307 418 89
Ratio of Gln deamidation2 1.88% 2.22% 2.95% 3.50% 1.69%
Note:
1. It should be noted that all N-glycopeptides identified in ERLIC1-RP, ERLIC2-RP, ERLIC3-
RP and In-Gel-RP are false positive ones since these samples were not treated with PNGase
F to remove N-glycans.
2. Ratio of deamidation is calculated as the number of unique deamidated peptides divided by
that of all identified unique peptides in the run.
3. ERLIC1-RP and ERLIC2-RP were two replicates for whole proteome analysis.
4. ERLIC3-RP and ERLIC4-RP were used for the concurrent analysis of proteome,
phosphoproteome and glycoproteome. The only difference between them was that ERLIC4-
RP was deglycosylated with PNGase F, but ERLIC3-RP was not.
2.4.3 Evaluation of Factors Potentially Affecting Deamidation during Sample
Preparation
Since nonenzymatic deamidation occurs at a high ratio in proteomics samples and results
in the false positive identification of many N-glycopeptides, it is instructive to determine
how it happens and how to prevent it. Deamidation proceeds readily under typical trypsin
Chapter 2
28
Figure 2.2 Effect of trypsin digestion time (A),
vacuum drying condition (B) and PNGase F
treatment (C) on Asn deamidation. BLK = Blank; the
control corresponding to treatment using PNGase F
conditions but without the PNGase F, as described in
Materials and Methods. Proteins extracted from rat liver
tissue were used in the test.
digestion conditions, i.e.,
incubation of proteins in digestion
buffers of pH 8 at 37ºC for 8-16 h.
We first evaluated the effect of
trypsin digestion time on
deamidation with gel-separated rat
liver tissue proteins. As shown in
Figure 2.2A, the deamidation ratio
increases significantly during
trypsin digestion for 16h compared
with that for 8h, indicating that
many deamidation sites were
newly induced or became
detectable during trypsin digestion
(P=0.006). Thus, deamidation can
be reduced by shortening trypsin
digestion time or improving the
digestion conditions. It should be
noted that the number of
detectable deamidated peptides is
closely related to the sensitivity of
the mass spectrometer used.
Because this may change slightly
with time, it is preferable to do the LC-MS/MS on samples consecutively for comparing
the deamidation ratio.
Tryptic peptides were also subjected to some other treatments before LC-MS/MS.
Generally, 50% ACN, 2% FA was used in the extraction of peptides from gel particles,
and 70% ACN, 0.1% TFA was used in the elution of desalted peptides. Both steps were
followed by vacuum drying. Thus, we tested whether the vacuum drying with these

Chapter 2
29
Figure 2.3 Proposed improved trypsin
digestion and PNGase F treatment protocol
for N-glycosylation site determination.
solutions significantly affected the deamidation ratio. As shown in Figure 2.2B,
compared with untreated samples, the deamidation ratio did not significantly increase in
the four tested vacuum drying conditions, i.e., with 70% ACN/0.1% TFA at RT for 12h,
50% ACN/2% FA at RT for 12h, 70% ACN/0.1% TFA at 60ºC for 6h and 50% ACN/2%
FA at 60ºC for 6h. This indicates that nonenzymatic deamidation proceeds slowly under
acidic conditions even at 60ºC.
The effect of PNGase F treatment on the deamidation ratio is shown in Figure 2.2C.
Compared with untreated samples, the deamidation ratio increased significantly in both
PNGase F treated samples (P=0.04) and the control (P=0.003), the two being comparable.
This indicates that the incubation of tryptic peptides with 25 mM NH4HCO3 is
responsible for the increase of deamidation, not the PNGase F treatment itself, and
suggests that the incubation conditions could be improved in order to reduce the
occurrence of deamidation.
2.4.4 Improved Protocol for N-Glycosylation Site Determination from Complex
Samples
Based on our results, the standard trypsin
digestion and deglycosylation protocol induce
a significant degree of nonenzymatic
deamidation due to the mildly alkaline pH of
the reaction buffers. As shown by the
schematic in Figure 2.3, we propose to solve
this problem via an improved protocol that
involves conducting protein reduction,
alkylation, and trypsin digestion in 50 mM
CH3COONH4, pH 6 and performing the
deglycosylation in 50 mM CH3COONH4, pH

Chapter 2
30
5. The deamidation rate is minimal at pH 5,(101) but trypsin digestion cannot be
performed at so low a pH according to the instructions from the manufacturer.
Accordingly, we evaluated trypsin digestion at pH 6. For the deglycosylation of N-
glycopeptides, the suggested reaction buffer for PNGase F is 50 mM Na2HPO4, pH 7.5,
or 25 mM NH4HCO3, but the enzyme activity was found not to be compromised at a pH
as low as 5.(110) Accordingly, we proposed to do the deglycosylation at pH 5 in this
study.
2.4.5 Comparison of the Digestion Efficiency of Trypsin at pH6 and pH8 using
Bovine Serum Albumin (BSA) as the Substrate
The digestion efficiency of trypsin at pH 6 was evaluated with BSA before it was applied
to complex samples. As shown in Figure 2.4A and 2.4C, when urea is used as the
denaturant, five µg BSA disappeared completely after being digested with either
unmodified or modified (side-chain protected) trypsin for 2-24h, indicating that even 2h
digestion at pH 6 at 37ºC was enough for complete digestion. However, when SDS was
used as the denaturant, the band of BSA remained unchanged even after 24h digestion at
pH 6 at 37ºC if unmodified trypsin was used (Figure 2.4B), indicating that it was
completely deactivated at pH 6. BSA was digested into large fragments at pH 8 if SDS
and unmodified trypsin were used. In contrast, modified trypsin performed much better
than unmodified when SDS was used as the denaturant. As shown in Figure 2.4D,
although it only digested BSA into large fragments after 24h at pH 6 at 37ºC, digestion
was complete at pH 8 in 2h. Thus, it was preferable to use urea as the denaturant when
the trypsin digestion was done at pH 6, and the resulting activity of trypsin was good
enough for proteomic analysis. The difference in the performance of V5111 and T8802
trypsin is possibly due to that V5111 trypsin is modified by reductive methylation,
rendering it more resistant to SDS denaturation. Since most researchers are using
modified trypsin to prevent autolysis, its high activity at pH 6 seems to be an additional
benefit in reducing digestion-induced deamidation.
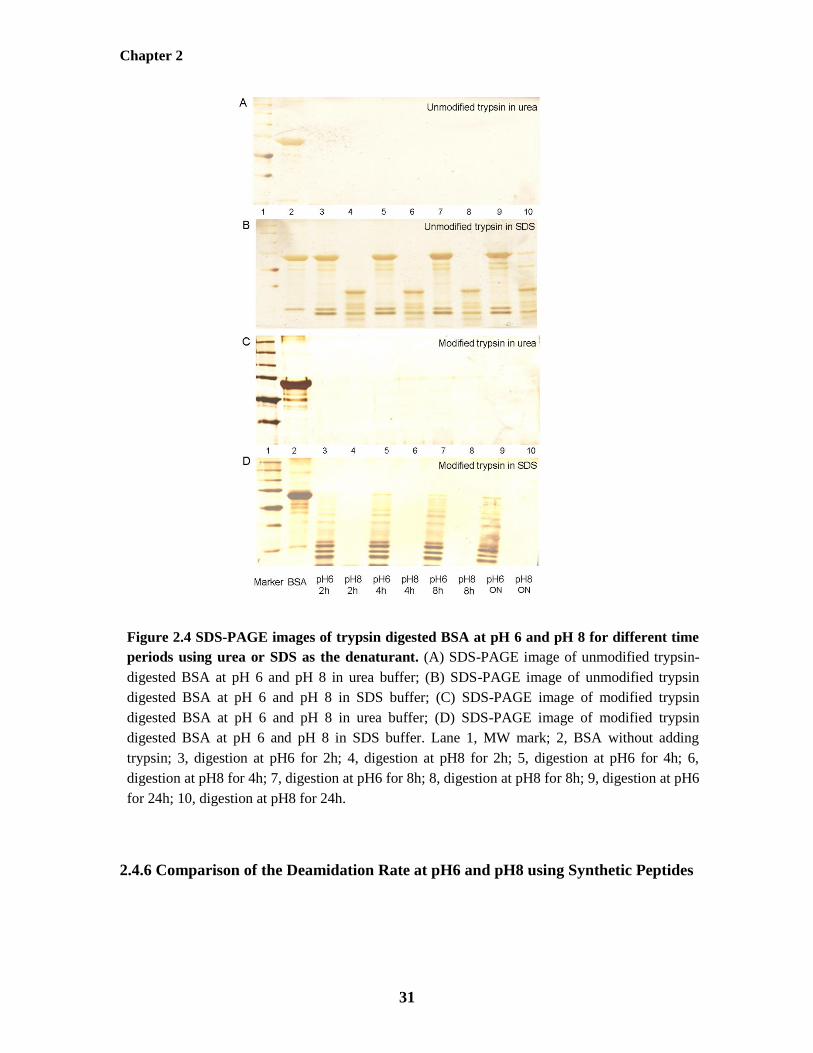
Chapter 2
31
Figure 2.4 SDS-PAGE images of trypsin digested BSA at pH 6 and pH 8 for different time
periods using urea or SDS as the denaturant. (A) SDS-PAGE image of unmodified trypsin-
digested BSA at pH 6 and pH 8 in urea buffer; (B) SDS-PAGE image of unmodified trypsin
digested BSA at pH 6 and pH 8 in SDS buffer; (C) SDS-PAGE image of modified trypsin
digested BSA at pH 6 and pH 8 in urea buffer; (D) SDS-PAGE image of modified trypsin
digested BSA at pH 6 and pH 8 in SDS buffer. Lane 1, MW mark; 2, BSA without adding
trypsin; 3, digestion at pH6 for 2h; 4, digestion at pH8 for 2h; 5, digestion at pH6 for 4h; 6,
digestion at pH8 for 4h; 7, digestion at pH6 for 8h; 8, digestion at pH8 for 8h; 9, digestion at pH6
for 24h; 10, digestion at pH8 for 24h.
2.4.6 Comparison of the Deamidation Rate at pH6 and pH8 using Synthetic Peptides

Chapter 2
32
Figure 2.5 Monitoring the deamidation of the
synthetic peptide DGNGYISAAELR at pH 6
and pH 8 by HPLC and MALDI-TOF. Solutions
of the synthetic peptide in 50 mM CH3COONH4,
pH 6, or 25 mM NH4HCO3 were incubated at 37ºC
for 2h, 4h, 8h and 24h, respectively. They were
resolved with a SCX column with UV detection at
280nm. Each unfractionated mixture was also
analyzed semi-quantitatively with MALDI-TOF
with the mass spectra shown in the insets.
The deamidation rate at pH 6 and pH
8 at 37ºC was determined using the
synthetic peptide DGNGYISAAELR.
As shown in Figure 2.5, the SCX
chromatograms showed the gradual
transformation of the undeamidated
peptide into two deamidation
products containing -βDG- and –DG-
at pH 8. The identification of the
peptide and two deamidated products
was verified with MALDI-TOF/TOF.
The deamidation ratio was calculated
as the area of the two deamidation
products divided by the sum of the
area of both deamidated and
undeamidated peptides. It was
estimated to be 5.7%, 11.4%, 25.8%
and 64.8% after 2h, 4h, 8h and 24h
incubation at pH 8 at 37ºC. However,
the chromatograms remained
unchanged when the synthetic peptide
was incubated at pH 6 at 37ºC for 2h,
4h and 8h [data not shown]. Even
after 24h incubation at pH 6 at 37ºC,
the deamidation ratio was estimated
to be only 0.52%. The same trend was also semiquantitatively reflected in the MALDI-
TOF mass spectra of the solution at different time points shown in the insets of Figure
2.5. This confirms that deamidation happens much more slowly at pH 6 than that at pH
8. Krokhin et al reported that the half-life of the deamidation of peptides with –NG- was
~8h in 100 mM NH4HCO3 at 37ºC.(70) This is two times faster than the deamidation rate
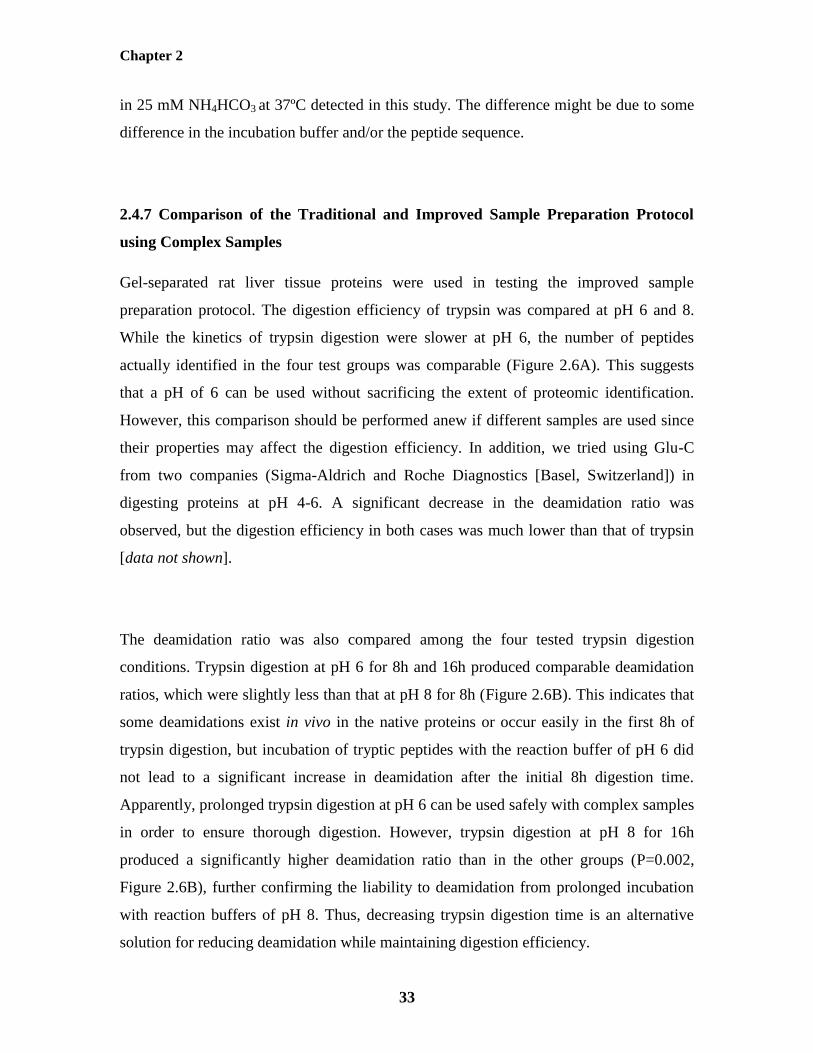
Chapter 2
33
in 25 mM NH4HCO3 at 37ºC detected in this study. The difference might be due to some
difference in the incubation buffer and/or the peptide sequence.
2.4.7 Comparison of the Traditional and Improved Sample Preparation Protocol
using Complex Samples
Gel-separated rat liver tissue proteins were used in testing the improved sample
preparation protocol. The digestion efficiency of trypsin was compared at pH 6 and 8.
While the kinetics of trypsin digestion were slower at pH 6, the number of peptides
actually identified in the four test groups was comparable (Figure 2.6A). This suggests
that a pH of 6 can be used without sacrificing the extent of proteomic identification.
However, this comparison should be performed anew if different samples are used since
their properties may affect the digestion efficiency. In addition, we tried using Glu-C
from two companies (Sigma-Aldrich and Roche Diagnostics [Basel, Switzerland]) in
digesting proteins at pH 4-6. A significant decrease in the deamidation ratio was
observed, but the digestion efficiency in both cases was much lower than that of trypsin
[data not shown].
The deamidation ratio was also compared among the four tested trypsin digestion
conditions. Trypsin digestion at pH 6 for 8h and 16h produced comparable deamidation
ratios, which were slightly less than that at pH 8 for 8h (Figure 2.6B). This indicates that
some deamidations exist in vivo in the native proteins or occur easily in the first 8h of
trypsin digestion, but incubation of tryptic peptides with the reaction buffer of pH 6 did
not lead to a significant increase in deamidation after the initial 8h digestion time.
Apparently, prolonged trypsin digestion at pH 6 can be used safely with complex samples
in order to ensure thorough digestion. However, trypsin digestion at pH 8 for 16h
produced a significantly higher deamidation ratio than in the other groups (P=0.002,
Figure 2.6B), further confirming the liability to deamidation from prolonged incubation
with reaction buffers of pH 8. Thus, decreasing trypsin digestion time is an alternative
solution for reducing deamidation while maintaining digestion efficiency.
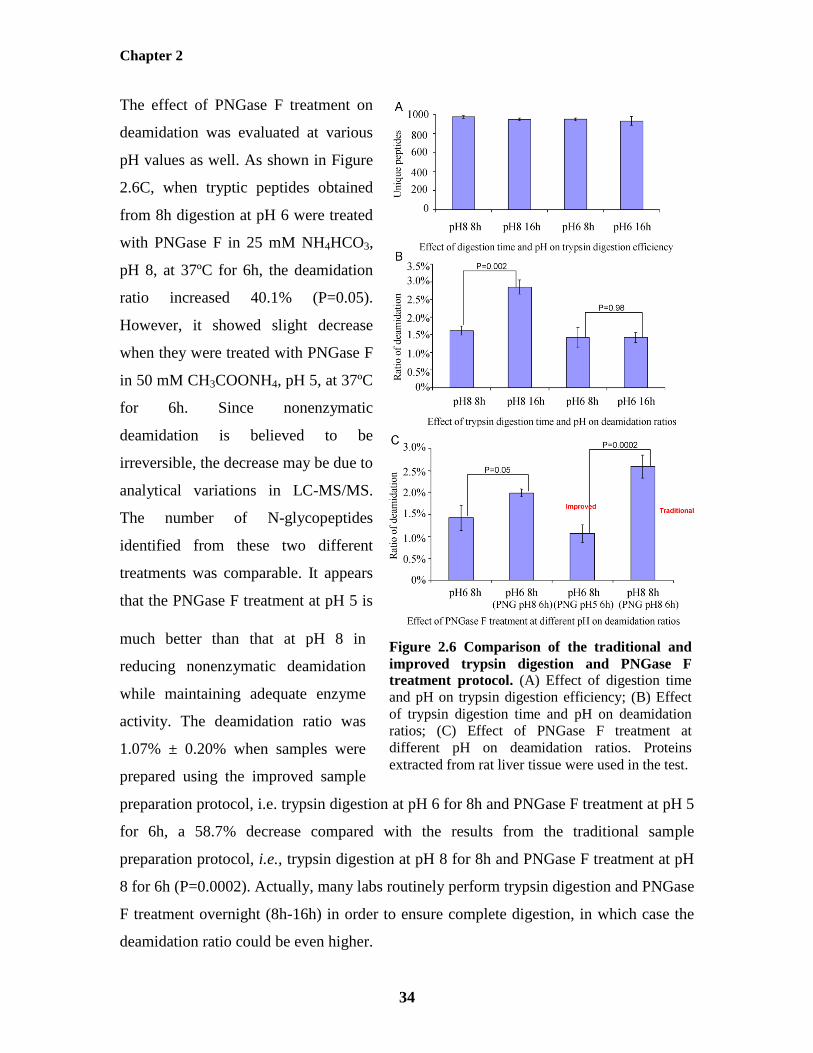
Chapter 2
34
Figure 2.6 Comparison of the traditional and
improved trypsin digestion and PNGase F
treatment protocol. (A) Effect of digestion time
and pH on trypsin digestion efficiency; (B) Effect
of trypsin digestion time and pH on deamidation
ratios; (C) Effect of PNGase F treatment at
different pH on deamidation ratios. Proteins
extracted from rat liver tissue were used in the test.
The effect of PNGase F treatment on
deamidation was evaluated at various
pH values as well. As shown in Figure
2.6C, when tryptic peptides obtained
from 8h digestion at pH 6 were treated
with PNGase F in 25 mM NH4HCO3,
pH 8, at 37ºC for 6h, the deamidation
ratio increased 40.1% (P=0.05).
However, it showed slight decrease
when they were treated with PNGase F
in 50 mM CH3COONH4, pH 5, at 37ºC
for 6h. Since nonenzymatic
deamidation is believed to be
irreversible, the decrease may be due to
analytical variations in LC-MS/MS.
The number of N-glycopeptides
identified from these two different
treatments was comparable. It appears
that the PNGase F treatment at pH 5 is
much better than that at pH 8 in
reducing nonenzymatic deamidation
while maintaining adequate enzyme
activity. The deamidation ratio was
1.07% ± 0.20% when samples were
prepared using the improved sample
preparation protocol, i.e. trypsin digestion at pH 6 for 8h and PNGase F treatment at pH 5
for 6h, a 58.7% decrease compared with the results from the traditional sample
preparation protocol, i.e., trypsin digestion at pH 8 for 8h and PNGase F treatment at pH
8 for 6h (P=0.0002). Actually, many labs routinely perform trypsin digestion and PNGase
F treatment overnight (8h-16h) in order to ensure complete digestion, in which case the
deamidation ratio could be even higher.
Chapter 2
35
2.4.8 Comparison of the Motifs of Asn Deamidation and Gln Deamidation
Many papers have been published on various aspects of the deamidation of peptides and
proteins, most of them about Asn deamidation. Asn deamidation is particularly prone to
occurring with the sequences -N-G- and -N-S-. As best we know, no large-scale analysis
of Gln-deamidated peptides in complex samples has been done yet, and the relevant
motifs of susceptible sequences remain undiscovered. The rate of Gln deamidation is ten
times slower than that of Asn deamidation, making it more difficult to analyze. In this
study, we occasionally found that an increase in the amount of sample loaded in LC-
MS/MS was helpful for the detection of deamidated peptides. When the loading amount
per LC-MS/MS injection increases from about 7.5 µg (In-Gel-RP) to about 100 µg (In-
Gel-RP-En), the figure for the ratio of Asn deamidation increases from 5.45% to 10.10%,
and the figure for the ratio of Gln deamidation increases from 1.69% to 10.41%.
Obviously there has been a dramatic increase in the ability to identify Gln-deamidated
peptides of low abundance, presumably due to enhancement of mass signals, as well as a
less dramatic increase in identification of Asn-deamidated peptides. However, the
increase in the loading amount does not have a significant effect on the identification of
unmodified peptides. With 794 Gln-deamidated peptides identified in In-Gel-RP-En,
motifs for Gln deamidation susceptibility could be compiled and compared with those for
Asn deamidation in ERLIC4-RP, in which 1020 Asn-deamidated peptides were
identified. As shown in Figure 2.7, Asn deamidation tends to occur at -N-G-, -N-S-, and -
N-D- sequences, consistent with previous studies. Gln deamidation tends to occur at -Q-
V-, -Q-L- and -Q-G- sequences, and to a lesser extent at Q-A- and Q-E-. This contrasts
with Asn deamidation motifs. Gln deamidation proceeds through a mechanism similar to
that of Asn deamidation except that a six-member glutarimide ring is formed. Presumably
the effect of steric hindrance on the formation of a glutarimide ring is not as strong as that
on the formation of a five-member ring so that the kinetics of Gln deamidation are
comparatively rapid with -Q-V- and -Q-L- sequences. Interesting, -Q-V-, -Q-L-, -Q-A-
and -Q-I- have relatively high deamidation rate. We speculate that the electron-donating
property of alkyl- groups (of V, L, A and I residues) promotes the nucleophilic attack that
results in the intermediate glutarimide ring; the inductive effect makes it easier for the

Chapter 2
36
attacking nitrogen to push its unshared pair of electrons onto the electropositive carbonyl
that gets attacked to form the ring.
Figure 2.7 Comparison of the incidence of Asn deamidation and Gln deamidation in
proteomic samples. (A) Experimental distribution of Asn deamidation and Gln deamidation; (B)
Distribution of Asn-Xxx/Gln-Xxx in IPI rat 3.40 database; (C) Normalized Distribution of
Asn/Gln deamidation (the experimental distribution of Asn deamidation and Gln deamidation
divided by the distribution of Asn-Xxx/Gln-Xxx in IPI rat 3.40 database). The X-axis lists the
residue on the C-terminal side of the deamidated N- or Q-residue.
Chapter 2
37
2.5 Conclusion
Nonenzymatic asparagine deamidation was found to occur to some extent in 4-9% of all
peptides during workup of samples for proteomic analysis and results in the false positive
identification of numerous N-glycopeptides. An improved protocol of trypsin digestion at
pH 6 and PNGase F treatment at pH 5 was proposed and validated in order to solve this
problem. The minimization of nonenzymatic deamidation will not only improve the
reliability of N-glycopeptide identification but also be helpful for the identification of
low-abundance peptides from complex samples. It should be noted that nonenzymatic
deamidation during sample preparation cannot be avoided completely even with the
improved protocol (unless the minimal deamidation in question was present in vivo). In
the future, H218
O could also be used during PNGase F treatment in the improved protocol
to reduce further the false positive identification of N-glycopeptides.
Chapter 3
38
Chapter 3
Evaluation of the Effect of Digestion Buffers on Artificial
Deamidation in In-solution Trypsin Digestion
Chapter 3
39
3.1 Abstract
Nonenzymatic deamidation occurs readily under the condition of trypsin digestion,
resulting in the identification of many artificial deamidation sites. To evaluate the effect
of trypsin digestion buffers on artificial deamidation, we compared the commonly used
buffers of Tris-HCl (pH 8), ammonium bicarbonate (ABB) and triethylammonium
bicarbonate (TEAB), and ammonium acetate (pH 6) which was reported to reduce Asn
deamidation. iTRAQ quantification on rat kidney tissue digested in these four buffers
indicates that artificial Asn deamidation is produced in the order of ammonium
acetate<Tris-HCl<ABB<TEAB, and Gln deamidation has no significant differences in all
tested buffers. Label-free experiments show the same trend, while protein and unique
peptide identification are comparable during using these four buffers. To explain the
differences of these four buffers in producing artificial Asn deamidation, we determined
the half-time of Asn deamidation in these buffers using synthetic peptides containing –
Asn-Gly- sequences. It is 51.4±6.0 days in 50 mM of ammonium acetate (pH 6) at 37ºC,
which is about 23, 104 and 137 times of that in Tris-HCl, ABB and TEAB buffers,
respectively. In conclusion, ammonium acetate (pH 6) is more suitable than other tested
buffers for characterizing endogenous deamidation and N-glycosylation.
3.2 Introduction
Protein deamidation is reported to contribute to Alzheimer’s disease and cataracts, (65-67)
and it is also proposed as a molecular clock of biological events, such as in protein
turnover, development and aging. (96, 97) Shotgun proteomics is powerful in detecting
deamidation sites in proteome scale due to its high sensitivity, accuracy and throughput,
(27, 87) and trypsin has been the most widely used protease in proteomics research.
However, nonenzymatic deamidation occurs readily under the condition of trypsin
digestion, i.e. prolonged incubation in mildly alkaline buffers at 37ºC, which results in
the identification of many artificial Asn-deamidation sites and N-glycosylation sites when
glycosylation site assignment is based on the detection of Asn deamidation in the
consensus sequence N-X-S/T (with X not proline).(84-86) Digestion buffers, temperature
Chapter 3
40
and digestion time are three major factors controlling the extent of deamidation during
proteolytic digestion.(84, 85) Since overnight trypsin digestion at 37ºC is generally used
in most proteomics experiments for complex samples, such as cell, tissue and plasma, it
is necessary to comprehensively evaluate the effect of trypsin digestion buffers on
artificial deamidation.
In proteomics studies, 25-100 mM ammonium bicarbonate (ABB) has been the most
widely used trypsin digestion buffer for both in-gel digestion and in-solution digestion
due to its volatility,(111) but it is reported to result in ~70-80% conversion of -Asn-Gly-
into -Asp-Gly- or -βAsp-Gly during the overnight digestion. (70) Tris-HCl (pH 8) is
another widely used digestion buffer and the recommended buffer from trypsin
manufacturers,(112) and it is reported to be a very mild catalyst of deamidation.(69)
However, it remains unclear whether Tris-HCl is good enough for reducing artificial
deamidation in proteomic studies without a comprehensive evaluation.
Triethylammonium bicarbonate (TEAB) is commonly used in trypsin digestion buffers
when amine-reactive isobaric tagging reagents, such as isobaric tags for relative and
absolute quantitation (iTRAQ) and tandem mass tag (TMT), are used to label proteins or
tryptic peptides for protein quantification because it has no primary amines which would
interfere with the labeling. (113, 114) Presently, there are no reports about the effect of
TEAB on artificial deamidation, but it has already been used in the identification and
quantification of N-glycopeptides. (115) The identified N-glycopeptides may include
many false positive ones if it is a strong catalyst of deamidation. In addition to these
commonly used buffers, we developed an improved trypsin digestion buffer, i.e.
ammonium acetate (pH 6), which was shown to significantly reduce artificial Asn
deamidation without affecting peptide identification using in-gel digested samples.(84)
Due to the difference between in-gel and in-solution digested samples, it is necessary to
conduct a comprehensive evaluation on in-solution digestion before widely applying it to
proteomics studies. In this study, we comprehensively evaluated 50 mM of ammonium
acetate (pH 6), Tris-HCl (pH 8), ABB and TEAB as the buffers for in-solution trypsin
digestion of rat kidney tissue using both iTRAQ quantification and label-free experiments,
and determined the half-time of Asn deamidation in these buffers using synthetic peptides.
Chapter 3
41
Our results indicate that ammonium acetate (pH 6) significantly outperforms the
commonly used trypsin digestion buffers by minimizing artificial deamidation for
proteomic study of endogenous deamidation and N-glycosylation.
3.3 Materials and Methods
3.3.1 Reagents
Unless indicated, all reagents used in this study were purchased from Sigma-Aldrich,
USA. Protease inhibitor (Cat no.: 05 892 791 001) was purchased from Roche, Basel,
Switzerland; Unmodified trypsin (T8802) was purchased from Sigma-Aldrich, St. Louis,
MO. Sep-Pak C18 cartridges were purchased from Waters, Milford, MA; 2D-Quant Kit
was purchased from Thermo Fisher, MA.
3.3.2 Sample Preparation
Male Sprague−Dawley rats were handled in accordance with the guidelines of NTU
Institutional Animal Care and Use Committee (NTU-IACUC), NTU, Singapore. Rat
kidneys were snap-frozen immediately in liquid nitrogen after collection, and kept at -
80oC until use. The tissue was cut into small pieces and ground into fine powders in
liquid nitrogen with a pestle. The powders were then suspended in lysis buffer (8 M urea,
50 mM Tris-HCl, pH 8) with protease inhibitor (05 892 791 001, Roche) added (10
ml/tablet). The suspension was sonicated for 10 seconds thrice on ice and centrifuged at
20,000g at 4oC for 20 min. The protein concentration of the supernatant was then
determined by the bicinchoninic acid (BCA) assay. About 5 mg tissue lysate was diluted
to 4 mg/ml using the lysis buffer, reduced with 10 mM DTT at 37oC for 2 h and alkylated
with 40 mM iodoacetamide at room temperature for 45 min in the dark. After the
concentration of urea was diluted to 1M with 50mM Tris-HCl (pH 8), trypsin (T8802,
Sigma) was added at a weight ratio of 1:50. It was then incubated at 37oC for 15 h. The
obtained tryptic peptides were desalted using a Sep-Pak® C18 cartridge (Waters,
Milford, MA, USA) and dried in a SpeedVac (Thermo Electron, Waltham, MA, USA).
The trypsin digestion using other digestion buffers was done using the same procedure as

Chapter 3
42
that of Tris-HCl trypsin digestion except for the lysis buffer and digestion buffer. Three
technical replicates were done for each step. It should be noted that protein concentration
in ammonium acetate (NH4Ace) buffer was quantified using 2D-Quant Kit (Thermo
Fisher, MA) since protein precipitation at pH 6 during dilution of urea concentration
interfered with BCA quantification.
3.3.3 iTRAQ Labeling
Peptides digested in different buffers were labeled with 4-plex iTRAQ reagents (Applied
Biosystems, Foster City, CA) according to the instructions from the manufacturer as
follows: ammonium acetate, 114; Tris-HCl, 115; ABB, 116; TEAB, 117. The labeled
peptides were pooled and desalted using Sep-Pak C18 cartridges. They were then
fractionated using Electrostatic Repulsion-Hydrophilic Interaction Chromatography
(ERLIC) as follows.
3.3.4 ERLIC Fractionation of iTRAQ Labeled Peptides
iTRAQ labeled Peptides were fractionated using a PolyWAX LP weak anion-exchange
column (4.6 × 200 mm, 5 μm, 300 Å, PolyLC, Columbia, MD) on a Shimadzu
Prominence UFLC system. Mobile Phase A (10 mM CH3COONH4 in 85% ACN/1% FA)
and mobile phase B (30% ACN/0.1% FA) were used to establish a 26 min gradient of
0%–28% buffer B for 19 min, 28%–100% buffer B for 0.1 min and 100% buffer B for
6.9 min at a flow rate of 1 mL/min with 16 fractions collected. The collected fractions
were then dried with vacuum centrifuge, pooled into 6 fractions by combining (1-3); (4-
5); (6-7); (8-9); (10-11); (12-16), and redissolved in 3% ACN/0.1% FA for LC-MS/MS
analysis.
3.3.5 ERLIC Fractionation of Label-free Peptides
Chapter 3
43
Label-free peptides from 1 mg of proteins were fractionated using a PolyWAX LP weak
anion-exchange column on a Shimadzu Prominence UFLC system in triplicate. Mobile
Phase A (85% ACN/0.1% FA) and mobile phase B (10% ACN/0.4% FA) were used to
establish a 30 min gradient of 0%–10% buffer B for 10 min, 8%–35% buffer B for 12
min, 35%–100% buffer B for 2 min and 100% buffer B for 6 min at a flow rate of 1
mL/min with 18 fractions collected. The collected fractions were then dried with vacuum
centrifuge, pooled into 5 fractions by combining (1-4); (5-6); (7-8); (9-11); (12-18), and
redissolved in 3% ACN/0.1% FA for LC-MS/MS analysis.
3.3.6 LC-MS/MS
Peptides were separated and analyzed on a Dionex Ultimate 3000 RSLCnano system
coupled to a Q Exactive (Thermo Fisher, MA). About 1 µg of the peptides from each
pooled fraction were injected into an Acclaim peptide trap column (Thermo Fisher, MA)
via the auto-sampler of the Dionex RSLCnano system. Peptides were separated in a
capillary column (75 µm x 10 cm) packed with C18 AQ (5 µm, 300Å; Bruker-Michrom,
Auburn, CA, USA) at room temperature. The flow rate was at 300 nl/min. Mobile phase
A (0.1% formic acid in 5% ACN) and mobile phase B (0.1% formic acid in 90% ACN)
were used to establish a 60 min gradient. Peptides were then analyzed on Q Exactive with
a nanospray source (Thermo Fisher, MA) at an electrospray potential of 1.5 kV. A full
MS scan (350-1600 m/z range) was acquired at a resolution of 70,000 at m/z 200 and a
maximum ion accumulation time of 100 msec. Dynamic exclusion was set as 30 s.
Resolution for HCD spectra was set to 17,500 at m/z 200. The AGC setting of full MS
scan and MS2
was set as 1E6 and 1E5, respectively. The 10 most intense ions above a
1000 counts threshold were selected for fragmentation in HCD with a maximum ion
accumulation time of 100 msec. Isolation width of 2 was used for MS2. Single and
unassigned charged ions were excluded from MS/MS. For HCD, normalized collision
energy was set to 28%. The underfill ratio was defined as 0.1%.
3.3.7 Data Analysis

Chapter 3
44
The raw data were first converted into .apl files with MaxQuant 1.4.1.2 using the function
of “Partial processing” with step 1 to 5, and then the .apl files were converted into Mascot
Generic File (MGF) format using an in-house made Perl script. The UniProt rat protein
database (release 2013_10, 28855 sequences) concatenated with cRAP contaminants
(version 2012.01.01) and their reverse complement were combined and used for database
searches. The database search was performed using an in-house Mascot server (version
2.4.0, Matrix Science, Boston, MA, USA) with MS tolerance of 10 ppm, #13
C of 2 and
MS/MS tolerance of 0.02 Da. Two missed cleavage sites of trypsin were allowed.
Carbamidomethylation (C) was set as a fixed modification, and oxidation (M) and
deamidation (NQ) were set as variable modifications. For iTRAQ labeled peptides, 4-
plex iTRAQ was set as fixed modifications on N-terminal and lysine, and it was set as a
variable modification on tyrosine. Only peptides with a Mascot score over 30 and a
minimum length of 7 are used for statistical analysis. It results in an FDR of less than
1%.(79) For high confidence protein identification, only protein groups identified with at
least 2 unique peptides over 30 are reported, and only peptides of which the search engine
rank is 1 and peptides in top scored proteins are counted. A Student’s t-Test was used to
verify the significance of the differences between each comparison.
3.3.8 Determination of the Half-time of Asn Deamidation in the Four Buffers Using
Synthetic Peptides
The peptide DGNGYISAAELR was synthesized at the Peptide Synthesis Core Facility,
Nanyang Technological University. It was incubated in 50 mM Tris-HCl, 50 mM ABB
and 50 mM TEAB at 37oC for 2h, 4h, 8h and 24h, respectively. Since Asn deamidation
occurs slowly in 50 mM ammonium acetate (pH 6),(84) the incubation time is 1d, 3d, 7d
and 10 d. After incubation, peptides were analyzed using a PolyWAX LP weak anion-
exchange column on a Shimadzu Prominence UFLC system. Mobile phase A (80%
ACN/0.1% FA) and mobile phase B (10% ACN/2% FA) were used to establish a 30 min
gradient of 0–20% B for 10 min, 20–100% B for 15 min and 100% B for 5 min at a flow
rate of 1 ml/min. The absorbance was monitored at 280 nm. The half-time of Asn
Chapter 3
45
deamidation was determined based on the percentage of remaining unmodified peptides
over time.
3.4 Results and Discussion
The suitable buffer for studying endogenous deamidation and N-glycosylation should
introduce as little as possible artificial deamidation during proteomic sample preparation
without significantly affecting protein and peptide identification. Here, we
comprehensively evaluated the three commonly used trypsin digestion buffers of Tris-
HCl, ABB and TEAB and an improved buffer of ammonium acetate (pH 6) in these
aspects. To explain the difference of these four buffers in introducing artificial Asn
deamidation, we also determined the half-time of Asn deamidation in these buffers using
synthetic peptides.
3.4.1 iTRAQ Based Relative Quantification of Asn-deamidated Peptides and Gln-
deamidated Peptides Digested in the Four Buffers
To evaluate the potential of these four buffers in producing artificial deamidation during
the course of proteomic sample preparation, we used 4-plex iTRAQ reagents to label
tryptic peptides from rat kidneys digested in these four buffers and compared the summed
areas of the reporter ions from each labeling with experimental bias normalized. Only
Asn-deamidated peptides and Gln-deamidated peptides with reporter ions detected in all
four digestion conditions are used for statistical analysis. As shown in Figure 3.1, based
on the results from two LC-MS/MS technical replicates, the summed areas of the reporter
ions of Asn-deamidated peptides are in the order of ammonium acetate<Tris-
HCl<ABB<TEAB, indicating the difference in the rate of Asn deamidation in these four
buffers. In contrast, the rate of Gln deamidation is consistent in the four tested buffers. It
should be noted that the difference of Asn deamidation between different buffers from
iTRAQ experiments may be underestimated due to the following two reasons: 1) TEAB
in the dissolution buffer of iTRAQ labeling Kits increases Asn deamidation in all labeled

Chapter 3
46
samples during the course of
iTRAQ labeling and vacuum
drying of the pooled samples,
which reduces the difference of
Asn deamidation between
different digestion conditions; 2)
the ratio compression problem in
iTRAQ quantification. (116, 117)
3.4.2 Identification of Asn-deamidated Peptides, Gln-deamidated Peptides and
Artificial N-glycopeptides in Label-free Experiments
Due to the limitation of iTRAQ quantification in comparing the four buffers in producing
artificial deamidation, label-free experiments were used as an alternative. To clearly
show the effect of different digestion buffers on artificial deamidation, we used an
ERLIC gradient that could selectively enrich deamidated peptides. Therefore, the
observed ratio of deamidation in this study may be higher than that from other proteomics
studies without enriching deamidated peptides. Based on the label-free LC-MS/MS
results from three technical replicates, the number of identified unique Gln-deamidated
peptides was comparable while using 50 mM of the four digestion buffers, but the
number of identified unique Asn-deamidation peptides in Tris-HCl, ABB and TEAB is
2.2, 3.0 and 3.8 times of that from ammonium acetate (pH 6) (P<0.002) , respectively
(Figure 3.2). As a result, the number of identified unique glycopeptides in Tris-HCl, ABB
Figure 3.1 The summed area of the reporter ions of
Asn-deamidated peptides and Gln-deamidated
peptides under different digestion conditions from
iTRAQ experiments. Artificial Asn deamidation is
produced in the order of ammonium acetate<Tris-
HCl<ABB<TEAB; Gln deamidation has no significant
differences in all tested buffers.
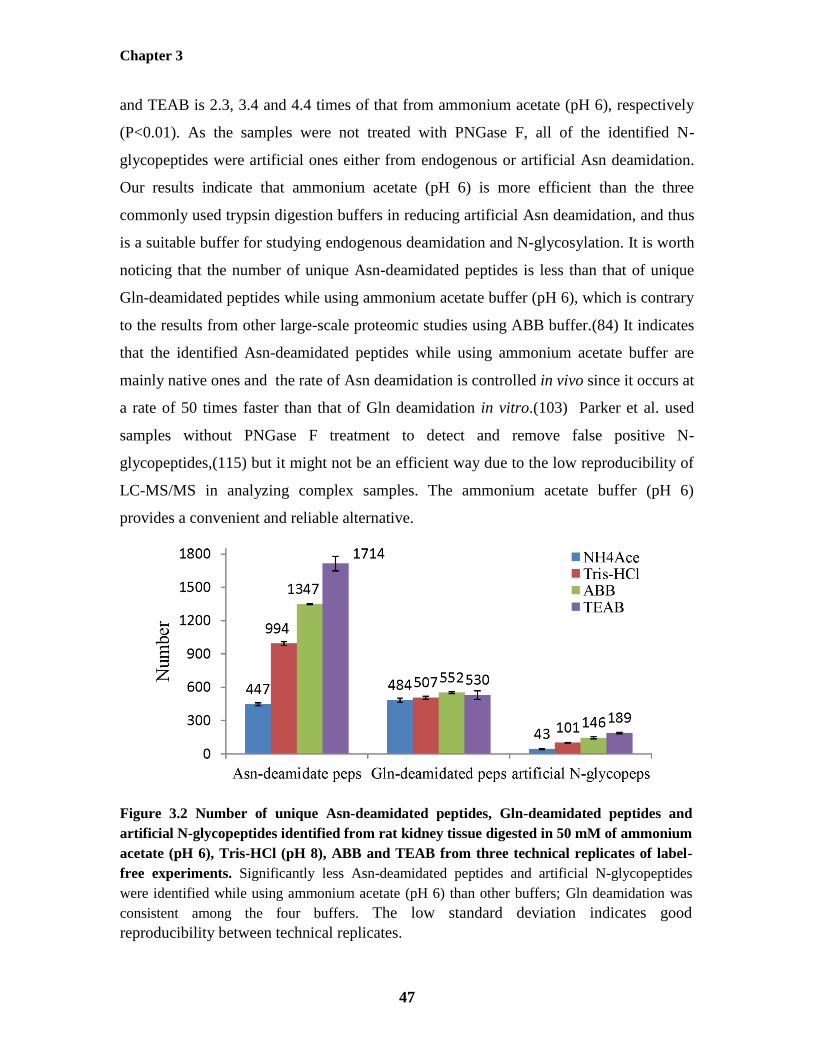
Chapter 3
47
and TEAB is 2.3, 3.4 and 4.4 times of that from ammonium acetate (pH 6), respectively
(P<0.01). As the samples were not treated with PNGase F, all of the identified N-
glycopeptides were artificial ones either from endogenous or artificial Asn deamidation.
Our results indicate that ammonium acetate (pH 6) is more efficient than the three
commonly used trypsin digestion buffers in reducing artificial Asn deamidation, and thus
is a suitable buffer for studying endogenous deamidation and N-glycosylation. It is worth
noticing that the number of unique Asn-deamidated peptides is less than that of unique
Gln-deamidated peptides while using ammonium acetate buffer (pH 6), which is contrary
to the results from other large-scale proteomic studies using ABB buffer.(84) It indicates
that the identified Asn-deamidated peptides while using ammonium acetate buffer are
mainly native ones and the rate of Asn deamidation is controlled in vivo since it occurs at
a rate of 50 times faster than that of Gln deamidation in vitro.(103) Parker et al. used
samples without PNGase F treatment to detect and remove false positive N-
glycopeptides,(115) but it might not be an efficient way due to the low reproducibility of
LC-MS/MS in analyzing complex samples. The ammonium acetate buffer (pH 6)
provides a convenient and reliable alternative.
Figure 3.2 Number of unique Asn-deamidated peptides, Gln-deamidated peptides and
artificial N-glycopeptides identified from rat kidney tissue digested in 50 mM of ammonium
acetate (pH 6), Tris-HCl (pH 8), ABB and TEAB from three technical replicates of label-
free experiments. Significantly less Asn-deamidated peptides and artificial N-glycopeptides
were identified while using ammonium acetate (pH 6) than other buffers; Gln deamidation was
consistent among the four buffers. The low standard deviation indicates good
reproducibility between technical replicates.
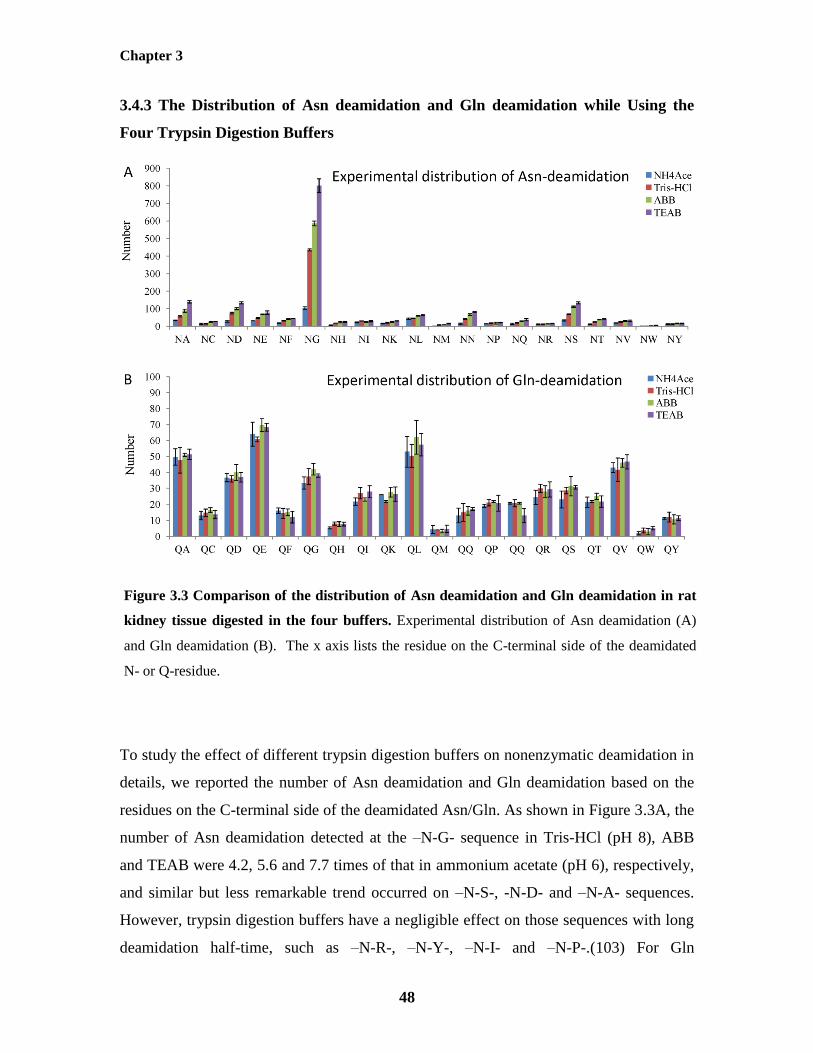
Chapter 3
48
3.4.3 The Distribution of Asn deamidation and Gln deamidation while Using the
Four Trypsin Digestion Buffers
To study the effect of different trypsin digestion buffers on nonenzymatic deamidation in
details, we reported the number of Asn deamidation and Gln deamidation based on the
residues on the C-terminal side of the deamidated Asn/Gln. As shown in Figure 3.3A, the
number of Asn deamidation detected at the –N-G- sequence in Tris-HCl (pH 8), ABB
and TEAB were 4.2, 5.6 and 7.7 times of that in ammonium acetate (pH 6), respectively,
and similar but less remarkable trend occurred on –N-S-, -N-D- and –N-A- sequences.
However, trypsin digestion buffers have a negligible effect on those sequences with long
deamidation half-time, such as –N-R-, –N-Y-, –N-I- and –N-P-.(103) For Gln
Figure 3.3 Comparison of the distribution of Asn deamidation and Gln deamidation in rat
kidney tissue digested in the four buffers. Experimental distribution of Asn deamidation (A)
and Gln deamidation (B). The x axis lists the residue on the C-terminal side of the deamidated
N- or Q-residue.

Chapter 3
49
deamidation, the effect of trypsin digestion buffers is negligible on all sequences because
of its extremely long half-time (Figure 3.3B).(103) These results indicate that trypsin
digestion buffers affect nonenzymatic deamidation of peptides mainly on sequences with
short half-time of deamidation.
3.4.4 Protein and Peptide Identifications and Tryptic Miscleavages in Label-free
Experiments
Table 3.1 Number of Protein and Peptide Identifications and Percentage of
Miscleavaged Peptides from Rat Kidney Tissue Digested in the Four Buffers
Unique peptides Proteins Misscleavaged
peptides (%)
Ammonium acetate (pH 6) 19785±128 2447±6 34.4%±0.3%
Tris-HCl (pH 8) 19508±173 2453±25 32.3%±0.1%
ABB 19306±161 2482±40 25.2%±0.1%
TEAB 18894±921 2369±77 26.6%±0.2%
Note: This table shows the results from three technical replicates with individual sample
preparations. As detailed in the section of “Materials and Methods”, only protein groups
with at least 2 unique peptides above 30 (Mascot score) are reported. The low standard
deviation indicates good reproducibility between technical replicates.
As shown in Table 3.1, based on the label-free LC-MS/MS results from three technical
replicates, protein and unique peptide identifications are comparable while using 50 mM
of the four trypsin digestion buffers. However, the percentages of tryptic peptides with
miscleavages in ammonium acetate (pH 6) are significantly higher than that in other
tested buffers (P<0.02), indicating the reduced activities of trypsin in ammonium acetate
(pH 6). Surprisingly, Tris-HCl (pH 8) also produces significantly more tryptic peptides
Chapter 3
50
with miscleavages than ABB (P=0.0005) and TEAB (P=0.0012) although it is the
recommended buffer from manufacturers. The increase of tryptic miscleavages does not
affect protein and peptide identification possibly because many peptides that are too short
to be identified with full cleavages become identifiable with miscleavages. Because of
the increase of miscleavaged peptides, ammonium acetate (pH 6) and Tris-HCl (pH 8)
may not be ideal buffers for SRM assay development in targeted MS analysis.(118)
However, targeted SRM validation may still be used with caution if the control and
samples are digested in ammonium acetate (pH 6) under completely same conditions. It
was worth noticing that the solubility of proteins decreased greatly at pH 6. Therefore,
protein concentration was diluted to 0.5 mg/ml during trypsin digestion using all tested
buffers to ensure the solubility of proteins.
3.4.5 Determination of the Half-time of Asn deamidation in the Four Buffers Using
Synthetic Peptides
The synthetic peptide DGNGYISAAELR was used to determine the half-time of Asn
deamidation in 50 mM of ammonium acetate (pH 6), Tris-HCl (pH 8), ABB and TEAB.
As shown in Figure 3.4, the ERLIC chromatograms showed the gradual transformation of
unmodified peptides into two deamidation products containing –βDG- and –DG-. The
half-time of Asn deamidation was determined as 51.4±6.0 days in 50 mM ammonium
acetate (pH 6), which was about 23, 104 and 137 times of that in Tris-HCl, ABB and
TEAB buffers, respectively. This sufficiently explains the reduced artificial Asn
deamidation in ammonium acetate buffer (pH 6) detected using both label-free qualitative
experiments and iTRAQ quantification. Deamidation decreased with decreasing pH in
the range of pH 12 to 5.(119) For 1 day incubation in 50 mM ammonium acetate buffer
(pH 6), 0.56% of the peptides are deamidated, which has a negligible effect on proteomic
studies. It was reported that the half-time of Asn deamidation was 1.03 days in 0.15 M
Tris-HCl, pH 7.4 at 37ºC,(103) which was about half of ours. The difference might be
due to that they used 3 times higher concentration of Tris-HCl than ours, and Asn
deamidation accelerated as the concentration of buffers increased.(120) We also
determined the half-time of Asn-deamiation in 25 mM ABB buffer, and it was

Chapter 3
51
15.08±2.03 h, i.e. about 1.27 times of that in 50 mM ABB buffer. Thus, a lower
concentration of buffers should be used in proteomic sample preparations to reduce
artificial deamidation. For example, 25-50 mM may be a good choice to the keep the pH
of the buffers stable during trypsin digestion.
3.5 Conclusion
This work comprehensively compared 50 mM of ammonium acetate (pH 6), Tris-HCl
(pH 8), ABB and TEAB as in-solution trypsin digestion buffers. Both iTRAQ
quantification and label-free results indicate that ammonium acetate (pH 6) is more
suitable than other tested buffers for studying endogenous deamidation and N-
glycosylation due to the significant decrease of artificial Asn deamidation in comparison
to other buffers without affecting protein and peptide identification and Gln deamidation.
Determination of the half-time of Asn deamidation in the four buffers further validates
the conclusion. Our results also indicate that among the commonly used tryspin digestion
Figure 3.4 Determination of the half-time of Asn deamidation using the synthetic peptide
DGNGYISAAELR by HPLC. Solutions of the synthetic peptide in 50 mM CH3COONH4, pH 6
were incubated for 1d, 3d, 7d and 10d at 37 °C. The incubation time in other buffers were 2h, 4h,
8h and 24h at 37°C. Peptide mixtures were resolved with an ERLIC column with UV detection at
280 nm. The half-time of Asn deamidation in 50 mM CH3COONH4, pH 6 is about 23, 104 and
137 times of that in 50 mM of Tris-HCl (pH 8), ABB and TEAB. A side product with the elution
time of around 9 minutes formed during the incubation in 50 mM CH3COONH4, but it had no
effect on the detection of endogenous Asn deamidation.

Chapter 3
52
buffers, ABB and TEAB are not suitable for studying Asn deamidation and N-
glycosylation, but Tris-HCl may be used if trypsin digestion has to be done at around pH
8.
Chapter 4
53
Chapter 4
Enhanced Separation and Characterization of Deamidated
Peptides with RP-ERLIC-based Multidimensional
Chromatography Coupled with Tandem Mass Spectrometry
Chapter 4
54
4.1 Abstract
Protein asparagine deamidation produces the mixture of protein isoforms containing
asparaginyl, n-aspartyl and isoaspartyl residues at the deamidation sites, which results in
function loss and protein degradation. The identification and quantification of the
deamidation products are very important to evaluate its biological effects, but it is
difficult to distinguish between the n-Asp and isoAsp deamidation products in a
proteome-wide analysis because of their similar physicochemical properties. Electron
capture dissociation (ECD) and electron transfer dissociation (ETD) are reported to be
able to distinguish between the isomeric n-Asp and isoAsp containing peptides using a
pair of reporter ions. However, in a proteome-wide analysis, it may result in many false
positive identifications of isoAsp containing peptides since the peak intensity of the
reporter ions are generally very weak and buried in the background noise. In the common
setup of reverse-phase liquid chromatography (RPLC), it is challenging to identify and
quantify the isomeric deamidated peptides because of their coelution/poor separation. In
this study, a RP-ERLIC-MS/MS approach was proposed to separate and quantify the
triad of deamidation products on a proteome-wide scale. The method is featured by the
use of offline RPLC in the first dimensional separation and the online coupling of
electrostatic repulsion-hydrophilic interaction chromatography (ERLIC) to tandem MS.
The three deamidation products from the same peptides are to be co-eluted and thus
collected in the same fraction in offline RPLC. In the 2nd dimension of ERILC, they are
separated according to both pI and GRAVY, facilitating the identification and
quantification of them. We confirmed the co-elution of the three deamidation products in
RPLC and the excellent separation of them in ERLIC using synthetic peptides, and tested
the performance of ERLIC-MS/MS using simple tryptic digests. Using this RP-ERLIC-
MS/MS, we identified 302 unique Asn-deamidated peptides from rat liver tissue. 20 of
them were identified with all three deamidation-related products, and 70 of them were
identified with two deamidation products.
4.2 Introduction
Chapter 4
55
Nonenzymatic deamidation of asparagine and glutamine takes place spontaneously in
proteins in vivo, which may lead to the structural changes and loss of function in long-life
proteins. Because protein deamidation occurs at a constant rate in vivo, it was proposed as
a “molecular clock” in studies of aging.(96, 97) It is reported that Alzheimer’s disease
(AD) and cataracts are due to the accumulation of isoaspartyl residues in some proteins
with important functions.(65-67) Protein deamidation may result in the degradation of
antibodies and therapeutic proteins during their production and storage.(71, 72) As shown
in Figure 1.1, under in vivo conditions or at alkaline pH, a succinimide ring intermediate
was formed during the deamidation of asparagine, and it is quickly hydrolyzed to n-Asp
and isoAsp at a ratio of about 1:3.(73) At neutral or low pH, Asp isomerization occurs
through the dehydration of Asp via a similar mechanism.(89) In order to uncover the
biological significance of protein deamidation, it is necessary to develop an accurate,
reliable and high-throughput analytical method to identify and quantify protein
deamidation and isomerization sites.
Mass spectrometry (MS) can be used for the fast, sensitive and specific identification of
protein deamidation in a proteome scale. The mass difference of 0.984 Da between
deamidated peptides and their corresponding undeamidated counterparts can be readily
detected using high-resolution MS. (81, 107) However, it is still very difficult to
differentiate between the isomeric n-Asp and isoAsp deamidation products since they
have identical chemical composition and mass, and similar physiochemical properties
(Figure 1.1). It is reported that some tandem MS peptide sequencing methods, such as
HCD, CAD and negative electrospray ionization, are able to differentiate between the
isomeric deamidation products based on some reporter ions, but the results are unspecific,
highly variable and unreliable.(106, 121, 122)
The powerful soft peptide backbone-fragmenting techniques of ECD and ETD are
reported to be able to distinguish between the isomeric Asp and isoAsp peptides based on
a pair of reporter ions, i.e. c+57 and z-57.(89) LC-ECD-MS/MS has been applied to the
large-scale study of deamidated peptides containing isoAsp in cell line sample.(90)
Chapter 4
56
However, many false positive identifications were included if the identification is based
solely on the detection of the reporter ions without further manual validation. The
possible reason is that the reporter ions of isoAsp containing peptides are generally
masked by the background noise due to their relatively low intensity compared with other
fragment ions. Under the commonly used RPLC-MS/MS conditions, the XIC based
quantification of the isomeric Asp and isoAsp peptides is challenging because they have
the same mass and are co-eluted from RP columns. (90) The identification of the
deamidation isomers is also challenging while using RP liquid chromatography because
of the co-fragmentation of them and their similar fragmentation pattern except for the
weak reporter ions. As a result, this reporter ion based identification method cannot be
used to identify low-abundance deamdated peptides containing isoAsp from complex
samples.
In principle, it is feasible to identify and quantify the triad of deamidation products
containing an Asn, n-Asp or isoAsp residue at the same position using LC-MS/MS if they
are well separated by liquid chromatography before tandem MS. The typical SCX-RP-
based shotgun proteomic approach cannot be used in the identification and quantification
of the triad of deamidation products since these three peptides have identical GRAVY
values of -3.5, resulting in the co-elution of them in RPLC. However, the triad of
peptides can potentially be separated well using ERLIC. The deamidated peptides are
eluted later than their unmodified counterparts using ERLIC on an anion-exchange
chromatography (AEX) column as the conversion of Asn to Asp introduces a negative
charge, enhancing their retention on the column. In addition, ERLIC has been reported to
be able to separate peptides based on their pI. (105) Therefore, in principle, ERLIC can
be used in the separation of the isomeric deamidation products containing Asp and
isoAsp as they have different pI values. n-Asp residue has a side-chain pKa of around 3.9,
but that of isoAsp is around 3.1. Theoretically, the triad of deamidation peptides should
be eluted in the order of Asn<n-Asp<isoAsp in ERLIC. Thus, they can be identified
based on their elution order even if they have the similar tandem MS fragmentation
pattern. Consequently, ERLIC-MS/MS can potentially be an excellent alternative to the
commonly used RPLC-MS/MS in separating and characterizing the triads of deamidation
Chapter 4
57
peptides. It is necessary to use volatile mobile phases that are compatible with mass
spectrometry in order to minimize clogging and adduct formation in the ionization source.
Our recent development of ERLIC introduces volatile solvents that are fully compatible
with MS/MS analysis.(105)
For proteome-wide study of complex samples, multidimensional liquid chromatography
(MDLC) is generally used to reduce sample complexity and increase sensitivity and
dynamic range of peptide identification by minimizing the undersampling and ion
suppression problems.(14, 74) In this study, we proposed to develop a RP-ERLIC-
MS/MS sequence for the proteome-scale study of deamidation and isomerization sites.
The co-elution of the three deamidation-related products from the same peptide in RPLC
becomes an advantage when RPLC is used as the first dimension of offline MDLC since
they are to be collected into the same fraction. This facilitates the separation and
identification of them in the second dimension of ERLIC coupled to MS/MS and
subsequent data analysis.
4.3 Materials and Methods
4.3.1 Reagents
Unless indicated, all reagents used in this study were purchased from Sigma-Aldrich,
USA. Protease inhibitor (Cat no.: P8340) and unmodified trypsin (T8802) were
purchased from Sigma-Aldrich, St. Louis, MO. Sep-Pak C18 cartridges were purchased
from Waters, Milford, MA; Bicinchoninic acid (BCA) assay kit was purchased from
Pierce, Rockford, IL.
4.3.2 Sample Preparation
Male Sprague Dawley rats were handled in accordance with the guidelines of NTU
Institutional Animal Care and Use Committee (NTU-IACUC), NTU, Singapore. Rat

Chapter 4
58
livers were snap-frozen in liquid nitrogen immediately after collection and kept at -80ºC
until use. The tissue was cut into small pieces and ground into fine powder in liquid
nitrogen with a pestle. The powder was then suspended in 8 M urea with protease
inhibitor cocktail (P8340, Sigma) and 10 mM PMSF added in the ratio of 1:50 and 1:20
(v/v), respectively. The suspension was sonicated for 10 s thrice on ice and centrifuged at
20,000 X g at room temperature (RT) for 30 min. The protein concentration of the
supernatant was then determined by the bicinchoninic acid (BCA) assay. Trypsin
digestion was done as previously described.(105) The obtained tryptic peptides were
desalted using a Sep-Pak C18 cartridge (Waters, Milford, MA) and dried in a SpeedVac
(Thermo Electron, Waltham, MA). The mixture of BSA (A2153, Sigma-Aldrich) and
chicken ovalbumin (A5503, Sigma-Aldrich) was digested and desalted in the same way
with rat liver samples.
4.3.3 RPLC Fractionation
Four triads of deamidation-related peptides with different pI and GRAVY value were
synthesized at the Peptide Synthesis Core Facility, Nangyang Technological University,
with the sequences DG(N/D/isoD)GYISAAELR,
DS(N/D/isoD)GAILVYDVTDEDSFQK, VT(N/D/isoD)GAFTGEISPGMIK, and
IEYDDQ(N/D/isoD)DGSCDVK. These peptides had been identified from a rat liver
protein digest in a previous study. (105) The mixture of each triad of peptides was
fractionated using a BioBasic C18 column (4.6 × 250 mm, 5 µm, 300 Å, Thermo
Scientific, West Palm Beach, FL) on a Shimadzu Prominence UFLC system monitored at
280 nm. Mobile phase A (0.1% formic acid (FA) in H2O) and mobile phase B (0.1% FA
in ACN) were used to establish the 50 min gradient of 5% mobile phase B for 3 min, 5-
40% B over 32 min, 40-60% buffer B over 5 min, 60-100% buffer B over 5 min, and 5
min at 100% B, at a flow rate of 1 mL/min. For the fractionation of rat liver whole
proteome, 2 mg of peptides were fractionated using the same gradient, with 29 fractions
collected. These were then dried in vacuo and combined into 24 fractions based on the
amplitude of absorbance in the chromatogram as shown in Figure 4.1. Each fraction was
redissolved in 200 µL 85% ACN/0.1% NH4OH for ERLIC-LC-MS/MS analysis.

Chapter 4
59
4.3.4 ERLIC Fractionation
The mixture of the above-mentioned triad of peptides was fractionated using a PolyWAX
LP anion-exchange column (4.6 × 200 mm, 5 µm, 300 Å, PolyLC, Columbia, MD) on a
Shimadzu Prominence UFLC system monitored at 280 nm. Mobile phase A (85%
ACN/0.1% acetic acid) and mobile phase B (30%ACN/0.2% FA) were used in a 30 min
gradient of 5-30% B over 15 min and 30-100% buffer B over 10 min followed by 5 min
at 100% B, at a flow rate of 1 mL/min. The volatile acid in the mobile phases is used to
maintain the low pH. Thus, FA is in use when ERLIC is coupled to MS/MS.
4.3.5 RP-LC-MS/MS
The mixture of the triad of synthetic peptides was separated and analyzed on a Shimadzu
UFLC system coupled to an LTQ-FT Ultra (Thermo Electron, Bremen, Germany). It was
injected into a Zorbax peptide trap column (Agilent, CA) via the autosampler of the
Shimadzu UFLC for concentration and desalting. The peptides were separated in a
capillary column (200 μm × 10 cm) packed with C18 AQ (5 μm, 300 Å; Bruker-
Figure 4.1 RPLC chromatogram of tryptic peptides from rat liver. Twenty nine fractions
were collected from offline RPLC and pooled into 24 for subsequent ERLIC-LC-MS/MS
analysis. The insert shows the full scale chromatogram, and the strong UV absorption at 2.5 and
7.8 min were from impurities. The UV absorption was monitored at 280nm.
Chapter 4
60
Michrom, Auburn, CA). The flow rate was maintained at 500 nL/min. Mobile phase A
(0.1% FA in H2O) and mobile phase B (0.1% FA in ACN) were used to establish the 60
min gradient comprised of 45 min of 5-35% B, 8 min of 35-50% B and 2 min of 80% B
followed by re-equilibration at 5% B for 5 min. Peptides were then analyzed on the LTQ-
FT with an ADVANCE™ CaptiveSpray™ Source (Bruker-Michrom) at an electrospray
potential of 1.5 kV. A gas flow of 2, ion transfer tube temperature of 180C and collision
gas pressure of 0.85 mTorr were used. The LTQ-FT was set to perform data acquisition
in the positive ion mode as previously described except that the m/z range of 350-1600
was used in the full MS scan. (123)
4.3.6 ERLIC-LC-MS/MS
ERLIC-LC-MS/MS was done on the same UFLC and mass spectrometer system with the
following modifications: 1) A PolyWAX LP anion-exchange guard column (PolyLC,
Columbia, MD) was used as the trap column and 85% ACN/0.1% NH4OH was used as
the desalting solvent; 2) The peptides were separated in a capillary column (200 µm × 15
cm) packed with PolyWAX LP anion-exchange bulk material (5 µm, 300 Å; PolyLC); 3)
For the tryptic digest of BSA and chicken ovalbumin, mobile phase A (0.1% FA in ACN)
and mobile phase B (0.1% FA in H2O) were used to establish the 60 min gradient
comprised of 45 min of 0-30% B, 5 min of 30-50 % B, 4 min of 50-90% B, and 1 min of
90%-0% B, followed by re-equilibration at 100% A for 5 min; 4) For synthetic peptides
and rat liver samples, the same ERLIC mobile phases were used to establish a 90 min
gradient comprised of 70 min of 0-30% B, 5 min of 30-50 % B, 3 min of 50-90% B, and
2 min of 90%-0% B followed by re-equilibration at 100% A for 10 min. The flow rate
was maintained at 500 nL/min.
4.3.7 Data Analysis
The raw data were first converted into dta format using the extract_msn (version 4.0) in
Bioworks Browser (version 3.3, Thermo Fisher Scientific, Inc.), and then the dta files
Chapter 4
61
were converted into MGF format using an in-house program. Intensity values and
fragment ion m/z ratios were not manipulated. For BSA and chicken ovalbumin, the
Swiss-Prot protein database (Release 57.11) was used for database searches. For
synthetic peptides and rat liver samples, the IPI rat protein database (version 3.40, 40381
sequences, 20547209 residues) and its reversed complement were combined and used for
database searches. The database search was performed using an in-house Mascot server
(version 2.2.04, Matrix Science, Boston, MA, USA) with MS tolerance of 5.1 ppm and
MS/MS tolerance of 0.8 Da. Two missed cleavage sites of trypsin were allowed.
Carbamidomethylation (C) was set as a fixed modification, and oxidation (M),
phosphorylation (S, T and Y) and deamidation (N and Q) were set as variable
modifications. The ions score significance threshold was set at 20. The obtained
peptide/protein list for each fraction was exported to Microsoft Excel or processed using
an in-house script for further analysis. For high confidence peptide identification, only
peptides with an E-value of less than 0.05 were used for statistical calculation. The FDR
of peptide identification was set to be less than 1% (FDR = 2.0 × decoy_hits/total_hits).
The FDR rate is based on the assigned spectra.
4.4 Results and Discussion
4.4.1 A Novel Strategy for Large-scale Study of Protein Deamidation
We propose to use the following shotgun proteomics strategy in studying protein
deamidation: 1) Tryptic peptides are first separated based on their polarity using RPLC as
the first dimension of offline MDLC. All three deamidation products originating from the
same peptides are co-eluted and collected in the same fraction due to their identical
GRAVY values; 2) Each RPLC fraction is separated using ERLIC coupled to a mass
spectrometer. To be compatible with direct MS analysis, volatile mobile phases are used.
In ERLIC, tryptic peptides are eluted based on their pI values as well as polarity, (105)
and the separation is orthogonal to that of the 1st dimensional RPLC. Therefore, RP-
ERLIC is a proper MDLC sequence. As a result, the three peptides in a deamidation triad
that are co-eluted and collected in the same fraction in RPLC, can be separated according
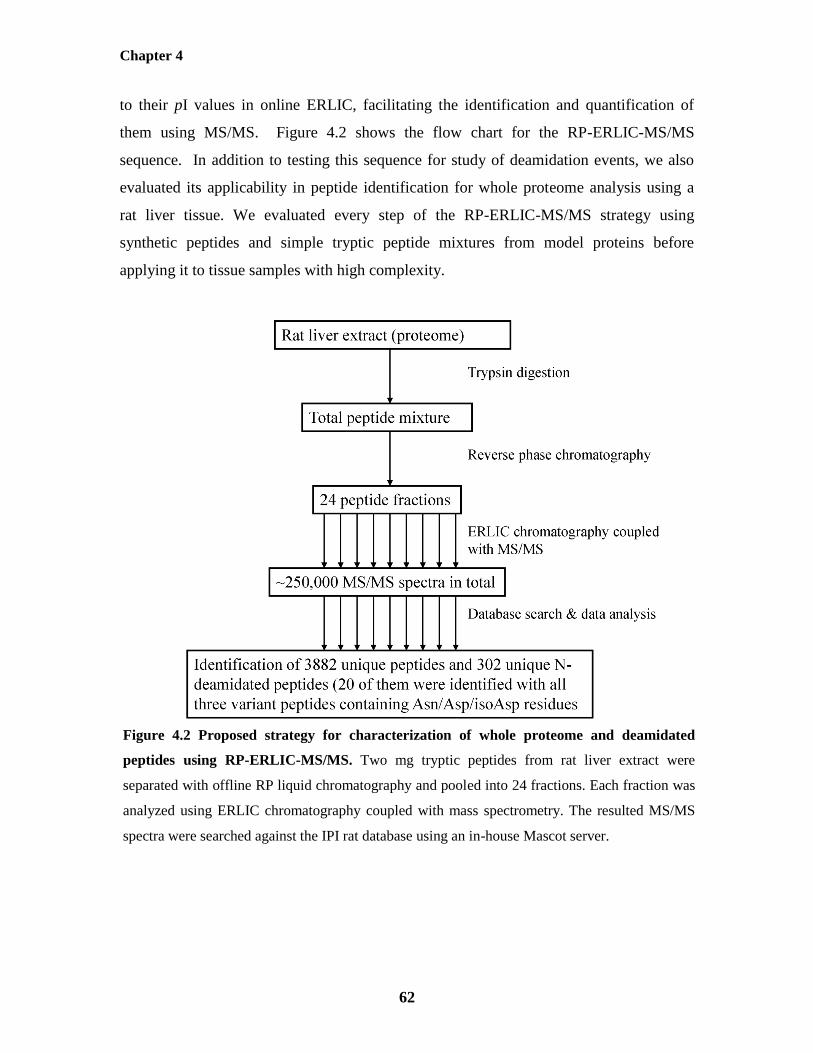
Chapter 4
62
to their pI values in online ERLIC, facilitating the identification and quantification of
them using MS/MS. Figure 4.2 shows the flow chart for the RP-ERLIC-MS/MS
sequence. In addition to testing this sequence for study of deamidation events, we also
evaluated its applicability in peptide identification for whole proteome analysis using a
rat liver tissue. We evaluated every step of the RP-ERLIC-MS/MS strategy using
synthetic peptides and simple tryptic peptide mixtures from model proteins before
applying it to tissue samples with high complexity.
Figure 4.2 Proposed strategy for characterization of whole proteome and deamidated
peptides using RP-ERLIC-MS/MS. Two mg tryptic peptides from rat liver extract were
separated with offline RP liquid chromatography and pooled into 24 fractions. Each fraction was
analyzed using ERLIC chromatography coupled with mass spectrometry. The resulted MS/MS
spectra were searched against the IPI rat database using an in-house Mascot server.

Chapter 4
63
4.4.2 Evaluation of RPLC and ERLIC for Separation of Synthetic Peptides
Figure 4.3 Comparison of RPLC and ERLIC for Separation of Synthetic Peptides: the co-
elution of the peptide mixture of DG(N/D/isoD)GYISAAELR in C18 RP liquid chromatography
with a conventional column (A) and in a C18 capillary coupled to mass spectrometry (B);
separation of the peptide mixture of DG(N/D/isoD)GYISAAELR using ERLIC chromatography
with a conventional column (C) and with a capillary coupled to mass spectrometry (D). The
absorbance was monitored at 280 nm. The co-elution of the three deamidation-related products in
RPLC makes it an ideal chromatography for the first dimension of MDLC, since collection of
them in the same fraction facilitates their identification as a set when resolved in the second
dimension.
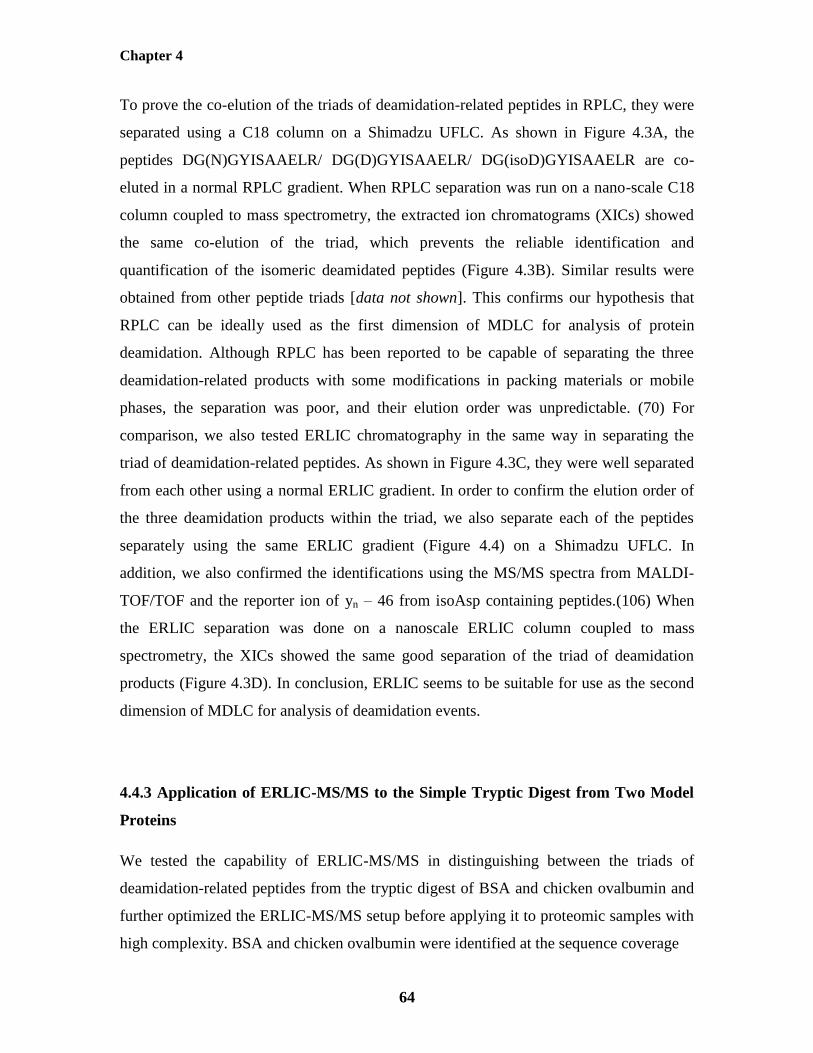
Chapter 4
64
To prove the co-elution of the triads of deamidation-related peptides in RPLC, they were
separated using a C18 column on a Shimadzu UFLC. As shown in Figure 4.3A, the
peptides DG(N)GYISAAELR/ DG(D)GYISAAELR/ DG(isoD)GYISAAELR are co-
eluted in a normal RPLC gradient. When RPLC separation was run on a nano-scale C18
column coupled to mass spectrometry, the extracted ion chromatograms (XICs) showed
the same co-elution of the triad, which prevents the reliable identification and
quantification of the isomeric deamidated peptides (Figure 4.3B). Similar results were
obtained from other peptide triads [data not shown]. This confirms our hypothesis that
RPLC can be ideally used as the first dimension of MDLC for analysis of protein
deamidation. Although RPLC has been reported to be capable of separating the three
deamidation-related products with some modifications in packing materials or mobile
phases, the separation was poor, and their elution order was unpredictable. (70) For
comparison, we also tested ERLIC chromatography in the same way in separating the
triad of deamidation-related peptides. As shown in Figure 4.3C, they were well separated
from each other using a normal ERLIC gradient. In order to confirm the elution order of
the three deamidation products within the triad, we also separate each of the peptides
separately using the same ERLIC gradient (Figure 4.4) on a Shimadzu UFLC. In
addition, we also confirmed the identifications using the MS/MS spectra from MALDI-
TOF/TOF and the reporter ion of yn – 46 from isoAsp containing peptides.(106) When
the ERLIC separation was done on a nanoscale ERLIC column coupled to mass
spectrometry, the XICs showed the same good separation of the triad of deamidation
products (Figure 4.3D). In conclusion, ERLIC seems to be suitable for use as the second
dimension of MDLC for analysis of deamidation events.
4.4.3 Application of ERLIC-MS/MS to the Simple Tryptic Digest from Two Model
Proteins
We tested the capability of ERLIC-MS/MS in distinguishing between the triads of
deamidation-related peptides from the tryptic digest of BSA and chicken ovalbumin and
further optimized the ERLIC-MS/MS setup before applying it to proteomic samples with
high complexity. BSA and chicken ovalbumin were identified at the sequence coverage
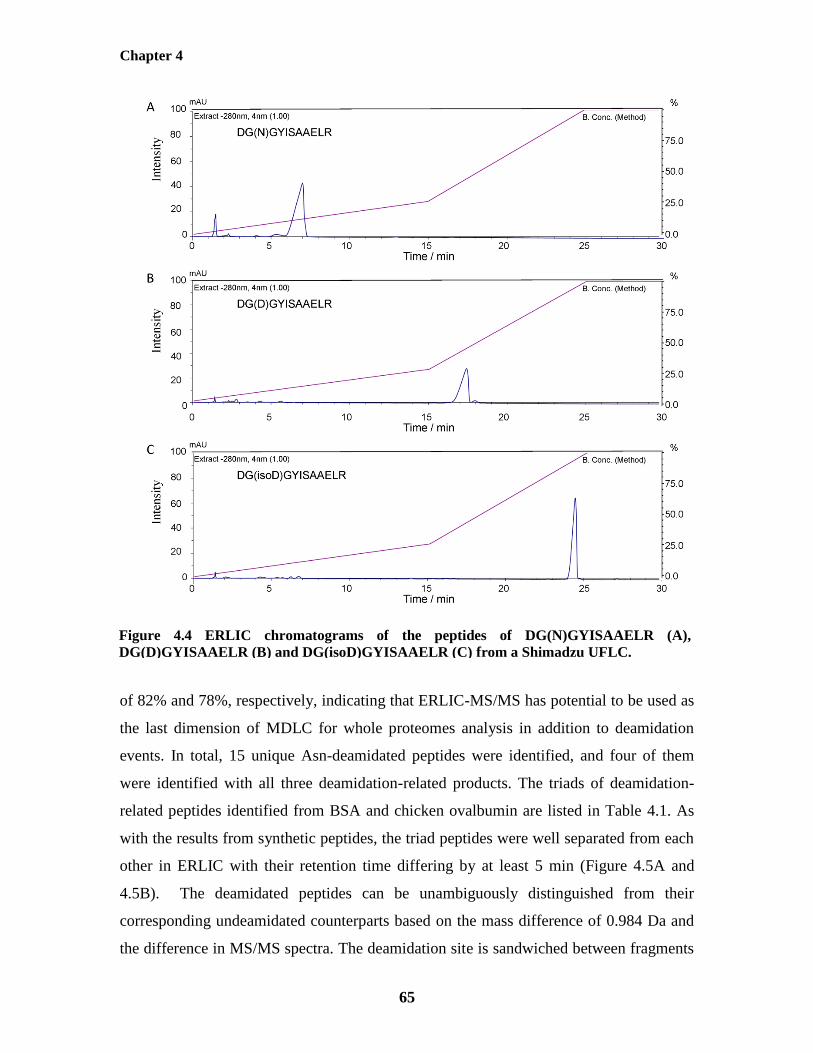
Chapter 4
65
of 82% and 78%, respectively, indicating that ERLIC-MS/MS has potential to be used as
the last dimension of MDLC for whole proteomes analysis in addition to deamidation
events. In total, 15 unique Asn-deamidated peptides were identified, and four of them
were identified with all three deamidation-related products. The triads of deamidation-
related peptides identified from BSA and chicken ovalbumin are listed in Table 4.1. As
with the results from synthetic peptides, the triad peptides were well separated from each
other in ERLIC with their retention time differing by at least 5 min (Figure 4.5A and
4.5B). The deamidated peptides can be unambiguously distinguished from their
corresponding undeamidated counterparts based on the mass difference of 0.984 Da and
the difference in MS/MS spectra. The deamidation site is sandwiched between fragments
Figure 4.4 ERLIC chromatograms of the peptides of DG(N)GYISAAELR (A),
DG(D)GYISAAELR (B) and DG(isoD)GYISAAELR (C) from a Shimadzu UFLC.
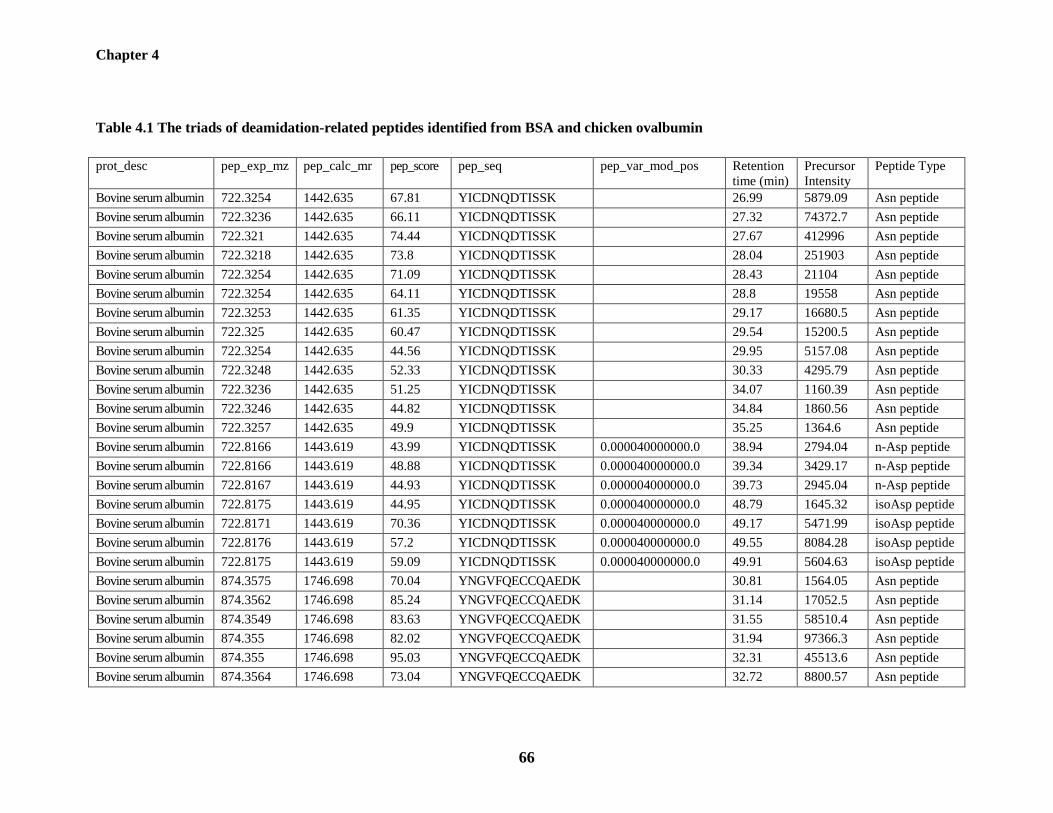
Chapter 4
66
Table 4.1 The triads of deamidation-related peptides identified from BSA and chicken ovalbumin
prot_desc pep_exp_mz pep_calc_mr pep_score pep_seq pep_var_mod_pos Retention
time (min)
Precursor
Intensity
Peptide Type
Bovine serum albumin 722.3254 1442.635 67.81 YICDNQDTISSK 26.99 5879.09 Asn peptide
Bovine serum albumin 722.3236 1442.635 66.11 YICDNQDTISSK 27.32 74372.7 Asn peptide
Bovine serum albumin 722.321 1442.635 74.44 YICDNQDTISSK 27.67 412996 Asn peptide
Bovine serum albumin 722.3218 1442.635 73.8 YICDNQDTISSK 28.04 251903 Asn peptide
Bovine serum albumin 722.3254 1442.635 71.09 YICDNQDTISSK 28.43 21104 Asn peptide
Bovine serum albumin 722.3254 1442.635 64.11 YICDNQDTISSK 28.8 19558 Asn peptide
Bovine serum albumin 722.3253 1442.635 61.35 YICDNQDTISSK 29.17 16680.5 Asn peptide
Bovine serum albumin 722.325 1442.635 60.47 YICDNQDTISSK 29.54 15200.5 Asn peptide
Bovine serum albumin 722.3254 1442.635 44.56 YICDNQDTISSK 29.95 5157.08 Asn peptide
Bovine serum albumin 722.3248 1442.635 52.33 YICDNQDTISSK 30.33 4295.79 Asn peptide
Bovine serum albumin 722.3236 1442.635 51.25 YICDNQDTISSK 34.07 1160.39 Asn peptide
Bovine serum albumin 722.3246 1442.635 44.82 YICDNQDTISSK 34.84 1860.56 Asn peptide
Bovine serum albumin 722.3257 1442.635 49.9 YICDNQDTISSK 35.25 1364.6 Asn peptide
Bovine serum albumin 722.8166 1443.619 43.99 YICDNQDTISSK 0.000040000000.0 38.94 2794.04 n-Asp peptide
Bovine serum albumin 722.8166 1443.619 48.88 YICDNQDTISSK 0.000040000000.0 39.34 3429.17 n-Asp peptide
Bovine serum albumin 722.8167 1443.619 44.93 YICDNQDTISSK 0.000004000000.0 39.73 2945.04 n-Asp peptide
Bovine serum albumin 722.8175 1443.619 44.95 YICDNQDTISSK 0.000040000000.0 48.79 1645.32 isoAsp peptide
Bovine serum albumin 722.8171 1443.619 70.36 YICDNQDTISSK 0.000040000000.0 49.17 5471.99 isoAsp peptide
Bovine serum albumin 722.8176 1443.619 57.2 YICDNQDTISSK 0.000040000000.0 49.55 8084.28 isoAsp peptide
Bovine serum albumin 722.8175 1443.619 59.09 YICDNQDTISSK 0.000040000000.0 49.91 5604.63 isoAsp peptide
Bovine serum albumin 874.3575 1746.698 70.04 YNGVFQECCQAEDK 30.81 1564.05 Asn peptide
Bovine serum albumin 874.3562 1746.698 85.24 YNGVFQECCQAEDK 31.14 17052.5 Asn peptide
Bovine serum albumin 874.3549 1746.698 83.63 YNGVFQECCQAEDK 31.55 58510.4 Asn peptide
Bovine serum albumin 874.355 1746.698 82.02 YNGVFQECCQAEDK 31.94 97366.3 Asn peptide
Bovine serum albumin 874.355 1746.698 95.03 YNGVFQECCQAEDK 32.31 45513.6 Asn peptide
Bovine serum albumin 874.3564 1746.698 73.04 YNGVFQECCQAEDK 32.72 8800.57 Asn peptide
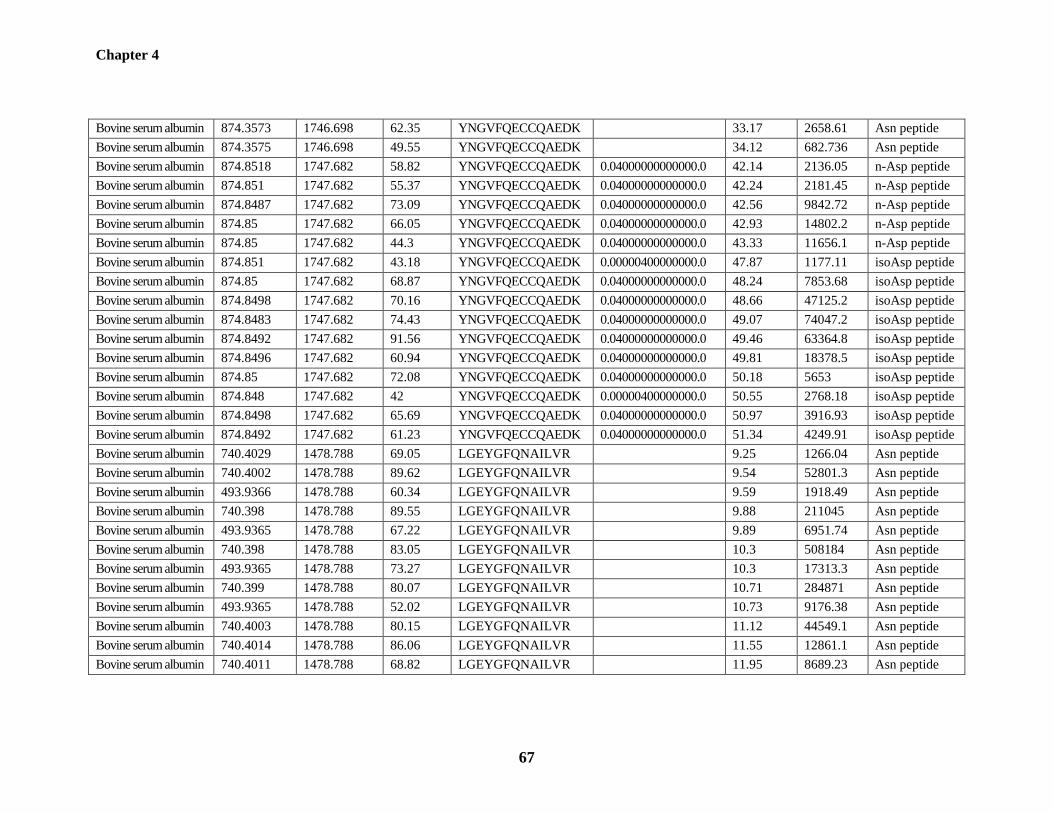
Chapter 4
67
Bovine serum albumin 874.3573 1746.698 62.35 YNGVFQECCQAEDK 33.17 2658.61 Asn peptide
Bovine serum albumin 874.3575 1746.698 49.55 YNGVFQECCQAEDK 34.12 682.736 Asn peptide
Bovine serum albumin 874.8518 1747.682 58.82 YNGVFQECCQAEDK 0.04000000000000.0 42.14 2136.05 n-Asp peptide
Bovine serum albumin 874.851 1747.682 55.37 YNGVFQECCQAEDK 0.04000000000000.0 42.24 2181.45 n-Asp peptide
Bovine serum albumin 874.8487 1747.682 73.09 YNGVFQECCQAEDK 0.04000000000000.0 42.56 9842.72 n-Asp peptide
Bovine serum albumin 874.85 1747.682 66.05 YNGVFQECCQAEDK 0.04000000000000.0 42.93 14802.2 n-Asp peptide
Bovine serum albumin 874.85 1747.682 44.3 YNGVFQECCQAEDK 0.04000000000000.0 43.33 11656.1 n-Asp peptide
Bovine serum albumin 874.851 1747.682 43.18 YNGVFQECCQAEDK 0.00000400000000.0 47.87 1177.11 isoAsp peptide
Bovine serum albumin 874.85 1747.682 68.87 YNGVFQECCQAEDK 0.04000000000000.0 48.24 7853.68 isoAsp peptide
Bovine serum albumin 874.8498 1747.682 70.16 YNGVFQECCQAEDK 0.04000000000000.0 48.66 47125.2 isoAsp peptide
Bovine serum albumin 874.8483 1747.682 74.43 YNGVFQECCQAEDK 0.04000000000000.0 49.07 74047.2 isoAsp peptide
Bovine serum albumin 874.8492 1747.682 91.56 YNGVFQECCQAEDK 0.04000000000000.0 49.46 63364.8 isoAsp peptide
Bovine serum albumin 874.8496 1747.682 60.94 YNGVFQECCQAEDK 0.04000000000000.0 49.81 18378.5 isoAsp peptide
Bovine serum albumin 874.85 1747.682 72.08 YNGVFQECCQAEDK 0.04000000000000.0 50.18 5653 isoAsp peptide
Bovine serum albumin 874.848 1747.682 42 YNGVFQECCQAEDK 0.00000400000000.0 50.55 2768.18 isoAsp peptide
Bovine serum albumin 874.8498 1747.682 65.69 YNGVFQECCQAEDK 0.04000000000000.0 50.97 3916.93 isoAsp peptide
Bovine serum albumin 874.8492 1747.682 61.23 YNGVFQECCQAEDK 0.04000000000000.0 51.34 4249.91 isoAsp peptide
Bovine serum albumin 740.4029 1478.788 69.05 LGEYGFQNAILVR 9.25 1266.04 Asn peptide
Bovine serum albumin 740.4002 1478.788 89.62 LGEYGFQNAILVR 9.54 52801.3 Asn peptide
Bovine serum albumin 493.9366 1478.788 60.34 LGEYGFQNAILVR 9.59 1918.49 Asn peptide
Bovine serum albumin 740.398 1478.788 89.55 LGEYGFQNAILVR 9.88 211045 Asn peptide
Bovine serum albumin 493.9365 1478.788 67.22 LGEYGFQNAILVR 9.89 6951.74 Asn peptide
Bovine serum albumin 740.398 1478.788 83.05 LGEYGFQNAILVR 10.3 508184 Asn peptide
Bovine serum albumin 493.9365 1478.788 73.27 LGEYGFQNAILVR 10.3 17313.3 Asn peptide
Bovine serum albumin 740.399 1478.788 80.07 LGEYGFQNAILVR 10.71 284871 Asn peptide
Bovine serum albumin 493.9365 1478.788 52.02 LGEYGFQNAILVR 10.73 9176.38 Asn peptide
Bovine serum albumin 740.4003 1478.788 80.15 LGEYGFQNAILVR 11.12 44549.1 Asn peptide
Bovine serum albumin 740.4014 1478.788 86.06 LGEYGFQNAILVR 11.55 12861.1 Asn peptide
Bovine serum albumin 740.4011 1478.788 68.82 LGEYGFQNAILVR 11.95 8689.23 Asn peptide
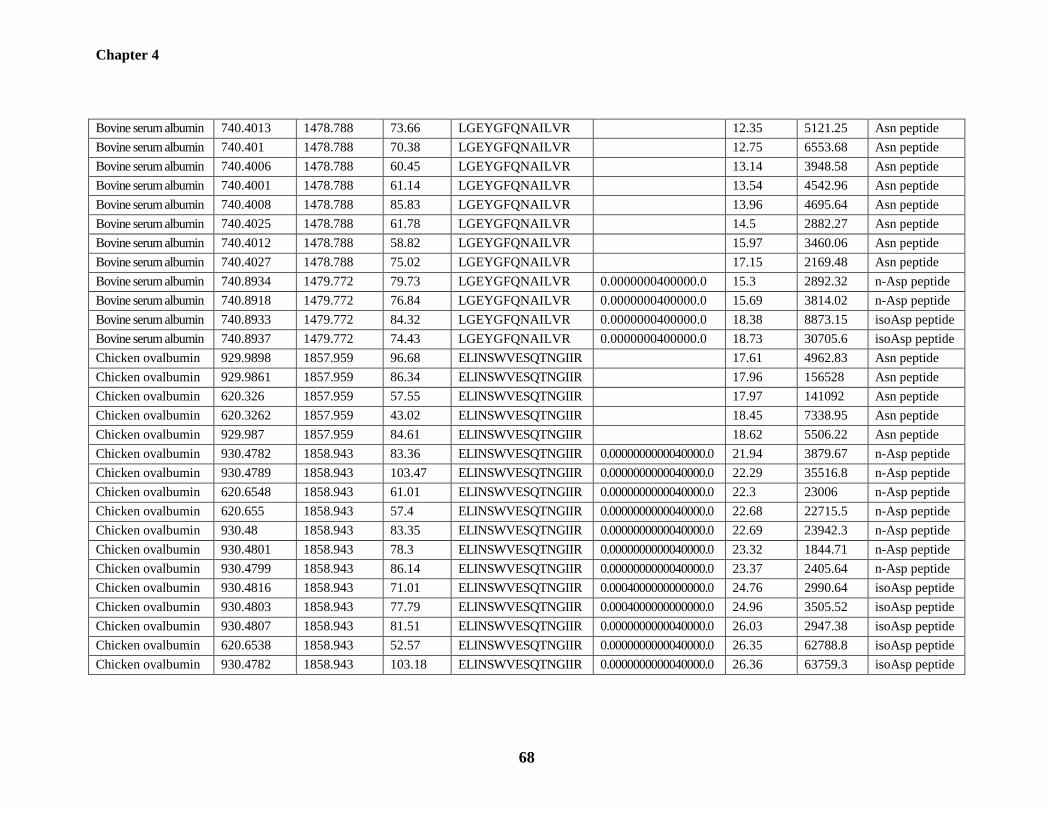
Chapter 4
68
Bovine serum albumin 740.4013 1478.788 73.66 LGEYGFQNAILVR 12.35 5121.25 Asn peptide
Bovine serum albumin 740.401 1478.788 70.38 LGEYGFQNAILVR 12.75 6553.68 Asn peptide
Bovine serum albumin 740.4006 1478.788 60.45 LGEYGFQNAILVR 13.14 3948.58 Asn peptide
Bovine serum albumin 740.4001 1478.788 61.14 LGEYGFQNAILVR 13.54 4542.96 Asn peptide
Bovine serum albumin 740.4008 1478.788 85.83 LGEYGFQNAILVR 13.96 4695.64 Asn peptide
Bovine serum albumin 740.4025 1478.788 61.78 LGEYGFQNAILVR 14.5 2882.27 Asn peptide
Bovine serum albumin 740.4012 1478.788 58.82 LGEYGFQNAILVR 15.97 3460.06 Asn peptide
Bovine serum albumin 740.4027 1478.788 75.02 LGEYGFQNAILVR 17.15 2169.48 Asn peptide
Bovine serum albumin 740.8934 1479.772 79.73 LGEYGFQNAILVR 0.0000000400000.0 15.3 2892.32 n-Asp peptide
Bovine serum albumin 740.8918 1479.772 76.84 LGEYGFQNAILVR 0.0000000400000.0 15.69 3814.02 n-Asp peptide
Bovine serum albumin 740.8933 1479.772 84.32 LGEYGFQNAILVR 0.0000000400000.0 18.38 8873.15 isoAsp peptide
Bovine serum albumin 740.8937 1479.772 74.43 LGEYGFQNAILVR 0.0000000400000.0 18.73 30705.6 isoAsp peptide
Chicken ovalbumin 929.9898 1857.959 96.68 ELINSWVESQTNGIIR 17.61 4962.83 Asn peptide
Chicken ovalbumin 929.9861 1857.959 86.34 ELINSWVESQTNGIIR 17.96 156528 Asn peptide
Chicken ovalbumin 620.326 1857.959 57.55 ELINSWVESQTNGIIR 17.97 141092 Asn peptide
Chicken ovalbumin 620.3262 1857.959 43.02 ELINSWVESQTNGIIR 18.45 7338.95 Asn peptide
Chicken ovalbumin 929.987 1857.959 84.61 ELINSWVESQTNGIIR 18.62 5506.22 Asn peptide
Chicken ovalbumin 930.4782 1858.943 83.36 ELINSWVESQTNGIIR 0.0000000000040000.0 21.94 3879.67 n-Asp peptide
Chicken ovalbumin 930.4789 1858.943 103.47 ELINSWVESQTNGIIR 0.0000000000040000.0 22.29 35516.8 n-Asp peptide
Chicken ovalbumin 620.6548 1858.943 61.01 ELINSWVESQTNGIIR 0.0000000000040000.0 22.3 23006 n-Asp peptide
Chicken ovalbumin 620.655 1858.943 57.4 ELINSWVESQTNGIIR 0.0000000000040000.0 22.68 22715.5 n-Asp peptide
Chicken ovalbumin 930.48 1858.943 83.35 ELINSWVESQTNGIIR 0.0000000000040000.0 22.69 23942.3 n-Asp peptide
Chicken ovalbumin 930.4801 1858.943 78.3 ELINSWVESQTNGIIR 0.0000000000040000.0 23.32 1844.71 n-Asp peptide
Chicken ovalbumin 930.4799 1858.943 86.14 ELINSWVESQTNGIIR 0.0000000000040000.0 23.37 2405.64 n-Asp peptide
Chicken ovalbumin 930.4816 1858.943 71.01 ELINSWVESQTNGIIR 0.0004000000000000.0 24.76 2990.64 isoAsp peptide
Chicken ovalbumin 930.4803 1858.943 77.79 ELINSWVESQTNGIIR 0.0004000000000000.0 24.96 3505.52 isoAsp peptide
Chicken ovalbumin 930.4807 1858.943 81.51 ELINSWVESQTNGIIR 0.0000000000040000.0 26.03 2947.38 isoAsp peptide
Chicken ovalbumin 620.6538 1858.943 52.57 ELINSWVESQTNGIIR 0.0000000000040000.0 26.35 62788.8 isoAsp peptide
Chicken ovalbumin 930.4782 1858.943 103.18 ELINSWVESQTNGIIR 0.0000000000040000.0 26.36 63759.3 isoAsp peptide
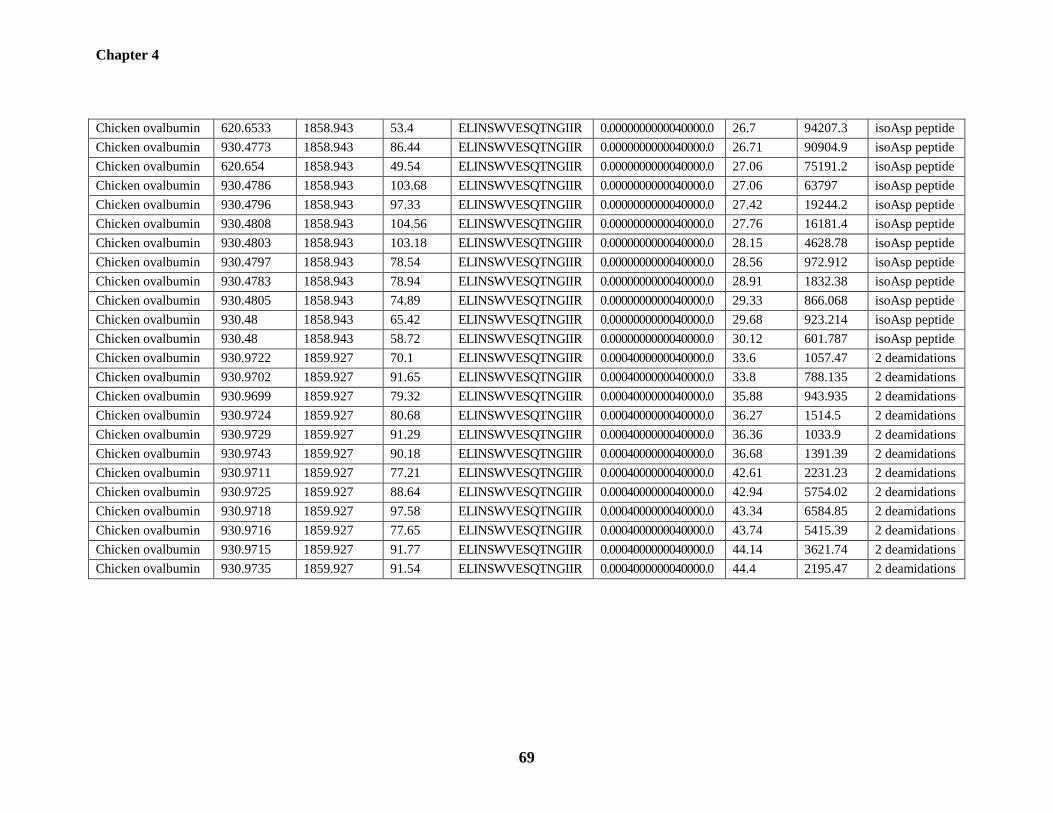
Chapter 4
69
Chicken ovalbumin 620.6533 1858.943 53.4 ELINSWVESQTNGIIR 0.0000000000040000.0 26.7 94207.3 isoAsp peptide
Chicken ovalbumin 930.4773 1858.943 86.44 ELINSWVESQTNGIIR 0.0000000000040000.0 26.71 90904.9 isoAsp peptide
Chicken ovalbumin 620.654 1858.943 49.54 ELINSWVESQTNGIIR 0.0000000000040000.0 27.06 75191.2 isoAsp peptide
Chicken ovalbumin 930.4786 1858.943 103.68 ELINSWVESQTNGIIR 0.0000000000040000.0 27.06 63797 isoAsp peptide
Chicken ovalbumin 930.4796 1858.943 97.33 ELINSWVESQTNGIIR 0.0000000000040000.0 27.42 19244.2 isoAsp peptide
Chicken ovalbumin 930.4808 1858.943 104.56 ELINSWVESQTNGIIR 0.0000000000040000.0 27.76 16181.4 isoAsp peptide
Chicken ovalbumin 930.4803 1858.943 103.18 ELINSWVESQTNGIIR 0.0000000000040000.0 28.15 4628.78 isoAsp peptide
Chicken ovalbumin 930.4797 1858.943 78.54 ELINSWVESQTNGIIR 0.0000000000040000.0 28.56 972.912 isoAsp peptide
Chicken ovalbumin 930.4783 1858.943 78.94 ELINSWVESQTNGIIR 0.0000000000040000.0 28.91 1832.38 isoAsp peptide
Chicken ovalbumin 930.4805 1858.943 74.89 ELINSWVESQTNGIIR 0.0000000000040000.0 29.33 866.068 isoAsp peptide
Chicken ovalbumin 930.48 1858.943 65.42 ELINSWVESQTNGIIR 0.0000000000040000.0 29.68 923.214 isoAsp peptide
Chicken ovalbumin 930.48 1858.943 58.72 ELINSWVESQTNGIIR 0.0000000000040000.0 30.12 601.787 isoAsp peptide
Chicken ovalbumin 930.9722 1859.927 70.1 ELINSWVESQTNGIIR 0.0004000000040000.0 33.6 1057.47 2 deamidations
Chicken ovalbumin 930.9702 1859.927 91.65 ELINSWVESQTNGIIR 0.0004000000040000.0 33.8 788.135 2 deamidations
Chicken ovalbumin 930.9699 1859.927 79.32 ELINSWVESQTNGIIR 0.0004000000040000.0 35.88 943.935 2 deamidations
Chicken ovalbumin 930.9724 1859.927 80.68 ELINSWVESQTNGIIR 0.0004000000040000.0 36.27 1514.5 2 deamidations
Chicken ovalbumin 930.9729 1859.927 91.29 ELINSWVESQTNGIIR 0.0004000000040000.0 36.36 1033.9 2 deamidations
Chicken ovalbumin 930.9743 1859.927 90.18 ELINSWVESQTNGIIR 0.0004000000040000.0 36.68 1391.39 2 deamidations
Chicken ovalbumin 930.9711 1859.927 77.21 ELINSWVESQTNGIIR 0.0004000000040000.0 42.61 2231.23 2 deamidations
Chicken ovalbumin 930.9725 1859.927 88.64 ELINSWVESQTNGIIR 0.0004000000040000.0 42.94 5754.02 2 deamidations
Chicken ovalbumin 930.9718 1859.927 97.58 ELINSWVESQTNGIIR 0.0004000000040000.0 43.34 6584.85 2 deamidations
Chicken ovalbumin 930.9716 1859.927 77.65 ELINSWVESQTNGIIR 0.0004000000040000.0 43.74 5415.39 2 deamidations
Chicken ovalbumin 930.9715 1859.927 91.77 ELINSWVESQTNGIIR 0.0004000000040000.0 44.14 3621.74 2 deamidations
Chicken ovalbumin 930.9735 1859.927 91.54 ELINSWVESQTNGIIR 0.0004000000040000.0 44.4 2195.47 2 deamidations

Chapter 4
70
with the deamidated asparagine (aspartic acid), such as b3-5, b7, b11-b13 and y12
(Figure 4.5D), the mass of which was about 0.984 Da higher than that of the
corresponding b or y ions detected in the MS/MS spectra of the unmodified peptides
(Figure 4.5C). (62, 124) The MS/MS spectra of the isomeric deamidated peptides
containing Asp or isoAsp were identical in CAD analysis. As discussed in the section of
4.2, we can distinguish them based on their predictable elution order in ERLIC. As
shown in Figure 4.4A and 4.4B, the relative intensity of the last eluted deamidated
peptides was about 3 times of the first eluted deamidated peptides, which is consistent
with the ratio of isoAsp and n-Asp produced in nonenzymatic deamidation and
isomerization. (72, 73, 125) This further confirms their identities. It is evident that the
rate of deamidation is much higher for the peptide shown in Figure 4.5A than that in
Figure 4.5B, reflecting the rapid kinetics of Asn deamidation at the –N-G- sequence.(126,
127) In conclusion, ERLIC-MS/MS can be effectively used in the identification and
relative quantification of deamidated products from the same peptide.
4.4.4 Application of RP-ERLIC-MS/MS to Tryptic Peptides from Rat liver Tissue
To determine the performance of the RP-ERLIC-MS/MS setup in characterizing
proteomic samples of high complexity, tryptic peptides from 2 mg rat liver tissue were
first distributed into 24 fractions with offline RPLC, and then subjected to ERLIC-
MS/MS for characterization of whole proteome and deamidated peptides. As a result,
1305 protein groups were identified with at least 2 unique peptides; 3,882 unique
peptides were identified from a total of 23,658 PSMs (peptide spectrum matches); 302
unique Asn-deamidated peptides were identified from 1408 PSMs; 20 unique Asn-
deamidated peptides were identified with all three deamidation-related products, and 70
Asn-deamidated peptides were identified with two of them. The identified triads of
deamidation-related peptides are shown in Supplemental Table 2 in Ref. (128). For those
identified with two deamidation-related products, all of them include the undeamidated
peptides. It is infeasible to determine whether the identified deamidated peptides are Asp
or isoAsp-containing deamidation products based solely on the elution time. However,
the separation of them will surely facilitate the identification and quantification of them

Chapter 4
71
Figure 4.5 Separation and identification of two groups of deamidation products containing
an asparaginyl, aspartyl or isoaspartyl residue at the same position from the tryptic digest
of BSA and chicken ovalbumin. (A) XICs of Y(D/isoD)GVFQECCQAEDK and their
undeamidated counterpart from ERLIC-LC-MS/MS; (B) XICs of YIC(D/isoD)QDTISSK and
their undeamidated counterpart from ERLIC-LC-MS/MS; (C) Tandem mass spectrum for
identification of Y(N)GVFQECCQAEDK; (D) Tandem mass spectrum for identification of
Y(D/isoD)GVFQECCQAEDK. The unmodifed and deamidated peptides were differentiated
based on the difference in MS/MS spectra, while the two isomeric deamidated peptides were
differentiated based on their elution times.
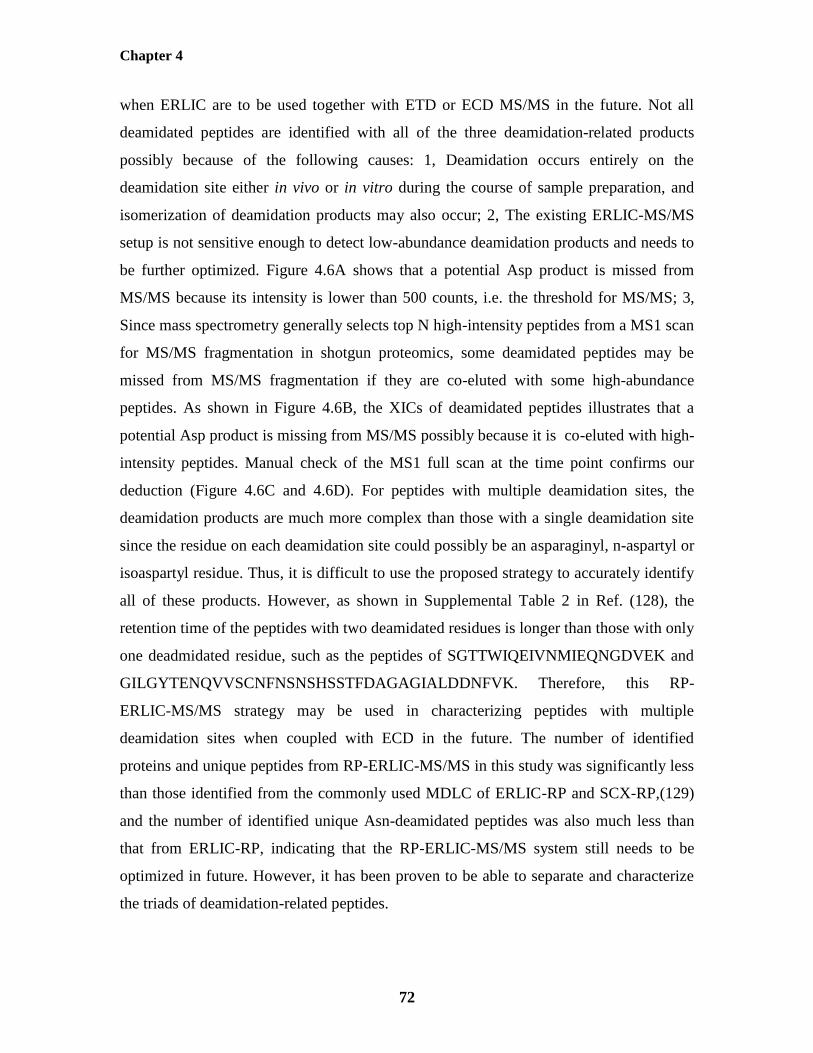
Chapter 4
72
when ERLIC are to be used together with ETD or ECD MS/MS in the future. Not all
deamidated peptides are identified with all of the three deamidation-related products
possibly because of the following causes: 1, Deamidation occurs entirely on the
deamidation site either in vivo or in vitro during the course of sample preparation, and
isomerization of deamidation products may also occur; 2, The existing ERLIC-MS/MS
setup is not sensitive enough to detect low-abundance deamidation products and needs to
be further optimized. Figure 4.6A shows that a potential Asp product is missed from
MS/MS because its intensity is lower than 500 counts, i.e. the threshold for MS/MS; 3,
Since mass spectrometry generally selects top N high-intensity peptides from a MS1 scan
for MS/MS fragmentation in shotgun proteomics, some deamidated peptides may be
missed from MS/MS fragmentation if they are co-eluted with some high-abundance
peptides. As shown in Figure 4.6B, the XICs of deamidated peptides illustrates that a
potential Asp product is missing from MS/MS possibly because it is co-eluted with high-
intensity peptides. Manual check of the MS1 full scan at the time point confirms our
deduction (Figure 4.6C and 4.6D). For peptides with multiple deamidation sites, the
deamidation products are much more complex than those with a single deamidation site
since the residue on each deamidation site could possibly be an asparaginyl, n-aspartyl or
isoaspartyl residue. Thus, it is difficult to use the proposed strategy to accurately identify
all of these products. However, as shown in Supplemental Table 2 in Ref. (128), the
retention time of the peptides with two deamidated residues is longer than those with only
one deadmidated residue, such as the peptides of SGTTWIQEIVNMIEQNGDVEK and
GILGYTENQVVSCNFNSNSHSSTFDAGAGIALDDNFVK. Therefore, this RP-
ERLIC-MS/MS strategy may be used in characterizing peptides with multiple
deamidation sites when coupled with ECD in the future. The number of identified
proteins and unique peptides from RP-ERLIC-MS/MS in this study was significantly less
than those identified from the commonly used MDLC of ERLIC-RP and SCX-RP,(129)
and the number of identified unique Asn-deamidated peptides was also much less than
that from ERLIC-RP, indicating that the RP-ERLIC-MS/MS system still needs to be
optimized in future. However, it has been proven to be able to separate and characterize
the triads of deamidation-related peptides.
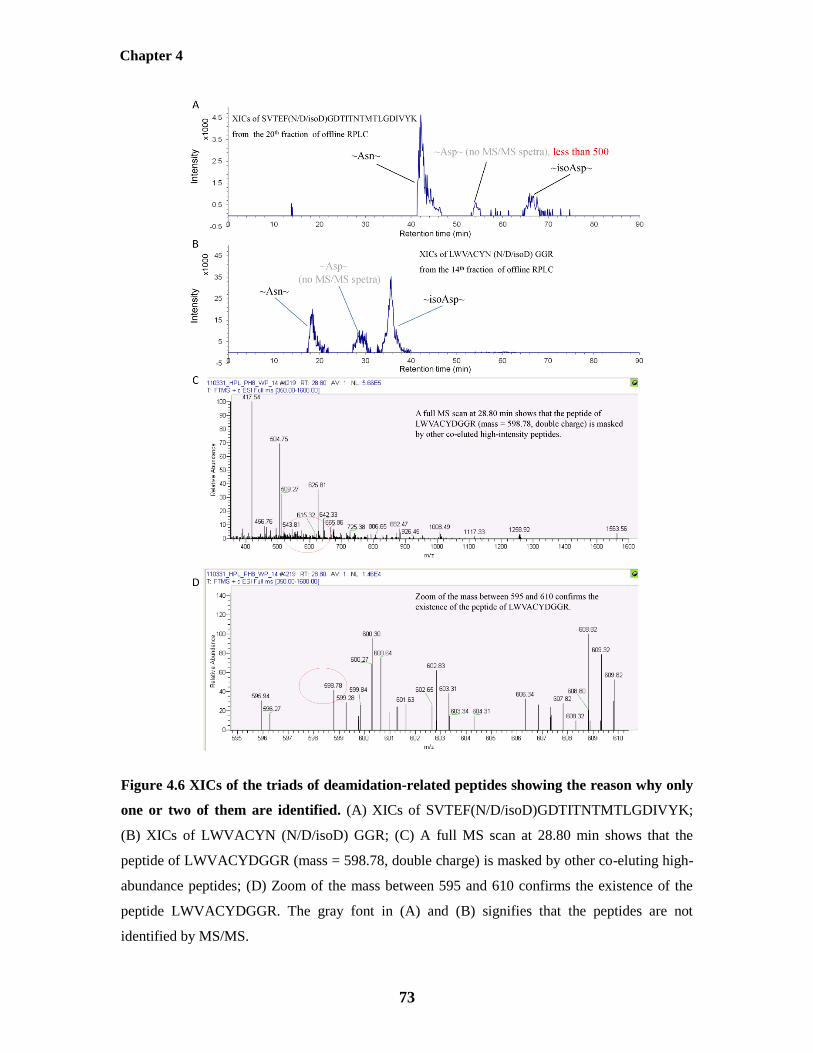
Chapter 4
73
Figure 4.6 XICs of the triads of deamidation-related peptides showing the reason why only
one or two of them are identified. (A) XICs of SVTEF(N/D/isoD)GDTITNTMTLGDIVYK;
(B) XICs of LWVACYN (N/D/isoD) GGR; (C) A full MS scan at 28.80 min shows that the
peptide of LWVACYDGGR (mass = 598.78, double charge) is masked by other co-eluting high-
abundance peptides; (D) Zoom of the mass between 595 and 610 confirms the existence of the
peptide LWVACYDGGR. The gray font in (A) and (B) signifies that the peptides are not
identified by MS/MS.
Chapter 4
74
4.4.5 Considerations for Optimizing RP-ERLIC-MS/MS in the Future
Based on our results, ERLIC-MS/MS has been proven to work effectively on simple
peptide mixtures, e.g. the tryptic peptides from BSA and chicken ovalbumin, but it is not
sensitive enough to detect low-abundance deamidated peptides from complex tryptic
digests. Since it is the first time that we directly coupled ERLIC to MS/MS, it may be
further optimized in the future in order to get better sensitivity. In this study, we tested
85% ACN/0.1% NH4OH, 85% ACN/1 mM NH4HCO3 and 90% ACN/0.1% FA as the
dissolving and desalting buffer for peptides. The first one got the best result since the
retention of peptides on the ERLIC trap column increases as the pH of the mobile phase
increases due to the decrease of electrostatic repulsion. Other reasonable solutions may
also be tested to optimize peptide trapping efficiency in the future. In this study, a
PolyWAX LP guard column was used as the trap column for ERLIC-MS/MS, but a
PolyWAX LP trap column designed specifically for peptide trapping may get better
performance. Alternatively, peptides may be directly injected into ERLIC columns
without using any trap columns. Additionally, different gradients and other mobile phases
may be tested in ERLIC-MS/MS, and similar WAX columns from other companies may
also be tested for ERLIC-MS/MS. It is highly possible that ERLIC-MS/MS may become
sensitive enough to characterize complex samples as the last dimension of MDLC with
the above-mentioned optimization.
4.4.6 Calculation of the Intensity Ratio of the isomeric isoAsp and n-Asp peptides
If a deamidated peptide is identified with ERLIC-MS/MS for over three times, the
average intensity of the top 3 is used to calculate its relative abundance. Otherwise, the
average intensity of all identified ones is used. The aim is to get the approximately
highest intensity of the peptides. As shown in Supplemental Table 3 in Ref. (128), the
ratio of the isoAsp versus Asp peptides is close to 3:1 in BSA and chicken ovalbumin, i.e.
2.09 to 5.90. It indicates that it may be mainly originated from nonenzymatic deamidation
without any repair. However, for rat liver tissue, the ratio of the isoAsp versus Asp
peptides is 0.23 to 69.49, indicating that some in vivo isoAsp repair/generation
Chapter 4
75
mechanism may work. It proves that the ERLIC-MS/MS strategy can be effectively used
in calculating the ratio of isoAsp versus Asp peptides from samples with high
complexity.
4.5 Conclusion
The widely used RPLC-MS/MS cannot be effectively used in the separation and
characterization of the structural isomers of deamidated peptides containing n-Asp or
isoAsp due to their identical polarities, but the newly introduced ERLIC is proven to
separate them well based on their different pI. Therefore, we here proposed and validated
a novel RP-ERLIC-MS/MS strategy for proteome-scale study of protein deamidation. Its
sensitivity still needs to be further improved before it can be used in characterizing low-
abundance deamidated peptides from complex samples. For more reliable identification
of isoAsp deamidation products, RP-ERLIC may be coupled to ECD or ETD in the
future. This sequence may also be used for the characterization of whole proteome
because of its remarkable resolution and compatibility with mass spectrometry.
Chapter 5
76
Chapter 5
Application of the Developed Technologies into the Study of
Protein Deamidation in Human Atherosclerotic Plaques for
Predicting Secondary Cerebrovascular Events
Chapter 5
77
5.1 Abstract
Human carotid atherosclerotic plaques from old patients are good samples to test the
applicability of our newly developed proteomic methods since protein deamidation
accumulates progressively with ages. The deep proteomic profiling of atherosclerotic
plaques is helpful to understand its mechanism, and the identification of prognostic
biomarkers may save patients from secondary cerebrovascular events. In this chapter, our
newly developed proteomics methods as detailed in previous chapters were employed to
ensure the accurate and reliable characterization of endogenous protein deamidation.
With the latest proteomics technologies, 3846 proteins were identified with at least 2
unique peptides from atherosclerotic plaques, and many low-abundance proteins with
important functions in atherosclerosis were identified confidently using mass
spectrometry for the first time. It represents a leap forward in understanding of plaque
composition, development and progression. Label-free quantification on pooled plaques
from patients with/without secondary cerebrovascular events identified many up-
regulated proteins and deamidated peptides that were either known biomarkers for
unstable plaques or closely related to the initiation and progression of atherosclerosis as
biomarker candidates. These candidates were then evaluated in 38 individual samples
using PRM for predicting secondary cerebrovascular events after the applicability of
PRM for validation of deamidated peptides was proven using simple tryptic digests.
None of them reached the criterion as a clinically usable biomarker possibly due to the
small sample size and high individual variation. However, the applicability of our newly
developed technologies for studying deamidation has been sufficiently proven. It opens a
door for scientists who are interested in understanding the role of protein deamidation in
aging and many diseases.
5.2 Introduction
Atherosclerotic cardiovascular disease is a major cause of mortality worldwide,
accounting for more than 19 million deaths per year.(130) Atherosclerosis is a chronic
inflammatory disease resulting in the narrowing of large and medium-sized arteries with

Chapter 5
78
associated plaque deposition on the intimal layer. Atherosclerotic plaque formation
begins with sub-endothelial accumulation of lipids, macrophage foam cells and T cells; in
the later stages a necrotic core composed of apoptotic and necrotic cells, cell debris and
cholesterol crystals forms. Plaque growth results in the narrowing of arterial lumen and
ischemia in the surrounding tissue, while plaque rupture can lead to life-threatening
myocardial infarction and ischemic stroke due to the blockage of arteries.(131)
Atherosclerotic plaques can be separated into two broad categories: stable and unstable,
with the latter associated with high risk of ruptures, leading to primary cardiovascular or
cerebrovascular events. (132, 133) Carotid endarterectomy (CEA) is a surgical procedure
that can be used to reduce the risk of stroke, by correcting stenosis in the common carotid
artery or internal carotid artery of patients with primary cerebrovascular events. The
incidence of secondary cerebrovascular events in patients who underwent CEA is 8.2%,
(134, 135) and predictive biomarkers may be used to save them from the secondary
events. By now, proteomics methods have been the most widely used means to study the
composition of plaques for better understanding the mechanism of atherosclerosis and
seek biomarkers due to its high sensitivity and throughput. (136, 137)
Defining the proteome of atherosclerotic plaques represents a promising avenue of
investigation for understanding the mechanism of atherosclerosis and searching novel
therapeutic targets. In fact, proteomics has been used to understand the mechanisms
underlying atherosclerosis and to identify biomarkers for many years. Until 2006, 2-DE
was the main means to study atherosclerosis in animal models or human arteries, but
generally only a few hundred proteins could be identified.(138, 139) In 2007, Bagnato et
al. conducted the first large-scale proteomic analysis of human coronary atherosclerotic
tissues and successfully identified 806 proteins.(140) In 2009, De Kleijn and colleagues
identified approximately 1200 proteins in human carotid atherosclerotic plaques in a
proteomic study using multidimensional LC-MS/MS.(141) However, many low-
abundance proteins that are known to be important for the development and progression
of plaques, such as VCAM1, ICAM1 and TGF-β, and various cytokines and growth
factors, still could not be identified from atherosclerotic plaques using mass
Chapter 5
79
spectrometry-based proteomics methods. It is an urgent need to apply the cutting-edge
proteomics technologies to the study of human carotid atherosclerotic plaques.
Protein deamidation is reported to be related to aging and many diseases, (65-67, 96, 97)
but its role in atherosclerosis remains unclear and less studied. Since nonenzymatic
deamidation accumulates progressively with ages in proteins, (142) atherosclerotic
plaques from old patients are good samples to test the applicability of our newly
developed proteomic methods. Patients were aged between 56 and 83 in this study. In the
previous chapters of this thesis, we developed novel data analysis strategy and sample
preparation protocols to minimize false positive identifications of deamidated peptides
and artificial deamidation so that the accurate and reliable characterization of endogenous
protein deamidation becomes feasible. (84) The quantification of protein deamidation
between patients with and without secondary cerebrovascular events may identify up-
regulated deamidated peptides as biomarker candidates.
To test the applicability of deamidated peptides as biomarkers, it is necessary to validate
their levels in each individual sample. The traditional antibody based assays, such as
Western Blot and ELISA, cannot be used in the discovery and validation of novel PTMs
due to the lack of commercially available antibodies with high specificity. Generally,
MRM can be used in the validation of novel PTMs in individual samples. (92, 143)
However, it cannot be used in the validation of deamidated peptides in individual
samples. With the commonly used full width at half-maximum (FWHM) of 0.7 Th in Q1
for MRM, both deamidated peptides and the 13
C peak of the corresponding undeamidated
peptides are isolated for fragmentation due to the slight mass difference of 19.34 mDa
between them. (84) When the FWHM of 0.7 Th is also used to monitor the MS2
fragments of deamidated peptides in Q3, both the MS2 fragments of deamidated peptides
and that of the 13
C peaks of their corresponding undeamidated peptides are isolated due to
the slight mass difference of 19.34 mDa between them. Therefore, MRM cannot be
effectively used to differentiate deamidated peptides from their corresponding
undeamidated peptides due to its low resolution, i.e. <2000. Generally, the mass accuracy
Chapter 5
80
of less than 5 ppm which is achievable at the resolution of at least 70,000 is necessary to
differentiate the mass difference of 19.34 mDa. Therefore, the newly introduced PRM
with a resolution of 70,000 to 140,000 on Q Exactive can theoretically be used in the
validation of deamidated peptides in individual samples.
In this chapter, the latest proteomics technologies were applied to the study of human
carotid atherosclerotic plaques to increase the proteome coverage and confirm the
presence of as many as possible low-abundance proteins. Our newly developed
proteomics methods were employed to ensure the accurate characterization of
endogenous protein deamidation. Label-free quantification on pooled plaques from
patients with/without secondary cerebrovascular events identified many up-regulated
proteins and deamidated peptides that were either known biomarkers for unstable plaques
or closely related to the initiation and progression of atherosclerosis as biomarker
candidates. These candidates were then evaluated in each individual sample using PRM
for predicting secondary cerebrovascular events after the applicability of PRM for
validation of deamidated peptides was proven using simple tryptic digests.
5.3 Materials and Methods
5.3.1 Reagents
Unless indicated, all reagents used in this study were purchased from Sigma-Aldrich,
USA. Protease inhibitor (Cat no.: 05 892 791 001) was purchased from Roche, Basel,
Switzerland; Unmodified trypsin (T8802) was purchased from Sigma-Aldrich, St. Louis,
MO. Sep-Pak C18 cartridges were purchased from Waters, Milford, MA; 2D-Quant Kit
was purchased from Thermo Fisher, MA.
5.3.2 Patient information
Atherosclerotic plaques from 38 patients who underwent carotid endarterectomy (surgical
unblocking of the carotid artery) in a Dutch hospital (UMC Utrecht) between 2002 and
Chapter 5
81
2006 were used for proteomics analysis in this study.(141) Patients were aged between 56
and 83, with 32 males and 6 females. The study was approved by the Institutional Review
Boards of the hospital and written informed consent was obtained from all patients. In the
discovery stage study, plaque lysates from patients with and without secondary
cerebrovascular events were pooled into two groups, respectively. Secondary outcome
means any major cardiovascular event, such as vascular death, nonfatal myocardial
infarction, nonfatal stroke, and nonfatal aneurysm rupture. Definitions and assessment
procedures of the outcome events were described previously. (144)
5.3.3 Sample Preparation
Each of 38 atherosclerotic plaques was washed 3 times with 1X PBS, weighed, cut into
small pieces and put into microcentrifuge tubes. One volume of SSB14B beads (Next
Advance, Inc., NY) and three volumes of lysis buffer (8M Urea, 50 mM ammonium
acetate, pH 6) with protease inhibitors added were added into the tubes (Note:
100mg=100ul). The homogenization was done at SPEED 10 for 3 min using Bullet
Blender®. After the tubes were centrifuged at 2,000 g for 1 min, the homogenization was
repeated once. The suspension was centrifuged at 20,000g at 4oC for 20 min. The protein
concentration of the supernatant was then determined using 2D-Quant Kit (Thermo
Fisher, MA) since protein precipitation at pH 6 during dilution of urea concentration
affected BCA quantification. The plaque lysates from 19 test patients who underwent
secondary cerebrovascular events and those from 19 control patients without secondary
cerebrovascular events were pooled, respectively. About 3 mg tissue lysate from either
individual plaques or pooled sample was reduced with 10 mM DTT at 37oC for 2 h and
alkylated with 50 mM iodoacetamide at room temperature for 45 min in the dark. After
the concentration of urea was diluted to 1M with 50mM ammonium acetate (pH 6),
trypsin (T8802, Sigma) was added at a weight ratio of 1:40. It was then incubated at 37oC
for 15 h. The obtained tryptic peptides were desalted using a Sep-Pak® C18 cartridge
(Waters, Milford, MA) and dried in a SpeedVac (Thermo Electron, Waltham, MA).
5.3.4 ERLIC Fractionation of Label-free Peptides from Pooled Plaque Lysates
Chapter 5
82
Peptides from 1 mg of pooled plaque lysates were fractionated using a PolyWAX LP
weak anion-exchange column (4.6 × 200 mm, 5 μm, 300 Å, PolyLC) on a Shimadzu
Prominence UFLC system. To ensure the solubility of peptides, 200 µl of mobile phase A
(85% ACN/0.1% FA) was used to dissolve the peptides. Mobile phase A and mobile
phase B (10% ACN/0.4% FA) were used to establish a 40 min gradient of 0%–8%
buffer B for 10 min, 8%–32% buffer B for 20 min, 32%–100% buffer B for 2 min and
100% buffer B for 8 min at a flow rate of 1 mL/min with 30 fractions collected. The
collected fractions were then dried in vacuum, pooled into 20 fractions and redissolved in
3% ACN/0.1% FA for LC-MS/MS analysis. Fractions 3-17 were not combined, while
fractions 1-2, 18-19, 20-22, 23-26 and 27-30 were combined, respectively.
5.3.5 LC-MS/MS for Shotgun Proteomics
Peptides from 20 pooled ERLIC fractions were separated and analyzed on a Dionex
Ultimate 3000 RSLCnano system coupled to a Q Exactive (Thermo Fisher, MA) in
triplicate. Peptides were separated in a capillary column (75 µm x 10 cm) packed with
C18 AQ (5 µm, 300Å; Bruker-Michrom, Auburn, CA, USA) at room temperature. The
flow rate was at 300 nl/min. Mobile phase A (0.1% formic acid in 5% ACN) and mobile
phase B (0.1% formic acid in 90% ACN) were used to establish a 70 min gradient
comprised of 5 min of 5% B, 57 min of 5-40% B, 1 min of 40-80% B and 2 min of 80%
B followed by re-equilibration at 5% B for 5 min. Peptides were then analyzed on Q
Exactive with a nanospray source (Thermo Fisher, MA) at an electrospray potential of
1.5 kV. A full MS scan (350-1600 m/z range) was acquired at a resolution of 70,000 at
m/z 200 and a maximum ion accumulation time of 100 msec. Dynamic exclusion was set
as 20 s. Resolution for HCD spectra was set to 17,500 at m/z 200. The AGC setting of
full MS scan and MS2 were set as 3E6 and 5E4, respectively. The 10 most intense ions
above a 250 counts threshold were selected for fragmentation in HCD with a maximum
ion accumulation time of 100 msec. Isolation width of 2 was used for MS2. Single and
unassigned charged ions were excluded from MS/MS. For HCD, normalized collision
energy was set to 25%. The underfill ratio was defined as 0.1%.

Chapter 5
83
5.3.6 LC-MS/MS for Parallel Reaction Monitoring (PRM)
Peptides from each individual plaque samples were separated and analyzed on a Dionex
Ultimate 3000 RSLCnano system coupled to a Q Exactive (Thermo Fisher, MA) in
triplicate. Peptides were separated in a capillary column (75 µm x 10 cm) packed with
C18 AQ (5 µm, 300Å; Bruker-Michrom, Auburn, CA) at room temperature. The flow
rate was at 300 nl/min. Mobile phase A (0.1% FA in 5% ACN) and mobile phase B
(0.1% FA in 90% ACN) were used to establish a 60 min gradient comprised of 1 min of
5-9% B, 46 min of 9-40% B, 5 min of 40-60% B, 0.1 min of 60-80% B and 2.9 min of
80% B followed by re-equilibration at 5% B for 5 min. Peptides were then analyzed on Q
Exactive with a nanospray source (Thermo Fisher, MA) at an electrospray potential of
1.5 kV. PRM was done with an isolation width of 2 Th, 70,000 resolution at m/z 200,
AGC target 1E6 and 250 ms maximum injection time as triggered by a scheduled
inclusion list. For HCD, normalized collision energy was set to 25%. The fixed first mass
is set to m/z 100.
5.3.7 Analysis of Data from Shotgun Proteomics
The raw data for pooled plaques were processed and searched with MaxQuant 1.3.0.5
with MS tolerance of 6 ppm and MS/MS tolerance of 0.02 Da. The UniProt human
protein database (release 2012_05, 87187 sequences) and database for proteomics
contaminants from MaxQuant were used for database searches. Reversed database
searches were used to evaluate FDR of peptide and protein identifications. Two missed
cleavage sites of trypsin were allowed. Carbamidomethylation (C) was set as a fixed
modification. Oxidation (M), Acetyl (Protein N-term) and deamidation (NQ) were set as
variable modifications. The FDR of both peptide identification and protein identification
is set to be 1%. (77, 78) The option of “Second peptides” was enabled. The function of
“Label-free quantification” was enabled in MaxQuant 1.3.0.5. Ingenuity Pathway
Analysis (IPA, Ingenuity® Systems, www.ingenuity.com) was used to reveal canonical
pathways associated with all identified proteins.
Chapter 5
84
For label-free quantification of protein groups, only protein groups identified with at least
2 unique peptides are considered, and the cutoff is >1.5 times or <0.67 time with the
relative standard deviation of the protein LFQ intensity values from both three technical
replicates of test group and that of control group less than 20%. Alternatively, protein
groups detected in all replicates of test group but not in all replicates of control group are
also regarded as up-regulated ones. For label-free quantification of deamidated peptides,
the cutoff is >1.6 times or <0.625 time with the relative standard deviation of the LFQ
intensity values of deamidated peptides from both three technical replicates of test group
and that of control group less than 30%. Alternatively, deamidated peptides detected in
all replicates of test group but not in all replicates of control group are also regarded as
up-regulated ones. Gene ontology analysis of up-regulated proteins in the pooled test
group with secondary cerebrovascular events was done using the PANTHER (Protein
ANalysis THrough Evolutionary Relationships) Classification System. (145, 146)
5.3.8 Analysis of Data from Parallel reaction monitoring (PRM)
Analysis of PRM data was done using Skyline (version 2.1.0.4936, University of
Washington), (147) Xcalibur (version 2.2; Thermo Fisher Scientific) or Pinpoint (version
1.3; Thermo Fisher Scientific). For Pinpoint, ion chromatograms were extracted at a mass
tolerance of 10 ppm; possible alignment error was set to 5 min; peak width was set to 1
min; complete peak area on smoothed data was used for calculation. Normalization of
PRM data for individual plaques is based on the total area of their LC-MS/MS base peaks.
5.4 Results and Discussion
5.4.1 The Strategy for Proteomic Study of Protein Deamidation in Human Carotid
Atherosclerotic Plaques for Predicting Secondary Cerebrovascular Events
As shown in Figure 5.1, this study is divided into two stages. In the stage I (discovery
stage), 38 human carotid atherosclerotic plaques from patients with and without
secondary cerebrovascular events were pooled into two groups, respectively. Each group
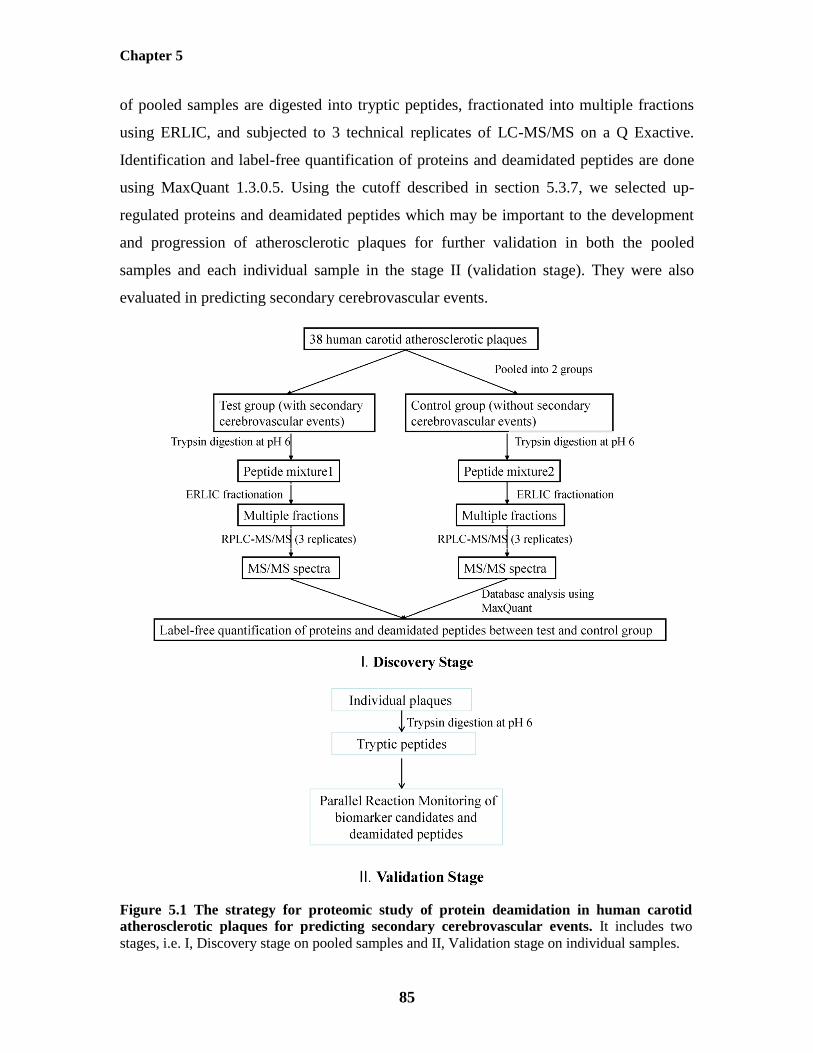
Chapter 5
85
of pooled samples are digested into tryptic peptides, fractionated into multiple fractions
using ERLIC, and subjected to 3 technical replicates of LC-MS/MS on a Q Exactive.
Identification and label-free quantification of proteins and deamidated peptides are done
using MaxQuant 1.3.0.5. Using the cutoff described in section 5.3.7, we selected up-
regulated proteins and deamidated peptides which may be important to the development
and progression of atherosclerotic plaques for further validation in both the pooled
samples and each individual sample in the stage II (validation stage). They were also
evaluated in predicting secondary cerebrovascular events.
Figure 5.1 The strategy for proteomic study of protein deamidation in human carotid
atherosclerotic plaques for predicting secondary cerebrovascular events. It includes two
stages, i.e. I, Discovery stage on pooled samples and II, Validation stage on individual samples.
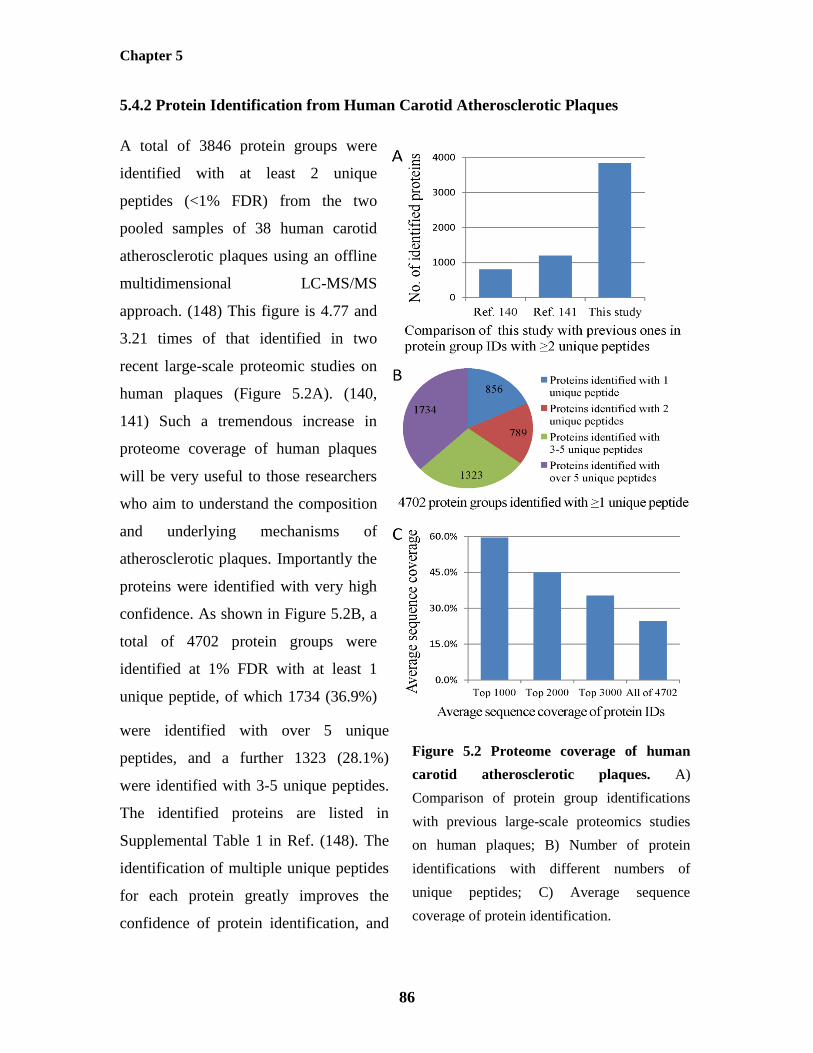
Chapter 5
86
Figure 5.2 Proteome coverage of human
carotid atherosclerotic plaques. A)
Comparison of protein group identifications
with previous large-scale proteomics studies
on human plaques; B) Number of protein
identifications with different numbers of
unique peptides; C) Average sequence
coverage of protein identification.
5.4.2 Protein Identification from Human Carotid Atherosclerotic Plaques
A total of 3846 protein groups were
identified with at least 2 unique
peptides (<1% FDR) from the two
pooled samples of 38 human carotid
atherosclerotic plaques using an offline
multidimensional LC-MS/MS
approach. (148) This figure is 4.77 and
3.21 times of that identified in two
recent large-scale proteomic studies on
human plaques (Figure 5.2A). (140,
141) Such a tremendous increase in
proteome coverage of human plaques
will be very useful to those researchers
who aim to understand the composition
and underlying mechanisms of
atherosclerotic plaques. Importantly the
proteins were identified with very high
confidence. As shown in Figure 5.2B, a
total of 4702 protein groups were
identified at 1% FDR with at least 1
unique peptide, of which 1734 (36.9%)
were identified with over 5 unique
peptides, and a further 1323 (28.1%)
were identified with 3-5 unique peptides.
The identified proteins are listed in
Supplemental Table 1 in Ref. (148). The
identification of multiple unique peptides
for each protein greatly improves the
confidence of protein identification, and
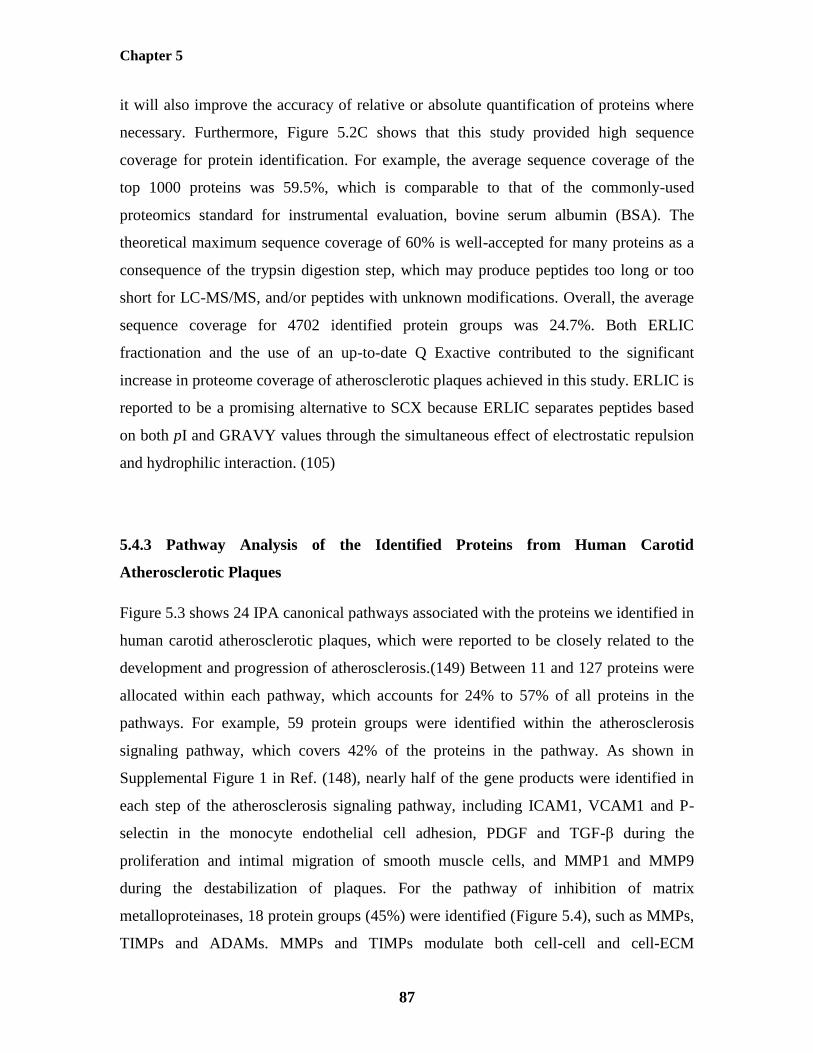
Chapter 5
87
it will also improve the accuracy of relative or absolute quantification of proteins where
necessary. Furthermore, Figure 5.2C shows that this study provided high sequence
coverage for protein identification. For example, the average sequence coverage of the
top 1000 proteins was 59.5%, which is comparable to that of the commonly-used
proteomics standard for instrumental evaluation, bovine serum albumin (BSA). The
theoretical maximum sequence coverage of 60% is well-accepted for many proteins as a
consequence of the trypsin digestion step, which may produce peptides too long or too
short for LC-MS/MS, and/or peptides with unknown modifications. Overall, the average
sequence coverage for 4702 identified protein groups was 24.7%. Both ERLIC
fractionation and the use of an up-to-date Q Exactive contributed to the significant
increase in proteome coverage of atherosclerotic plaques achieved in this study. ERLIC is
reported to be a promising alternative to SCX because ERLIC separates peptides based
on both pI and GRAVY values through the simultaneous effect of electrostatic repulsion
and hydrophilic interaction. (105)
5.4.3 Pathway Analysis of the Identified Proteins from Human Carotid
Atherosclerotic Plaques
Figure 5.3 shows 24 IPA canonical pathways associated with the proteins we identified in
human carotid atherosclerotic plaques, which were reported to be closely related to the
development and progression of atherosclerosis.(149) Between 11 and 127 proteins were
allocated within each pathway, which accounts for 24% to 57% of all proteins in the
pathways. For example, 59 protein groups were identified within the atherosclerosis
signaling pathway, which covers 42% of the proteins in the pathway. As shown in
Supplemental Figure 1 in Ref. (148), nearly half of the gene products were identified in
each step of the atherosclerosis signaling pathway, including ICAM1, VCAM1 and P-
selectin in the monocyte endothelial cell adhesion, PDGF and TGF-β during the
proliferation and intimal migration of smooth muscle cells, and MMP1 and MMP9
during the destabilization of plaques. For the pathway of inhibition of matrix
metalloproteinases, 18 protein groups (45%) were identified (Figure 5.4), such as MMPs,
TIMPs and ADAMs. MMPs and TIMPs modulate both cell-cell and cell-ECM
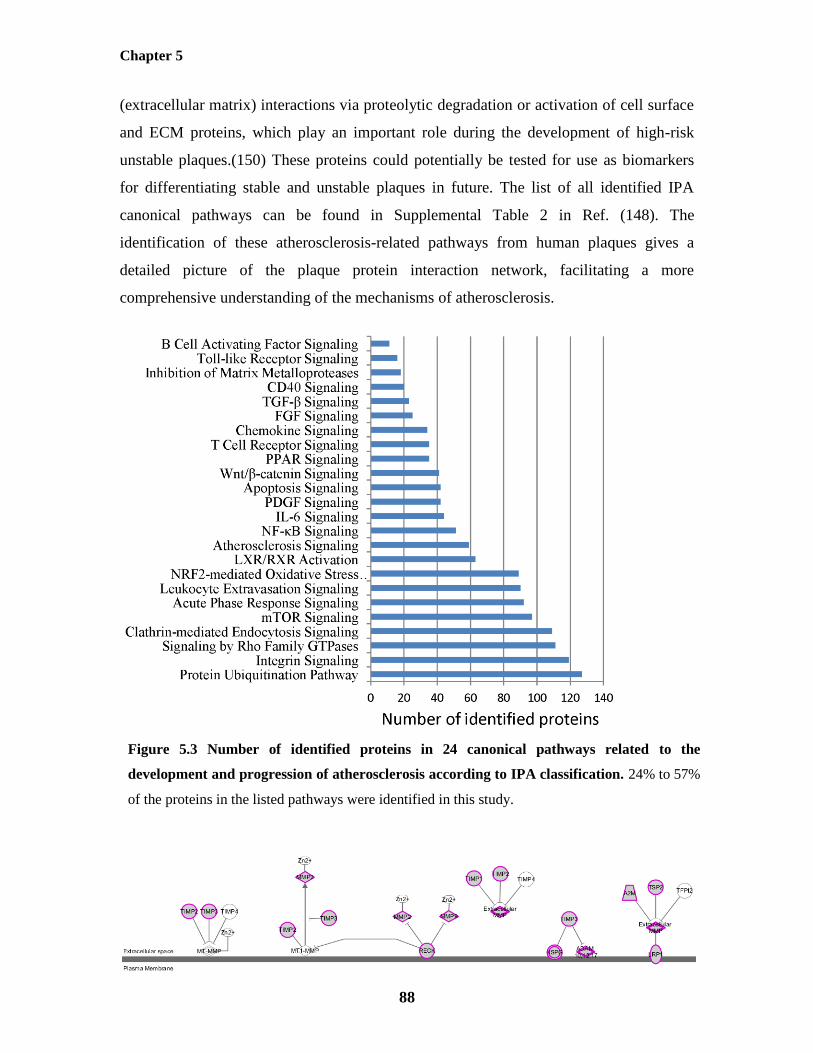
Chapter 5
88
(extracellular matrix) interactions via proteolytic degradation or activation of cell surface
and ECM proteins, which play an important role during the development of high-risk
unstable plaques.(150) These proteins could potentially be tested for use as biomarkers
for differentiating stable and unstable plaques in future. The list of all identified IPA
canonical pathways can be found in Supplemental Table 2 in Ref. (148). The
identification of these atherosclerosis-related pathways from human plaques gives a
detailed picture of the plaque protein interaction network, facilitating a more
comprehensive understanding of the mechanisms of atherosclerosis.
Figure 5.3 Number of identified proteins in 24 canonical pathways related to the
development and progression of atherosclerosis according to IPA classification. 24% to 57%
of the proteins in the listed pathways were identified in this study.
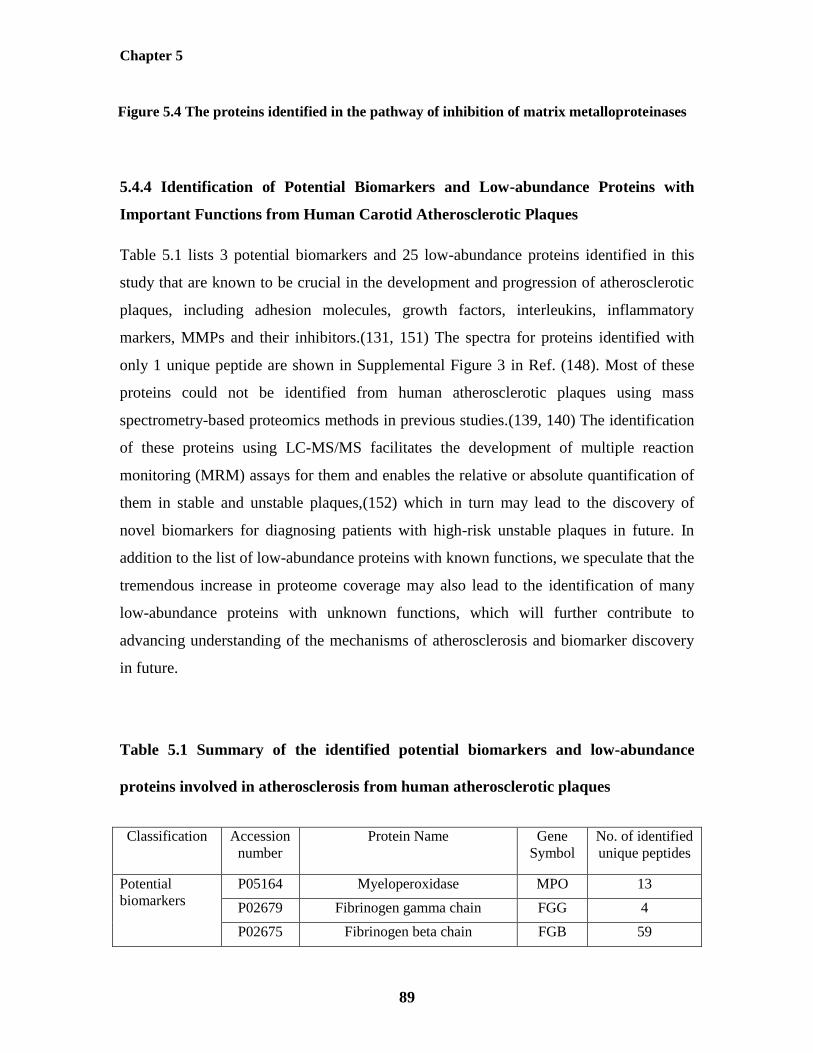
Chapter 5
89
5.4.4 Identification of Potential Biomarkers and Low-abundance Proteins with
Important Functions from Human Carotid Atherosclerotic Plaques
Table 5.1 lists 3 potential biomarkers and 25 low-abundance proteins identified in this
study that are known to be crucial in the development and progression of atherosclerotic
plaques, including adhesion molecules, growth factors, interleukins, inflammatory
markers, MMPs and their inhibitors.(131, 151) The spectra for proteins identified with
only 1 unique peptide are shown in Supplemental Figure 3 in Ref. (148). Most of these
proteins could not be identified from human atherosclerotic plaques using mass
spectrometry-based proteomics methods in previous studies.(139, 140) The identification
of these proteins using LC-MS/MS facilitates the development of multiple reaction
monitoring (MRM) assays for them and enables the relative or absolute quantification of
them in stable and unstable plaques,(152) which in turn may lead to the discovery of
novel biomarkers for diagnosing patients with high-risk unstable plaques in future. In
addition to the list of low-abundance proteins with known functions, we speculate that the
tremendous increase in proteome coverage may also lead to the identification of many
low-abundance proteins with unknown functions, which will further contribute to
advancing understanding of the mechanisms of atherosclerosis and biomarker discovery
in future.
Table 5.1 Summary of the identified potential biomarkers and low-abundance
proteins involved in atherosclerosis from human atherosclerotic plaques
Classification Accession
number
Protein Name Gene
Symbol
No. of identified
unique peptides
Potential
biomarkers
P05164 Myeloperoxidase MPO 13
P02679 Fibrinogen gamma chain FGG 4
P02675 Fibrinogen beta chain FGB 59
Figure 5.4 The proteins identified in the pathway of inhibition of matrix metalloproteinases
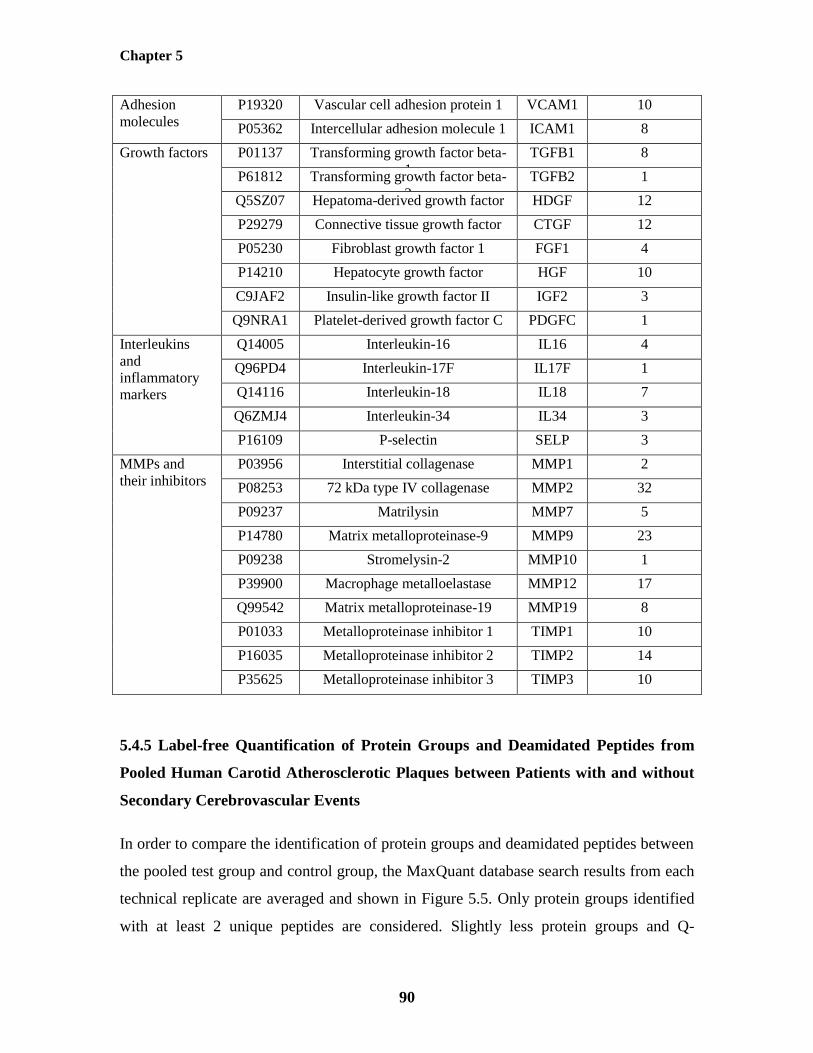
Chapter 5
90
Adhesion
molecules
P19320 Vascular cell adhesion protein 1 VCAM1 10
P05362 Intercellular adhesion molecule 1 ICAM1 8
Growth factors P01137 Transforming growth factor beta-
1
TGFB1 8
P61812 Transforming growth factor beta-
2
TGFB2 1
Q5SZ07 Hepatoma-derived growth factor HDGF 12
P29279 Connective tissue growth factor CTGF 12
P05230 Fibroblast growth factor 1 FGF1 4
P14210 Hepatocyte growth factor HGF 10
C9JAF2 Insulin-like growth factor II IGF2 3
Q9NRA1 Platelet-derived growth factor C PDGFC 1
Interleukins
and
inflammatory
markers
Q14005 Interleukin-16 IL16 4
Q96PD4 Interleukin-17F IL17F 1
Q14116 Interleukin-18 IL18 7
Q6ZMJ4 Interleukin-34 IL34 3
P16109 P-selectin SELP 3
MMPs and
their inhibitors
P03956 Interstitial collagenase MMP1 2
P08253 72 kDa type IV collagenase MMP2 32
P09237 Matrilysin MMP7 5
P14780 Matrix metalloproteinase-9 MMP9 23
P09238 Stromelysin-2 MMP10 1
P39900 Macrophage metalloelastase MMP12 17
Q99542 Matrix metalloproteinase-19 MMP19 8
P01033 Metalloproteinase inhibitor 1 TIMP1 10
P16035 Metalloproteinase inhibitor 2 TIMP2 14
P35625 Metalloproteinase inhibitor 3 TIMP3 10
5.4.5 Label-free Quantification of Protein Groups and Deamidated Peptides from
Pooled Human Carotid Atherosclerotic Plaques between Patients with and without
Secondary Cerebrovascular Events
In order to compare the identification of protein groups and deamidated peptides between
the pooled test group and control group, the MaxQuant database search results from each
technical replicate are averaged and shown in Figure 5.5. Only protein groups identified
with at least 2 unique peptides are considered. Slightly less protein groups and Q-
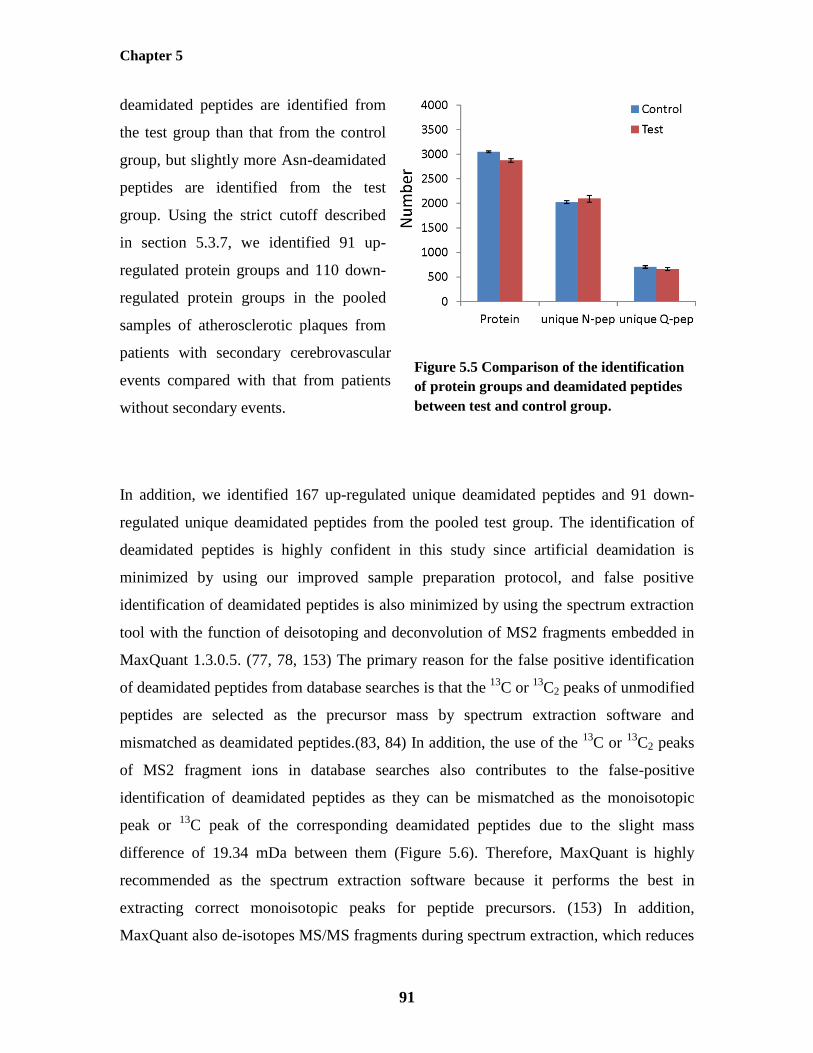
Chapter 5
91
Figure 5.5 Comparison of the identification
of protein groups and deamidated peptides
between test and control group.
deamidated peptides are identified from
the test group than that from the control
group, but slightly more Asn-deamidated
peptides are identified from the test
group. Using the strict cutoff described
in section 5.3.7, we identified 91 up-
regulated protein groups and 110 down-
regulated protein groups in the pooled
samples of atherosclerotic plaques from
patients with secondary cerebrovascular
events compared with that from patients
without secondary events.
In addition, we identified 167 up-regulated unique deamidated peptides and 91 down-
regulated unique deamidated peptides from the pooled test group. The identification of
deamidated peptides is highly confident in this study since artificial deamidation is
minimized by using our improved sample preparation protocol, and false positive
identification of deamidated peptides is also minimized by using the spectrum extraction
tool with the function of deisotoping and deconvolution of MS2 fragments embedded in
MaxQuant 1.3.0.5. (77, 78, 153) The primary reason for the false positive identification
of deamidated peptides from database searches is that the 13
C or 13
C2 peaks of unmodified
peptides are selected as the precursor mass by spectrum extraction software and
mismatched as deamidated peptides.(83, 84) In addition, the use of the 13
C or 13
C2 peaks
of MS2 fragment ions in database searches also contributes to the false-positive
identification of deamidated peptides as they can be mismatched as the monoisotopic
peak or 13
C peak of the corresponding deamidated peptides due to the slight mass
difference of 19.34 mDa between them (Figure 5.6). Therefore, MaxQuant is highly
recommended as the spectrum extraction software because it performs the best in
extracting correct monoisotopic peaks for peptide precursors. (153) In addition,
MaxQuant also de-isotopes MS/MS fragments during spectrum extraction, which reduces

Chapter 5
92
Figure 5.6: Schematic mass spectrum of the MS2 fragments of an unmodified peptide and
its corresponding deamidated peptide. Peak A is the first isotopic peak of the MS2 fragment of
the unmodified peptide; A’ and A’’ are its 13
C and 13
C2 peaks, respectively. Peak B is the first
isotopic peak of the MS2 fragment of the corresponding deamidated peptide. Peak A’ can be
mismatched as the MS2 fragment of a deamidated peptide, i.e. Peak B.
the possibility that the 13
C or 13
C2 peaks of fragment ions are matched during database
searches. Alternatively, the MS/MS tolerance of less than 5 ppm may be used during
database searches if MS/MS is acquired at a resolution of over 70,000, which reduces the
possibility that the 13
C peak of the MS2 fragments of unmodified peptides is mismatched
as the MS2 fragments of corresponding deamidated peptides. Q Exactive performs better
than LTQ-FT Ultra in studying protein deamidation due to its high-resolution MS/MS.
However, MaxQuant can only process raw files from mass spectrometers from Thermo
Fisher. For raw files from mass spectrometers from other vendors, it is necessary to
evaluate which software performs the best in extracting correct monoisotopic peaks for
peptide precursors and fragments. Nevertheless, a cutoff of 5 ppm for precursor mass
tolerance can be used to remove the false-positive identification of deamidated peptides
no matter which software is used for spectrum extraction and database searches. (84)
5.4.5.1 Gene Ontology Analysis of Up-regulated Proteins in the Pooled Test Group
with Secondary Cerebrovascular Events
In this study, we mainly focused on the study of the up-regulated proteins in the pooled
test group with secondary cerebrovascular events in comparison to the control group
without secondary cerebrovascular events due to the following considerations: 1, the up-

Chapter 5
93
Figure 5.7 Gene ontology annotations of
up-regulated proteins in test group
according to their cellular components
(A), molecular function (B) and protein
class (C).
regulated proteins are potentially related to the mechanism of the disease; 2, the detection
of up-regulated proteins is usually easier than that of down-regulated proteins if they can
potentially be used as biomarkers in the future. The up-regulated proteins in the pooled
test group were classified according to their cellular components, molecular function and
protein class (Figure 5.7) using the PANTHER. (145, 146) The enriched cellular
components, molecular function and protein class are found to play an important role in
the initiation and progression of
atherosclerosis.
As shown in Figure 5.7A, many of the up-
regulated proteins in the pooled test group
are from extracellular region or extracellular
matrix (ECM) proteins. It was reported that
smooth muscle cells release various matrix
metalloproteinases (MMPs) that can digest
ECM proteins and play an important role in
the formation and development of
atherosclerotic plaques. An excess of MMPs
over TIMPs (tissue inhibitors of
metalloproteinases) results in ECM
destruction so that the plaque becomes
unstable and prone to rupture. (154-156)
As shown in Figure 5.7B, most of the up-
regulated proteins in the pooled test group
are involved in the molecular function of
binding and catalytic activity. Many of the
up-regulated enzymes are reported to be
important in the development of
atherosclerosis, such as VCAM1, CTSF,
MMP9 and MPO. The up-regulation of
VCAM1 has been found to be associated
Chapter 5
94
with atherosclerosis at the site of lesion formation. (157, 158) MPO is reported to be a
major player in the initiation and progression of atherosclerotic cardiovascular disease
(CVD). (159) It is an important enzyme to catalyze the production of oxidative reagents
which kill pathogens. However, in chronic inflammation syndromes, MPO is also
released into the extracellular space due to neutrophil activation and in turn causes tissue
damage and plaque initiation.(160, 161)
Based on the classification of the up-regulated proteins in the pooled test group according
to protein class (Figure 5.6C), protease, signaling molecule and hydrolase are three most
identified protein class. The disorders of extracellular proteases have been reported to
contribute to the growth of arterial plaques. (162, 163) They not only result in the
degradation of extracellular matrix, but also have many other biological functions, such
as angiogenesis, cytokine modulation, enhancing cell migration, proliferation, and
apoptosis.
5.4.5.2 Analysis of Up-regulated Deamidated Peptides in the Pooled Test Group with
Secondary Cerebrovascular Events
Among the 167 up-regulated unique deamidated peptides identified in the test group, 23
are from APOB (Apolipoprotein B-100, P04114); 4 are from MFGE8 (Lactadherin,
Q08431); 3 are from PGK1 (Phosphoglycerate kinase 1, P00558). It is reported that
these proteins are closely related to the initiation and progression of atherosclerosis. For
example, APOB is the primary apolipoproteins of chylomicrons and low-density
lipoproteins (LDL) that carry cholesterol to tissues. Although its exact role in LDL is not
fully understood, high levels of APOB can result in plaque formation and atherosclerosis.
It is reported that levels of APOB can be a better indicator of heart disease risk than total
cholesterol or LDL. (164, 165) MFGE8 is involved in the phagocytic removal of
apoptotic cells in many tissues. Apoptosis of macrophages may be good for plaque
stability with apoptotic bodies removed, but apoptosis in the primary atherosclerosis may
result in plaque rupture and thrombosis. (166, 167) Therefore, the increase of
deamidation in these proteins may not be a random event but possibly have some
Chapter 5
95
important biological functions and can potentially be used as biomarkers for predicting
secondary cerebrovascular events. We also checked whether the deamidation of these
proteins was consistent with their expression level. APOB increased 1.64 times in the test
group, but MFGE8 and PGK1 showed no significant changes.
In addition, one deamidated peptides from TIMP1 and one from TIMP3 were found to be
identified only in the test group. TIMPs are specific tissue inhibitors of MMPs, which
inhibit the proteolytic activities of MMPs. The increased expression of several MMPs
was reported to contribute to the weakening and instability of atherosclerotic plaques.
(168, 169) Overexpression of TIMPs can inhibit MMP activity and reduce intimal
thickening in different models.(170, 171) For example, the overexpression of TIMP1 led
to the reduction of atherosclerotic lesions in mice. (172) Consequently, the reduction of
TIMP3 in patients with type 2 diabetes resulted in the accelerated formation of
atherosclerotic plaques. (173) TIMP1 and TIMP3 have been tested as the biomarker
candidates for differentiating patients with stable or unstable plaques. (174, 175) In this
study, TIMP1 increased 1.79 times in the test group compared with the control group,
and TIMP3 was only identified in the test group. Since protein deamidation can affect its
structure and function, we hypothesize that the increased deamidation of TIMP1 and
TIMP3 may result in the function loss of them, thus decreasing the inhibition of MMPs
and increasing the instability of plaques. Therefore, both the expression level and the
deamidation of TIMP1 and TIMP3 were to be further validated as biomarker candidates
for predicting secondary cerebrovascular events.
5.4.6 Application of Parallel Reaction Monitoring (PRM) to the Validation of the
Up-regulated Proteins and Up-regulated Deamidated Peptides in Individual Plaques
as Biomarker Candidates
As described in the section of 5.2, MRM cannot be used in the validation of deamidated
peptides in individual samples since it cannot differentiate the MS2 fragments of
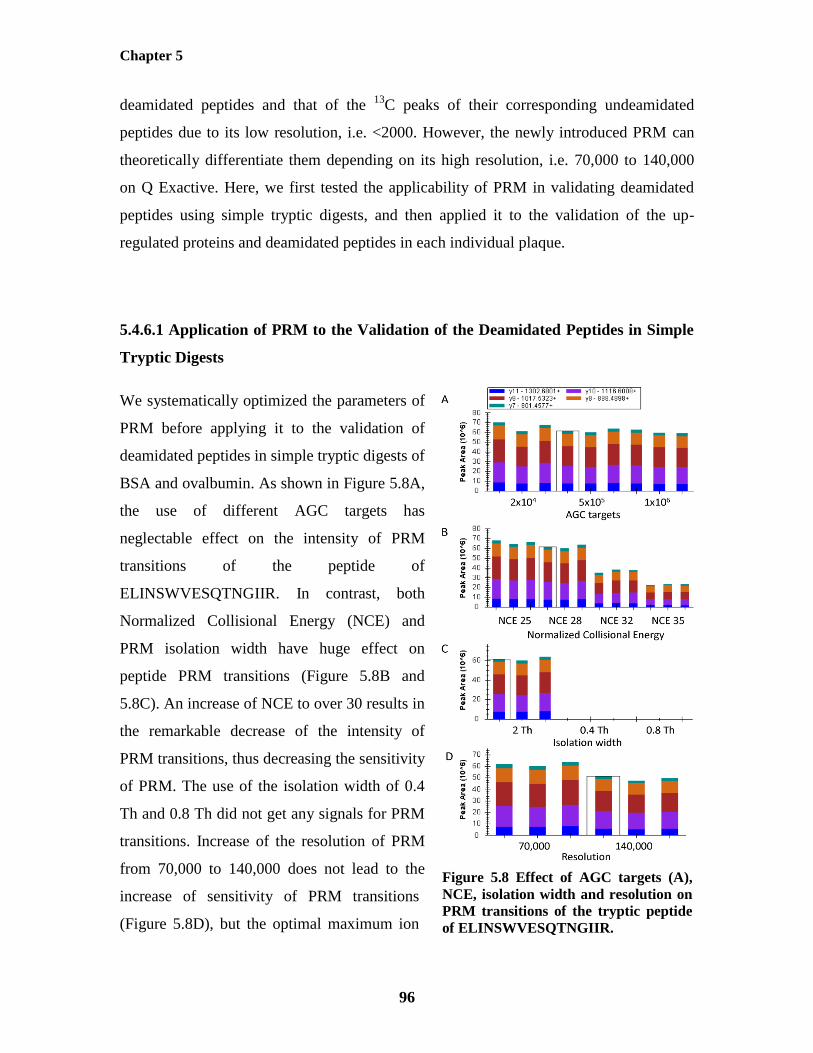
Chapter 5
96
Figure 5.8 Effect of AGC targets (A),
NCE, isolation width and resolution on
PRM transitions of the tryptic peptide
of ELINSWVESQTNGIIR.
deamidated peptides and that of the 13
C peaks of their corresponding undeamidated
peptides due to its low resolution, i.e. <2000. However, the newly introduced PRM can
theoretically differentiate them depending on its high resolution, i.e. 70,000 to 140,000
on Q Exactive. Here, we first tested the applicability of PRM in validating deamidated
peptides using simple tryptic digests, and then applied it to the validation of the up-
regulated proteins and deamidated peptides in each individual plaque.
5.4.6.1 Application of PRM to the Validation of the Deamidated Peptides in Simple
Tryptic Digests
We systematically optimized the parameters of
PRM before applying it to the validation of
deamidated peptides in simple tryptic digests of
BSA and ovalbumin. As shown in Figure 5.8A,
the use of different AGC targets has
neglectable effect on the intensity of PRM
transitions of the peptide of
ELINSWVESQTNGIIR. In contrast, both
Normalized Collisional Energy (NCE) and
PRM isolation width have huge effect on
peptide PRM transitions (Figure 5.8B and
5.8C). An increase of NCE to over 30 results in
the remarkable decrease of the intensity of
PRM transitions, thus decreasing the sensitivity
of PRM. The use of the isolation width of 0.4
Th and 0.8 Th did not get any signals for PRM
transitions. Increase of the resolution of PRM
from 70,000 to 140,000 does not lead to the
increase of sensitivity of PRM transitions
(Figure 5.8D), but the optimal maximum ion
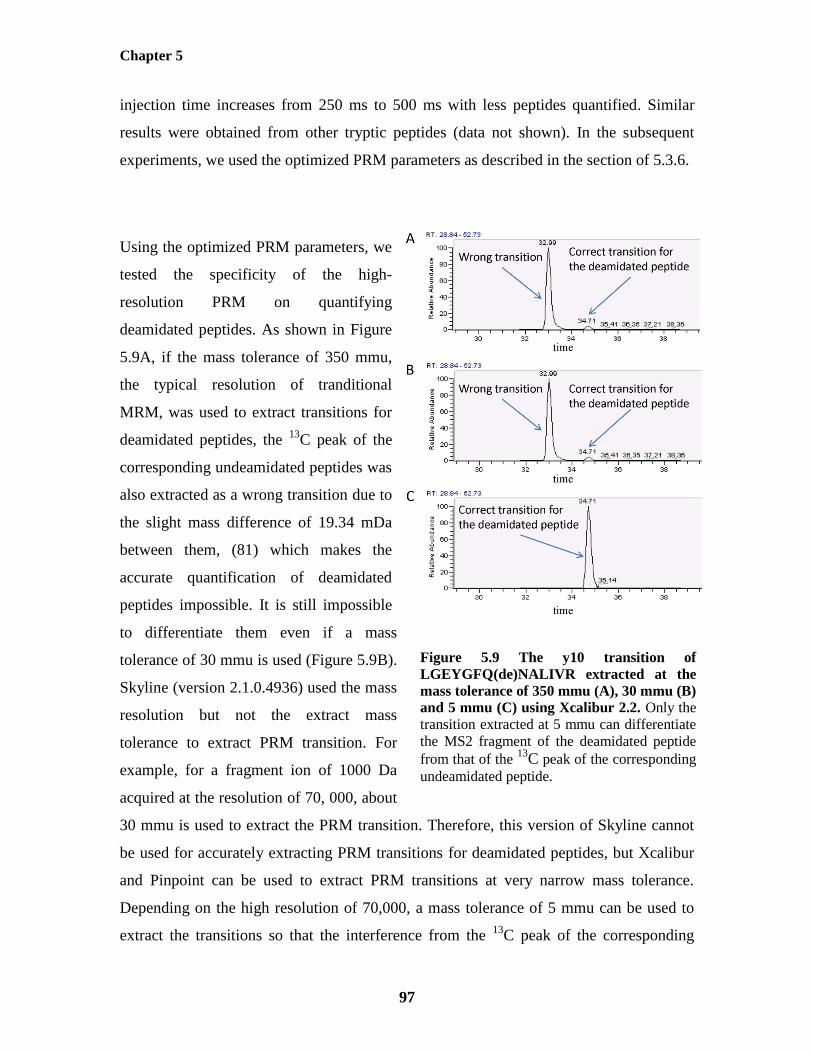
Chapter 5
97
Figure 5.9 The y10 transition of
LGEYGFQ(de)NALIVR extracted at the
mass tolerance of 350 mmu (A), 30 mmu (B)
and 5 mmu (C) using Xcalibur 2.2. Only the
transition extracted at 5 mmu can differentiate
the MS2 fragment of the deamidated peptide
from that of the 13
C peak of the corresponding
undeamidated peptide.
injection time increases from 250 ms to 500 ms with less peptides quantified. Similar
results were obtained from other tryptic peptides (data not shown). In the subsequent
experiments, we used the optimized PRM parameters as described in the section of 5.3.6.
Using the optimized PRM parameters, we
tested the specificity of the high-
resolution PRM on quantifying
deamidated peptides. As shown in Figure
5.9A, if the mass tolerance of 350 mmu,
the typical resolution of tranditional
MRM, was used to extract transitions for
deamidated peptides, the 13
C peak of the
corresponding undeamidated peptides was
also extracted as a wrong transition due to
the slight mass difference of 19.34 mDa
between them, (81) which makes the
accurate quantification of deamidated
peptides impossible. It is still impossible
to differentiate them even if a mass
tolerance of 30 mmu is used (Figure 5.9B).
Skyline (version 2.1.0.4936) used the mass
resolution but not the extract mass
tolerance to extract PRM transition. For
example, for a fragment ion of 1000 Da
acquired at the resolution of 70, 000, about
30 mmu is used to extract the PRM transition. Therefore, this version of Skyline cannot
be used for accurately extracting PRM transitions for deamidated peptides, but Xcalibur
and Pinpoint can be used to extract PRM transitions at very narrow mass tolerance.
Depending on the high resolution of 70,000, a mass tolerance of 5 mmu can be used to
extract the transitions so that the interference from the 13
C peak of the corresponding
Chapter 5
98
undeamidated peptides disappears completely (Figure 5.9C), which in turn leads to the
accurate quantification of deamidated peptides. (28, 176) Since protein deamidation
occurs spontaneously either in vivo or in vitro and generally produces a mixture of
undeamidated and deamidated products, it is necessary to differentiate them using high-
resolution PRM for accurate quantification of protein deamidation.
5.4.6.2 Selection and Refinement of Biomarker Candidates of Proteins and
Deamidated Peptides for PRM Validation
We first used a relative low resolution of 17,500 and a time window to 25-29 min to
conduct preliminary PRM on a large number of deamidated peptides and unmodified
peptides from biomarker candidates, and then fine-tuned the PRM inclusion list by
removing those with weak signals and determining the accurate elution time of target
peptides. The refinement of PRM targets was done using pooled samples. Finally,
dynamic PRM would be applied to both pooled samples and each individual sample
using a resolution of 70,000 and a narrow time window of 5 min to ensure high mass
accuracy of PRM transitions and monitor as many peptides as possible.
As discussed in the section of 5.4.5.2, the deamidated peptides of APOB, MFGE8,
PGK1, TIMP1 and TIMP3 identified from the pooled samples in label-free experiments
were selected as targets for PRM validation. Two to four unmodified peptides from each
of these 5 proteins were also monitored to compare the difference between protein
expression and deamidation. Since many more peptides can be quantified simultaneously
in a single PRM experiment, we also selected other biomarker candidates which were up-
regulated in the pooled test samples from label-free quantification as the targets for PRM.
For example, some existing or potential biomarkers for unstable plaques, such as MPO,
MMP7, MMP9, MMP12, FGB and FGG, were quantified using PRM. These biomarker
candidates are not only indicators of unstable plaques, but also play an important role in
the occurrence of cardiovascular and/or cerebrovascular events. Increasing evidence
Chapter 5
99
indicates that MMPs are overproduced in the rupture-prone regions of atherosclerotic
plaques and are closely related to plaque instability and consequent cardiovascular
events. (177-180) The proteolytic activity of MMPs results in the rupture of plaques by
destroying extracellular matrix and fibrous cap. MPO may work together with MMPs to
degrade the collagen layer of atheroma, resulting in the instability and rupture of
plaques.(181, 182) Since the instability of plaques was also the major cause for a
secondary cerebrovascular event, these biomarkers for unstable plaques may also be
valuable in predicting secondary cerebrovascular events.
In addition to the above-mentioned known biomarker candidates, we selected some novel
biomarker candidates that were up-regulated in the pooled test samples from label-free
quantification and were also considerably involved in the development and progression
of atherosclerosis for PRM validation, such as ITGAM, PLTP, WISP2, CTSF and
VCAM1. Studies in mouse models indicate that overexpression of PLTP (phospho-lipid
transfer protein) accelerates the development of atherosclerosis by increasing hepatic
VLDL level, decreasing plasma HDL levels and affecting the anti-inflammatory and
antioxidative properties of HDL. (183-186) CTSF was found to expressed in human
atherosclerotic lesions and modify low density lipoprotein particles in vitro. (187)
VCAM1 was up-regulated at atherosclerosis-prone sites on the endothelium, and it
promotes monocyte accumulation in the arterial intima in mouse models during the
course of atherogenesis. (157, 188) To normalize the possible difference in sample
preparation, loading amount and LC-MS/MS ionization efficiency, VCL and AKAP12
were selected as control proteins for PRM as its expression shows no significant
difference between the pooled test samples and the pooled control samples. The complete
list of biomarker candidates for PRM validation in each individual sample is shown in
Table 5.2 and Table 5.3.
5.4.6.3 Application of PRM to the Validation of the Biomarker Candidates in Pooled
Plaque Samples
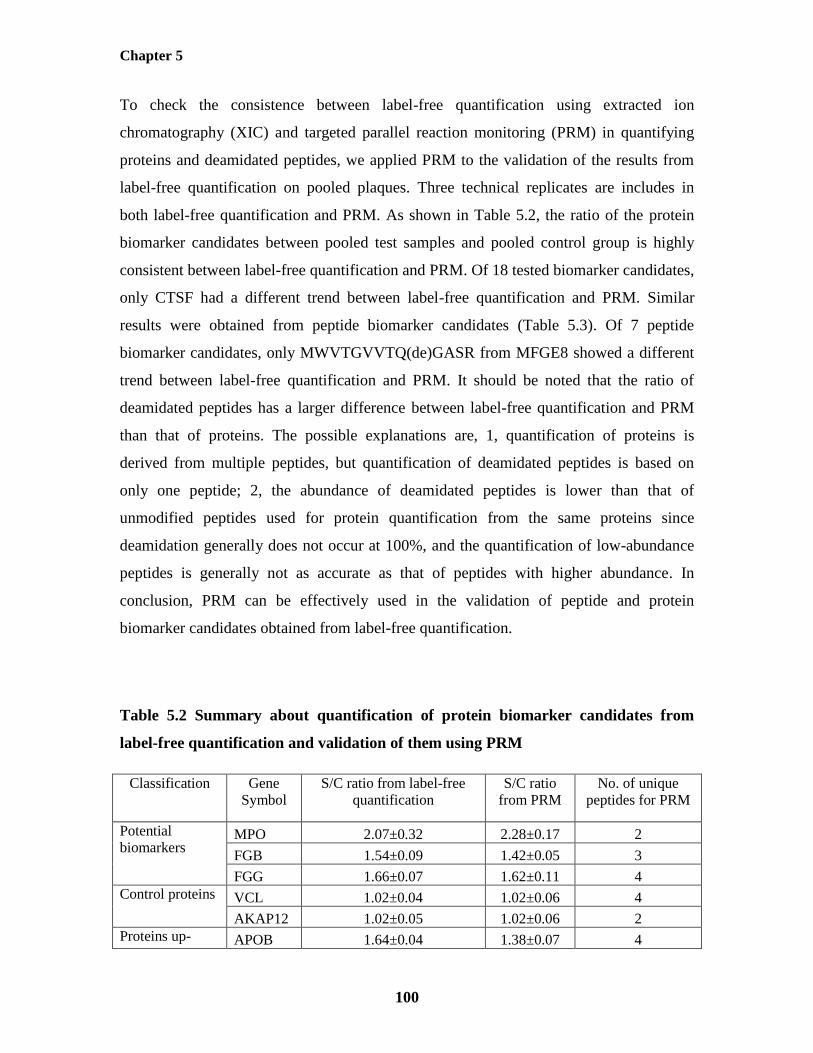
Chapter 5
100
To check the consistence between label-free quantification using extracted ion
chromatography (XIC) and targeted parallel reaction monitoring (PRM) in quantifying
proteins and deamidated peptides, we applied PRM to the validation of the results from
label-free quantification on pooled plaques. Three technical replicates are includes in
both label-free quantification and PRM. As shown in Table 5.2, the ratio of the protein
biomarker candidates between pooled test samples and pooled control group is highly
consistent between label-free quantification and PRM. Of 18 tested biomarker candidates,
only CTSF had a different trend between label-free quantification and PRM. Similar
results were obtained from peptide biomarker candidates (Table 5.3). Of 7 peptide
biomarker candidates, only MWVTGVVTQ(de)GASR from MFGE8 showed a different
trend between label-free quantification and PRM. It should be noted that the ratio of
deamidated peptides has a larger difference between label-free quantification and PRM
than that of proteins. The possible explanations are, 1, quantification of proteins is
derived from multiple peptides, but quantification of deamidated peptides is based on
only one peptide; 2, the abundance of deamidated peptides is lower than that of
unmodified peptides used for protein quantification from the same proteins since
deamidation generally does not occur at 100%, and the quantification of low-abundance
peptides is generally not as accurate as that of peptides with higher abundance. In
conclusion, PRM can be effectively used in the validation of peptide and protein
biomarker candidates obtained from label-free quantification.
Table 5.2 Summary about quantification of protein biomarker candidates from
label-free quantification and validation of them using PRM
Classification Gene
Symbol
S/C ratio from label-free
quantification
S/C ratio
from PRM
No. of unique
peptides for PRM
Potential
biomarkers
MPO 2.07±0.32 2.28±0.17 2
FGB 1.54±0.09 1.42±0.05 3
FGG 1.66±0.07 1.62±0.11 4
Control proteins VCL 1.02±0.04 1.02±0.06 4
AKAP12 1.02±0.05 1.02±0.06 2
Proteins up- APOB 1.64±0.04 1.38±0.07 4
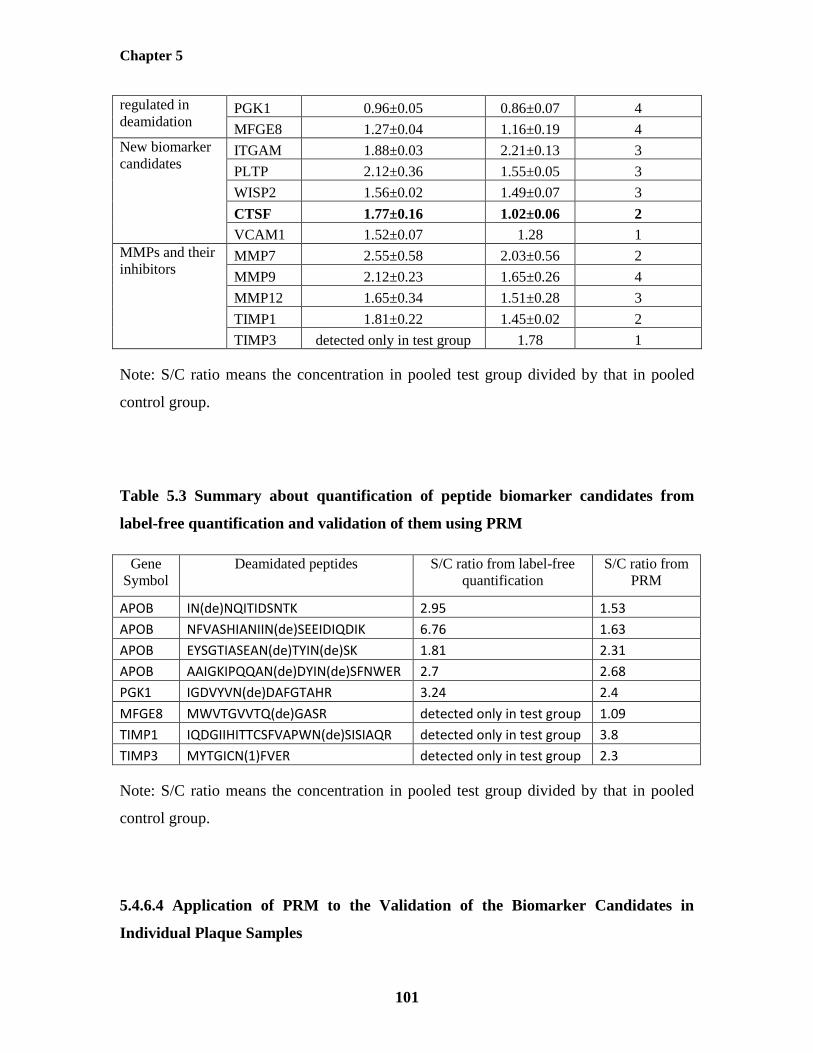
Chapter 5
101
regulated in
deamidation PGK1 0.96±0.05 0.86±0.07 4
MFGE8 1.27±0.04 1.16±0.19 4
New biomarker
candidates ITGAM 1.88±0.03 2.21±0.13 3
PLTP 2.12±0.36 1.55±0.05 3
WISP2 1.56±0.02 1.49±0.07 3
CTSF 1.77±0.16 1.02±0.06 2
VCAM1 1.52±0.07 1.28 1
MMPs and their
inhibitors
MMP7 2.55±0.58 2.03±0.56 2
MMP9 2.12±0.23 1.65±0.26 4
MMP12 1.65±0.34 1.51±0.28 3
TIMP1 1.81±0.22 1.45±0.02 2
TIMP3 detected only in test group 1.78 1
Note: S/C ratio means the concentration in pooled test group divided by that in pooled
control group.
Table 5.3 Summary about quantification of peptide biomarker candidates from
label-free quantification and validation of them using PRM
Gene
Symbol
Deamidated peptides S/C ratio from label-free
quantification
S/C ratio from
PRM
APOB IN(de)NQITIDSNTK 2.95 1.53
APOB NFVASHIANIIN(de)SEEIDIQDIK 6.76 1.63
APOB EYSGTIASEAN(de)TYIN(de)SK 1.81 2.31
APOB AAIGKIPQQAN(de)DYIN(de)SFNWER 2.7 2.68
PGK1 IGDVYVN(de)DAFGTAHR 3.24 2.4
MFGE8 MWVTGVVTQ(de)GASR detected only in test group 1.09
TIMP1 IQDGIIHITTCSFVAPWN(de)SISIAQR detected only in test group 3.8
TIMP3 MYTGICN(1)FVER detected only in test group 2.3
Note: S/C ratio means the concentration in pooled test group divided by that in pooled
control group.
5.4.6.4 Application of PRM to the Validation of the Biomarker Candidates in
Individual Plaque Samples

Chapter 5
102
Figure 5.10 The concentration of VCL (A)
and AKAP12 (B) in all individual patients
with or without secondary events. They
cannot be used for normalization of PRM due
to the large individual variation.
To determine the applicability of the
protein and peptide biomarker candidates
for predicting secondary cerebrovascular
events, PRM is used to validate them in
each individual plaque. As discussed in
the section of 5.4.6.2, we proposed to use
VCL and AKAP12 for normalization of
PRM data for each individual sample.
However, as shown in Figure 5.10, their
concentration in each individual sample
shows very large variations even if the
average ratio of VCL and AKAP12
between patients with/without secondary
cerebrovascular events is 1.05 for PRM
data. Therefore, they cannot be used for
normalization of PRM data. The
commonly used housekeeping proteins for
normalization in western blotting are also
reported to be unusable in some
diseases.(189) However, we found that the
total area of the LC- MS/MS base peak for
each individual plaque could be used to normalize PRM data to minimize the difference
in trypsin digestion, sample loading amount, ionization efficiency, and so on. The
underlying principle is that PRM collected many more ions than its targets with the
isolation window of 2 Th and the AGC target of 1E6, and the total intensity of all these
ions is identical for each plaque sample if all of the factors, including but not limited to
trypsin digestion, sample loading amount and ionization efficiency, are the same.
Similarly, the total loading amount is used as a control in fluorescent western
blotting.(190)
After the peak area of all transitions for each protein is integrated and added together
using Pinpoint 1.3 and normalized based on the total area of their LC-MS/MS base peaks,
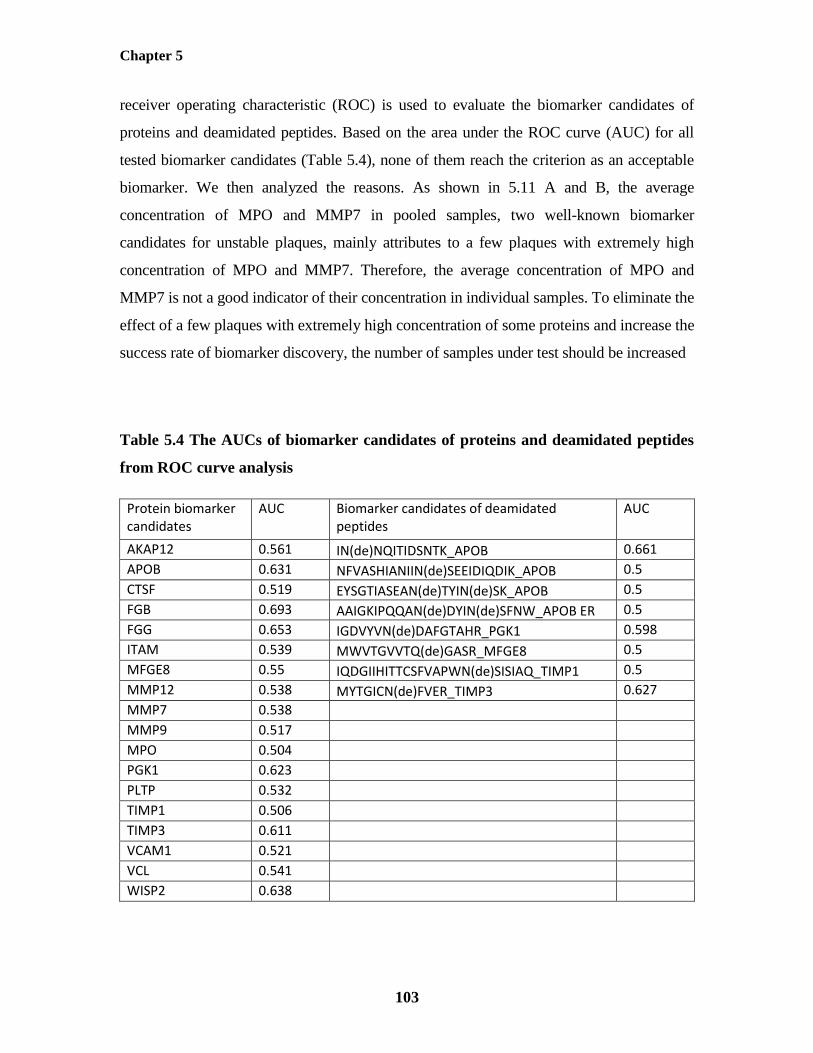
Chapter 5
103
receiver operating characteristic (ROC) is used to evaluate the biomarker candidates of
proteins and deamidated peptides. Based on the area under the ROC curve (AUC) for all
tested biomarker candidates (Table 5.4), none of them reach the criterion as an acceptable
biomarker. We then analyzed the reasons. As shown in 5.11 A and B, the average
concentration of MPO and MMP7 in pooled samples, two well-known biomarker
candidates for unstable plaques, mainly attributes to a few plaques with extremely high
concentration of MPO and MMP7. Therefore, the average concentration of MPO and
MMP7 is not a good indicator of their concentration in individual samples. To eliminate the
effect of a few plaques with extremely high concentration of some proteins and increase the
success rate of biomarker discovery, the number of samples under test should be increased
Table 5.4 The AUCs of biomarker candidates of proteins and deamidated peptides
from ROC curve analysis
Protein biomarker candidates
AUC Biomarker candidates of deamidated peptides
AUC
AKAP12 0.561 IN(de)NQITIDSNTK_APOB 0.661
APOB 0.631 NFVASHIANIIN(de)SEEIDIQDIK_APOB 0.5
CTSF 0.519 EYSGTIASEAN(de)TYIN(de)SK_APOB 0.5
FGB 0.693 AAIGKIPQQAN(de)DYIN(de)SFNW_APOB ER 0.5
FGG 0.653 IGDVYVN(de)DAFGTAHR_PGK1 0.598
ITAM 0.539 MWVTGVVTQ(de)GASR_MFGE8 0.5
MFGE8 0.55 IQDGIIHITTCSFVAPWN(de)SISIAQ_TIMP1 0.5
MMP12 0.538 MYTGICN(de)FVER_TIMP3 0.627
MMP7 0.538
MMP9 0.517
MPO 0.504
PGK1 0.623
PLTP 0.532
TIMP1 0.506
TIMP3 0.611
VCAM1 0.521
VCL 0.541
WISP2 0.638
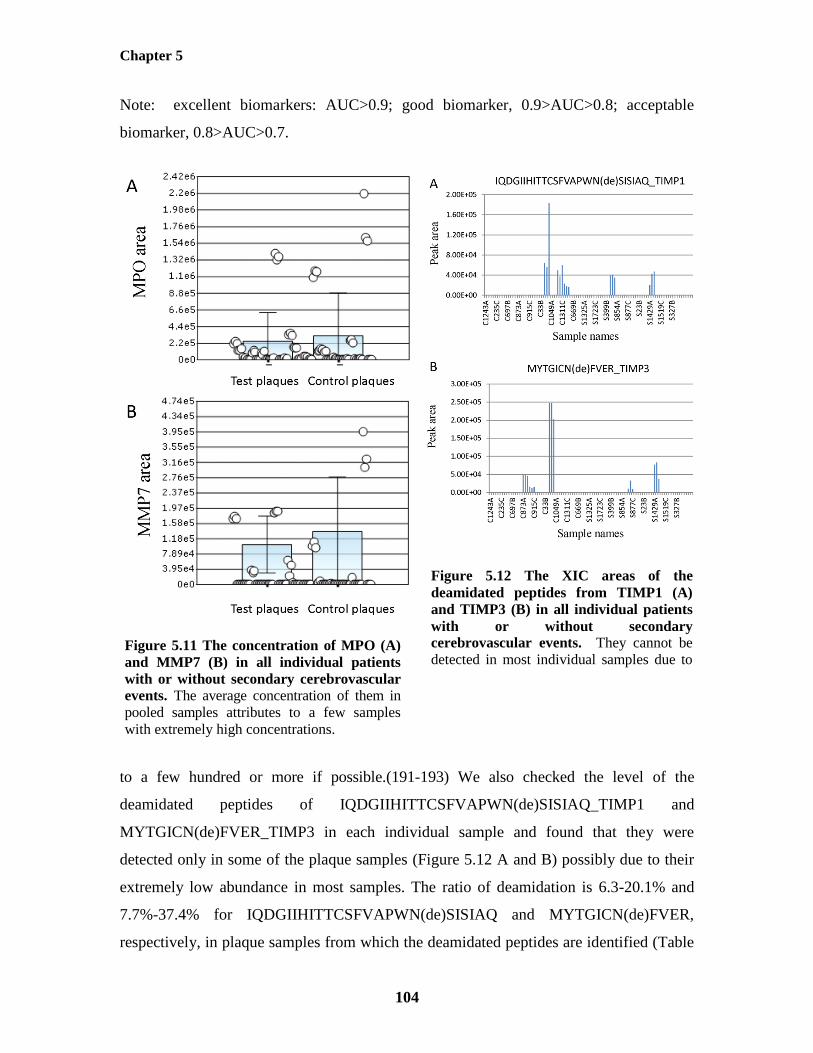
Chapter 5
104
Figure 5.11 The concentration of MPO (A)
and MMP7 (B) in all individual patients
with or without secondary cerebrovascular
events. The average concentration of them in
pooled samples attributes to a few samples
with extremely high concentrations.
Figure 5.12 The XIC areas of the
deamidated peptides from TIMP1 (A)
and TIMP3 (B) in all individual patients
with or without secondary
cerebrovascular events. They cannot be
detected in most individual samples due to
their low abundance.
Note: excellent biomarkers: AUC>0.9; good biomarker, 0.9>AUC>0.8; acceptable
biomarker, 0.8>AUC>0.7.
to a few hundred or more if possible.(191-193) We also checked the level of the
deamidated peptides of IQDGIIHITTCSFVAPWN(de)SISIAQ_TIMP1 and
MYTGICN(de)FVER_TIMP3 in each individual sample and found that they were
detected only in some of the plaque samples (Figure 5.12 A and B) possibly due to their
extremely low abundance in most samples. The ratio of deamidation is 6.3-20.1% and
7.7%-37.4% for IQDGIIHITTCSFVAPWN(de)SISIAQ and MYTGICN(de)FVER,
respectively, in plaque samples from which the deamidated peptides are identified (Table
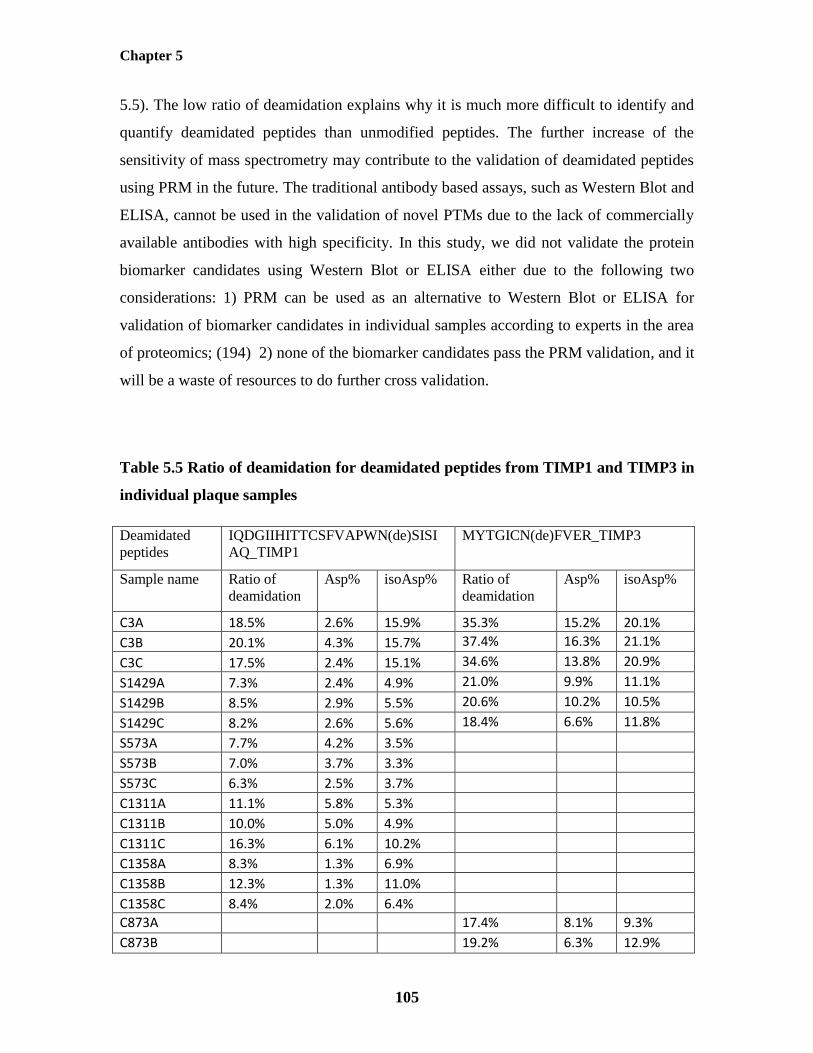
Chapter 5
105
5.5). The low ratio of deamidation explains why it is much more difficult to identify and
quantify deamidated peptides than unmodified peptides. The further increase of the
sensitivity of mass spectrometry may contribute to the validation of deamidated peptides
using PRM in the future. The traditional antibody based assays, such as Western Blot and
ELISA, cannot be used in the validation of novel PTMs due to the lack of commercially
available antibodies with high specificity. In this study, we did not validate the protein
biomarker candidates using Western Blot or ELISA either due to the following two
considerations: 1) PRM can be used as an alternative to Western Blot or ELISA for
validation of biomarker candidates in individual samples according to experts in the area
of proteomics; (194) 2) none of the biomarker candidates pass the PRM validation, and it
will be a waste of resources to do further cross validation.
Table 5.5 Ratio of deamidation for deamidated peptides from TIMP1 and TIMP3 in
individual plaque samples
Deamidated
peptides
IQDGIIHITTCSFVAPWN(de)SISI
AQ_TIMP1
MYTGICN(de)FVER_TIMP3
Sample name Ratio of
deamidation
Asp% isoAsp% Ratio of
deamidation
Asp% isoAsp%
C3A 18.5% 2.6% 15.9% 35.3% 15.2% 20.1%
C3B 20.1% 4.3% 15.7% 37.4% 16.3% 21.1%
C3C 17.5% 2.4% 15.1% 34.6% 13.8% 20.9%
S1429A 7.3% 2.4% 4.9% 21.0% 9.9% 11.1%
S1429B 8.5% 2.9% 5.5% 20.6% 10.2% 10.5%
S1429C 8.2% 2.6% 5.6% 18.4% 6.6% 11.8%
S573A 7.7% 4.2% 3.5%
S573B 7.0% 3.7% 3.3%
S573C 6.3% 2.5% 3.7%
C1311A 11.1% 5.8% 5.3%
C1311B 10.0% 5.0% 4.9%
C1311C 16.3% 6.1% 10.2%
C1358A 8.3% 1.3% 6.9%
C1358B 12.3% 1.3% 11.0%
C1358C 8.4% 2.0% 6.4%
C873A 17.4% 8.1% 9.3%
C873B 19.2% 6.3% 12.9%
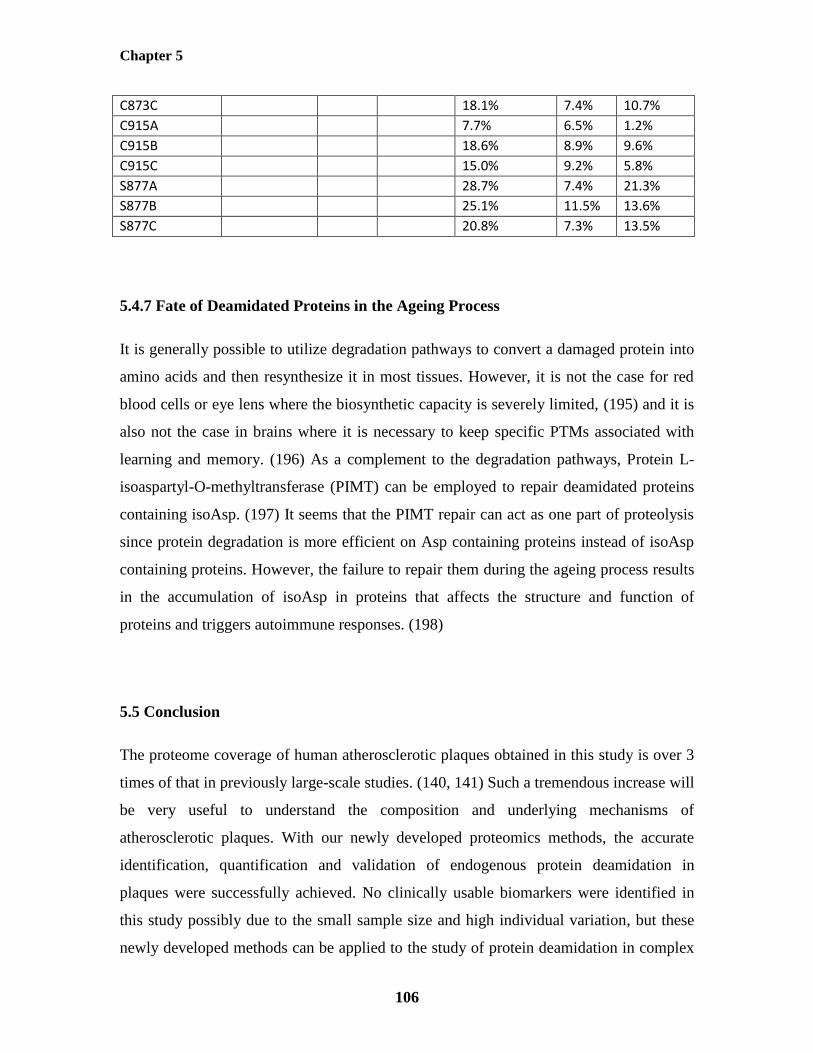
Chapter 5
106
C873C 18.1% 7.4% 10.7%
C915A 7.7% 6.5% 1.2%
C915B 18.6% 8.9% 9.6%
C915C 15.0% 9.2% 5.8%
S877A 28.7% 7.4% 21.3%
S877B 25.1% 11.5% 13.6%
S877C 20.8% 7.3% 13.5%
5.4.7 Fate of Deamidated Proteins in the Ageing Process
It is generally possible to utilize degradation pathways to convert a damaged protein into
amino acids and then resynthesize it in most tissues. However, it is not the case for red
blood cells or eye lens where the biosynthetic capacity is severely limited, (195) and it is
also not the case in brains where it is necessary to keep specific PTMs associated with
learning and memory. (196) As a complement to the degradation pathways, Protein L-
isoaspartyl-O-methyltransferase (PIMT) can be employed to repair deamidated proteins
containing isoAsp. (197) It seems that the PIMT repair can act as one part of proteolysis
since protein degradation is more efficient on Asp containing proteins instead of isoAsp
containing proteins. However, the failure to repair them during the ageing process results
in the accumulation of isoAsp in proteins that affects the structure and function of
proteins and triggers autoimmune responses. (198)
5.5 Conclusion
The proteome coverage of human atherosclerotic plaques obtained in this study is over 3
times of that in previously large-scale studies. (140, 141) Such a tremendous increase will
be very useful to understand the composition and underlying mechanisms of
atherosclerotic plaques. With our newly developed proteomics methods, the accurate
identification, quantification and validation of endogenous protein deamidation in
plaques were successfully achieved. No clinically usable biomarkers were identified in
this study possibly due to the small sample size and high individual variation, but these
newly developed methods can be applied to the study of protein deamidation in complex
Chapter 5
107
samples for biomarker discovery and mechanism studies in the future. The further
improvement in the sensitivity of PRM will contribute to the validation of peptide
biomarker candidates in complex samples.
.

Chapter 6
108
Chapter 6
6 Conclusion and future perspective
Chapter 6
109
6.1 Conclusion and future perspective
Protein deamidation occurs nonenzymatically both in vivo and in vitro with the
conversion of asparagine and glutamine into aspartic acid and glutamic acid, respectively.
Endogenous deamidation has been reported to be related to aging and many diseases. In
vitro deamidation results in the degradation of antibodies during inappropriate storage.
LC-MS/MS is the method of choice for large-scale characterization of deamidation due to
its high sensitivity, speed and specificity of detection. As a less studied PTM, there are
still many technical challenges in studying protein deamidation using large-scale
proteomic methods. Database search returns the identification of many false positive
deamidated peptides due to the slight mass difference of 19.34 mDa between deamidated
peptides and the 13
C peaks of their unmodified counterparts. Since deamidation occurs
readily under the typical conditions of trypsin digestion, artificial deamidation may
prevent the accurate identification and quantification of endogenous deamidation. Now, it
is still very challenging to distinguish between the isomeric n-Asp and isoAsp
deamidation products using large-scale proteomics methods because of their identical
composition, mass and charge (Figure 1.1). The quantification of deamidated peptides
cannot be validated using either ELISA or MRM. In this thesis, in order to overcome
these obvious challenges, novel proteomic methods were developed and applied to the
study of protein deamidation in human carotid atherosclerotic plaques from old patients
for predicting secondary cerebrovascular events.
In Chapter 2, we developed a data analysis strategy to minimize the false positive
identification of deamidated peptides from database searches by using the mass
difference of 19.34 mDa between deamidated peptides and the 13
C peaks of their
unmodified counterparts as a cutoff. Evaluation of 5 groups of proteomic data indicated
that nonenzymatic Asn deamidation occurred on 4-9% of all peptides and resulted in the
identification of many false positive N-glycosylation sites. The mild alkaline pH of the
digestion buffer and prolonged incubation at 37ºC were proven to be the major causes of
nonenzymatic Asn deamidation during proteomic sample preparations according to a
Chapter 6
110
comprehensive study of many potential factors. Therefore, an improved protocol of
trypsin digestion at pH 6 and deglycosylation at pH 5 was proposed and validated, and
significant decrease of nonenzymatic Asn deamidation was achieved without affecting
protein and peptide identification. We also identified the sequence motifs for glutamine
deamidation, i.e. -Q-V-, -Q-L-, -Q-G-, -Q-A- and -Q-E-. It should be noted that artificial
deamidation due to sample preparation cannot be avoided completely even with the
improved protocol. In the future, H218
O can also be used during PNGase F treatment in
the improved protocol to further reduce the false positive identification of N-
glycopeptides.
Because of the differences between in-gel and in-solution trypsin digestion, it is
necessary to conduct a comprehensive evaluation on in-solution digestion before widely
applying the sample preparation protocol developed in chapter 2 to proteomics studies.
To evaluate the effect of trypsin digestion buffers on artificial deamidation and protein &
peptide identification, we compared the commonly used buffers of Tris-HCl (pH 8),
ammonium bicarbonate (ABB) and triethylammonium bicarbonate (TEAB), and
ammonium acetate (pH 6) as developed in chapter 3. Both iTRAQ quantification and
label-free results indicates that artificial Asn deamidation is produced in the order of
ammonium acetate<Tris-HCl<ABB<TEAB, and Gln deamidation has no significant
differences among all tested buffers. Determination of the half-time of Asn deamidation
in the four buffers using synthetic peptides further validates the conclusion. Label-free
experiments showed that protein and unique peptide identification is comparable during
using these four buffers. However, targeted MRM or PRM validation may be used with
caution while using Tris-HCl or ammonium acetate (pH 6) as digestion buffers due to the
increase of tryptic miscleavages, i.e. the control and samples being digested under
completely same conditions. In conclusion, the commonly used tryspin digestion buffers
of ABB and TEAB are not suitable for studying Asn deamidation and N-glycosylation,
but Tris-HCl may be used if trypsin digestion has to be done at around pH 8; Ammonium
acetate (pH 6) is more suitable than other tested buffers for studying endogenous
deamidation and N-glycosylation.
Chapter 6
111
In chapter 4, we proposed and validated a novel RP-ERLIC-MS/MS strategy for
proteome-scale study of the triads of deamidation products. Protein Asn deamidation
produces the mixture of protein isoforms containing asparaginyl, n-aspartyl and
isoaspartyl residues at the deamidation sites, which results in function loss and protein
degradation. The identification and quantification of these deamidation products are
crucial to evaluate its biological effects, but it is difficult to distinguish between the
isomeric n-Asp and isoAsp deamidation products in a proteome-wide analysis because of
their similar physicochemical properties. The widely used RPLC-MS/MS cannot be
effectively used in the separation and characterization of the structural isomers of
deamidated peptides due to their identical polarities, but the newly introduced ERLIC is
proven to separate them well based on their different pI. The RP-ERLIC-MS/MS method
is featured by the use of offline RPLC in the first dimensional separation and the online
coupling of electrostatic repulsion-hydrophilic interaction chromatography (ERLIC) to
tandem MS. The three deamidation products from the same peptides are to be co-eluted
and thus collected in the same fraction in offline RPLC. In the 2nd dimension of ERILC-
MS/MS, they are separated according to their pI values, facilitating the identification and
quantification of them using MS/MS. The co-elution of them in RPLC, the excellent
separation of them in ERLIC and the performance of ERLIC-MS/MS were validated
using synthetic peptides, simple tryptic digests and rat liver digests. The sensitivity of
ERLIC-MS/MS still needs to be further improved before it can be used in characterizing
low-abundance deamidated peptides from complex samples. For more reliable
identification of isoAsp deamidation products, RP-ERLIC may be coupled to ECD or
ETD in the future. RP-ERLIC may also be used for the analysis of whole proteome
because of its remarkable resolution and compatibility with mass spectrometry.
Human carotid atherosclerotic plaques from old patients are good samples to test the
applicability of our newly developed proteomic methods for studying deamidation since
protein deamidation accumulates progressively with ages. In chapter 5, our newly
developed proteomics methods as detailed in previous chapters were employed to ensure
the accurate and reliable characterization of endogenous protein deamidation. With the
Chapter 6
112
latest proteomics technologies, the proteome coverage of human atherosclerotic plaques
obtained in this study is over 3 times of that in previously large-scale studies. (140, 141)
A total of 3846 proteins were identified with at least 2 unique peptides from
atherosclerotic plaques, and many low-abundance proteins with important functions in
atherosclerosis were identified confidently using mass spectrometry for the first time.
Such a tremendous increase will be very useful to understand the composition and
underlying mechanisms of atherosclerotic plaques. Label-free quantification on pooled
plaques from patients with/without secondary cerebrovascular events identified many up-
regulated proteins and deamidated peptides that were either known biomarkers for
unstable plaques or closely related to the initiation and progression of atherosclerosis as
biomarker candidates. These candidates were then evaluated in 38 individual samples
using PRM for predicting secondary cerebrovascular events after the applicability of
PRM for validation of deamidated peptides was proven using simple tryptic digests. With
our newly developed proteomics methods, the accurate identification, quantification and
validation of endogenous protein deamidation in plaques were successfully achieved. No
clinically usable biomarkers were identified in this study possibly due to the small sample
size and high individual variation, but these newly developed methods can be applied to
the accurate characterization of protein deamidation in complex samples for biomarker
discovery and mechanism studies in the future. The further improvement in the
sensitivity of PRM will contribute to the validation of peptide biomarker candidates in
complex samples.

References
113
References
References
114
1. James, P. (1997) Protein identification in the post-genome era: the rapid rise of
proteomics. Q Rev Biophys 30, 279-331.
2. Wilkins, M. R., Pasquali, C., Appel, R. D., Ou, K., Golaz, O., Sanchez, J. C., Yan,
J. X., Gooley, A. A., Hughes, G., Humphery-Smith, I., Williams, K. L., and Hochstrasser,
D. F. (1996) From proteins to proteomes: large scale protein identification by two-
dimensional electrophoresis and amino acid analysis. Biotechnology (N Y) 14, 61-65.
3. Wasinger, V. C., Cordwell, S. J., Cerpa-Poljak, A., Yan, J. X., Gooley, A. A.,
Wilkins, M. R., Duncan, M. W., Harris, R., Williams, K. L., and Humphery-Smith, I.
(1995) Progress with gene-product mapping of the Mollicutes: Mycoplasma genitalium.
Electrophoresis 16, 1090-1094.
4. Cottrell, J. S. (2011) Protein identification using MS/MS data. J Proteomics 74,
1842-1851.
5. Dancik, V., Addona, T. A., Clauser, K. R., Vath, J. E., and Pevzner, P. A. (1999)
De novo peptide sequencing via tandem mass spectrometry. J Comput Biol 6, 327-342.
6. Bandeira, N., Pham, V., Pevzner, P., Arnott, D., and Lill, J. R. (2008) Automated
de novo protein sequencing of monoclonal antibodies. Nat Biotechnol 26, 1336-1338.
7. Gygi, S. P., Rochon, Y., Franza, B. R., and Aebersold, R. (1999) Correlation
between protein and mRNA abundance in yeast. Mol Cell Biol 19, 1720-1730.
8. Mann, M., and Jensen, O. N. (2003) Proteomic analysis of post-translational
modifications. Nat Biotechnol 21, 255-261.
9. Parker, K. C., Garrels, J. I., Hines, W., Butler, E. M., McKee, A. H., Patterson, D.,
and Martin, S. (1998) Identification of yeast proteins from two-dimensional gels:
working out spot cross-contamination. Electrophoresis 19, 1920-1932.
References
115
10. Eymann, C., Dreisbach, A., Albrecht, D., Bernhardt, J., Becher, D., Gentner, S.,
Tam le, T., Buttner, K., Buurman, G., Scharf, C., Venz, S., Volker, U., and Hecker, M.
(2004) A comprehensive proteome map of growing Bacillus subtilis cells. Proteomics 4,
2849-2876.
11. Wilkins, M. R., Gasteiger, E., Sanchez, J. C., Bairoch, A., and Hochstrasser, D. F.
(1998) Two-dimensional gel electrophoresis for proteome projects: the effects of protein
hydrophobicity and copy number. Electrophoresis 19, 1501-1505.
12. Wolters, D. A., Washburn, M. P., and Yates, J. R., 3rd (2001) An automated
multidimensional protein identification technology for shotgun proteomics. Anal Chem
73, 5683-5690.
13. Yates, J. R., 3rd (1998) Mass spectrometry and the age of the proteome. J Mass
Spectrom 33, 1-19.
14. Fang, X., Balgley, B. M., Wang, W., Park, D. M., and Lee, C. S. (2009)
Comparison of multidimensional shotgun technologies targeting tissue proteomics.
Electrophoresis 30, 4063-4070.
15. Sandra, K., Moshir, M., D'Hondt, F., Tuytten, R., Verleysen, K., Kas, K., Francois,
I., and Sandra, P. (2009) Highly efficient peptide separations in proteomics. Part 2: bi-
and multidimensional liquid-based separation techniques. J Chromatogr B Analyt
Technol Biomed Life Sci 877, 1019-1039.
16. Pirmoradian, M., Budamgunta, H., Chingin, K., Zhang, B., Astorga-Wells, J., and
Zubarev, R. A. (2013) Rapid and deep human proteome analysis by single-dimension
shotgun proteomics. Mol Cell Proteomics 12, 3330-3338.
17. Hebert, A. S., Richards, A. L., Bailey, D. J., Ulbrich, A., Coughlin, E. E.,
Westphall, M. S., and Coon, J. J. (2014) The one hour yeast proteome. Mol Cell
Proteomics 13, 339-347.
References
116
18. Geiger, T., Wehner, A., Schaab, C., Cox, J., and Mann, M. (2012) Comparative
proteomic analysis of eleven common cell lines reveals ubiquitous but varying expression
of most proteins. Mol Cell Proteomics 11, M111 014050.
19. Bantscheff, M., Schirle, M., Sweetman, G., Rick, J., and Kuster, B. (2007)
Quantitative mass spectrometry in proteomics: a critical review. Anal Bioanal Chem 389,
1017-1031.
20. Ong, S. E., Blagoev, B., Kratchmarova, I., Kristensen, D. B., Steen, H., Pandey,
A., and Mann, M. (2002) Stable isotope labeling by amino acids in cell culture, SILAC,
as a simple and accurate approach to expression proteomics. Mol Cell Proteomics 1, 376-
386.
21. Gygi, S. P., Rist, B., Gerber, S. A., Turecek, F., Gelb, M. H., and Aebersold, R.
(1999) Quantitative analysis of complex protein mixtures using isotope-coded affinity
tags. Nat Biotechnol 17, 994-999.
22. Ross, P. L., Huang, Y. N., Marchese, J. N., Williamson, B., Parker, K., Hattan, S.,
Khainovski, N., Pillai, S., Dey, S., Daniels, S., Purkayastha, S., Juhasz, P., Martin, S.,
Bartlet-Jones, M., He, F., Jacobson, A., and Pappin, D. J. (2004) Multiplexed protein
quantitation in Saccharomyces cerevisiae using amine-reactive isobaric tagging reagents.
Mol Cell Proteomics 3, 1154-1169.
23. Elliott, M. H., Smith, D. S., Parker, C. E., and Borchers, C. (2009) Current trends
in quantitative proteomics. J Mass Spectrom 44, 1637-1660.
24. Fuzery, A. K., Levin, J., Chan, M. M., and Chan, D. W. (2013) Translation of
proteomic biomarkers into FDA approved cancer diagnostics: issues and challenges. Clin
Proteomics 10, 13.
25. Service, R. F. (2008) Proteomics. Will biomarkers take off at last? Science 321,
1760.
References
117
26. Picotti, P., and Aebersold, R. (2012) Selected reaction monitoring-based
proteomics: workflows, potential, pitfalls and future directions. Nat Methods 9, 555-566.
27. Schiess, R., Wollscheid, B., and Aebersold, R. (2009) Targeted proteomic strategy
for clinical biomarker discovery. Mol Oncol 3, 33-44.
28. Peterson, A. C., Russell, J. D., Bailey, D. J., Westphall, M. S., and Coon, J. J.
(2012) Parallel reaction monitoring for high resolution and high mass accuracy
quantitative, targeted proteomics. Mol Cell Proteomics 11, 1475-1488.
29. Jin, H., and Zangar, R. C. (2009) Protein modifications as potential biomarkers in
breast cancer. Biomark Insights 4, 191-200.
30. Martin, L., Latypova, X., and Terro, F. (2011) Post-translational modifications of
tau protein: implications for Alzheimer's disease. Neurochem Int 58, 458-471.
31. van Lummel, M., Duinkerken, G., van Veelen, P. A., de Ru, A., Cordfunke, R.,
Zaldumbide, A., Gomez-Tourino, I., Arif, S., Peakman, M., Drijfhout, J. W., and Roep,
B. O. (2014) Posttranslational modification of HLA-DQ binding islet autoantigens in
type 1 diabetes. Diabetes 63, 237-247.
32. Eom, G. H., and Kook, H. (2014) Posttranslational modifications of histone
deacetylases: Implications for cardiovascular diseases. Pharmacol Ther.
33. Pena-Altamira, L. E., Polazzi, E., and Monti, B. (2013) Histone post-translational
modifications in Huntington's and Parkinson's diseases. Curr Pharm Des 19, 5085-5092.
34. Jaisson, S., and Gillery, P. (2010) Evaluation of nonenzymatic posttranslational
modification-derived products as biomarkers of molecular aging of proteins. Clin Chem
56, 1401-1412.
References
118
35. Huttlin, E. L., Jedrychowski, M. P., Elias, J. E., Goswami, T., Rad, R., Beausoleil,
S. A., Villen, J., Haas, W., Sowa, M. E., and Gygi, S. P. (2010) A tissue-specific atlas of
mouse protein phosphorylation and expression. Cell 143, 1174-1189.
36. Kim, W., Bennett, E. J., Huttlin, E. L., Guo, A., Li, J., Possemato, A., Sowa, M. E.,
Rad, R., Rush, J., Comb, M. J., Harper, J. W., and Gygi, S. P. (2011) Systematic and
quantitative assessment of the ubiquitin-modified proteome. Mol Cell 44, 325-340.
37. Deeb, S. J., Cox, J., Schmidt-Supprian, M., and Mann, M. (2014) N-linked
glycosylation enrichment for in-depth cell surface proteomics of diffuse large B-cell
lymphoma subtypes. Mol Cell Proteomics 13, 240-251.
38. Burnett, G., and Kennedy, E. P. (1954) The enzymatic phosphorylation of proteins.
The Journal of biological chemistry 211, 969-980.
39. Hay, R. T. (2005) SUMO: a history of modification. Mol Cell 18, 1-12.
40. Pickart, C. M. (2001) Mechanisms underlying ubiquitination. Annual review of
biochemistry 70, 503-533.
41. Robinson, A. B., and Rudd, C. J. (1974) Deamidation of glutaminyl and
asparaginyl residues in peptides and proteins. Curr Top Cell Regul 8, 247-295.
42. Wang, Z., Nicholls, S. J., Rodriguez, E. R., Kummu, O., Horkko, S., Barnard, J.,
Reynolds, W. F., Topol, E. J., DiDonato, J. A., and Hazen, S. L. (2007) Protein
carbamylation links inflammation, smoking, uremia and atherogenesis. Nature medicine
13, 1176-1184.
43. Sevier, C. S., and Kaiser, C. A. (2002) Formation and transfer of disulphide bonds
in living cells. Nature reviews. Molecular cell biology 3, 836-847.
44. Hunter, T. (2000) Signaling--2000 and beyond. Cell 100, 113-127.
References
119
45. Gnad, F., de Godoy, L. M., Cox, J., Neuhauser, N., Ren, S., Olsen, J. V., and
Mann, M. (2009) High-accuracy identification and bioinformatic analysis of in vivo
protein phosphorylation sites in yeast. Proteomics 9, 4642-4652.
46. Pawson, T., and Nash, P. (2003) Assembly of cell regulatory systems through
protein interaction domains. Science 300, 445-452.
47. Morelle, W., Canis, K., Chirat, F., Faid, V., and Michalski, J. C. (2006) The use of
mass spectrometry for the proteomic analysis of glycosylation. Proteomics 6, 3993-4015.
48. Lu, J. P., Knezevic, A., Wang, Y. X., Rudan, I., Campbell, H., Zou, Z. K., Lan, J.,
Lai, Q. X., Wu, J. J., He, Y., Song, M. S., Zhang, L., Lauc, G., and Wang, W. (2011)
Screening novel biomarkers for metabolic syndrome by profiling human plasma N-
glycans in Chinese Han and Croatian populations. J Proteome Res 10, 4959-4969.
49. Dube, D. H., and Bertozzi, C. R. (2005) Glycans in cancer and inflammation--
potential for therapeutics and diagnostics. Nat Rev Drug Discov 4, 477-488.
50. Holst, S., Stavenhagen, K., Balog, C. I., Koeleman, C. A., McDonnell, L. M.,
Mayboroda, O. A., Verhoeven, A., Mesker, W. E., Tollenaar, R. A., Deelder, A. M., and
Wuhrer, M. (2013) Investigations on aberrant glycosylation of glycosphingolipids in
colorectal cancer tissues using liquid chromatography and matrix-assisted laser
desorption time-of-flight mass spectrometry (MALDI-TOF-MS). Mol Cell Proteomics
12, 3081-3093.
51. Glozak, M. A., Sengupta, N., Zhang, X., and Seto, E. (2005) Acetylation and
deacetylation of non-histone proteins. Gene 363, 15-23.
52. Yang, X. J., and Seto, E. (2008) Lysine acetylation: codified crosstalk with other
posttranslational modifications. Mol Cell 31, 449-461.
References
120
53. Mertins, P., Qiao, J. W., Patel, J., Udeshi, N. D., Clauser, K. R., Mani, D. R.,
Burgess, M. W., Gillette, M. A., Jaffe, J. D., and Carr, S. A. (2013) Integrated proteomic
analysis of post-translational modifications by serial enrichment. Nat Methods 10, 634-
637.
54. Liddy, K. A., White, M. Y., and Cordwell, S. J. (2013) Functional decorations:
post-translational modifications and heart disease delineated by targeted proteomics.
Genome Med 5, 20.
55. Schmid, A. W., Fauvet, B., Moniatte, M., and Lashuel, H. A. (2013) Alpha-
synuclein post-translational modifications as potential biomarkers for Parkinson disease
and other synucleinopathies. Mol Cell Proteomics 12, 3543-3558.
56. Dunne, J. L., Overbergh, L., Purcell, A. W., and Mathieu, C. (2012)
Posttranslational modifications of proteins in type 1 diabetes: the next step in finding the
cure? Diabetes 61, 1907-1914.
57. Rush, J., Moritz, A., Lee, K. A., Guo, A., Goss, V. L., Spek, E. J., Zhang, H., Zha,
X. M., Polakiewicz, R. D., and Comb, M. J. (2005) Immunoaffinity profiling of tyrosine
phosphorylation in cancer cells. Nat Biotechnol 23, 94-101.
58. Larsen, M. R., Thingholm, T. E., Jensen, O. N., Roepstorff, P., and Jorgensen, T. J.
(2005) Highly selective enrichment of phosphorylated peptides from peptide mixtures
using titanium dioxide microcolumns. Mol Cell Proteomics 4, 873-886.
59. Heo, S. H., Lee, S. J., Ryoo, H. M., Park, J. Y., and Cho, J. Y. (2007) Identification
of putative serum glycoprotein biomarkers for human lung adenocarcinoma by
multilectin affinity chromatography and LC-MS/MS. Proteomics 7, 4292-4302.
60. Lewandrowski, U., Zahedi, R. P., Moebius, J., Walter, U., and Sickmann, A.
(2007) Enhanced N-glycosylation site analysis of sialoglycopeptides by strong cation
References
121
exchange prefractionation applied to platelet plasma membranes. Mol Cell Proteomics 6,
1933-1941.
61. Calvano, C. D., Zambonin, C. G., and Jensen, O. N. (2008) Assessment of lectin
and HILIC based enrichment protocols for characterization of serum glycoproteins by
mass spectrometry. J Proteomics 71, 304-317.
62. Zhang, H., Guo, T., Li, X., Datta, A., Park, J. E., Yang, J., Lim, S. K., Tam, J. P.,
and Sze, S. K. (2010) Simultaneous characterization of glyco- and phosphoproteomes of
mouse brain membrane proteome with electrostatic repulsion hydrophilic interaction
chromatography. Mol Cell Proteomics 9, 635-647.
63. Cao, L., Yu, L., Guo, Z., Li, X., Xue, X., and Liang, X. (2013) Application of a
strong anion exchange material in electrostatic repulsion-hydrophilic interaction
chromatography for selective enrichment of glycopeptides. Journal of chromatography.
A 1299, 18-24.
64. Boilly, B., Lheureux, E., Boilly-Marer, Y., and Bart, A. (1990) Cell interactions
and regeneration control. The International journal of developmental biology 34, 219-
231.
65. Roher, A. E., Lowenson, J. D., Clarke, S., Wolkow, C., Wang, R., Cotter, R. J.,
Reardon, I. M., Zurcher-Neely, H. A., Heinrikson, R. L., Ball, M. J., and et al. (1993)
Structural alterations in the peptide backbone of beta-amyloid core protein may account
for its deposition and stability in Alzheimer's disease. The Journal of biological chemistry
268, 3072-3083.
66. Takata, T., Oxford, J. T., Demeler, B., and Lampi, K. J. (2008) Deamidation
destabilizes and triggers aggregation of a lens protein, betaA3-crystallin. Protein Sci 17,
1565-1575.
References
122
67. Wilmarth, P. A., Tanner, S., Dasari, S., Nagalla, S. R., Riviere, M. A., Bafna, V.,
Pevzner, P. A., and David, L. L. (2006) Age-related changes in human crystallins
determined from comparative analysis of post-translational modifications in young and
aged lens: does deamidation contribute to crystallin insolubility? Journal of proteome
research 5, 2554-2566.
68. Mukhopadhyay, D., and Riezman, H. (2007) Proteasome-independent functions of
ubiquitin in endocytosis and signaling. Science 315, 201-205.
69. Robinson, N. E., and Robinson, A. B. (2001) Deamidation of human proteins. Proc
Natl Acad Sci U S A 98, 12409-12413.
70. Krokhin, O. V., Antonovici, M., Ens, W., Wilkins, J. A., and Standing, K. G.
(2006) Deamidation of -Asn-Gly- sequences during sample preparation for proteomics:
Consequences for MALDI and HPLC-MALDI analysis. Anal Chem 78, 6645-6650.
71. Solstad, T., and Flatmark, T. (2000) Microheterogeneity of recombinant human
phenylalanine hydroxylase as a result of nonenzymatic deamidations of labile amide
containing amino acids. Effects on catalytic and stability properties. European journal of
biochemistry / FEBS 267, 6302-6310.
72. Huang, L., Lu, J., Wroblewski, V. J., Beals, J. M., and Riggin, R. M. (2005) In
vivo deamidation characterization of monoclonal antibody by LC/MS/MS. Analytical
chemistry 77, 1432-1439.
73. Geiger, T., and Clarke, S. (1987) Deamidation, isomerization, and racemization at
asparaginyl and aspartyl residues in peptides. Succinimide-linked reactions that
contribute to protein degradation. The Journal of biological chemistry 262, 785-794.
74. Motoyama, A., and Yates, J. R., 3rd (2008) Multidimensional LC separations in
shotgun proteomics. Analytical chemistry 80, 7187-7193.
References
123
75. Perkins, D. N., Pappin, D. J., Creasy, D. M., and Cottrell, J. S. (1999) Probability-
based protein identification by searching sequence databases using mass spectrometry
data. Electrophoresis 20, 3551-3567.
76. Eng, J. K., McCormack, A. L., and Yates, J. R. (1994) An approach to correlate
tandem mass spectral data of peptides with amino acid sequences in a protein database.
Journal of the American Society for Mass Spectrometry 5, 976-989.
77. Cox, J., and Mann, M. (2008) MaxQuant enables high peptide identification rates,
individualized p.p.b.-range mass accuracies and proteome-wide protein quantification.
Nat Biotechnol 26, 1367-1372.
78. Cox, J., Neuhauser, N., Michalski, A., Scheltema, R. A., Olsen, J. V., and Mann,
M. (2011) Andromeda: a peptide search engine integrated into the MaxQuant
environment. J Proteome Res 10, 1794-1805.
79. Elias, J. E., and Gygi, S. P. (2007) Target-decoy search strategy for increased
confidence in large-scale protein identifications by mass spectrometry. Nat Methods 4,
207-214.
80. Kall, L., Canterbury, J. D., Weston, J., Noble, W. S., and MacCoss, M. J. (2007)
Semi-supervised learning for peptide identification from shotgun proteomics datasets.
Nat Methods 4, 923-925.
81. Robinson, N. E., Lampi, K. J., McIver, R. T., Williams, R. H., Muster, W. C.,
Kruppa, G., and Robinson, A. B. (2005) Quantitative measurement of deamidation in lens
betaB2-crystallin and peptides by direct electrospray injection and fragmentation in a
Fourier transform mass spectrometer. Mol Vis 11, 1211-1219.
82. Segu, Z. M., Hussein, A., Novotny, M. V., and Mechref, Y. (2010) Assigning N-
glycosylation sites of glycoproteins using LC/MSMS in conjunction with endo-
M/exoglycosidase mixture. Journal of proteome research 9, 3598-3607.
References
124
83. Nepomuceno, A. I., Gibson, R. J., Randall, S. M., and Muddiman, D. C. (2014)
Accurate identification of deamidated peptides in global proteomics using a quadrupole
orbitrap mass spectrometer. J Proteome Res 13, 777-785.
84. Hao, P., Ren, Y., Alpert, A. J., and Sze, S. K. (2011) Detection, evaluation and
minimization of nonenzymatic deamidation in proteomic sample preparation. Mol Cell
Proteomics 10, O111 009381.
85. Ren, D., Pipes, G. D., Liu, D., Shih, L. Y., Nichols, A. C., Treuheit, M. J., Brems,
D. N., and Bondarenko, P. V. (2009) An improved trypsin digestion method minimizes
digestion-induced modifications on proteins. Anal Biochem 392, 12-21.
86. Palmisano, G., Melo-Braga, M. N., Engholm-Keller, K., Parker, B. L., and Larsen,
M. R. (2012) Chemical deamidation: a common pitfall in large-scale N-linked
glycoproteomic mass spectrometry-based analyses. J Proteome Res 11, 1949-1957.
87. Mann, M., and Kelleher, N. L. (2008) Precision proteomics: the case for high
resolution and high mass accuracy. Proc Natl Acad Sci U S A 105, 18132-18138.
88. Li, X., Lin, C., and O'Connor, P. B. (2010) Glutamine deamidation: differentiation
of glutamic acid and gamma-glutamic acid in peptides by electron capture dissociation.
Analytical chemistry 82, 3606-3615.
89. Cournoyer, J. J., Pittman, J. L., Ivleva, V. B., Fallows, E., Waskell, L., Costello, C.
E., and O'Connor, P. B. (2005) Deamidation: Differentiation of aspartyl from isoaspartyl
products in peptides by electron capture dissociation. Protein Sci 14, 452-463.
90. Yang, H., Fung, E. Y., Zubarev, A. R., and Zubarev, R. A. (2009) Toward
proteome-scale identification and quantification of isoaspartyl residues in biological
samples. Journal of proteome research 8, 4615-4621.
References
125
91. Wolf-Yadlin, A., Hautaniemi, S., Lauffenburger, D. A., and White, F. M. (2007)
Multiple reaction monitoring for robust quantitative proteomic analysis of cellular
signaling networks. Proc Natl Acad Sci U S A 104, 5860-5865.
92. Unwin, R. D., Griffiths, J. R., Leverentz, M. K., Grallert, A., Hagan, I. M., and
Whetton, A. D. (2005) Multiple reaction monitoring to identify sites of protein
phosphorylation with high sensitivity. Mol Cell Proteomics 4, 1134-1144.
93. Sollid, L. M. (2000) Molecular basis of celiac disease. Annu Rev Immunol 18, 53-
81.
94. Shimizu, T., Matsuoka, Y., and Shirasawa, T. (2005) Biological significance of
isoaspartate and its repair system. Biol Pharm Bull 28, 1590-1596.
95. Powell, J. T., Vine, N., and Crossman, M. (1992) On the accumulation of D-
aspartate in elastin and other proteins of the ageing aorta. Atherosclerosis 97, 201-208.
96. Robinson, N. E., and Robinson, A. B. (2001) Molecular clocks. Proceedings of the
National Academy of Sciences of the United States of America 98, 944-949.
97. Robinson, N. E., and Robinson, A. B. (2004) Amide molecular clocks in
drosophila proteins: potential regulators of aging and other processes. Mechanisms of
ageing and development 125, 259-267.
98. Robinson, N. E., and Robinson, A. B. (2004) Prediction of primary structure
deamidation rates of asparaginyl and glutaminyl peptides through steric and catalytic
effects. J Pept Res 63, 437-448.
99. Catak, S., Monard, G., Aviyente, V., and Ruiz-Lopez, M. F. (2006) Reaction
mechanism of deamidation of asparaginyl residues in peptides: effect of solvent
molecules. J Phys Chem A 110, 8354-8365.
References
126
100. Zabrouskov, V., Han, X., Welker, E., Zhai, H., Lin, C., van Wijk, K. J., Scheraga,
H. A., and McLafferty, F. W. (2006) Stepwise deamidation of ribonuclease A at five sites
determined by top down mass spectrometry. Biochemistry 45, 987-992.
101. Li, X., Cournoyer, J. J., Lin, C., and O'Connor, P. B. (2008) Use of 18O labels to
monitor deamidation during protein and peptide sample processing. Journal of the
American Society for Mass Spectrometry 19, 855-864.
102. Gaza-Bulseco, G., Li, B., Bulseco, A., and Liu, H. C. (2008) Method to
differentiate asn deamidation that occurred prior to and during sample preparation of a
monoclonal antibody. Analytical chemistry 80, 9491-9498.
103. Robinson, N. E., Robinson, Z. W., Robinson, B. R., Robinson, A. L., Robinson, J.
A., Robinson, M. L., and Robinson, A. B. (2004) Structure-dependent nonenzymatic
deamidation of glutaminyl and asparaginyl pentapeptides. J Pept Res 63, 426-436.
104. Stroop, S. D. (2007) A modified peptide mapping strategy for quantifying site-
specific deamidation by electrospray time-of-flight mass spectrometry. Rapid Commun
Mass Spectrom 21, 830-836.
105. Hao, P., Guo, T., Li, X., Adav, S. S., Yang, J., Wei, M., and Sze, S. K. (2010)
Novel application of electrostatic repulsion-hydrophilic interaction chromatography
(ERLIC) in shotgun proteomics: comprehensive profiling of rat kidney proteome. J
Proteome Res 9, 3520-3526.
106. Gonzalez, L. J., Shimizu, T., Satomi, Y., Betancourt, L., Besada, V., Padron, G.,
Orlando, R., Shirasawa, T., Shimonishi, Y., and Takao, T. (2000) Differentiating alpha-
and beta-aspartic acids by electrospray ionization and low-energy tandem mass
spectrometry. Rapid Commun Mass Spectrom 14, 2092-2102.
107. Robinson, N. E., Zabrouskov, V., Zhang, J., Lampi, K. J., and Robinson, A. B.
(2006) Measurement of deamidation of intact proteins by isotopic envelope and mass

References
127
defect with ion cyclotron resonance Fourier transform mass spectrometry. Rapid
Commun Mass Spectrom 20, 3535-3541.
108. Jung, H. J., Purvine, S. O., Kim, H., Petyuk, V. A., Hyung, S. W., Monroe, M. E.,
Mun, D. G., Kim, K. C., Park, J. M., Kim, S. J., Tolic, N., Slysz, G. W., Moore, R. J.,
Zhao, R., Adkins, J. N., Anderson, G. A., Lee, H., Camp, D. G., 2nd, Yu, M. H., Smith,
R. D., and Lee, S. W. (2010) Integrated post-experiment monoisotopic mass refinement:
an integrated approach to accurately assign monoisotopic precursor masses to tandem
mass spectrometric data. Analytical chemistry 82, 8510-8518.
109. Dasari, S., Wilmarth, P. A., Rustvold, D. L., Riviere, M. A., Nagalla, S. R., and
David, L. L. (2007) Reliable detection of deamidated peptides from lens crystallin
proteins using changes in reversed-phase elution times and parent ion masses. Journal of
proteome research 6, 3819-3826.
110. Liu, Y., Salas-Solano, O., and Gennaro, L. A. (2009) Investigation of sample
preparation artifacts formed during the enzymatic release of N-linked glycans prior to
analysis by capillary electrophoresis. Analytical chemistry 81, 6823-6829.
111. Rosenfeld, J., Capdevielle, J., Guillemot, J. C., and Ferrara, P. (1992) In-gel
digestion of proteins for internal sequence analysis after one- or two-dimensional gel
electrophoresis. Anal Biochem 203, 173-179.
112. Chen, E. I., Cociorva, D., Norris, J. L., and Yates, J. R., 3rd (2007) Optimization of
mass spectrometry-compatible surfactants for shotgun proteomics. J Proteome Res 6,
2529-2538.
113. Ernoult, E., Gamelin, E., and Guette, C. (2008) Improved proteome coverage by
using iTRAQ labelling and peptide OFFGEL fractionation. Proteome Sci 6, 27.
References
128
114. Hao, P., Qian, J., Ren, Y., and Sze, S. K. (2011) Electrostatic repulsion-hydrophilic
interaction chromatography (ERLIC) versus strong cation exchange (SCX) for
fractionation of iTRAQ-labeled peptides. J Proteome Res 10, 5568-5574.
115. Parker, B. L., Palmisano, G., Edwards, A. V., White, M. Y., Engholm-Keller, K.,
Lee, A., Scott, N. E., Kolarich, D., Hambly, B. D., Packer, N. H., Larsen, M. R., and
Cordwell, S. J. (2011) Quantitative N-linked glycoproteomics of myocardial ischemia
and reperfusion injury reveals early remodeling in the extracellular environment. Mol
Cell Proteomics 10, M110 006833.
116. Ow, S. Y., Salim, M., Noirel, J., Evans, C., and Wright, P. C. (2011) Minimising
iTRAQ ratio compression through understanding LC-MS elution dependence and high-
resolution HILIC fractionation. Proteomics 11, 2341-2346.
117. Ow, S. Y., Salim, M., Noirel, J., Evans, C., Rehman, I., and Wright, P. C. (2009)
iTRAQ underestimation in simple and complex mixtures: "the good, the bad and the
ugly". J Proteome Res 8, 5347-5355.
118. Glatter, T., Ludwig, C., Ahrne, E., Aebersold, R., Heck, A. J., and Schmidt, A.
(2012) Large-scale quantitative assessment of different in-solution protein digestion
protocols reveals superior cleavage efficiency of tandem Lys-C/trypsin proteolysis over
trypsin digestion. J Proteome Res 11, 5145-5156.
119. Patel, K., and Borchardt, R. T. (1990) Chemical pathways of peptide degradation.
II. Kinetics of deamidation of an asparaginyl residue in a model hexapeptide. Pharm Res
7, 703-711.
120. Tyler-Cross, R., and Schirch, V. (1991) Effects of amino acid sequence, buffers,
and ionic strength on the rate and mechanism of deamidation of asparagine residues in
small peptides. J Biol Chem 266, 22549-22556.

References
129
121. Carr, S. A., Hemling, M. E., Bean, M. F., and Roberts, G. D. (1991) Integration of
mass spectrometry in analytical biotechnology. Anal Chem 63, 2802-2824.
122. Andreazza, H. J., Wang, T., Bagley, C. J., Hoffmann, P., and Bowie, J. H. (2009)
Negative ion fragmentations of deprotonated peptides. The unusual case of isoAsp: a
joint experimental and theoretical study. Comparison with positive ion cleavages. Rapid
Commun Mass Spectrom 23, 1993-2002.
123. Gan, C. S., Guo, T., Zhang, H., Lim, S. K., and Sze, S. K. (2008) A comparative
study of electrostatic repulsion-hydrophilic interaction chromatography (ERLIC) versus
SCX-IMAC-based methods for phosphopeptide isolation/enrichment. J Proteome Res 7,
4869-4877.
124. Hao, P., Guo, T., and Sze, S. K. (2011) Simultaneous analysis of proteome,
phospho- and glycoproteome of rat kidney tissue with electrostatic repulsion hydrophilic
interaction chromatography. PLoS One 6, e16884.
125. Wright, H. T. (1991) Nonenzymatic deamidation of asparaginyl and glutaminyl
residues in proteins. Critical reviews in biochemistry and molecular biology 26, 1-52.
126. Bischoff, R., and Kolbe, H. V. (1994) Deamidation of asparagine and glutamine
residues in proteins and peptides: structural determinants and analytical methodology.
Journal of chromatography 662, 261-278.
127. Capasso, S. (2000) Estimation of the deamidation rate of asparagine side chains. J
Pept Res 55, 224-229.
128. Hao, P., Qian, J., Dutta, B., Cheow, E. S., Sim, K. H., Meng, W., Adav, S. S.,
Alpert, A., and Sze, S. K. (2012) Enhanced separation and characterization of deamidated
peptides with RP-ERLIC-based multidimensional chromatography coupled with tandem
mass spectrometry. J Proteome Res 11, 1804-1811.
References
130
129. Peng, J., Elias, J. E., Thoreen, C. C., Licklider, L. J., and Gygi, S. P. (2003)
Evaluation of multidimensional chromatography coupled with tandem mass spectrometry
(LC/LC-MS/MS) for large-scale protein analysis: the yeast proteome. Journal of
proteome research 2, 43-50.
130. Naghavi, M., Libby, P., Falk, E., Casscells, S. W., Litovsky, S., Rumberger, J.,
Badimon, J. J., Stefanadis, C., Moreno, P., Pasterkamp, G., Fayad, Z., Stone, P. H.,
Waxman, S., Raggi, P., Madjid, M., Zarrabi, A., Burke, A., Yuan, C., Fitzgerald, P. J.,
Siscovick, D. S., de Korte, C. L., Aikawa, M., Juhani Airaksinen, K. E., Assmann, G.,
Becker, C. R., Chesebro, J. H., Farb, A., Galis, Z. S., Jackson, C., Jang, I. K., Koenig, W.,
Lodder, R. A., March, K., Demirovic, J., Navab, M., Priori, S. G., Rekhter, M. D., Bahr,
R., Grundy, S. M., Mehran, R., Colombo, A., Boerwinkle, E., Ballantyne, C., Insull, W.,
Jr., Schwartz, R. S., Vogel, R., Serruys, P. W., Hansson, G. K., Faxon, D. P., Kaul, S.,
Drexler, H., Greenland, P., Muller, J. E., Virmani, R., Ridker, P. M., Zipes, D. P., Shah,
P. K., and Willerson, J. T. (2003) From vulnerable plaque to vulnerable patient: a call for
new definitions and risk assessment strategies: Part I. Circulation 108, 1664-1672.
131. Hansson, G. K., and Hermansson, A. (2011) The immune system in
atherosclerosis. Nat Immunol 12, 204-212.
132. van der Wal, A. C., and Becker, A. E. (1999) Atherosclerotic plaque rupture--
pathologic basis of plaque stability and instability. Cardiovasc Res 41, 334-344.
133. Depre, C., Wijns, W., Robert, A. M., Renkin, J. P., and Havaux, X. (1997)
Pathology of unstable plaque: correlation with the clinical severity of acute coronary
syndromes. J Am Coll Cardiol 30, 694-702.
134. Lattimer, C. R., and Burnand, K. G. (1997) Recurrent carotid stenosis after carotid
endarterectomy. Br J Surg 84, 1206-1219.
135. Sadideen, H., Taylor, P. R., and Padayachee, T. S. (2006) Restenosis after carotid
endarterectomy. Int J Clin Pract 60, 1625-1630.

References
131
136. Frantzi, M., Bhat, A., and Latosinska, A. (2014) Clinical proteomic biomarkers:
relevant issues on study design & technical considerations in biomarker development.
Clin Transl Med 3, 7.
137. Whiteaker, J. R., Lin, C., Kennedy, J., Hou, L., Trute, M., Sokal, I., Yan, P.,
Schoenherr, R. M., Zhao, L., Voytovich, U. J., Kelly-Spratt, K. S., Krasnoselsky, A.,
Gafken, P. R., Hogan, J. M., Jones, L. A., Wang, P., Amon, L., Chodosh, L. A., Nelson,
P. S., McIntosh, M. W., Kemp, C. J., and Paulovich, A. G. (2011) A targeted proteomics-
based pipeline for verification of biomarkers in plasma. Nat Biotechnol 29, 625-634.
138. de la Cuesta, F., Alvarez-Llamas, G., Gil-Dones, F., Martin-Rojas, T., Zubiri, I.,
Pastor, C., Barderas, M. G., and Vivanco, F. (2009) Tissue proteomics in atherosclerosis:
elucidating the molecular mechanisms of cardiovascular diseases. Expert Rev Proteomics
6, 395-409.
139. Eberini, I., Wait, R., Calabresi, L., Sensi, C., Miller, I., and Gianazza, E. (2013) A
proteomic portrait of atherosclerosis. J Proteomics 82, 92-112.
140. Bagnato, C., Thumar, J., Mayya, V., Hwang, S. I., Zebroski, H., Claffey, K. P.,
Haudenschild, C., Eng, J. K., Lundgren, D. H., and Han, D. K. (2007) Proteomics
analysis of human coronary atherosclerotic plaque: a feasibility study of direct tissue
proteomics by liquid chromatography and tandem mass spectrometry. Mol Cell
Proteomics 6, 1088-1102.
141. de Kleijn, D. P., Moll, F. L., Hellings, W. E., Ozsarlak-Sozer, G., de Bruin, P.,
Doevendans, P. A., Vink, A., Catanzariti, L. M., Schoneveld, A. H., Algra, A., Daemen,
M. J., Biessen, E. A., de Jager, W., Zhang, H., de Vries, J. P., Falk, E., Lim, S. K., van
der Spek, P. J., Sze, S. K., and Pasterkamp, G. (2010) Local atherosclerotic plaques are a
source of prognostic biomarkers for adverse cardiovascular events. Arterioscler Thromb
Vasc Biol 30, 612-619.
References
132
142. Hains, P. G., and Truscott, R. J. (2010) Age-dependent deamidation of lifelong
proteins in the human lens. Invest Ophthalmol Vis Sci 51, 3107-3114.
143. Jin, L. L., Tong, J., Prakash, A., Peterman, S. M., St-Germain, J. R., Taylor, P.,
Trudel, S., and Moran, M. F. (2010) Measurement of protein phosphorylation
stoichiometry by selected reaction monitoring mass spectrometry. J Proteome Res 9,
2752-2761.
144. Verhoeven, B. A., Velema, E., Schoneveld, A. H., de Vries, J. P., de Bruin, P.,
Seldenrijk, C. A., de Kleijn, D. P., Busser, E., van der Graaf, Y., Moll, F., and
Pasterkamp, G. (2004) Athero-express: differential atherosclerotic plaque expression of
mRNA and protein in relation to cardiovascular events and patient characteristics.
Rationale and design. Eur J Epidemiol 19, 1127-1133.
145. Thomas, P. D., Campbell, M. J., Kejariwal, A., Mi, H., Karlak, B., Daverman, R.,
Diemer, K., Muruganujan, A., and Narechania, A. (2003) PANTHER: a library of protein
families and subfamilies indexed by function. Genome Res 13, 2129-2141.
146. Mi, H., Lazareva-Ulitsky, B., Loo, R., Kejariwal, A., Vandergriff, J., Rabkin, S.,
Guo, N., Muruganujan, A., Doremieux, O., Campbell, M. J., Kitano, H., and Thomas, P.
D. (2005) The PANTHER database of protein families, subfamilies, functions and
pathways. Nucleic Acids Res 33, D284-288.
147. MacLean, B., Tomazela, D. M., Shulman, N., Chambers, M., Finney, G. L.,
Frewen, B., Kern, R., Tabb, D. L., Liebler, D. C., and MacCoss, M. J. (2010) Skyline: an
open source document editor for creating and analyzing targeted proteomics experiments.
Bioinformatics 26, 966-968.
148. Hao, P., Ren, Y., Pasterkamp, G., Moll, F. L., de Kleijn, D. P., and Sze, S. K.
(2014) Deep proteomic profiling of human carotid atherosclerotic plaques using
multidimensional LC-MS/MS. Proteomics Clin Appl.
References
133
149. Ghazalpour, A., Doss, S., Yang, X., Aten, J., Toomey, E. M., Van Nas, A., Wang,
S., Drake, T. A., and Lusis, A. J. (2004) Thematic review series: The pathogenesis of
atherosclerosis. Toward a biological network for atherosclerosis. J Lipid Res 45, 1793-
1805.
150. Hansson, G. K. (2005) Inflammation, atherosclerosis, and coronary artery disease.
N Engl J Med 352, 1685-1695.
151. Giannakopoulos, T., Avgerinos, E., Moulakakis, K., Kadoglou, N., Preza, O.,
Papapetrou, A., Papasideris, C., and Liapis, C. (2011) Biomarkers for diagnosis of the
vulnerable atherosclerotic plaque. Interventional Cardiology 3, 223-233.
152. Lange, V., Picotti, P., Domon, B., and Aebersold, R. (2008) Selected reaction
monitoring for quantitative proteomics: a tutorial. Mol Syst Biol 4, 222.
153. Hao, P., Ren, Y., Tam, J. P., and Sze, S. K. (2013) Correction of errors in tandem
mass spectrum extraction enhances phosphopeptide identification. J Proteome Res 12,
5548-5557.
154. Katsuda, S., and Kaji, T. (2003) Atherosclerosis and extracellular matrix. J
Atheroscler Thromb 10, 267-274.
155. MacLeod, D. C., Strauss, B. H., de Jong, M., Escaned, J., Umans, V. A., van
Suylen, R. J., Verkerk, A., de Feyter, P. J., and Serruys, P. W. (1994) Proliferation and
extracellular matrix synthesis of smooth muscle cells cultured from human coronary
atherosclerotic and restenotic lesions. J Am Coll Cardiol 23, 59-65.
156. Johnson, J. L. (2007) Matrix metalloproteinases: influence on smooth muscle cells
and atherosclerotic plaque stability. Expert Rev Cardiovasc Ther 5, 265-282.

References
134
157. Nakashima, Y., Raines, E. W., Plump, A. S., Breslow, J. L., and Ross, R. (1998)
Upregulation of VCAM-1 and ICAM-1 at atherosclerosis-prone sites on the endothelium
in the ApoE-deficient mouse. Arterioscler Thromb Vasc Biol 18, 842-851.
158. Iiyama, K., Hajra, L., Iiyama, M., Li, H., DiChiara, M., Medoff, B. D., and
Cybulsky, M. I. (1999) Patterns of vascular cell adhesion molecule-1 and intercellular
adhesion molecule-1 expression in rabbit and mouse atherosclerotic lesions and at sites
predisposed to lesion formation. Circ Res 85, 199-207.
159. Karakas, M., and Koenig, W. (2012) Myeloperoxidase production by macrophage
and risk of atherosclerosis. Curr Atheroscler Rep 14, 277-283.
160. Nicholls, S. J., and Hazen, S. L. (2009) Myeloperoxidase, modified lipoproteins,
and atherogenesis. J Lipid Res 50 Suppl, S346-351.
161. Delporte, C., Van Antwerpen, P., Vanhamme, L., Roumeguere, T., and Zouaoui
Boudjeltia, K. (2013) Low-density lipoprotein modified by myeloperoxidase in
inflammatory pathways and clinical studies. Mediators Inflamm 2013, 971579.
162. Garcia-Touchard, A., Henry, T. D., Sangiorgi, G., Spagnoli, L. G., Mauriello, A.,
Conover, C., and Schwartz, R. S. (2005) Extracellular proteases in atherosclerosis and
restenosis. Arterioscler Thromb Vasc Biol 25, 1119-1127.
163. Cudic, M., and Fields, G. B. (2009) Extracellular proteases as targets for drug
development. Curr Protein Pept Sci 10, 297-307.
164. Lim, J. S., Lee, D. H., Park, J. Y., Jin, S. H., and Jacobs, D. R., Jr. (2007) A strong
interaction between serum gamma-glutamyltransferase and obesity on the risk of
prevalent type 2 diabetes: results from the Third National Health and Nutrition
Examination Survey. Clin Chem 53, 1092-1098.
References
135
165. Jacobson, T. A. (2011) Opening a new lipid "apo-thecary": incorporating
apolipoproteins as potential risk factors and treatment targets to reduce cardiovascular
risk. Mayo Clin Proc 86, 762-780.
166. Kockx, M. M., and Herman, A. G. (2000) Apoptosis in atherosclerosis: beneficial
or detrimental? Cardiovasc Res 45, 736-746.
167. Kockx, M. M., and Herman, A. G. (1998) Apoptosis in atherogenesis: implications
for plaque destabilization. Eur Heart J 19 Suppl G, G23-28.
168. Galis, Z. S., Sukhova, G. K., Lark, M. W., and Libby, P. (1994) Increased
expression of matrix metalloproteinases and matrix degrading activity in vulnerable
regions of human atherosclerotic plaques. J Clin Invest 94, 2493-2503.
169. Galis, Z. S., and Khatri, J. J. (2002) Matrix metalloproteinases in vascular
remodeling and atherogenesis: the good, the bad, and the ugly. Circ Res 90, 251-262.
170. Dollery, C. M., Humphries, S. E., McClelland, A., Latchman, D. S., and McEwan,
J. R. (1999) Expression of tissue inhibitor of matrix metalloproteinases 1 by use of an
adenoviral vector inhibits smooth muscle cell migration and reduces neointimal
hyperplasia in the rat model of vascular balloon injury. Circulation 99, 3199-3205.
171. George, S. J., Baker, A. H., Angelini, G. D., and Newby, A. C. (1998) Gene
transfer of tissue inhibitor of metalloproteinase-2 inhibits metalloproteinase activity and
neointima formation in human saphenous veins. Gene Ther 5, 1552-1560.
172. Rouis, M., Adamy, C., Duverger, N., Lesnik, P., Horellou, P., Moreau, M.,
Emmanuel, F., Caillaud, J. M., Laplaud, P. M., Dachet, C., and Chapman, M. J. (1999)
Adenovirus-mediated overexpression of tissue inhibitor of metalloproteinase-1 reduces
atherosclerotic lesions in apolipoprotein E-deficient mice. Circulation 100, 533-540.
References
136
173. Cardellini, M., Menghini, R., Martelli, E., Casagrande, V., Marino, A., Rizza, S.,
Porzio, O., Mauriello, A., Solini, A., Ippoliti, A., Lauro, R., Folli, F., and Federici, M.
(2009) TIMP3 is reduced in atherosclerotic plaques from subjects with type 2 diabetes
and increased by SirT1. Diabetes 58, 2396-2401.
174. Romero, J. R., Vasan, R. S., Beiser, A. S., Polak, J. F., Benjamin, E. J., Wolf, P.
A., and Seshadri, S. (2008) Association of carotid artery atherosclerosis with circulating
biomarkers of extracellular matrix remodeling: the Framingham Offspring Study. J
Stroke Cerebrovasc Dis 17, 412-417.
175. LA, V. B., Nakao, L. S., Ramos, S. G., Filho, A. P., Murta, L. O., Jr., Ingberman,
M., Tefe-Silva, C., and Precoma, D. B. (2011) Assessment of MMP-9, TIMP-1, and
COX-2 in normal tissue and in advanced symptomatic and asymptomatic carotid plaques.
Thromb J 9, 6.
176. Kim, Y. J., Gallien, S., van Oostrum, J., and Domon, B. (2013) Targeted
proteomics strategy applied to biomarker evaluation. Proteomics Clin Appl 7, 739-747.
177. Alvarez, B., Ruiz, C., Chacon, P., Alvarez-Sabin, J., and Matas, M. (2004) Serum
values of metalloproteinase-2 and metalloproteinase-9 as related to unstable plaque and
inflammatory cells in patients with greater than 70% carotid artery stenosis. J Vasc Surg
40, 469-475.
178. Eldrup, N., Gronholdt, M. L., Sillesen, H., and Nordestgaard, B. G. (2006)
Elevated matrix metalloproteinase-9 associated with stroke or cardiovascular death in
patients with carotid stenosis. Circulation 114, 1847-1854.
179. Libby, P., Ridker, P. M., and Hansson, G. K. (2009) Inflammation in
atherosclerosis: from pathophysiology to practice. J Am Coll Cardiol 54, 2129-2138.
180. Halim, S. A., and Newby, L. K. (2009) Prognostic biomarkers in individuals with
prevalent coronary heart disease. Dis Markers 26, 265-271.
References
137
181. Naruko, T., Ueda, M., Haze, K., van der Wal, A. C., van der Loos, C. M., Itoh, A.,
Komatsu, R., Ikura, Y., Ogami, M., Shimada, Y., Ehara, S., Yoshiyama, M., Takeuchi,
K., Yoshikawa, J., and Becker, A. E. (2002) Neutrophil infiltration of culprit lesions in
acute coronary syndromes. Circulation 106, 2894-2900.
182. Sugiyama, S., Okada, Y., Sukhova, G. K., Virmani, R., Heinecke, J. W., and
Libby, P. (2001) Macrophage myeloperoxidase regulation by granulocyte macrophage
colony-stimulating factor in human atherosclerosis and implications in acute coronary
syndromes. Am J Pathol 158, 879-891.
183. Lie, J., de Crom, R., van Gent, T., van Haperen, R., Scheek, L., Sadeghi-Niaraki,
F., and van Tol, A. (2004) Elevation of plasma phospholipid transfer protein increases the
risk of atherosclerosis despite lower apolipoprotein B-containing lipoproteins. J Lipid Res
45, 805-811.
184. Lie, J., de Crom, R., van Gent, T., van Haperen, R., Scheek, L., Lankhuizen, I., and
van Tol, A. (2002) Elevation of plasma phospholipid transfer protein in transgenic mice
increases VLDL secretion. J Lipid Res 43, 1875-1880.
185. van Haperen, R., van Tol, A., van Gent, T., Scheek, L., Visser, P., van der Kamp,
A., Grosveld, F., and de Crom, R. (2002) Increased risk of atherosclerosis by elevated
plasma levels of phospholipid transfer protein. J Biol Chem 277, 48938-48943.
186. Jiang, X. C., Qin, S., Qiao, C., Kawano, K., Lin, M., Skold, A., Xiao, X., and Tall,
A. R. (2001) Apolipoprotein B secretion and atherosclerosis are decreased in mice with
phospholipid-transfer protein deficiency. Nat Med 7, 847-852.
187. Oorni, K., Sneck, M., Bromme, D., Pentikainen, M. O., Lindstedt, K. A.,
Mayranpaa, M., Aitio, H., and Kovanen, P. T. (2004) Cysteine protease cathepsin F is
expressed in human atherosclerotic lesions, is secreted by cultured macrophages, and
modifies low density lipoprotein particles in vitro. J Biol Chem 279, 34776-34784.

References
138
188. Cybulsky, M. I., Iiyama, K., Li, H., Zhu, S., Chen, M., Iiyama, M., Davis, V.,
Gutierrez-Ramos, J. C., Connelly, P. W., and Milstone, D. S. (2001) A major role for
VCAM-1, but not ICAM-1, in early atherosclerosis. J Clin Invest 107, 1255-1262.
189. Li, R., and Shen, Y. (2013) An old method facing a new challenge: re-visiting
housekeeping proteins as internal reference control for neuroscience research. Life Sci 92,
747-751.
190. Eaton, S. L., Roche, S. L., Llavero Hurtado, M., Oldknow, K. J., Farquharson, C.,
Gillingwater, T. H., and Wishart, T. M. (2013) Total protein analysis as a reliable loading
control for quantitative fluorescent Western blotting. PLoS One 8, e72457.
191. Skates, S. J., Gillette, M. A., LaBaer, J., Carr, S. A., Anderson, L., Liebler, D. C.,
Ransohoff, D., Rifai, N., Kondratovich, M., Tezak, Z., Mansfield, E., Oberg, A. L.,
Wright, I., Barnes, G., Gail, M., Mesri, M., Kinsinger, C. R., Rodriguez, H., and Boja, E.
S. (2013) Statistical design for biospecimen cohort size in proteomics-based biomarker
discovery and verification studies. J Proteome Res 12, 5383-5394.
192. Di Camillo, B., Sanavia, T., Martini, M., Jurman, G., Sambo, F., Barla, A.,
Squillario, M., Furlanello, C., Toffolo, G., and Cobelli, C. (2012) Effect of size and
heterogeneity of samples on biomarker discovery: synthetic and real data assessment.
PLoS One 7, e32200.
193. Drucker, E., and Krapfenbauer, K. (2013) Pitfalls and limitations in translation
from biomarker discovery to clinical utility in predictive and personalised medicine.
EPMA J 4, 7.
194. Aebersold, R., Burlingame, A. L., and Bradshaw, R. A. (2013) Western blots
versus selected reaction monitoring assays: time to turn the tables? Mol Cell Proteomics
12, 2381-2382.
References
139
195. Takemoto, L., and Boyle, D. (2000) Specific glutamine and asparagine residues of
gamma-S crystallin are resistant to in vivo deamidation. J Biol Chem 275, 26109-26112.
196. Chain, D. G., Schwartz, J. H., and Hegde, A. N. (1999) Ubiquitin-mediated
proteolysis in learning and memory. Mol Neurobiol 20, 125-142.
197. McFadden, P. N., and Clarke, S. (1987) Conversion of isoaspartyl peptides to
normal peptides: implications for the cellular repair of damaged proteins. Proc Natl Acad
Sci U S A 84, 2595-2599.
198. Young, A. L., Carter, W. G., Doyle, H. A., Mamula, M. J., and Aswad, D. W.
(2001) Structural integrity of histone H2B in vivo requires the activity of protein L-
isoaspartate O-methyltransferase, a putative protein repair enzyme. J Biol Chem 276,
37161-37165.
Appendix A
140
Publications
1. Hao, P., Ren, Y., Datta, A., Tam, J. P., and Sze, S. K. (2014) Evaluation of the
Effect of Trypsin Digestion Buffers on Artificial Deamidation. J Proteome Res. 2014 Dec
22. [Epub ahead of print]
2. Hao, P., Ren, Y., Pasterkamp, G., Moll, F. L., de Kleijn, D. P., and Sze, S. K.
(2014) Deep Proteomic Profiling of Human Carotid Atherosclerotic Plaques Using
Multidimensional LC-MS/MS. Proteomics Clin Appl. 8, 631-5.
3. Ren, Y., Hao, P., Law, S.K., and Sze, S. K. (2014) Hypoxia-induced changes to
integrin alpha 3 glycosylation facilitate invasion in epidermoid carcinoma cell line A431.
Mol Cell Proteomics. pii: mcp.M114.038505
4. Dutta, B., Ren, Y., Hao, P., Sim, K. H., Cheow, E., Adav, S., Tam, J. P., and Sze,
S. K. (2014) Profiling of the Chromatin-Associated Proteome Identifies HP1BP3 as a
Novel Regulator of Cell Cycle Progression. Mol Cell Proteomics. pii: mcp.M113.034975.
5. Hao, P., Ren, Y., Tam, J. P., and Sze, S. K. (2013) Correction of errors in tandem
mass spectrum extraction enhances phosphopeptide identification. J Proteome Res 12,
5548-5557.
6. Hao, P., Ren, Y., Dutta, B., and Sze, S. K. (2013) Comparative evaluation of
electrostatic repulsion-hydrophilic interaction chromatography (ERLIC) and high-pH
reversed phase (Hp-RP) chromatography in profiling of rat kidney proteome. J
Proteomics 82, 254-262.
7. Li, Z., Hao, P., Li, L., Tan, C. Y., Cheng, X., Chen, G. Y., Sze, S. K., Shen, H. M.,
and Yao, S. Q. (2013) Design and synthesis of minimalist terminal alkyne-containing
diazirine photo-crosslinkers and their incorporation into kinase inhibitors for cell- and
tissue-based proteome profiling. Angew Chem Int Ed Engl 52, 8551-8556.
8. Ren, Y., Hao, P., Dutta, B., Cheow, E. S., Sim, K. H., Gan, C. S., Lim, S. K., and
Sze, S. K. (2013) Hypoxia modulates A431 cellular pathways association to tumor
radioresistance and enhanced migration revealed by comprehensive proteomic and
functional studies. Mol Cell Proteomics 12, 485-498.
Appendix A
141
9. Ge, J., Zhang, C. J., Li, L., Chong, L. M., Wu, X., Hao, P., Sze, S. K., and Yao, S.
Q. (2013) Small molecule probe suitable for in situ profiling and inhibition of protein
disulfide isomerase. ACS Chem Biol 8, 2577-2585.
10. Hao, P., Qian, J., Dutta, B., Cheow, E. S., Sim, K. H., Meng, W., Adav, S. S.,
Alpert, A., and Sze, S. K. (2012) Enhanced separation and characterization of deamidated
peptides with RP-ERLIC-based multidimensional chromatography coupled with tandem
mass spectrometry. J Proteome Res 11, 1804-1811.
11. Hao, P., Qian, J., Ren, Y., and Sze, S. K. (2011) Electrostatic repulsion-
hydrophilic interaction chromatography (ERLIC) versus strong cation exchange (SCX)
for fractionation of iTRAQ-labeled peptides. J Proteome Res 10, 5568-5574.
12. Hao, P., Ren, Y., Alpert, A. J., and Sze, S. K. (2011) Detection, evaluation and
minimization of nonenzymatic deamidation in proteomic sample preparation. Mol Cell
Proteomics 10, O111 009381.
13. Hao, P., Guo, T., and Sze, S. K. (2011) Simultaneous analysis of proteome,
phospho- and glycoproteome of rat kidney tissue with electrostatic repulsion hydrophilic
interaction chromatography. PLoS One 6, e16884.
14. Hao, P., Guo, T., Li, X., Adav, S. S., Yang, J., Wei, M., and Sze, S. K. (2010)
Novel application of electrostatic repulsion-hydrophilic interaction chromatography
(ERLIC) in shotgun proteomics: comprehensive profiling of rat kidney proteome. J
Proteome Res 9, 3520-3526.
Book Chapters:
1. Hao, P., Sze, S.K. (2014) Proteomic analysis of protein deamidation. Curr Protoc
Protein Sci. 2014 Nov 3;78:24.5.1-24.5.14
2. Hao, P., Zhang, H., and Sze, S. K. (2011) Application of electrostatic repulsion
hydrophilic interaction chromatography to the characterization of proteome,
glycoproteome, and phosphoproteome using nano LC-MS/MS. Methods Mol Biol 790,
305-318.
Appendix B
142
Conference Presentations
Posters
1. 7th AOHUPO/9th PST, Bangkok, Thailand, August 6-8, 2014. Piliang Hao, Yan
Ren, Siu Kwan Sze.
Title: Evaluation of the Effect of Digestion Buffers on Artificial Deamidation in
In-solution Trypsin Digestion
2. 62nd ASMS Conference on Mass Spectrometry and Allied Topics, Baltimore, USA,
June 15-19, 2014. Piliang Hao, Yan Ren, James P. Tam, Siu Kwan Sze.
Title: Correction of Errors in Tandem Mass Spectrum Extraction Enhances
Phosphopeptide Identification
3. Inaugural SOCRATES Scientific Meeting 2013, Singapore, October 24-25, 2013.
Piliang Hao, Yan Ren, Siu Kwan Sze.
Title: Enhanced Separation and Characterization of Deamidated Peptides with RP-
ERLIC-based Multidimensional Chromatography Coupled with Tandem Mass
Spectrometry
4. International Conference on Natural Products and Health 2013, Singapore, September
5-7, 2013. Piliang Hao, Yan Ren, Siu Kwan Sze.
Title: Enhanced Separation and Characterization of Deamidated Peptides with RP-
ERLIC-based Multidimensional Chromatography Coupled with Tandem Mass
Spectrometry
5. 60th ASMS Conference on Mass Spectrometry and Allied Topics, Vancouver,
Canada, May 19-24, 2012. Piliang Hao, Yan Ren, Esther Sok Hwee Cheow, Kae
Hwan Sim, Andrew Alpert, Siu Kwan Sze.
Title: Global Profiling of Endogenous Deamidated Peptides with a RP-ERLIC
Chromatography Sequence Coupled with Tandem Mass Spectrometry
Appendix B
143
6. 59th ASMS Conference on Mass Spectrometry and Allied Topics, Denver, USA,
June 5-9, 2011. Piliang Hao, Jingru Qian, Wei Meng, Yan Ren, Andrew J. Alpert,
Siu Kwan Sze.
Title: Simultaneous Identification of Unmodified Tryptic Peptides and
Phosphopeptides, Glycopeptides, and Deamidated Peptides by Electrostatic
Repulsion-Hydrophilic Interaction Chromatography (ERLIC) and LC-MS/MS
Awards
The Bronze Award of the 1st Shimadzu Young Scientist Award