DEVELOPING PROPOSED LAYOUT FOR INCREASING LINE …
21
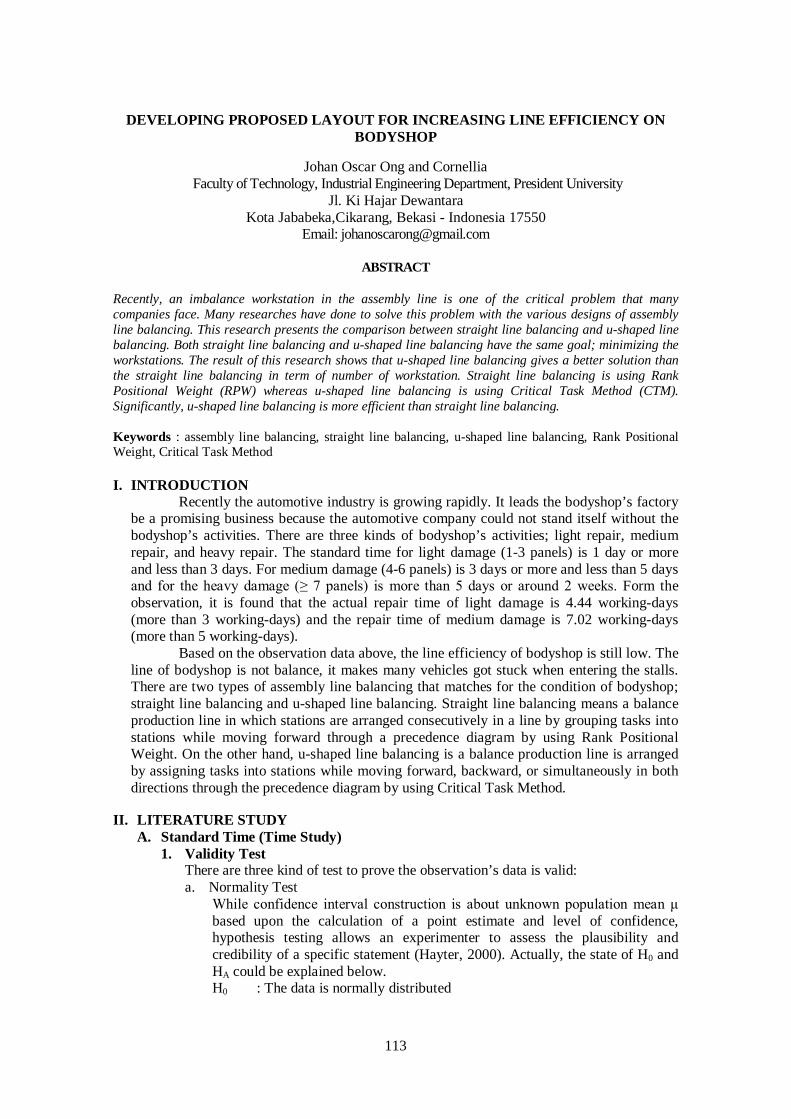
113 DEVELOPING PROPOSED LAYOUT FOR INCREASING LINE EFFICIENCY ON BODYSHOP Johan Oscar Ong and Cornellia Faculty of Technology, Industrial Engineering Department, President University Jl. Ki Hajar Dewantara Kota Jababeka,Cikarang, Bekasi - Indonesia 17550 Email: [email protected] ABSTRACT Recently, an imbalance workstation in the assembly line is one of the critical problem that many companies face. Many researches have done to solve this problem with the various designs of assembly line balancing. This research presents the comparison between straight line balancing and u-shaped line balancing. Both straight line balancing and u-shaped line balancing have the same goal; minimizing the workstations. The result of this research shows that u-shaped line balancing gives a better solution than the straight line balancing in term of number of workstation. Straight line balancing is using Rank Positional Weight (RPW) whereas u-shaped line balancing is using Critical Task Method (CTM). Significantly, u-shaped line balancing is more efficient than straight line balancing. Keywords : assembly line balancing, straight line balancing, u-shaped line balancing, Rank Positional Weight, Critical Task Method I. INTRODUCTION Recently the automotive industry is growing rapidly. It leads the bodyshop’s factory be a promising business because the automotive company could not stand itself without the bodyshop’s activities. There are three kinds of bodyshop’s activities; light repair, medium repair, and heavy repair. The standard time for light damage (1-3 panels) is 1 day or more and less than 3 days. For medium damage (4-6 panels) is 3 days or more and less than 5 days and for the heavy damage (≥ 7 panels) is more than 5 days or around 2 weeks. Form the observation, it is found that the actual repair time of light damage is 4.44 working-days (more than 3 working-days) and the repair time of medium damage is 7.02 working-days (more than 5 working-days). Based on the observation data above, the line efficiency of bodyshop is still low. The line of bodyshop is not balance, it makes many vehicles got stuck when entering the stalls. There are two types of assembly line balancing that matches for the condition of bodyshop; straight line balancing and u-shaped line balancing. Straight line balancing means a balance production line in which stations are arranged consecutively in a line by grouping tasks into stations while moving forward through a precedence diagram by using Rank Positional Weight. On the other hand, u-shaped line balancing is a balance production line is arranged by assigning tasks into stations while moving forward, backward, or simultaneously in both directions through the precedence diagram by using Critical Task Method. II. LITERATURE STUDY A. Standard Time (Time Study) 1. Validity Test There are three kind of test to prove the observation’s data is valid: a. Normality Test While confidence interval construction is about unknown population mean μ based upon the calculation of a point estimate and level of confidence, hypothesis testing allows an experimenter to assess the plausibility and credibility of a specific statement (Hayter, 2000). Actually, the state of H 0 and H A could be explained below. H 0 : The data is normally distributed
Transcript of DEVELOPING PROPOSED LAYOUT FOR INCREASING LINE …
113
DEVELOPING PROPOSED LAYOUT FOR INCREASING LINE EFFICIENCY ON BODYSHOP
Johan Oscar Ong and Cornellia Faculty of Technology, Industrial Engineering Department, President University
Jl. Ki Hajar Dewantara Kota Jababeka,Cikarang, Bekasi - Indonesia 17550
Email: [email protected]
ABSTRACT
Recently, an imbalance workstation in the assembly line is one of the critical problem that many companies face. Many researches have done to solve this problem with the various designs of assembly line balancing. This research presents the comparison between straight line balancing and u-shaped line balancing. Both straight line balancing and u-shaped line balancing have the same goal; minimizing the workstations. The result of this research shows that u-shaped line balancing gives a better solution than the straight line balancing in term of number of workstation. Straight line balancing is using Rank Positional Weight (RPW) whereas u-shaped line balancing is using Critical Task Method (CTM). Significantly, u-shaped line balancing is more efficient than straight line balancing. Keywords : assembly line balancing, straight line balancing, u-shaped line balancing, Rank Positional Weight, Critical Task Method I. INTRODUCTION
Recently the automotive industry is growing rapidly. It leads the bodyshop’s factory be a promising business because the automotive company could not stand itself without the bodyshop’s activities. There are three kinds of bodyshop’s activities; light repair, medium repair, and heavy repair. The standard time for light damage (1-3 panels) is 1 day or more and less than 3 days. For medium damage (4-6 panels) is 3 days or more and less than 5 days and for the heavy damage (≥ 7 panels) is more than 5 days or around 2 weeks. Form the observation, it is found that the actual repair time of light damage is 4.44 working-days (more than 3 working-days) and the repair time of medium damage is 7.02 working-days (more than 5 working-days).
Based on the observation data above, the line efficiency of bodyshop is still low. The line of bodyshop is not balance, it makes many vehicles got stuck when entering the stalls. There are two types of assembly line balancing that matches for the condition of bodyshop; straight line balancing and u-shaped line balancing. Straight line balancing means a balance production line in which stations are arranged consecutively in a line by grouping tasks into stations while moving forward through a precedence diagram by using Rank Positional Weight. On the other hand, u-shaped line balancing is a balance production line is arranged by assigning tasks into stations while moving forward, backward, or simultaneously in both directions through the precedence diagram by using Critical Task Method.
II. LITERATURE STUDY
A. Standard Time (Time Study) 1. Validity Test
There are three kind of test to prove the observation’s data is valid: a. Normality Test
While confidence interval construction is about unknown population mean μ based upon the calculation of a point estimate and level of confidence, hypothesis testing allows an experimenter to assess the plausibility and credibility of a specific statement (Hayter, 2000). Actually, the state of H0 and HA could be explained below. H0 : The data is normally distributed

Spektrum Industri, 2014, Vol. 12, No. 2, 113 – 247 ISSN : 1963-6590
114
HA : The data is not normally distributed If the p-value ≤ α (significance level), the null hypothesis is rejected. The significance level for this research is 5%.
b. Uniformity Test There are several steps to determine the uniformity of a set of data:
i. Calculate average observed time ( ) for each operation.
(1)
ii. Calculate the standard deviation (s) of each operation.
(2)
iii. Determine the Upper Control Limit (UCL) and Lower Control Limit (LCL) (Wignjosoebroto, 2000).
(3)
iv. Suficiency Test The data is sufficient when n (number of data) greater than N’ (number of observation needed). The following formula is calculating how many observations must be done to reach 95% confidence level (Sutalaksana, 2006).
(4)
2. Rating Operator Performance (Westinghouse System)
Niebel (2003) put the detail of westinghouse system as the rating method. This method considers four factors in evaluating the performance of operator; skill, effort, conditions, and consistency. The overall performance factor could be determined by algebraically combining the four values and adding their sum to unity.
3. Adding Allowance
Sutalaksana (2006) determines the factors as energy that be taken out, work posture, work motion, eye fatigue, temperature condition, atmosphere condition, and good environment condition. The evaluation is done by calculating the values of the seven factors, personal needs, and delays.
B. Rank Positional Weight (Straight Line Balancing)
There are some steps in Helgeson-Birnie Approach method to design assembly line: 1. Create the precedence matrix to show the relationship among those elements. The
following figure is established to show the precedence matrix. The numeral 1 signifies a “must precedes” relationship.
2. Calculate Positional Weight (PW) for every work element (WE). 3. Sort all work elements from the largest PW until the smallest PW. Listing all the
positional weight in decreasing order of magnitude. 4. Based on the rank of PW in step 2, develop the task loading into work station.
Because of that, there will be some limitations: • The relation in Precedence Diagram (+Status zone/ zone constraints)
Spektrum Industri, 2014, Vol. 12, No. 2, 113 – 247 ISSN : 1963-6590
115
• Work station time (ST) could not be more than actual cycle time (CTi) 5. Calculate the work station’s efficiency and efficiency of assembly line (LE).
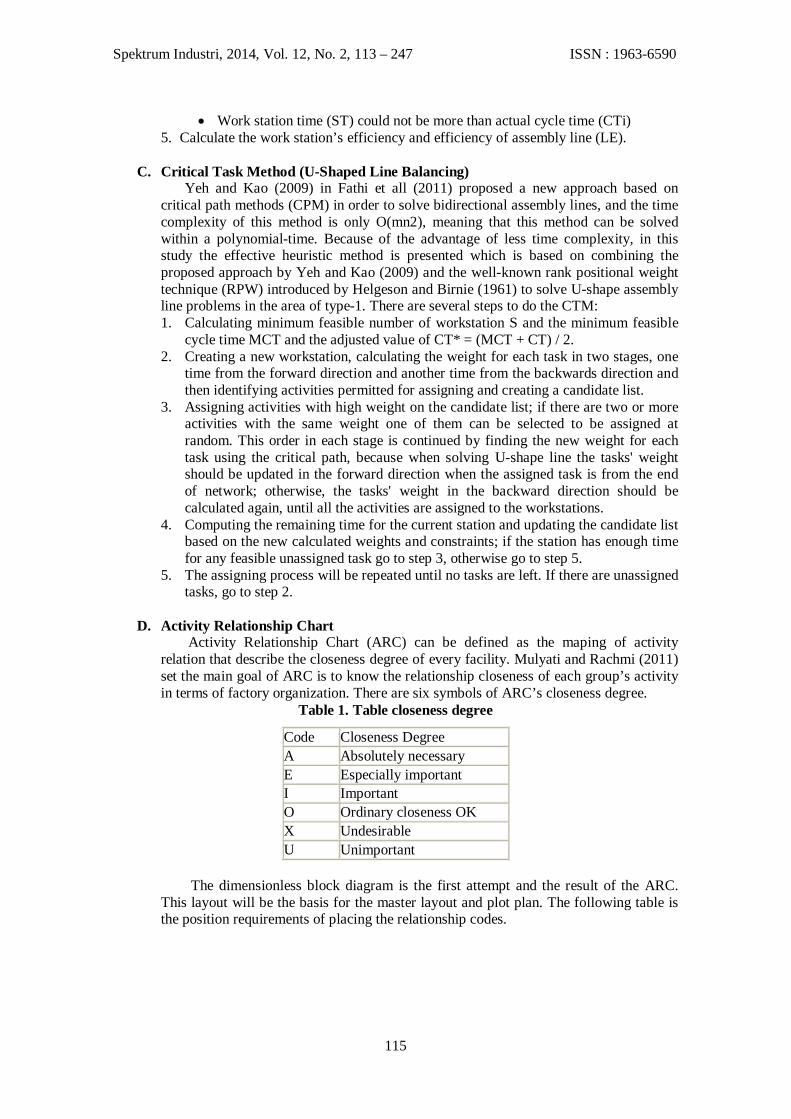
C. Critical Task Method (U-Shaped Line Balancing)
Yeh and Kao (2009) in Fathi et all (2011) proposed a new approach based on critical path methods (CPM) in order to solve bidirectional assembly lines, and the time complexity of this method is only O(mn2), meaning that this method can be solved within a polynomial-time. Because of the advantage of less time complexity, in this study the effective heuristic method is presented which is based on combining the proposed approach by Yeh and Kao (2009) and the well-known rank positional weight technique (RPW) introduced by Helgeson and Birnie (1961) to solve U-shape assembly line problems in the area of type-1. There are several steps to do the CTM: 1. Calculating minimum feasible number of workstation S and the minimum feasible
cycle time MCT and the adjusted value of CT* = (MCT + CT) / 2. 2. Creating a new workstation, calculating the weight for each task in two stages, one
time from the forward direction and another time from the backwards direction and then identifying activities permitted for assigning and creating a candidate list.
3. Assigning activities with high weight on the candidate list; if there are two or more activities with the same weight one of them can be selected to be assigned at random. This order in each stage is continued by finding the new weight for each task using the critical path, because when solving U-shape line the tasks' weight should be updated in the forward direction when the assigned task is from the end of network; otherwise, the tasks' weight in the backward direction should be calculated again, until all the activities are assigned to the workstations.
4. Computing the remaining time for the current station and updating the candidate list based on the new calculated weights and constraints; if the station has enough time for any feasible unassigned task go to step 3, otherwise go to step 5.
5. The assigning process will be repeated until no tasks are left. If there are unassigned tasks, go to step 2.
D. Activity Relationship Chart
Activity Relationship Chart (ARC) can be defined as the maping of activity relation that describe the closeness degree of every facility. Mulyati and Rachmi (2011) set the main goal of ARC is to know the relationship closeness of each group’s activity in terms of factory organization. There are six symbols of ARC’s closeness degree.
Table 1. Table closeness degree
Code Closeness Degree A Absolutely necessary E Especially important I Important O Ordinary closeness OK X Undesirable U Unimportant
The dimensionless block diagram is the first attempt and the result of the ARC.
This layout will be the basis for the master layout and plot plan. The following table is the position requirements of placing the relationship codes.

Spektrum Industri, 2014, Vol. 12, No. 2, 113 – 247 ISSN : 1963-6590
116
Table 2. Position in dimensionless block diagram
Code Position A in the top left-hand corner E top right corner I bottom left corner O bottom right corner U relationship omitted X in the center under the department number
E. Simulation Modelling
A model is a simplified representation of reality, the exact way in whuch an operation is performed is not so important as the way in which the operation impacts the rest of the system (Harrell et al, 2012). There are four basic of model building in Simulation Modelling (Promodel 7): location, entities, arrival, and processing.
1. Bonferroni Approach
In Harrell et al. (2012), the statistical methods for making the comparison of system are called hypotheses tests. One of the methods that could be used is Bonferroni Approach. When there are three to about five alternative system designs to compare with respect to some performance measure, the Bonferroni approach is the method to solve it. Given K alternative system designs to compare, the null hypothesis H0 and alternative hypothesis H1 become : H0: = = = . . . . = μ for K alternative systems
H1: ≠ for at least one pair i ≠ i’ where i and i’ are between 1 and K and i < i’. The number of pairwise comparisons for K candidate designs is computed by K(K – 1) / 2.
2. Model Verification and Model Validation
There is a way to do the model verification; using trace and debugging facilities. Comparing with the actual system is one of the techniques that could be used to validate the model. Using the paired-t test for comparing the model with the actual system. In paired-t test, it is necessary for testing the hypotheses;
H0: = 0 H1: ≠ 0
Thus, the paired-t confidence interval for an α level of significance is P( – hw ≤ ≤ + hw) = 1 – α
F. Line Efficiency, Smoothness Index, and Balance Delay
There are three parameters in designing the assembly line balancing. • The efficiency of assembly line (ratio between total workstation time and
multification of cycle time and number of workstations). LE = x 100%
(K) (CT) (5)
LE = efficiency of assembly line STi = workstation time i K = number of workstations
CT = cycle time
Spektrum Industri, 2014, Vol. 12, No. 2, 113 – 247 ISSN : 1963-6590
117
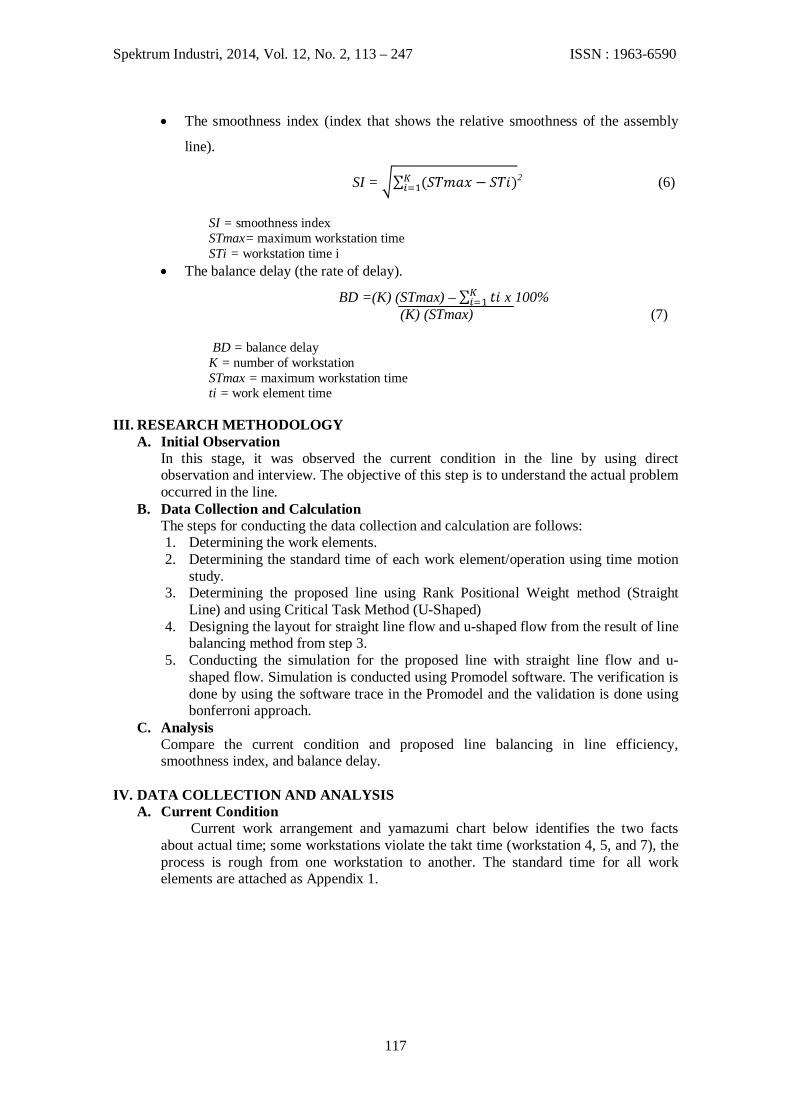
• The smoothness index (index that shows the relative smoothness of the assembly
line).
SI = 2 (6)
SI = smoothness index STmax= maximum workstation time STi = workstation time i
• The balance delay (the rate of delay).
BD =(K) (STmax) – x 100% (K) (STmax) (7)
BD = balance delay K = number of workstation STmax = maximum workstation time ti = work element time
III. RESEARCH METHODOLOGY
A. Initial Observation In this stage, it was observed the current condition in the line by using direct observation and interview. The objective of this step is to understand the actual problem occurred in the line.
B. Data Collection and Calculation The steps for conducting the data collection and calculation are follows: 1. Determining the work elements. 2. Determining the standard time of each work element/operation using time motion
study. 3. Determining the proposed line using Rank Positional Weight method (Straight
Line) and using Critical Task Method (U-Shaped) 4. Designing the layout for straight line flow and u-shaped flow from the result of line
balancing method from step 3. 5. Conducting the simulation for the proposed line with straight line flow and u-
shaped flow. Simulation is conducted using Promodel software. The verification is done by using the software trace in the Promodel and the validation is done using bonferroni approach.
C. Analysis Compare the current condition and proposed line balancing in line efficiency, smoothness index, and balance delay.
IV. DATA COLLECTION AND ANALYSIS
A. Current Condition Current work arrangement and yamazumi chart below identifies the two facts
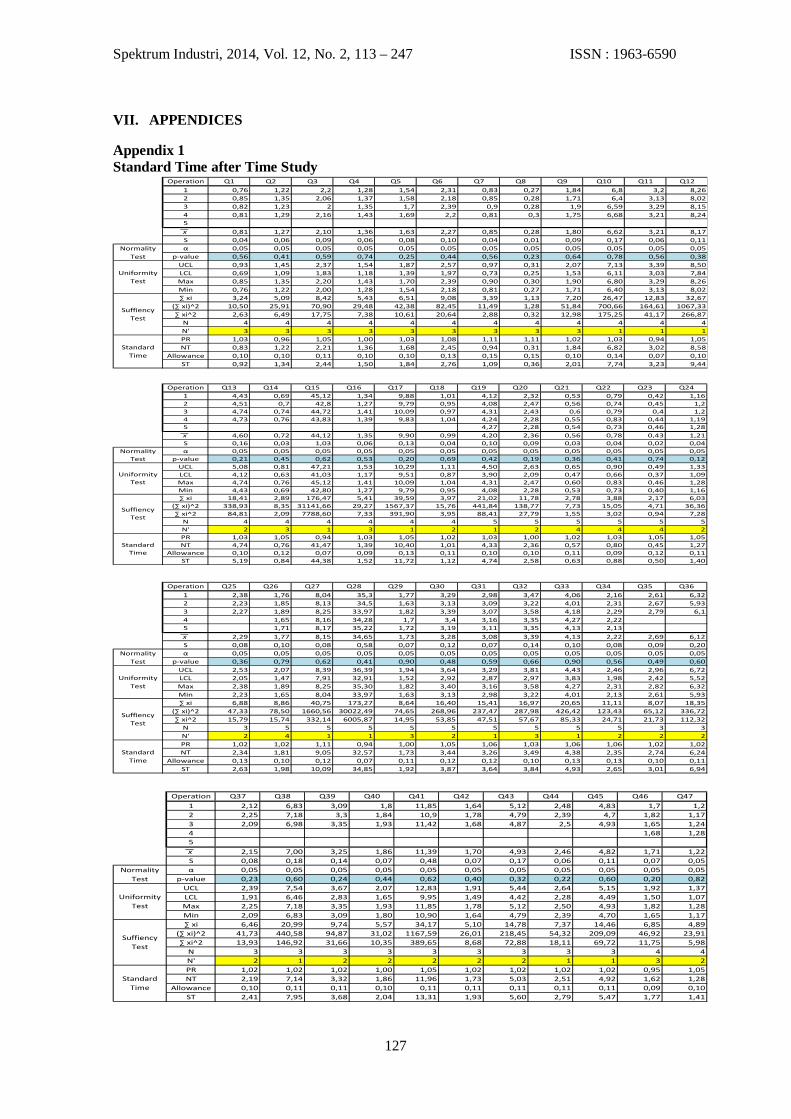
about actual time; some workstations violate the takt time (workstation 4, 5, and 7), the process is rough from one workstation to another. The standard time for all work elements are attached as Appendix 1.

Spektrum Industri, 2014, Vol. 12, No. 2, 113 – 247 ISSN : 1963-6590
118
Table 3. Actual cycle time of work arrangement No Operation Workstation
Time (min) Number of
operator 1 Q1 + Q2 +Q3 4,69 1 2 Q4 + Q5 + Q6 + Q7 + Q8 7,53 1 3 Q9 + Q10 + Q11 + Q12 22,41 1 4 Q13 + Q14 + Q15 + Q16 + Q17 + Q18 64,76 1 5 Q19 + Q20 + Q21 + Q22 + Q23 + Q24 + Q25 + Q26 + Q27 + Q28 60,28 1 6 Q29 + Q30 + Q31 + Q32 + Q33 + Q34 20,84 1
7 Q35 + Q36 + Q37 + Q38 + Q39 + Q40 + Q41 + Q42 + Q43 + Q44 + Q45 55,12 1
8 Q46 + Q47 3,18 1 Total 238,82 8
Figure 1. Actual yamazumi chart of bodyshop
The line efficiency of current condition is calculated using formula number 5 and the result is:
LE = x 100% = 46,1% The smoothness index of each process is shown below:
Table 4. Smoothness Index of Current Line Operator STi (STmax-STi)2
1 4,69 3608,79 2 7,53 3274,80 3 22,41 1793,21 4 64,76 0,00 5 60,28 20,06 6 20,84 1928,91 7 55,12 92,89 8 3,18 3792,13
Total 14510,79 Smoothness Index 120,46
Due to bottleneck and idle time which occur in the bodyshop line, a delay arises. The value of delay is calculated below.
Workstation Time Cycle Time (min)
Spektrum Industri, 2014, Vol. 12, No. 2, 113 – 247 ISSN : 1963-6590
119
BD = = 53,9%
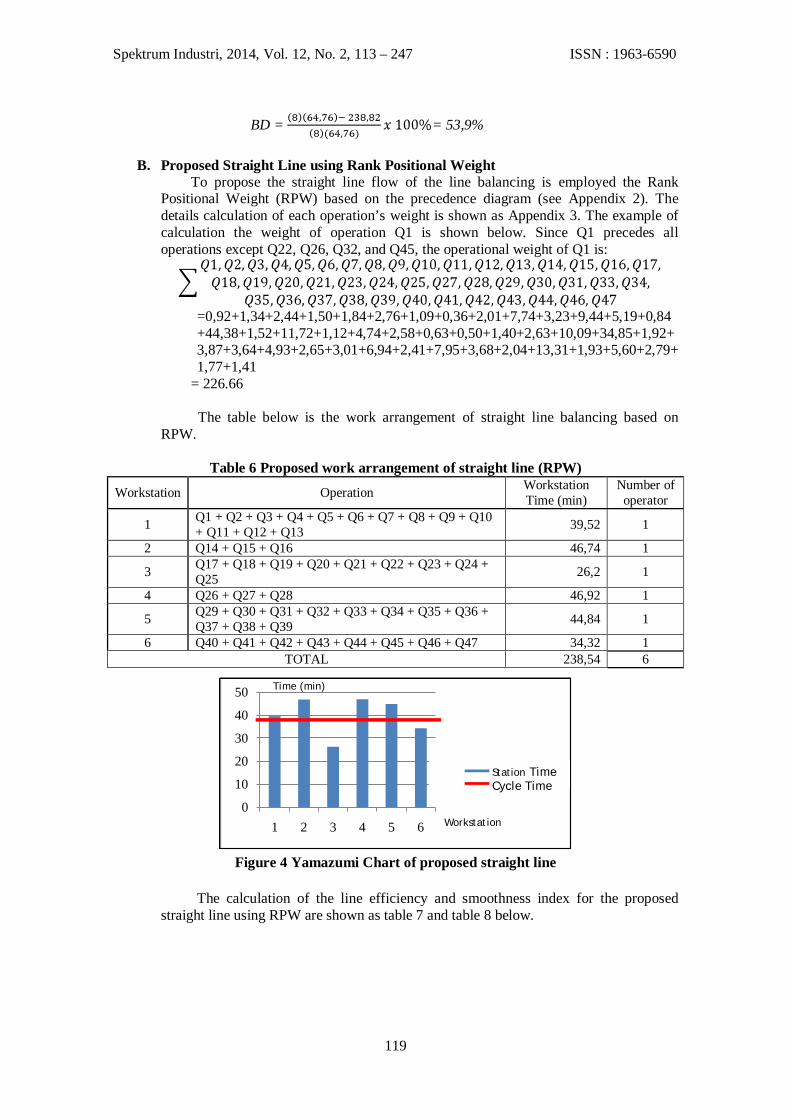
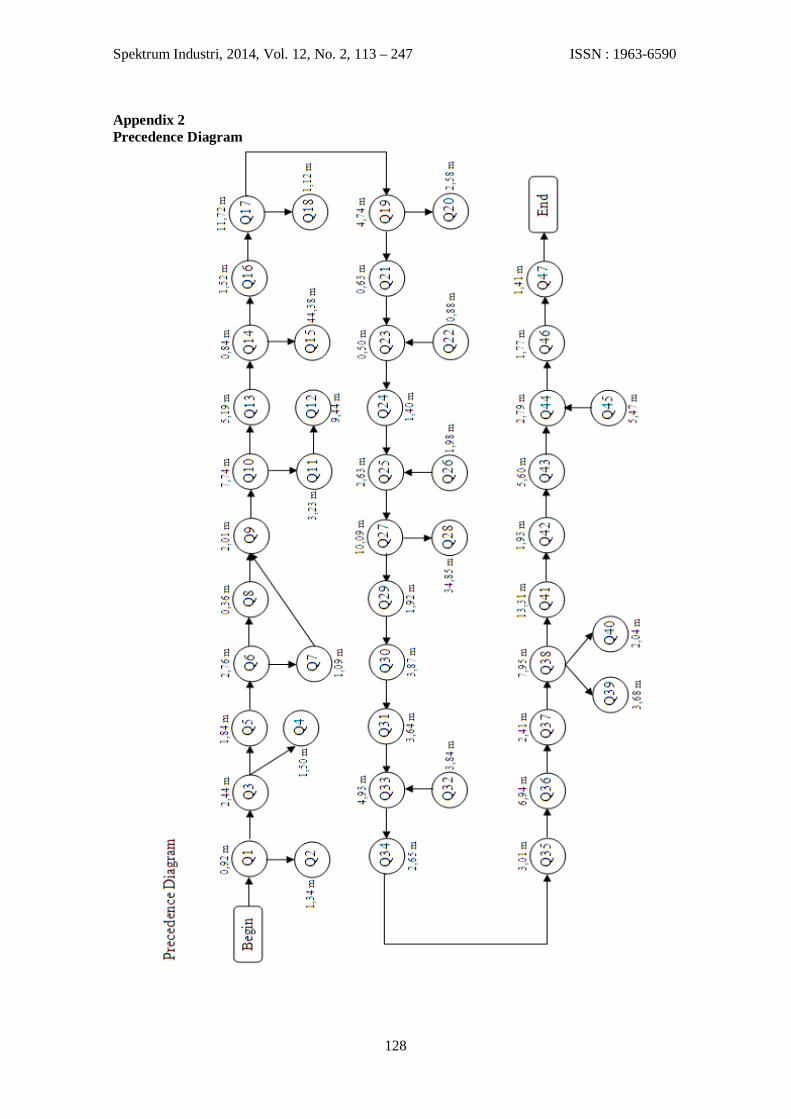
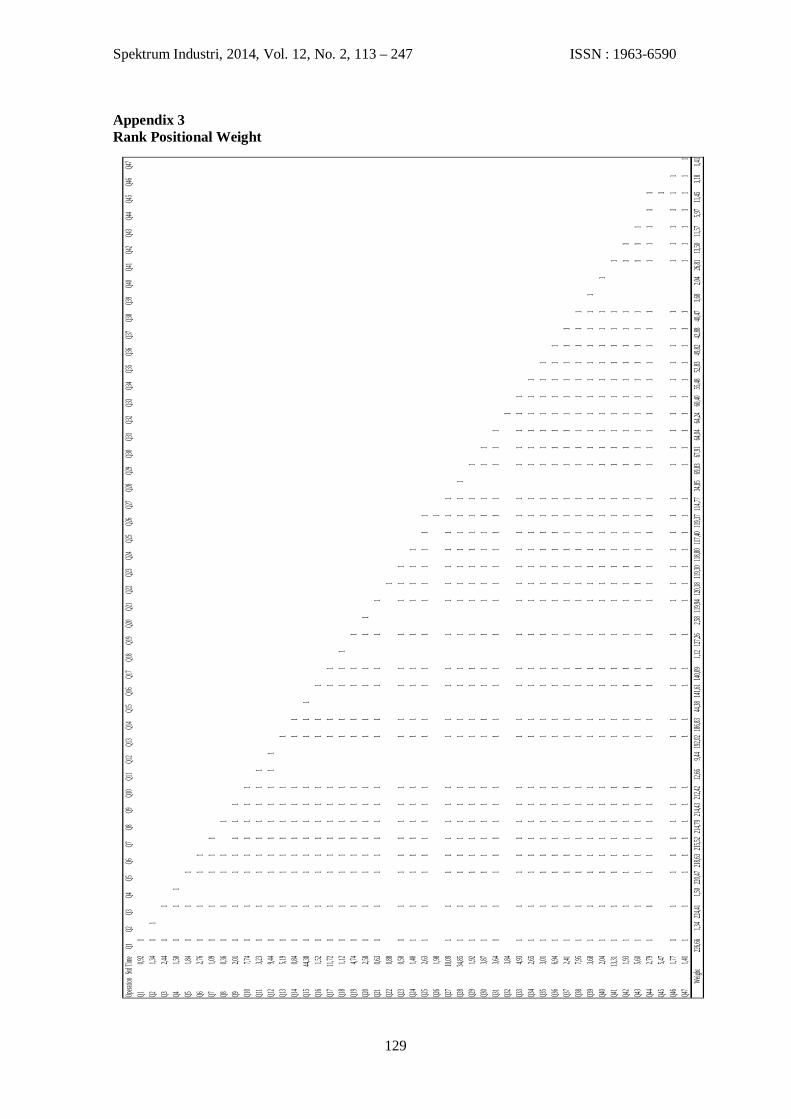
B. Proposed Straight Line using Rank Positional Weight To propose the straight line flow of the line balancing is employed the Rank
Positional Weight (RPW) based on the precedence diagram (see Appendix 2). The details calculation of each operation’s weight is shown as Appendix 3. The example of calculation the weight of operation Q1 is shown below. Since Q1 precedes all operations except Q22, Q26, Q32, and Q45, the operational weight of Q1 is:
=0,92+1,34+2,44+1,50+1,84+2,76+1,09+0,36+2,01+7,74+3,23+9,44+5,19+0,84+44,38+1,52+11,72+1,12+4,74+2,58+0,63+0,50+1,40+2,63+10,09+34,85+1,92+3,87+3,64+4,93+2,65+3,01+6,94+2,41+7,95+3,68+2,04+13,31+1,93+5,60+2,79+1,77+1,41
= 226.66 The table below is the work arrangement of straight line balancing based on
RPW.
Table 6 Proposed work arrangement of straight line (RPW) Workstation Operation Workstation
Time (min) Number of
operator
1 Q1 + Q2 + Q3 + Q4 + Q5 + Q6 + Q7 + Q8 + Q9 + Q10 + Q11 + Q12 + Q13 39,52 1
2 Q14 + Q15 + Q16 46,74 1
3 Q17 + Q18 + Q19 + Q20 + Q21 + Q22 + Q23 + Q24 + Q25 26,2 1
4 Q26 + Q27 + Q28 46,92 1
5 Q29 + Q30 + Q31 + Q32 + Q33 + Q34 + Q35 + Q36 + Q37 + Q38 + Q39 44,84 1
6 Q40 + Q41 + Q42 + Q43 + Q44 + Q45 + Q46 + Q47 34,32 1 TOTAL 238,54 6
Figure 4 Yamazumi Chart of proposed straight line
The calculation of the line efficiency and smoothness index for the proposed
straight line using RPW are shown as table 7 and table 8 below.
0
10
20
30
40
50
1 2 3 4 5 6
Yamazumi …Station TimeCycle Time
Workstation
Time (min)
Spektrum Industri, 2014, Vol. 12, No. 2, 113 – 247 ISSN : 1963-6590
120
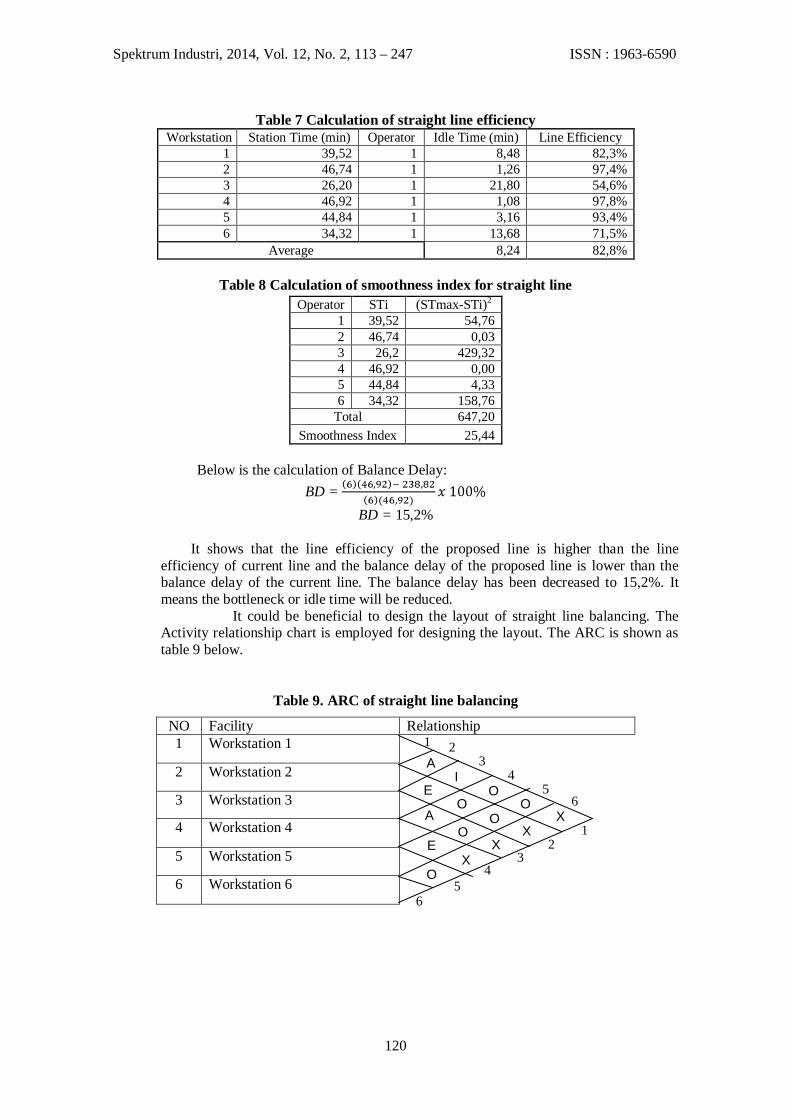
Table 7 Calculation of straight line efficiency Workstation Station Time (min) Operator Idle Time (min) Line Efficiency
1 39,52 1 8,48 82,3% 2 46,74 1 1,26 97,4% 3 26,20 1 21,80 54,6% 4 46,92 1 1,08 97,8% 5 44,84 1 3,16 93,4% 6 34,32 1 13,68 71,5%
Average 8,24 82,8%
Table 8 Calculation of smoothness index for straight line Operator STi (STmax-STi)2
1 39,52 54,76 2 46,74 0,03 3 26,2 429,32 4 46,92 0,00 5 44,84 4,33 6 34,32 158,76
Total 647,20 Smoothness Index 25,44
Below is the calculation of Balance Delay:
BD = BD = 15,2%
It shows that the line efficiency of the proposed line is higher than the line
efficiency of current line and the balance delay of the proposed line is lower than the balance delay of the current line. The balance delay has been decreased to 15,2%. It means the bottleneck or idle time will be reduced.
It could be beneficial to design the layout of straight line balancing. The Activity relationship chart is employed for designing the layout. The ARC is shown as table 9 below.
Table 9. ARC of straight line balancing
NO Facility Relationship 1 Workstation 1
2 Workstation 2
3 Workstation 3
4 Workstation 4
5 Workstation 5
6 Workstation 6
6 5
4 3
2 1
6 5
4 3
2 1
O
E X
X O
A X
O O
E
X O
O I
A
Spektrum Industri, 2014, Vol. 12, No. 2, 113 – 247 ISSN : 1963-6590
121
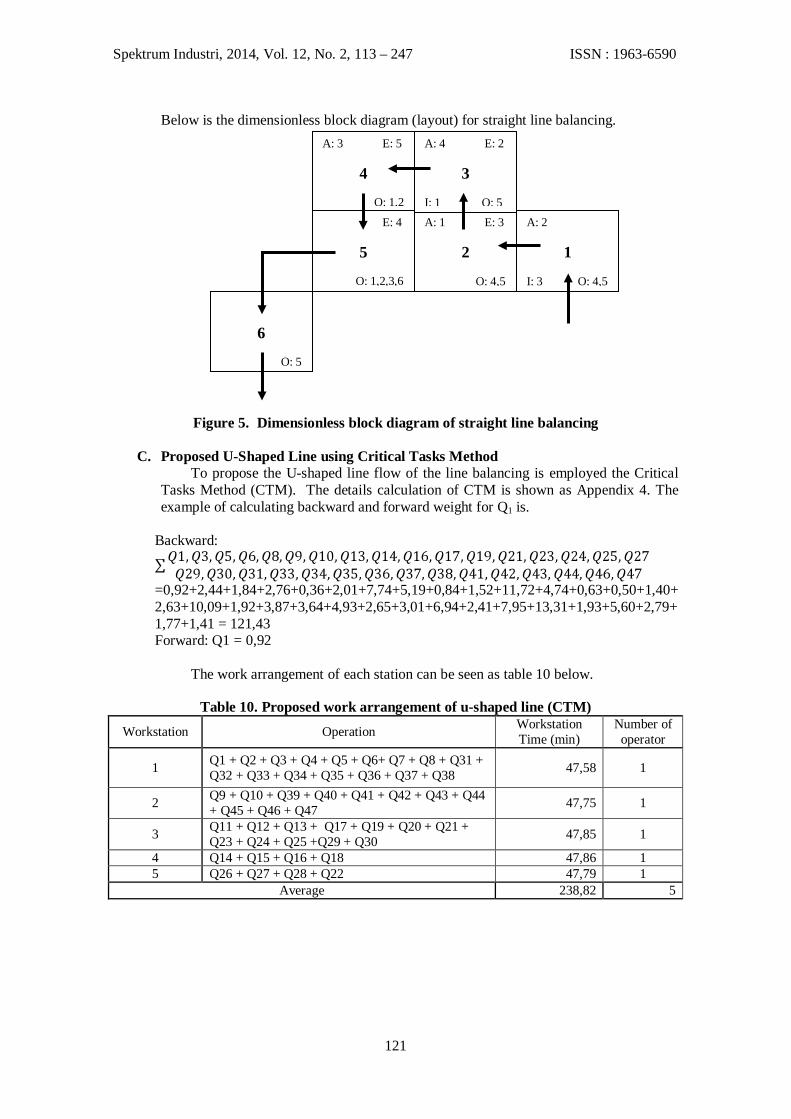
Below is the dimensionless block diagram (layout) for straight line balancing.
Figure 5. Dimensionless block diagram of straight line balancing
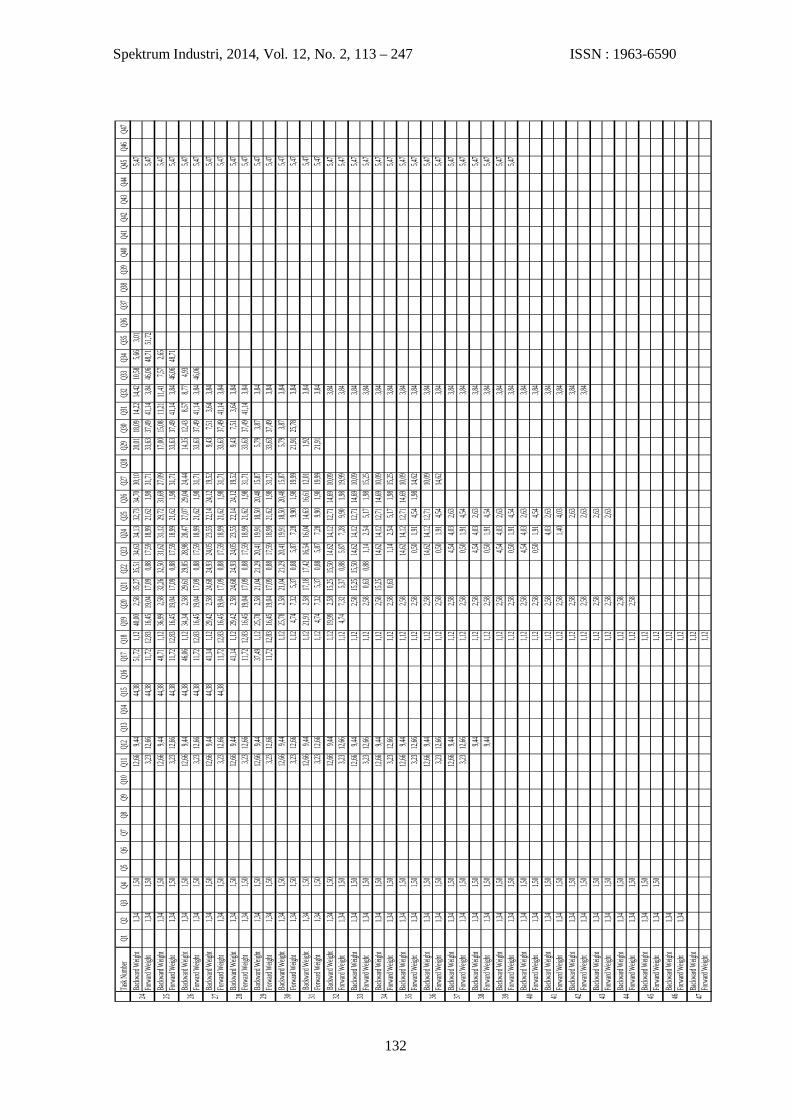
C. Proposed U-Shaped Line using Critical Tasks Method To propose the U-shaped line flow of the line balancing is employed the Critical
Tasks Method (CTM). The details calculation of CTM is shown as Appendix 4. The example of calculating backward and forward weight for Q1 is.
Backward:
=0,92+2,44+1,84+2,76+0,36+2,01+7,74+5,19+0,84+1,52+11,72+4,74+0,63+0,50+1,40+2,63+10,09+1,92+3,87+3,64+4,93+2,65+3,01+6,94+2,41+7,95+13,31+1,93+5,60+2,79+1,77+1,41 = 121,43 Forward: Q1 = 0,92
The work arrangement of each station can be seen as table 10 below.
Table 10. Proposed work arrangement of u-shaped line (CTM) Workstation Operation Workstation
Time (min) Number of operator
1 Q1 + Q2 + Q3 + Q4 + Q5 + Q6+ Q7 + Q8 + Q31 + Q32 + Q33 + Q34 + Q35 + Q36 + Q37 + Q38 47,58 1
2 Q9 + Q10 + Q39 + Q40 + Q41 + Q42 + Q43 + Q44 + Q45 + Q46 + Q47 47,75 1
3 Q11 + Q12 + Q13 + Q17 + Q19 + Q20 + Q21 + Q23 + Q24 + Q25 +Q29 + Q30 47,85 1
4 Q14 + Q15 + Q16 + Q18 47,86 1 5 Q26 + Q27 + Q28 + Q22 47,79 1
Average 238,82 5
A: 2
1
I: 3 O: 4,5
A: 1 E: 3
2
O: 4,5
A: 4 E: 2
3
I: 1 O: 5
A: 3 E: 5
4
O: 1,2 E: 4
5
O: 1,2,3,6
6
O: 5
Spektrum Industri, 2014, Vol. 12, No. 2, 113 – 247 ISSN : 1963-6590
122
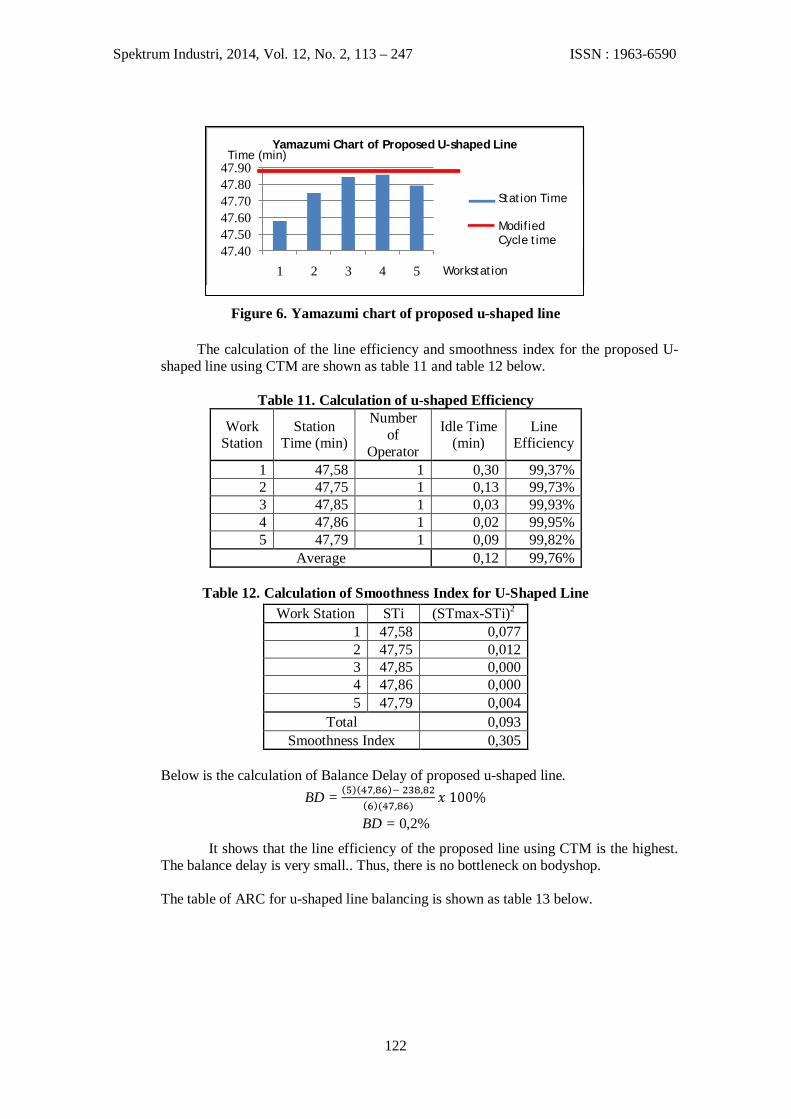
Figure 6. Yamazumi chart of proposed u-shaped line
The calculation of the line efficiency and smoothness index for the proposed U-shaped line using CTM are shown as table 11 and table 12 below.
Table 11. Calculation of u-shaped Efficiency
Work Station
Station Time (min)
Number of
Operator
Idle Time (min)
Line Efficiency
1 47,58 1 0,30 99,37% 2 47,75 1 0,13 99,73% 3 47,85 1 0,03 99,93% 4 47,86 1 0,02 99,95% 5 47,79 1 0,09 99,82%
Average 0,12 99,76%
Table 12. Calculation of Smoothness Index for U-Shaped Line Work Station STi (STmax-STi)2
1 47,58 0,077 2 47,75 0,012 3 47,85 0,000 4 47,86 0,000 5 47,79 0,004
Total 0,093 Smoothness Index 0,305
Below is the calculation of Balance Delay of proposed u-shaped line.
BD =
BD = 0,2%
It shows that the line efficiency of the proposed line using CTM is the highest. The balance delay is very small.. Thus, there is no bottleneck on bodyshop.
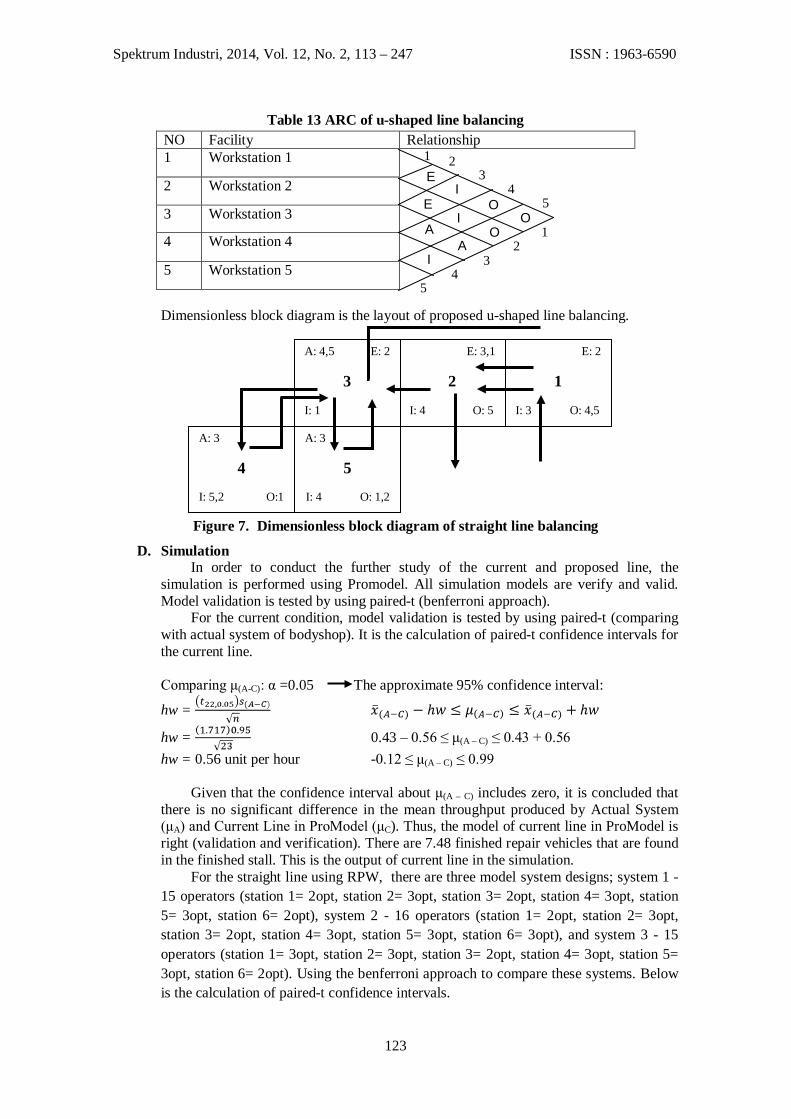
The table of ARC for u-shaped line balancing is shown as table 13 below.
47.4047.5047.6047.7047.8047.90
1 2 3 4 5
Yamazumi Chart of Proposed U-shaped Line
Yamazumi …
Station Time
Modified Cycle time
Workstation
Time (min)
Spektrum Industri, 2014, Vol. 12, No. 2, 113 – 247 ISSN : 1963-6590
123
Table 13 ARC of u-shaped line balancing NO Facility Relationship 1 Workstation 1
2 Workstation 2
3 Workstation 3
4 Workstation 4
5 Workstation 5
Dimensionless block diagram is the layout of proposed u-shaped line balancing.
Figure 7. Dimensionless block diagram of straight line balancing
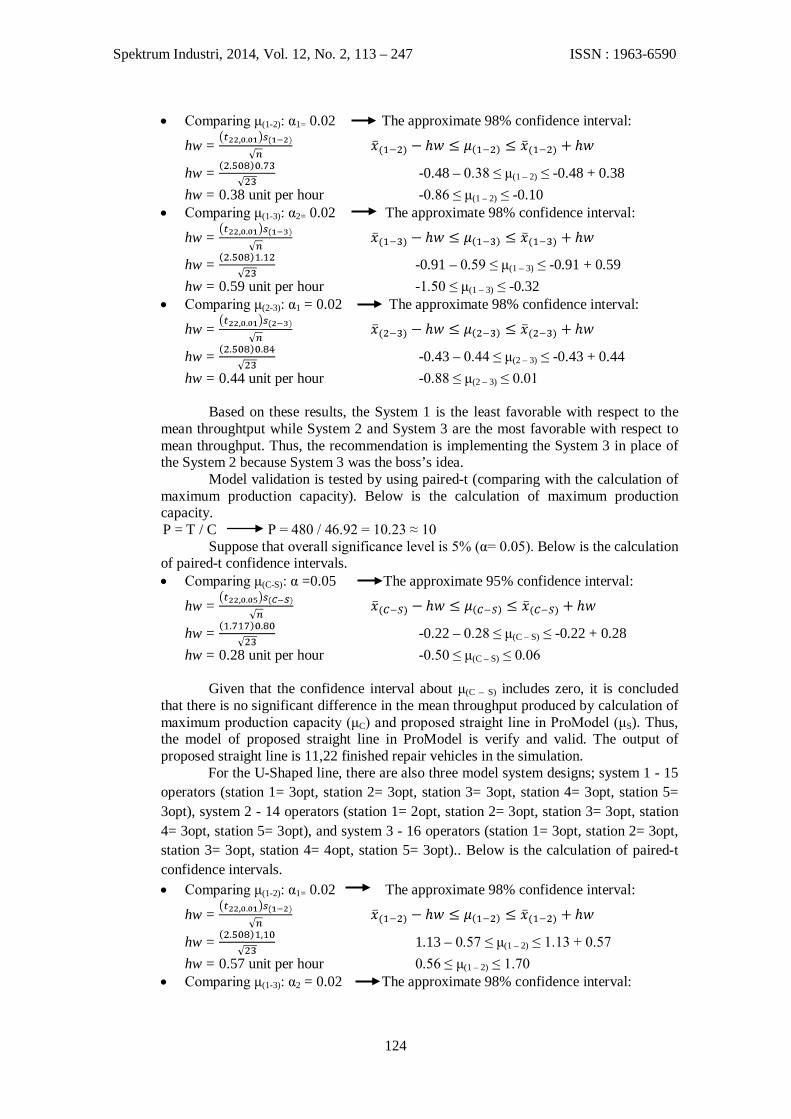
D. Simulation In order to conduct the further study of the current and proposed line, the
simulation is performed using Promodel. All simulation models are verify and valid. Model validation is tested by using paired-t (benferroni approach).
For the current condition, model validation is tested by using paired-t (comparing with actual system of bodyshop). It is the calculation of paired-t confidence intervals for the current line. Comparing μ(A-C): α =0.05 The approximate 95% confidence interval:
hw =
hw = 0.43 – 0.56 ≤ μ(A – C) ≤ 0.43 + 0.56 hw = 0.56 unit per hour -0.12 ≤ μ(A – C) ≤ 0.99
Given that the confidence interval about μ(A – C) includes zero, it is concluded that
there is no significant difference in the mean throughput produced by Actual System (μA) and Current Line in ProModel (μC). Thus, the model of current line in ProModel is right (validation and verification). There are 7.48 finished repair vehicles that are found in the finished stall. This is the output of current line in the simulation.
For the straight line using RPW, there are three model system designs; system 1 -15 operators (station 1= 2opt, station 2= 3opt, station 3= 2opt, station 4= 3opt, station 5= 3opt, station 6= 2opt), system 2 - 16 operators (station 1= 2opt, station 2= 3opt, station 3= 2opt, station 4= 3opt, station 5= 3opt, station 6= 3opt), and system 3 - 15 operators (station 1= 3opt, station 2= 3opt, station 3= 2opt, station 4= 3opt, station 5= 3opt, station 6= 2opt). Using the benferroni approach to compare these systems. Below is the calculation of paired-t confidence intervals.
5 4
3 2
1
5 4
3 2 1
I A
A O I
E O
O I
E
E: 2
1
I: 3 O: 4,5
E: 3,1
2
I: 4 O: 5
A: 4,5 E: 2
3
I: 1
A: 3
4
I: 5,2 O:1
A: 3
5
I: 4 O: 1,2
Spektrum Industri, 2014, Vol. 12, No. 2, 113 – 247 ISSN : 1963-6590
124
• Comparing μ(1-2): α1= 0.02 The approximate 98% confidence interval:
hw =
hw = -0.48 – 0.38 ≤ μ(1 – 2) ≤ -0.48 + 0.38 hw = 0.38 unit per hour -0.86 ≤ μ(1 – 2) ≤ -0.10
• Comparing μ(1-3): α2= 0.02 The approximate 98% confidence interval:
hw =
hw = -0.91 – 0.59 ≤ μ(1 – 3) ≤ -0.91 + 0.59 hw = 0.59 unit per hour -1.50 ≤ μ(1 – 3) ≤ -0.32
• Comparing μ(2-3): α1 = 0.02 The approximate 98% confidence interval:
hw =
hw = -0.43 – 0.44 ≤ μ(2 – 3) ≤ -0.43 + 0.44 hw = 0.44 unit per hour -0.88 ≤ μ(2 – 3) ≤ 0.01
Based on these results, the System 1 is the least favorable with respect to the mean throughtput while System 2 and System 3 are the most favorable with respect to mean throughput. Thus, the recommendation is implementing the System 3 in place of the System 2 because System 3 was the boss’s idea.
Model validation is tested by using paired-t (comparing with the calculation of maximum production capacity). Below is the calculation of maximum production capacity.
P = T / C P = 480 / 46.92 = 10.23 ≈ 10 Suppose that overall significance level is 5% (α= 0.05). Below is the calculation
of paired-t confidence intervals. • Comparing μ(C-S): α =0.05 The approximate 95% confidence interval:
hw =
hw = -0.22 – 0.28 ≤ μ(C – S) ≤ -0.22 + 0.28 hw = 0.28 unit per hour -0.50 ≤ μ(C – S) ≤ 0.06
Given that the confidence interval about μ(C – S) includes zero, it is concluded that there is no significant difference in the mean throughput produced by calculation of maximum production capacity (μC) and proposed straight line in ProModel (μS). Thus, the model of proposed straight line in ProModel is verify and valid. The output of proposed straight line is 11,22 finished repair vehicles in the simulation.
For the U-Shaped line, there are also three model system designs; system 1 - 15 operators (station 1= 3opt, station 2= 3opt, station 3= 3opt, station 4= 3opt, station 5= 3opt), system 2 - 14 operators (station 1= 2opt, station 2= 3opt, station 3= 3opt, station 4= 3opt, station 5= 3opt), and system 3 - 16 operators (station 1= 3opt, station 2= 3opt, station 3= 3opt, station 4= 4opt, station 5= 3opt).. Below is the calculation of paired-t confidence intervals. • Comparing μ(1-2): α1= 0.02 The approximate 98% confidence interval:
hw =
hw = 1.13 – 0.57 ≤ μ(1 – 2) ≤ 1.13 + 0.57 hw = 0.57 unit per hour 0.56 ≤ μ(1 – 2) ≤ 1.70
• Comparing μ(1-3): α2 = 0.02 The approximate 98% confidence interval:
Spektrum Industri, 2014, Vol. 12, No. 2, 113 – 247 ISSN : 1963-6590
125
0.00%10.00%20.00%30.00%40.00%50.00%60.00%
Balance Delay
hw =
hw = -0.48 – 0.61 ≤ μ(1 – 3) ≤ -0.48 + 0.61 hw = 0.61 unit per hour -1.09 ≤ μ(1 – 3) ≤ 0.13
• Comparing μ(2-3): α1= 0.02 The approximate 98% confidence interval:
hw =
hw = -1.61 – 0.47 ≤ μ(2 – 3) ≤ -1.61 + 0.47 hw = 0.47 unit per hour -2.08 ≤ μ(2 – 3) ≤ -1.14 Based on these results, the System 1 is the least favorable with respect to the mean
throughtput while System 2 and System 3 are the most favorable with respect to mean throughput. Model validation is tested by using paired-t (comparing with the calculation of maximum production capacity). Below is the calculation of maximum production capacity.
P = T / C P = 480 / 46.92 = 10.23 ≈ 10 Suppose that overall significance level is 5% (α= 0.05). Below is the calculation of
paired-t confidence intervals. • Comparing μ(C-U): α= 0.05 The approximate 95% confidence interval:
hw =
hw = -0.22 – 0.24 ≤ μ(C – U) ≤ -0.22 + 0.24 hw = 0.24 unit per hour -0.46 ≤ μ(C – U) ≤ 0.02 Given that the confidence interval about μ(C – U) includes zero, it is concluded that
there is no significant difference in the mean throughput produced by calculation of maximum production capacity (μC) and proposed u-shaped line in ProModel (μU). Thus, the model of proposed u-shaped line in ProModel is right (validation and verification). There are 11,83 finished repair vehicles that are found in the finished stall. This is the output of proposed u-shaped line in the simulation.
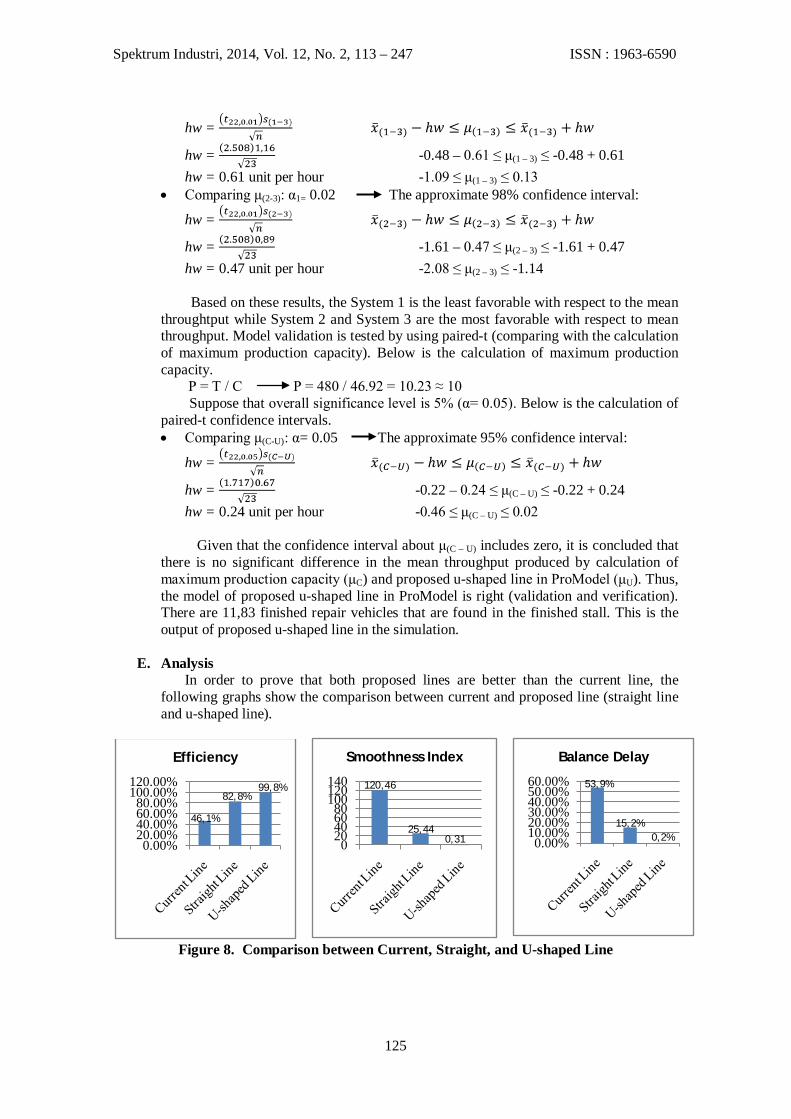
E. Analysis
In order to prove that both proposed lines are better than the current line, the following graphs show the comparison between current and proposed line (straight line and u-shaped line).
Figure 8. Comparison between Current, Straight, and U-shaped Line
0.00%20.00%40.00%60.00%80.00%
100.00%120.00%
Efficiency
46,1%
020406080
100120140
Smoothness Index
99,8% 82,8%
0,2% 15,2%
53,9% 120,46
25,44 0,31
Spektrum Industri, 2014, Vol. 12, No. 2, 113 – 247 ISSN : 1963-6590
126
Figure 8 shows a significant improvement in line efficiency, smoothness index, and balance delay. Although both proposed lines are better than the current line, the proposed u-shaped line is the best line to implement in the body shop. The proposed u-shaped line is significantly increasing the line efficiency and reducing the number of workstations. On contrast, the proposed u-shaped line is not significantly increasing the output of body shop because there is no significant difference between output of proposed straight line and output of proposed u-shaped line. This fact could happened because the main goal of proposed u-shaped line is minimizing the number of workstations. Therefore, the proposed u-shaped line is better than proposed straight line.
V. CONCLUSION There are two ways to improve the line efficiency in the body shop; creating the
accurate standard time by using time study and redesigning the assembly line through heuristic approaches (Rank Positional Weight for straight line balancing and Critical Task Method for u-shaped line balancing). The proposed u-shaped line is significantly increasing the line efficiency and reducing the number of workstations. On contrast, the proposed u-shaped line is not significantly increasing the output of body shop because there is no significant difference between output of proposed straight line and output of proposed u-shaped line. This fact could happened because the main goal of proposed u-shaped line is minimizing the number of workstations. Therefore, the proposed u-shaped line is better than proposed straight line.
VI. REFERENCES [1] Bagher, M., Zandieh, M. & Farsijani, H. Balancing of Stochastic U-type Assembly Line: an
Imperialist Competitive Algorithm. Int J Adv Manuf Technol. 2011. [2] Barnes. Perancangan Keseimbangan Lintasan Produksi untuk Mengurangi Balance Delay
dan Meningkatkan Efisiensi Kerja. Modul6 Perancangan Sistem Produksi Perakitan. 2011. Lab Sistem Produksi IE ITB.
[3] Fathi, M., Alvarez, M. J. & Rodriguez, V. A New Heuristics Approach to Solving U-shape Assembly Line Balancing Problem Type-1. World Academy of Science, Engineering and Technology 59. 2011.
[4] Gasperz, Vincent. (1998). Statistical process control ManajemenBisnis Total. Jakarta: PT. GramediaPustakaUtama.
[5] Harrel, C., Ghosh, Biman K. & Bowden, Royce O. (2012). Simulation using Promodel 3rd edition. New York: McGraw-hill education.
[6] Hayter, A., 2000. Probability and Statistics for Engineers and Scientists 3rd Edition. Thomson.
[7] Karger, D.W. & Bahya, F.H. (1977). Engineering Work Measurement 3rd Edition. New York: The Industrial Press.
[8] Mahmud, A., Mahbubur R. & Ahmad N. Study the Impact of Fatigue and Optimizing Productivity of an Assembly Line of Garment Industry. International Journal of Scientific and Engineering Research volume 2. Issue 11. 2011.
[9] Mulyati, Erna & Rachmi, Ricca. Redesain Layout untuk Meningkatkan Efisiensi Ruangan. Politeknik Pos Indonesia. 2011.
[10] Niebel, B.W. & Freivalds, A. (2003). Niebel’s Methods, Standards, and Work Design 12th Edition. New York: McGraw-Hill.
[11] Sharma, R. (2009). Overview of Precedence Diagram Method (PDM). [12] Sutalaksana, Iftikar Z., Anggawisastra, R. And Tjakraatmadja, J.H. (2006). Teknik
Perancangan Sistem Kerja. Bandung: ITB. [13] Verma, R. & Boyer, Kenneth D. (2010). Operations & Supply Chain Management. South-
Western: Cengage Learning. [14] Wignjosoebroto, S. (2000). Ergonomi, Studi Gerak dan Waktu. Surabaya: Guna Widya. [15] Yeh, D. H. & Kao, H. H. A New Bidirectional Heuristic for the Assembly Line Balancing
Problem. Comput Indu Eng. Vol 57. No 4. pp. 1156-1160. 2009
Spektrum Industri, 2014, Vol. 12, No. 2, 113 – 247 ISSN : 1963-6590
127
VII. APPENDICES
Appendix 1 Standard Time after Time Study
Operation Q1 Q2 Q3 Q4 Q5 Q6 Q7 Q8 Q9 Q10 Q11 Q121 0,76 1,22 2,2 1,28 1,54 2,31 0,83 0,27 1,84 6,8 3,2 8,262 0,85 1,35 2,06 1,37 1,58 2,18 0,85 0,28 1,71 6,4 3,13 8,023 0,82 1,23 2 1,35 1,7 2,39 0,9 0,28 1,9 6,59 3,29 8,154 0,81 1,29 2,16 1,43 1,69 2,2 0,81 0,3 1,75 6,68 3,21 8,245x 0,81 1,27 2,10 1,36 1,63 2,27 0,85 0,28 1,80 6,62 3,21 8,17S 0,04 0,06 0,09 0,06 0,08 0,10 0,04 0,01 0,09 0,17 0,06 0,11α 0,05 0,05 0,05 0,05 0,05 0,05 0,05 0,05 0,05 0,05 0,05 0,05
p-value 0,56 0,41 0,59 0,74 0,25 0,44 0,56 0,23 0,64 0,78 0,56 0,38UCL 0,93 1,45 2,37 1,54 1,87 2,57 0,97 0,31 2,07 7,13 3,39 8,50LCL 0,69 1,09 1,83 1,18 1,39 1,97 0,73 0,25 1,53 6,11 3,03 7,84Max 0,85 1,35 2,20 1,43 1,70 2,39 0,90 0,30 1,90 6,80 3,29 8,26Min 0,76 1,22 2,00 1,28 1,54 2,18 0,81 0,27 1,71 6,40 3,13 8,02∑ xi 3,24 5,09 8,42 5,43 6,51 9,08 3,39 1,13 7,20 26,47 12,83 32,67
(∑ xi)^2 10,50 25,91 70,90 29,48 42,38 82,45 11,49 1,28 51,84 700,66 164,61 1067,33∑ xi^2 2,63 6,49 17,75 7,38 10,61 20,64 2,88 0,32 12,98 175,25 41,17 266,87
N 4 4 4 4 4 4 4 4 4 4 4 4N' 3 3 3 3 3 3 3 3 3 1 1 1PR 1,03 0,96 1,05 1,00 1,03 1,08 1,11 1,11 1,02 1,03 0,94 1,05NT 0,83 1,22 2,21 1,36 1,68 2,45 0,94 0,31 1,84 6,82 3,02 8,58
Allowance 0,10 0,10 0,11 0,10 0,10 0,13 0,15 0,15 0,10 0,14 0,07 0,10ST 0,92 1,34 2,44 1,50 1,84 2,76 1,09 0,36 2,01 7,74 3,23 9,44
Normality Test
Uniformity Test
Suffiency Test
Standard Time
Operation Q13 Q14 Q15 Q16 Q17 Q18 Q19 Q20 Q21 Q22 Q23 Q241 4,43 0,69 45,12 1,34 9,88 1,01 4,12 2,32 0,53 0,79 0,42 1,162 4,51 0,7 42,8 1,27 9,79 0,95 4,08 2,47 0,56 0,74 0,45 1,23 4,74 0,74 44,72 1,41 10,09 0,97 4,31 2,43 0,6 0,79 0,4 1,24 4,73 0,76 43,83 1,39 9,83 1,04 4,24 2,28 0,55 0,83 0,44 1,195 4,27 2,28 0,54 0,73 0,46 1,28x 4,60 0,72 44,12 1,35 9,90 0,99 4,20 2,36 0,56 0,78 0,43 1,21S 0,16 0,03 1,03 0,06 0,13 0,04 0,10 0,09 0,03 0,04 0,02 0,04α 0,05 0,05 0,05 0,05 0,05 0,05 0,05 0,05 0,05 0,05 0,05 0,05
p-value 0,21 0,45 0,62 0,53 0,20 0,69 0,42 0,19 0,36 0,41 0,74 0,12UCL 5,08 0,81 47,21 1,53 10,29 1,11 4,50 2,63 0,65 0,90 0,49 1,33LCL 4,12 0,63 41,03 1,17 9,51 0,87 3,90 2,09 0,47 0,66 0,37 1,09Max 4,74 0,76 45,12 1,41 10,09 1,04 4,31 2,47 0,60 0,83 0,46 1,28Min 4,43 0,69 42,80 1,27 9,79 0,95 4,08 2,28 0,53 0,73 0,40 1,16∑ xi 18,41 2,89 176,47 5,41 39,59 3,97 21,02 11,78 2,78 3,88 2,17 6,03
(∑ xi)^2 338,93 8,35 31141,66 29,27 1567,37 15,76 441,84 138,77 7,73 15,05 4,71 36,36∑ xi^2 84,81 2,09 7788,60 7,33 391,90 3,95 88,41 27,79 1,55 3,02 0,94 7,28
N 4 4 4 4 4 4 5 5 5 5 5 5N' 2 3 1 3 1 2 1 2 4 4 4 2PR 1,03 1,05 0,94 1,03 1,05 1,02 1,03 1,00 1,02 1,03 1,05 1,05NT 4,74 0,76 41,47 1,39 10,40 1,01 4,33 2,36 0,57 0,80 0,45 1,27
Allowance 0,10 0,12 0,07 0,09 0,13 0,11 0,10 0,10 0,11 0,09 0,12 0,11ST 5,19 0,84 44,38 1,52 11,72 1,12 4,74 2,58 0,63 0,88 0,50 1,40
Normality Test
Uniformity Test
Suffiency Test
Standard Time
Operation Q25 Q26 Q27 Q28 Q29 Q30 Q31 Q32 Q33 Q34 Q35 Q361 2,38 1,76 8,04 35,3 1,77 3,29 2,98 3,47 4,06 2,16 2,61 6,322 2,23 1,85 8,13 34,5 1,63 3,13 3,09 3,22 4,01 2,31 2,67 5,933 2,27 1,89 8,25 33,97 1,82 3,39 3,07 3,58 4,18 2,29 2,79 6,14 1,65 8,16 34,28 1,7 3,4 3,16 3,35 4,27 2,225 1,71 8,17 35,22 1,72 3,19 3,11 3,35 4,13 2,13x 2,29 1,77 8,15 34,65 1,73 3,28 3,08 3,39 4,13 2,22 2,69 6,12S 0,08 0,10 0,08 0,58 0,07 0,12 0,07 0,14 0,10 0,08 0,09 0,20α 0,05 0,05 0,05 0,05 0,05 0,05 0,05 0,05 0,05 0,05 0,05 0,05
p-value 0,36 0,79 0,62 0,41 0,90 0,48 0,59 0,66 0,90 0,56 0,49 0,60UCL 2,53 2,07 8,39 36,39 1,94 3,64 3,29 3,81 4,43 2,46 2,96 6,72LCL 2,05 1,47 7,91 32,91 1,52 2,92 2,87 2,97 3,83 1,98 2,42 5,52Max 2,38 1,89 8,25 35,30 1,82 3,40 3,16 3,58 4,27 2,31 2,82 6,32Min 2,23 1,65 8,04 33,97 1,63 3,13 2,98 3,22 4,01 2,13 2,61 5,93∑ xi 6,88 8,86 40,75 173,27 8,64 16,40 15,41 16,97 20,65 11,11 8,07 18,35
(∑ xi)^2 47,33 78,50 1660,56 30022,49 74,65 268,96 237,47 287,98 426,42 123,43 65,12 336,72∑ xi^2 15,79 15,74 332,14 6005,87 14,95 53,85 47,51 57,67 85,33 24,71 21,73 112,32
N 3 5 5 5 5 5 5 5 5 5 3 3N' 2 4 1 1 3 2 1 3 1 2 2 2PR 1,02 1,02 1,11 0,94 1,00 1,05 1,06 1,03 1,06 1,06 1,02 1,02NT 2,34 1,81 9,05 32,57 1,73 3,44 3,26 3,49 4,38 2,35 2,74 6,24
Allowance 0,13 0,10 0,12 0,07 0,11 0,12 0,12 0,10 0,13 0,13 0,10 0,11ST 2,63 1,98 10,09 34,85 1,92 3,87 3,64 3,84 4,93 2,65 3,01 6,94
Normality Test
Uniformity Test
Suffiency Test
Standard Time
Operation Q37 Q38 Q39 Q40 Q41 Q42 Q43 Q44 Q45 Q46 Q471 2,12 6,83 3,09 1,8 11,85 1,64 5,12 2,48 4,83 1,7 1,22 2,25 7,18 3,3 1,84 10,9 1,78 4,79 2,39 4,7 1,82 1,173 2,09 6,98 3,35 1,93 11,42 1,68 4,87 2,5 4,93 1,65 1,244 1,68 1,285x 2,15 7,00 3,25 1,86 11,39 1,70 4,93 2,46 4,82 1,71 1,22S 0,08 0,18 0,14 0,07 0,48 0,07 0,17 0,06 0,11 0,07 0,05α 0,05 0,05 0,05 0,05 0,05 0,05 0,05 0,05 0,05 0,05 0,05
p-value 0,23 0,60 0,24 0,44 0,62 0,40 0,32 0,22 0,60 0,20 0,82UCL 2,39 7,54 3,67 2,07 12,83 1,91 5,44 2,64 5,15 1,92 1,37LCL 1,91 6,46 2,83 1,65 9,95 1,49 4,42 2,28 4,49 1,50 1,07Max 2,25 7,18 3,35 1,93 11,85 1,78 5,12 2,50 4,93 1,82 1,28Min 2,09 6,83 3,09 1,80 10,90 1,64 4,79 2,39 4,70 1,65 1,17∑ xi 6,46 20,99 9,74 5,57 34,17 5,10 14,78 7,37 14,46 6,85 4,89
(∑ xi)^2 41,73 440,58 94,87 31,02 1167,59 26,01 218,45 54,32 209,09 46,92 23,91∑ xi^2 13,93 146,92 31,66 10,35 389,65 8,68 72,88 18,11 69,72 11,75 5,98
N 3 3 3 3 3 3 3 3 3 4 4N' 2 1 2 2 2 2 2 1 1 3 2PR 1,02 1,02 1,02 1,00 1,05 1,02 1,02 1,02 1,02 0,95 1,05NT 2,19 7,14 3,32 1,86 11,96 1,73 5,03 2,51 4,92 1,62 1,28
Allowance 0,10 0,11 0,11 0,10 0,11 0,11 0,11 0,11 0,11 0,09 0,10ST 2,41 7,95 3,68 2,04 13,31 1,93 5,60 2,79 5,47 1,77 1,41
Normality Test
Uniformity Test
Suffiency Test
Standard Time
Spektrum Industri, 2014, Vol. 12, No. 2, 113 – 247 ISSN : 1963-6590
128
Appendix 2 Precedence Diagram
Spektrum Industri, 2014, Vol. 12, No. 2, 113 – 247 ISSN : 1963-6590
129
Appendix 3 Rank Positional Weight
Operati
onStd
Time
Q1Q2
Q3Q4
Q5Q6
Q7Q8
Q9Q10
Q11Q12
Q13Q14
Q15Q16
Q17Q18
Q19Q20
Q21Q22
Q23Q24
Q25Q26
Q27Q28
Q29Q30
Q31Q32
Q33Q34
Q35Q36
Q37Q38
Q39Q40
Q41Q42
Q43Q44
Q45Q46
Q47Q1
0,92
1Q2
1,34
11
Q32,4
41
1Q4
1,50
11
1Q5
1,84
11
1Q6
2,76
11
11
Q71,0
91
11
11
Q80,3
61
11
11
Q92,0
11
11
11
11
Q107,7
41
11
11
11
1Q11
3,23
11
11
11
11
1Q12
9,44
11
11
11
11
11
Q135,1
91
11
11
11
11
Q140,8
41
11
11
11
11
1Q15
44,38
11
11
11
11
11
1Q16
1,52
11
11
11
11
11
1Q17
11,72
11
11
11
11
11
11
Q181,1
21
11
11
11
11
11
11
Q194,7
41
11
11
11
11
11
11
Q202,5
81
11
11
11
11
11
11
1Q21
0,63
11
11
11
11
11
11
11
Q220,8
81
Q230,5
01
11
11
11
11
11
11
11
1Q24
1,40
11
11
11
11
11
11
11
11
1Q25
2,63
11
11
11
11
11
11
11
11
11
1Q26
1,98
1Q27
10,09
11
11
11
11
11
11
11
11
11
11
Q2834,
851
11
11
11
11
11
11
11
11
11
11
Q291,9
21
11
11
11
11
11
11
11
11
11
11
Q303,8
71
11
11
11
11
11
11
11
11
11
11
1Q31
3,64
11
11
11
11
11
11
11
11
11
11
11
1Q32
3,84
1Q33
4,93
11
11
11
11
11
11
11
11
11
11
11
11
1Q34
2,65
11
11
11
11
11
11
11
11
11
11
11
11
11
Q353,0
11
11
11
11
11
11
11
11
11
11
11
11
11
11
Q366,9
41
11
11
11
11
11
11
11
11
11
11
11
11
11
1Q37
2,41
11
11
11
11
11
11
11
11
11
11
11
11
11
11
1Q38
7,95
11
11
11
11
11
11
11
11
11
11
11
11
11
11
11
Q393,6
81
11
11
11
11
11
11
11
11
11
11
11
11
11
11
11
Q402,0
41
11
11
11
11
11
11
11
11
11
11
11
11
11
11
11
Q4113,
311
11
11
11
11
11
11
11
11
11
11
11
11
11
11
11
Q421,9
31
11
11
11
11
11
11
11
11
11
11
11
11
11
11
11
1Q43
5,60
11
11
11
11
11
11
11
11
11
11
11
11
11
11
11
11
1Q44
2,79
11
11
11
11
11
11
11
11
11
11
11
11
11
11
11
11
11
1Q45
5,47
1Q46
1,77
11
11
11
11
11
11
11
11
11
11
11
11
11
11
11
11
11
11
Q471,4
11
11
11
11
11
11
11
11
11
11
11
11
11
11
11
11
11
11
11
226,66
1,34
224,41
1,50
220,47
218,63
215,52
214,79
214,43
212,42
12,66
9,44
192,02
186,83
44,38
141,61
140,09
1,12
127,26
2,58
119,94
120,18
119,30
118,80
117,40
119,37
114,77
34,85
69,83
67,91
64,04
64,24
60,40
55,48
52,83
49,82
42,88
40,47
3,68
2,04
26,81
13,50
11,57
5,97
11,45
3,18
1,41
Weigh
t

Spektrum Industri, 2014, Vol. 12, No. 2, 113 – 247 ISSN : 1963-6590
130
Following table shows how the combination is determined after having RPW
Workstation
Work Element PW Immediate
Predecessor Std Time Number of Operator
Cummulative per workstation
Unassigned per Workstation
1 Q1 226,66 0,92 1 39,52 8,481 Q3 224,41 Q1 2,44 1 39,52 8,481 Q5 220,47 Q3 1,50 1 39,52 8,481 Q6 218,63 Q5 2,76 1 39,52 8,481 Q7 215,52 Q6 1,09 1 39,52 8,481 Q8 214,79 Q6 0,36 1 39,52 8,481 Q9 214,43 Q7, Q8 2,01 1 39,52 8,481 Q10 212,42 Q9 7,74 1 39,52 8,481 Q13 192,02 Q10 5,19 1 39,52 8,482 Q14 186,83 Q13 0,84 1 46,74 1,262 Q16 141,61 Q14 1,52 1 46,74 1,263 Q17 140,09 Q16 11,72 1 26,2 21,83 Q19 127,26 Q17 4,74 1 26,2 21,83 Q22 120,18 0,88 1 26,2 21,83 Q21 119,94 Q19 0,63 1 26,2 21,84 Q26 119,37 1,98 1 46,92 1,083 Q23 119,3 Q21, Q22 0,50 1 26,2 21,83 Q24 118,8 Q23 1,40 1 26,2 21,83 Q25 117,4 Q24, Q26 2,63 1 26,2 21,84 Q27 114,77 Q25 10,09 1 46,92 1,085 Q29 69,83 Q27 1,92 1 44,84 3,165 Q30 67,91 Q29 3,87 1 44,84 3,165 Q32 64,24 3,84 1 44,84 3,165 Q31 64,04 Q30 3,64 1 44,84 3,165 Q33 60,4 Q31, Q32 4,93 1 44,84 3,165 Q34 55,48 Q33 2,65 1 44,84 3,165 Q35 52,83 Q34 3,01 1 44,84 3,165 Q36 49,82 Q35 6,94 1 44,84 3,162 Q15 44,38 Q14 44,38 1 46,74 1,265 Q37 42,88 Q36 2,41 1 44,84 3,165 Q38 40,47 Q37 7,95 1 44,84 3,164 Q28 34,85 Q27 34,85 1 46,92 1,086 Q41 26,81 Q38 13,31 1 34,32 13,686 Q42 13,5 Q41 1,93 1 34,32 13,681 Q11 12,66 Q10 3,23 1 39,52 8,486 Q43 11,57 Q42 5,60 1 34,32 13,686 Q45 11,45 5,47 1 34,32 13,681 Q12 9,44 Q11 9,44 1 39,52 8,486 Q44 5,97 Q43, Q45 2,79 1 34,32 13,685 Q39 3,68 Q38 3,68 1 44,84 3,166 Q46 3,18 Q44 1,77 1 34,32 13,683 Q20 2,58 Q19 2,58 1 26,2 21,86 Q40 2,04 Q38 2,04 1 34,32 13,681 Q4 1,5 Q3 1,50 1 39,52 8,486 Q47 1,41 Q46 1,41 1 34,32 13,681 Q2 1,34 Q1 1,34 1 39,52 8,483 Q18 1,12 Q17 1,12 1 26,2 21,8

Spektrum Industri, 2014, Vol. 12, No. 2, 113 – 247 ISSN : 1963-6590
131
Appendix 4 Critical Task Method
Task N
umber
Q1Q2
Q3Q4
Q5Q6
Q7Q8
Q9Q1
0Q1
1Q1
2Q1
3Q1
4Q1
5Q1
6Q1
7Q1
8Q1
9Q2
0Q2
1Q2
2Q2
3Q2
4Q2
5Q2
6Q2
7Q2
8Q2
9Q3
0Q3
1Q3
2Q3
3Q3
4Q3
5Q3
6Q3
7Q3
8Q3
9Q4
0Q4
1Q4
2Q4
3Q4
4Q4
5Q4
6Q4
7Bac
kward
Weig
ht121
,431,3
4120,
511,5
0118,
08116
,24114
,21113
,48113
,12111
,1112,
669,4
4103,
3798,
1944,
3897,
3495,
821,1
284,
112,5
879,
3779,
6278,
7478,
2376,
8378,
8174,
2034,
8564,
1262,
2058,
3358,
5354,
6949,
7647,
1144,
1137,
1634,
763,6
82,0
426,
8113,
5011,
575,9
711,
453,1
81,4
1For
ward W
eight
0,92
2,25
3,35
4,85
5,19
7,95
9,03
8,31
10,32
18,06
21,28
30,72
23,24
24,09
68,46
25,61
37,32
38,44
42,06
44,64
42,69
0,88
43,20
44,60
47,23
1,98
57,31
92,16
59,23
63,10
66,74
3,84
71,67
74,31
77,32
84,27
86,67
94,62
98,30
96,66
107,93
109,86
115,46
118,25
5,471
20,02
121,43
Backw
ard W
eight
1,341
20,51
1,501
18,08
116,24
114,21
113,48
113,12
111,11
12,66
9,441
03,37
98,19
44,38
97,34
95,82
1,12
84,11
2,58
79,37
79,62
78,74
78,23
76,83
78,81
74,20
34,85
64,12
62,20
58,33
58,53
54,69
49,76
47,11
44,11
37,16
34,76
3,68
2,04
26,81
13,50
11,57
5,97
11,45
3,18
1,41
Forwar
d Weig
ht1,3
42,4
43,9
34,2
77,0
38,1
27,3
99,4
017,
1420,
3729,
8022,
3323,
1767,
5524,
6936,
4137,
5241,
1443,
7341,
780,8
842,
2843,
6846,
311,9
856,
4091,
2558,
3262,
1965,
833,8
470,
7573,
4076,
4183,
3585,
7693,
7097,
3895,
74107
,01108
,94114
,54117
,335,4
7119,
11120
,51Bac
kward
Weig
ht1,3
41,5
0118,
08116
,24114
,21113
,48113
,12111
,1112,
669,4
4103,
3798,
1944,
3897,
3495,
821,1
284,
112,5
879,
3779,
6278,
7478,
2376,
8378,
8174,
2034,
8564,
1262,
2058,
3358,
5354,
6949,
7647,
1144,
1137,
1634,
763,6
82,0
426,
8113,
5011,
575,9
711,
453,1
81,4
1For
ward W
eight
1,34
1,50
1,84
4,60
5,68
4,95
6,96
14,70
17,93
27,37
19,89
20,73
65,11
22,25
33,97
35,09
38,71
41,29
39,34
0,88
39,84
41,25
43,87
1,98
53,96
88,81
55,88
59,75
63,39
3,84
68,31
70,96
73,97
80,91
83,32
91,27
94,95
93,30
104,58
106,51
112,10
114,90
5,471
16,67
118,08
Backw
ard W
eight
1,34
1,50
116,24
114,21
113,48
113,12
111,11
12,66
9,441
03,37
98,19
44,38
97,34
95,82
1,12
84,11
2,58
79,37
79,62
78,74
78,23
76,83
78,81
74,20
34,85
64,12
62,20
58,33
58,53
54,69
49,76
47,11
44,11
37,16
34,76
3,68
2,04
26,81
13,50
11,57
5,97
11,45
3,18
1,41
Forwar
d Weig
ht1,3
41,5
02,7
63,8
43,1
25,1
312,
8716,
0925,
5318,
0518,
9063,
2720,
4232,
1333,
2536,
8739,
4537,
500,8
838,
0039,
4142,
041,9
852,
1286,
9754,
0457,
9161,
553,8
466,
4869,
1272,
1379,
0781,
4889,
4393,
1191,
46102
,74104
,67110
,27113
,065,4
7114,
83116
,24Bac
kward
Weig
ht1,3
41,5
0114
,21113
,48113
,12111
,1112,
669,4
4103,
3798,
1944,
3897,
3495,
821,1
284,
112,5
879,
3779,
6278,
7478,
2376,
8378,
8174,
2034,
8564,
1262,
2058,
3358,
5354,
6949,
7647,
1144,
1137,
1634,
763,6
82,0
426,
8113,
5011,
575,9
711,
453,1
81,4
1For
ward W
eight
1,34
1,50
1,09
0,36
2,37
10,11
13,34
22,77
15,30
16,14
60,51
17,66
29,37
30,49
34,11
36,69
34,74
0,88
35,25
36,65
39,28
1,98
49,36
84,22
51,29
55,15
58,79
3,84
63,72
66,37
69,38
76,32
78,72
86,67
90,35
88,71
99,98
101,91
107,51
110,30
5,471
12,07
113,48
Backw
ard W
eight
1,34
1,50
113,48
113,12
111,11
12,66
9,441
03,37
98,19
44,38
97,34
95,82
1,12
84,11
2,58
79,37
79,62
78,74
78,23
76,83
78,81
74,20
34,85
64,12
62,20
58,33
58,53
54,69
49,76
47,11
44,11
37,16
34,76
3,68
2,04
26,81
13,50
11,57
5,97
11,45
3,18
1,41
Forwar
d Weig
ht1,3
41,5
00,3
62,3
710,
1113,
3422,
7715,
3016,
1460,
5117,
6629,
3730,
4934,
1136,
6934,
740,8
835,
2536,
6539,
281,9
849,
3684,
2251,
2955,
1558,
793,8
463,
7266,
3769,
3876,
3278,
7286,
6790,
3588,
7199,
98101
,91107
,51110
,305,4
7112,
07113
,48Bac
kward
Weig
ht1,3
41,5
0113
,12111
,1112,
669,4
4103,
3798,
1944,
3897,
3495,
821,1
284,
112,5
879,
3779,
6278,
7478,
2376,
8378,
8174,
2034,
8564,
1262,
2058,
3358,
5354,
6949,
7647,
1144,
1137,
1634,
763,6
82,0
426,
8113,
5011,
575,9
711,
453,1
81,4
1For
ward W
eight
1,34
1,50
2,01
9,75
12,98
22,41
14,94
15,78
60,16
17,30
29,02
30,13
33,75
36,34
34,39
0,88
34,89
36,29
38,92
1,98
49,01
83,86
50,93
54,80
58,44
3,84
63,36
66,01
69,02
75,96
78,37
86,31
89,99
88,35
99,62
101,55
107,15
109,94
5,471
11,72
113,12
Backw
ard W
eight
1,34
1,50
111,72
109,71
12,66
9,441
01,97
96,78
44,38
95,94
94,42
1,12
82,70
2,58
77,96
78,21
77,33
76,83
75,42
77,40
72,80
34,85
62,71
60,79
56,92
57,12
53,28
48,36
45,71
42,70
35,76
33,35
3,68
2,04
25,40
12,09
10,16
4,57
10,04
1,77
Forwar
d Weig
ht1,3
41,5
02,0
19,7
512,
9822,
4114,
9415,
7860,
1617,
3029,
0230,
1333,
7536,
3434,
390,8
834,
8936,
2938,
921,9
849,
0183,
8650,
9354,
8058,
443,8
463,
3666,
0169,
0275,
9678,
3786,
3189,
9988,
3599,
62101
,55107
,15109
,945,4
7111,
72Bac
kward
Weig
ht1,3
41,5
0109
,94107
,9312,
669,4
4100,
1995,
0044,
3894,
1692,
641,1
280,
932,5
876,
1976,
4475,
5675,
0573,
6575,
6371,
0234,
8560,
9459,
0155,
1555,
3551,
5146,
5843,
9340,
9233,
9831,
583,6
82,0
423,
6310,
328,3
92,7
98,2
6For
ward W
eight
1,34
1,50
2,01
9,75
12,98
22,41
14,94
15,78
60,16
17,30
29,02
30,13
33,75
36,34
34,39
0,88
34,89
36,29
38,92
1,98
49,01
83,86
50,93
54,80
58,44
3,84
63,36
66,01
69,02
75,96
78,37
86,31
89,99
88,35
99,62
101,55
107,15
109,94
5,47
Backw
ard W
eight
1,34
1,50
107,93
12,66
9,441
00,19
95,00
44,38
94,16
92,64
1,12
80,93
2,58
76,19
76,44
75,56
75,05
73,65
75,63
71,02
34,85
60,94
59,01
55,15
55,35
51,51
46,58
43,93
40,92
33,98
31,58
3,68
2,04
23,63
10,32
8,39
2,79
8,26
Forwar
d Weig
ht1,3
41,5
07,7
410,
9720,
4012,
9313,
7758,
1515,
2927,
0128,
1231,
7434,
3332,
380,8
832,
8834,
2836,
911,9
847,
0081,
8548,
9252,
7856,
433,8
461,
3564,
0067,
0173,
9576,
3584,
3087,
9886,
3497,
6199,
54105
,14107
,935,4
7Bac
kward
Weig
ht1,3
41,5
012,
669,4
4100,
1995,
0044,
3894,
1692,
641,1
280,
932,5
876,
1976,
4475,
5675,
0573,
6575,
6371,
0234,
8560,
9459,
0155,
1555,
3551,
5146,
5843,
9340,
9233,
9831,
583,6
82,0
423,
6310,
328,3
92,7
98,2
6For
ward W
eight
1,34
1,50
3,23
12,66
5,19
6,03
50,41
7,55
19,27
20,38
24,00
26,59
24,64
0,88
25,14
26,54
29,17
1,98
39,26
74,11
41,18
45,05
48,69
3,84
53,61
56,26
59,27
66,21
68,62
76,56
80,24
78,60
89,87
91,80
97,40
100,19
5,47
Backw
ard W
eight
1,34
1,50
12,66
9,44
97,40
92,21
44,38
91,37
89,85
1,12
78,13
2,58
73,40
73,64
72,76
72,26
70,86
72,83
68,23
34,85
58,14
56,22
52,35
52,55
48,71
43,79
41,14
38,13
31,19
28,78
3,68
2,04
20,84
7,53
5,60
5,47
Forwar
d Weig
ht1,3
41,5
03,2
312,
665,1
96,0
350,
417,5
519,
2720,
3824,
0026,
5924,
640,8
825,
1426,
5429,
171,9
839,
2674,
1141,
1845,
0548,
693,8
453,
6156,
2659,
2766,
2168,
6276,
5680,
2478,
6089,
8791,
8097,
405,4
7Bac
kward
Weig
ht1,3
41,5
012,
669,4
491,
8086,
6244,
3885,
7784,
251,1
272,
542,5
867,
8068,
0567,
1766,
6665,
2667,
2462,
6334,
8552,
5550,
6346,
7646,
9643,
1238,
1935,
5432,
5325,
5923,
193,6
82,0
415,
241,9
35,4
7For
ward W
eight
1,34
1,50
3,23
12,66
5,19
6,03
50,41
7,55
19,27
20,38
24,00
26,59
24,64
0,88
25,14
26,54
29,17
1,98
39,26
74,11
41,18
45,05
48,69
3,84
53,61
56,26
59,27
66,21
68,62
76,56
80,24
78,60
89,87
91,80
5,47
Backw
ard W
eight
1,34
1,50
12,66
9,44
89,87
84,69
44,38
83,84
82,32
1,12
70,61
2,58
65,87
66,12
65,24
64,73
63,33
65,31
60,70
34,85
50,62
48,70
44,83
45,03
41,19
36,26
33,61
30,61
23,66
21,26
3,68
2,04
13,31
5,47
Forwar
d Weig
ht1,3
41,5
03,2
312,
665,1
96,0
350,
417,5
519,
2720,
3824,
0026,
5924,
640,8
825,
1426,
5429,
171,9
839,
2674,
1141,
1845,
0548,
693,8
453,
6156,
2659,
2766,
2168,
6276,
5680,
2478,
6089,
875,4
7Bac
kward
Weig
ht1,3
41,5
012,
669,4
476,
5671,
3744,
3870,
5369,
011,1
257,
302,5
852,
5652,
8051,
9351,
4250,
0252,
0047,
3934,
8537,
3035,
3831,
5231,
7227,
8822,
9520,
3017,
2910,
357,9
53,6
82,0
45,4
7For
ward W
eight
1,34
1,50
3,23
12,66
5,19
6,03
50,41
7,55
19,27
20,38
24,00
26,59
24,64
0,88
25,14
26,54
29,17
1,98
39,26
74,11
41,18
45,05
48,69
3,84
53,61
56,26
59,27
66,21
68,62
76,56
80,24
78,60
5,47
Backw
ard W
eight
1,34
1,50
12,66
9,44
76,56
71,37
44,38
70,53
69,01
1,12
57,30
2,58
52,56
52,80
51,93
51,42
50,02
52,00
47,39
34,85
37,30
35,38
31,52
31,72
27,88
22,95
20,30
17,29
10,35
7,95
2,04
5,47
Forwar
d Weig
ht1,3
41,5
03,2
312,
665,1
96,0
350,
417,5
519,
2720,
3824,
0026,
5924,
640,8
825,
1426,
5429,
171,9
839,
2674,
1141,
1845,
0548,
693,8
453,
6156,
2659,
2766,
2168,
6276,
5678,
605,4
7Bac
kward
Weig
ht1,3
41,5
012,
669,4
476,
5671,
3744,
3870,
5369,
011,1
257,
302,5
852,
5652,
8051,
9351,
4250,
0252,
0047,
3934,
8537,
3035,
3831,
5231,
7227,
8822,
9520,
3017,
2910,
357,9
55,4
7For
ward W
eight
1,34
1,50
3,23
12,66
5,19
6,03
50,41
7,55
19,27
20,38
24,00
26,59
24,64
0,88
25,14
26,54
29,17
1,98
39,26
74,11
41,18
45,05
48,69
3,84
53,61
56,26
59,27
66,21
68,62
76,56
5,47
Backw
ard W
eight
1,34
1,50
12,66
9,44
71,37
44,38
70,53
69,01
1,12
57,30
2,58
52,56
52,80
51,93
51,42
50,02
52,00
47,39
34,85
37,30
35,38
31,52
31,72
27,88
22,95
20,30
17,29
10,35
7,95
5,47
Forwar
d Weig
ht1,3
41,5
03,2
312,
660,8
445,
222,3
614,
0815,
2018,
8121,
4019,
450,8
819,
9521,
3623,
981,9
834,
0768,
9235,
9939,
8643,
503,8
448,
4251,
0754,
0861,
0263,
4371,
375,4
7Bac
kward
Weig
ht1,3
41,5
012,
669,4
444,
3870,
5369,
011,1
257,
302,5
852,
5652,
8051,
9351,
4250,
0252,
0047,
3934,
8537,
3035,
3831,
5231,
7227,
8822,
9520,
3017,
2910,
357,9
55,4
7For
ward W
eight
1,34
1,50
3,23
12,66
44,38
1,52
13,23
14,35
17,97
20,56
18,60
0,88
19,11
20,51
23,14
1,98
33,23
68,08
35,15
39,01
42,65
3,84
47,58
50,23
53,24
60,18
62,58
70,53
5,47
Backw
ard W
eight
1,34
1,50
12,66
9,44
44,38
69,01
1,12
57,30
2,58
52,56
52,80
51,93
51,42
50,02
52,00
47,39
34,85
37,30
35,38
31,52
31,72
27,88
22,95
20,30
17,29
10,35
7,95
5,47
Forwar
d Weig
ht1,3
41,5
03,2
312,
6644,
3811,
7212,
8316,
4519,
0417,
090,8
817,
5918,
9921,
621,9
831,
7166,
5633,
6337,
4941,
143,8
446,
0648,
7151,
7258,
6661,
0669,
015,4
7Bac
kward
Weig
ht1,3
41,5
012,
669,4
444,
3861,
061,1
249,
352,5
844,
6144,
8643,
9843,
4842,
0744,
0539,
4434,
8529,
3627,
4423,
5723,
7719,
9315,
0012,
369,3
52,4
15,4
7For
ward W
eight
1,34
1,50
3,23
12,66
44,38
11,72
12,83
16,45
19,04
17,09
0,88
17,59
18,99
21,62
1,98
31,71
66,56
33,63
37,49
41,14
3,84
46,06
48,71
51,72
58,66
61,06
5,47
Backw
ard W
eight
1,34
1,50
12,66
9,44
44,38
61,06
1,12
49,35
2,58
44,61
44,86
43,98
43,48
42,07
44,05
39,44
29,36
27,44
23,57
23,77
19,93
15,00
12,36
9,35
2,41
5,47
Forwar
d Weig
ht1,3
41,5
03,2
312,
6644,
3811,
7212,
8316,
4519,
0417,
090,8
817,
5918,
9921,
621,9
831,
7133,
6337,
4941,
143,8
446,
0648,
7151,
7258,
6661,
065,4
7Bac
kward
Weig
ht1,3
41,5
012,
669,4
444,
3858,
661,1
246,
942,5
842,
2142,
4541,
5741,
0739,
6741,
6437,
0426,
9525,
0321,
1621,
3617,
5212,
609,9
56,9
45,4
7For
ward W
eight
1,34
1,50
3,23
12,66
44,38
11,72
12,83
16,45
19,04
17,09
0,88
17,59
18,99
21,62
1,98
31,71
33,63
37,49
41,14
3,84
46,06
48,71
51,72
58,66
5,47
541 2 3 11109876 171615141312 232221201918
Spektrum Industri, 2014, Vol. 12, No. 2, 113 – 247 ISSN : 1963-6590
132
Task N
umber
Q1Q2
Q3Q4
Q5Q6
Q7Q8
Q9Q1
0Q1
1Q1
2Q1
3Q1
4Q1
5Q1
6Q1
7Q1
8Q1
9Q2
0Q2
1Q2
2Q2
3Q2
4Q2
5Q2
6Q2
7Q2
8Q2
9Q3
0Q3
1Q3
2Q3
3Q3
4Q3
5Q3
6Q3
7Q3
8Q3
9Q4
0Q4
1Q4
2Q4
3Q4
4Q4
5Q4
6Q4
7Ba
ckward
Weig
ht1,3
41,5
012,
669,4
444,
3851,
721,1
240,
002,5
835,
2735,
5134,
6334,
1332,
7334,
7030,
1020,
0118,
0914,
2214,
4210,
585,6
63,0
15,4
7For
ward W
eight
1,34
1,50
3,23
12,66
44,38
11,72
12,83
16,45
19,04
17,09
0,88
17,59
18,99
21,62
1,98
31,71
33,63
37,49
41,14
3,84
46,06
48,71
51,72
5,47
Backw
ard W
eight
1,34
1,50
12,66
9,44
44,38
48,71
1,12
36,99
2,58
32,26
32,50
31,62
31,12
29,72
31,69
27,09
17,00
15,08
11,21
11,41
7,57
2,65
5,47
Forwa
rd Weig
ht1,3
41,5
03,2
312,
6644,
3811,
7212,
8316,
4519,
0417,
090,8
817,
5918,
9921,
621,9
831,
7133,
6337,
4941,
143,8
446,
0648,
715,4
7Ba
ckward
Weig
ht1,3
41,5
012,
669,4
444,
3846,
061,1
234,
342,5
829,
6129,
8528,
9828,
4727,
0729,
0424,
4414,
3512,
438,5
78,7
74,9
35,4
7For
ward W
eight
1,34
1,50
3,23
12,66
44,38
11,72
12,83
16,45
19,04
17,09
0,88
17,59
18,99
21,62
1,98
31,71
33,63
37,49
41,14
3,84
46,06
5,47
Backw
ard W
eight
1,34
1,50
12,66
9,44
44,38
41,14
1,12
29,42
2,58
24,68
24,93
24,05
23,55
22,14
24,12
19,52
9,43
7,51
3,64
3,84
5,47
Forwa
rd Weig
ht1,3
41,5
03,2
312,
6644,
3811,
7212,
8316,
4519,
0417,
090,8
817,
5918,
9921,
621,9
831,
7133,
6337,
4941,
143,8
45,4
7Ba
ckward
Weig
ht1,3
41,5
012,
669,4
441,
141,1
229,
422,5
824,
6824,
9324,
0523,
5522,
1424,
1219,
529,4
37,5
13,6
43,8
45,4
7For
ward W
eight
1,34
1,50
3,23
12,66
11,72
12,83
16,45
19,04
17,09
0,88
17,59
18,99
21,62
1,98
31,71
33,63
37,49
41,14
3,84
5,47
Backw
ard W
eight
1,34
1,50
12,66
9,44
37,49
1,12
25,78
2,58
21,04
21,29
20,41
19,91
18,50
20,48
15,87
5,79
3,87
3,84
5,47
Forwa
rd Weig
ht1,3
41,5
03,2
312,
6611,
7212,
8316,
4519,
0417,
090,8
817,
5918,
9921,
621,9
831,
7133,
6337,
493,8
45,4
7Ba
ckward
Weig
ht1,3
41,5
012,
669,4
41,1
225,
782,5
821,
0421,
2920,
4119,
9118,
5020,
4815,
875,7
93,8
73,8
45,4
7For
ward W
eight
1,34
1,50
3,23
12,66
1,12
4,74
7,32
5,37
0,88
5,87
7,28
9,90
1,98
19,99
21,91
25,78
3,84
5,47
Backw
ard W
eight
1,34
1,50
12,66
9,44
1,12
21,91
2,58
17,18
17,42
16,54
16,04
14,63
16,61
12,01
1,92
3,84
5,47
Forwa
rd Weig
ht1,3
41,5
03,2
312,
661,1
24,7
47,3
25,3
70,8
85,8
77,2
89,9
01,9
819,
9921,
913,8
45,4
7Ba
ckward
Weig
ht1,3
41,5
012,
669,4
41,1
219,
992,5
815,
2515,
5014,
6214,
1212,
7114,
6910,
093,8
45,4
7For
ward W
eight
1,34
1,50
3,23
12,66
1,12
4,74
7,32
5,37
0,88
5,87
7,28
9,90
1,98
19,99
3,84
5,47
Backw
ard W
eight
1,34
1,50
12,66
9,44
1,12
2,58
15,25
15,50
14,62
14,12
12,71
14,69
10,09
3,84
5,47
Forwa
rd Weig
ht1,3
41,5
03,2
312,
661,1
22,5
80,6
30,8
81,1
42,5
45,1
71,9
815,
253,8
45,4
7Ba
ckward
Weig
ht1,3
41,5
012,
669,4
41,1
22,5
815,
2514,
6214,
1212,
7114,
6910,
093,8
45,4
7For
ward W
eight
1,34
1,50
3,23
12,66
1,12
2,58
0,63
1,14
2,54
5,17
1,98
15,25
3,84
5,47
Backw
ard W
eight
1,34
1,50
12,66
9,44
1,12
2,58
14,62
14,12
12,71
14,69
10,09
3,84
5,47
Forwa
rd Weig
ht1,3
41,5
03,2
312,
661,1
22,5
80,5
01,9
14,5
41,9
814,
623,8
45,4
7Ba
ckward
Weig
ht1,3
41,5
012,
669,4
41,1
22,5
814,
6214,
1212,
7110,
093,8
45,4
7For
ward W
eight
1,34
1,50
3,23
12,66
1,12
2,58
0,50
1,91
4,54
14,62
3,84
5,47
Backw
ard W
eight
1,34
1,50
12,66
9,44
1,12
2,58
4,54
4,03
2,63
3,84
5,47
Forwa
rd Weig
ht1,3
41,5
03,2
312,
661,1
22,5
80,5
01,9
14,5
43,8
45,4
7Ba
ckward
Weig
ht1,3
41,5
09,4
41,1
22,5
84,5
44,0
32,6
33,8
45,4
7For
ward W
eight
1,34
1,50
9,44
1,12
2,58
0,50
1,91
4,54
3,84
5,47
Backw
ard W
eight
1,34
1,50
1,12
2,58
4,54
4,03
2,63
3,84
5,47
Forwa
rd Weig
ht1,3
41,5
01,1
22,5
80,5
01,9
14,5
43,8
45,4
7Ba
ckward
Weig
ht1,3
41,5
01,1
22,5
84,5
44,0
32,6
33,8
4For
ward W
eight
1,34
1,50
1,12
2,58
0,50
1,91
4,54
3,84
Backw
ard W
eight
1,34
1,50
1,12
2,58
4,03
2,63
3,84
Forwa
rd Weig
ht1,3
41,5
01,1
22,5
81,4
04,0
33,8
4Ba
ckward
Weig
ht1,3
41,5
01,1
22,5
82,6
33,8
4For
ward W
eight
1,34
1,50
1,12
2,58
2,63
3,84
Backw
ard W
eight
1,34
1,50
1,12
2,58
2,63
Forwa
rd Weig
ht1,3
41,5
01,1
22,5
82,6
3Ba
ckward
Weig
ht1,3
41,5
01,1
22,5
8For
ward W
eight
1,34
1,50
1,12
2,58
Backw
ard W
eight
1,34
1,50
1,12
Forwa
rd Weig
ht1,3
41,5
01,1
2Ba
ckward
Weig
ht1,3
41,1
2For
ward W
eight
1,34
1,12
Backw
ard W
eight
1,12
Forwa
rd Weig
ht1,1
2
28 2927262524 353433323130 414039383736 474645444342
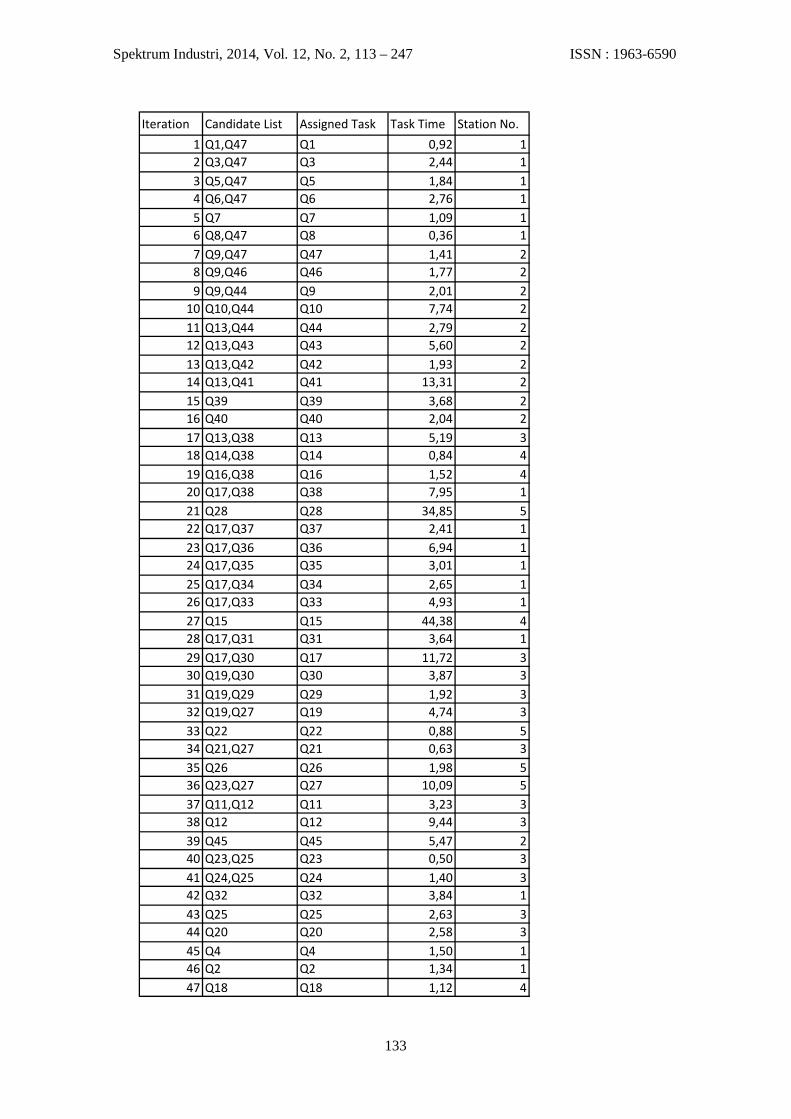
Spektrum Industri, 2014, Vol. 12, No. 2, 113 – 247 ISSN : 1963-6590
133
Iteration Candidate List Assigned Task Task Time Station No.
1 Q1,Q47 Q1 0,92 12 Q3,Q47 Q3 2,44 13 Q5,Q47 Q5 1,84 14 Q6,Q47 Q6 2,76 15 Q7 Q7 1,09 16 Q8,Q47 Q8 0,36 17 Q9,Q47 Q47 1,41 28 Q9,Q46 Q46 1,77 29 Q9,Q44 Q9 2,01 2
10 Q10,Q44 Q10 7,74 211 Q13,Q44 Q44 2,79 212 Q13,Q43 Q43 5,60 213 Q13,Q42 Q42 1,93 214 Q13,Q41 Q41 13,31 215 Q39 Q39 3,68 216 Q40 Q40 2,04 217 Q13,Q38 Q13 5,19 318 Q14,Q38 Q14 0,84 419 Q16,Q38 Q16 1,52 420 Q17,Q38 Q38 7,95 121 Q28 Q28 34,85 522 Q17,Q37 Q37 2,41 123 Q17,Q36 Q36 6,94 124 Q17,Q35 Q35 3,01 125 Q17,Q34 Q34 2,65 126 Q17,Q33 Q33 4,93 127 Q15 Q15 44,38 428 Q17,Q31 Q31 3,64 129 Q17,Q30 Q17 11,72 330 Q19,Q30 Q30 3,87 331 Q19,Q29 Q29 1,92 332 Q19,Q27 Q19 4,74 333 Q22 Q22 0,88 534 Q21,Q27 Q21 0,63 335 Q26 Q26 1,98 536 Q23,Q27 Q27 10,09 537 Q11,Q12 Q11 3,23 338 Q12 Q12 9,44 339 Q45 Q45 5,47 240 Q23,Q25 Q23 0,50 341 Q24,Q25 Q24 1,40 342 Q32 Q32 3,84 143 Q25 Q25 2,63 344 Q20 Q20 2,58 345 Q4 Q4 1,50 146 Q2 Q2 1,34 147 Q18 Q18 1,12 4