Developing markers of neurological manifestations in ...
216
1 Developing markers of neurological manifestations in Neuronopathic Gaucher Disease Elin Haf Davies RN (Child) BSc (Hons) MSc (Merit) A thesis submitted for the degree of Doctor of Philosophy (PhD) at University College London Biochemistry Research Group, Clinical and Molecular Genetics Unit Institute of Child Health University College London 2010
Transcript of Developing markers of neurological manifestations in ...
1
Developing markers of neurological manifestations in
Neuronopathic Gaucher Disease
Elin Haf Davies
RN (Child) BSc (Hons) MSc (Merit)
A thesis submitted for the degree of Doctor of Philosophy (PhD) at
University College London
Biochemistry Research Group, Clinical and Molecular Genetics Unit
Institute of Child Health
University College London
2010

2
I, Elin Haf Davies, confirm that the work presented in this thesis is my own.
Where information has been derived from other sources, I confirm that this
has been indicated in the thesis.

3
I dedicate this thesis to my parents for all their unconditional love and support
in every aspect of my life. Diolch diffuant am bopeth.
And to make an end is to make a beginning,
The end is where we start from …
And the end of all our exploring
Will be to arrive where we started,
And to know the place for the first time.
T.S Elliot

4
Acknowledgement
I’d like to take this opportunity to thank everyone that has supported me during my
studies. The loss of Professor Robert Surtees continued throughout, but his initial
input remains invaluable. Dr Ashok Vellodi, now my primary supervisor has
supported me unconditionally over the last few years, and his unwavering
enthusiasm has helped to maintain my motivation in “the world of the lysosomes” –
despite the numerous distractions!
Thank you to Dr Paramala Santosh and Dr Chris Clark as my Secondary
Supervisors, and physiotherapists Michelle Wood and Dr Lucy Alderson for teaching
me how to use the GAITRite. Heartfelt thanks to Dr Sophie Vadakar for continued,
support and advice which went over and beyond what I could have ever hoped.
Acknowledgments must also go to Genzyme and Actelion pharmaceuticals for
sponsoring part of the costs of this work, along with sincere thanks to the Gaucher
Association UK who sponsored the cost of my travel to Germany and Poland.
I also need to share my heartfelt thanks to my ever-suffering parents. Regardless of
the type of the challenge I choose, the risks and demands involved, my parents
have supported me unconditionally.
The ultimate thanks must go however to all the children and their parents who have
consented to use their valuable time to take part in this study. Their time and
contribution is much appreciated, without them this work would not have been
possible.
5
Statement of work and acknowledgment of others
Severity Scoring Tool
I had sole responsibility for the conception, development, validation and
statistical analysis of the data collated while developing the Severity Scoring
Tool. I conducted the assessment either individually or in collaboration with
another clinician in at least 80% across all three centres. I was also responsible
for identifying the world wide experts that collaborated to provide their expert
opinion on the weighting of each domain and the identification of the Minimum
Clinically Important Difference. Both of which were done using web-based
nominal group technique, organised by myself.
Gait analysis
After training in the use of the equipment and analysis process by Dr Lucy
Alderson and Michelle Wood, the recruitment of patients, assessment, analysis
and interpretation of the data was all done by myself.
Magnetic Resonance Imaging
My involvement on this aspect of the study was to recruit and consent patients.
Dr Kiran Seunarine processed the imaging analysis and we then collaborated to
identify relevance in relation to pathology and clinical manifestations.
Each manuscript that has emerged from this work was written in the first place
by myself, and revised according to comments from the co-authors in each case.
6
Abstract
Gaucher disease is a rare inherited lysosomal disorder caused by deficiency of
the enzyme glucocerebrosidase. Classically, three forms of the disease are
recognised: type I or nonneuronopathic, type 2 or acute neuronopathic, and type
3 or subacute or chronic neuronopathic. Neuronopathic Gaucher disease (NGD)
is defined as a confirmed diagnosis of Gaucher disease in the presence of
neurological symptoms and signs, for which there is no other cause.
Horizontal gaze palsy is the clinical hallmark of NGD. Other neurological
manifestations include seizures, cerebellar ataxia and pyramidal tract
involvements. However, NGD is very heterogeneous and the neurological
features vary greatly from patient to patient, not only in terms of manifestations
involved but also in terms of severity. The emergence of enzyme replacement
therapy has changed the ‘natural history’ of the disease, and patients are now
living longer where previously they would have succumbed to the visceral
complications of the disease. New emerging therapies are being developed for
NGD, however a suitable surrogate marker to monitor neurological disease is
lacking.
In this study, three different assessment tools were explored to examine their
value and sensitivity to assess neurological involvement in NGD. A Severity
Scoring Tool developed specifically for NGD was modified and validated to offer
a robust assessment tool, with demonstrated sensitivity to track disease
progression and distinguish between phenotypes. Additional assessments
utilised were gait analysis and diffusion tensor imaging, both of which were
sensitive enough to distinguish between the NGD and Type I cohort studied.
This is the largest cohort of NGD patients (recruited across three European
countries) to be studied prospectively and systematically. It is also the first study
to describe the gait pattern of NGD children, and to provide an in-vivo insight of
the Gaucher brain utilising diffusion tensor imaging.
7
Table of Contents
Acknowledgement .................................................................4
Statement of work and acknowledgment of others .....5
Abstract ....................................................................................6
Table of Contents...................................................................7
Appendix 1, 2, and 3. List of Figures................................8
List of Figures .........................................................................9
List of Tables .........................................................................11
Abbreviations ........................................................................13
Oral presentations ...............................................................14
Poster presentations...........................................................14
List of publications ..............................................................15
Chapter 1 Introduction ......................................................16
1 Introduction ....................................................................................................17
1.1 Lysosomal Storage Disorders ............................................................. 17
1.2 Gaucher Disease ..................................................................................... 18
1.3 Clinical trials qualifying for Marketing Authorisation Lysosomal
Storage Disorders.......................................................................................... 32
1.4 Quantifying disease severity ............................................................... 39
1.5 Surrogate Markers and Biomarkers ................................................... 41
1.6 Aims of thesis .......................................................................................... 44
1.7 Ethics Approval ....................................................................................... 45
1.8 Patient Recruitment ................................................................................ 46
Chapter 2 Severity Scoring Tool......................................47
2. Severity Scoring Tool. ..................................................................................48
2.1 Introduction .............................................................................................. 48
2.2 Methods ..................................................................................................... 60
8
2.3 Results ....................................................................................................... 65
2.4 Discussion on mSST development .................................................. 101
Chapter 3 GAIT analysis ..................................................106
3 Gait Analysis ................................................................................................107
3.2. Methods .................................................................................................. 124
3.3 Results ..................................................................................................... 125
3.4 Discussion .............................................................................................. 143
Chapter 4 Diffusion Tensor Imaging ............................150
4. Diffusion Tensor Imaging ...........................................................................151
4.1 Magnetic Resonance Imaging ........................................................... 151
4.2 Method...................................................................................................... 161
4.3 Results ..................................................................................................... 164
4.4 Limitations .............................................................................................. 170
4.5 Discussion .............................................................................................. 171
Chapter 5 Discussion ......................................................178
5. Discussion...................................................................................................179
5.1 Correlation of the three assessments. ............................................ 179
5.2 The advantages, disadvantages and potential value of each
assessment ................................................................................................... 183
Chapter 6 Conclusion ......................................................193
Literature Cited ...................................................................196
Appendix 1, 2, and 3.
9
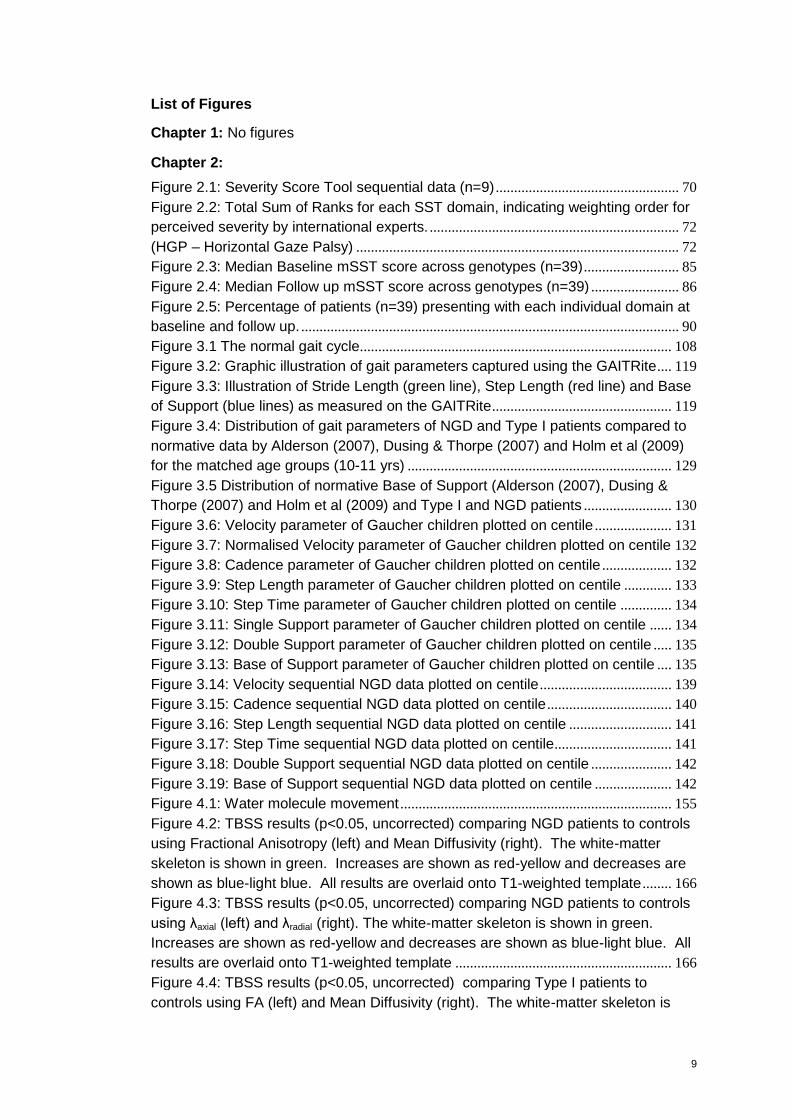
List of Figures
Chapter 1: No figures
Chapter 2:
Figure 2.1: Severity Score Tool sequential data (n=9) .................................................. 70
Figure 2.2: Total Sum of Ranks for each SST domain, indicating weighting order for
perceived severity by international experts. .................................................................... 72
(HGP – Horizontal Gaze Palsy) ........................................................................................ 72
Figure 2.3: Median Baseline mSST score across genotypes (n=39).......................... 85
Figure 2.4: Median Follow up mSST score across genotypes (n=39) ........................ 86
Figure 2.5: Percentage of patients (n=39) presenting with each individual domain at
baseline and follow up. ....................................................................................................... 90
Figure 3.1 The normal gait cycle..................................................................................... 108
Figure 3.2: Graphic illustration of gait parameters captured using the GAITRite.... 119
Figure 3.3: Illustration of Stride Length (green line), Step Length (red line) and Base
of Support (blue lines) as measured on the GAITRite................................................. 119
Figure 3.4: Distribution of gait parameters of NGD and Type I patients compared to
normative data by Alderson (2007), Dusing & Thorpe (2007) and Holm et al (2009)
for the matched age groups (10-11 yrs) ........................................................................ 129
Figure 3.5 Distribution of normative Base of Support (Alderson (2007), Dusing &
Thorpe (2007) and Holm et al (2009) and Type I and NGD patients ........................ 130
Figure 3.6: Velocity parameter of Gaucher children plotted on centile ..................... 131
Figure 3.7: Normalised Velocity parameter of Gaucher children plotted on centile 132
Figure 3.8: Cadence parameter of Gaucher children plotted on centile ................... 132
Figure 3.9: Step Length parameter of Gaucher children plotted on centile ............. 133
Figure 3.10: Step Time parameter of Gaucher children plotted on centile .............. 134
Figure 3.11: Single Support parameter of Gaucher children plotted on centile ...... 134
Figure 3.12: Double Support parameter of Gaucher children plotted on centile ..... 135
Figure 3.13: Base of Support parameter of Gaucher children plotted on centile .... 135
Figure 3.14: Velocity sequential NGD data plotted on centile.................................... 139
Figure 3.15: Cadence sequential NGD data plotted on centile.................................. 140
Figure 3.16: Step Length sequential NGD data plotted on centile ............................ 141
Figure 3.17: Step Time sequential NGD data plotted on centile................................ 141
Figure 3.18: Double Support sequential NGD data plotted on centile ...................... 142
Figure 3.19: Base of Support sequential NGD data plotted on centile ..................... 142
Figure 4.1: Water molecule movement .......................................................................... 155
Figure 4.2: TBSS results (p<0.05, uncorrected) comparing NGD patients to controls
using Fractional Anisotropy (left) and Mean Diffusivity (right). The white-matter
skeleton is shown in green. Increases are shown as red-yellow and decreases are
shown as blue-light blue. All results are overlaid onto T1-weighted template ........ 166
Figure 4.3: TBSS results (p<0.05, uncorrected) comparing NGD patients to controls
using λaxial (left) and λradial (right). The white-matter skeleton is shown in green.
Increases are shown as red-yellow and decreases are shown as blue-light blue. All
results are overlaid onto T1-weighted template ........................................................... 166
Figure 4.4: TBSS results (p<0.05, uncorrected) comparing Type I patients to
controls using FA (left) and Mean Diffusivity (right). The white-matter skeleton is
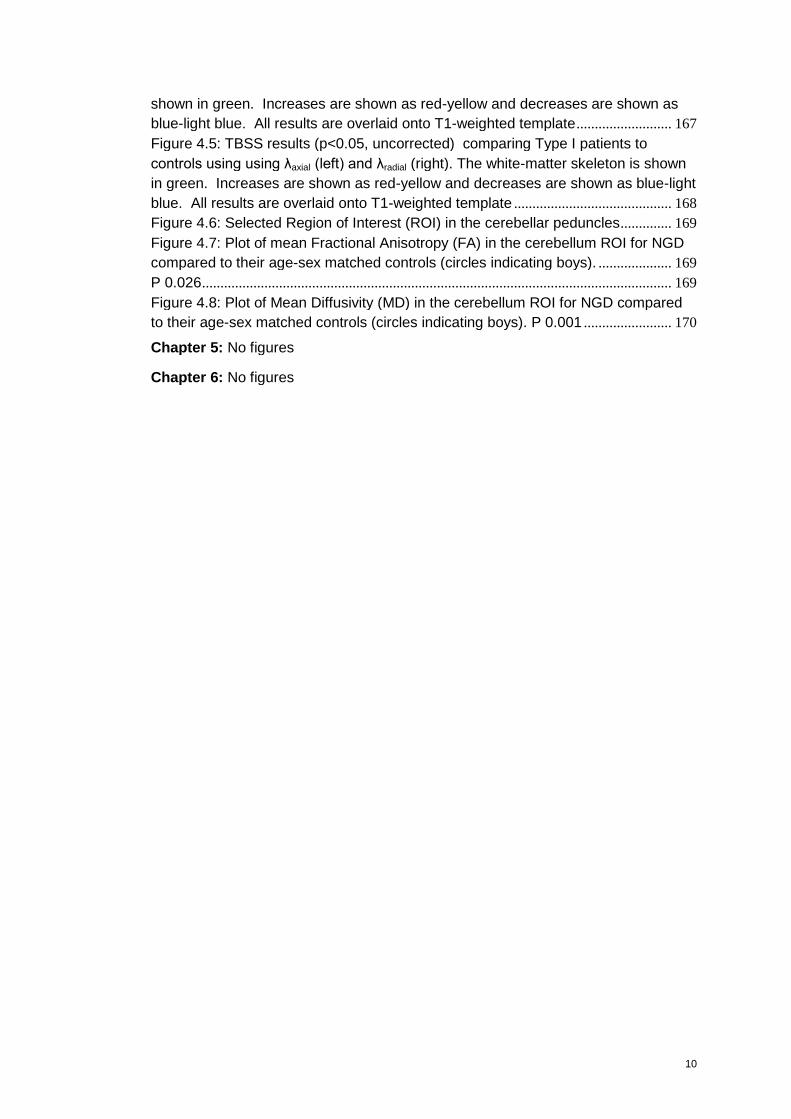
10
shown in green. Increases are shown as red-yellow and decreases are shown as
blue-light blue. All results are overlaid onto T1-weighted template.......................... 167
Figure 4.5: TBSS results (p<0.05, uncorrected) comparing Type I patients to
controls using using λaxial (left) and λradial (right). The white-matter skeleton is shown
in green. Increases are shown as red-yellow and decreases are shown as blue-light
blue. All results are overlaid onto T1-weighted template ........................................... 168
Figure 4.6: Selected Region of Interest (ROI) in the cerebellar peduncles.............. 169
Figure 4.7: Plot of mean Fractional Anisotropy (FA) in the cerebellum ROI for NGD
compared to their age-sex matched controls (circles indicating boys). .................... 169
P 0.026................................................................................................................................ 169
Figure 4.8: Plot of Mean Diffusivity (MD) in the cerebellum ROI for NGD compared
to their age-sex matched controls (circles indicating boys). P 0.001 ........................ 170
Chapter 5: No figures
Chapter 6: No figures
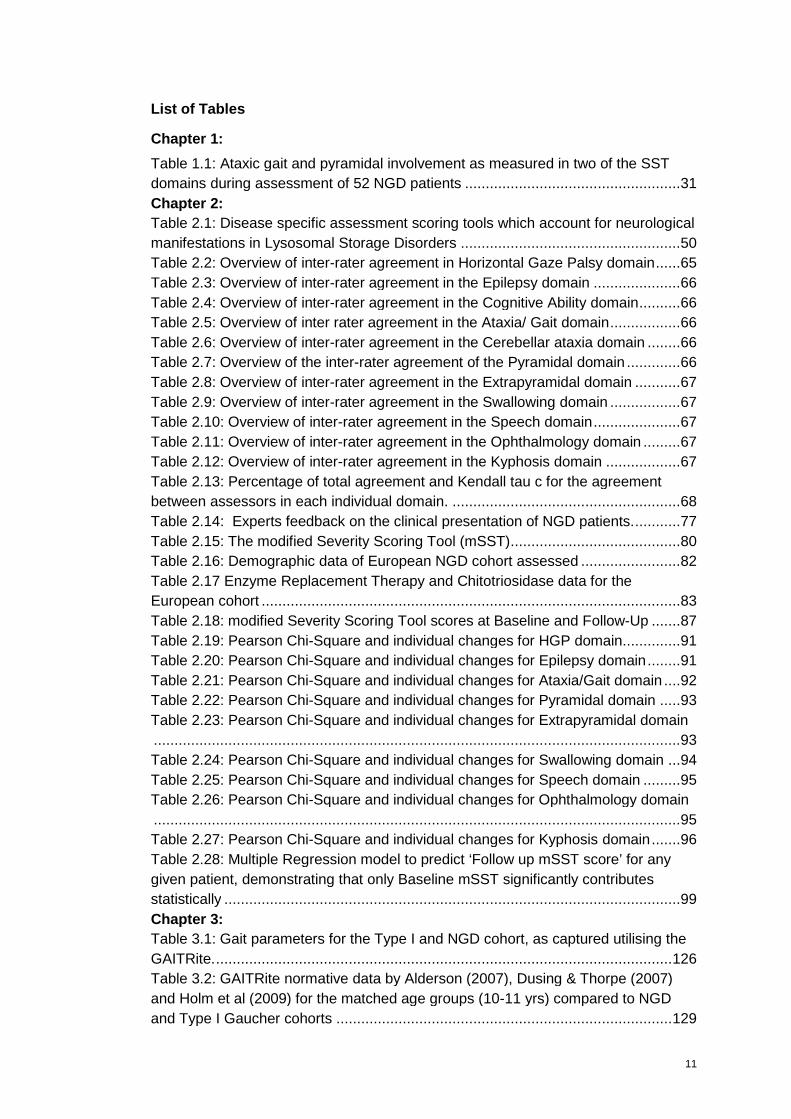
11
List of Tables
Chapter 1:
Table 1.1: Ataxic gait and pyramidal involvement as measured in two of the SST
domains during assessment of 52 NGD patients ....................................................31
Chapter 2:
Table 2.1: Disease specific assessment scoring tools which account for neurological
manifestations in Lysosomal Storage Disorders .....................................................50
Table 2.2: Overview of inter-rater agreement in Horizontal Gaze Palsy domain......65
Table 2.3: Overview of inter-rater agreement in the Epilepsy domain .....................66
Table 2.4: Overview of inter-rater agreement in the Cognitive Ability domain..........66
Table 2.5: Overview of inter rater agreement in the Ataxia/ Gait domain.................66
Table 2.6: Overview of inter-rater agreement in the Cerebellar ataxia domain ........66
Table 2.7: Overview of the inter-rater agreement of the Pyramidal domain .............66
Table 2.8: Overview of inter-rater agreement in the Extrapyramidal domain ...........67
Table 2.9: Overview of inter-rater agreement in the Swallowing domain .................67
Table 2.10: Overview of inter-rater agreement in the Speech domain.....................67
Table 2.11: Overview of inter-rater agreement in the Ophthalmology domain .........67
Table 2.12: Overview of inter-rater agreement in the Kyphosis domain ..................67
Table 2.13: Percentage of total agreement and Kendall tau c for the agreement
between assessors in each individual domain. .......................................................68
Table 2.14: Experts feedback on the clinical presentation of NGD patients............77
Table 2.15: The modified Severity Scoring Tool (mSST).........................................80
Table 2.16: Demographic data of European NGD cohort assessed ........................82
Table 2.17 Enzyme Replacement Therapy and Chitotriosidase data for the
European cohort .....................................................................................................83
Table 2.18: modified Severity Scoring Tool scores at Baseline and Follow-Up .......87
Table 2.19: Pearson Chi-Square and individual changes for HGP domain..............91
Table 2.20: Pearson Chi-Square and individual changes for Epilepsy domain........91
Table 2.21: Pearson Chi-Square and individual changes for Ataxia/Gait domain ....92
Table 2.22: Pearson Chi-Square and individual changes for Pyramidal domain .....93
Table 2.23: Pearson Chi-Square and individual changes for Extrapyramidal domain
...............................................................................................................................93
Table 2.24: Pearson Chi-Square and individual changes for Swallowing domain ...94
Table 2.25: Pearson Chi-Square and individual changes for Speech domain .........95
Table 2.26: Pearson Chi-Square and individual changes for Ophthalmology domain
...............................................................................................................................95
Table 2.27: Pearson Chi-Square and individual changes for Kyphosis domain.......96
Table 2.28: Multiple Regression model to predict ‘Follow up mSST score’ for any
given patient, demonstrating that only Baseline mSST significantly contributes
statistically ..............................................................................................................99
Chapter 3:
Table 3.1: Gait parameters for the Type I and NGD cohort, as captured utilising the
GAITRite...............................................................................................................126
Table 3.2: GAITRite normative data by Alderson (2007), Dusing & Thorpe (2007)
and Holm et al (2009) for the matched age groups (10-11 yrs) compared to NGD
and Type I Gaucher cohorts .................................................................................129

12
Table 3.3: Z score for all gait parameters assessed in the NGD and Type I Gaucher
patients.................................................................................................................137
Table 5.1: Correlation of gait parameters and mSST score and domains .............180
Table 5.2: Velocity of DMD and NGD patients ......................................................190
Chapter 4: No figures
Chapter 5: No figures
Chapter 6: No figures
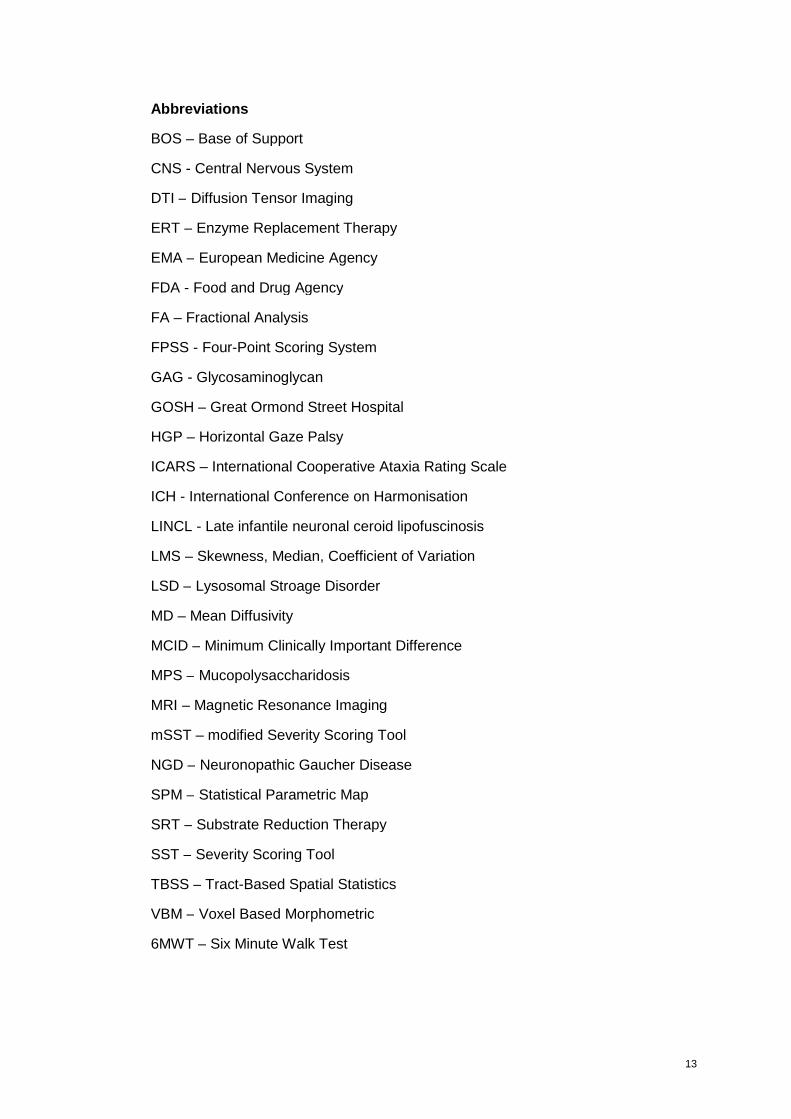
13
Abbreviations
BOS – Base of Support
CNS - Central Nervous System
DTI – Diffusion Tensor Imaging
ERT – Enzyme Replacement Therapy
EMA – European Medicine Agency
FDA - Food and Drug Agency
FA – Fractional Analysis
FPSS - Four-Point Scoring System
GAG - Glycosaminoglycan
GOSH – Great Ormond Street Hospital
HGP – Horizontal Gaze Palsy
ICARS – International Cooperative Ataxia Rating Scale
ICH - International Conference on Harmonisation
LINCL - Late infantile neuronal ceroid lipofuscinosis
LMS – Skewness, Median, Coefficient of Variation
LSD – Lysosomal Stroage Disorder
MD – Mean Diffusivity
MCID – Minimum Clinically Important Difference
MPS – Mucopolysaccharidosis
MRI – Magnetic Resonance Imaging
mSST – modified Severity Scoring Tool
NGD – Neuronopathic Gaucher Disease
SPM – Statistical Parametric Map
SRT – Substrate Reduction Therapy
SST – Severity Scoring Tool
TBSS – Tract-Based Spatial Statistics
VBM – Voxel Based Morphometric
6MWT – Six Minute Walk Test
14
Oral presentations
Davies, E.H., Seunarine, K., Clark, C., Vellodi, A. Diffusion Tensor Imaging: Study
of white matter brain in paediatric patients with Gaucher Disease.
7th Annual WORLD Symposium for Lysosomal Diseases, February 16-18 2011, Las
Vegas, USA.
Davies, E.H., Seunarine, K., Clark, C., Vellodi, A. Diffusion Tensor Imaging: Study
of white matter brain in paediatric Gaucher Type I and III patients.
9th International European Working Group on Gaucher Disease, June 30-July 3,
2010. Cologne, Germany.
Davies, E.H., Mengel, E., Tylki-Szymanska, A., Kleinotiene,G., Reinke,J., Vellodi, A.
Four year follow up of Type III Gaucher patients using a modified Severity Scoring
Tool. 9th International European Working Group on Gaucher Disease, June 30-July
3, 2010. Cologne, Germany.
Proposal for the organization and structure of the EMEA Network (2009)
Davies, EH. 1st EMEA European Paediatric Network, London. UK 16th February
Quantifying neurology in Neuronpathic Gaucher Disease. Davies, EH
Neuronopathic Gaucher Disease, European Family Conference. Leicester
UK. 29th November 2008
How did the EMEA prepare for Paediatric Regulation (EC) No 1901/2006.
Davies, EH. Drug Information Association EU Paediatric Regulation: How is it
working in practice? London. November 2007
International Conference on Harmonization and Good Clinical Practice: Paediatric
principles. Davies, EH. Consenting, Pharmacovigilance, and Principal Investigator
Responsibility. Cancer Research UK. London. 12 Feb 2007
Providing a quality clinical environment for Paediatric trials. Davies, EH.
Paediatric Research: Quality & Policy study day. Medicines for Children Network,
Medical Research Council, London. 1 February 2007.
The aftermath of a clinical trial! Parent’s views after a negative result.
Davies, EH. Neuronopathic Gaucher Disease, European Family Conference.
London. UK. 20th January 2007
Poster presentations
Davies, E.H & Vellodi, A. A modified Severity Scoring Tool for Neuronopathic
Gaucher disease. 9th International European Working Group on Gaucher Disease,
June 30-July 3, 2010. Cologne, Germany.
Davies, E.H., Wood, M., Vellodi, A. - Quantifying Ataxia in Neuronopathic Gaucher
disease. 9th International European Working Group on Gaucher Disease, June 30-
July 3, 2010. Cologne, Germany.
15
Davies, E.H & Vellodi, A. On-Going development of a Severity Scoring Tool for
Neuronopathic Gaucher disease. 6th WORLD Symposium, February 10-12, 2010.
Miami, Florida, USA.
Davies, E.H., Wood, M., Vellodi, A. Quantifying Ataxia in Neuronopathic Gaucher
disease. 6th WORLD Symposium, February 10-12, 2010. Miami, Florida, USA.
List of publications
Davies, E.H., Seunarine, K., Clark, C., Vellodi, A. (2011) Diffusion Tensor Imaging:
Study of white matter brain in paediatric Gaucher Type I and III patients. JIMD [Epub
ahead of print]
Davies EH, Ollivier CM, Saint Raymond A. (2010). Paediatric investigation plans for
pain: painfully slow! Eur J Clin Pharmacol. Sep 7. Nov;66(11):1091-7.
Vellodi A, Tylki-Szymanska A, Davies EH, Kolodny E, Bembi B, Collin-Histed T,
Mengel E, Erikson A, Schiffmann R. (2009) Management of neuronopathic Gaucher
disease: revised recommendations. J Inherit Metab Dis. Oct;32(5):660-4. Aug 5.
The selection and use of essential medicines. WHO Expert Committee.
Collaborators (27) Al-Fannah JM, Coelho H, Cranswick N, Gilani AU, Gray A, Gupta
U, Helali A, Hoppu K, Irs A, Kazembe P, Mehta D, Reidenberg M, Suryawati S,
Walters S, Pedersen HB, Chongtrakul P, Zhiping L, Nakamura H, Robertson J, Hill
S, Hogerzeil H, Ondari C, Zisovska E, Davies EH, Kearns G, Mattison D, Terlouw D.
This report presents the recommendations of the Subcommittee of the WHO Expert
Committee responsible for the WHO Model List of Essential Medicines. The task of
this Subcommittee was to draw up the first WHO Model List of Essential Medicines
for Children. World Health Organ Tech Rep Ser. 2008;(950): vii-174.
Davies, E., Tuleu, C. (2008) Medicines for children: a matter of taste
J Pediatr. Nov;153(5):599-604,
Schiffmann, R; Fitzgibbon; Harris, C; DeVile, C; Davies, EH; Abel, L; van Schaik, I;
Timmons, M; Ries, M; Vellodi, A. (2008). A Randomized Controlled Trial of Miglustat
in Gaucher Disease Type 3. Ann Neurol. Nov;64(5):514-22.
Davies, E., Erikson, A., Collin-Histed, T., Mengel, E., Tylki-Szymanska., Vellodi, A
(2007) Outcome of type III Gaucher disease on enzyme replacement therapy:
review of 55 cases. J Inherit Metab Dis. Nov;30(6):935-42.
Davies, E. Surtees, R. DeVile, C. Schoon, I. Vellodi, A (2007)
A severity scoring tool to assess the neurological features of neuronopathic Gaucher
disease. J Inherit Metab Dis. Oct;30(5):768-82.
16
Chapter 1
Introduction
Research is one percent inspiration and 99 percent perspiration
17
1 Introduction
1.1 Lysosomal Storage Disorders
Lysosomal Storage Disorders (LSDs) are individually rare but cumulatively have an
incidence of 1:7700 (Meikle et al. 1999a; Meikle et al. 1999b). Each disorder results
from the defective function of a specific hydrolase, which ultimately leads to
progressive accumulation of either undegraded substrate(s) or catabolic products
that are unable to escape from this organelle. Most, but not all, are inherited in an
autosomal recessive manner. Defects in lysosomal enzymes, cofactors or transport
proteins may all give rise to LSDs and these can be classed conveniently according
to the type(s) of storage material accumulating (sphingolipidoses, oligosacharidoses,
mucopolysaccharidoses, glycogenoses, and neuronal ceroid lipofuscinoses). The
severity of the phenotype is closely related to the residual enzyme activity. For
practically all LSDs, the gene has been cloned and disease mutations identified
(Lyon et al. 2006).
The phenotypic spectrum of LSD manifestations can generally be divided into three
groups as follows:
1. Central nervous involvement with visceral manifestations
2. Central nervous involvement without visceral manifestations
3. Visceral manifestations only
The first group account for multisystem diseases where both visceral and central
nervous systems are involved (e.g Gaucher Type III, some forms of
Mucopolysaccharidosis (MPS) I and II). The second group is more commonly
associated with the infantile forms of diseases, where neurological involvement
18
presents early in life, and is often progressive and unrelenting, with early death (e.g
Tay-Sachs and infantile Krabbe). The third scenario appears when systemic disease
progresses but the central nervous system remains intact (e.g MPS IV A, MPS VI).
Lyon and colleagues categorised LSDs by their age of symptom onset and called
attention to their phenotypic expression to offer a practical means of directing
evaluation and diagnosis of patients (Lyon et al. 2006). The rate of progression, both
somatic and neurological, is heterogeneous – not only across disorders but within
each disease.
There are between forty and fifty different known LSDs; the majority involve the
central nervous system (Wraith 2002; Vellodi 2005). A review of the literature
identified at least twenty five that do so. This equates to around 50-60% of LSDs
having neurological involvement. A wide range of neurological phenotypes have
been reported. These include progressive psychomotor retardation, seizures and a
number of neurological abnormalities, in both the central and peripheral system,
sensorineural defects and psychiatric symptoms (Lyon et al. 2006). It is not fully
understood how an accumulation of substrates accumulating in brain tissues
gradually and irreparably damages nerve cells.
1.2 Gaucher Disease
Gaucher disease is an inherited lysosomal disorder caused by deficiency of the
enzyme glucocerebrosidase, which is necessary for the catabolism of
glucocerebroside. It is a multi-system disease that was first described by the French
19
physician Philippe Gaucher in 1882. Exactly a century later the gene for
glucocerebrosidase (GBA) was first localised to 1q21 (Barneveld et al. 1983).
1.2.1 Classification of Gaucher disease
Classically, three forms of the disease are recognised: type I or nonneuronopathic,
type 2 or acute neuronopathic, and type 3 or subacute or chronic neuronopathic
(Fredrickson & Sloan 1972). Type I or nonneuronopathic Gaucher disease is
diagnosed in childhood in 66% of Type I patients diagnosed, and an earlier onset is
indicative of more severe visceral disease. Paediatric presentation is characterised
by growth failure, hepatosplenomegaly, anaemia, skeletal involvement (Weinreb et
al. 2002).
Neuronopathic Gaucher disease (NGD) is defined as a confirmed diagnosis of
Gaucher disease in the presence of neurological symptoms and signs, for which
there is no other cause (Schiffmann & Vellodi 2007). Primary neurological
involvement in Gaucher disease was first described in the early 20th century (Rusca
1921). Historically NGD was sub-divided into ‘type 2’ and ‘type 3’ based on the
severity of the symptoms, and the rate of progression (Fredrickson & Sloan 1972).
However our group proposed that the terms ‘type 2’ and ‘type 3’ be dropped as they
fail to take account of the spectrum of NGD phenotypes. We proposed instead that
the terms ‘acute’ and ‘chronic’ NGD be used; these are now incorporated in the
revised guidelines for the management of NGD (Vellodi et al. 2009).
20
‘Acute NGD’ refers to the onset at <1 year of age of progressive bulbar involvement
(stridor, squint, swallowing difficulty) with pyramidal involvement (opisthotonus, head
retroflexion, spasticity, trismus) with death by the age of 2-4 years. ‘Chronic NGD’
refers to all patients with NGD who do not have ‘acute NGD’. Historically chronic
NGD has been subdivided in types A, B and C. However, our group felt that this
subdivision of chronic NGD was artificial and should be dropped, as the clinical
spectrum is too heterogeneous, and patients with intermediate severity have been
described (Goker-Alpan et al. 2003). By using the terms ‘acute’ and ‘chronic’ NGD
as classification will allow for the necessary flexibility to accommodate them.
1.2.2 Epidemiology
Gaucher disease is the most prevalent LSD, with a particularly high prevalence in
the Ashkenazi Jewish population. In most Caucasian populations, including
Ashkenazi Jews, type I is clearly the most prevalent. NGD is panethnic. However a
founder effect has been described in certain populations (Dreborg et al. 1980; Tylki-
Szymanska et al. 1996). Although no systematic study exists, it is estimated that
about 6% of Gaucher patients have NGD, 5% have the chronic form and 1% have
the acute form of the disease (Charrow et al. 2000). The neuronopathic forms are
collectively the rarest variant with an estimated incidence of <1:100,000 live births.
The first two mutations described in GBA - c.1448T>C (L444P) and c.1226A>G
(N370S), were identified in the late 1980s and these alleles are also the most
prevalent. Nomenclature mutations were recently changed however. Traditionally
mutations in the GBA gene were referred to by one letter amino acid codes with
21
amino acid number 1 being the first of the processed protein. According to the
Human Genome Variation Society (HGVS) www.hgvs.org/mutnomen guidelines,
protein numbering with amino acid 1 is now the initiating methionine of the precursor
protein. L444P protein nomenclature is now therefore p.Leu483Pro (exon 11) and
N370S is p.Asn409Ser (exon 10). For purpose of this thesis, however, only the
original nomenclature will be used.
There is poor genotype-phenotype correlation in Gaucher disease, and this has
been complicated further by the ever-expanding phenotypic spectrum observed. To
confound the issue, phenotypically similar patients have many different genotypes,
even in unique subgroups of patients (Hruska et al. 2007), while individuals with the
same genotype can have different phenotypes (Sidransky 2004). However some
genotype-phenotype correlations have been made. The N370S (c.1226A>G) allele
is typically associated with the non-neuronopathic form of the disease. Individuals
homozygous for L444P (c.1448T>C) or F213I (c.754T>A) usually develop chronic
NGD, but either mutation with a null allele is more likely to be associated with the
acute phenotype. Homozygous mutation D409H (1342G>C Protein nomenclature
p.Asp448His (exon 10)) is a phenotype that is associated with aortic valve
calcification and only mild neurological disease (Abrahamov et al. 1995; Chabas et
al. 1995; Chabas et al. 1996; Abrahamov et al. 2000; Bohlega et al. 2000).
1.2.3 Neuropathology
The neuropathological hallmark of Gaucher disease and one of the most
consistently identified pathologic features is the perivascular and periadvential
22
accumulation of lipid-laden macrophages, called Gaucher cells (Lee 1982; Wong et
al. 2004; Wong 2007). This has been reportd in all forms of Gaucher disease.
However, acute and chronic NGD have certain features. An extracortical, discernible
loss of neurons, sometimes associated with crumpled, shrunken-atrophic neurons
has been reported involving the basal ganglia, nuclei of the midbrain, pons and
medulla, cerebellum, dentate nucleus and hypothalamus. A severe neuronal loss
and degeneration of pyramidal cell neurons of the hippocampus has also been
described (Wong et al. 2004).
The main cell types affected are astrocytes and neurons, with the most common
astrocytic change being perivascular astrogliosis of grey and white matter. In
Gaucher disease of all types perivascular gliosis is present in white matter centrum
ovale, white matter tracts and interspersed grey matter of the striatum, cerebellar
white matter, and the brainstem interlaced with white matter tracts and
interconnected brainstem nuclei (Wong 2007).
White and grey matter are therefore both affected. However, as highlighted in
Chapter 4, the techniques available to investigate both white and grey matter in vivo
are not as sophisticated.
Although by definition Type I Gaucher disease does not involve the brain, there are
reports of neuropathological CNS involvement in patients who would otherwise be
considered to have Type I Gaucher – these are patients who are asymptomatic until
well into adulthood and the pathological CNS findings are much milder (Wong et al.
23
2004). Parkinsonian symptoms in patients diagnosed as having Type I Gaucher
disease have been noted (Lee 1982). Clinical and pathologic Parkinsonism and
dementia with Gaucher disease of all types have also been linked (Sidransky 2004;
Wong et al. 2004; Sidransky 2005).
1.2.4 Diagnosis
The diagnosis of NGD is purely clinical. The clinical hallmark of NGD is an
abnormality of horizontal gaze. This has been mistakenly described as oculomotor
apraxia, but should more accurately be called supranuclear saccadic gaze palsy.
Often this is the sole feature for many years. Furthermore, it can be difficult to detect
clinically, especially in infancy. It is usually be observed when the child turns around
while walking or when reading is associated with horizontal head jerks that
represent an attempt to compensate for the saccadic deficit. Older children learn to
compensate for their poor saccades by a combination of synkinetic blinking, looping
and head thrusting. Vertical saccades may be affected as well, though always later.
NGD should be suspected with early onset of disease, aggressive visceral disease
or high-risk genotype (Schiffmann & Vellodi 2007).
1.2.5 Neurological features of Chronic Neuronopathic Gaucher Disease
Most patients with chronic NGD present in the first 5 years of life (Altarescu et al.
2001). Patients often present not with a neurological abnormality, but with
hepatospenomegaly, anemia or failure to thrive. Historically, the severity of visceral
involvement has overshadowed the neurological manifestations of chronic NGD,
and the early demise from visceral complications has masked the “neurological
natural history”. The first comprehensive account of the neurological manifestations
24
seen in the Norrbottnian cohort, typical of the pre-ERT era, was reported thirty years
ago. The manifestations reported were convergent squint/ sixth nerve palsy; ataxic
gait; low IQ; Cerebellar, Pyramidal and Extrapyramidal involvement; delayed gross
and fine motor skills; seizures (including progressive myoclonus epilepsy) and
dementia with a median age of death at 12 years of age (Dreborg et al. 1980).
The rarity of NGD renders large-scale, systematic studies difficult (Jardim et al.
2010). Most clinical reports are of small numbers of patients (maximum 22) from
single ethnic or geographic locations (Dreborg et al. 1980; Tylki-Szymanska et al.
2006). Publications by our group, as part of a European collaboration across four
countries was the largest cohort of NGD patients ever studied uniformly, and
presented 52 patients (Davies et al. 2007a; Davies et al. 2007b).
The demographic and clinical features of NGD patients enrolled in an International
Collaborative Gaucher Group Neurological Outcomes Subregistry were recently
published (Tylki-Szymanska et al. 2010). This provides a great insight to the clinical
presentation of patients in the ERT era despite the limitations associated with
retrospective registries which are voluntary and observational, in particular missing
data. Given that large prospective studies on the natural history are hampered by
the rarity of these patients, registry data is valuable. Twenty three different
neurological symptoms for 131 patients were reported. The neurological
manifestation with the highest reported percentage is the ‘Ability to look to the
extreme right or left’, at 71%. The heterogeneity of manifestations in NGD is also
reflected in this cohort, as only three of the manifestations reported occurred in more
25
than 50% of the patients - Ability to look to the extreme right or left; 71%. Head
movement rather than eye movement; 63% and Head thrusting; 55%. Head
movement and head thrusting which are secondary manifestations to, horizontal
gaze palsy (HGP) the clinical hallmark of the disease. Other cranial nerve
characteristics reported were dysarthria (22%), swallowing difficulties (20%),
chewing difficulties (11%) and stridor (11%). The most frequently reported motor
abnormalities were muscle weakness (25%), extrapyramidal features (18%),
spasticity (15%), intention tremor (24%), and tremor at rest (16%). Sixteen percent
had suffered a seizure at the time their data was entered into the registry for the first
time, with the median age of first seizure being 5.6 years. One limitation of this
registry data however is that most symptoms are only accounted for as, present: yes
or no. Defining a level of severity for patients was not attempted.
1.2.6 Treatment options
The emergence of enzyme replacement therapy (ERT) as a therapeutic option
changed the outlook for Gaucher disease. Brady and colleagues developed the first
purification method for human beta glucosidase (Furbish et al. 1977). Subsequently
beta glucosidase from human placentae (alglucerase, Ceredase) was developed,
and followed later by the recombinant form (imiglucerase) (Barton et al. 1990). ERT
is now regarded as the treatment of choice for the visceral manifestations of
Gaucher disease. It has completely modifying the clinical phenotype.
In the pre ERT era, splenomegaly was debilitating, particularly when respiratory
function was compromised. Clinical management options at the time were limited to
26
splenectomy. However, splenectomy has been shown to result in increased skeletal
and CNS morbidity (Svennerholm et al. 1991; Mistry et al. 2009).
Neurological outcomes in NGD patients on ERT have only been reported on in open
label studies. The lack of control groups has prevented the results from being clearly
conclusive, or to help understand the natural history (Aoki et al. 2001; Lonser et al.
2007; Davies et al. 2007a). Even with gaps in knowledge, it is estimated that life
span of NGD patients has changed from the former 12 years of age (Dreborg et al.
1980) to the third or fourth decade after the advent of ERT (Jardim et al. 2010).
Bone marrow transplantation (BMT) was the treatment of choice before the efficacy
and safety of imiglucerase was demonstrated. Successful engraftment reversed the
manifestations of visceral disease, which are caused by enzyme-deficient
macrophages. However BMT does not appear to have reversed neurological deficit
or prevent continued deterioration (Schiffmann & Vellodi 2007). It is also not without
risk, and requires a total splenectomy beforehand. In the event of graft rejection the
patient is left asplenic and consequently at risk of rapidly progressive neurological
deterioration (Erikson et al. 1990; Svennerholm et al. 1991). The clinical course of
patients post-BMT is similar to the one commonly observed in NGD patients on ERT
(Erikson et al. 1990; Altarescu et al. 2001).
Despite demonstration that ERT is associated with reduction of perivascular lipid-
laden macrophages (Gaucher cells) in the brain (Schiffman et al. 1997). ERT does
not seem to have any effect in patients with myoclonic seizures, supranuclear gaze
27
palsy or cognitive deficit (Altarescu et al. 2001). Whilst it was initially thought that
NGD patients benefited from high dose ERT (Vellodi et al. 2001) there is now an
increasing consensus that ERT has no measurable effect on the neurological
manifestations of NGD patients, regardless of dose. To this end, it is now
recommended that NGD patients are treated with doses sufficient to control the
somatic manifestations (Vellodi et al. 2009).
The major obstacle thus far to halting the neurological manifestations is the blood-
brain barrier, and the inability of the intravenously infused glucocerebrosidase to
cross it in appreciable amounts (Schiffman et al. 1997). To overcome this limitation,
an attempt has been made to directly infuse glucocerebrosidase into the brain of a
patient with Type 2, acute NGD patient using convection-enhanced delivery (Migita
et al. 2003; Lonser et al. 2007). Targeted perfusion of affected sites in the brain was
achieved and well tolerated by the patient, without any evidence of toxicity. On this
basis, Lonser et al (2007) concluded that convection-enhanced delivery may be a
treatment paradigm that could be of benefit in the future. However, this approach
presents significant challenges.
Substrate Reduction Therapy (SRT) is another treatment modality. Unlike ERT, SRT
does not need to be disease specific. In this approach the enzymatic synthesis of
glucocerebroside is blocked by an inhibitor of ceramide: UDP-glucoslytransferse.
One of the principal substances employed in this regard is N-butyldeoxynojirimycin
NB-DNJ. NB-DNJ is registered and marketed for Gaucher Type I disease as
miglustat (Zavesca) (Cox et al. 2003).
28
Preliminary results indicated that SRT miglustat penetrated the blood-brain barrier,
with cerebrospinal fluid concentrating reaching 20-40% of those achieved
therapeutically in the plasma (Platt & Cox 2007). This led to a phase II, randomised,
multicenter, open-label study recruiting 30 NGD patients. However, this study failed
to demonstrate a measurable benefit for miglustat (Schiffmann et al. 2008).
Another future direction which holds hope for NGD patients is gene therapy. There
has been extensive laboratory and limited clinical experience with
glucocerebrosidase gene transfer by various techniques into animal and human
hematopoietic stem cell. In the early 1990s, work by at least three groups
demonstrated: 1) expression of human glucocerebrosidase following retroviral
vector-mediated transduction of murine hematopoietic stem cells, 2) retroviral-
mediated transfer of the human glucocerebrosidase gene into cultured Gaucher
bone marrow, 3) transfer and sustained expression of the human
glucocerebrosidase gene in mice and their macrophages after transplantation of
retrovirally transduced bone marrow, and 4) high titer amphotrophic vectors
containing the glucocerebrosidase gene capable of transducing at high efficiency
(Peters & Krivit 2007).
Further laboratory work led to the first clinical trials of gene transfer in patients with
Type I Gaucher disease (Barranger et al. 1997). While there was great promise
initially, sustained and significant clinical benefit was not observed. Consequently
29
investigators redirected their focus to improving methods for gene transfer, in
particular the use of viral vectors, particularly retroviral ones (Peters & Krivit 2007).
The history of treatment of Gaucher disease started with splenectomy, continued
with BMT, and more recently focused primarily on ERT. Despite these major
therapeutic advances, many questions and clinical management challenges remain
(Erikson 2001). The cause of neurologic signs and how best to treat the CNS being
one of the most complex. Combination therapeutic agents and modalities tailored to
the patient’s clinical condition and type of Gaucher may soon be warranted until new
potential therapies on the horizon are a step closer. A parallel need to identify
appropriate means of monitoring therapeutic interventions has also become evident.
1.2.7 Clinical monitoring
Clinical monitoring of NGD varies across centres, despite guidelines which were
recently revised and published (Vellodi et al. 2009). The minimum specified clinical
protocol for initial assessment include clinical neurological examination, neuro-
opthalmological inestigation and peripheral hearing: Brain imaging (preferably
magnetic resonance imaging (MRI), or computed tomography (CT) if MRI is
unavailable): Neurophysiology and Neuropsychomtery (Vellodi et al. 2009).
However due to age and cultural difference, and economic constraints it has not
been possible to develop a standardised format for these assessments, and their
sensitivity in demonstrating disease progression or improvement in response to new
potential therapy is unknown.
30
As HGP is a clinical hallmark of NGD neuroopthalmologic evaluation is
commonplace. Garbutt and Harris (2000) reported vertical eye movement
involvement in NGD, and postulated that it could be used as a sign of progression of
disease (Garbutt & Harris 2000). However the technical and practical difficulties in
measuring saccades to detect change were made evident in a recent study in which
our group participated (Schiffmann et al. 2008). This study highlighted the inherent
problems with complex assessment for the paediatric population. Compliance with
this assessment was not only difficult for the young, but also for those who had
adopted blinking as a compensatory mechanism to deal with HGP. Furthermore the
real value of saccades in reflecting clinical status, and its correlation with disease
severity has not been established. It contributes little to determining clinical care.
In such a heterogeneous disease, identifying a common clinical manifestation with
the potential for clinical monitoring is difficult. Encompassing all the neurological
manifestations into one score has advantages. This was the rationale for
development of a Severity Scoring Tool (SST) specifically for assessing and
monitoring the neurological manifestations of NGD (Davies et al. 2007b).
However, exploration of individual clinical features as acceptable markers of the
disease was also necessary. Selection of a feature that lends itself to be measured
as a marker was challenging, and in particular selecting a manifestation that was
present in a large enough incidence. In a study of 15 patients assessed at this
centre identified ataxia (12/15) and pyramidal involvement (13/15) as the most
common presenting feature after HGP (Davies et al. 2007b).
31
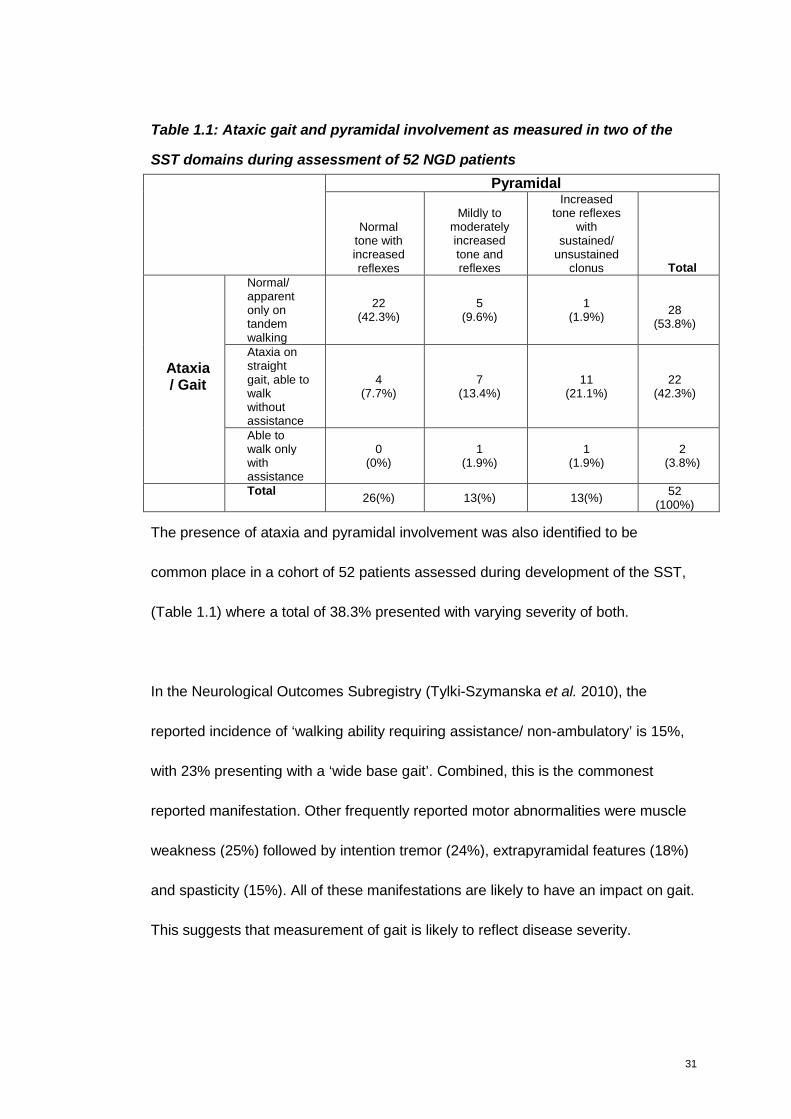
Table 1.1: Ataxic gait and pyramidal involvement as measured in two of the
SST domains during assessment of 52 NGD patients
Pyramidal
Normaltone withincreasedreflexes
Mildly tomoderatelyincreasedtone andreflexes
Increasedtone reflexes
withsustained/
unsustainedclonus Total
Normal/apparentonly ontandemwalking
22(42.3%)
5(9.6%)
1(1.9%)
28(53.8%)
Ataxia onstraightgait, able towalkwithoutassistance
4(7.7%)
7(13.4%)
11(21.1%)
22(42.3%)
Ataxia/ Gait
Able towalk onlywithassistance
0(0%)
1(1.9%)
1(1.9%)
2(3.8%)
Total26(%) 13(%) 13(%)
52(100%)
The presence of ataxia and pyramidal involvement was also identified to be
common place in a cohort of 52 patients assessed during development of the SST,
(Table 1.1) where a total of 38.3% presented with varying severity of both.
In the Neurological Outcomes Subregistry (Tylki-Szymanska et al. 2010), the
reported incidence of ‘walking ability requiring assistance/ non-ambulatory’ is 15%,
with 23% presenting with a ‘wide base gait’. Combined, this is the commonest
reported manifestation. Other frequently reported motor abnormalities were muscle
weakness (25%) followed by intention tremor (24%), extrapyramidal features (18%)
and spasticity (15%). All of these manifestations are likely to have an impact on gait.
This suggests that measurement of gait is likely to reflect disease severity.
32
As previously highlighted, in such a heterogeneous disease, identifying a clinical
manifestation that is present in all of the patients is difficult. Especially as the use of
HGP, the disease hallmark has been identified to be unsuitable as a marker for
monitoring disease progression. Encompassing all the neurological manifestations
in one score, as proposed in the SST has clear advantages. However other
manifestations which have an obvious impact on overall patient function warrant
further exploration. Based on the percentage of patients presenting with
manifestations that impact on gait (e.g ataxia, muscle weakness, pyramidal) it is
hypothesised that gait could be a useful marker of neurology in NGD, and worthy of
exploration.
1.3 Clinical trials qualifying for Marketing Authorisation Lysosomal Storage
Disorders
Following the Orphan Drug regulation ((EC) No 141/2000), a number of therapeutic
options have emerged for LSD over the last decade and more. Gaucher disease
paved the way with enzyme replacement therapy (ERT) alglucerase (Ceredase)
which was later replaced by imiglucerase (Cerezyme).
There are now eight ERT’s and one Substrate Reduction Therapy (SRT) licensed
centrally by the European community marketing authorisations: imiglucerase,
velaglucerase alfa, agalsidase beta, agalsidase alfa, alglucosidase alfa, laronidase,
idursulfase, galsulfase and miglustat for seven different LSDs, Gaucher, Fabry,
Pompe, MPS I, MPS II, MPS VI and NP-C.

33
The selection of clinical trial endpoints that meet the requirements of the regulatory
bodies is fraught with difficulties. Primary efficacy endpoints used in clinical trials for
the management of Gaucher disease with imiglucerase (Cerezyme) for Gaucher
disease included an increase in haemoglobin and platelet count and decrease in
liver and spleen volume. These parameters are robust and validated markers which
have clear correlation to clinical function.
http://www.ema.europa.eu/ema/index.jsp?curl=pages/medicines/human/medicines/0
00157/human_med_000693.jsp&murl=menus/medicines/medicines.jsp&mid=WC0b
01ac058001d125
Studies of agalsidase beta (Fabrazyme) for Fabry disease showed that agalsidase
beta could be administered safely and that it cleared glycosphingolipids
accumulated in the vascular endothelium in all organs studied. The primary efficacy
endpoint was a reduction of GL-3 accumulation from the capillary endothelium of the
kidney, measured by three pathologists using a scale of 0-3. Secondary efficacy
parameters included a reduction in pain as assessed by the Short Form McGill Pain
Questionnaire.
http://www.ema.europa.eu/ema/index.jsp?curl=pages/medicines/human/medicines/0
00370/human_med_000784.jsp&murl=menus/medicines/medicines.jsp&mid=WC0b
01ac058001d125
Studies of agalsidase alfa (Replagal) also for Fabry disease selected serious
debilitating pain, as measured by the brief pain inventory (a quantitative, validated
pain assessment scale) as the primary endpoint. The primary endpoint in the

34
second study was the effect of ERT on cardiac Gb3 levels as determined from
cardiac biopsy samples.
http://www.ema.europa.eu/ema/index.jsp?curl=pages/medicines/human/medicines/0
00369/human_med_001029.jsp&murl=menus/medicines/medicines.jsp&mid=WC0b
01ac058001d125
Efficacy of alglucosidase alfa (Myozyme) in the treatment of Pompe disease was
studied in two main clinical studies recruiting 39 patients. An epidemiological study
of the natural history of infantile Pompe examined the percentage of patients alive
and ventilator-free at 12 months from birth, from the date of onset of first symptoms,
and from the diagnosis date. “Percentage of patients alive and free of invasive
ventilator support (endotracheal tube) at 12 months of age” was compared to a
comparable historical untreated cohort derived from an epidemiological study. Other
efficacy endpoints included 1) percentage of patients alive at 12 months of age, 2)
percentage of patients with signs and symptoms of cardiac failure, 3) assessment of
motor function by Alberta Infant Motor Scale (AIMS) from birth to the age of
independent walking, 4) assessment of cognitive function by BSID II – modified
Bayley Scales of Infant Development in children from birth to 42 months of age and
5) assessment of functional status and disability by Paediatric Evaluation of
Disability Inventory (PEDI) and Pompe PEDI.
http://www.ema.europa.eu/ema/index.jsp?curl=pages/medicines/human/medicines/0
00636/human_med_000917.jsp&murl=menus/medicines/medicines.jsp&mid=WC0b
01ac058001d125
35
The primary efficacy variables of laronidase (Aldurazyme) in patients with MPS I,
were percent of predicted forced vital capacity (FVC) and absolute distance travelled
(in metres) during the six-minute walk test. There were four secondary efficacy
endpoints: apnea/hypopnea index, liver organ volume, disability score index of the
Childhood Health Assessment Questionnaire/ Health Assessment Questionnaire
(CHAQ/HAQ) and shoulder flexion of the Joint Range of Motion (ROM). Aldurazyme
was only studied in children over 5 years of age, and conclusions about its efficacy
on neurological manifestations not made.
http://www.emea.europa.eu/humandocs/Humans/EPAR/aldurazyme/aldurazyme.ht
m
Efficacy data of idursulfase (Elaprase) in MPS II, was also based on a 2-component
composite variable of the sum of the ranks of the change from baseline in the total
distance walked in the 6-minute walk test (6MWT) and % predicted FVC. Patients
were stratified by age and disease severity score at baseline. The clinical variables
of total distance walked in the 6MWT and % predicted FVC were also analysed
separately. Secondary efficacy endpoints were passive joint range of motion, liver
and spleen volume by MRI, urine glycosaminoglycan (GAG) levels and cardiac left
ventricular mass (LVM) by echocardiogram. Tertiary exploratory efficacy endpoints
growth velocity in prepubertal patients, radiological skeletal survey, CHAQ to
measure physical function (disability and pain) and the Hunter Syndrome-Functional
Outcomes in Clinical Understanding Scale (HS-FOCUS) questionnaire assessing
physical disabilities (supplement to CHAQ), Quality of Life assessment using the
Health Utilities Index (HUI) and the Childhood Health Questionnaire (CHQ). Again,
36
idursulfase is indicated to treat the non-neurological manifestations and therefore
evaluations of the neurological manifestations have not been conducted.
http://www.ema.europa.eu/ema/index.jsp?curl=pages/medicines/human/medicines/0
00477/human_med_000636.jsp&murl=menus/medicines/medicines.jsp&mid=WC0b
01ac058001d125
The efficacy of galsulfase (Naglazyme) was evaluated in MPS VI patients based on
the number of meters walked in 12 minutes, a three minute stair climb test and other
assessments of systemic function: joint mobility, joint pain and stiffness, upper
airway obstruction, manual dexterity and visual acuity.
http://www.ema.europa.eu/ema/index.jsp?curl=pages/medicines/human/medicines/0
00640/human_med_000918.jsp&murl=menus/medicines/medicines.jsp&mid=WC0b
01ac058001d125
A pivotal trial of miglustat (Zavesca) in Type I Gaucher disease was conducted in
patients unable or unwilling to receive ERT. Efficacy variables were mean liver and
spleen volume, haemoglobin concentration and platelet count. Other selected
efficacy parameters were bone mineral density Z-scores at the lumbar spine and
femoral neck and number of events of bone crisis, vascular necrosis or fractures
during treatment period.
Miglustat (Zavesca) was also studied in 31 patients with Niemann-Pick type C (NP-
C), 12 of whom were less than 12 years old. The primary endpoint was horizontal
saccadic eye movement velocity, based on its correlation with disease progression.
37
Secondary efficacy endpoints were assessments of swallowing, auditory acuity,
ambulatory ability (standard ambulation index), and for those 12 years and older -
cognition (mini-mental status examination MMSE).
http://www.ema.europa.eu/ema/index.jsp?curl=pages/medicines/human/medicines/0
00435/human_med_001171.jsp&murl=menus/medicines/medicines.jsp&mid=WC0b
01ac058001d125
Miglustat (Zavesca) was also studied in late-onset Tay-Sachs, but failed to
demonstrate efficacy, much like in NGD. In this 12 month, randomised, multicenter,
open-label study in late-onset Tay-Sachs change in eight measures of isometric
muscle strength in the limbs and isometric grip strength was selected as primary
efficacy endpoints. Secondary efficacy endpoints included gait, balance, overall
disability. A timed walk test (nonwheelchair bound patients only) was used to
measure gait speed, and the Standard Ambulation Index (range 0-9) was used to
determine the time and degree of assistance required to a set distance (overall and
for the nonwheelchair bound patients). The Modified Falls Efficacy Scale total score
(0-140) was used to assess patients’ fear of falling, and the Tinetti Scale balance (0-
16) and gait (range 0-12) scores were determined to assess the risk of future falls.
The overall functional disability throughout the study was measured using the
Amyotrophic Lateral Sclerosis Functioning rating Scale (Shapiro et al. 2009).
In NGD, the selected the primary efficacy endpoint was vertical saccadic eye
movement velocity as determined by the peak amplitude versus amplitude
regression lone slope. Secondary endpoints included changes in neurological and
38
neuropsychological assessments - including Purdue Peg Board test, Wechsler
Scale, Benton Visual Retention test, Rey auditory verbal learning test, D2 test of
attention, continuous performance test, and Trail Making Test. Neurological
assessments of metal state, cranial nerves, motor skills and brain auditory-evoked
potentials. However, many of these assessments are not age-appropriate for the
majority of the paediatric population that were recruited, resulting in a lot of missing
data for this study.
Performing this overview of therapeutic options currently licensed for LSDs, and
most importantly the endpoints used to evaluate their efficacy provides an insight
into an approach that may be acceptable for neuronopathic Gaucher disease.
Exploring and identifying valid and reliable means of measuring clinically meaningful
neurological changes is an obstacle that must be addressed if the efficacy of new
therapy is to be monitored effectively. To be truly valuable however this needs to be
done in a way that will be accepted by the regulatory authorities, before evaluation
of a drug therapy is commenced.
It is apparent from this review that very few of these drugs were studied for CNS
involvement, or able to demonstrate CNS benefit within neurolysosomal. Guidance
is therefore somewhat limited, however it is possible to deduct that a variety of
clinical assessment tools (MPS II, Pompe, Tay-Sachs) and gait parameters (MPS I,
MPS II, MPS VI, Tay-Sachs) have previously been used and accepted by the
regulatory authorities. This indicates that exploratory and development work using a
39
clinical severity scoring tool of neurological manifestations and gait analysis is a
worthwhile approach which can be justified in the context of this study.
1.4 Quantifying disease severity
The use of historical data to define the natural history of a disease and to
demonstrate the efficacy of alglucosidase alfa (Myozyme) was used and approved
by the Food and Drug Agency (FDA) for the licensing of ERT for Pompe disease
(Hannerieke et al. 2003). This approach has significant limitations however. While it
may be justified in a disease where mortality is the primary end point for efficacy,
this approach is inappropriate in other outcomes, especially without a large number
of published data to conduct a meta-analysis, particularly as the results are often
irreproducible.
The emergence of new drugs in rare disease has identified a demand for clinical
trials that incorporate adaptive designs. However, utilising a primary end point that
has not been validated for the study subjects has practical, scientific and ethical
implications. As an example, the use of nonstandardised outcome assessments has
yielded in conclusive results, insufficient power from multiple end points, an inability
to compare the results of different trials, and, overall, an absence of proven
therapies for disorders in myositis, adult and juvenile rheumatoid arthritis (van
Gestel et al. 1996; Giannini et al. 1997; Rider et al. 2004).
Paediatric drug development has experienced a complete revamp following the
European Paediatric legislation (Regulation (EC) No 1901/2006) which came into
40
force in 2007. One of the big drivers for this initiative was the high occurrence of off-
label prescribing occurring in the paediatric community. The legislation means that
all products being developed need to be considered in terms of their potential use in
the paediatric population. This is evaluated as part of a Paediatric Investigation Plan
presented to the Paediatric Committee at a European level, resulting in a legally
binding development plan between the European Medicine Agency and
pharmaceutical companies. This development plan will include the design of all
clinical trials, including the selection of the primary and secondary endpoints. The
demand for primary endpoints that are disease and age appropriate and validated
for the target population is therefore emerging as a critical necessity. In line with the
International Conference on Harmonisation; harmonised tripartite guideline on
statistical principles for clinical trials (E9) only surrogate markers with demonstrated
correlation to disease progression will be accepted (International Conference on
Harmonisation 1998).
In line with International Conference on Harmonisation guideline E9 a primary
endpoint should be a reliable and validated variable measuring some clinically
relevant and important benefit in the patient population. It is especially important to
address factors such as content validity, inter- and intra-rater reliability and
responsiveness for detecting changes in the severity of the disease (International
Conference on Harmonisation 1998). Achieving validity and reliability of a measuring
tool requires time and effort however, which is a powerful reason for using existing
scales when available (Bowling 2001). The appropriateness of the instrument for the
study population; and the acceptability of the instrument to the group under study
41
need to be evaluated and considered, this is particularly important for the paediatric
population. Disease-specific scales have the aim of being more clinically significant
in relation to specific conditions – of being able to discriminate more finely between
patients’ levels of severity of condition, and of being more sensitive to their clinical
outcomes (Bowling 2001).
1.5 Surrogate Markers and Biomarkers
International Conference on Harmonisation guideline on ‘Clinical Investigation of
Medicinal Products in the Paediatric Population’ (E11) (2000) clearly states that
“Where efficacy studies are needed, it may be necessary to develop, validate and
employ different endpoints for specific age and developmental age groups”
(International Conference on Harmonisation 2000).
Furthermore, the Committee for Medicinal Products for Human Use at the European
Medicine Agency (EMA) (2006) developed a Guideline on Clinical Trials in Small
Populations, which discuss the choice of endpoints. The guideline states that; Time
to disease progression is an endpoint of intermediate level and it requires a
measure of disease severity or of disease progression. Ideally, this should be
validated as a tool for use in clinical trials, but it is recognised that there might be too
few patients to use some for validating endpoints and other for testing treatments.
The choice of a primary endpoint may therefore pose considerable problems. In
some cases, the ‘most appropriate’ clinical endpoint may not be known or widely
agreed or a validated endpoint may not exist.
42
In the context of rare disorders; for a given clinical endpoint or validated surrogate
endpoint, recruitment of a sufficient number of patients is difficult, or demonstration
of change in this endpoint can take an unreasonable length of time. The use of other
surrogate markers as substitutes for a clinical endpoint may be considered.
However, selection of a surrogate marker as study endpoint requires it to be
reasonably likely – based on epidemiologic, pathophysiologic, or other evidence – to
predict benefit. Demonstrating that a surrogate endpoint adequately reflects the true
clinical endpoint is difficult. Epidemiological data, and data from patient registries
can provide some help. These data may be limited when there are very few patients,
and data entry is incomplete.
Validated surrogate outcomes are those tests for which there is adequate evidence
that a drug effect on the measure predicts the clinical benefit desired. Regulatory
authorities have approved several treatments on the basis of their effects on
validated surrogate measures e.g anti-hypertensives are approved on the basis of
their effects on a blood pressure and not on any effect on a symptom that is
detectable to a patient. These drugs are approved because evidence has
demonstrated that lowering blood pressure in the long term has beneficial clinical
effects.
Unvalidated surrogates, on the other hand, are measures for which evidence does
not exist that a drug effect on the measure predicts the desired clinical outcome. In
1992 the FDA adopted a new regulation (Title 21 Code of Federal Regulations
314.500, Subpart H, Accelerated Approval of New Drugs for Serious or Life-
43
Threatening Illnesses, FDA) in which for the first time, approval of a treatment on the
basis of its effect on an unvalidated surrogate was permitted.
This regulation permits approval of a drug on the basis of clinical trials (which must
be adequate and well-controlled) in serious or life-threatening illnesses that
establish that “… the drug product has an effect on a surrogate endpoint that is
reasonably likely, based on epidemiologic, therapeutic, pathophysiologic, or other
evidence, to predict clinical benefit…”. This regulation only applies to treatments that
offer a meaningful therapeutic benefit over that provided by available products (…
“e.g., ability to treat patients unresponsive to, or intolerant of, available therapy, or
improved patient response over available therapy”). The regulation require that the
surrogate marker be validated in studies completed after marketing, and, if this is
not accomplished, the FDA may remove the product from the market in an
expedited manner.
Surrogate endpoints are defined as laboratory measures, imaging or other tests that
have no direct or obvious relationship to how a patient feels, or to any clinical
symptom, but on which a beneficial effect of a drug is presumed to predict a desired
beneficial effect on such a clinical outcome. There is considerable interest currently
in approval of treatments on the basis of their effects on endpoints for several
reasons, with the view that studies that rely on surrogate measures as their primary
outcome measures can be smaller (fewer patients) and shorter than studies that rely
on an effect on a more traditional clinical outcome. Plasma levels of chitoriosidase in
Gaucher and GL3 in Fabry disease can be regarded as surrogate endpoints.
44
However there are no laboratory measures that are currently available to evaluate
CNS function. Chitotriosidase levels in the cerebrospinal fluid (CSF) may be one
option to consider in the NGD cohort. However, the invasiveness of the lumbar
punctures required to obtain CSF samples, and the unlikely possibility of obtaining
ethical approval to conduct a study to explore its value for monitoring purposes
makes this difficult.
The Paediatric legislation (2007) along with the Orphan Drug legislation (1990) can
now result in 12 years exclusivity for pharmaceutical companies, which can be
regarded as a real incentive to study new emerging therapies in LSD. This is an
opportune time therefore to identify and develop disease specific clinical markers of
NGD that are appropriate and validated for use in a paediatric population.
1.6 Aims of thesis
The aim of this work was to explore the potential use of three different assessment
tools to monitor the neurological involvements in NGD. Horizontal gaze palsy is the
clinical hallmark of NGD. Other neurological manifestations include seizures,
cerebellar ataxia and pyramidal tract involvements. However, NGD is very
heterogeneous and the neurological features vary greatly from patient to patient, not
only in terms of manifestations involved but also in terms of the severity of the
presentation. The emergence of enzyme replacement therapy has changed the
‘natural history’ of the disease, and patients are now living longer where previously
they would have succumbed to the visceral complications of the disease. New
emerging therapies are being developed for NGD, however a suitable surrogate

45
marker to monitor neurological disease progress is lacking. Therefore, in a bid to
identify suitable markers, three different tools were utilised to examine their value
and sensitivity to assess neurological involvement in NGD.
Thus, the aims of this project were:
To modify and complete validation of the Severity Scoring Tool (SST) - to
ensure that it offers a robust tool for monitoring NGD patients.
To describe the gait characteristics of NGD patients to explore the potential
use of gait as a marker of disease severity.
To use state of the art imaging (diffusion tensor imaging) to examine the
NGD brain, and explore its value and sensitivity as a marker of disease
severity.
To examine the concordance of these assessments in defining disease
severity.
To consider the value of the three assessment tools for future clinical trials.
1.7 Ethics Approval
This study was approved in two parts.
1. By the Institute of Child Health Research Ethics Committee on 26 May 2006.
Study Title: The Development of a Severity Scoring Tool for Neuronopathic Gaucher
Disease. Reference Number: 06/Q0508/39
2. By Wandsworth Research Ethics Committee (Paediatric specialist) on 25 July
2007. Study Title: Quantifying neurological features in Lysosomal Storage Disorders.
Reference Number: 07/H0803/126. With amendment submitted, and approved 06
January 2009.
46
1.8 Patient Recruitment
Patient recruitment for the validation and modification of the Severity Scoring Tool
patients were from three different centres:
Villa Metabolica Children’s Hospital, MC Universitatsmedizin Mainz,
Langenbeckstr.2, Mainz, Germany
Clinic of Metabolic Diseases, Endocrinology and Diabetology, The Children’s
Memorial Health Institute, Warsaw, Poland
Great Ormond Street Hospital Children’s NHS Trust, London.
Patient recruitment for gait and diffusion tensor imaging was performed only at:
Great Ormond Street Hospital Children’s NHS Trust, London.
A detailed overview of all the patients recruited, and assessments performed by
each patient are presented in Appendix 3.
47
Chapter 2
Severity Scoring Tool
Keep your fears to yourself, but share your aspirations with others.
- Robert Louis Stevenson
48
2. Severity Scoring Tool.
2.1 Introduction
Clinical rating scales are widely used in neurology (Masur 2007). The majority of
these however are developed for diseases that are most commonly seen in
adulthood, and rarely developed, or validated for disease that are predominately
seen in paediatrics. Developing tools that are both disease-specific and age-
appropriate is particularly challenging.
There are some exceptions. The ‘International Cooperative Ataxia Rating Scale’
(ICARS) is a disease specific instrument for Friedreich's ataxia, a disease that
typically presents in childhood, with mean age at presentation being 10 years old.
The scale is based upon 19 simple testing manoeuvres compartmentalised into
postural and stance disorders, limb ataxia, dysarthria and oculomotor disorders
(Trouillas et al. 1997). It is considered valid (Cano et al. 2005) with good inter-rater
reliability (Storey et al. 2004). A second scale has also been developed, the
Friedreich's Ataxia Rating Scale (FARS). The main component of the scale is a
detailed neurological examination consisting of 25 manoeuvres along with three
quantitative performance measures (Lynch et al. 2006). The scale has only
provisionally been validated in one study which identified a larger variability
compared to ICARS. This may have been caused by the fact that performing the
FARS takes 45 minutes compared to 10 minutes for the ICARS. This may lead to
patient and investigator fatigue (Lynch et al. 2006).
In response to the fact that there was no assessment tool available to plot the
temporal course of mitochondrial disease, the Newcastle Paediatric Mitochondrial
49
Disease Scale (NPMDS) was devised for children in 2006 (Phoenix et al. 2006). It is
a practical and semi-quantitative rating scale that covers the diverse clinical
spectrum seen. It is also multi-dimensional and reproducible, offering a tool through
which mitochondrial disease can be objectively monitored. It was designed
according to several predefined objectives: (1) to accurately and objectively assess
the natural history of mitochondrial disease throughout childhood and into adult life;
(2) to encompass the multi-dimensional nature of mitochondrial disease through a
process which required input from patient (where possible), carer, clinician and case
notes; (3) to provide a quantifiable measure of the functional disability encountered
and the impact this has on patients and their families; (4) to be a concise, pragmatic
tool suitable for use in a clinic setting, yet able to provide a comprehensive
assessment. The scale was developed based around four domains: Section I –
current function: Section II – system-specific involvement; III – current clinical
assessment and IV – quality of life. The list of items to be included in Section I-III
was developed by three clinicians with expertise in mitochondrial disease. During
this development, the experts acknowledged the difficult challenge in creating a tool
that is relevant to patient’s age and state of development. To address this, the scale
was subdivided into three age ranges, infancy and early childhood (0-24 months),
middle childhood (2-11 years) and adolescence (12-18 years). The scale was
designed so that each subdivision of the scale merged seamlessly with the next as
the children grew older, thereby moving from the adolescent rating scale to the adult
scale (Phoenix et al. 2006).
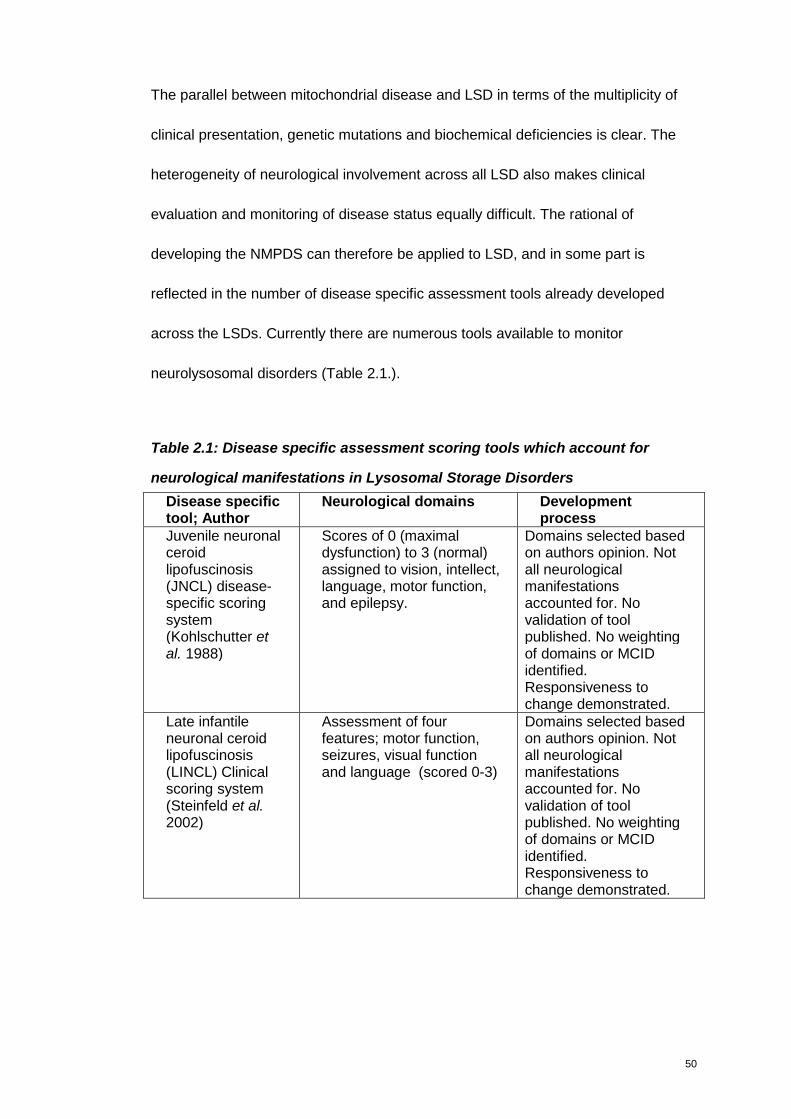
50
The parallel between mitochondrial disease and LSD in terms of the multiplicity of
clinical presentation, genetic mutations and biochemical deficiencies is clear. The
heterogeneity of neurological involvement across all LSD also makes clinical
evaluation and monitoring of disease status equally difficult. The rational of
developing the NMPDS can therefore be applied to LSD, and in some part is
reflected in the number of disease specific assessment tools already developed
across the LSDs. Currently there are numerous tools available to monitor
neurolysosomal disorders (Table 2.1.).
Table 2.1: Disease specific assessment scoring tools which account for
neurological manifestations in Lysosomal Storage Disorders
Disease specifictool; Author
Neurological domains Developmentprocess
Juvenile neuronalceroidlipofuscinosis(JNCL) disease-specific scoringsystem(Kohlschutter etal. 1988)
Scores of 0 (maximaldysfunction) to 3 (normal)assigned to vision, intellect,language, motor function,and epilepsy.
Domains selected basedon authors opinion. Notall neurologicalmanifestationsaccounted for. Novalidation of toolpublished. No weightingof domains or MCIDidentified.Responsiveness tochange demonstrated.
Late infantileneuronal ceroidlipofuscinosis(LINCL) Clinicalscoring system(Steinfeld et al.2002)
Assessment of fourfeatures; motor function,seizures, visual functionand language (scored 0-3)
Domains selected basedon authors opinion. Notall neurologicalmanifestationsaccounted for. Novalidation of toolpublished. No weightingof domains or MCIDidentified.Responsiveness tochange demonstrated.
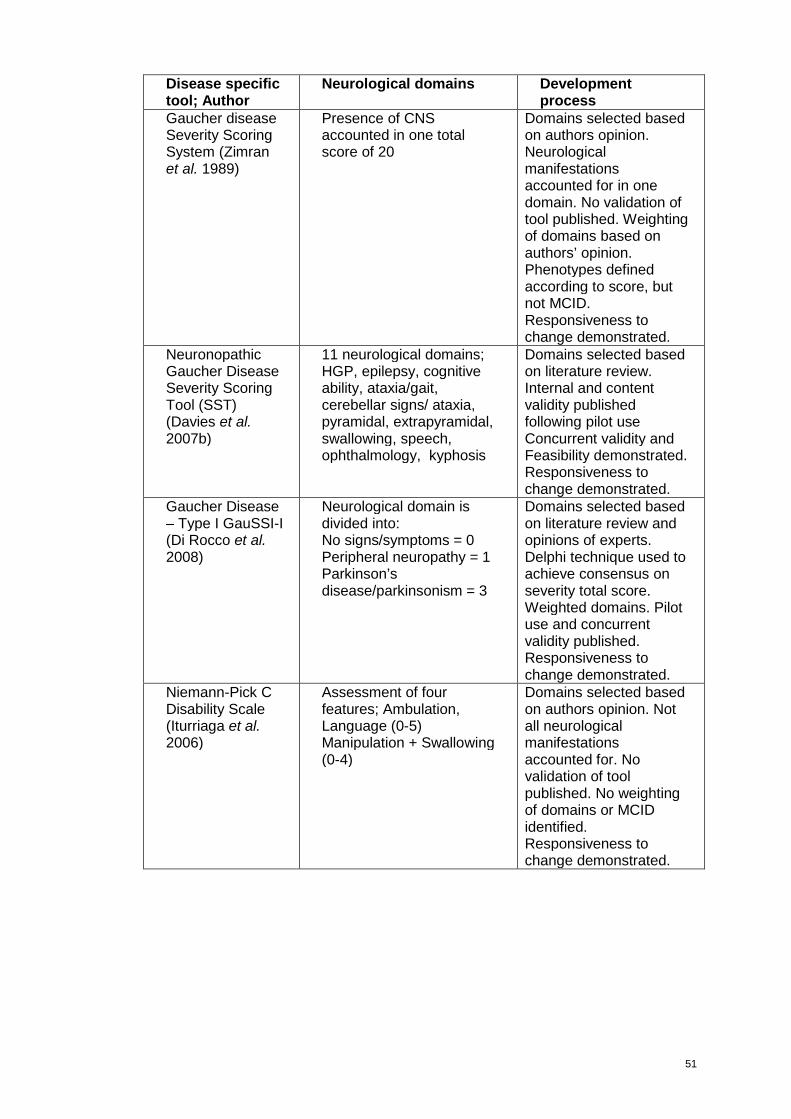
51
Disease specifictool; Author
Neurological domains Developmentprocess
Gaucher diseaseSeverity ScoringSystem (Zimranet al. 1989)
Presence of CNSaccounted in one totalscore of 20
Domains selected basedon authors opinion.Neurologicalmanifestationsaccounted for in onedomain. No validation oftool published. Weightingof domains based onauthors’ opinion.Phenotypes definedaccording to score, butnot MCID.Responsiveness tochange demonstrated.
NeuronopathicGaucher DiseaseSeverity ScoringTool (SST)(Davies et al.2007b)
11 neurological domains;HGP, epilepsy, cognitiveability, ataxia/gait,cerebellar signs/ ataxia,pyramidal, extrapyramidal,swallowing, speech,ophthalmology, kyphosis
Domains selected basedon literature review.Internal and contentvalidity publishedfollowing pilot useConcurrent validity andFeasibility demonstrated.Responsiveness tochange demonstrated.
Gaucher Disease– Type I GauSSI-I(Di Rocco et al.2008)
Neurological domain isdivided into:No signs/symptoms = 0Peripheral neuropathy = 1Parkinson’sdisease/parkinsonism = 3
Domains selected basedon literature review andopinions of experts.Delphi technique used toachieve consensus onseverity total score.Weighted domains. Pilotuse and concurrentvalidity published.Responsiveness tochange demonstrated.
Niemann-Pick CDisability Scale(Iturriaga et al.2006)
Assessment of fourfeatures; Ambulation,Language (0-5)Manipulation + Swallowing(0-4)
Domains selected basedon authors opinion. Notall neurologicalmanifestationsaccounted for. Novalidation of toolpublished. No weightingof domains or MCIDidentified.Responsiveness tochange demonstrated.

52
Disease specifictool; Author
Neurological domains Developmentprocess
Niemann-Pick CClinical SeverityScale(Yanjanin et al.2010a)
Eye movement,Ambulation, Speech,Swallow, Fine Motor Skill,Cognition, Hearing,Memory, Seizures (all 0-5).Modifiers – Gelasticcataplexy, Narcolepsy,Behaviour, Psychiatric,Hyperreflexia,Incontinence, AuditoryBrainstem Response,Respiratory.
Inter-rater reliability,sensitivity and validity ofscale published.Domains not weighted.Responsiveness tochange demonstrated.
Fabry DiseaseDS3 (Giannini etal. 2010)
Peripheral NervousSystem: Sweating (0-2)Gastrointestinal (0-5) Pain(0-5) Central NervousSystem: White MatterLesions (0-8)TIA/stroke (0-8).
Reliability and validitydemonstrated throughexpert consensusformation and statisticaltechniques used toidentify domains andweighting. MCIDestimated.Responsiveness tochange demonstrated.
Fabry DiseaseMainz SeverityScore (MSSI)(Whybra et al.2004)
Neurological domains:Tinnitus, Vertigo,Acroparesthesia, Fever,Pain Crisis,Cerebrovascular,Psychiatric/ psychological
Domains selected andweighted based onauthors opinion.Specificity of MSSIdemonstrated.Phenotypes definedaccording to score, butnot MCID.Responsiveness tochange demonstrated.
MPS IIIA FPSS(Meyer et al.2007)(modified basedon LINCL scoringsystem)
Four-point scoring systemassessing three clinicalfeatures: Motor function,Speech abilities andCognitive function
Domains selected basedon authors opinion. Notall neurologicalmanifestationsaccounted for. Novalidation of toolpublished. No weightingof domains or MCIDidentified.Responsiveness tochange demonstrated.
MCID - Minimum Clinically Important Difference
53
Scales developed for use in LSDs
Neuronal ceroid lipofuscinosis (NCL)
Clinical assessment scales developed for paediatric use include the one for JNCL
and another for LINCL. During the initial development of the scoring system for
LINCL Steinfeld et al (2002) examined 26 patients, and developed the clinical
performance score by rating motor, visual, and verbal functions. Incidence of
seizures in 3-month intervals had originally been included but later omitted as
seizure scores fluctuated strongly and seemed to depend on treatment modalities. A
Total Disability Score was derived by summing up the single scores for motor, visual
and verbal functions – totalling in a normal score of 9, where a declining score
indicates progression of disease. The authors say that the performance rating scale
is able to clearly and quantitatively delineate the disease course of the LINCL
patients, and hence offers a useful tool for clinical evaluation of therapeutic
interventions. In the author’s view the system can be applied to other types of
neuronal ceroid lipofuscinoses and could be adapted to various other
neurodegenerative diseases of childhood (Steinfeld et al. 2002). However
proceeding with this approach would still require disease-specific validation.
Mucopolysaccaridosis type IIIA
The four-point scoring tool developed for JNCL and LINCL was adapted to develop
a scoring tool for MPS IIIA based on the assessment of 71 patients (Meyer et al.
2007). The domains selected for this disease were changed to include motor
function, speech abilities and cognitive function. In the same regard however, the
54
total score of 9 indicated normal function and a declining score reflects disease
progression.
However, a failing of these tools is that they fail to include domains for all of the
neurological manifestations that are present in both LINCL and MPSIIIA.
Furthermore, important issues such as internal reliability, feasibility, face validity or
content validity have not been addressed. These are important issues to be
established in order to demonstrate the robustness of any tool.
Gaucher disease
There have been three tools developed for Gaucher disease, the Zimran Severity
Scoring System, the Gaucher Disease Severity Scoring Index, and the Severity
Scoring Tool. The first two were developed predominantly for type I. In the Zimran
Severity Scoring System, the neurological manifestations were all grouped into one
domain (Zimran et al. 1989). Based on the opinion of the authors, patients were
assigned to one of three clinical phenotypes: mild (severity scoring index 0-10
points), moderate (11-25), or severe (>26). The neurological domain was attributed
20 points, for any neurological involvement, regardless of presentation. This does
not allow for level of severity to be reflected, and there is no means of capturing
change in presentation. It was for this reason that the SST was originally developed
(Davies et al. 2007b). The Gaucher Disease Severity Score Index (GauSSI-I) (Di
Rocco et al. 2008) which was developed later is specific for Type I Gaucher disease
and mostly omitted neurological manifestations, particularly those seen in NGD. The
Zimran et al (1989) Severity Scoring System failed to address most of the criteria for
55
demonstrating validity and reliability, while the GauSSI-I (Di Rocco et al. 2008) has
established some validity criterions.
Niemann-Pick C
Two clinical severity scales to state the progression of Niemann-Pick C (NP-C) have
also been developed. Iturriaga et al (2006) created a disability scale containing four
domains, with the aim of recording the chronological evolution of the disease.
Despite describing 10 neurological manifestations leading to diagnosis in the cohort
studied, the authors do not say why only four manifestations were selected for the
scale. They state that the disability scale showed, as expected, differing scores
according to NP-C form and age. However no work was published on the validation
process of the scale (Iturriaga et al. 2006).
The most recent scale includes 17 domains, which give comprehensive coverage of
the neurological manifestations of NP-C. The severity scale was applied
longitudinally, in prospective and retrospective cohorts of NP-C, and their results
outlined the disease progression of late-infantile, juvenile and adult forms of NP-C.
Scores increased linearly as function of time interval between visits, and nonlinearly
as a function of age (Yanjanin et al. 2010b). The authors also examined inter-rater
reliability, sensitivity and validity of scale, with good results.
Fabry Disease
The MSSI was developed to assess the severity of Fabry disease and to monitor
patient progress while on enzyme replacement therapy. MSSI was demonstrated to
56
be highly specific for differentiating Fabry from other patients who presented with
similar complaints. MSSI also correlated to increasing age, which is clinically viable
in Fabry disease (Whybra et al. 2004).
The development of the DS3 severity scoring system for Fabry disease, Giannini et
al (2010) demonstrate an excellent and comprehensive approach to tool
development, in which sixteen experts from six countries collaborated. Reliability,
validity and feasibility were tested using a combination of expert consensus
formation and statistical techniques. Furthermore, the minimum clinically important
difference (MCID) in each of the instruments was estimated and the DS3’s
quantitative content validity was judged.
These tools demonstrate that there is a clinical demand for disease specific tools in
LSD. Existing tools are not applicable across the board for all LSD however, given
the large heterogeneity of neurological manifestations seen across the disorders -
hence the need to develop and validate new, disease-specific tools.
The assessment of neurological or cognitive status in some of the MPS disorders
can be rendered difficult by co-existing visceral disease. MPS II, for example, is
difficult, as somatic disease can confound the neurological presentation (Wraith et al.
2008). Fine motor skills of hand function diminish as a result of progressive flexion
contractures in the fingers, and ultimately a ‘claw hand’ deformity. Factors such as
limited hand function; carpal tunnel syndrome, decreased visual acuity or hearing
57
loss may interfere with communication and learning, and ultimately give an
impression of developmental delay.
Wraith and colleagues (2008) further highlight the difficulties in monitoring MPS
patients’ response to treatment when they are too young to cooperate with clinical
assessments, and states that identifying a suitable biomarker that would reflect the
disease burden and respond promptly to therapy currently remains a significant
clinical need. The same complexities when patients are too young to cooperate with
complex clinical assessments are true for NGD, which is primarily a paediatric
presenting disease.
Severity Scoring Tool for NGD – previous work and original development
The ‘natural history’ of the neurological manifestations seen in NGD remains largely
unknown in the enzyme replacement era, despite some follow up studies of cohorts
in Europe (Tylki-Szymanska et al. 2006; Erikson et al. 2006a; Erikson et al. 2006b;
Erikson et al. 2006c).
Clinical monitoring was found to vary across centres, despite published guidelines
(Davies et al. 2007a). Critically, there appeared to be little or no means of monitoring
patients objectively.
The SST (Appendix 1) was developed in response to this, and in the aftermath of
the miglustat clinical trial (Schiffman et al. 2008). This work, led by myself, was
supported by our group and several members of the European Task Force for NGD.
58
Its development was based on extensive review of the literature, which accounted
for 102 patients. Based on the neurological manifestations reported in the
publications the domains were identified, and categories of severity defined. This
was followed with a pilot use on 47 patients across four European countries –
equating to the largest cohort of NGD patients ever studied systematically (Davies et
al. 2007b). The neurological domains included in the SST after evaluation of internal
reliability and content validity were - Horizontal Gaze Palsy, Epilepsy, Cognitive
Development, Ataxia/Gait, Cerebellar Ataxia, Pyramidal, Extrapyramidal, Swallowing,
Speech, Ophthalmology and Kyphosis (Davies et al. 2007b).
The SST was recently incorporated in the revised guidelines for the management of
NGD by The European Task Force (Vellodi et al. 2009). The guidelines attempted to
utilise generally available, cost-effective technology, while at the same time yielding
the most possible clinically relevant data. Apart from the SST, other recommended
neurological examination include neuro-opthalmological investigation, brain imaging,
electroencephalography, neuropsychological assessments and measurement of
peripheral hearing (electro-acoustical emission in small children, pure tone
audiometry in older patients) (Vellodi et al. 2009). However, due to age, cultural
difference, and economic constraints it has not been possible to ascertain a
standardised format for any of these individual assessments, and their sensitivity in
capturing disease progression or improvement in response to new potential therapy
is unknown. As horizontal gaze palsy is a clinical hallmark of NGD, neuro-
opthalmologic evaluation is common place. However the value of using saccades in
detecting change in disease status is now questioned following a recent study
59
(Schiffmann et al. 2008). The complexities of this study, in which our group recruited
half of the patients identified many challenges. The biggest was that the evaluation
of saccades was extremely difficult. The assessment requires complex cooperation
for a prolonged period of time. Furthermore, each time the child blinks or head
thrusts – the natural compensatory mechanisms adopted in NGD, an artefact
corrupts the quality of the data captured. This made the assessment stressful and
traumatic for many of the children, and highlighted the need to develop clinical tools
that are acceptable to the target population.
Despite the demonstration of internal reliability, feasibility, face and content validity
(consensual and quantitative) of the SST (Davies et al. 2007b) further work was
necessary to ensure that it offered a robust and valid means to capture disease
progression, and to serve as a potential marker to monitor response to any new
emerging therapies. To be in line with the International Conference on
Harmonisation (ICH) E9 Statistical Principles for Clinical Trials guideline; factors
such as content validity, inter- and intra-rater reliability and responsiveness for
detecting changes in the severity of the disease need to be addressed for all
selected endpoints (International Conference on Harmonisation 1998).
Additional development and validation of the SST was therefore needed to address
the ICH E9 specification, which is the basis for this part of this study. Evaluating
inter-rater and intra-rater agreement; identifying the ‘weighting’ for each domain;
demonstrating the SSTs responsiveness to change and identifying the ‘minimum

60
clinically important difference’ (MCID) will allow for a scale that accurately reflects
the neurological phenotype, while at the same time being robust and valid.
2.2 Methods
2.2.1 Inter-rater and intra-rater evaluation
Repeatability assessment indicates the extent of potential error present; this is
referred to as ‘measurement error’. For example, if an assessor measures a child’s
height to the nearest millimetre on two separate occasions, then it is very likely that
the two readings will be different. If the assessor is inexperienced or using new
equipment then these differences are likely to be larger. If the two measurements
are taken by two different assessors, then these differences are likely to be larger
still.
It is important to understand the terms inter-rater and intra-rater agreement. Intra-
rater agreement refers to the reliability of the same rater’s scores on the same
subjects on different occasions. Inter-rater agreement is the concordance of scores
achieved by different assessors on the same occasion.
Therefore, with any clinical tool, it is imperative to demonstrate inter-rater and intra-
rater agreement. Correlation techniques are often used to compute an index of
agreement. By calculating the correlation coefficient, the degree of correlation
among each observer’s scores is determined. The higher the coefficient of
correlation, the more reliable the score is.
61
When considering the impact of measurement error, one needs to consider whether
the total score is likely to change over time naturally and the possibility of fatigue or
learning effect. These are particularly relevant in progressive diseases like NGD.
Patient fatigue can impact on how well the child cooperates with the assessor’s
examination, and of course the assessors become more familiar with the
examination and assessment prompts which may affect the result (learning effect).
It is important to demonstrate that any variability in the data is due to natural
variability and not assessor error. Appropriate statistical tests to consider when one
assessor produces several replicate scores, or when a series of patients are
assessed by more than one assessor, are ‘repeatability coefficient’ and ‘intra-class
correlation coefficient’. There are several different types of intra-class correlation
(reliability) coefficients; one of the more commonly used is the Pearson coefficient.
A situation that may occur is that the total score of the SST demonstrates good
agreement, while individual domains within the SST do not. Individual domains yield
ordinal data, which means that non-parametric tests must be used. Although the
SST total score could be regarded as interval data, and therefore possibly suitable
for parametric analysis this will ultimately be decided based on the data generated
and whether or not it is normally distributed
When the categorical outcome measured is ordered (ordinal data), as in these
domains, this must be taken into account and a non-parametric statistical test used.
Kendall tau tests the strength of association of the cross tabulations when both
62
variables are measured at the ordinal level. It makes adjustments for ties and is
most suitable for rectangular tables. The values range from −1 (100% negative
association, or perfect inversion) to +1 (100% positive association, or perfect
agreement). A value of zero indicates the absence of association.
The statistical value of performing inferential statistics is limited given that the
number of patient required to power them sufficiently is near impossible in the
context of an orphan disease, particularly when recruitment is restricted to one
specialist centre. This needs to be considered during data analysis.
In a bid to examine intra-rater agreement nine patients were assessed sequentially.
Due to the slow nature of disease progression in NGD, as documented by Erikson et
al (2006) and Tylki-Szymanska et al (2006), it was hypothesised that that disease
status would not progress in a three month period of time. Three months being the
time period that patients attend routine clinic. To increase the power with the limited
number of patients available as many assessments scores as possible were sought.
An assessment of the SST’s inter-rater agreement was evaluated by having NGD
patients assessed on the same day by two separate assessors. The assessors were
medical clinicians within our group. Both had extensive experience in managing
NGD patients, and were familiar with the SST having been involved in its original
development.
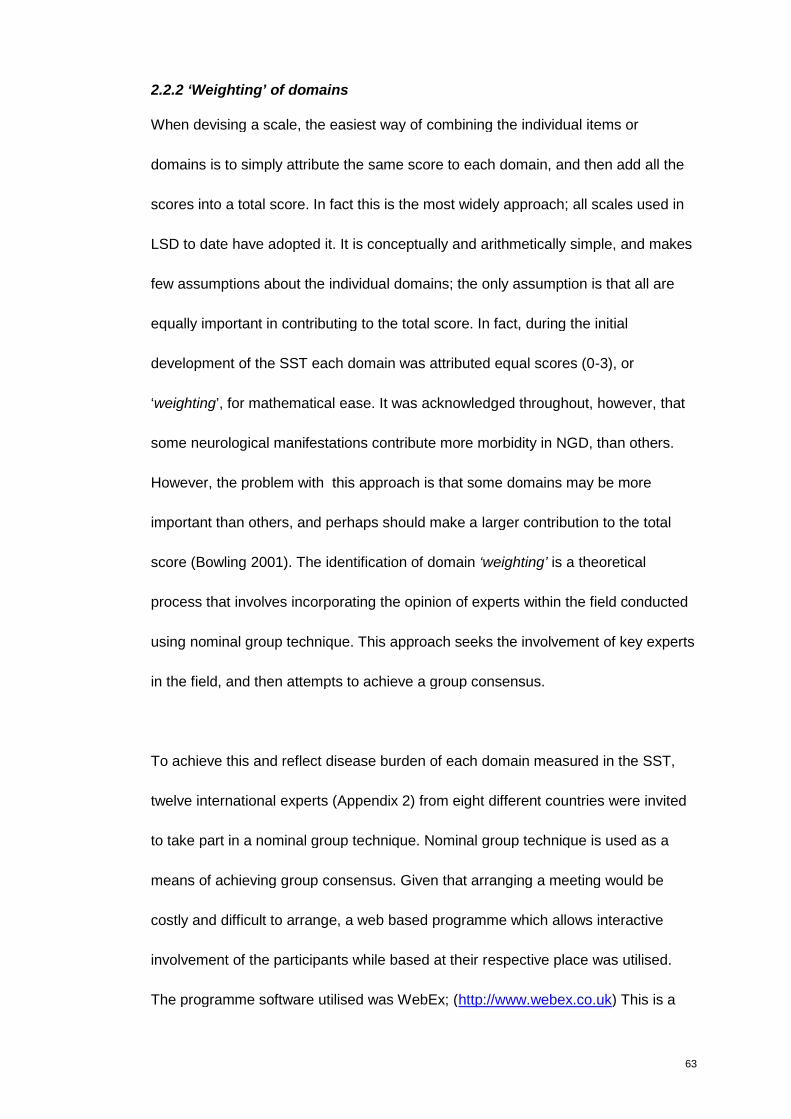
63
2.2.2 ‘Weighting’ of domains
When devising a scale, the easiest way of combining the individual items or
domains is to simply attribute the same score to each domain, and then add all the
scores into a total score. In fact this is the most widely approach; all scales used in
LSD to date have adopted it. It is conceptually and arithmetically simple, and makes
few assumptions about the individual domains; the only assumption is that all are
equally important in contributing to the total score. In fact, during the initial
development of the SST each domain was attributed equal scores (0-3), or
‘weighting’, for mathematical ease. It was acknowledged throughout, however, that
some neurological manifestations contribute more morbidity in NGD, than others.
However, the problem with this approach is that some domains may be more
important than others, and perhaps should make a larger contribution to the total
score (Bowling 2001). The identification of domain ‘weighting’ is a theoretical
process that involves incorporating the opinion of experts within the field conducted
using nominal group technique. This approach seeks the involvement of key experts
in the field, and then attempts to achieve a group consensus.
To achieve this and reflect disease burden of each domain measured in the SST,
twelve international experts (Appendix 2) from eight different countries were invited
to take part in a nominal group technique. Nominal group technique is used as a
means of achieving group consensus. Given that arranging a meeting would be
costly and difficult to arrange, a web based programme which allows interactive
involvement of the participants while based at their respective place was utilised.
The programme software utilised was WebEx; (http://www.webex.co.uk) This is a
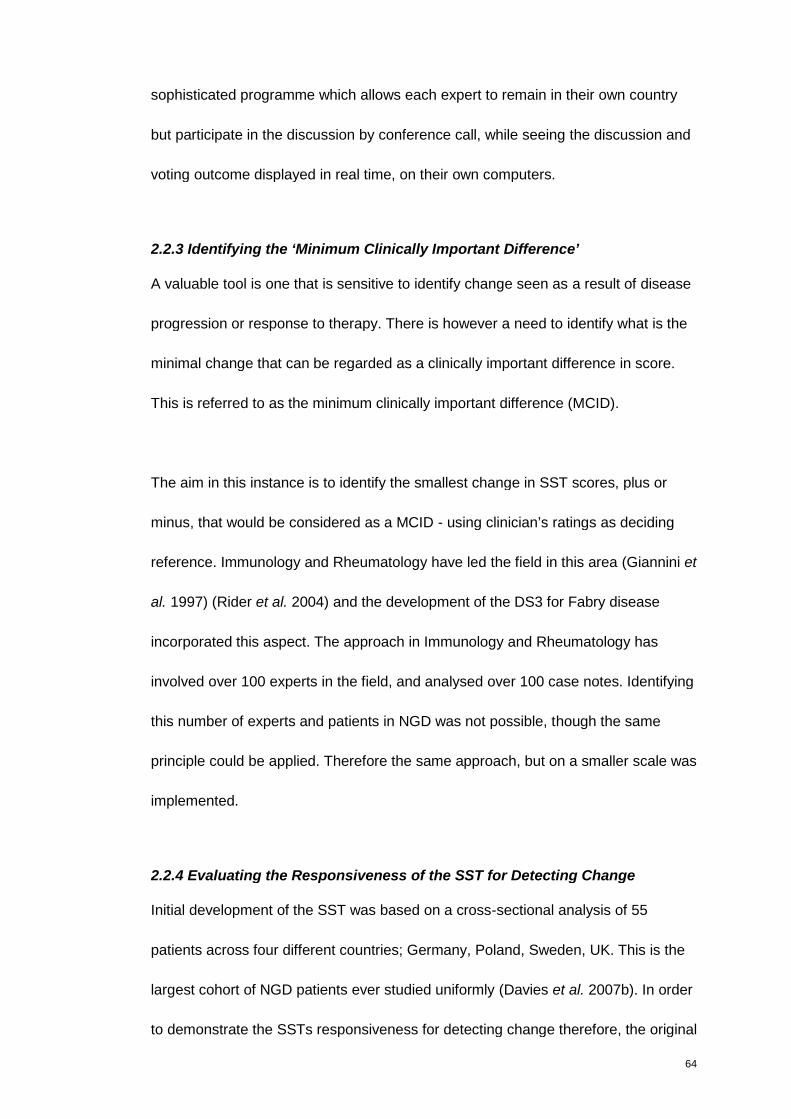
64
sophisticated programme which allows each expert to remain in their own country
but participate in the discussion by conference call, while seeing the discussion and
voting outcome displayed in real time, on their own computers.
2.2.3 Identifying the ‘Minimum Clinically Important Difference’
A valuable tool is one that is sensitive to identify change seen as a result of disease
progression or response to therapy. There is however a need to identify what is the
minimal change that can be regarded as a clinically important difference in score.
This is referred to as the minimum clinically important difference (MCID).
The aim in this instance is to identify the smallest change in SST scores, plus or
minus, that would be considered as a MCID - using clinician’s ratings as deciding
reference. Immunology and Rheumatology have led the field in this area (Giannini et
al. 1997) (Rider et al. 2004) and the development of the DS3 for Fabry disease
incorporated this aspect. The approach in Immunology and Rheumatology has
involved over 100 experts in the field, and analysed over 100 case notes. Identifying
this number of experts and patients in NGD was not possible, though the same
principle could be applied. Therefore the same approach, but on a smaller scale was
implemented.
2.2.4 Evaluating the Responsiveness of the SST for Detecting Change
Initial development of the SST was based on a cross-sectional analysis of 55
patients across four different countries; Germany, Poland, Sweden, UK. This is the
largest cohort of NGD patients ever studied uniformly (Davies et al. 2007b). In order
to demonstrate the SSTs responsiveness for detecting change therefore, the original
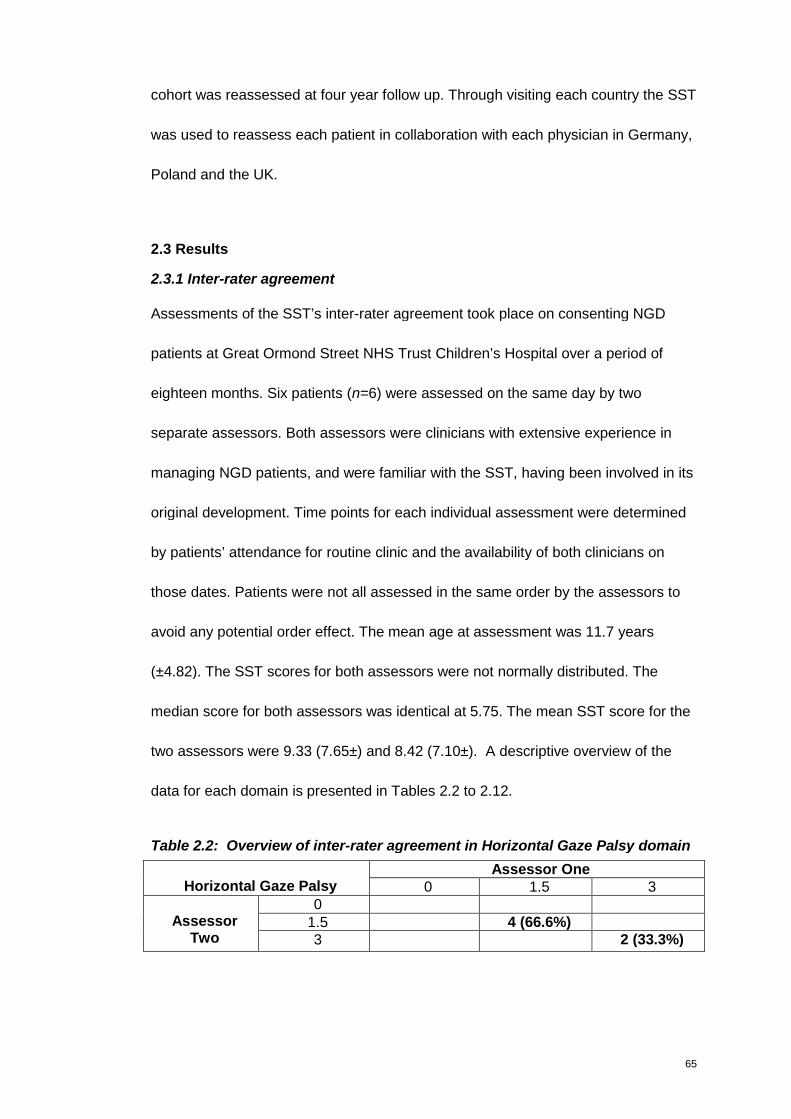
65
cohort was reassessed at four year follow up. Through visiting each country the SST
was used to reassess each patient in collaboration with each physician in Germany,
Poland and the UK.
2.3 Results
2.3.1 Inter-rater agreement
Assessments of the SST’s inter-rater agreement took place on consenting NGD
patients at Great Ormond Street NHS Trust Children’s Hospital over a period of
eighteen months. Six patients (n=6) were assessed on the same day by two
separate assessors. Both assessors were clinicians with extensive experience in
managing NGD patients, and were familiar with the SST, having been involved in its
original development. Time points for each individual assessment were determined
by patients’ attendance for routine clinic and the availability of both clinicians on
those dates. Patients were not all assessed in the same order by the assessors to
avoid any potential order effect. The mean age at assessment was 11.7 years
(±4.82). The SST scores for both assessors were not normally distributed. The
median score for both assessors was identical at 5.75. The mean SST score for the
two assessors were 9.33 (7.65±) and 8.42 (7.10±). A descriptive overview of the
data for each domain is presented in Tables 2.2 to 2.12.
Table 2.2: Overview of inter-rater agreement in Horizontal Gaze Palsy domain
Assessor OneHorizontal Gaze Palsy 0 1.5 3
01.5 4 (66.6%)Assessor
Two 3 2 (33.3%)
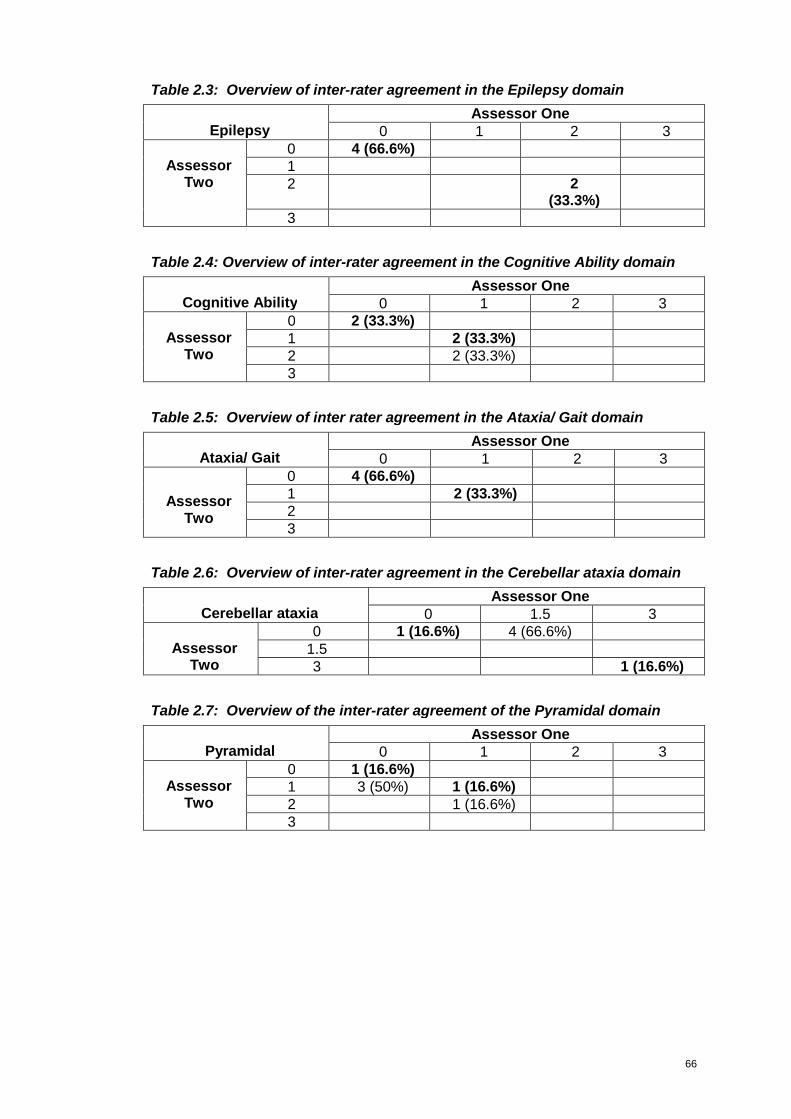
66
Table 2.3: Overview of inter-rater agreement in the Epilepsy domain
Assessor OneEpilepsy 0 1 2 3
0 4 (66.6%)12 2
(33.3%)
AssessorTwo
3
Table 2.4: Overview of inter-rater agreement in the Cognitive Ability domain
Assessor OneCognitive Ability 0 1 2 3
0 2 (33.3%)1 2 (33.3%)2 2 (33.3%)
AssessorTwo
3
Table 2.5: Overview of inter rater agreement in the Ataxia/ Gait domain
Assessor OneAtaxia/ Gait 0 1 2 3
0 4 (66.6%)1 2 (33.3%)2
AssessorTwo
3
Table 2.6: Overview of inter-rater agreement in the Cerebellar ataxia domain
Assessor OneCerebellar ataxia 0 1.5 3
0 1 (16.6%) 4 (66.6%)1.5Assessor
Two 3 1 (16.6%)
Table 2.7: Overview of the inter-rater agreement of the Pyramidal domain
Assessor OnePyramidal 0 1 2 3
0 1 (16.6%)1 3 (50%) 1 (16.6%)2 1 (16.6%)
AssessorTwo
3

67
Table 2.8: Overview of inter-rater agreement in the Extrapyramidal domain
Assessor OneExtrapyramidal 0 1 2 3
0 4 (66.6%) 1 (16.6%)1 1 (16.6%)2
AssessorTwo
3
Table 2.9: Overview of inter-rater agreement in the Swallowing domain
Assessor OneSwallowing 0 1 2 3
0 5 (83.3%) *1 1 (16.6%)2
AssessorTwo
3
Table 2.10: Overview of inter-rater agreement in the Speech domain
Assessor OneSpeech 0 1 2 3
0 5 (83.3%)1 1 (16.6%)2
Assessor
Two
3
Table 2.11: Overview of inter-rater agreement in the Ophthalmology domain
Assessor OneOphthalmology 0 1.5 3
0 1 (16.6%) 2 (33.3%)1.5 1 (16.6%) 2 (33.3%)
Assessor
Two3
Table 2.12: Overview of inter-rater agreement in the Kyphosis domain
Assessor OneKyphosis 0 1 2 3
0 1 (16.6%)1 2 (33.3%) 1 (16.6%) 1
(16.6%)2 1 (16.6%)
AssessorTwo
3
A descriptive analysis of this data indicates that the assessors were in 100%
agreement for four of the eleven domains and in 83% agreement for another four.
Poor agreement was noted in the Pyramidal, Ophthalmology and Kyphosis domains.
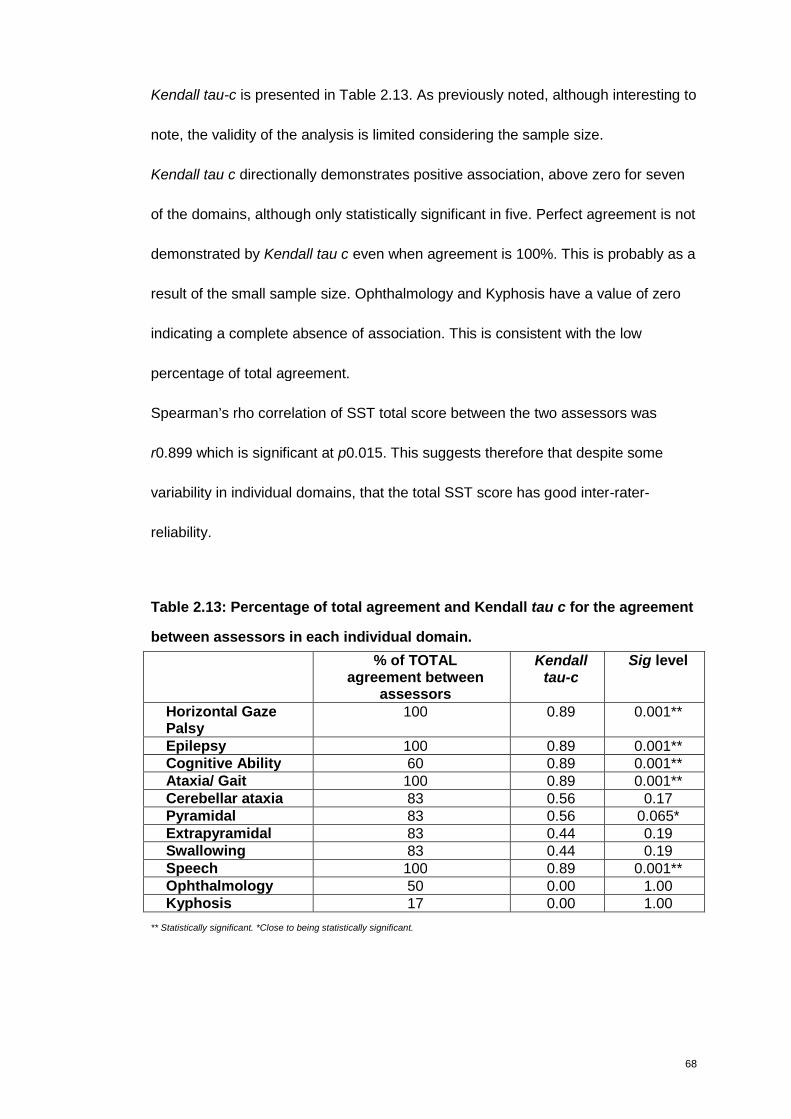
68
Kendall tau-c is presented in Table 2.13. As previously noted, although interesting to
note, the validity of the analysis is limited considering the sample size.
Kendall tau c directionally demonstrates positive association, above zero for seven
of the domains, although only statistically significant in five. Perfect agreement is not
demonstrated by Kendall tau c even when agreement is 100%. This is probably as a
result of the small sample size. Ophthalmology and Kyphosis have a value of zero
indicating a complete absence of association. This is consistent with the low
percentage of total agreement.
Spearman’s rho correlation of SST total score between the two assessors was
r0.899 which is significant at p0.015. This suggests therefore that despite some
variability in individual domains, that the total SST score has good inter-rater-
reliability.
Table 2.13: Percentage of total agreement and Kendall tau c for the agreement
between assessors in each individual domain.
% of TOTALagreement between
assessors
Kendalltau-c
Sig level
Horizontal GazePalsy
100 0.89 0.001**
Epilepsy 100 0.89 0.001**Cognitive Ability 60 0.89 0.001**Ataxia/ Gait 100 0.89 0.001**Cerebellar ataxia 83 0.56 0.17Pyramidal 83 0.56 0.065*Extrapyramidal 83 0.44 0.19Swallowing 83 0.44 0.19Speech 100 0.89 0.001**Ophthalmology 50 0.00 1.00Kyphosis 17 0.00 1.00
** Statistically significant. *Close to being statistically significant.
69
2.3.2 Intra-rater agreement
To evaluate intra-rater agreement nine patients (3 boys, 6 girls) were assessed
sequentially, by the same assessor, between 3 and 6 times. Mean age at first
assessment was 10.6 years (±4.89) while mean age at last assessment was 11.1
years (±4.76). Time points for each individual assessment were determined by
patients’ attendance for routine clinic. Assessments ranged from 3 to 7 months
(mean 4.55 ±1.43), with the total duration of follow up (mean ±SD) being 12.8
months (±4.7).
An interval of 3 months between assessments had been thought to be short enough
to avoid potential disease progression, yet sufficiently long enough to avoid recall
bias by the assessor. However it became apparent that the cohort naturally divided
into two groups, one that progressed even within a short time and one that remained
mostly clinically stable. The group that remained constant, with no or minimal
change seen were the L444P homozygote. These are patients 2, 3, 4, 5 and 6 as
seen in Figure 2.1. The heterozygote group demonstrate progression with an
increase in SST score.

70
Sequential SST scores
0
3
6
9
12
15
18
21
24
27
30
33
3 5 7 9 11 13 15 17
Age (years)
SS
TS
co
rePatient 1
Patient 2
Patient 3
Patient 4
Patient 5
Patient 6
Patient 7
Patient 8
Patient 9
L444P/L444P
Figure 2.1: Severity Score Tool sequential data (n=9)
The overall heterozygosity within such a small cohort made inferential statistical
analysis unfeasible. Descriptive observations, however, suggest that intra-rater
reliability was evident in the stable patients with the SST score remaining consistent
at 1.5 for three patients and consistent scores reported for four other patients on at
least two of the occasions (Between time points 1 and 2 for patients 7, 8 and 9, and
between time points 2 and 3 for patient 1).
These findings are encouraging, in that they not only demonstrate intra-rater
agreement, but also the sensitivity of the SST in capturing and quantifying disease
progression.
2.3.3 ‘Weighting’ of domains
Four experts from three countries were able to participate in the nominal group
discussion for ‘weighting’ the domains. Prior to the WebEx meeting a power point
71
presentation was prepared detailing the background of the SST and the
development to date. All experts were sent a presentation prior to the WebEx
meeting. This was also briefly discussed at the beginning of the WebEx meeting.
The meeting was chaired by an independent person (E. H. Giannini) who is a
methodologist-biostatistician with experience in instrument development for
Rheumatology and Fabry disease.
Firstly, the experts were asked to rank all eleven domains according to the amount
of morbidity each contributes to NGD severity as perceived by themselves. A Likert-
like scale, which is a psychometric scale used to specify level of agreement, was
used for each domain, the range of which was selected by each individual
participant. This provided an external criterion for the ratings of the clinicians’
perceptions. Clinicians were then asked to rate on a scale of 0 to 10 where each
level of domain would be placed in terms of its impact on disease - indicating the
overall disease burden of that domain (e.g Cognitive Ability). Based upon these
rankings the experts assigned the range of scores, representing the relative weights,
for the clinical measurements within each domain. On both occasions participant’s
first votes were discussed in a ‘round robin’ type discussion – giving each expert an
opportunity to explain their chosen score. Following this discussion, a second vote
took place – providing the final results used for analysis. Results were calculated
and made visible for all to see at the time of the WebEx meeting.
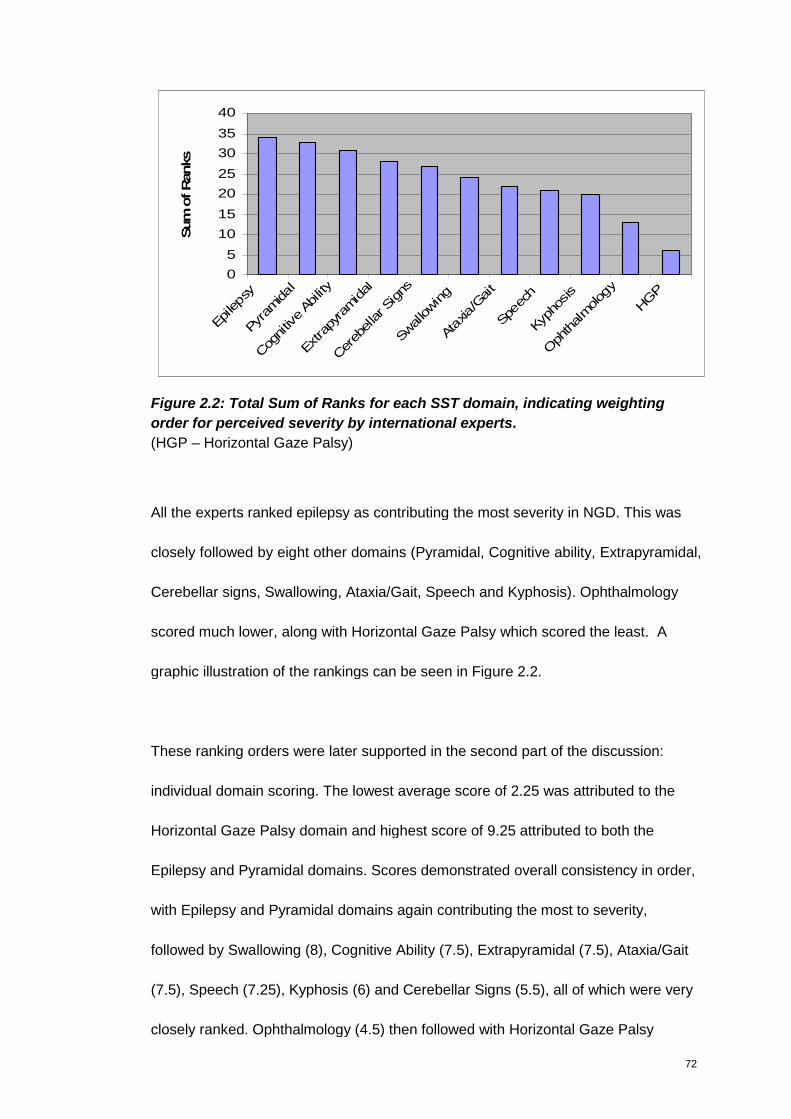
72
0
5
10
15
20
25
30
35
40
Epileps
y
Pyr
amidal
Cog
nitiv
eAb
ility
Extra
pyra
midal
Cer
ebellar S
igns
Swallowing
Ata
xia/G
ait
Spe
ech
Kyph
osis
Oph
thalmolog
y
HGP
Sum
ofR
anks
Figure 2.2: Total Sum of Ranks for each SST domain, indicating weighting
order for perceived severity by international experts.
(HGP – Horizontal Gaze Palsy)
All the experts ranked epilepsy as contributing the most severity in NGD. This was
closely followed by eight other domains (Pyramidal, Cognitive ability, Extrapyramidal,
Cerebellar signs, Swallowing, Ataxia/Gait, Speech and Kyphosis). Ophthalmology
scored much lower, along with Horizontal Gaze Palsy which scored the least. A
graphic illustration of the rankings can be seen in Figure 2.2.
These ranking orders were later supported in the second part of the discussion:
individual domain scoring. The lowest average score of 2.25 was attributed to the
Horizontal Gaze Palsy domain and highest score of 9.25 attributed to both the
Epilepsy and Pyramidal domains. Scores demonstrated overall consistency in order,
with Epilepsy and Pyramidal domains again contributing the most to severity,
followed by Swallowing (8), Cognitive Ability (7.5), Extrapyramidal (7.5), Ataxia/Gait
(7.5), Speech (7.25), Kyphosis (6) and Cerebellar Signs (5.5), all of which were very
closely ranked. Ophthalmology (4.5) then followed with Horizontal Gaze Palsy
73
scoring the least. Only Cerebellar Signs and Swallowing domains changed their
ranking in the opinions of the experts when measured with two different
methodologies.
Six domains, which were very closely ranked by the experts; Cognitive Development,
Ataxia/Gait, Extrapyramidal, Swallowing, Speech, Kyphosis maintained the same 0-
3 score. The two highest ranked domains, Epilepsy and Pyramidal were attributed
higher scores of 0-5. Given the low ranking for Horizontal Gaze palsy (HGP),
Cerebellar Signs and Ophthalmology they were attributed lower scores of 0-1, 0-2
and 0-2 respectively. Based on these results the domains that scored consistently
higher by clinicians were allocated a higher ‘weight’ in each domain. The score
allocated to each sub-section within each domain was not always linear, but based
upon the rankings that the experts assigned for the clinical measurements within
each domain. This was calculated for each domain based on the overall percentage
and the original total severity score kept the same. This equates to a total severity
score of 33, the original total score.
It is interesting to note that HGP was attributed the lowest score considering that the
vertical component of the horizontal saccade was the chosen primary endpoint for
the clinical trial of SRT in NGD. This choice was probably based on the fact that this
clinical manifestation is ubiquitous in NGD patients and measurable. As previously
stated, the selection of one clinical parameter which is present in all patients is
difficult to identify in such a heterogeneous disorder as NGD. Given the high
74
prevalence of ataxia and the severity attributed to it during the weighting exercise,
ataxia/ ataxic gait appears to be a promising option.
2.3.4 Identification of the Minimum Clinically Important Difference (MCID)
To identify the MCID, a second nominal group approach was organised, again with
the aim of using WebEx. All experts were sent the clinical presentation of NGD
patients as defined with SST scores prior to the WebEx. Due to technical difficulty
however, it was not possible to use WebEx on the day. The meeting proceeded on a
teleconference type basis, with the experts looking at the slides as previously sent to
them. Scores were calculated manually. It was considered important to incorporate
the opinion of as many experts as possible, therefore participants unable to join the
meeting were asked to answer the questions in their own time and their opinions
were subsequently added to the results for analysis. A total of five experts from five
different countries participated, three on the day of the meeting and two
subsequently.
SST scores generated from all nine consenting patients were presented to the
experts (as previously presented in Figure 2.1). In order to reflect the full spectrum
of the SST scale, the full range of neurological presentation was presented.
Justification for the selection of the final four patients presented for discussion and
scoring was based on the clinical phenotypes and the clinical changes seen using
the SST. The patients selected for discussion not only varied in terms of baseline
SST score, but also in terms of rate of progression.
75
The change in clinical presentation and the corresponding SST score over three to
four different time points were presented for each patient. The time period between
assessments ranged from 3-14 months, with the total follow up for all four patients
ranging from 15-20 months.
The issue of whether the interval between assessments should be constant (e.g 12
months) for all patients was considered. This would allow experts to score each
patient directly against each other in terms of level of severity and amount of
progression. However it was felt that a change in SST score observed in a three
month period may be viewed as a more important clinical difference compared to
the same disease progression observed in a twelve month or two year period, as
this would indicate a more rapid decline, and therefore more likely to be an
important clinical difference. Therefore no fixed interval was chosen therefore.
The four patients selected for presentation were two boys and two girls, all with
different genotypes: L444P/L444P, L279P/G243V, K198T/L444P, L444P/E233D.
Mean age at first assessment was 7.5 years (±3.2) and mean age at last
assessment was 10.2 years (±2.2). the SST scores ranged from 4 to 24 (mean SST
11.3 ±6.6) with changes in clinical score ranging from 0.5 to 9. All changes
demonstrated disease progression (score increase) apart from one with a 0.5
improvement of SST score.
These patients were selected given their change in clinical presentation. The
remaining five patients were not presented as their clinical state remained stable,

76
and their SST score remained constant over the time period of assessment. These
five stable patients were L444P homozygote, with mild disease.
Participants were asked to vote on whether each SST score was considered to be
‘mild’, ‘moderate’ or ‘severe’. Participants were then asked to vote on whether, in
their clinical opinion the change in the SST score could be regarded as “clinically
meaningful” – “yes” or “no”. During the WebEx each participant were asked to
justify or rationalise their answer, especially if it differed from the other participants.
After discussion participants were given the opportunity to score again if they
wanted to, however this did not happen. Answers received after the WebEx were
incorporated for analysis, as seen in Table 2.14. Overall there was agreement
amongst the experts on nearly all of the questions. The distribution of responses in
the three categories (19=mild; 25=moderate, 22=severe) indicates that there was
good coverage of the known clinical spectrum of NGD in the four patients discussed.
It became apparent during the WebEx discussion (subsequently supported by the
follow up answers) however that the same score seen in different patients did not
consistently fall within the same category of ‘mild’, ‘moderate’ or ‘severe’. The
clearest example of this can be seen with Patient 3 and 4. Patient 3, an
L444P/L444P female assessed at 11.2 years and 12.6 years, had SST score
between 4 and 7. Patient 4, an L444P/E233D, who was 8.4 years at first
assessment and 9.9 years at follow up, had SST scores between 6.5 and nine.
Despite the overlapping of scores, Patient 3 was consistently scored as a ‘mild’ case
while Patient 4 consistently scored as ‘moderate’.
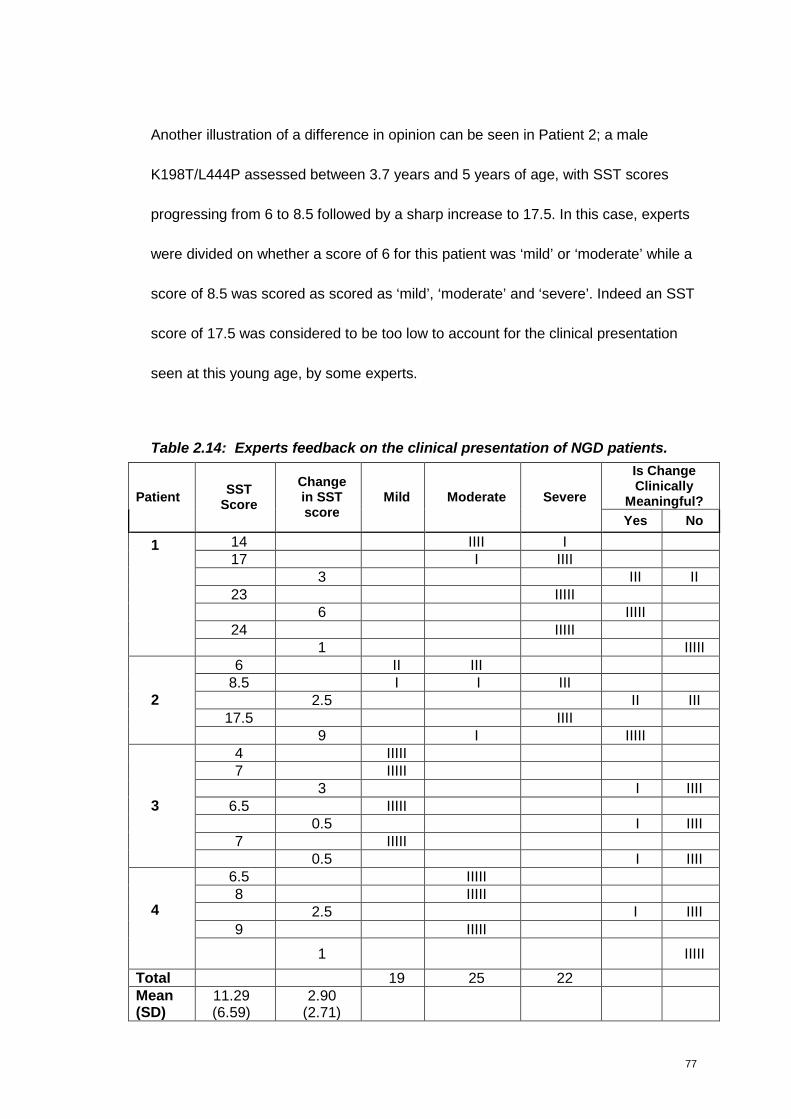
77
Another illustration of a difference in opinion can be seen in Patient 2; a male
K198T/L444P assessed between 3.7 years and 5 years of age, with SST scores
progressing from 6 to 8.5 followed by a sharp increase to 17.5. In this case, experts
were divided on whether a score of 6 for this patient was ‘mild’ or ‘moderate’ while a
score of 8.5 was scored as scored as ‘mild’, ‘moderate’ and ‘severe’. Indeed an SST
score of 17.5 was considered to be too low to account for the clinical presentation
seen at this young age, by some experts.
Table 2.14: Experts feedback on the clinical presentation of NGD patients.
Is ChangeClinically
Meaningful?PatientSST
Score
Changein SSTscore
Mild Moderate Severe
Yes No
14 IIII I17 I IIII
3 III II23 IIIII
6 IIIII24 IIIII
1
1 IIIII6 II III
8.5 I I III2.5 II III
17.5 IIII2
9 I IIIII4 IIIII7 IIIII
3 I IIII6.5 IIIII
0.5 I IIII7 IIIII
3
0.5 I IIII6.5 IIIII8 IIIII
2.5 I IIII9 IIIII
4
1 IIIII
Total 19 25 22Mean(SD)
11.29(6.59)
2.90(2.71)

78
On discussion, and based on the comments received, the discrepancy in
categorising similar scores arose from the significant differences in the child’s age at
assessment, not the interval between assessment. That is, the severity of a patient’s
disease was as much related to age as to individual domains. Age at assessment
had not previously been factored into the analytical process. It was agreed by all
that it needed to be addressed in order to ensure that the SST is as valuable as it
possibly could.
To account for impact of age on disease severity a twelfth domain of ‘Age 0-5 years
=3. 6-10 years =2. 11-15 years =1. 16 years and over =0’ was considered. However
it was realised that this would not add to the identification of the severe patients. It
was deemed necessary therefore to add ‘Age at onset of an event’ as a factor, and
given the impact of epilepsy ‘Age at first seizure’ was decided upon as a new
domain to the SST. Based on the cohort studied none of the patients assessed
presented with seizures before the diagnosis of NGD was made. It was therefore
considered that an accurate scoring could be made in the created categories,
without having to rely on patient notes and/or patient/ carer memory. The twelfth
domain was categorised in consultation with the experts and the ‘Age at Onset of
Seizure’ categorised into brackets as follows; 0-5 years =3. 6-10 years =2. 11-15
years =1. 16 years and over or seizure free =0. Seizures occurring for the first time
in adulthood are not therefore given a score to attribute severity.
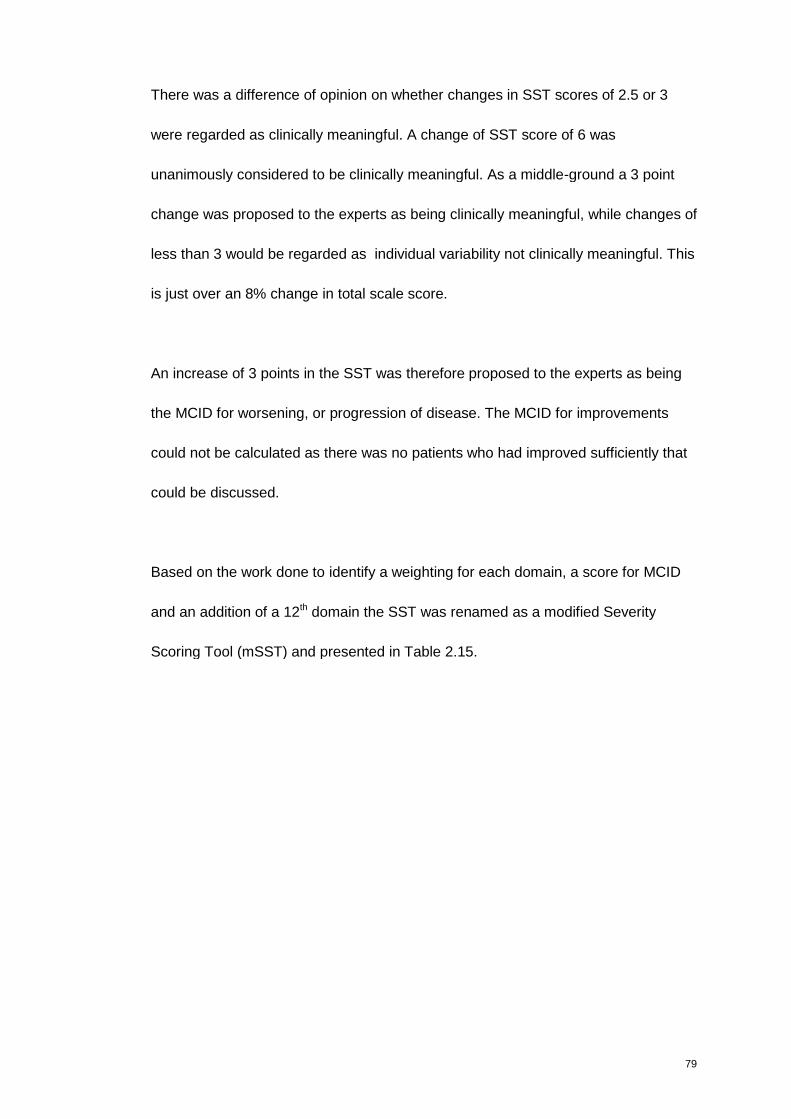
79
There was a difference of opinion on whether changes in SST scores of 2.5 or 3
were regarded as clinically meaningful. A change of SST score of 6 was
unanimously considered to be clinically meaningful. As a middle-ground a 3 point
change was proposed to the experts as being clinically meaningful, while changes of
less than 3 would be regarded as individual variability not clinically meaningful. This
is just over an 8% change in total scale score.
An increase of 3 points in the SST was therefore proposed to the experts as being
the MCID for worsening, or progression of disease. The MCID for improvements
could not be calculated as there was no patients who had improved sufficiently that
could be discussed.
Based on the work done to identify a weighting for each domain, a score for MCID
and an addition of a 12th domain the SST was renamed as a modified Severity
Scoring Tool (mSST) and presented in Table 2.15.
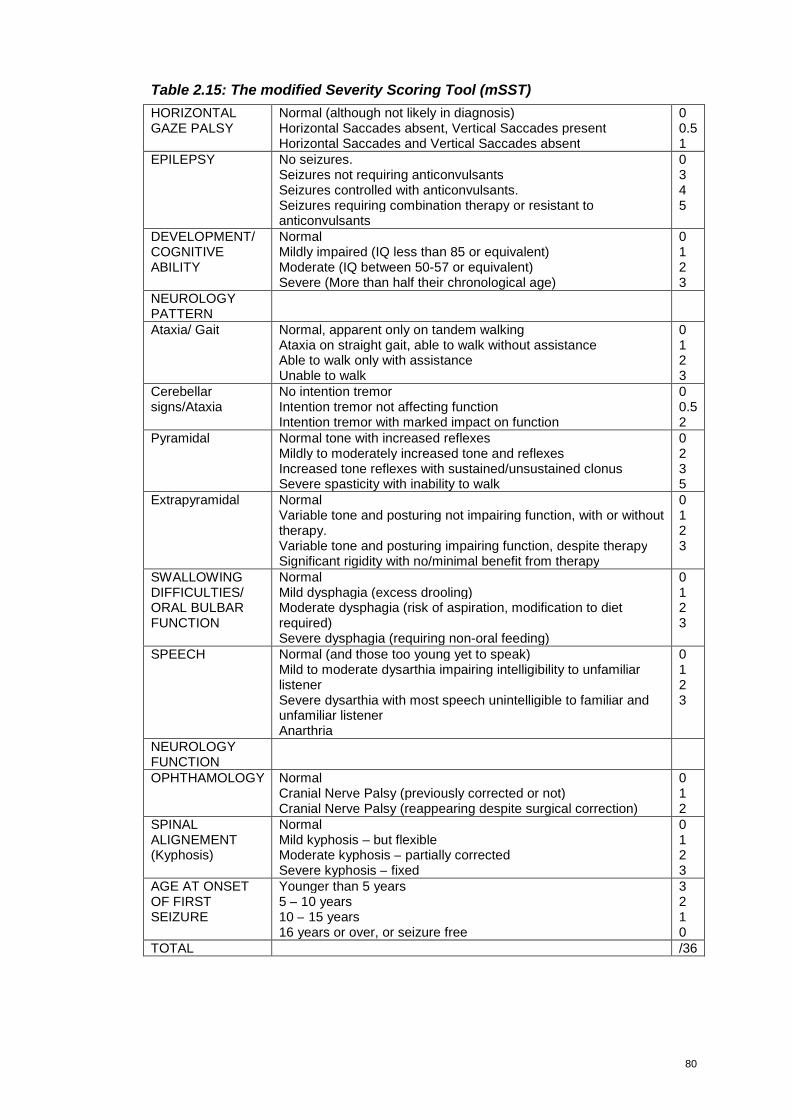
80
Table 2.15: The modified Severity Scoring Tool (mSST)
HORIZONTALGAZE PALSY
Normal (although not likely in diagnosis)Horizontal Saccades absent, Vertical Saccades presentHorizontal Saccades and Vertical Saccades absent
00.51
EPILEPSY No seizures.Seizures not requiring anticonvulsantsSeizures controlled with anticonvulsants.Seizures requiring combination therapy or resistant toanticonvulsants
0345
DEVELOPMENT/COGNITIVEABILITY
NormalMildly impaired (IQ less than 85 or equivalent)Moderate (IQ between 50-57 or equivalent)Severe (More than half their chronological age)
0123
NEUROLOGYPATTERNAtaxia/ Gait Normal, apparent only on tandem walking
Ataxia on straight gait, able to walk without assistanceAble to walk only with assistanceUnable to walk
0123
Cerebellarsigns/Ataxia
No intention tremorIntention tremor not affecting functionIntention tremor with marked impact on function
00.52
Pyramidal Normal tone with increased reflexesMildly to moderately increased tone and reflexesIncreased tone reflexes with sustained/unsustained clonusSevere spasticity with inability to walk
0235
Extrapyramidal NormalVariable tone and posturing not impairing function, with or withouttherapy.Variable tone and posturing impairing function, despite therapySignificant rigidity with no/minimal benefit from therapy
0123
SWALLOWINGDIFFICULTIES/ORAL BULBARFUNCTION
NormalMild dysphagia (excess drooling)Moderate dysphagia (risk of aspiration, modification to dietrequired)Severe dysphagia (requiring non-oral feeding)
0123
SPEECH Normal (and those too young yet to speak)Mild to moderate dysarthia impairing intelligibility to unfamiliarlistenerSevere dysarthia with most speech unintelligible to familiar andunfamiliar listenerAnarthria
0123
NEUROLOGYFUNCTIONOPHTHAMOLOGY Normal
Cranial Nerve Palsy (previously corrected or not)Cranial Nerve Palsy (reappearing despite surgical correction)
012
SPINALALIGNEMENT(Kyphosis)
NormalMild kyphosis – but flexibleModerate kyphosis – partially correctedSevere kyphosis – fixed
0123
AGE AT ONSETOF FIRSTSEIZURE
Younger than 5 years5 – 10 years10 – 15 years16 years or over, or seizure free
3210
TOTAL /36
81
2.3.5 Responsiveness for Detecting Change
During the intra-rater agreement analysis, it became apparent that the SST was
sensitive enough to capture change. However analysis of this was required on a
much larger scale to truly demonstrate this, and importantly to incorporate the
modifications made to the SST. A separate piece of work was therefore conducted
utilising the mSST.
Thirty nine (n=39) NGD patients from three European countries (Germany, Poland,
UK) were assessed sequentially using the mSST. These were the same patients
assessed in the original work performed during initial development of the SST. The
Swedish cohort (n=12) could not be included in this review as the original managing
physician had since retired and care of the patients had been dispersed. Out of the
remaining 43 patients assessed in the original 2007 review, two patients had died
and two patients had been lost to follow up. The time interval between assessments
was 3.9 years (±0.55). The mean age at follow up was 18.5 years (±9.9). As per
original publication (Davies et al. 2007a), the British cohort was the youngest while
the Polish cohort was the eldest. 69.2% of the cohort was L444P homozygote,
which is only slightly lower than that previously reported, and an indication of the
missing Swedish cohort. Genotypes were divided into four categories. These
categories were based on the original publication (Davies et al. 2007b), in order to
allow for consistency in comparisons. Group 1 were all L444P homozygote. Group
2 had one allele of L444P with another allele, as follows F213I/L444P,
L444P/G202R, L444P/E326K and L444P/E233D. Group 3 all had a D409H and
L444P allele. Group 4 included all the remaining genotypes, as follows:
82
L279P/G243V, R433S/R433S, D409H/G202R, 1599AG/1603T. Demographics can
be seen in Table 2.16
Table 2.16: Demographic data of European NGD cohort assessed
Poland Germany UK TotalNumber 18 10 11 39Mean Age (years)at baseline
19.2(±11.1)
13.8(±8.8)
9.7(±4.35)
15.1(±9.8)
Mean Age (years)at follow up
23.2(±11.2)
17.9(±8.8)
13.1(±4.6)
18.5(±9.9)
Median Age(years) at baseline
19.6 11.9 9.3 11.9
Median Age(years) at follow up
15.7 16.0 13.3 16.0
Genotype Group 1:L444P/ L444P
14 5 8 27(69.2%)
Genotype Group 2:L444P and other
1 1 2 4 (10.2%)
Genotype Group 3:L444P and D409H
2 2 0 4 (10.2%)
Genotype Group 4:All OtherGenotypes
1 2 1 4 (10.2%)
Total splenectomy 6 2 0 8 (20.5%)
In addition to mSST score, Chitoriosidase levels and current ERT dose were
collated where possible. The Genotype and spleen status of each patient was
already available from the original study. Genotype and whether the patient has had
a total splenectomy have been reported to be correlate with disease severity, and
therefore important to be considered for analysis. This was to offer a complete
overview of the patients assessed, and allow for exploratory analysis of any patterns
seen across the cohort.
Mean ERT dose was significantly lower at the time of follow up, and a reflection of
the revised guidelines which states that given the lack of evidence, high dose ERT is
no longer justified (Vellodi et al. 2009) and current worldwide shortage of Cerezyme.
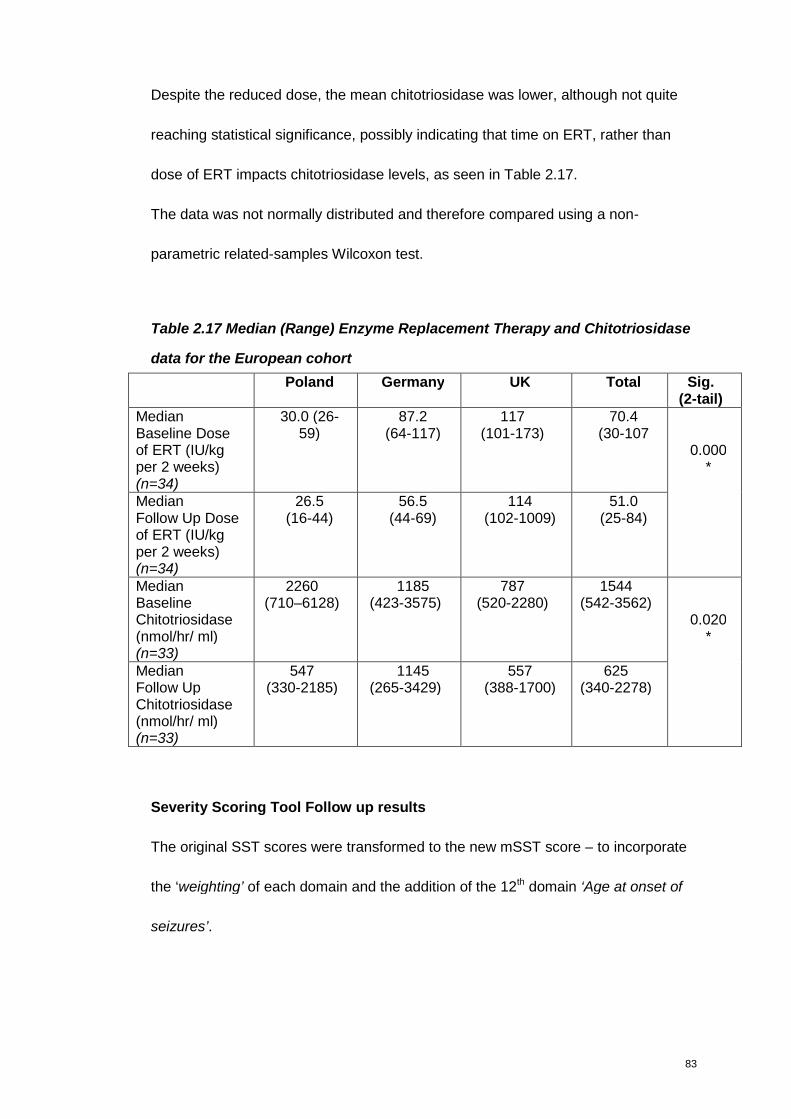
83
Despite the reduced dose, the mean chitotriosidase was lower, although not quite
reaching statistical significance, possibly indicating that time on ERT, rather than
dose of ERT impacts chitotriosidase levels, as seen in Table 2.17.
The data was not normally distributed and therefore compared using a non-
parametric related-samples Wilcoxon test.
Table 2.17 Median (Range) Enzyme Replacement Therapy and Chitotriosidase
data for the European cohort
Poland Germany UK Total Sig.(2-tail)
MedianBaseline Doseof ERT (IU/kgper 2 weeks)(n=34)
30.0 (26-59)
87.2(64-117)
117(101-173)
70.4(30-107
MedianFollow Up Doseof ERT (IU/kgper 2 weeks)(n=34)
26.5(16-44)
56.5(44-69)
114(102-1009)
51.0(25-84)
0.000*
MedianBaselineChitotriosidase(nmol/hr/ ml)(n=33)
2260(710–6128)
1185(423-3575)
787(520-2280)
1544(542-3562)
MedianFollow UpChitotriosidase(nmol/hr/ ml)(n=33)
547(330-2185)
1145(265-3429)
557(388-1700)
625(340-2278)
0.020*
Severity Scoring Tool Follow up results
The original SST scores were transformed to the new mSST score – to incorporate
the ‘weighting’ of each domain and the addition of the 12th domain ‘Age at onset of
seizures’.
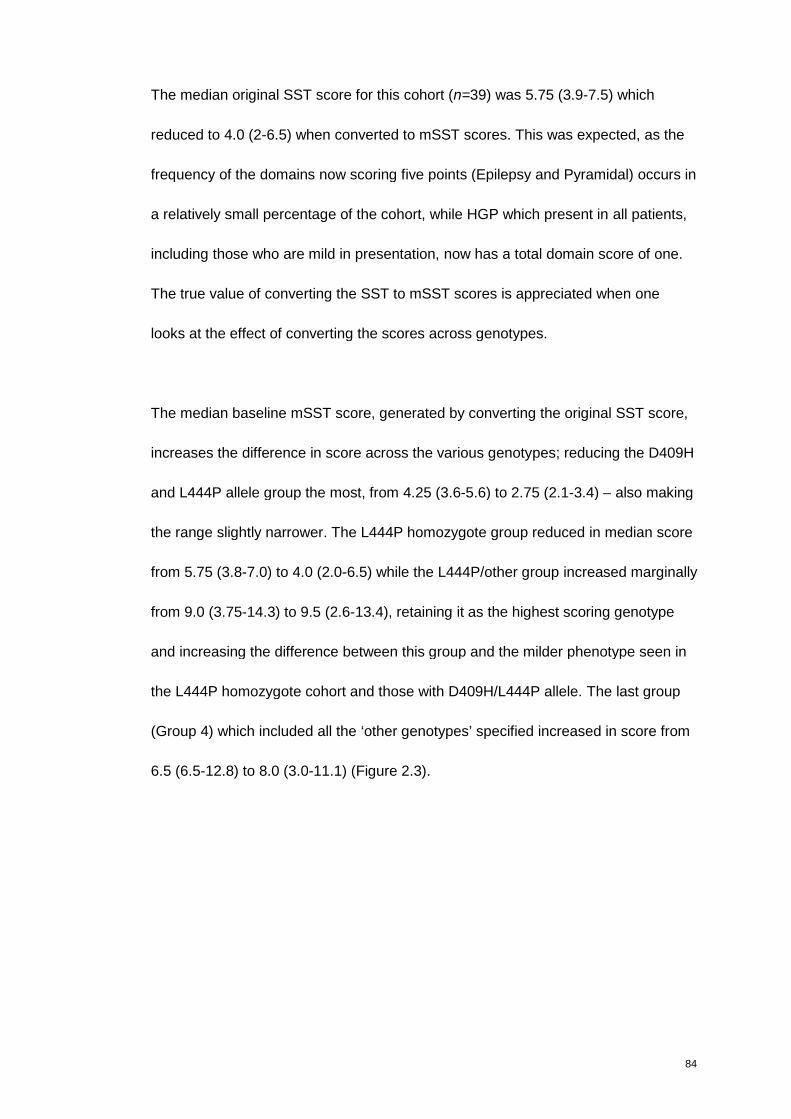
84
The median original SST score for this cohort (n=39) was 5.75 (3.9-7.5) which
reduced to 4.0 (2-6.5) when converted to mSST scores. This was expected, as the
frequency of the domains now scoring five points (Epilepsy and Pyramidal) occurs in
a relatively small percentage of the cohort, while HGP which present in all patients,
including those who are mild in presentation, now has a total domain score of one.
The true value of converting the SST to mSST scores is appreciated when one
looks at the effect of converting the scores across genotypes.
The median baseline mSST score, generated by converting the original SST score,
increases the difference in score across the various genotypes; reducing the D409H
and L444P allele group the most, from 4.25 (3.6-5.6) to 2.75 (2.1-3.4) – also making
the range slightly narrower. The L444P homozygote group reduced in median score
from 5.75 (3.8-7.0) to 4.0 (2.0-6.5) while the L444P/other group increased marginally
from 9.0 (3.75-14.3) to 9.5 (2.6-13.4), retaining it as the highest scoring genotype
and increasing the difference between this group and the milder phenotype seen in
the L444P homozygote cohort and those with D409H/L444P allele. The last group
(Group 4) which included all the ‘other genotypes’ specified increased in score from
6.5 (6.5-12.8) to 8.0 (3.0-11.1) (Figure 2.3).
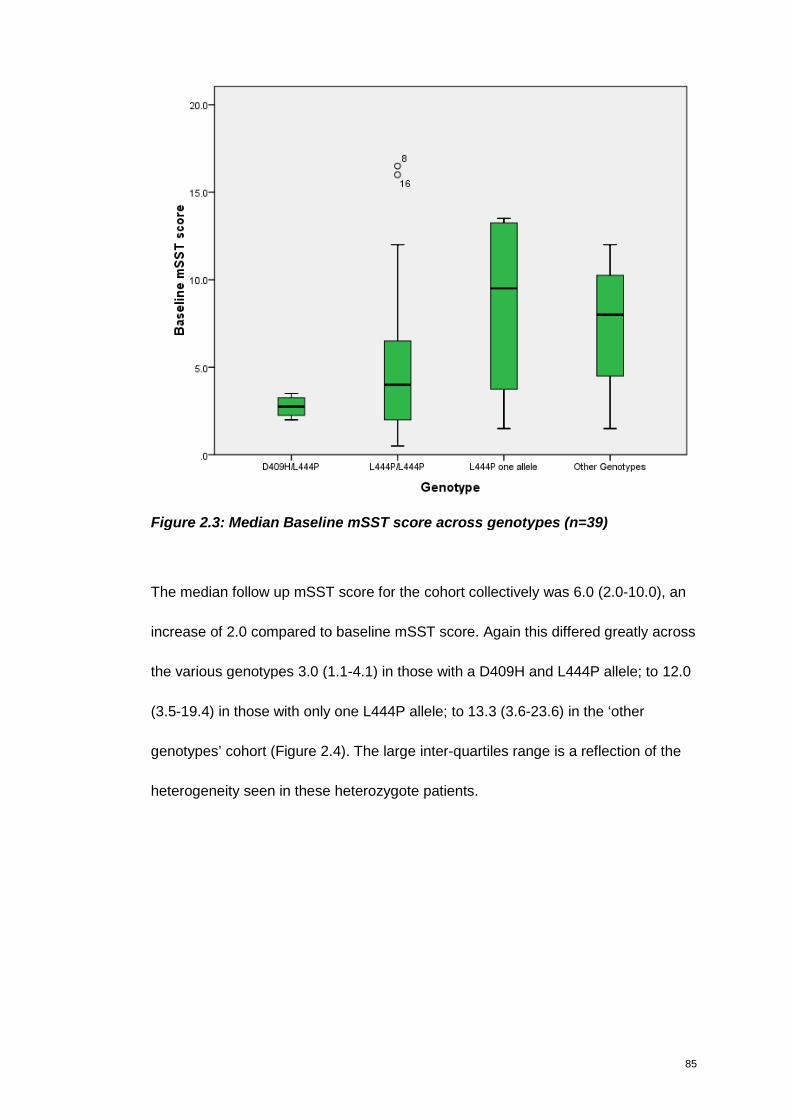
85
Figure 2.3: Median Baseline mSST score across genotypes (n=39)
The median follow up mSST score for the cohort collectively was 6.0 (2.0-10.0), an
increase of 2.0 compared to baseline mSST score. Again this differed greatly across
the various genotypes 3.0 (1.1-4.1) in those with a D409H and L444P allele; to 12.0
(3.5-19.4) in those with only one L444P allele; to 13.3 (3.6-23.6) in the ‘other
genotypes’ cohort (Figure 2.4). The large inter-quartiles range is a reflection of the
heterogeneity seen in these heterozygote patients.
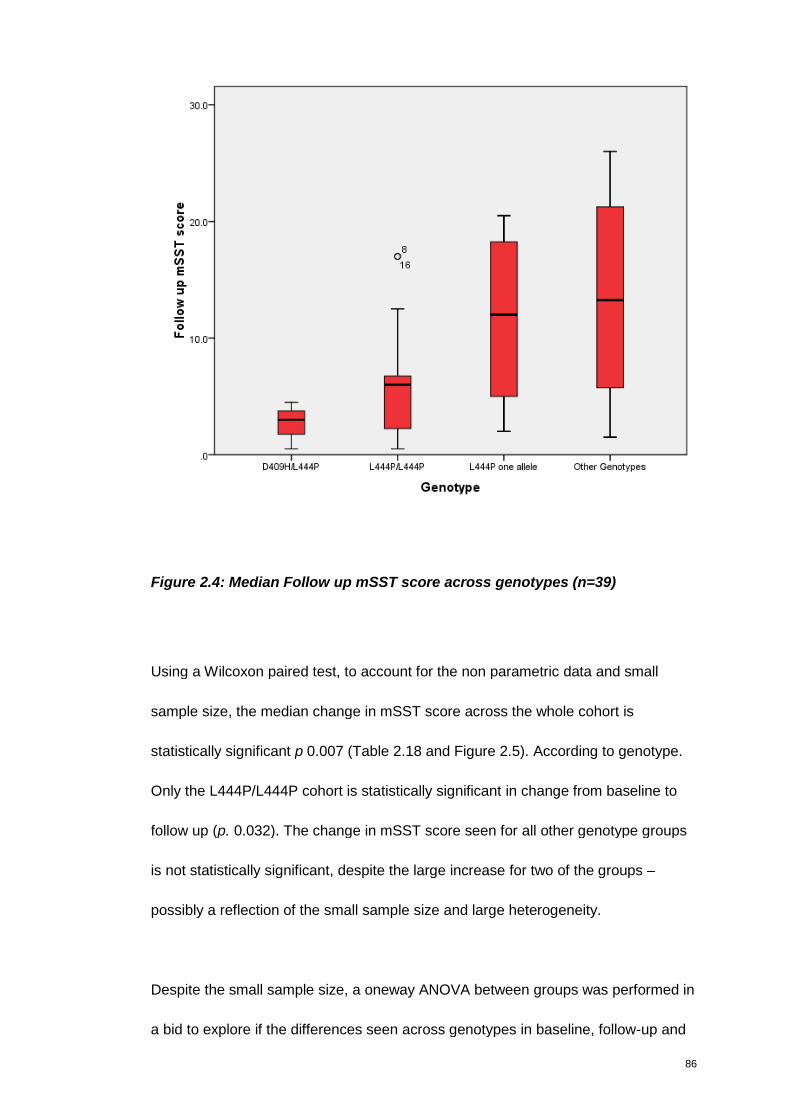
86
Figure 2.4: Median Follow up mSST score across genotypes (n=39)
Using a Wilcoxon paired test, to account for the non parametric data and small
sample size, the median change in mSST score across the whole cohort is
statistically significant p 0.007 (Table 2.18 and Figure 2.5). According to genotype.
Only the L444P/L444P cohort is statistically significant in change from baseline to
follow up (p. 0.032). The change in mSST score seen for all other genotype groups
is not statistically significant, despite the large increase for two of the groups –
possibly a reflection of the small sample size and large heterogeneity.
Despite the small sample size, a oneway ANOVA between groups was performed in
a bid to explore if the differences seen across genotypes in baseline, follow-up and
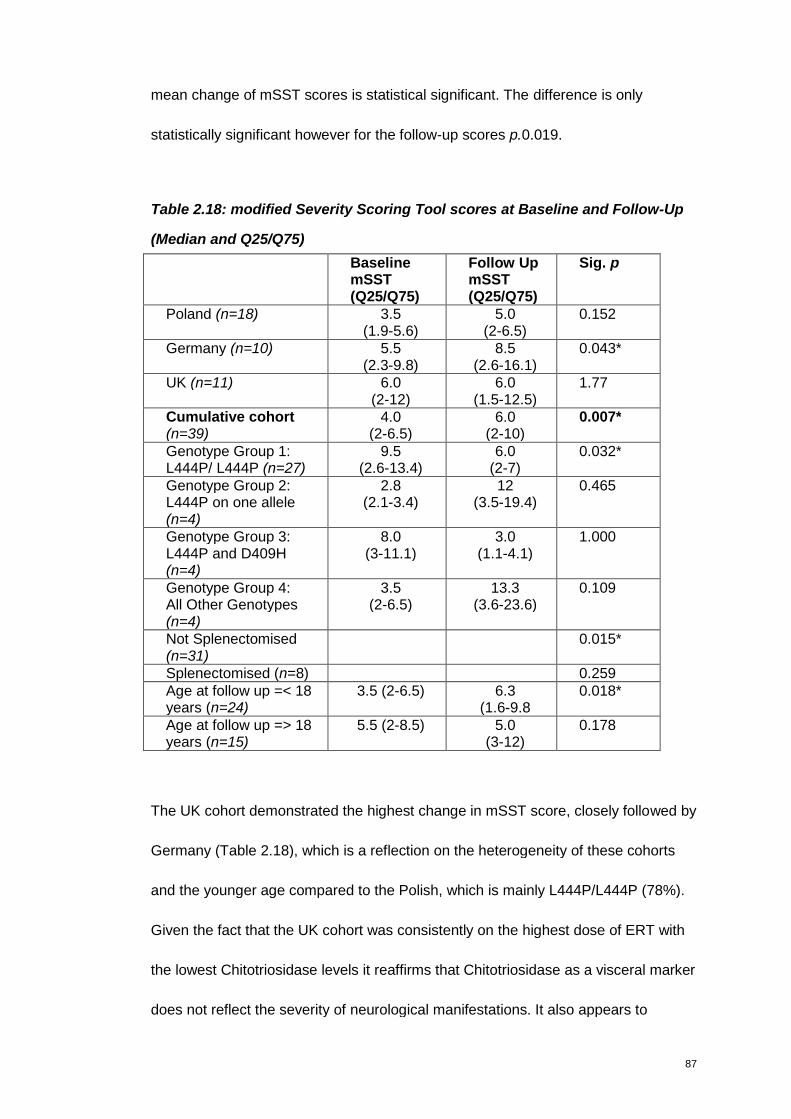
87
mean change of mSST scores is statistical significant. The difference is only
statistically significant however for the follow-up scores p.0.019.
Table 2.18: modified Severity Scoring Tool scores at Baseline and Follow-Up
(Median and Q25/Q75)
BaselinemSST(Q25/Q75)
Follow UpmSST(Q25/Q75)
Sig. p
Poland (n=18) 3.5(1.9-5.6)
5.0(2-6.5)
0.152
Germany (n=10) 5.5(2.3-9.8)
8.5(2.6-16.1)
0.043*
UK (n=11) 6.0(2-12)
6.0(1.5-12.5)
1.77
Cumulative cohort(n=39)
4.0(2-6.5)
6.0(2-10)
0.007*
Genotype Group 1:L444P/ L444P (n=27)
9.5(2.6-13.4)
6.0(2-7)
0.032*
Genotype Group 2:L444P on one allele(n=4)
2.8(2.1-3.4)
12(3.5-19.4)
0.465
Genotype Group 3:L444P and D409H(n=4)
8.0(3-11.1)
3.0(1.1-4.1)
1.000
Genotype Group 4:All Other Genotypes(n=4)
3.5(2-6.5)
13.3(3.6-23.6)
0.109
Not Splenectomised(n=31)
0.015*
Splenectomised (n=8) 0.259Age at follow up =< 18years (n=24)
3.5 (2-6.5) 6.3(1.6-9.8
0.018*
Age at follow up => 18years (n=15)
5.5 (2-8.5) 5.0(3-12)
0.178
The UK cohort demonstrated the highest change in mSST score, closely followed by
Germany (Table 2.18), which is a reflection on the heterogeneity of these cohorts
and the younger age compared to the Polish, which is mainly L444P/L444P (78%).
Given the fact that the UK cohort was consistently on the highest dose of ERT with
the lowest Chitotriosidase levels it reaffirms that Chitotriosidase as a visceral marker
does not reflect the severity of neurological manifestations. It also appears to
88
indicate, in keeping with the revised guidelines, that high dose ERT does not halt
neurological progression in these severe cases.
As indicated in the introduction, NGD patients are reported to progress more rapidly
neurologically following a complete splenectomy. The difference in mean mSST
score between splenectomised and none splenectomised patients at baseline was
statistically significant p 0.0062. However, at follow up the non-splenectomised
patients had progressed more and this statistical difference between the two groups
was lost. The difference in mean change of mSST score between the two groups is
not statistically significant either; however the mean difference between baseline
and follow up is statistically significant for those with an intact spleen p.0.015. This
indicates that splenectomised patients has greater disease severity, but do not
endure disease progression as the same rate as those with intact spleens. This is
contradictory to that previously published, however these findings are biased by the
fact that young more severe affected children, with more progressive disease are no
longer splenectomised, while the splenectomised patients are still alive at an older
age, and therefore indicating a milder rate of disease progression. Details of
splenectomised patients are presented in more detail in Appendix 3.
The situation is similar when exploring the data according to age brackets (Younger
than 18 years at time of follow up assessment vs Older than 18 years at time of
follow up assessment), although without a statistically significant difference of
scores at baseline. Those younger than 18 years at the time of follow up
89
assessment had an increase in mean mSST score of 2.3 (±4.6) which is statistically
significant (p 0.26) compared to 0.8 (±2.2) for those over 18 years.
The similar pattern in the older patients and splenectomised patients is a reflection
of the fact that the majority of splenectomised patients are the Polish older ones and
that only one of the eight splenectomised patients was younger than 18 years of age
at the time of follow up assessment.
Despite the overall increase in mSST score across the cohort there were 10 patients
that reported an improved score. Five patients only improved by 0.5 which was
based on improvement in Cerebellar signs/Ataxia. Four of the five were on SRT at
the time of baseline assessment - a side effect of SRT treatment is intention tremor,
which has resolved since stopping the SRT. Another patient was also on SRT at the
time of baseline assessment, with a marked impairment of ataxia/gait, intention
tremor and pyramidal involvement. These manifestations were improved at follow-up,
with a correlating improvement in mSST score.
Individual domain analysis
An attempt was made to identify in which of the 11 domains the greatest change
was seen between Baseline and Follow-Up. A basic overview of the manifestation
seen (in %), regardless of level of severity is presented in Figure 2.5.
It can be seen that the presenting percentage has remained constant for HGP and
Pyramidal. Involvement of Cognitive Ability, Ataxia/Gait, Speech and Extrapyramidal
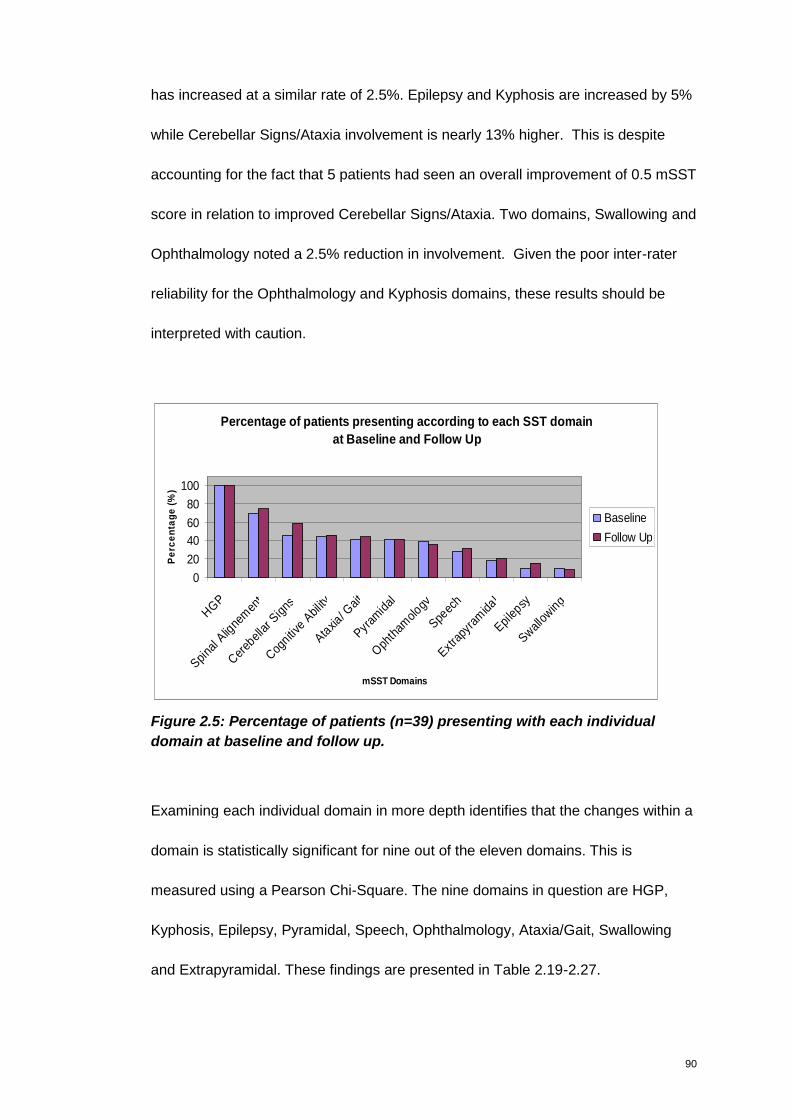
90
has increased at a similar rate of 2.5%. Epilepsy and Kyphosis are increased by 5%
while Cerebellar Signs/Ataxia involvement is nearly 13% higher. This is despite
accounting for the fact that 5 patients had seen an overall improvement of 0.5 mSST
score in relation to improved Cerebellar Signs/Ataxia. Two domains, Swallowing and
Ophthalmology noted a 2.5% reduction in involvement. Given the poor inter-rater
reliability for the Ophthalmology and Kyphosis domains, these results should be
interpreted with caution.
Percentage of patients presenting according to each SST domain
at Baseline and Follow Up
0
20
40
60
80
100
HGP
Spina
l Alig
nem
ent
Cereb
ellar
Signs
Cognitiv
eAbil
ity
Ataxia
/ Gait
Pyram
idal
Oph
tham
ology
Speec
h
Extra
pyra
mida
l
Epilep
sy
Swallow
ing
mSST Domains
Pe
rce
nta
ge
(%)
Baseline
Follow Up
Figure 2.5: Percentage of patients (n=39) presenting with each individual
domain at baseline and follow up.
Examining each individual domain in more depth identifies that the changes within a
domain is statistically significant for nine out of the eleven domains. This is
measured using a Pearson Chi-Square. The nine domains in question are HGP,
Kyphosis, Epilepsy, Pyramidal, Speech, Ophthalmology, Ataxia/Gait, Swallowing
and Extrapyramidal. These findings are presented in Table 2.19-2.27.

91
Table 2.19: Pearson Chi-Square and individual changes for HGP domain
Follow Up Horizontal Gaze PalsyHorizontal
Saccades absent,Vertical Saccades
present
Horizontal andVertical
Saccades absent TotalHorizontal Saccadesabsent, VerticalSaccades present
20 10 30
Horizontal andVertical Saccadesabsent
2 7 9
BaselineHorizontalGazePalsy
Total 22 17 39
Pearson Chi-Square 0.018
This table indicates that the number of patients with “Horizontal and Vertical
Saccades absent” had increased from nine to seventeen, a 20% increase. This
increase in presentation is significant, however given the difficulty in assessing
saccades without sophisticated equipment there may be some variability to this
number.
Table 2.20: Pearson Chi-Square and individual changes for Epilepsy domain
Follow Up Epilepsy
Noseizures
Seizurescontrolledwith AED
Seizures requiringcombination
therapy or resistantto AED Total
No seizures 31 3 1 35Seizurescontrolled withAED
0 0 3 3
Seizures requiringcombinationtherapy orresistant to AED
0 0 1 1
BaselineEpilepsy
Total 31 3 5 39
Pearson Chi-Square 0.000
AED – Anti epileptic drugs.
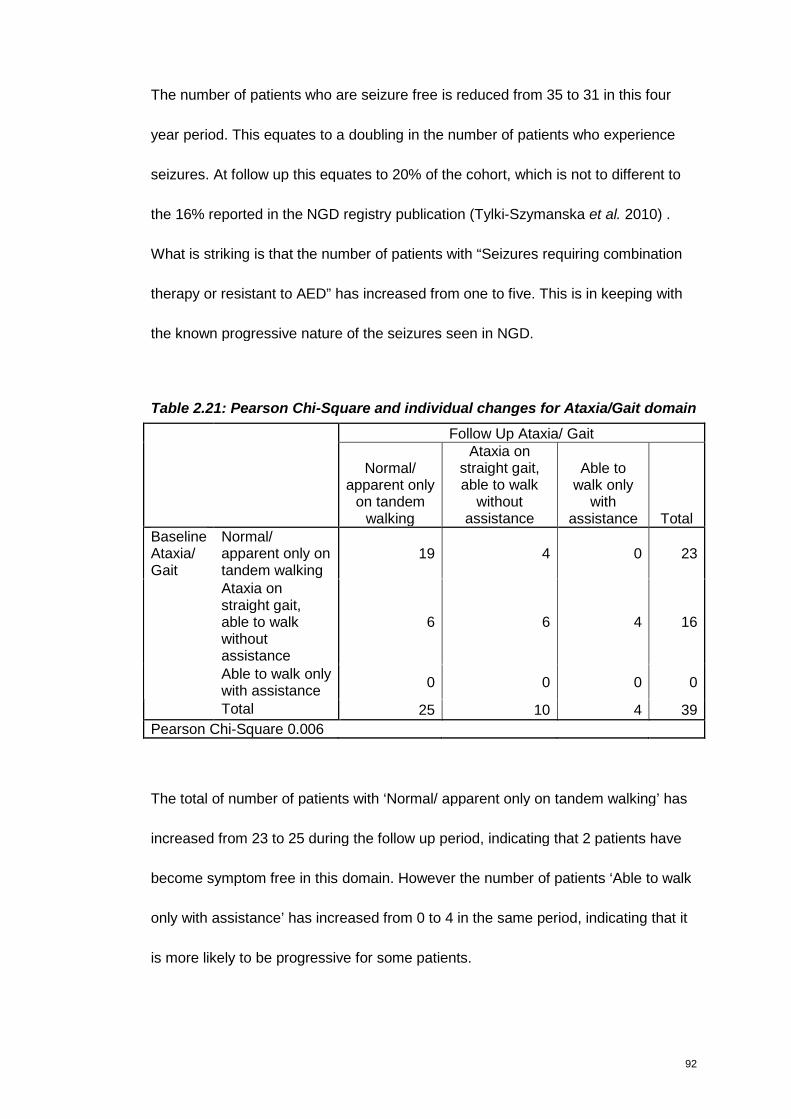
92
The number of patients who are seizure free is reduced from 35 to 31 in this four
year period. This equates to a doubling in the number of patients who experience
seizures. At follow up this equates to 20% of the cohort, which is not to different to
the 16% reported in the NGD registry publication (Tylki-Szymanska et al. 2010) .
What is striking is that the number of patients with “Seizures requiring combination
therapy or resistant to AED” has increased from one to five. This is in keeping with
the known progressive nature of the seizures seen in NGD.
Table 2.21: Pearson Chi-Square and individual changes for Ataxia/Gait domain
Follow Up Ataxia/ Gait
Normal/apparent only
on tandemwalking
Ataxia onstraight gait,able to walk
withoutassistance
Able towalk only
withassistance Total
Normal/apparent only ontandem walking
19 4 0 23
Ataxia onstraight gait,able to walkwithoutassistance
6 6 4 16
Able to walk onlywith assistance
0 0 0 0
BaselineAtaxia/Gait
Total 25 10 4 39
Pearson Chi-Square 0.006
The total of number of patients with ‘Normal/ apparent only on tandem walking’ has
increased from 23 to 25 during the follow up period, indicating that 2 patients have
become symptom free in this domain. However the number of patients ‘Able to walk
only with assistance’ has increased from 0 to 4 in the same period, indicating that it
is more likely to be progressive for some patients.
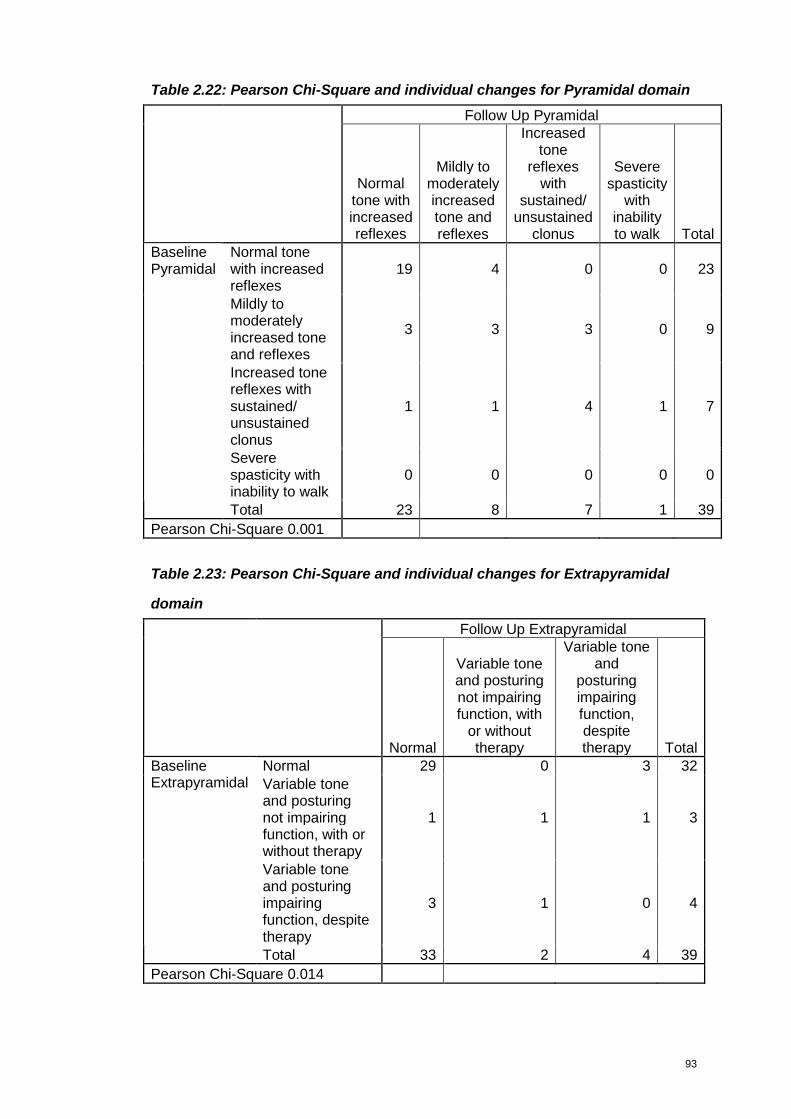
93
Table 2.22: Pearson Chi-Square and individual changes for Pyramidal domain
Follow Up Pyramidal
Normaltone withincreasedreflexes
Mildly tomoderatelyincreasedtone andreflexes
Increasedtone
reflexeswith
sustained/unsustained
clonus
Severespasticity
withinabilityto walk Total
Normal tonewith increasedreflexes
19 4 0 0 23
Mildly tomoderatelyincreased toneand reflexes
3 3 3 0 9
Increased tonereflexes withsustained/unsustainedclonus
1 1 4 1 7
Severespasticity withinability to walk
0 0 0 0 0
BaselinePyramidal
Total 23 8 7 1 39
Pearson Chi-Square 0.001
Table 2.23: Pearson Chi-Square and individual changes for Extrapyramidal
domain
Follow Up Extrapyramidal
Normal
Variable toneand posturingnot impairingfunction, with
or withouttherapy
Variable toneand
posturingimpairingfunction,despitetherapy Total
Normal 29 0 3 32Variable toneand posturingnot impairingfunction, with orwithout therapy
1 1 1 3
Variable toneand posturingimpairingfunction, despitetherapy
3 1 0 4
BaselineExtrapyramidal
Total 33 2 4 39
Pearson Chi-Square 0.014

94
Overall there appears to be only minimal changes in the Pyramidal features but it
does show a progressing trend – which are very statistically significant. A very
similar pattern is also seen in the Extrapyramidal domain.
In the Swallowing domain it appears that one patient has improved, while two have
remained symptomatic with mild symptoms, while a fourth has progressed to severe
symptoms.
Table 2.24: Pearson Chi-Square and individual changes for Swallowing
domain
Follow Up Swallowing difficulties/ Oral bulbar function
Normal
Milddysphagia(excessdrooling)
Severe dysphagia(requiring non-oralfeeding) Total
Normal 33 2 0 35Milddysphagia(excessdrooling)
3 0 1 4
BaselineSwallowingdifficulties/Oral bulbarfunction
Severedysphagia(requiring non-oral feeding)
0 0 0 0
Total 36 2 1 39Pearson Chi-Square 0.010
Again there appears to be very little change in the Speech domain. However this
change is statistically significant. At the time of follow up, it appears that one patient
has progressed to having “Severe dysarthia with most speech unintelligible to
familiar listener”.
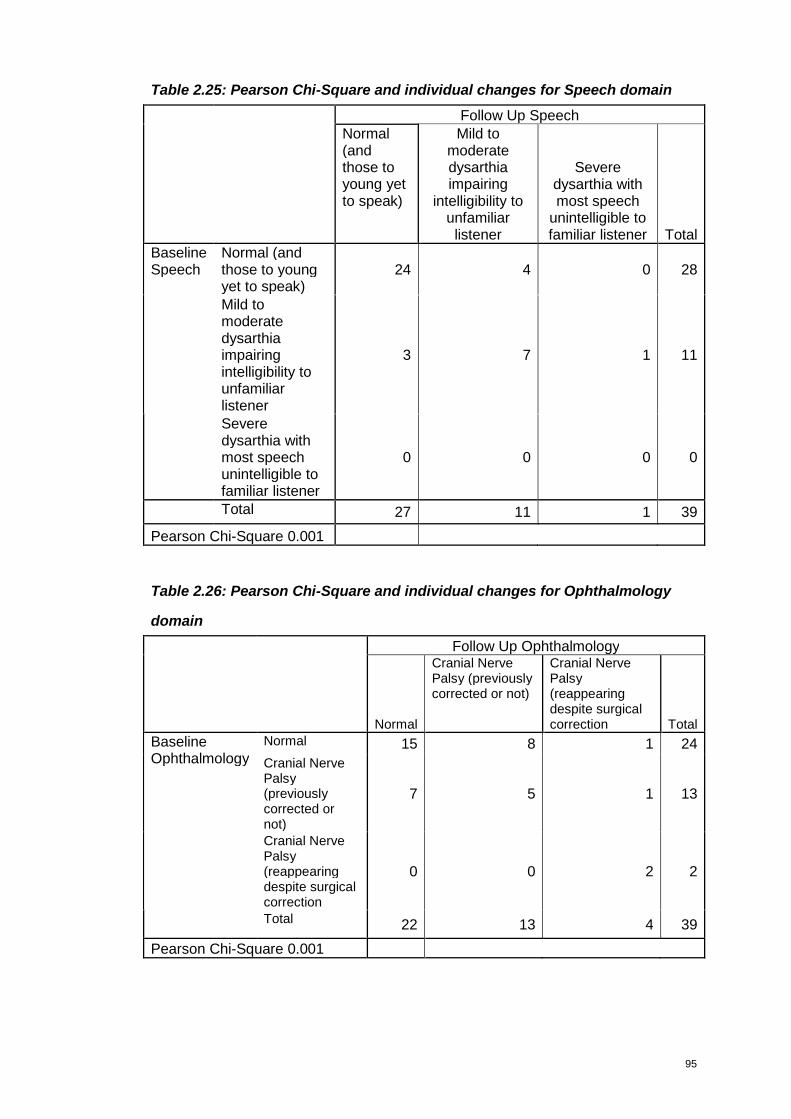
95
Table 2.25: Pearson Chi-Square and individual changes for Speech domain
Follow Up SpeechNormal(andthose toyoung yetto speak)
Mild tomoderatedysarthiaimpairing
intelligibility tounfamiliarlistener
Severedysarthia withmost speech
unintelligible tofamiliar listener Total
Normal (andthose to youngyet to speak)
24 4 0 28
Mild tomoderatedysarthiaimpairingintelligibility tounfamiliarlistener
3 7 1 11
BaselineSpeech
Severedysarthia withmost speechunintelligible tofamiliar listener
0 0 0 0
Total 27 11 1 39
Pearson Chi-Square 0.001
Table 2.26: Pearson Chi-Square and individual changes for Ophthalmology
domain
Follow Up Ophthalmology
Normal
Cranial NervePalsy (previouslycorrected or not)
Cranial NervePalsy(reappearingdespite surgicalcorrection Total
Normal 15 8 1 24
Cranial NervePalsy(previouslycorrected ornot)
7 5 1 13
Cranial NervePalsy(reappearingdespite surgicalcorrection
0 0 2 2
BaselineOphthalmology
Total 22 13 4 39
Pearson Chi-Square 0.001
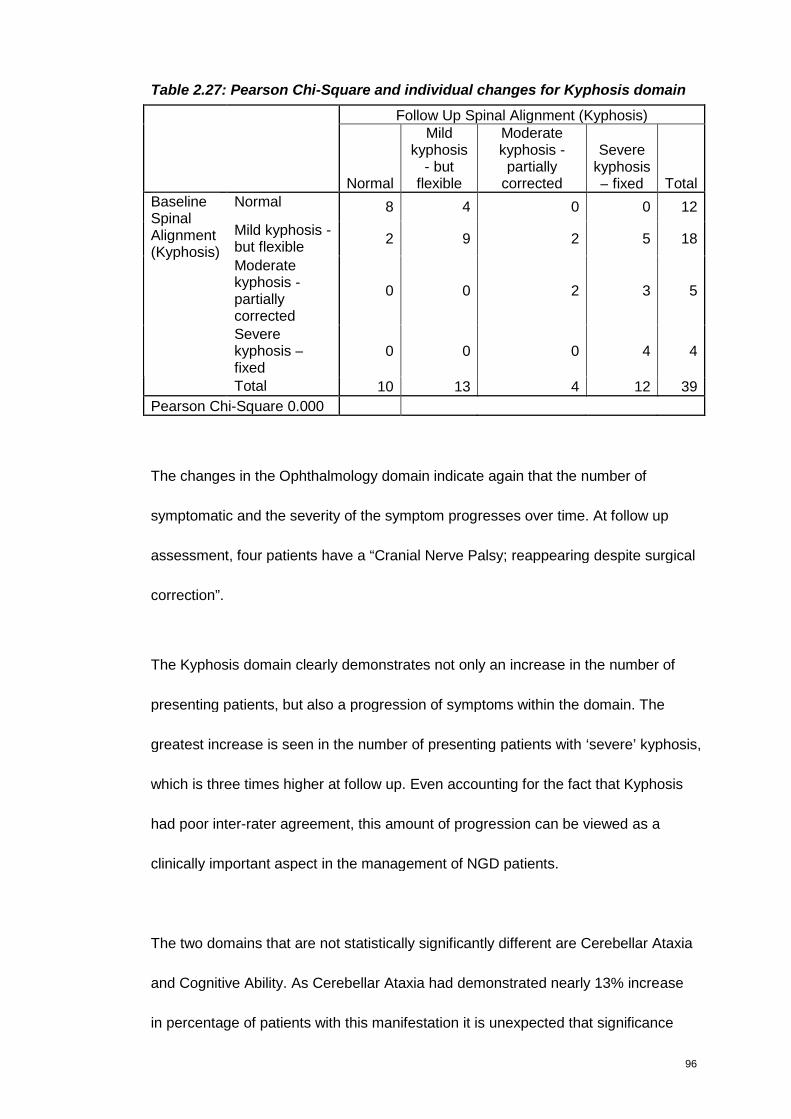
96
Table 2.27: Pearson Chi-Square and individual changes for Kyphosis domain
Follow Up Spinal Alignment (Kyphosis)
Normal
Mildkyphosis
- butflexible
Moderatekyphosis -partially
corrected
Severekyphosis– fixed Total
Normal 8 4 0 0 12
Mild kyphosis -but flexible
2 9 2 5 18
Moderatekyphosis -partiallycorrected
0 0 2 3 5
Severekyphosis –fixed
0 0 0 4 4
BaselineSpinalAlignment(Kyphosis)
Total 10 13 4 12 39
Pearson Chi-Square 0.000
The changes in the Ophthalmology domain indicate again that the number of
symptomatic and the severity of the symptom progresses over time. At follow up
assessment, four patients have a “Cranial Nerve Palsy; reappearing despite surgical
correction”.
The Kyphosis domain clearly demonstrates not only an increase in the number of
presenting patients, but also a progression of symptoms within the domain. The
greatest increase is seen in the number of presenting patients with ‘severe’ kyphosis,
which is three times higher at follow up. Even accounting for the fact that Kyphosis
had poor inter-rater agreement, this amount of progression can be viewed as a
clinically important aspect in the management of NGD patients.
The two domains that are not statistically significantly different are Cerebellar Ataxia
and Cognitive Ability. As Cerebellar Ataxia had demonstrated nearly 13% increase
in percentage of patients with this manifestation it is unexpected that significance
97
was not reached in the Chi-Squared at p.0.057. The following two domains with
highest increase in percentage of involvement, Epilepsy and Kyphosis (both at 5%)
demonstrate the highest statistical significance in Chi-Square at 0.000 for both.
Value of mSST in predicting disease course
Regression is a topic that considers using the relationship between two or more
variables for prediction (Pagano 2004). In Multiple Regression the value of a
dependent variable, in this case mSST score at follow up are estimated from those
of other variables. This is achieved by the construction of a linear multiple
regression equation of the general form:
y’ = b0 + b1(x1) + b2(x2) + b3(x3) + b4(x4) + b5(x5)
Where b0 represents the intercept, or regression constant, while b1 b2 b3 b4 b5
represents the partial regression coefficient, or the slope of the five variables. This
equation is known as the multiple linear regression equation of y upon x1 x2 x3 x4 x5
While the regression equation assumes that all variables are interval data it is also
accepted that ordinal variables can be used. Categorical variables can only be
entered into the equation when the have been transformed into ‘dummy variables’.
Pearson correlation (r) assesses the magnitude and direction of a relationship
between two interval variables. A perfect correlation takes a value of ±1 (range from
-1 to +1) when all the points in the scatter-plot lie on the regression line. Correlation,
in this instance in primarily concerned with exploring if a relationship exists, with its
98
magnitude and direction. To enable the relationship to be used for prediction, a
regression analysis is required.
The independent variables considered likely to predict Follow Up mSST were:
Baseline mSST, Genotypes, Spleen status, Age at first assessment and FSIQ at
baseline. ERT dose IU/kg/2 weeks and Chitotriosidase are other variables that may
have an impact on disease progression, however given the fact that their direct link
to neurological function remains contentious, they were not included.
There are two general rules of thumb regarding the number of predictors that can be
used in a model depending on the sample size in question. Generally there should
be no more predictors in the model than n/10 or alternatively Square Root (n). So for
this sample size of n=39 four to six predictors can be used, depending on the rule
used.
R represents the multiple correlation coefficients, which is 0.897. R Square (R2) is
an estimate of the proportion of variance accounted for by regression. This is a
positively biased estimate of the proportion of the variance of Follow up mSST
accounted for by the regression. This is corrected in the Adjusted R2 at .727. Using
the Adjusted R2 which takes into account sample size and the number of variables,
and therefore a better estimate of the population, indicates the effect size is 73%,
which is a large effect size.
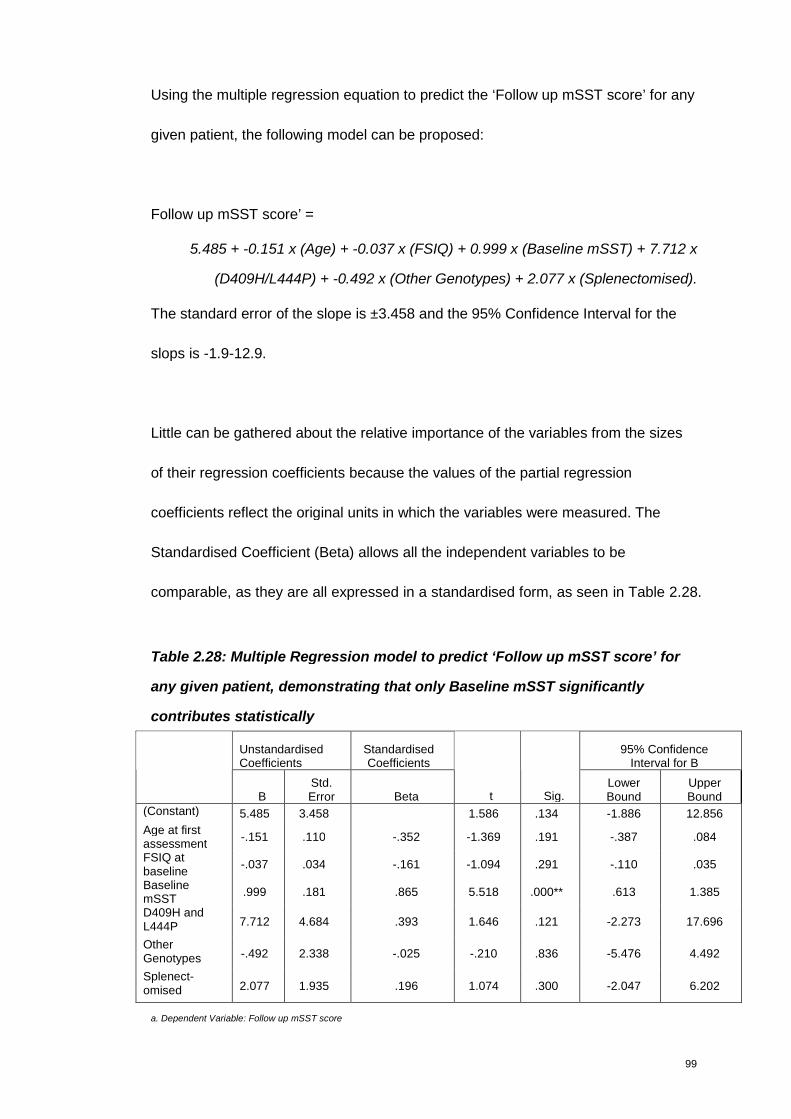
99
Using the multiple regression equation to predict the ‘Follow up mSST score’ for any
given patient, the following model can be proposed:
Follow up mSST score’ =
5.485 + -0.151 x (Age) + -0.037 x (FSIQ) + 0.999 x (Baseline mSST) + 7.712 x
(D409H/L444P) + -0.492 x (Other Genotypes) + 2.077 x (Splenectomised).
The standard error of the slope is ±3.458 and the 95% Confidence Interval for the
slops is -1.9-12.9.
Little can be gathered about the relative importance of the variables from the sizes
of their regression coefficients because the values of the partial regression
coefficients reflect the original units in which the variables were measured. The
Standardised Coefficient (Beta) allows all the independent variables to be
comparable, as they are all expressed in a standardised form, as seen in Table 2.28.
Table 2.28: Multiple Regression model to predict ‘Follow up mSST score’ for
any given patient, demonstrating that only Baseline mSST significantly
contributes statistically
UnstandardisedCoefficients
StandardisedCoefficients
95% ConfidenceInterval for B
BStd.Error Beta t Sig.
LowerBound
UpperBound
(Constant) 5.485 3.458 1.586 .134 -1.886 12.856
Age at firstassessment
-.151 .110 -.352 -1.369 .191 -.387 .084
FSIQ atbaseline
-.037 .034 -.161 -1.094 .291 -.110 .035
BaselinemSST
.999 .181 .865 5.518 .000** .613 1.385
D409H andL444P 7.712 4.684 .393 1.646 .121 -2.273 17.696
OtherGenotypes -.492 2.338 -.025 -.210 .836 -5.476 4.492
Splenect-omised 2.077 1.935 .196 1.074 .300 -2.047 6.202
a. Dependent Variable: Follow up mSST score
100
The Beta coefficient is the change in ‘Follow up mSST score’; the dependent
variable (expressed in standard deviation units) produced by a positive increment of
one standard deviation in the independent variable. In this instance, mSST score at
baseline makes the greatest contribution to predicting follow up mSST score - as a
change of one standard deviation on that variable produces a change of 0.865 on
follow up mSST score. Indeed, baseline mSST score is the only significant
predicting variable. This seemed surprising considering the group difference seen
between Genotypes in previous analysis of change in mSST score between
baseline and follow up.
However this multivariable regression model is for each factor after adjusting for
others. Genotype as a variable is therefore not significant after taking into account
the other variables, primarily baseline mSST.
When Genotype alone is used as a predicting variable, the regression model is as
follows:
Follow up mSST score’ = 6.130 + 5.495 x (L444P/Heterozygote) + -3.380 x
(D409H/L444P) + 7.370 x (Other Genotype)
(Constant being L444P/L444P).
‘Other Genotype’ is the only Significant predicting variable (p0.018) , with
L444P/Heterozygote closest there after, but not significant at p0.071.
101
However the Adjusted R2 for the model summary where only Genotype alone is
included accounts for only 18% of the change seen. In the same regard the
Adjusted R2 for a model summary where only baseline mSST score is included is
58%. This is 15% less than when all the variables are included in one model. This
indicates that Genotype, Spleen status, FSIQ at baseline, Age at first assessment
and baseline mSST score, collectively, contribute to the most predictive model and
should therefore all be retained. This appears to be consistent with the clinical
phenomenon seen as well.
2.4 Discussion on mSST development
The original aim in developing the SST was to create a tool that was feasible to use,
easy and quick to apply, and without any cultural or economical constraint (Davies
et al. 2007b). The modifications made to the SST based on this work means that the
mSST has been validated in line with the E9 ICH guideline for the development of a
tools (International Conference on Harmonisation 1998), and could be used as a
primary endpoint in a clinical trial – offering a measurement of a clinically relevant
and important benefit to the patient population.
During the inter-rater evaluation Ophthalmology and Kyphosis was noted to have
poor agreement. A reason which may explain why Kyphosis has poor agreement is
that this is one domain where the terms mild, moderate and severe were used with
minimal additional information included to direct the assessor in making their
selection. Agreement may have been better if classification was based on degree of
curve according to spinal x-rays. However the SST was devised with the aim of

102
being completely self-standing, that is, without requiring any additional assessments
to calculate score, therefore this approach was not pursued.
The reason for the lack of agreement in the Ophthalmology domain is less clear.
One reason may be that the assessor relied on memory rather than medical notes to
score if the child had undergone surgical correction or not. Furthermore, on
reflection, the distinction between “Cranial Nerve Palsy (previously corrected or not)”
and “Cranial Nerve Palsy (reappearing despite surgical correction or not)” may be
ambiguous. The first intended to reflect that a cranial nerve palsy may not be visible
following surgical correction, while the latter reflects a patients whose nerve palsy
reappears and persistent despite surgical intervention, a reflection of increased
severity.
This suggests that these domains would benefit from further guidance and possible
training to improve the concordance of opinion. Producing a video clip of a patient
being assessed might be the most effective approach in this regard, particularly if
the tool was to be used for clinical trial purposes.
Intra-rater evaluation findings were particularly encouraging, in that not only was
intra-rater agreement demonstrated, but also the sensitivity of the mSST in
capturing and quantifying disease progression. This sensitivity to capture and
quantify disease progression was demonstrated on a greater scale during the follow
up assessment of the European cohort.
103
The twelfth domain ‘Age at Onset of Seizure’ was categorised in consultation with
the experts and categorised into the age brackets of 0-5 years =3. 6-10 years =2.
11-15 years =1. 16 years and over or seizure free =0. On reflection, this may not
have been the best categorisation selected. The International Conference of
Harmonisation, E11 guideline on Clinical Investigation of Medicinal Products in the
Paediatric Population, paediatric patients are classified as preterm newborns, terms
newborns, infants and toddlers (28 days to 23 months), Children (2 to 11 years) and
Adolescents (over 12 years). The age epochs utilised in epilepsy are 0-2 years, 3-5
years, 5-12 years and 12-18 years. The choice of age categories may therefore be
subject to some criticism for failing to follow one of these. In the registry data of 131
NGD patients reported (Tylki-Szymanska et al. 2010) the median age myoclonus
seizures were first noted at 2.5 years, while the median age of first seizure noted
was 5.4 years. Given the categories of 0-5 years and 5-10 years it allows for the
presentation of myoclonus seizures and other types of seizures to be accounted for
separately.
Although not formally tested, the credibility of the mSST can be assumed to be quite
high as it was modified using consensus formation among leading experts from
around the world.
The MCID for worsening calculated from our data, must be considered with caution,
and may not be valid as the numbers are small. Furthermore it was not possible to
discuss MCID for improvement. However it does provide a benchmark, which can
be considered again during continued monitoring of NGD patients with the mSST.
104
By performing the follow up assessment the mSST has also been demonstrated to
be sensitive enough to capture change. The rate of progression identified is
reflective of the slow nature of disease progression seen in the majority of NGD
patients. The ability to be responsive to change, no matter how small, is obviously
one of the key most important aspect of an useful assessment tool.
Weighting the domains and adding a twelfth domain, based on the opinion of the
experts, has ensured that the domains that contribute most morbidity to the disease
is reflected appropriately, while increasing the difference in scores between mild,
moderate and severe patients. The modifications made to the SST have improved
the ability of the tool to distinguish between severely affected patients and mild
patients, which is particularly evident when summarising mSST scores according to
genotype.
This ability of the mSST to measure disease severity as opposed to measuring
progression can be considered in terms of total mSST score generated and
individual domain. Based on the fact that the total mSST score progressed with
statistical significant in the follow up period, and was able to distinguish between
genotypes according to phenotype severity is demonstrative that the mSST is
capable of measuring both severity and progression. This is further supported by the
regression analysis performed to examine the value of the mSST in predicting
disease course.
105
It must be acknowledged that each domain is unable to monitor progression once
the worst level of severity, according to the defined criterion, has been reached –
this is commonly referred to as a ‘ceiling affect’. For example, in the HGP domain
when deterioration classified as both horizontal and vertical saccades absent has
been reached. As none of the patients assessed presented with the most severe
criterion defined in all the domains – that is, none scored maximum possible score,
reaching a ‘ceiling affect’ that prohibits its value for on-going monitoring of disease
progression is not considered to be a problem.
The cohort studied here represents the largest cohort of NGD patients every studied
systematically. Four years follow up period can also be regarded as a sufficient
period of time to capture real change. Through validating the mSST and using it in
this context, this work offers a valuable insight to the ‘natural history’ of NGD
patients in the ERT era, not only in terms of the neurological domains involved, but
also in terms of the rate of disease progression. This will be of particular interest in
the selection of clinically meaningful end points in future clinical trials.
106
Chapter 3
GAIT analysis
If you don’t like the road that you’re walking, start paving another one
- Dolly Parton
107
3 Gait Analysis
3.1 Introduction
Locomotion is the act of getting from one place to another. It is an action that
involves the change of position of the body and limbs in space and time. Gait is the
means of achieving the action of locomotion and is specified by the goal and
environment in which the task is carried out. Walking is therefore a type of gait.
Walking is a basic motor skill and the first locomotion pattern to appear in children in
an upright position (Holm et al. 2009).
Walking measurement is typically simplified, and timed performance often used to
describe walking and provide an impression of its efficiency. The assessment of gait
involves more than simply measuring the distance walked however. As measures of
walking alone may fail to identify subtle disorders or changes associated with
postural control, measuring the components of the gait cycle has the potential to
quantify clinical change. Gait analysis is the systematic study of human motion. This
is an essential prerequisite for any clinical tool that purports to evaluate the
effectiveness of therapy (Whittle 2007).
The normal gait cycle is shown in Figure 3.1. It is a fundamental unit to describe the
gait during ambulation, which occurs from the time when the heel of one foot strikes
the ground to the time at which the same foot contacts the ground again (heel strike
to heel strike of the same foot). It has two phases, a stance phase comprising
approximately 62% of the cycle and a swing phase comprising about 38%. The
stance phase is the duration when the foot is in contact with the ground. The swing
phase is when the foot is in the air.
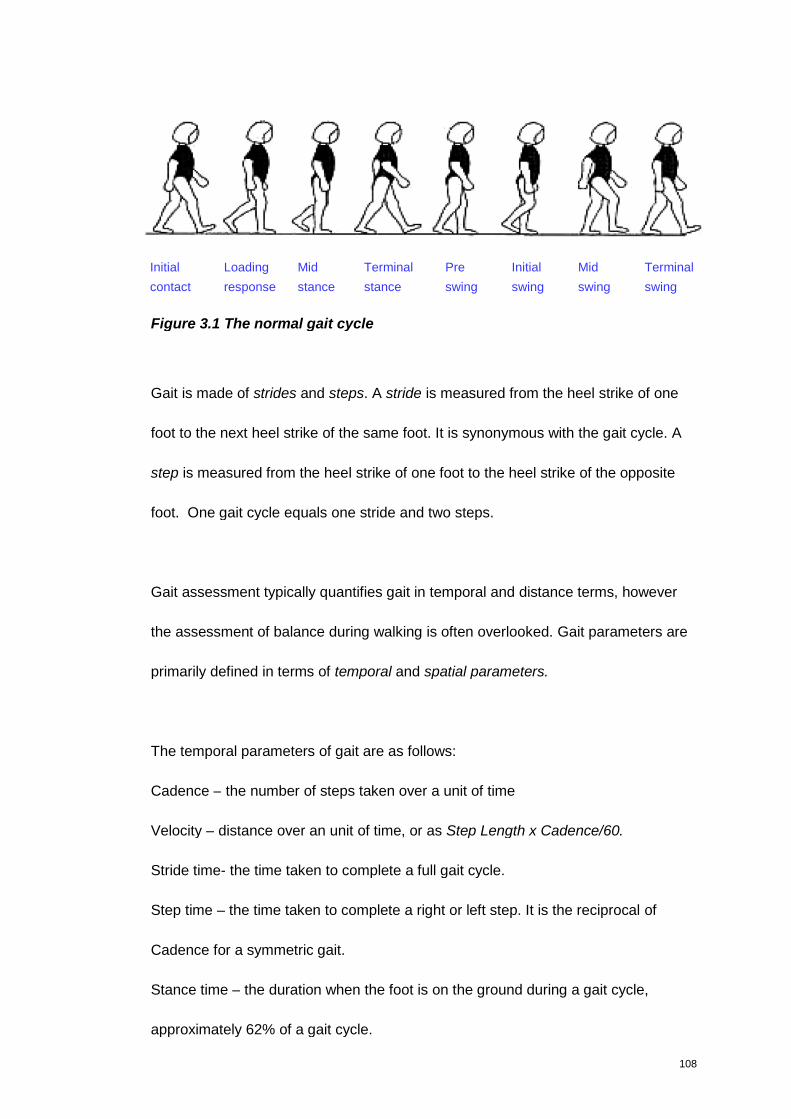
108
Figure 3.1 The normal gait cycle
Gait is made of strides and steps. A stride is measured from the heel strike of one
foot to the next heel strike of the same foot. It is synonymous with the gait cycle. A
step is measured from the heel strike of one foot to the heel strike of the opposite
foot. One gait cycle equals one stride and two steps.
Gait assessment typically quantifies gait in temporal and distance terms, however
the assessment of balance during walking is often overlooked. Gait parameters are
primarily defined in terms of temporal and spatial parameters.
The temporal parameters of gait are as follows:
Cadence – the number of steps taken over a unit of time
Velocity – distance over an unit of time, or as Step Length x Cadence/60.
Stride time- the time taken to complete a full gait cycle.
Step time – the time taken to complete a right or left step. It is the reciprocal of
Cadence for a symmetric gait.
Stance time – the duration when the foot is on the ground during a gait cycle,
approximately 62% of a gait cycle.
Initial
contact
Loading
response
Mid
stance
Pre
swing
Initial
swing
Mid
swing
Terminal
swing
Terminal
stance
109
Single Support time – the duration when only one foot is on the ground during a gait
cycle.
Double Support Time the duration when both feet are on the ground simultaneously
during a gait cycle. It is approximately 22% of the gait cycle, but decreases as
walking speed increases.
Swing Time – the duration when the foot is in the air during a gait cycle. It
compromises approximately 38% of the gait cycle and decreases as walking speed
increases.
The spatial (distance) parameters of gait are as follows:
Stride Length – the distance between two successive heel contacts of the same foot.
It increases as walking speed increases.
Step length is the distance from the heel of the trailing limb to the heel of the landing
one, or the distance covered by a step in the direction of locomotion. It is measured
in centimetres, and is usually between 80 and 90% of leg length. Symmetry
(between the two legs) is usually the norm (Alderson 2007). Any asymmetry is often
a predictor of some pathology present – asymmetrical range of movement, altered
muscle power etc (Wood et al. 2009).
Base of Support (BoS) is the area between the feet in double support, and the area
under the foot in single leg stance.
The temporal-spatial parameters (TSPs) of gait and their measurement form the
basis of any gait. When one step of each (right and left) has occurred, the person
has taken a stride, or performed a gait cycle, and the time it takes for this to occur is
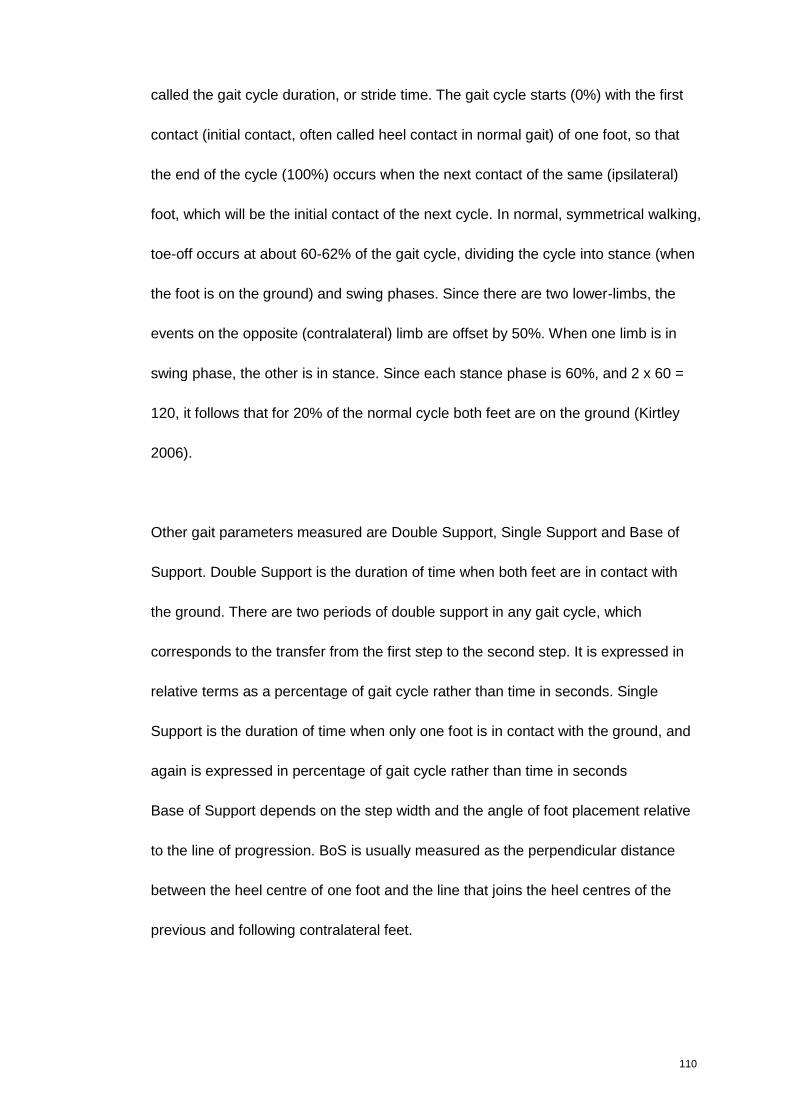
110
called the gait cycle duration, or stride time. The gait cycle starts (0%) with the first
contact (initial contact, often called heel contact in normal gait) of one foot, so that
the end of the cycle (100%) occurs when the next contact of the same (ipsilateral)
foot, which will be the initial contact of the next cycle. In normal, symmetrical walking,
toe-off occurs at about 60-62% of the gait cycle, dividing the cycle into stance (when
the foot is on the ground) and swing phases. Since there are two lower-limbs, the
events on the opposite (contralateral) limb are offset by 50%. When one limb is in
swing phase, the other is in stance. Since each stance phase is 60%, and 2 x 60 =
120, it follows that for 20% of the normal cycle both feet are on the ground (Kirtley
2006).
Other gait parameters measured are Double Support, Single Support and Base of
Support. Double Support is the duration of time when both feet are in contact with
the ground. There are two periods of double support in any gait cycle, which
corresponds to the transfer from the first step to the second step. It is expressed in
relative terms as a percentage of gait cycle rather than time in seconds. Single
Support is the duration of time when only one foot is in contact with the ground, and
again is expressed in percentage of gait cycle rather than time in seconds
Base of Support depends on the step width and the angle of foot placement relative
to the line of progression. BoS is usually measured as the perpendicular distance
between the heel centre of one foot and the line that joins the heel centres of the
previous and following contralateral feet.
111
Stance phase is slightly longer while in bare feet compared to when wearing shoes
(Eisenhardt 1996) as shoes provide a slightly increased base of support, which
improves balance. This is an important consideration to remember when assessing
gait. As balance is compromised, both stance and double support increase to
provide an increased support time. This is an example of a compensation strategy
which is seen in vestibular, cerebellar (ataxia) or non-specific instability. The step
width (mediolateral distance between the heels in double support) also tends to
increase with disequilibrium in order to increase base of support although this may
only become evident at higher speeds (Krebs et al. 2002).
Gait velocity provides an overall measure of how quickly gait is achieved and it
influences many other gait parameters. Cadence and Velocity have been used
widely in the measurement of gait and are thought to reflect the overall ability to
walk and balance. Freely selected walking speed is considered to be a good
indicator of how well an individual walks (Alderson 2007). It has been used as an
indicator of impairment and functional status, and of treatment efficacy in both
clinical and research studies in numerous different clinical groups (Shore et al. 2005)
(Bladen et al. 2007), (Rinehart et al. 2006), (Wondra et al. 2007), (Dusing et al.
2007), (Wood et al. 2009).
3.1.2 The development of gait
The gait pattern is a distinctive attribute of the individual that changes over the life
span (Sutherland 1997). Gait performance is influenced by change in stature, and
also maturation of postural control and coordination of movement. A working

112
knowledge of the developmental sequence of postural control and the development
of mature walking in childhood is necessary to enable an informed clinical
assessment.
Children use different walking strategies during development. The toddler has a fast
Cadence (steps per minute) and uses Step Length to change speed. After about 5
months of walking, this pattern reverses and Cadence is used to drive Velocity
change. The preferred Cadence rapidly decreases over the first two years the slowly
decreases towards adults level (Sutherland 1997).
Selby-Silverstein and O’Reilly (2003) investigated the development of gait
characteristics in children aged between one and five years. Velocity was also found
to increase with age. The Step and Stride Lengths had high positive correlations to
age and this relationship did not disappear when normalised to leg length (Selby-
Silverstein & O'Reilly 2003).
Normalisation of data to account for growth is a widely disputed issue. It is applied in
a number of different ways, often without mathematical justification or a firm basis in
dynamics (Stansfield et al. 2003).
For scaling gait parameters of children Hof (1996) proposed the use of non-
dimensional numbers, based on geometric scaling (Hof 1996). This was applied with
success in a study of treadmill walking in children between 4 and 10 year of age

113
(Zijlstra et al. 1994). It was found that children over 7 years of age had essentially
adult value gait parameters.
O’Malley J (1996) stated that preferred stride length divided by height keeps
increasing with age, from 1 to 7 years (O'Malley 1996). The difference between
O’Malley J (1996) and Hof (1996) is that while (Hof 1996) had normalised stride
length and other distance parameters by leg length (measured in trochanteric
height), O’Malley J (1996) had done so by total height (stature). Leg length
increases more proportionally compared to the total body height in humans. Using
O’Malley J (1996) data, Hof and Zijlstra (1997) demonstrated that preferred stride
length when normalised by division by leg length, is essentially constant from the
age of 3 ½ year up to adult (Hof & Zijlstra 1997). Scaling leads to a similar result as
with stride length: in young children, normalised cadence increases up to age 3 ½
year and reaches approximately the adult level by then.
Hof and Zijlstra (1997) suggest that:
1. Geometric scaling is superior to raw data: leg length and g are the only
factors necessary for an effective scaling. Size effects can thus be
accounted for in a mechanically consistent way and separated from other
effects, like age or pathology.
2. Leg length is a better scaling factor than stature.
However Alderson (2007) reports that as the “leg length to height ratio” is not linear,
therefore this approach to normalisation has limitations. Based on this, Alderson
(2007) developed percentile charts to graphically illustrate the developmental
114
changes of gait, according to age. The true value of these charts are in longitudinal
measurement.
Alderson (2007) identified that development trends of Velocity continue beyond
seven years of age, and were related to factors other than growth (leg length). A
change in Velocity was influenced by increased Step Time with a reduced rate of
stepping. Older children had less variation from step to step, which along with
reduced rate helps to conserve and minimise energy expenditure and maximise
efficiency (Alderson 2007).
Selby-Silverstein and O’Reilly (2003) proposed that factors, other than
anthropometrical changes that occur with growth influence the maturation of gait.
Possible explanations were the continued myelination of the central nervous system,
or the refinement of the neuromuscular system. A decrease in coefficient of variation
of gait parameters was proposed as an indicator of maturation in gait (Selby-
Silverstein & O'Reilly 2003).
3.1.3 Abnormal gait
Different pathologies are believed to affect gait in different ways and research has
been done to describe walking and balance ability in different patient groups.
Musculoskeletal, cardio-respiratory and central nervous system involvement may
impact on gait.
115
In relation to the central nervous system, peripheral inputs and proprioceptive
reflexes processed in the spinal cord, the cerebellum, basal ganglia, and cortical
mechanisms contribute to the motor control necessary for normal gait and balance.
In addition to the spinal and central mechanisms, visual, vestibular and
somatosensory inputs contribute to a stable posture (Thomas et al. 2004).
Pathology impacting on any of these mechanisms has the possibility to affect
balance and gait therefore.
Although the basal ganglia play a central role in the initiation and mediation of
movement, the cerebellum is more involved in controlling and tempering end-stage
movements. Cerebellar lesions may result in movements that are irregular and
variable. A lesion in the cerebellum or spinocerebellar tracts may result in ataxia.
Cerebellar ataxia is most apparent in the ambulatory child, where movements of the
limbs are uncoordinated because of a lack of harmonious enlistment of all the
muscles (dysynergia). The gait is not the only indication of ataxia however; rapid
alternating movements are slowed and irregularly timed (dysdiadochokinesia).
There may be tremor during voluntary movements that increases as the limb
approaches its target resulting in an overshooting of the target (dysmetria), and
occasionally there is nystagmus. Speech is typically altered, both slow and uneven
in volume, varying from jerky or scanning speech to explosive and occasionally
staccato. Muscle tone is generally unchanged or arguably reduced and tendon
reflexes may be weak or pendular. Disorders of supranuclear gaze is also a frequent
finding in disorders with cerebellar ataxia (Lyon et al. 2006). All of which impact on
the child’s gait.
116
Clinical descriptions of cerebellar gait typically include a widened base,
unsteadiness and irregularity of steps, and lateral veering. The patients may
compensate for these abnormalities by shortening steps and shuffling, spending
more time on both feet (Adams et al. 1997).
Alderson (2007) in her study of normal and impaired walking in children was able to
identify deviations from the normal developmental trajectory in numerous different
pathologies – Peripheral Neuropathy, Muscular Dystrophy, Spinal Muscular Atrophy,
Developmental Coordination Disorder, Cerebellar Pathology and Traumatic Brain
Injury. Each group had significant differences from controls for specific outcomes. In
addition there were also some significant differences between clinical groups. The
Cerebellar Pathology tended to have a slower Normalised Velocity than the control
groups. Cadence was also significantly reduced and Step Time increased relative to
control. Step Length was significantly shorter, with an increased variation in Step
Time and Length relative to controls. The Cerebellar Pathology group is unique in
that the reduction in Velocity is related to both reduction in Step Length and an
increase in Step Time. This suggested that one or both of these may be a strategy
employed to reduce the balance requirements of walking. They also appeared to be
the most likely to manifest signs of decreased balance control and reduced time
spent in Single Support and increased Double Support.
Children with Peripheral Neuropathy in this study presented with a mixed picture;
they appeared to walk more slowly with a limited Step Length, and an increased
117
Step Time relative to controls. Asymmetry was common place. Alderson (2007)
proposed that the asymmetrical walking patterns were due to biomechanical
alignments and musculoskeletal limitation – and highlights the importance of
combining this information with clinical examination to assess muscle weakness,
imbalance and possible loss of joint range.
3.1. 4 Methods for gait assessment
A comprehensive understanding of the normal gait, armed with a sophisticated
measuring tool leads to the ability of to compare an abnormal gait in a methodical
approach.
Apart from observational assessments armed with a stop-watch there are seven
different types of tools available to measure walking balance: Force Platform,
Pressure Platform, Pressure Walkway, Pressure Insoles, Accelerometer, Gyroscope,
3D Motion Analysis. Force Platform and Pressure Platform are unable to measure
temporal-spatial gait data, while Pressure Insoles, Accelerometer, Gyroscope, 3D
Motion Analysis are relatively not easy and quick to set up, and in most, to use. This,
supported by the low-moderate cost (£10,000-20,000) makes Pressure Walkways
an attractive option (Alderson et al. 2007).
Pressure sensitive walkways register multiple steps, but do not require insoles or
footwear. Walkways have sensors embedded within the walkway which register the
pressure exerted by the foot and record temporal-spatial gait data. They can be
made of fixed plates that can be slotted together, the GaitMat, or in a continuous
118
flexible rubber walkway that rolls up, the GAITRIte. Both walkways automate the
measurements that would otherwise be recorded manually. An electronic walkway is
suited for use in a paediatric clinical setting due to ease of administration and
portability.
The GAITRite system is the most commonly used walkway. It uses a pressure-
sensing array arranged in 48 rows of 288 sensors to record the imprint of each
footfall with six different levels of pressure (McDonough et al. 2001). It is only 3 mm
thick and portable, generating data for immediate determination of gait parameters
(Kirtley 2006). The most common mat, 4m long weighs 20kg in its case, although
longer options are available. Concurrent validity and reliability of spatial and
temporal measurements in adults have been supported. Validity and repeatability in
children has also demonstrated, with within the same day reliability assessed in
children aged one to eleven years as part of a larger normative study (Thorpe et al.
2005). The younger children (1-4 years) had the widest limits of agreement between
measurements.
Normative data for children has been generated by three different authors in three
different countries, (Dusing & Thorpe 2007; Alderson 2007; Holm et al. 2009) USA,
UK, and Norway, respectively. These data sets provide the normal references
ranges for children according to age, which is very important as gait evolves with
age. These normative data, and the demonstrated validity and repeatability of the
GAITRite make it an extremely useful tool for quantifying gait in children.
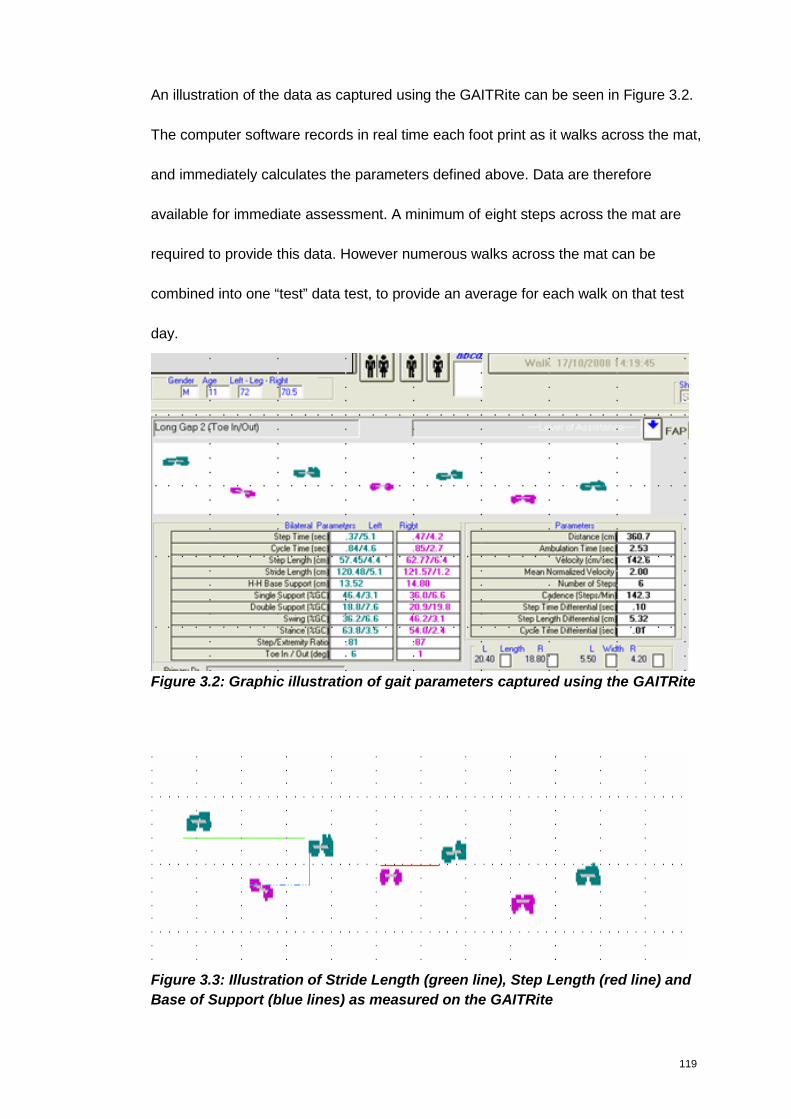
119
An illustration of the data as captured using the GAITRite can be seen in Figure 3.2.
The computer software records in real time each foot print as it walks across the mat,
and immediately calculates the parameters defined above. Data are therefore
available for immediate assessment. A minimum of eight steps across the mat are
required to provide this data. However numerous walks across the mat can be
combined into one “test” data test, to provide an average for each walk on that test
day.
Figure 3.2: Graphic illustration of gait parameters captured using the GAITRite
Figure 3.3: Illustration of Stride Length (green line), Step Length (red line) and
Base of Support (blue lines) as measured on the GAITRite
120
Stride Length, Step Length and Base of Support as measured on the GAITRite are
illustrated in Figure 3.3.
Utilising the normative data captured Alderson developed reference centile curves to
show the distribution of measurements as each of the gait parameter change
according to age. The gait parameters presented are: Velocity (cm/s), Cadence
(steps/ minute), Step Length (cms), Step Time (seconds), Single Support (% of gait
cycle), Double Support (% of gait cycle), and Base of Support (cms). The changes
observed in gait parameters, as age increases are as follows:
a consistent and gradual increase in Velocity,
a large variability at 4 years, which decreases by 14 years in Cadence,
a consistent increase across all ages in Step Length
a large variability at 4 years, which narrows by 14 years in Step Time
an overall stability in Double Support and Single Support
a large variability at 4 years, which narrows gradually by 14 years in Base
of Support.
These centiles were developed according to the LMS method, which summarises
the changing distribution by three curves representing the median (M), coefficient of
variation (S) and skewness (L), the latter expressed as a Box-Cox power. Using
penalised likelihood the three curves are fitted as cubic splines by non-linear
regression, and the extent of smoothing required can be expressed in terms of
smoothing parameters or equivalent degrees of freedom, a method developed by
Cole and Green (Cole & Green 1992). A big advantage of the LMS centiles is that is
allows for a graphic illustration of where each child functions, according to their age.
121
Walking may also be compromised by pathologies of the musculoskeletal and
cardio-respiratory systems. In this respect, Velocity and Cadence have been
measured in an assessment known as the 6-minute walk test (6MWT) as a means
of measuring cardiovascular endurance. Patients are asked to walk for 6 minutes in
laps of 30-50m in length on flat, hard ground with a portable pulse oxymeter
attached to the wrist to record pulse rate and oxygen saturation at baseline and then
every minute during the test, and for three minutes after the test has been
completed. The 6MWT allows the assessment of physiological changes during
exercise performed in a given time, and was developed to predict functional capacity.
The 6MWT has been demonstrated to be safe, easy to perform and highly
acceptable (Geiger et al. 2010). However, children with cognitive deficits or
behavioural challenges may be less likely to follow the instructions (e.g., they may
run, skip or gallop). Lack of motivation and boredom may also affect 6MWT
performance in children.
As noted in Chapter 1, the 6MWT was utilised as a primary outcome in registration-
directed studies for MPS I, MPS II and Pompe disease. In MPS the 6MWT has been
used to provide clinically relevant information about the global severity of the
disease. In patients with MPS II however, an impaired 6MWT may be secondary to
dysfunction of pulmonary, cardiovascular, musculoskeletal joint movement, and
even neurological involvement. It would be very difficult to extract which of these
pathologies impact the most on the 6MWT function. The impact of neurological
122
involvement, in relation to the other more prominent features would be particularly
difficult to ascertain.
More recently however the value of using the 6MWT in neuromuscular diseases has
also been explored. It was proved to be reliable and feasible in myotonic dystrophy
type I (Kierkegaard & Tollback 2007) and more recently it was demonstrated to be
feasible, safe and reproducible in documenting disease-related limitation on
ambulation; the authors propose it as a new out-come measure for Duchenne
Muscular Dystrophy (DMD) natural history and therapeutic trials (McDonald et al.
2010). In this study, the findings demonstrated that walking distance and walking
velocity were substantially lower in boys with DMD compared to healthy boys; on
average, values were ~60% of the average stride length observed in healthy
controls. The difference in walking distance, walking velocity and stride length
between the groups were highly statistically significant (p<0.0001). Cadence was
only slightly lower in subjects with DMD but was much more variable. Understanding
this variability is important if the use of 6MWT in this condition is to be utilised further.
That is, Cadence alone, may not be appropriate as a suitable parameter to monitor
response to therapy (McDonald et al. 2010).
The 6MWT does have the advantage that is has already been accepted by the
regulatory authorities as a valid end point in clinical trials. However the value of the
6MWT in clinical management of MPS II patients has been questioned by Wood et
al (2007), where younger patients, and those with neurological involvement and the
electronic walkway GAITRite proposed as a more valuable tool (Wood et al. 2009).
123
Due to the fact that the GAITRite assessment requires the child to comply with the
assessment for a much shorter time it is an attractive alternative – particularly in
some of the MPS diseases where behavioural issues can be problematic to manage.
The GAITRIte has also been successfully used to monitor the response of MPS I
patients to transplantation (Dusing et al. 2007). Furthermore, in a recent concept
paper on the clinical investigations of medicinal products for the treatment of
pulmonary arterial hypertension, expert opinion stated that the validity and utility of
the 6MWT as an endpoint is limited in patients younger than 6 years, and that its
predictive value on the long term improvement of the disease is not established in
the adult population, questioning its usefulness in the paediatric population over 6
years (Committee for Medicinal Products for Human Use & (CHMP) 2009).
Given the clinical presentation of an ataxic gait as described above; widened base,
shortening of steps and spending more time on both feet, gait parameter other than
Cadence and Velocity alone are also hypothesised to be valuable in defining the gait
of NGD patients. The 6MWT was not considered sensitive enough to fully define
these parameters. Apart from the work of Alderson (2007) six other studies, have
successfully used the GAITRite to assess gait abnormality of children with various
conditions - Hydrocephalus (Shore et al. 2005), Haemophilia (Bladen et al. 2007),
Autism (Rinehart et al. 2006), Cerebral Palsy, (Wondra et al. 2007), and MPS I post
transplant (Dusing et al. 2007), MPS II on ERT (Wood et al. 2009). This suggested
the value of the GAITRite as a worthwhile assessment tool. On the basis of the
above, the availability of normative gait parameters as referenced, the economical
advantages compared to other gait assessments and the ease of use, the GAITRite
124
was selected as the appropriate assessment to attempt to define the gait
characteristics of NGD patients, and to explore its potential value in defining disease
involvement.
3.2. Methods
3.2.1 GAITRite Protocol of use
The European GAITRite Network Group approved guidelines for clinicians
implementing spatio-temporal gait analysis in a bid to enhance reproducibility of gait
measures and improve comparability of outcomes (Kressig & Beauchet 2005).
These guidelines, which were developed for adults, were used in the absence of any
specific paediatric guidelines. However, gait analysis in association with
simultaneous cognitive tasks (dual-tasking) was not performed, as this was not
deemed appropriate.
For the purpose of this study the above guidelines were used. Subjects were
measured walking at their preferred pace; in four consecutives walks. Occasionally,
encouragement (e.g parents either end of the mat with treats saying “keep going”,
“you are doing well”) were necessary to keep the children interested and motivated.
Height and leg length (measured from the anterior superior iliac spine to medial
malleolus) in centimetres was also measured.
As ataxia is more pronounced in bare feet assessments (Eisenhardt 1996) were
conducted without shoes when safe for the child to do so. Only children that were
able to safely comply were requested to walk on the mat.
125
Children with Type I Gaucher disease were recruited to act as an additional control
group to the normative data already available. Despite the availability of published
normative data (and centiles) the rationale for recruiting the Type I Gaucher patients
was to demonstrate that any abnormalities of gait seen in the NGD cohort would be
secondary to neurological involvement, and not visceral involvement. Bone pain and
splenomegaly, for example would also impact on gait. As the Type I Gaucher
patients endure the same visceral manifestations they were regarded as an
appropriate cohort to make these distinctions.
3.3 Results
Each patient performed the walk four times, barefoot as per The European GAITRite
Network guideline. All four walks were then combined, using the GAITRite software
to provide one set of results. Data was examined to ensure symmetry between left
and right leg, and then combined to provide one data set per parameter, per patient.
Parameters captured were based on those studied by Alderson (2007): Velocity
(cm/s), Normalised Velocity, Cadence (steps/ minute), Step Length (cms), Step
Time (seconds), Single Support (% of Gait Cycle), Double Support (% of Gait Cycle),
and Base of Support (cms).
Fourteen patients with Gaucher disease were recruited in total to walk on the
GAITRite. The Control group consisted of five Type I Gaucher patients. The mean
age at assessment was 10.6 years (±3.4). Their height was 142.3 cms (±21.4) and
leg length 68.6 cms (±11.1). Four of the Type I patients were boys, with only one girl.
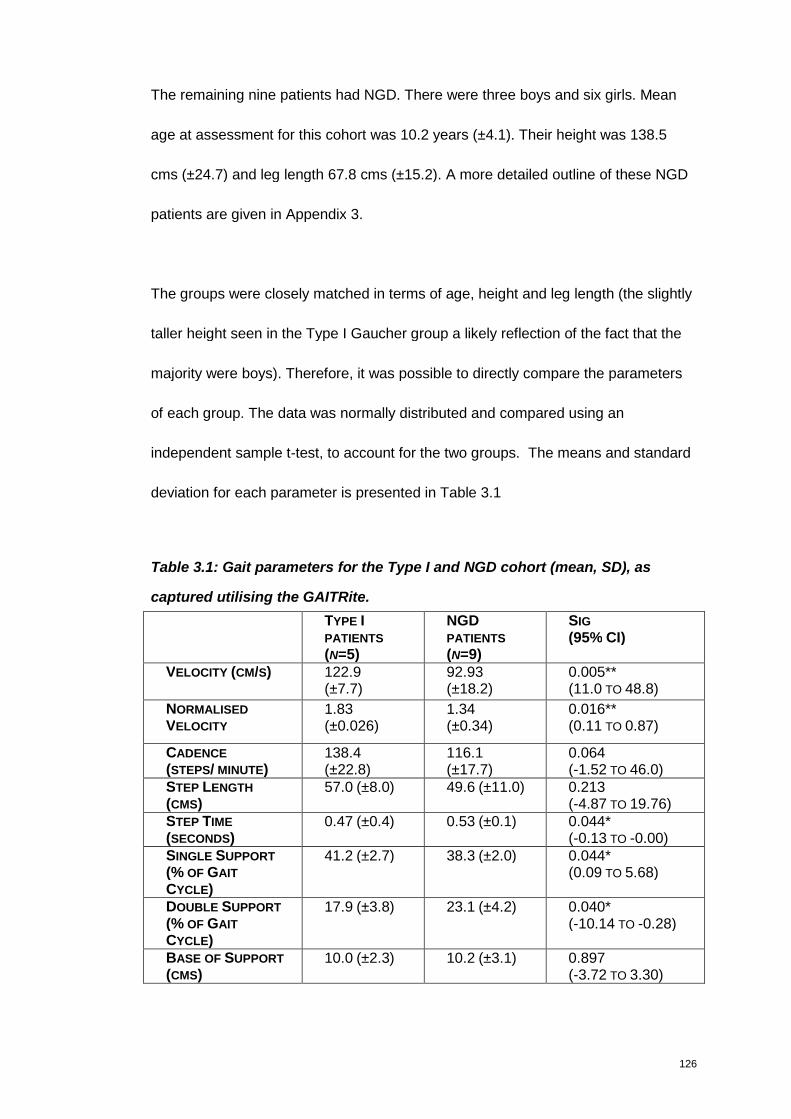
126
The remaining nine patients had NGD. There were three boys and six girls. Mean
age at assessment for this cohort was 10.2 years (±4.1). Their height was 138.5
cms (±24.7) and leg length 67.8 cms (±15.2). A more detailed outline of these NGD
patients are given in Appendix 3.
The groups were closely matched in terms of age, height and leg length (the slightly
taller height seen in the Type I Gaucher group a likely reflection of the fact that the
majority were boys). Therefore, it was possible to directly compare the parameters
of each group. The data was normally distributed and compared using an
independent sample t-test, to account for the two groups. The means and standard
deviation for each parameter is presented in Table 3.1
Table 3.1: Gait parameters for the Type I and NGD cohort (mean, SD), as
captured utilising the GAITRite.
TYPE IPATIENTS
(N=5)
NGDPATIENTS
(N=9)
SIG
(95% CI)
VELOCITY (CM/S) 122.9(±7.7)
92.93(±18.2)
0.005**(11.0 TO 48.8)
NORMALISED
VELOCITY
1.83(±0.026)
1.34(±0.34)
0.016**(0.11 TO 0.87)
CADENCE
(STEPS/ MINUTE)138.4(±22.8)
116.1(±17.7)
0.064(-1.52 TO 46.0)
STEP LENGTH
(CMS)57.0 (±8.0) 49.6 (±11.0) 0.213
(-4.87 TO 19.76)STEP TIME
(SECONDS)0.47 (±0.4) 0.53 (±0.1) 0.044*
(-0.13 TO -0.00)SINGLE SUPPORT
(% OF GAIT
CYCLE)
41.2 (±2.7) 38.3 (±2.0) 0.044*(0.09 TO 5.68)
DOUBLE SUPPORT
(% OF GAIT
CYCLE)
17.9 (±3.8) 23.1 (±4.2) 0.040*(-10.14 TO -0.28)
BASE OF SUPPORT
(CMS)10.0 (±2.3) 10.2 (±3.1) 0.897
(-3.72 TO 3.30)
127
Out of the eight parameters measured (including Normalised Velocity), a statistically
significant difference was noted in five. The difference in Velocity was particularly
significant at p0.005. The variability for Velocity in the NGD cohort was more than
twice that seen in the Type I cohort.
The gait pattern of the NGD cohort appear to differ from that of the Type I Gaucher
cohort in the amount of time spent in double support, at 5.2% longer (p0.040).
Conversely, the NGD cohort spends 2.9% less of the gait cycle in single support (p
0.044). Step time in seconds was also longer, and statistically significant (p0.044).
Despite the fact that the groups were closely matched in terms of height in this case,
the impact of height on gait and balance needs to be considered.
Although the mean age for both cohorts in this study was 10 years, and therefore
older than the 7 years cut off where essentially adult value gait parameters are
reached (Zijlstra et al. 1994), for completion however velocity data was normalised
according to the Alderson (2007) (Velocity / Leg Length). The mean Normalised
Velocity for the Type I cohort was 1.83 (±0.03) compared to 1.34 (±0.03) in the NGD
cohort. The statistical significance observed in Velocity without normalising is
maintained with normalisation p 0.016**. This indicates that there is no benefit to be
gained from normalising data in this cohort, particularly as the LMS centiles are
available.
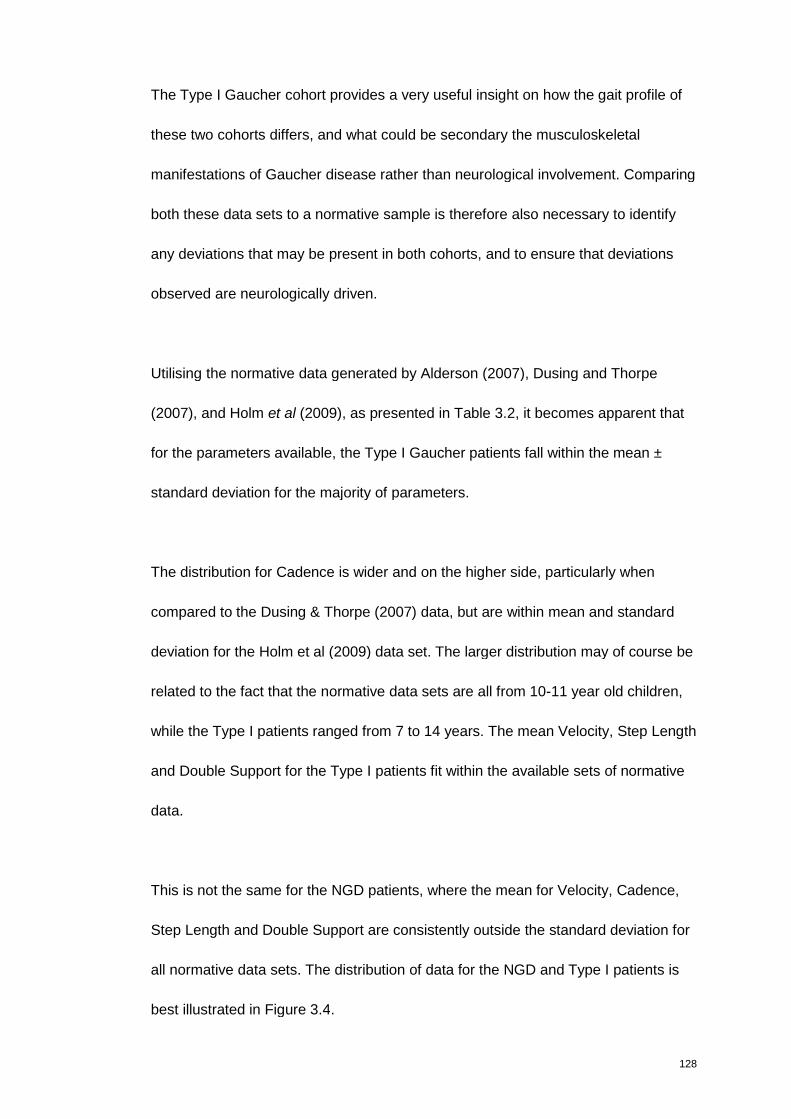
128
The Type I Gaucher cohort provides a very useful insight on how the gait profile of
these two cohorts differs, and what could be secondary the musculoskeletal
manifestations of Gaucher disease rather than neurological involvement. Comparing
both these data sets to a normative sample is therefore also necessary to identify
any deviations that may be present in both cohorts, and to ensure that deviations
observed are neurologically driven.
Utilising the normative data generated by Alderson (2007), Dusing and Thorpe
(2007), and Holm et al (2009), as presented in Table 3.2, it becomes apparent that
for the parameters available, the Type I Gaucher patients fall within the mean ±
standard deviation for the majority of parameters.
The distribution for Cadence is wider and on the higher side, particularly when
compared to the Dusing & Thorpe (2007) data, but are within mean and standard
deviation for the Holm et al (2009) data set. The larger distribution may of course be
related to the fact that the normative data sets are all from 10-11 year old children,
while the Type I patients ranged from 7 to 14 years. The mean Velocity, Step Length
and Double Support for the Type I patients fit within the available sets of normative
data.
This is not the same for the NGD patients, where the mean for Velocity, Cadence,
Step Length and Double Support are consistently outside the standard deviation for
all normative data sets. The distribution of data for the NGD and Type I patients is
best illustrated in Figure 3.4.
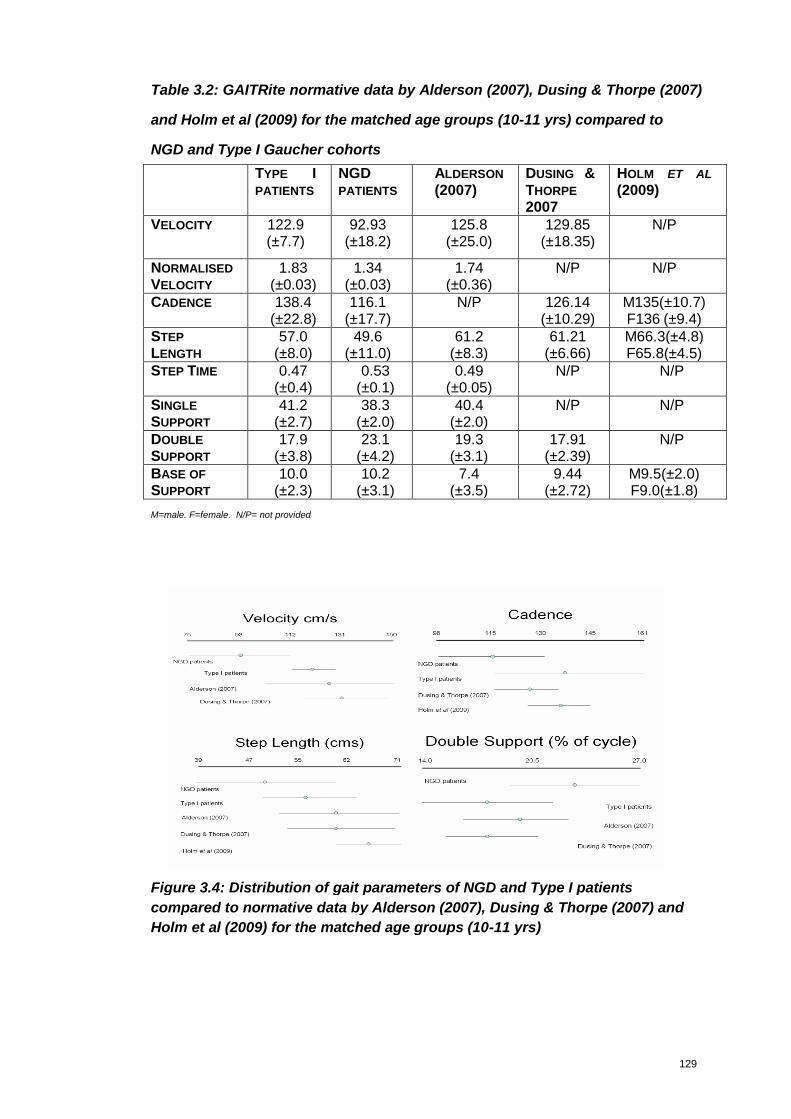
129
Table 3.2: GAITRite normative data by Alderson (2007), Dusing & Thorpe (2007)
and Holm et al (2009) for the matched age groups (10-11 yrs) compared to
NGD and Type I Gaucher cohorts
TYPE IPATIENTS
NGDPATIENTS
ALDERSON
(2007)DUSING &THORPE
2007
HOLM ET AL
(2009)
VELOCITY 122.9(±7.7)
92.93(±18.2)
125.8(±25.0)
129.85(±18.35)
N/P
NORMALISED
VELOCITY
1.83(±0.03)
1.34(±0.03)
1.74(±0.36)
N/P N/P
CADENCE 138.4(±22.8)
116.1(±17.7)
N/P 126.14(±10.29)
M135(±10.7)F136 (±9.4)
STEP
LENGTH
57.0(±8.0)
49.6(±11.0)
61.2(±8.3)
61.21(±6.66)
M66.3(±4.8)F65.8(±4.5)
STEP TIME 0.47(±0.4)
0.53(±0.1)
0.49(±0.05)
N/P N/P
SINGLE
SUPPORT
41.2(±2.7)
38.3(±2.0)
40.4(±2.0)
N/P N/P
DOUBLE
SUPPORT
17.9(±3.8)
23.1(±4.2)
19.3(±3.1)
17.91(±2.39)
N/P
BASE OF
SUPPORT
10.0(±2.3)
10.2(±3.1)
7.4(±3.5)
9.44(±2.72)
M9.5(±2.0)F9.0(±1.8)
M=male. F=female. N/P= not provided
Figure 3.4: Distribution of gait parameters of NGD and Type I patients
compared to normative data by Alderson (2007), Dusing & Thorpe (2007) and
Holm et al (2009) for the matched age groups (10-11 yrs)
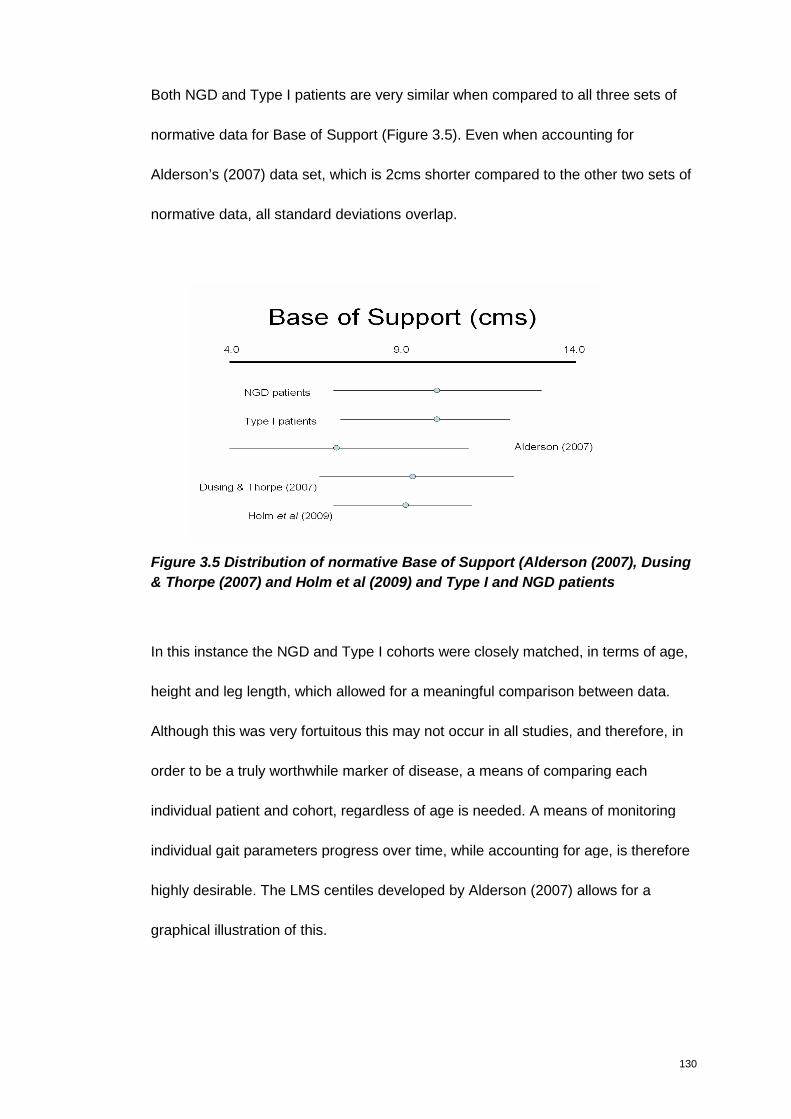
130
Both NGD and Type I patients are very similar when compared to all three sets of
normative data for Base of Support (Figure 3.5). Even when accounting for
Alderson’s (2007) data set, which is 2cms shorter compared to the other two sets of
normative data, all standard deviations overlap.
Figure 3.5 Distribution of normative Base of Support (Alderson (2007), Dusing
& Thorpe (2007) and Holm et al (2009) and Type I and NGD patients
In this instance the NGD and Type I cohorts were closely matched, in terms of age,
height and leg length, which allowed for a meaningful comparison between data.
Although this was very fortuitous this may not occur in all studies, and therefore, in
order to be a truly worthwhile marker of disease, a means of comparing each
individual patient and cohort, regardless of age is needed. A means of monitoring
individual gait parameters progress over time, while accounting for age, is therefore
highly desirable. The LMS centiles developed by Alderson (2007) allows for a
graphical illustration of this.
131
3.3.1 LMS gait centiles
Alderson (2007) studied 138 children between the ages of four and fourteen to
establish normative data and developmental trends in a population of healthy
children. There were at least 10 children for each year from 4 to 13 years, and 6
children recruited aged 14 years. Utilising this data Alderson (2007) developed gait
parameter centiles. They provide a 3rd, 10th, 25th, Median, 75th, 90th and 97th centile
for children from 4 to 14 years of age. The charts have the potential to have a
valuable clinical application (Alderson 2007).
Plotting the Gaucher data on the LMS centiles provides a graphic illustration of how
the Type 1 cohort (red squares) differentiate from the NGD cohort (blue triangles).
Velocity - Gaucher cohort
20
40
60
80
100
120
140
160
180
200
3 5 7 9 11 13 15
Age (years)
Ve
loc
ity
(cm
/s)
97th
90th
75th
Median
25th
10th
3rd
NGD cohort
Gaucher Type I
Figure 3.6: Velocity parameter of Gaucher children plotted on centile
In the Velocity parameter, it can be clearly seen that all the NGD cohort are well
below the median line and seven are below the 25th centile. There is one Type I
Gaucher patient also on the 25th centile line; this 13.8 year old boy had previously
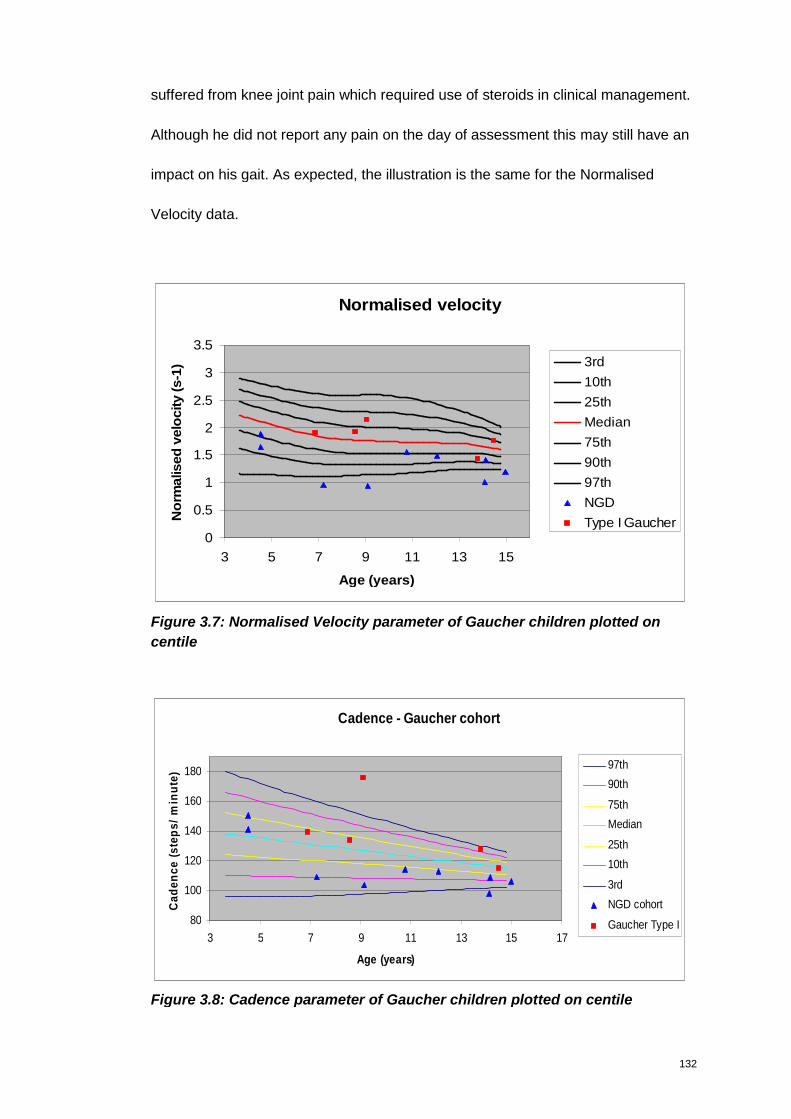
132
suffered from knee joint pain which required use of steroids in clinical management.
Although he did not report any pain on the day of assessment this may still have an
impact on his gait. As expected, the illustration is the same for the Normalised
Velocity data.
Normalised velocity
0
0.5
1
1.5
2
2.5
3
3.5
3 5 7 9 11 13 15
Age (years)
No
rmalised
velo
city
(s-1
) 3rd
10th
25th
Median
75th
90th
97th
NGD
Type I Gaucher
Figure 3.7: Normalised Velocity parameter of Gaucher children plotted on
centile
Cadence - Gaucher cohort
80
100
120
140
160
180
3 5 7 9 11 13 15 17
Age (years)
Ca
de
nc
e(s
tep
s/
min
ute
)
97th
90th
75th
Median
25th
10th
3rd
NGD cohort
Gaucher Type I
Figure 3.8: Cadence parameter of Gaucher children plotted on centile

133
While exploring the Gaucher data plotted on the Cadence centile it is apparent again
that seven of the nine NGD patients fall below the 25th centiles. The two NGD
patients that were above the median were the youngest two, male twins. The 9 year
old Type I Gaucher, who evidently stands above the norm, took numerous short,
fast steps. There was no apparent reason for this.
Before plotting the following gait parameters on the LMS centiles, left and right leg
data were checked for any asymmetry. None of the patients were noted to have a
significant asymmetry; therefore a mean number for left and right leg was calculated
for ease of use.
Step Length - Gaucher cohort
25
35
45
55
65
75
85
3 5 7 9 11 13 15
Age (years)
Ste
pL
en
gth
(cm
s)
97th
90th
75th
Median
25th
10th
3rd
NGDcohortType 1Gaucher
Figure 3.9: Step Length parameter of Gaucher children plotted on centile
Given that there was no statistical difference between the NGD and Type I cohort for
Step Length it is not surprising that there is no apparent pattern of distribution on the
Leg Length LMS centile.
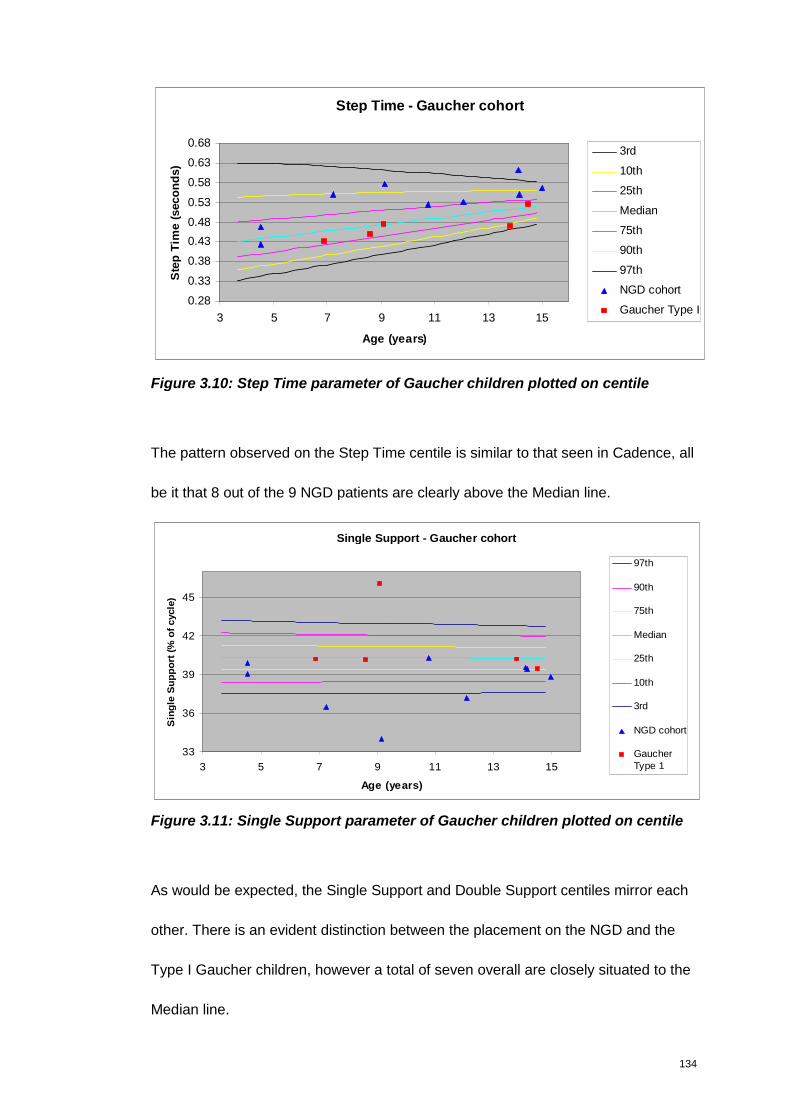
134
Step Time - Gaucher cohort
0.28
0.33
0.38
0.43
0.48
0.53
0.58
0.63
0.68
3 5 7 9 11 13 15
Age (years)
Ste
pT
ime
(seco
nd
s)
3rd
10th
25th
Median
75th
90th
97th
NGD cohort
Gaucher Type I
Figure 3.10: Step Time parameter of Gaucher children plotted on centile
The pattern observed on the Step Time centile is similar to that seen in Cadence, all
be it that 8 out of the 9 NGD patients are clearly above the Median line.
Single Support - Gaucher cohort
33
36
39
42
45
3 5 7 9 11 13 15
Age (years)
Sin
gle
Su
pp
ort
(%o
fcycle
)
97th
90th
75th
Median
25th
10th
3rd
NGD cohort
GaucherType 1
Figure 3.11: Single Support parameter of Gaucher children plotted on centile
As would be expected, the Single Support and Double Support centiles mirror each
other. There is an evident distinction between the placement on the NGD and the
Type I Gaucher children, however a total of seven overall are closely situated to the
Median line.
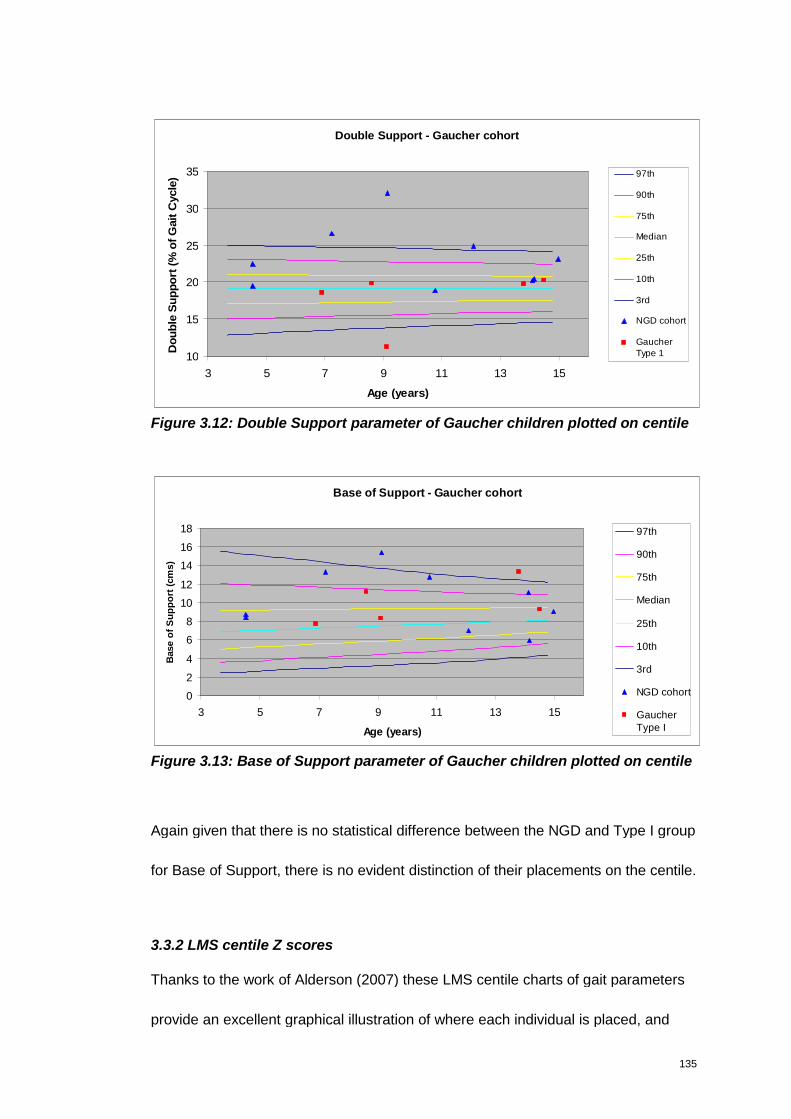
135
Double Support - Gaucher cohort
10
15
20
25
30
35
3 5 7 9 11 13 15
Age (years)
Do
ub
leS
up
po
rt(%
of
Gait
Cycle
) 97th
90th
75th
Median
25th
10th
3rd
NGD cohort
GaucherType 1
Figure 3.12: Double Support parameter of Gaucher children plotted on centile
Base of Support - Gaucher cohort
0
2
4
6
8
10
12
14
16
18
3 5 7 9 11 13 15
Age (years)
Base
of
Su
pp
ort
(cm
s)
97th
90th
75th
Median
25th
10th
3rd
NGD cohort
GaucherType I
Figure 3.13: Base of Support parameter of Gaucher children plotted on centile
Again given that there is no statistical difference between the NGD and Type I group
for Base of Support, there is no evident distinction of their placements on the centile.
3.3.2 LMS centile Z scores
Thanks to the work of Alderson (2007) these LMS centile charts of gait parameters
provide an excellent graphical illustration of where each individual is placed, and
136
also how different grouping may appear between cohorts. However a numeric
representation which maintains the relationship to age would be a better marker.
Although this work had not been done by Alderson (2007) by obtaining the original
data that created the LMS centiles, it was possible to generate this in the form of Z
scores. Permission was obtained by Alderson to conduct this work.
Z scores or standard deviation scores as also known, of a child’s measurement (y)
are calculated from the L, M and S curves, using values appropriate for the child’s
age. Two formulae are relevant depending on the value of L (Huiqi & Cole 2005).
The formulae are:
Z = (y /M) L – 1, if L ≠ 0
L x S
Z = log(y /M) L – 1, if L = 0
S
Using these formulae therefore an individual Z score has been calculated for each
child, for each of the gait parameters studied. Scores range from -1 to 1. A minus
score indicating that the child is performing below the median.
The calculated Z score can be seen in Table 3.3. The normal distribution that was
present with the raw data is lost in conversion to Z scores, therefore only non-
parametric tests were used to assess statistical significance.

137
It becomes apparent that the parameters which were statistically significant in the
group comparison remain statistically significant when using the Z scores. However,
when using the Z scores, the gait parameter Cadence becomes statistically
significant (p0.028) while it had previously been borderline p0.064. The strength of
the statistical significance for Step Time is also greatly improved while using the Z
scores. This indicates that the Z scores may offer greater sensitivity compared to
utilising the raw data alone, for these parameters in particular.
Table 3.3: Z score for all gait parameters assessed in the NGD and Type I
Gaucher patients.
Type I NGD Sig. P.
Velocity
Z score
0.00243
(±0.011)
-0.04049
(±0.026)
0.004**
Normalised Velocity
Z score
0.0107
(±0.02)
-0.0683
(±0.076)
0.009**
Cadence
Z score
0.01289
(±0.02)
-0.00457
(±0.01)
0.028**
Step Length
Z score -0.00485 (±0.008)
-0.01736
(±0.014)
0.072
Step Time
Z score -0.0034 (±0.004)
0.00736
(±0.007)
0.006**
Single Support
Z score 0.0008 (±0.0023)
-0.0016
(±0.0017)
0.033*
Double Support
Z score -0.0096 (±0.0287)
0.0286
(±0.0300)
0.039*
Base of Support
Z score 0.1182 (±0.071)0.0850 (±0.071)
0.739
** highly significant * statistically significant

138
3.3.3 Sequential data
As discussed in the development of the mSST, for an assessment tool to be truly
valuable it needs to have the ability to be “responsive to change”. This is assessed
through sequential assessments.
Four NGD patients consented to have sequential NGD assessment of gait, using the
GAITRite. Unfortunately, the eldest three NGD patients are now too old for the LMS
centiles, and therefore would not be useful. Sadly one patient passed away. This
makes the number of patients suitable and available for sequential assessment
small.
The four consenting patients that had sequential GAITRite assessments were three
girls and one boy. The two eldest (Patients 3 and 4) are L444P homozygote. The
other two were heterozygote with rare mutations.
Time interval between assessments ranged from 3 months to 15 months, again
depending on the dates which the children were attending routine appointments at
the hospital. Two patients were assessed on two occasions, and two assessed on
three occasions. The children’s age ranged from 7 years 2 months to 12 years 1
month at first assessment, to 7 years 5 months to 13 years 5 months at the last
assessment.
Through plotting the sequential gait parameters on the LMS centiles it becomes
apparent that there is not specific pattern or trend to be seen. Indeed the data is
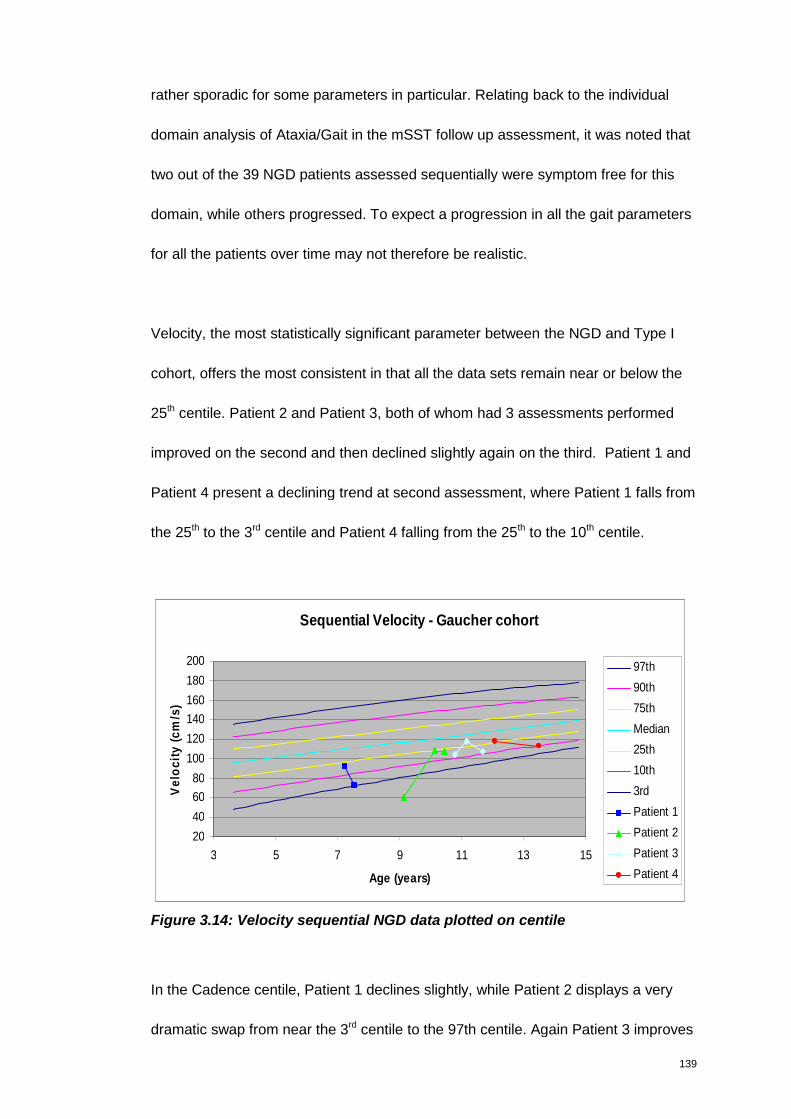
139
rather sporadic for some parameters in particular. Relating back to the individual
domain analysis of Ataxia/Gait in the mSST follow up assessment, it was noted that
two out of the 39 NGD patients assessed sequentially were symptom free for this
domain, while others progressed. To expect a progression in all the gait parameters
for all the patients over time may not therefore be realistic.
Velocity, the most statistically significant parameter between the NGD and Type I
cohort, offers the most consistent in that all the data sets remain near or below the
25th centile. Patient 2 and Patient 3, both of whom had 3 assessments performed
improved on the second and then declined slightly again on the third. Patient 1 and
Patient 4 present a declining trend at second assessment, where Patient 1 falls from
the 25th to the 3rd centile and Patient 4 falling from the 25th to the 10th centile.
Sequential Velocity - Gaucher cohort
20
40
60
80
100
120
140
160
180
200
3 5 7 9 11 13 15
Age (years)
Ve
loc
ity
(cm
/s)
97th
90th
75th
Median
25th
10th
3rd
Patient 1
Patient 2
Patient 3
Patient 4
Figure 3.14: Velocity sequential NGD data plotted on centile
In the Cadence centile, Patient 1 declines slightly, while Patient 2 displays a very
dramatic swap from near the 3rd centile to the 97th centile. Again Patient 3 improves
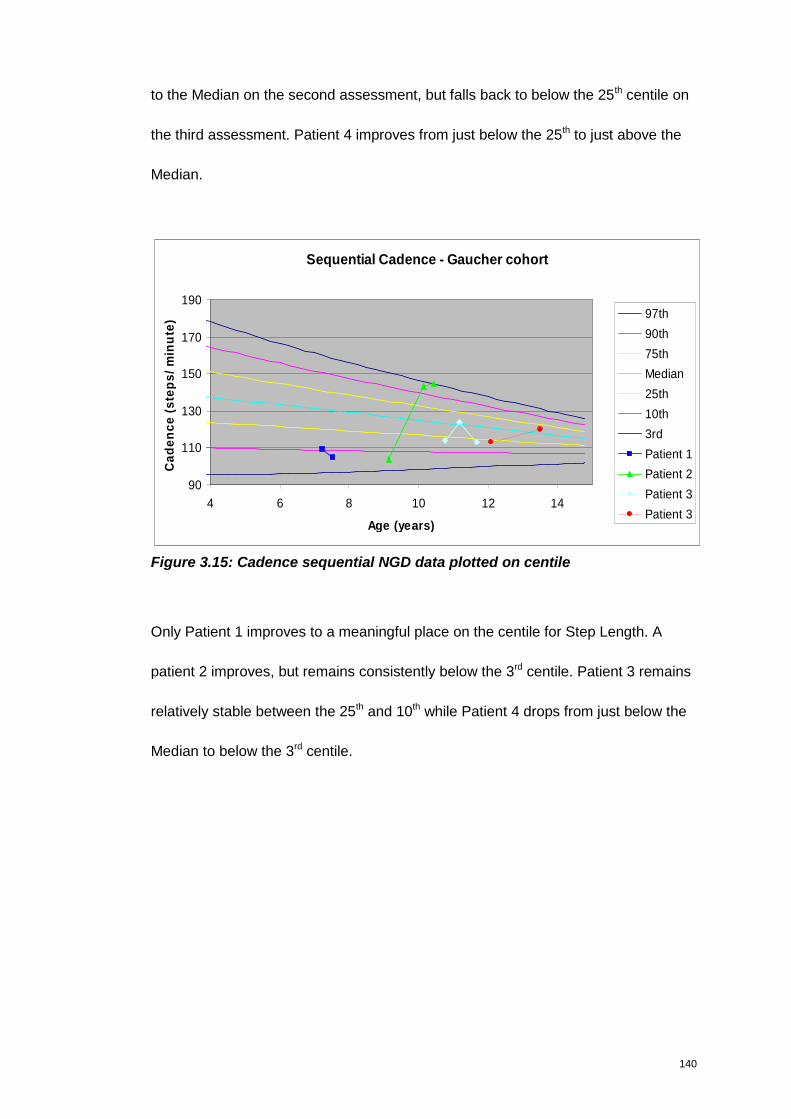
140
to the Median on the second assessment, but falls back to below the 25th centile on
the third assessment. Patient 4 improves from just below the 25th to just above the
Median.
Sequential Cadence - Gaucher cohort
90
110
130
150
170
190
4 6 8 10 12 14
Age (years)
Ca
de
nc
e(s
tep
s/
min
ute
) 97th
90th
75th
Median
25th
10th
3rd
Patient 1
Patient 2
Patient 3
Patient 3
Figure 3.15: Cadence sequential NGD data plotted on centile
Only Patient 1 improves to a meaningful place on the centile for Step Length. A
patient 2 improves, but remains consistently below the 3rd centile. Patient 3 remains
relatively stable between the 25th and 10th while Patient 4 drops from just below the
Median to below the 3rd centile.
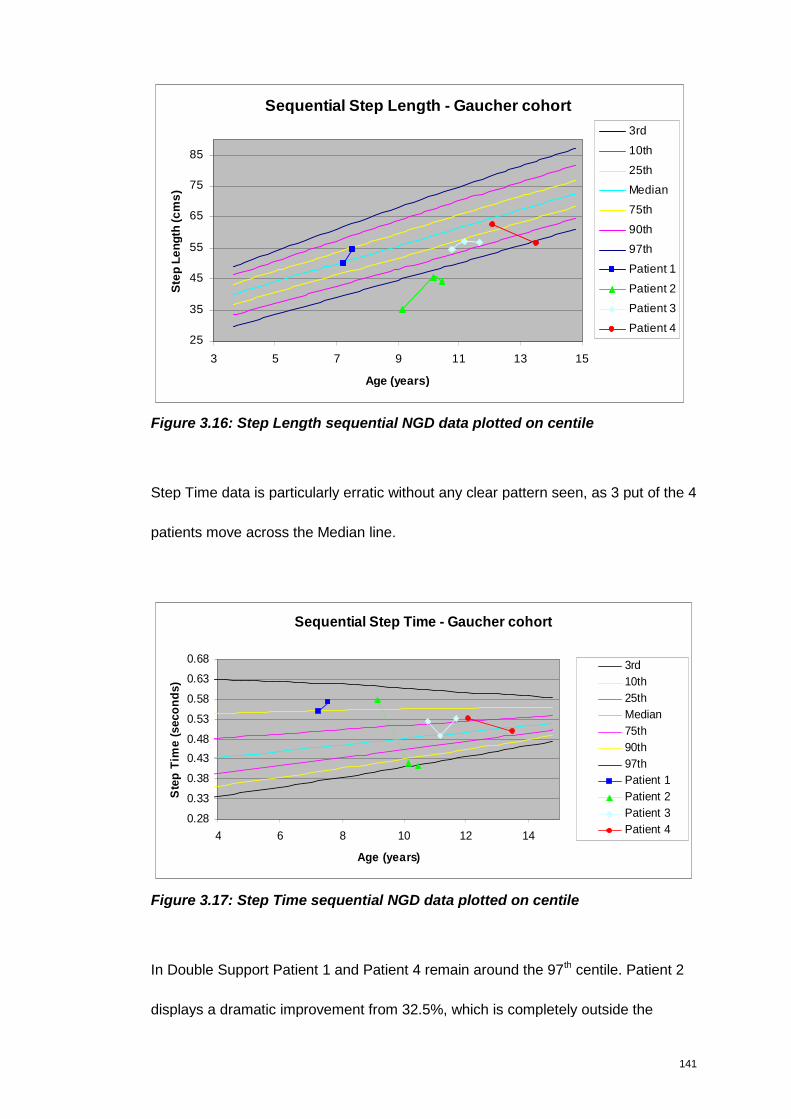
141
Sequential Step Length - Gaucher cohort
25
35
45
55
65
75
85
3 5 7 9 11 13 15
Age (years)
Ste
pL
en
gth
(cm
s)
3rd
10th
25th
Median
75th
90th
97th
Patient 1
Patient 2
Patient 3
Patient 4
Figure 3.16: Step Length sequential NGD data plotted on centile
Step Time data is particularly erratic without any clear pattern seen, as 3 put of the 4
patients move across the Median line.
Sequential Step Time - Gaucher cohort
0.28
0.33
0.38
0.43
0.48
0.53
0.58
0.63
0.68
4 6 8 10 12 14
Age (years)
Ste
pT
ime
(se
co
nd
s)
3rd
10th
25th
Median
75th
90th
97th
Patient 1
Patient 2
Patient 3
Patient 4
Figure 3.17: Step Time sequential NGD data plotted on centile
In Double Support Patient 1 and Patient 4 remain around the 97th centile. Patient 2
displays a dramatic improvement from 32.5%, which is completely outside the
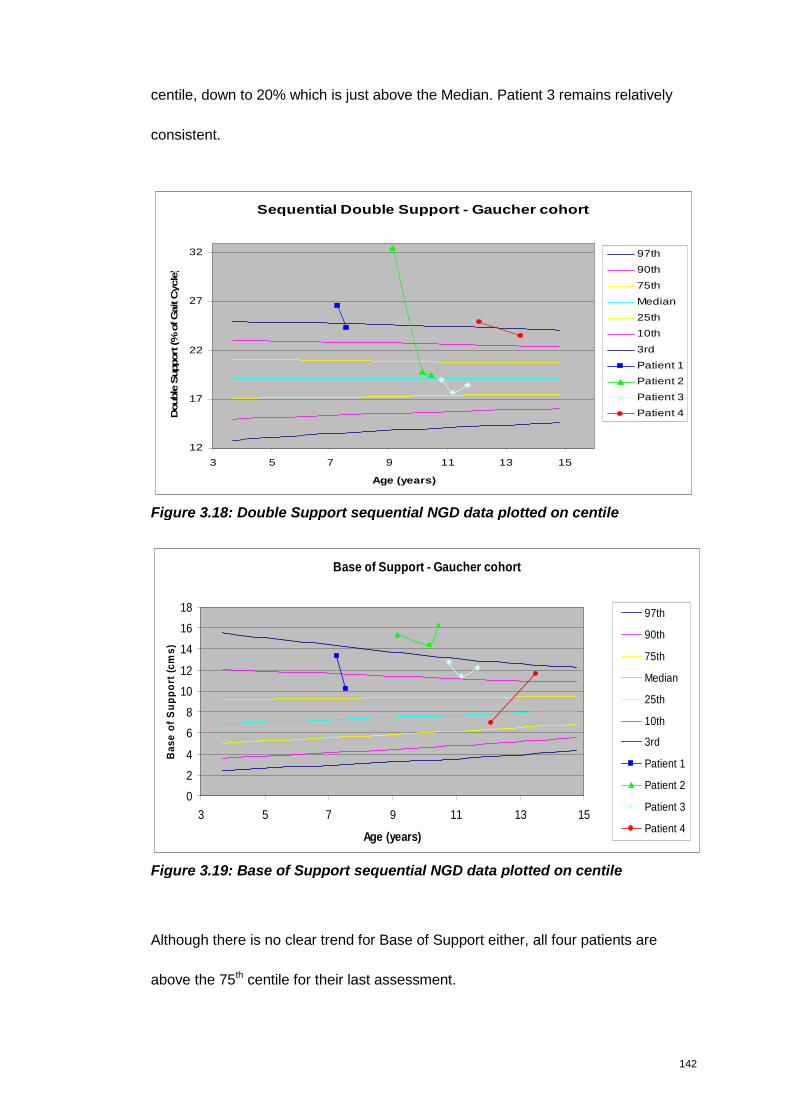
142
centile, down to 20% which is just above the Median. Patient 3 remains relatively
consistent.
Sequential Double Support - Gaucher cohort
12
17
22
27
32
3 5 7 9 11 13 15
Age (years)
Double
Support
(%ofG
ait
Cycle
)
97th
90th
75th
Median
25th
10th
3rd
Patient 1
Patient 2
Patient 3
Patient 4
Figure 3.18: Double Support sequential NGD data plotted on centile
Base of Support - Gaucher cohort
0
2
4
6
8
10
12
14
16
18
3 5 7 9 11 13 15
Age (years)
Ba
se
of
Su
pp
ort
(cm
s)
97th
90th
75th
Median
25th
10th
3rd
Patient 1
Patient 2
Patient 3
Patient 4
Figure 3.19: Base of Support sequential NGD data plotted on centile
Although there is no clear trend for Base of Support either, all four patients are
above the 75th centile for their last assessment.
143
3.4 Discussion
The GAITRite was demonstrated to be a very user friendly assessment tool for the
purpose of measuring gait parameters in Gaucher children. All the children were
able to comply with the assessment easily, and all completed the assessment in
less then 20 minutes time. Statistically significant differences were observed
between the Type I and NGD patients in six of the gait parameters (Z scores). The
NGD cohort also differed to the age-matched normative data of Holm, Alderson and
Dusing & Thorpe (Dusing & Thorpe 2007; Alderson 2007; Holm et al. 2009).
The increased statistical significance observed using the Z score for five of the
parameters, suggests that the Z scores offers greater sensitivity compared to
utilising the raw data alone, particularly for Step Time. These parameters can be
regarded as clinically viable too.
That is, the reduction in Velocity, and increased Step Time, decreases the postural
control requirements during gait, which could be regarded as a compensatory
mechanism, and may explain the altered gait cycle seen. While the shift towards
longer periods in Double Support may be also be strategy to improve stability.
Cadence and Step Length was reduced in the NGD cohort, although not significant
statistically for Step Length. This possibly indicates that the decreased Velocity
observed is driven by the increased Step Time and time spent in Double Support.
144
Clinically it makes sense that children with an ataxic gait spend more time in Double
Support to increase stability and balance. The trend towards a reduced Step Length
and a statistically significant increase in Step Time are also consistent with this. All
these are likely reflect a compromised ability to coordinate movement. Cadence and
Velocity on their own could be a reflection of poor strength of muscle, or even poor
fitness, therefore the incorporation of the other parameters offers a better means of
truly understanding the gait profile of theses children.
In a study of gait disturbances in twelve adult patients with various cerebellar
disorders, a significantly reduced step frequency with a prolonged stance and
double limb support duration was found in patients with cerebellar disorders
compared to age matched controls (Stolze et al. 2002). Stolze (2002) postulated
that the coexistence of variable stride length with variable stride duration (time) may
underpin the clinical features of cerebellar disease, in particular the deficiencies in
adjusting the relative movement of multiple joints. Although this study utilised a
different method for measuring gait, and only studied adults with cerebellar
disorders the findings of prolonged double limb support duration and stride duration
(time) are consistent with the increased double support and step time seen in the
NGD cohort.
An interesting aspect of the data is that the Base of Support of NGD children was
not different to compared to the normative data available and not statistically
different when compared to the Type 1 cohort, with only 0.2cms difference between
145
the two. This is despite frequently documented ‘wide-base of support’ in clinical
reports.
These findings were not expected based on the clinical picture observed. This may
be because the observing eye interprets the increased Double Support time as a
wide Base of Support? Or that the child’s raised arms, used to improve balance,
gives the illusion that Base of Support is also increased.
Despite involving a slightly difference methodology, Stolze (2002) in his study of
adults with cerebellar disorders reported an increased step width, indicating the
need for stability. However, following a study comparing patients with vestibulopathy
and people without any known neuromuscular pathology Krebs et al (2002)
concluded that “wide-based gait alone cannot differentiate between subjects with
and without balance impairments. Base of support and other whole-body kinematic
variables are mechanical compensations of vestibulopathic instability” (Krebs et al.
2002).
On the other had, Alderson (2007) in her study of children peripheral neuropathy
were identified to have a significantly narrower Base of Support than control at
preferred speed. Alderson (2007) proposed that the reduced Base of Support in this
case may reflect musculoskeletal limitations, such as balance imbalance and
restrictions to joint range. Alderson (2007) further postulated that the increased
Double Support, also seen in this cohort of children with peripheral neuropathy may
have compensated for these restrictions, and introduced longer periods of stability
146
into the gait cycle. Overall their walk was slower, with a shorter Step Length. This
reduced Velocity, shorter Step Length and increased Double Support time reported
for the peripheral neuropathy group is similar to the NGD findings. Differently to the
NGD cohort however, the peripheral neuropathy group were identified to have
asymmetrical walking patterns
Alderson (2007) also studied four other different clinical groups in addition to
peripheral neuropathy - muscular dystrophy; developmental coordination; traumatic
brain injury and cerebellar pathology (Alderson 2007).
Children in the cerebellar pathology group showed the most significant alterations in
walking and dynamic balance. Cadence in this group was significantly reduced and
step time increased relative to control. Step Length was significantly shorter with an
increased variation in Step Time relative to control. Single Support was reduced and
Double Support was also increased. These findings are consistent with the gait
pattern seen in the NGD group. Alderson (2007) reports that the cerebellar
pathology group had a significant increase in Base of Support - measuring 9.4 cms
(±4.9). This distance would however be regarded as normal in the Dusing and
Thorpe (2007) and Holm (2009) data set.
The comparison of Type I children with NGD children indicates that the differences
observed in the NGD gait is not secondary to the visceral manifestation of Gaucher
disease, and are probably secondary to central nervous involvement.
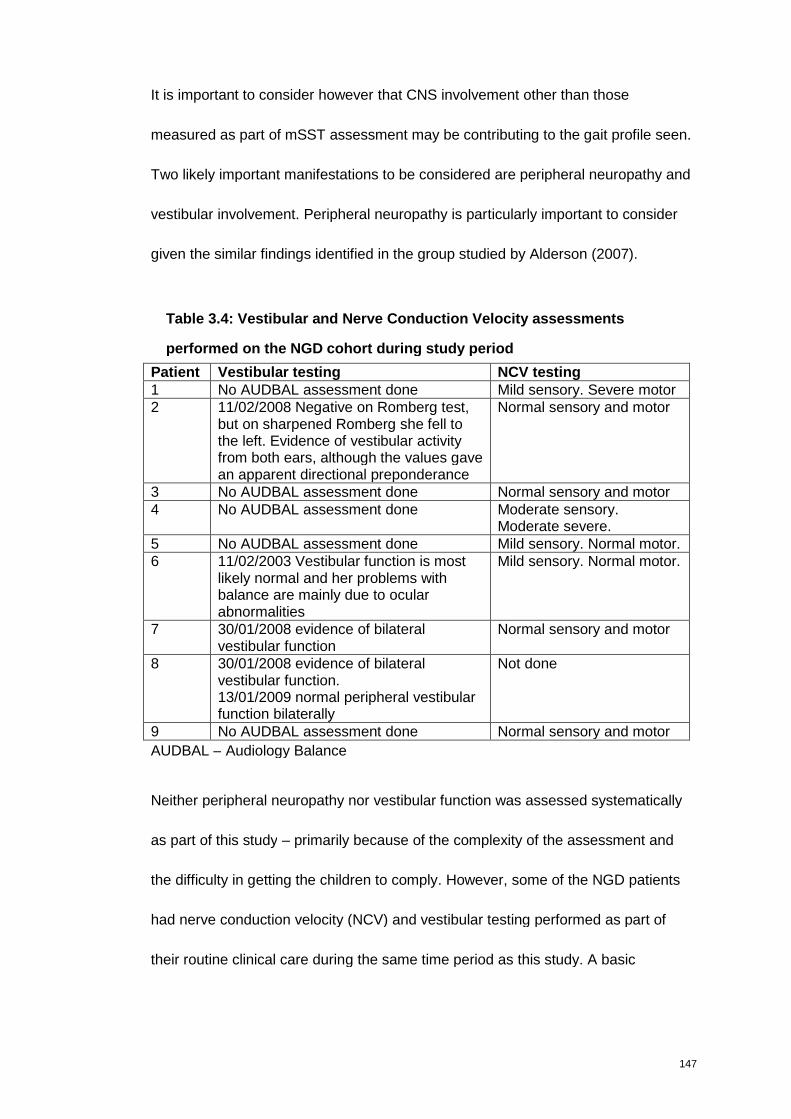
147
It is important to consider however that CNS involvement other than those
measured as part of mSST assessment may be contributing to the gait profile seen.
Two likely important manifestations to be considered are peripheral neuropathy and
vestibular involvement. Peripheral neuropathy is particularly important to consider
given the similar findings identified in the group studied by Alderson (2007).
Table 3.4: Vestibular and Nerve Conduction Velocity assessments
performed on the NGD cohort during study period
Patient Vestibular testing NCV testing1 No AUDBAL assessment done Mild sensory. Severe motor2 11/02/2008 Negative on Romberg test,
but on sharpened Romberg she fell tothe left. Evidence of vestibular activityfrom both ears, although the values gavean apparent directional preponderance
Normal sensory and motor
3 No AUDBAL assessment done Normal sensory and motor4 No AUDBAL assessment done Moderate sensory.
Moderate severe.5 No AUDBAL assessment done Mild sensory. Normal motor.6 11/02/2003 Vestibular function is most
likely normal and her problems withbalance are mainly due to ocularabnormalities
Mild sensory. Normal motor.
7 30/01/2008 evidence of bilateralvestibular function
Normal sensory and motor
8 30/01/2008 evidence of bilateralvestibular function.13/01/2009 normal peripheral vestibularfunction bilaterally
Not done
9 No AUDBAL assessment done Normal sensory and motor
AUDBAL – Audiology Balance
Neither peripheral neuropathy nor vestibular function was assessed systematically
as part of this study – primarily because of the complexity of the assessment and
the difficulty in getting the children to comply. However, some of the NGD patients
had nerve conduction velocity (NCV) and vestibular testing performed as part of
their routine clinical care during the same time period as this study. A basic
148
exploratory review of the data was therefore performed to consider whether of these
could have a significant impact on the gait data (Table 3.4).
Ocular motor deficit (absence of saccades and pursuit) makes it difficult to interpret
the results of vestibular testing, which are based on normal eye movement, however
based on the findings of the limited number of children assessed, a link between
vestibular and the gait profile seen can not be drawn.
More children were assessed with a NCV during the study. Based on the findings,
Consultant Paediatric Neurophysiologist Dr Matthew Pitt was asked to classify
neuropathy involvement (sensory and motor) as normal; mild; moderate and severe.
Although this is a subjective overview it provided an indication of the involvement for
this cohort. These findings indicate that peripheral neuropathy may be a contributing
factor to the gait profile of four out of the eight assessed (three mild, one moderate).
Two of these patients also have moderate and severe motor involvement, which
may also impact on the gait profile seen.
This work has provided a valuable insight to the gait profile of the NGD cohort.
Given that the gait profile of the Type I cohort was identified to be normal, it can be
postulated that the gait deviations observed in NGD are driven by CNS, rather than
somatic pathology. Whether the underlying CNS pathology driving this is cerebellar
ataxia in isolation or in combination with neuropathy is unclear. However, given that
both are progressive in nature, gait analysis remains a valuable assessment tool.
149
The variability and lack of a definite trend observed in the sequential assessments
does make the value of using the GAITRite longitudinally or to assess clinical
interventions or drug therapy difficult however. Variability of gait parameters, and
lack of trend was also evident in the MPS II study previously discussed (Wood et al.
2009).
This lack of trend, as a progression in particular, may be because the duration
between assessments may not be long enough. Follow Up assessment using the
mSST was after a period of 4 years. Naturally, following a larger cohort would also
be more informative. Assessing the Type I patients sequentially would also give an
insight into whether this variability is seen in that cohort as well. Addressing these
issues may enable the value of using GAITRite to monitor progress, rather than
distinguish between cohorts.
150
Chapter 4
Diffusion Tensor Imaging
Exploration is the physical expression of the intellectual passion
- Apsley Cherry Garrad
151
4. Diffusion Tensor Imaging
4.1 Magnetic Resonance Imaging
Magnetic resonance imaging (MRI) uses the body’s natural magnetic properties to
produce detailed images from any part of the body. For imaging purposes the
hydrogen nucleus (a single proton) is used because of its abundance in water and
fat. Diseases can manifest themselves by a change in water signal. There are no
known biological hazards of MRI because, unlike x ray and computed tomography,
MRI uses radiation in the radiofrequency range, which does not damage tissue
(Berger 2002).
MRI has become a virtually indispensable modality in the field of neurology (Lyon et
al. 2006). Some lesions of the brain exist for some time without clinical signs, and
certain lesions of the white matter (i.e., leukodystrophies) and basal ganglia necrosis
may precede the emergence of the characteristic clinical syndrome. Conversely
many neurological problems show no visible changes using MRI or CT scans,
therefore neuroradiological imaging will never replace clinical examination, but the
two can combine effectively to assess patients.
Lesions are now being visualised that previously were known only to pathologists;
and in some diseases, still defined mainly by pathological criteria; in these cases,
neuroradiologic imaging can enable diagnostic confirmation during life. The use of
recently refined techniques, such as MR spectroscopy and diffusion tensor imaging,
MR angiography, positron emission tomography (PET), and single proton emission
computed tomography (SPECT), advances knowledge of the functional aspects of
152
brain pathology. These techniques have enabled the clinician to use living
biopathology in formulating the disease process.
MRI is widely used in children and young adults with suspected brain disease and
offers the opportunity to explore brain structure-function relationships. A number of
MRI approaches offers ways of identifying subtle brain abnormalities that are not
seen on conventional neuroradiological assessment (Rowan et al. 2007).
Brain imaging, preferably MRI is specified as one of the minimum assessment to be
performed at initial assessment of primary neurological involvement in Gaucher
disease. It is also included as part of the minimum follow-up clinical protocol if
clinically indicated, taking into account the risk of anaesthesia if necessary.
Data generated from the MRI data provides objective, quantitative information
(ensuring the same methodology is applied at all times in each individual analysis).
In this respect it offers an advantage over the mSST and GAITRite which may be
vulnerable to the subjective opinions of assessors and the compliance of children,
respectively.
4.1.1 Brain MRI in Gaucher disease
There are few publications that have studied the paediatric Gaucher brain, despite
its inclusion in the revised guidelines for the management of NGD patients (Vellodi
et al. 2009). The literature available report non-specific unilateral cerebral atrophy
153
and dural thickening with contrast enhancement in routine MRI of Type II paediatric
Gaucher brain (Chang et al. 2000).
A recent publication, by Abdel Razek et al (2009), utilised diffusion-weighted MR
imaging to examine the apparent diffusion coefficient in thirteen patients, three Type
II and ten NGD, with an age range of 8 months to 14 years (Abdel Razek et al.
2009). The study examined multiple regions of interest (ROI), which were selected
and manually identified by one expert neuroradiologist who was blinded to the
genotype and clinical presentation of the patient. The results demonstrated
significant lower apparent diffusion coefficient value in the cortical frontal, cortical
temporal, frontal subcortical white matter, corticospinal tract, medulla, midbrain, and
cerebellum of Gaucher patients compared to the controls.
Abdel Razek et al (2009) in their study of apparent diffusion coefficient value in
Gaucher patients using diffusion-weighted imaging, hypothesised that the lower
apparent diffusion coefficient value identified in Gaucher patients compared to
controls may be attributed to the accumulation of Gaucher’s cells within the
parenchyma with subsequent increasing cellularity of the brain parenchyma. Also,
Gaucher cells are lipid-engorged macrophages that contain high amount of fat
resulting in restricted diffusion and consequently lower apparent diffusion coefficient
values.

154
4.1.2 Diffusion Tensor Imaging
Diffusion Tensor Imaging (DTI) is a technique that allows exploration of tissue
microstructure, such as the white matter, as a non-invasive method for evaluating
diffusivity and directionality of water molecules. It is more sensitive in quantifying
structural brain alterations than conventional magnetic resonance techniques.
Pure water has isotropic diffusion properties i.e the same in all directions in space.
The diffusion of water in brain tissue is affected by the local tissue microstructure;
for example, water molecules diffuse more easily along the major axis of a white
matter fibre bundle than perpendicular to it. This type of diffusion behaviour is called
anisotropic. DTI is sensitive to anisotropic diffusion and has been developed as a
tool for investigating the local properties of brain tissues such as white matter tracts
(LeBihan et al. 2001). There has also been a great deal of interest in using scalar
indices derived from the diffusion tensor as markers of white matter tract integrity for
disease diagnosis and tracking disease progression.
DTI specifically probes the random-walk process, known as Brownian motion, which
water molecules undergo. If there are no barriers to this random-walk (or no
preferential direction to the barriers), then there is equal probability that a water
molecule will displace by a given distance in any direction; the scatter pattern is
isotropic (left diagram in Figure 4.1). However, if the water molecule is, inside a
white-matter axon, for example, then the cell walls provide a barrier to diffusion.
This means that the water molecules can travel along the fibre with less resistance
than across it, so the scatter pattern becomes anisotropic (centre diagram in Figure
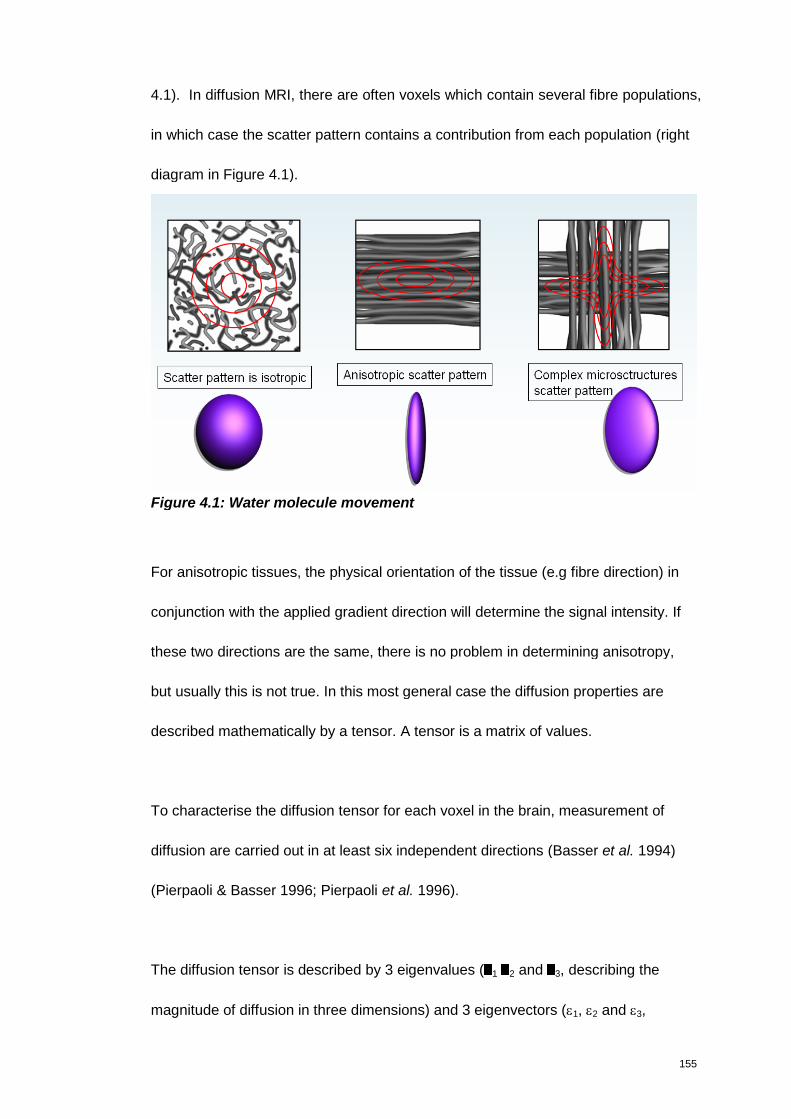
155
4.1). In diffusion MRI, there are often voxels which contain several fibre populations,
in which case the scatter pattern contains a contribution from each population (right
diagram in Figure 4.1).
Figure 4.1: Water molecule movement
For anisotropic tissues, the physical orientation of the tissue (e.g fibre direction) in
conjunction with the applied gradient direction will determine the signal intensity. If
these two directions are the same, there is no problem in determining anisotropy,
but usually this is not true. In this most general case the diffusion properties are
described mathematically by a tensor. A tensor is a matrix of values.
To characterise the diffusion tensor for each voxel in the brain, measurement of
diffusion are carried out in at least six independent directions (Basser et al. 1994)
(Pierpaoli & Basser 1996; Pierpaoli et al. 1996).
The diffusion tensor is described by 3 eigenvalues ( 1 2 and 3, describing the
magnitude of diffusion in three dimensions) and 3 eigenvectors (1, 2 and 3,
156
describing the orientation of the three eigenvalues) and is insensitive to head
orientation and fibre tract alignment in the scanner. From the eigenvalues,
information can be derived about how far diffusion differs from being spherical (i.e.
from the profile of isotropic diffusion). If the principal eigenvalue (by convention 1) is
much greater than 2 or 3 then diffusion is highly non-spherical process (anisotropic)
and the highest diffusion within this voxel will have an orientation along 1. Diffusion
does occur along directions 2 and 3, but to a lesser degree than along 1
(Pierpaoli & Basser 1996).
From these data, images can be produced which represent at the voxel level how
isotropic or anisotropic diffusion is. There are a number of parameters that can be
used to describe the degree of anisotropy at the voxel level, which include mean
diffusivity and fractional anisotropy. The most commonly used one however is
fractional anisotropy (FA). This measure describes how much the diffusion tensor
profile deviates from the sphere. The value of this parameter, ranges from 0 to 1,
can be calculated for each voxel and the results displayed in the form of an FA map
(Pierpaoli & Basser 1996). If the FA is zero, then the diffusion tensor is completely
spherical; if it is one, then the diffusion tensor is a “spike” shape. In addition,
principal eigenvector maps can be derived and colour coded to demonstrate
whether the principle diffusion direction is in the anterior-posterior, left-right or
inferior-superior direction with voxels.
The two popular choices of scalar indices therefore are fractional anisotropy (FA)
and mean diffusivity (MD) (Pierpaoli & Basser 1996). Explained more simply, FA
157
describes the directionality of diffusion; while MD describes the amount of diffusion
in a voxel, regardless of directionality. Both measures are independent of the local
fibre orientation (and therefore a relatively objective and straightforward measure to
compare across subjects). If high diffusion levels occur in white matter, then it is
indicative of poorly developed, immature, or structurally compromised white matter.
High levels of anisotropy are considered a reflection of coherently bundled,
myelinated fibres orientated along the axis of the greatest diffusion (Cascio J.C et al.
2007). Other metrics, such as axial (λaxial) and radial (λradial) diffusivity provide
additional information on whether changes in FA and MD are caused by a change in
diffusivity in the principal direction of diffusion or caused by a change in diffusivity in
a perpendicular direction respectively.
As a marker for tract integrity, FA is a useful quantity to compare across subjects as
it is computable voxelwise and is a scalar value that is independent of the local fibre
orientation and therefore a relative objective and straightforward measure to
compare across subjects (Smith et al. 2006).
To achieve this many studies have utilised a voxel-based morphometry (VBM)
approach (Ashburner & Friston 2000). VBM has been used in many structural
imaging studies, exploring differences in grey matter density once macroscopic
differences in brain shape and size has been discounted.
158
In VBM-style FA analysis, each subjects FA image is registered into a standard
space, and then voxelwise statistics are performed to identify areas which correlate
to the covariate of interest (e.g., patients vs normals, disability score, age).
Traditionally voxel indices measured as VBM involves a number of imaging
preprocessing steps and then subsequent analysis and anatomical localization of
any detectable differences in the brains under study. The key steps involved in
performing VBM are Normalisation, Segmentation, Smoothing and the Statistical
analysis. These steps are available in more detail through the University College
London / The Wellcome Department of Imaging Neuroscience website
www.fil.ion.ucl.ac.uk./spm Results are displayed as an image where the voxel
values are t-statistics, known as Statistical Parametric Map (SPM). A serious
limitation of VBM-style approaches is the need for spatial smoothing, and the
problem of arbitrarily choosing the spatial smoothing extent (Smith et al. 2006).
A method developed specifically for analysing FA maps is Tract-Based Spatial
Statistics (TBSS) (Smith et al. 2006) . TBSS uses a slightly different approach to
SPM. Instead of comparing all voxels of the brain, it only performs statistics for
voxels on a white-matter skeleton. The procedure involves transforming the FA map
of each subject into standard space and generating a white matter skeleton from the
group mean FA map. To ensure that the FA measurements are from the centre of
each individual’s white-matter tracts, there is a projection step that searches for the
locally maximal FA orthogonal to the skeleton. The same transforms can then be
applied to the MD, λaxial and λradial maps. The main limitation of this approach is that
159
large parts of the brain (grey matter) are omitted from analysis, however it has
advantages in that it deals with alignment issues, has no need for smoothing and
the processing is straightforward, by comparison.
4.1.3 Brain development and DTI
The structure of the brain continues to develop throughout childhood, and into
adolescence and early adulthood. Although there is a clear consensus that
anisotropy increases and diffusion decreases with age, there is conflicting data as to
what trajectory those changes follow during development. Studies generally concur
that stabilisation of diffusion properties is reached by 2 years of life (Schneider et al.
2004; Zhang et al. 2005). Following this steep pattern, is a slower process of change
on through adolescence (Mukherjee et al. 2002). The slope of FA from 2 to 18 years
of age is modest in magnitude (Schmithorst et al. 2002) although variable across
various regions of the brain. It is mostly agreed that the most significant brain
changes occur in children up to the age of 5 years old; however structures do
continue to develop into adulthood. The rate of these changes is also known to differ
between boys and girls. In the first TBSS study looking at sexual dimorphism in
children aged 8 to 13 years, widespread white matter changes in boys were noted,
but not in girls in this age range (Seunarine et al. 2010). These differences must be
accounted for in any comparative analysis.
4.1.4 DTI in other LSD
DTI has already been used to investigate brain integrity in other lysosomal storage
disorders with interesting results, most notably based on the findings in adults with
Fabry disease performed in one German centre (Fellgiebel et al. 2006; Albrecht et al.
160
2007). These findings, which included 27 adult Fabry patients compared to 21 age-
matched controls identified that global mean diffusivity (MD) was increased in Fabry
patients whereas global fraction anisotropy (FA) did not differ significantly compared
to controls (Fellgiebel et al. 2006; Albrecht et al. 2007). The authors recommended
that diffusivity measurements was a more sensitive structural imaging tool to detect
and quantify brain involvement in Fabry disease at an early stage of disease, even
in patients without white matter lesions.
In paediatric patients DTI studies in two different LSD were identified, Krabbe
disease and Cystinosis.
In 2001, Guo et al (2001) examined eight patients with Krabbe disease and eight
age-matched control subjects (Guo et al. 2001b). Anisotropy maps were generated
with diffusion tensor data, encoding in six directions. Loss of diffusion anisotropy
appeared on anisotropy maps as areas of decreased hyperintensity in patients with
Krabbe disease. Guo et al (2001) reported that diffusion tensor derived anisotropy
maps provide a quantitative measure of abnormal white matter in patients with
Krabbe disease, which is more sensitive than T2-weighted images for detecting
white matter abnormality. The authors also stated that DTI may be a marker of
treatment response (Guo et al. 2001a).
A later study applied DTI to 24 children with Cystinosis (age 3–7 years) and to 24
typically developing age-matched controls (Bava et al. 2010). Scalar diffusion
indices, fractional anisotropy (FA) and mean diffusivity (MD) were examined in
161
manually defined regions of interest within the parietal and inferior temporal lobes.
Bilaterally decreased FA and increased MD were evident in the inferior and superior
parietal lobules in children with cystinosis, with comparable FA and MD to controls in
inferior temporal white matter, and implicate a dissociation of the dorsal and ventral
visual pathways. The strength of this study is that diffusion indices were correlated
with performance on measures of visuospatial cognition and with white blood cell
cystine levels. In older cystinosis children (age > 5), diminutions in visuospatial
performance were associated with reduced FA in the right inferior parietal lobule. In
addition, increased MD was found in the presence of high cystine levels in all
children with cystinosis. This study demonstrated that the average diffusion
properties in children with cystinosis deviate from typically developing children,
suggesting the presence of early microstructural white matter changes in addition to
a secondary effect of cystine accumulation.
4.2 Method
4.2.1 MR acquisition
Diffusion-weighted images were acquired on a Siemens Avanto 1.5T scanner using
a twice refocused single-shot diffusion-weighted spin-echo echo-planner imaging
sequence (TR 6300ms, TE 89ms, field of view 240mm, and acquisition matrix
96×96). A total of 45 transverse slices covering the whole brain were collected with
slice thickness of 2.5mm, zero gap and an in-plane resolution of 2.5×2.5mm.
Diffusion gradients were applied in 20 directions at b=1000 s mm-1. This was
repeated three times to improve signal-to-noise ratio. Three b=0 s mm-1 images
were also acquired.
162
4.2.2 Image Processing
All images of Gaucher patients were inspected visually by an experienced
Consultant Paediatric Neuroradiologist (Dr Kling Chong), who was blinded to the
clinical presentation. Any lesions were described in terms of their location and
graded 1-3 based on whether they were obvious or subtle.
Processing of the data involved removal of eddy-current distortion and skull-
stripping of the brain volume using FSL (www.fmrib.ox.ac.uk/fsl). To improve
alignment, all subjects were registered on a specific template. Diffusion tensors
were then fitted to the data and the FA, MD, λaxial and λradial maps were calculated
utilising TBSS as previously described. All analysis was performed by Dr Kiran
Seunarine (Institute of Child Health).
NGD patients were compared to a control group using a two sample t-test, where
age and sex were added as covariates. The same procedure was used to compare
Type I patients to a separate age-sex matched control group. The mean of each
diffusion parameter over the white-matter skeleton was also calculated for each
subject and plotted against age for a larger cohort of normal children to compare
overall trend.
4.2.3 Analysis of DTI data
The pathology data presented in the Introduction suggests that the Gaucher
pathology is likely to be found in both grey and white matter (neuronal cell bodies of
grey matter and astrocytosis of cerebellar white matter). This has important
163
implications when considering MRI approach and analysis is the most appropriate to
utilise.
To examine the grey matter in this context some exploratory VBM analysis was
performed according to the methodology reported by Ashburner & Friston (2000).
This initial analysis however failed to identify any areas of the brain that differed
from Type I to the NGD cohort. This was believed to be partly attributed to the VBM
analysis used and that possibly neuropathalogical findings in the grey matter are not
as prominent as those in the white matter.
Based on this and the fact that extensive white matter lesion is a frequent finding in
many metabolic diseases, and that there are currently no other robust methods for
voxel-wise spatially normalised analysis of grey matter, Tract-Based Spatial
Statistics (TBSS) was utilised. Given that TBSS only performs voxel-wise statistics
on the main white-matter skeleton is clinically more meaningful that a voxel alone.
Type I Gaucher and NGD were compared to their own age-sex matched control
group. This is to account for the fact that there was an age and sex differentiation
between the NGD and Type I patients recruited. The rationale for including Type I
Gaucher disease was again to be able to define the characteristic of the NGD brain
compared to the Type I Gaucher brain, which may offer an insight into why Type I
patients remain neurologically intact.
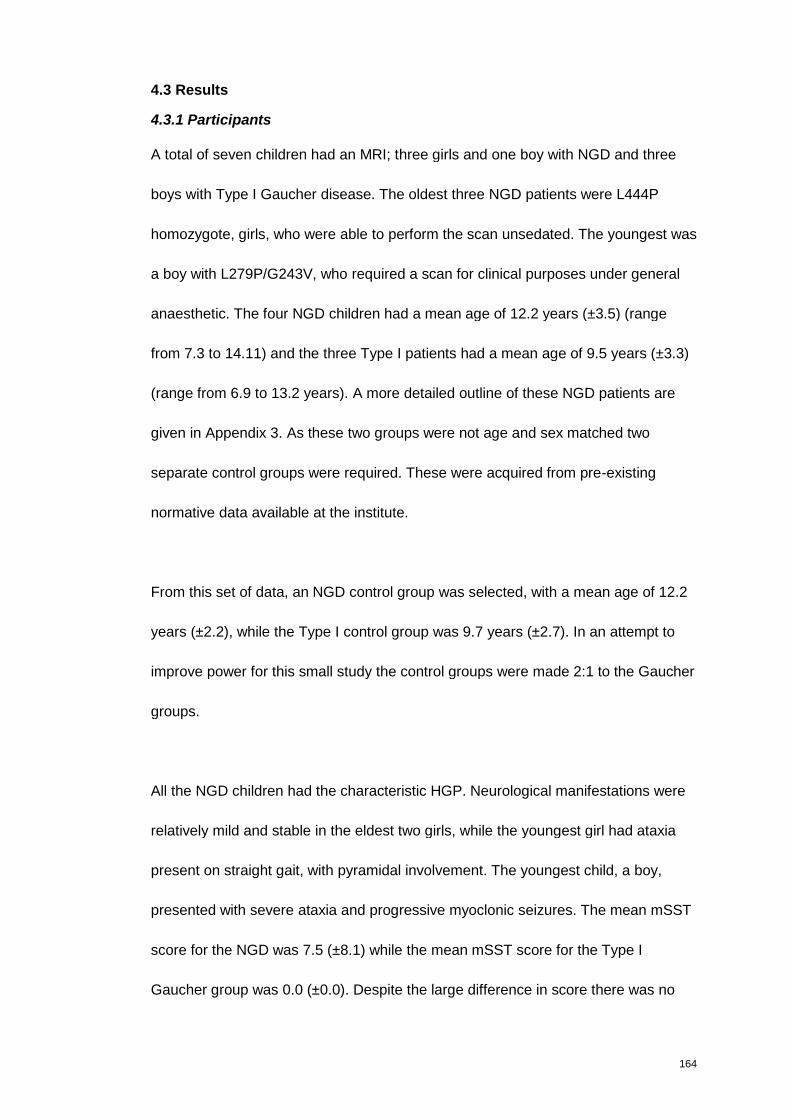
164
4.3 Results
4.3.1 Participants
A total of seven children had an MRI; three girls and one boy with NGD and three
boys with Type I Gaucher disease. The oldest three NGD patients were L444P
homozygote, girls, who were able to perform the scan unsedated. The youngest was
a boy with L279P/G243V, who required a scan for clinical purposes under general
anaesthetic. The four NGD children had a mean age of 12.2 years (±3.5) (range
from 7.3 to 14.11) and the three Type I patients had a mean age of 9.5 years (±3.3)
(range from 6.9 to 13.2 years). A more detailed outline of these NGD patients are
given in Appendix 3. As these two groups were not age and sex matched two
separate control groups were required. These were acquired from pre-existing
normative data available at the institute.
From this set of data, an NGD control group was selected, with a mean age of 12.2
years (±2.2), while the Type I control group was 9.7 years (±2.7). In an attempt to
improve power for this small study the control groups were made 2:1 to the Gaucher
groups.
All the NGD children had the characteristic HGP. Neurological manifestations were
relatively mild and stable in the eldest two girls, while the youngest girl had ataxia
present on straight gait, with pyramidal involvement. The youngest child, a boy,
presented with severe ataxia and progressive myoclonic seizures. The mean mSST
score for the NGD was 7.5 (±8.1) while the mean mSST score for the Type I
Gaucher group was 0.0 (±0.0). Despite the large difference in score there was no
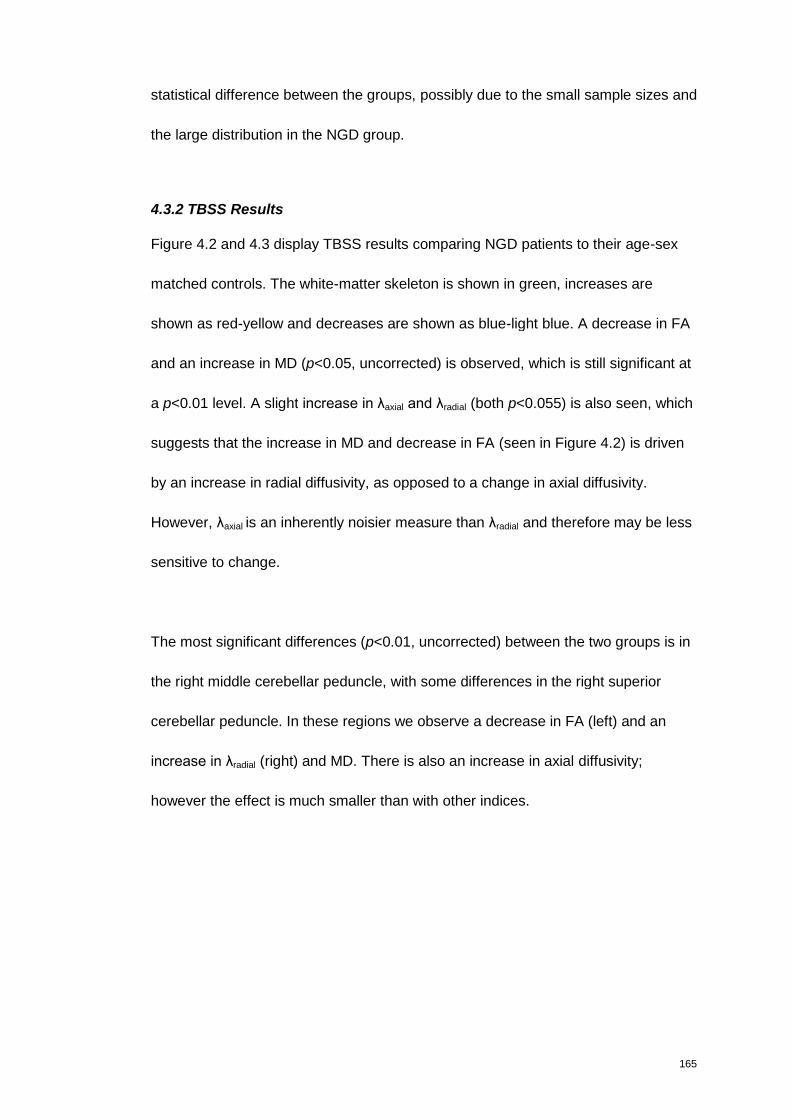
165
statistical difference between the groups, possibly due to the small sample sizes and
the large distribution in the NGD group.
4.3.2 TBSS Results
Figure 4.2 and 4.3 display TBSS results comparing NGD patients to their age-sex
matched controls. The white-matter skeleton is shown in green, increases are
shown as red-yellow and decreases are shown as blue-light blue. A decrease in FA
and an increase in MD (p<0.05, uncorrected) is observed, which is still significant at
a p<0.01 level. A slight increase in λaxial and λradial (both p<0.055) is also seen, which
suggests that the increase in MD and decrease in FA (seen in Figure 4.2) is driven
by an increase in radial diffusivity, as opposed to a change in axial diffusivity.
However, λaxial is an inherently noisier measure than λradial and therefore may be less
sensitive to change.
The most significant differences (p<0.01, uncorrected) between the two groups is in
the right middle cerebellar peduncle, with some differences in the right superior
cerebellar peduncle. In these regions we observe a decrease in FA (left) and an
increase in λradial (right) and MD. There is also an increase in axial diffusivity;
however the effect is much smaller than with other indices.
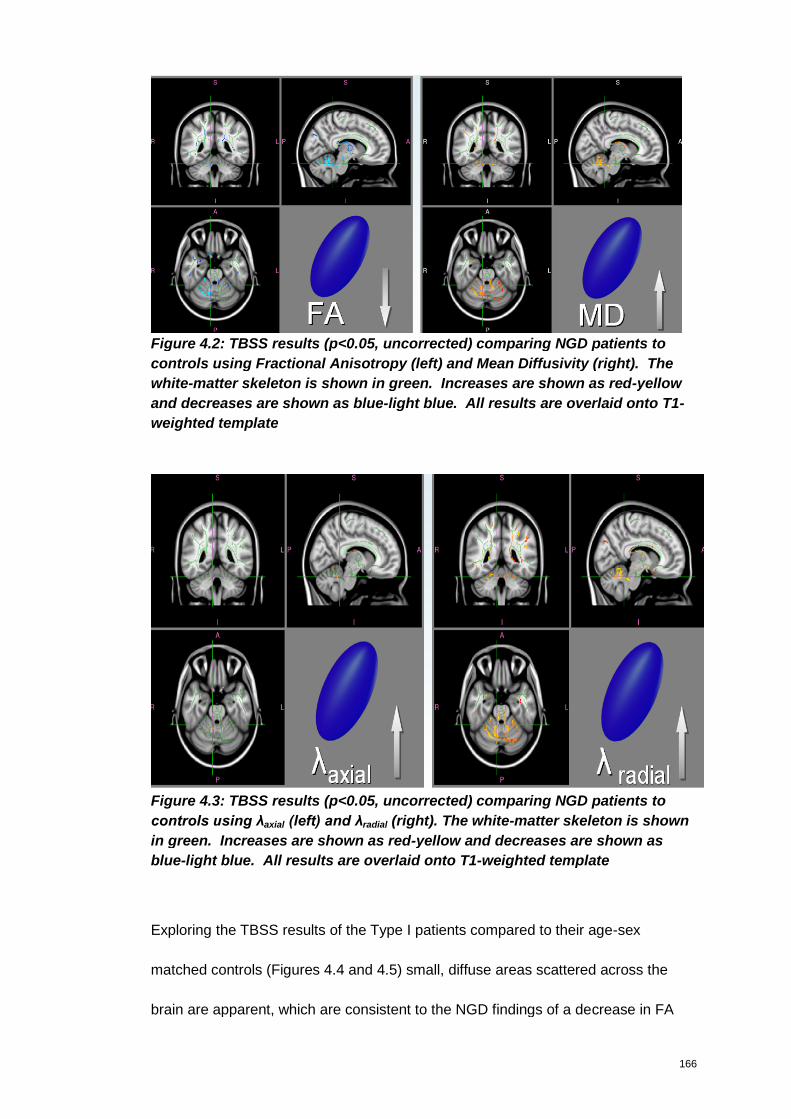
166
Figure 4.2: TBSS results (p<0.05, uncorrected) comparing NGD patients to
controls using Fractional Anisotropy (left) and Mean Diffusivity (right). The
white-matter skeleton is shown in green. Increases are shown as red-yellow
and decreases are shown as blue-light blue. All results are overlaid onto T1-
weighted template
Figure 4.3: TBSS results (p<0.05, uncorrected) comparing NGD patients to
controls using λaxial (left) and λradial (right). The white-matter skeleton is shown
in green. Increases are shown as red-yellow and decreases are shown as
blue-light blue. All results are overlaid onto T1-weighted template
Exploring the TBSS results of the Type I patients compared to their age-sex
matched controls (Figures 4.4 and 4.5) small, diffuse areas scattered across the
brain are apparent, which are consistent to the NGD findings of a decrease in FA
167
and an increase in MD, also significant at p<0.05 (uncorrected). The increased
pattern for λaxial seen in the NGD group is not observed in the Type I cohort,
furthermore there is no one specific area identified, and in particular no significant
difference observed in the cerebellar peduncles.
Figure 4.4: TBSS results (p<0.05, uncorrected) comparing Type I patients to
controls using FA (left) and Mean Diffusivity (right). The white-matter skeleton
is shown in green. Increases are shown as red-yellow and decreases are
shown as blue-light blue. All results are overlaid onto T1-weighted template
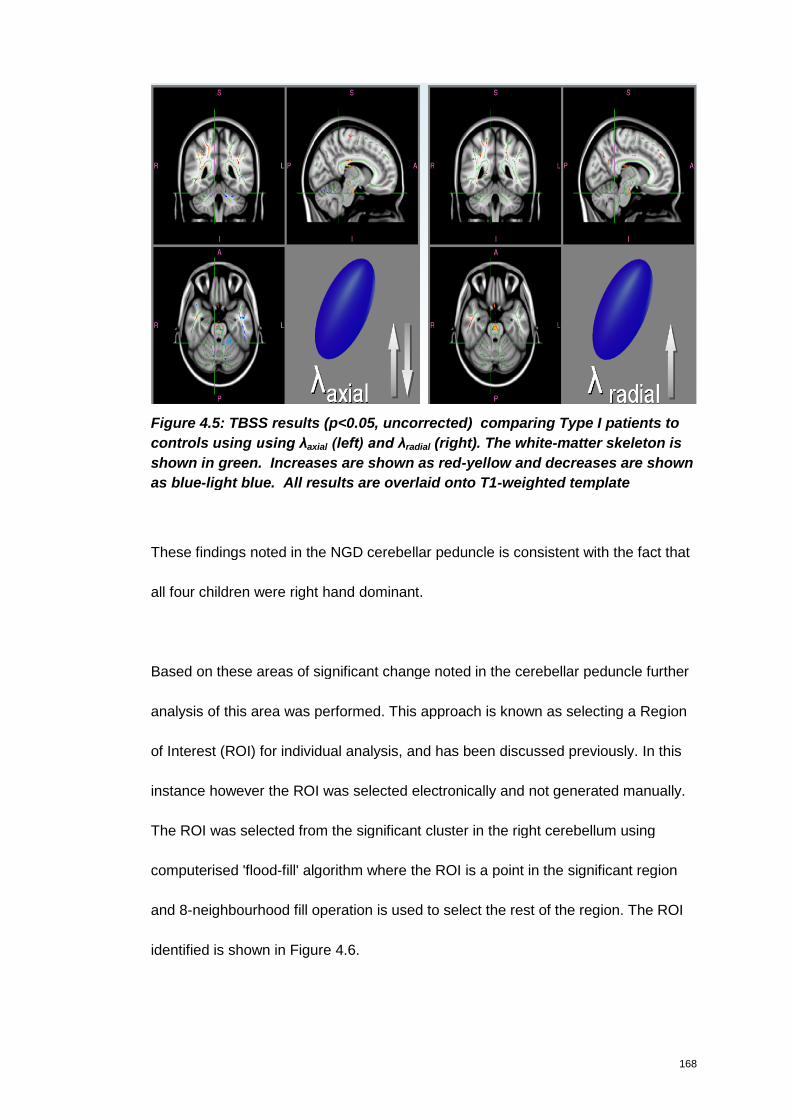
168
Figure 4.5: TBSS results (p<0.05, uncorrected) comparing Type I patients to
controls using using λaxial (left) and λradial (right). The white-matter skeleton is
shown in green. Increases are shown as red-yellow and decreases are shown
as blue-light blue. All results are overlaid onto T1-weighted template
These findings noted in the NGD cerebellar peduncle is consistent with the fact that
all four children were right hand dominant.
Based on these areas of significant change noted in the cerebellar peduncle further
analysis of this area was performed. This approach is known as selecting a Region
of Interest (ROI) for individual analysis, and has been discussed previously. In this
instance however the ROI was selected electronically and not generated manually.
The ROI was selected from the significant cluster in the right cerebellum using
computerised 'flood-fill' algorithm where the ROI is a point in the significant region
and 8-neighbourhood fill operation is used to select the rest of the region. The ROI
identified is shown in Figure 4.6.
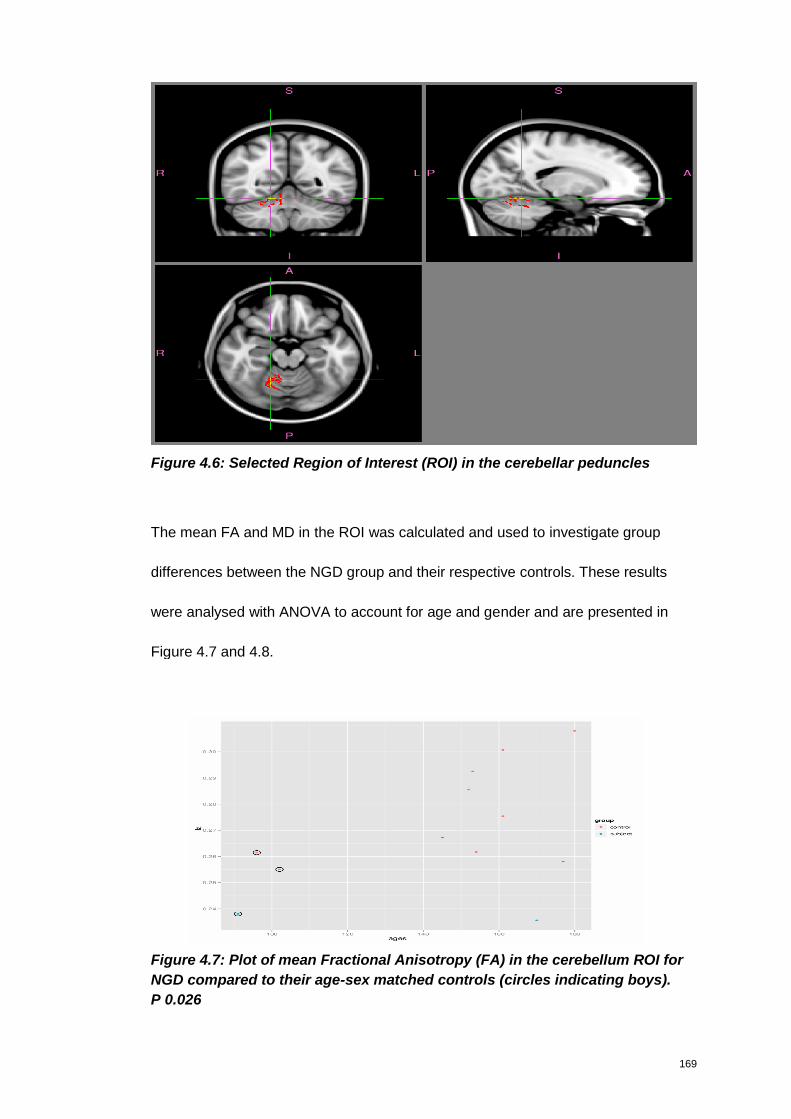
169
Figure 4.6: Selected Region of Interest (ROI) in the cerebellar peduncles
The mean FA and MD in the ROI was calculated and used to investigate group
differences between the NGD group and their respective controls. These results
were analysed with ANOVA to account for age and gender and are presented in
Figure 4.7 and 4.8.
Figure 4.7: Plot of mean Fractional Anisotropy (FA) in the cerebellum ROI for
NGD compared to their age-sex matched controls (circles indicating boys).
P 0.026
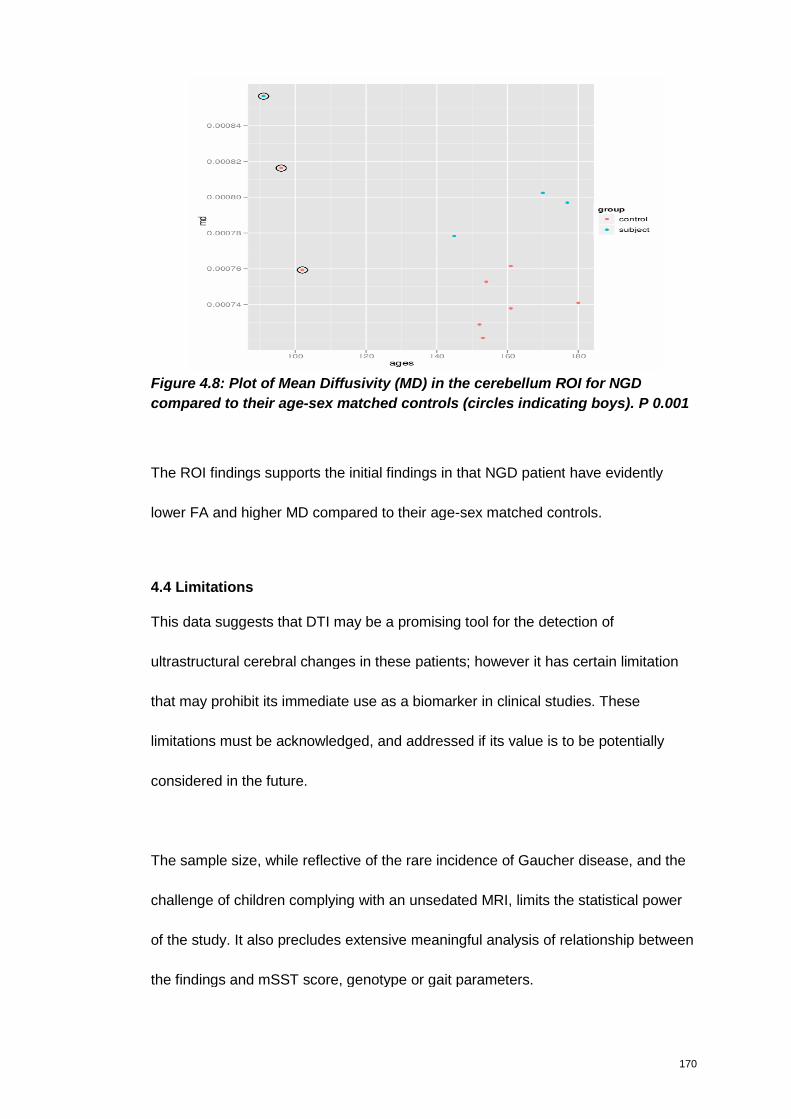
170
Figure 4.8: Plot of Mean Diffusivity (MD) in the cerebellum ROI for NGD
compared to their age-sex matched controls (circles indicating boys). P 0.001
The ROI findings supports the initial findings in that NGD patient have evidently
lower FA and higher MD compared to their age-sex matched controls.
4.4 Limitations
This data suggests that DTI may be a promising tool for the detection of
ultrastructural cerebral changes in these patients; however it has certain limitation
that may prohibit its immediate use as a biomarker in clinical studies. These
limitations must be acknowledged, and addressed if its value is to be potentially
considered in the future.
The sample size, while reflective of the rare incidence of Gaucher disease, and the
challenge of children complying with an unsedated MRI, limits the statistical power
of the study. It also precludes extensive meaningful analysis of relationship between
the findings and mSST score, genotype or gait parameters.

171
Although the control group was selected to be as close as possible to be age and
sex-matched for the Gaucher groups, the self-selection of control groups, from a
limited source, is open to criticism.
Full Scale IQ for both Gaucher groups and control groups was not available to
explore for difference. However, it is suspected that the groups were not IQ matched,
as NGD patients are known to have lower IQ and the control group studied was
reported to have a normal to high IQ. Although the issue of chronological age on DTI
results were accounted for in the selection of an age-matched control group, any
possible impact that developmental age may have is not. Indeed developmental
changes may be more dependant on the data than chronological age.
A methodological limitation is that TBSS intentionally restricts the analysis to the
small subset of voxels in the white-matter skeleton. This improves the statistics by
reducing the multiple comparisons problem, although it also omits regions of
potential interest, such as the basal ganglia and grey matter, from the analysis.
Considering the advantages of TBSS in dealing with alignment issues, this approach
is considered justified however, despite the loss of grey matter analysis.
4.5 Discussion
TBSS analysis of the white matter tracts identified decreased FA and increased MD
in the cerebellum of Gaucher patients. Although statistically significant in both the
Type I and NGD cohort the changes in the Type I cohort were diffuse, where as the
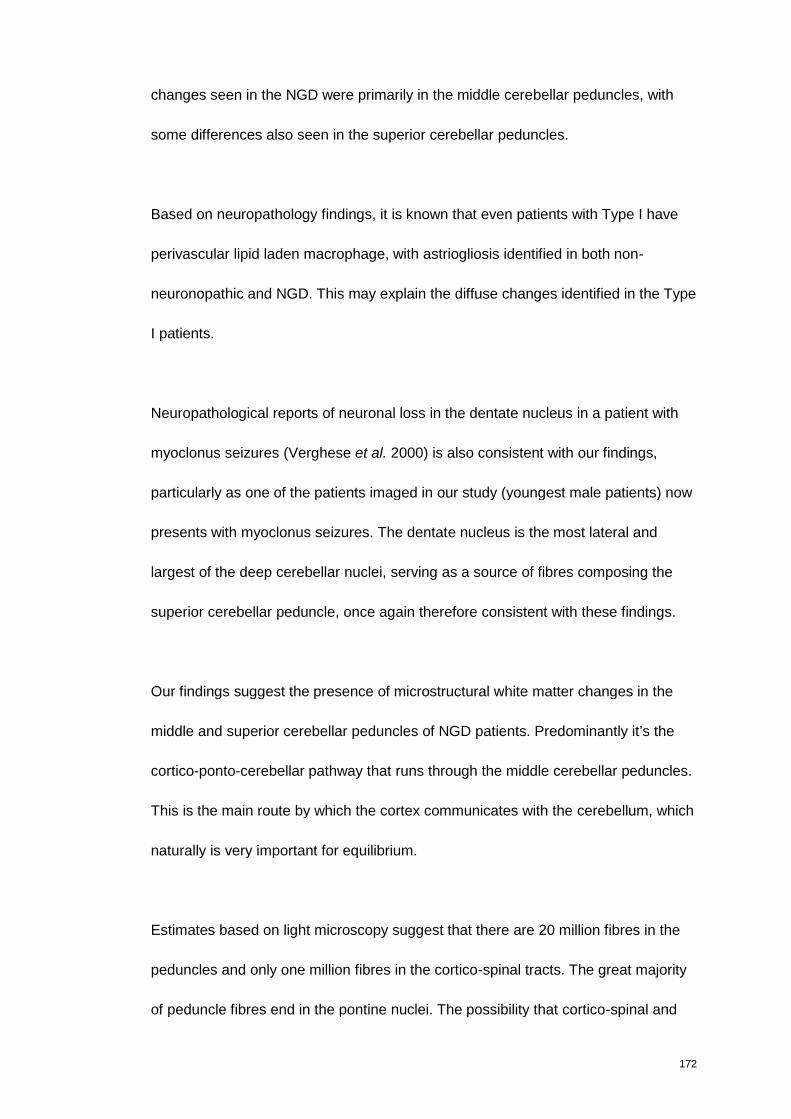
172
changes seen in the NGD were primarily in the middle cerebellar peduncles, with
some differences also seen in the superior cerebellar peduncles.
Based on neuropathology findings, it is known that even patients with Type I have
perivascular lipid laden macrophage, with astriogliosis identified in both non-
neuronopathic and NGD. This may explain the diffuse changes identified in the Type
I patients.
Neuropathological reports of neuronal loss in the dentate nucleus in a patient with
myoclonus seizures (Verghese et al. 2000) is also consistent with our findings,
particularly as one of the patients imaged in our study (youngest male patients) now
presents with myoclonus seizures. The dentate nucleus is the most lateral and
largest of the deep cerebellar nuclei, serving as a source of fibres composing the
superior cerebellar peduncle, once again therefore consistent with these findings.
Our findings suggest the presence of microstructural white matter changes in the
middle and superior cerebellar peduncles of NGD patients. Predominantly it’s the
cortico-ponto-cerebellar pathway that runs through the middle cerebellar peduncles.
This is the main route by which the cortex communicates with the cerebellum, which
naturally is very important for equilibrium.
Estimates based on light microscopy suggest that there are 20 million fibres in the
peduncles and only one million fibres in the cortico-spinal tracts. The great majority
of peduncle fibres end in the pontine nuclei. The possibility that cortico-spinal and
173
cortico-bulbar fibres also give off collaterals to pontine cells as the pass through the
pons suggests that every fibre in the cerebral peduncles has a pontine target. One
of the major circuits through the human brain is a route that originates in the
cerebral cortex and connects to the cerebellum by the way of the pontine nuclei.
The cerebellum, which is bilaterally symmetrical and placed in the posterior cranial
fossa, influences the timing and force of contractions of voluntary muscles, through
its afferent and efferent connections, resulting in smooth, coordinated movement
(Young & Young 1997). Given the clinical presentation of ataxia seen in NGD
patients, in the sense of gait and ataxia in the broader sense, which is not
characteristically seen in Type I paediatric patients this finding is clinically viable.
This finding would also be in line with the neuropathology seen in NGD patients as
previously described.
Our findings of an increased MD (compared to age-sex matched controls) is
consistent with findings reported for other LSDs, such as Fabry disease, Cystinosis
and Krabbe disease, as previously discussed.
The findings of Abdel Razek et al (2009) however are at odds with all the other LSD
publications utilising DTI, where increased diffusion coefficient, rather than lower
diffusion is observed. A possible explanation for this discrepancy is that the patients
and control group were not adequately matched for age. As stated, the patients
studied by Abdel Razek et al (2009) were between 8 months and 14 years. Brain
changes during this age group are significant. The authors do not provide the age
ranges for the controls, but the presence of older subject in the control group would
174
manifest as apparent decrease in diffusion coefficient. Furthermore Abdel Razek et
al (2009) do not specify if sex-matched controls are used. The developmental
trajectory of boys and girls differ, which may contribute to the findings. One further
consideration is that the DWI acquisition uses diffusion-weighted measurements
acquired in 3 orthogonal directions and estimates the diffusivity from the
measurements directly. DTI, on the other hand acquire 20 diffusion-weighting
directions three times and the MD is calculated from the diffusion tensor, which
offers higher precision.
Changes in the peduncles were also noted in neonates with infantile Krabbe disease
(Escolar et al. 2009). Based on their DTI study of six neonates with infantile Krabbe
disease identified through family history, Escalor et al (2009) claimed that FA
differences identified in the superior and middle cerebellar peduncles may help to
differentiate between babies who will develop the early-onset disease, those who
will develop disease at a much later time and those who will never develop disease.
This approach can provide very consistent FA values and detect regional
differences and age-related changes in the first 2 years of life. For this reason the
authors claimed that DTI with quantitative tractography may prove to be an excellent
technology for studying infantile Krabbe disease and other demyelinating conditions
of early childhood. A large sample of healthy controls and babies with low enzymes
who do not develop early-infantile disease will need to be studied for an adequate
standardisation and validation of this tool (Escolar et al. 2009).
175
In adults, there are many conditions that are associated with MR abnormalities in
the middle cerebellar peduncle, the common one being multi-system atrophy, but
also a rare genetic ataxic syndrome dentato-rubro-pallido-luysian atrophy (DRPLA)
which causes a T2 high signal and restricted diffusion there, even cerebral
autosomal dominant arteriopathy with subcortical infarcts and leukoencephalopathy
(CADASIL) can cause a similar MR picture and progressive ataxia.
In a study examining white matter damage in adults with spinocerebellar ataxia type
1 and 2, TBSS revealed decreased FA in the inferior, middle and superior cerebellar
peduncles (Della et al. 2008). Despite the different aetiology, spinocerebellar ataxia
has clinical similarities to that of NGD - ataxia of gait, stance and limbs, dysarthia
and oculomotor abnormalities, albeit progressing at a more rapid rate (Schulz et al.
2009).
In another study, apparent diffusion coefficient measurements of the middle
cerebellar peduncle were identified to differentiate in the Parkinson variant of
multiple system atrophy (Nicoletti et al. 2006). On the basis of symptoms at onset,
multiple system atrophy (MSA) has been divided into two forms: MSA-C
characterised by a predominance of cerebellar symptoms and MSA-P where
Parkinsonism is prevalent. The clinical presentation of MSA-C is more comparable
to that seen in NGD, however parkinsonian-like symptoms are increasingly being
linked to Type I Gaucher disease (Sidransky 2005).
176
The value of DTI as a biomarker
There is great interest in developing objective biologically based markers that can
be used to predict risk, diagnose, stage, or track the course and treatment of
neurodegeneration and complement currently employed clinical measures. Fox and
Growdon (2004) report that the ideal surrogate endpoint or outcome measure is a
laboratory substitute for a clinically meaningful result, and should lie directly in the
causal pathway linking disease to outcome. There are three different areas where
imaging biomarkers may have important roles to play: as markers of trait, state and
rate. A measure of disease trait is a marker such as a genetic mutation that predicts
the likelihood of developing disease. A measure of disease trait may also indicate
susceptibility to disease. A measure of disease state is, in essence, a diagnostic
biomarker. A measure of disease rate or change is a marker that can be used to
track progression of the pathophysiology of the disease, or to detect the effects of a
therapeutic intervention. Promising markers in this regard, are measures of atrophy
on quantitative magnetic resonance brain scans. It is theoretically possible that a
single biomarker may fulfil all roles of measuring trait, state and rate in a particular
disease. However, the requirements of a robust predictive marker, a sensitive and
specific diagnostic marker to separate disease, and a validated marker of
progression in trials in neurodegenerative brain disease may be quite different from
each other, making this unlikely.
In practical terms, it is more likely that it will be necessary to use a number of
different markers, either separately or in combination, to fulfil these three different
roles (Fox & Growdon 2004). Recent advances in Alzheimer’s disease illustrate the
177
use of neuroimaging as a biomarker for clinical trials (Dickerson & Sperling 2005)
and increase the value their consideration in other neurodegendrative disorders,
such as NGD.

178
Chapter 5
Discussion
“A p-value is no substitute for a brain.”
Anonymous
179
5. Discussion
Chapter 2-4 has demonstrated that the mSST, GAITRite and DTI are have all been
able to quantifying disease severity across the Gaucher cohort studied. The relative
value of each tool is considered to be variable however.
Through validation, the mSST has demonstrated its ability to monitor disease
progression in the largest cohort of NGD patients ever studied systematically and
prospectively. The GAITRite was able to distinguish between the gait profile of the
NGD and Type I cohort, defining key parameters (Velocity, Step Time and Double
Support in particular) that deviated from normal, however the lack of trend identified
in the sequential data is a real limitation in its use. The DTI identified areas of
statistically significant difference in NGD children compared to age-sex-matched
controls. This difference was prominent in the middle cerebellar peduncle of the
NGD cohort, which is consistent with the clinical finding of ataxia observed in this
cohort, indicating a ‘proof of concept’ for this methodology.
It is important to consider however how the findings for each individual assessment
correlate with each other, and what the advantages, disadvantages and potential
use for all three assessments are.
5.1 Correlation of the three assessments.
Although each assessment tool has demonstrated to be useful in its own right, it is
important to consider whether the findings correlate with each other, and whether
the three assessment tools are in agreement in identifying and/or scoring severe
patients.
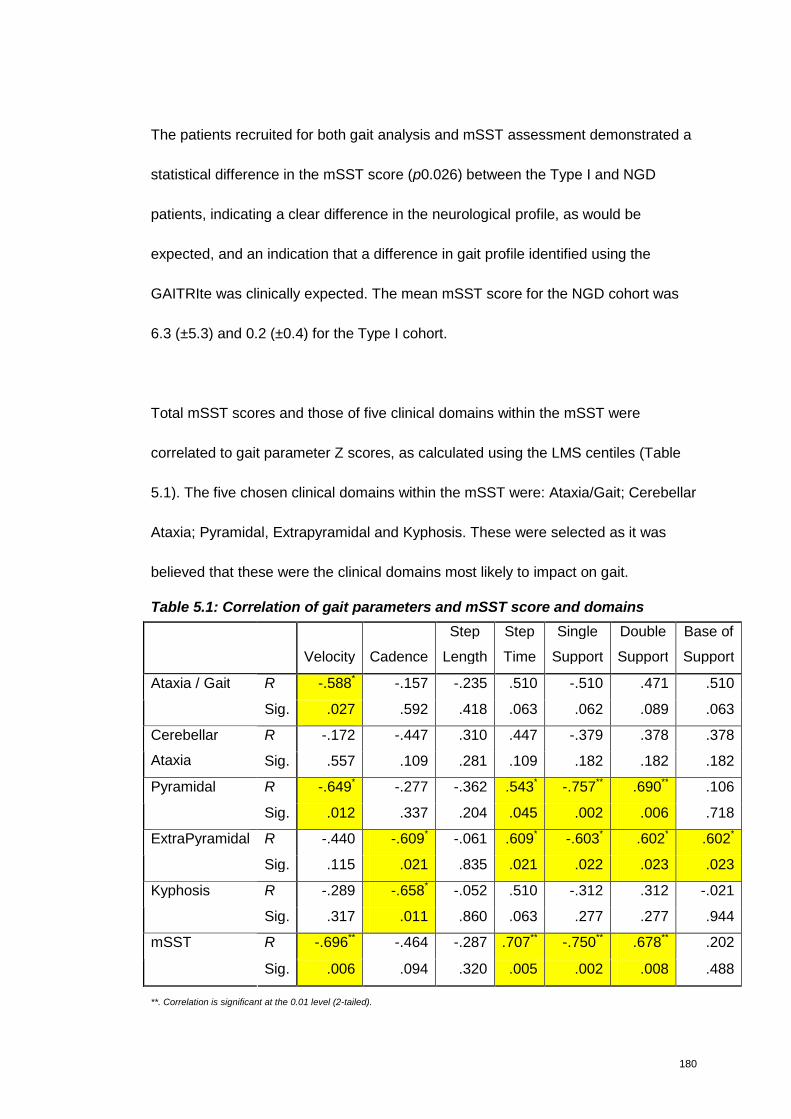
180
The patients recruited for both gait analysis and mSST assessment demonstrated a
statistical difference in the mSST score (p0.026) between the Type I and NGD
patients, indicating a clear difference in the neurological profile, as would be
expected, and an indication that a difference in gait profile identified using the
GAITRIte was clinically expected. The mean mSST score for the NGD cohort was
6.3 (±5.3) and 0.2 (±0.4) for the Type I cohort.
Total mSST scores and those of five clinical domains within the mSST were
correlated to gait parameter Z scores, as calculated using the LMS centiles (Table
5.1). The five chosen clinical domains within the mSST were: Ataxia/Gait; Cerebellar
Ataxia; Pyramidal, Extrapyramidal and Kyphosis. These were selected as it was
believed that these were the clinical domains most likely to impact on gait.
Table 5.1: Correlation of gait parameters and mSST score and domains
Velocity Cadence
Step
Length
Step
Time
Single
Support
Double
Support
Base of
Support
R -.588* -.157 -.235 .510 -.510 .471 .510Ataxia / Gait
Sig. .027 .592 .418 .063 .062 .089 .063
R -.172 -.447 .310 .447 -.379 .378 .378Cerebellar
Ataxia Sig. .557 .109 .281 .109 .182 .182 .182
R -.649* -.277 -.362 .543* -.757** .690** .106Pyramidal
Sig. .012 .337 .204 .045 .002 .006 .718
R -.440 -.609* -.061 .609* -.603* .602* .602*ExtraPyramidal
Sig. .115 .021 .835 .021 .022 .023 .023
R -.289 -.658* -.052 .510 -.312 .312 -.021Kyphosis
Sig. .317 .011 .860 .063 .277 .277 .944
R -.696** -.464 -.287 .707** -.750** .678** .202mSST
Sig. .006 .094 .320 .005 .002 .008 .488
**. Correlation is significant at the 0.01 level (2-tailed).
181
Utilising Spearmans Rho to accommodate for the ordinal data in the mSST domains,
statistically significant correlation is observed between six of the seven gait
parameters and the mSST domains. Cerebellar Ataxia did not correlate with any of
the gait paramaters, and Base of Support only correlated with Extrapyramidal.
Indeed, Extrapyramidal is the domain that correlates with the highest number of gait
parameters. Velocity and Step Length are the only two gait parameters that did not
correlate with Extrapyramidal. The strength of association was strongest between
the Extrapyramidal domain and Step Time and Cadence, r 0.609 and -0.609
respectively. This negative correlation with Cadence possibly indicative that a
significantly reduced number of steps correlates with moderate to severe
Extrapyramidal involvement.
Given the number of gait parameters that correlate with Extrapyramidal, and the
strength of correlation with Pyramidal, it would imply that these two domains have
more impact on gait compared to the other domains measured within the mSST.
A reason why correlation is stronger in the Extrapyramidal domain compared to
Ataxia/Gait is that the domain construct for Ataxia/Gait has “Normal, apparent only
on tandem walking” as the first construct. This may therefore allow for a patient to
have some pathology, which would not be scored within the realms of the mSST
domain. The same is also true for the Pyramidal domain, in that ‘Normal tone with
increased reflexes’ scores 0, but the presence of increased reflexes might be an
indication of an underlying pathology.
182
Kyphosis only correlated with Cadence. This may suggest that the presence of
Kyphosis has a limited impact on the gait profile as measured using the GAITRite.
The mSST total score had the strongest correlation with Step Time and Double
Support, but also correlated with Velocity and Single Support. As previously
discussed in the Chapter 3 Step Time and Double Support may be indicative of
power and postural control, and are more subtle abnormalities compared to a
change in Velocity, which in isolation could be just regarded as a indication of
strength and power and/or none CNS manifestations. An increase in disease
severity as measured utilising the mSST accounts for all the neurological
manifestations seen in NGD, and this correlation with Step Time and Double
Support indicates that these are important gait parameters which reflect a
neurologically driven pathology.
When the FA and MD values obtained for both groups in the TBSS analysis of DTI
are added to the correlation equation however, it is noted that neither FA nor MD
correlates with any of the other mSST domains or gait parameters. One of the
reason for this may be the small sample size that were able to consent to having an
MRI performed, particularly as age and sex need to be considered as covariates.
Furthermore, it was a disadvantage that the controls used for DTI analysis were not
assessed the mSST or GAITRite.
183
5.2 The advantages, disadvantages and potential value of each assessment
The modified Severity Scoring Tool
In line with the ICH E9 guideline the SST has been modified and validated for
measuring a clinically relevant and important benefit to the patient population.
Factors such as content validity, inter- and intra-rater reliability and responsiveness
for detecting changes have been addressed, which is advantageous compared to
some other tools currently used clinically.
Based on a cohort covering three European countries the mSST has effectively
distinguished disease severity and rate of progression across the genotypes, which
strengthen its validity. Whether these findings can be extrapolated to account for the
clinical presentation of patients in other geographical regions to Europe (e.g Asia
and Africa) now needs to be established.
When considering the value of the mSST as a clinical tool, its potential as a primary
end-point in a clinical trial is an obvious consideration. It is particularly advantageous
that the mSST data generated this far can be used to calculate a sample size that
may be required for any proposed clinical trial. This is hypothetical, and based on
the assumption that the mode of action of drug “X” would be evaluated for halting
disease progression rather than reversing clinical damage.
In the traditional, or classical approach to clinical trial design the mSST change
observed in n=39 cases would be utilised to estimate the effect in any proposed
untreated control group compared to a treated group. For instance, the treated

184
group whom would be anticipated to remain stable can be predicted based on the
result for mildest group D409H and L444P, who did not change (i.e mean change =
0 with an estimated ± of 2.27), while the untreated group would be anticipated to
progress at the same rate as observed during this follow-up assessment (i.e. mean
change = 1.71 ±3.91). Based on this data, with a 5% significance level and 80%
power 55 patients per treatment group would be necessary. Unfortunately this is too
large a cohort to be recruited in such a rare disease. Furthermore this predicted
change was observed over 4 years. Although this is reflective of the slow
progressive nature of the disease, it may be difficult to persuade pharmaceutical
companies to undertake such a long study.
Another way of calculating the sample size for the study would be to use the
Minimum Clinically Important Difference (MCID). Based on discussions with the
experts a change in mSST score of 3 was considered to be a MCID. Using a MCID
of three to calculate the sample size can be done by utilising the mean change for
the L444P/other genotype group (3.13 ±8.22) as a reference. However, assuming
the same significance and power, 59 patients per group would still be needed. This
is probably because of the large standard deviation observed in the L444P/other
group.
These problems are frequently encountered when designing clinical trials for rare
diseases, where patient recruitment is particularly problematic. Adaptive designs are
therefore more appropriate. Regulators and industry alike now accept this
(Committee for Medicinal Products for Human Use & CHMP 2007).
185
Variability (whether in terms of disease phenotype, underlying pathophysiology,
pharmacodynamics or pharmacokinetics) is as an acknowledged threat to
successful drug development. Efficient study design and analysis requires a clear
understanding as possible of all these potential sources of variability. Stratifying for
genotype may therefore be an appropriate consideration in this context, particularly
given the differences in mSST scores seen across genotypes in terms of severity
and rate of progression.
The mSST is a valuable clinical tool that offers a systematic way to monitor NGD
patients in the clinical setting. Part of its value is its ease of use, which means that it
could easily be incorporated into a registry or database format. This would allow
data about cohorts across the world to be captured systematically, and in a way that
can quantitatively measure change. Filling the gap about non-European cohorts,
and increasing the number of patients with various genotypes would offer a better
insight of whether stratifying according to genotype might be valuable in an adaptive
study design. In an approach known as data mining - where pooled accessible data
collection from well described phenotypes is used to build the foundation for a
retrospective data mining. This can be used to qualify new tools as biomarkers and
as possible markers for stratification.
An unavoidable limitation in the mSST use is the subjective aspect of evaluation.
Despite the guidance of severity offered in each domain the assessing clinician still
makes a subjective assessment on the presentation. Although this was not
186
considered to be an issue of concern in the small inter-reliability evaluation
performed, and would be minimised by having on responsible clinician score
sequentially, it is still vulnerable to this limitation, as is all clinical scores.
The GAITRite
The value of the GAITRite is that it has demonstrated itself to be an user-friendly
and sensitive assessment tool for distinguishing between NGD and Type I Gaucher
children. Four gait parameters in particular: Velocity, Cadence, Step Time and
Double Support are clinically relevant and sensitive to detecting abnormalities in the
gait profile of NGD children. Cadence became apparent while using the Z scores,
which may have been missed exploring the raw data only. These can be regarded
as meaningful markers of neurological disease in NGD.
A big disadvantage in proposing the GAITRite as a tool to monitor disease
progression is the lack of a trend in sequential results - that is some patients actually
appeared to have an improved gait pattern, which would not be expected in a
progressive disease like NGD. Identifying a reason why there is no evident trend is
difficult. Exploring the mSST data captured on the same assessment date,
demonstrates that all patients remained stable according to mSST scores.
In a small recent study exploring the behavioural aspect of NGD, McPartlan et al
(2010) identified that anxiety was a presenting feature in this cohort, with nearly 30%
reporting emotions of fear and worry (McPartlan et al. 2010). Such psychological
manifestations may also impact on the child’s performance in a clinical assessment,
187
particularly on the first attempt. It was hypothesised that this anxiety and fear may
have contributed to the child performing worse than could be explained by
pathological disease alone. To explore this possibility further, the original data set
for each walk, before it was combined into one mean test score was examined. If
anxiety and fear was a contributing factor, it was anticipated that each child would
improve slightly on each walk, and that this improvement would be consistent across
each of assessment. A wide variation was predicted for Patients 2 and 3 where
improvement was seen, with less for Patients 1 and 4, whom had shown more of a
deterioration. However, this was not observed. There was great variability across
the board, and no clear pattern emerged.
The value of the GAITRite at this time therefore remains unclear. The difference
observed in the gait pattern of NGD patients compared to Type I and normative data
indicated that it could be an useful marker, with proof of concept established.
However the lack of trend in sequential assessment is clearly at odds with the
progressive nature of the disease, and questions its value as a monitoring
assessment for disease severity and/or progression.
Studying a larger cohort, such as that studied with the mSST, and following the
patients over a longer period of time may provide a clearer indication of whether this
large variation completely prohibits the use of the GAITRite as a worthwhile
assessment.
188
These issues could again be addressed in a data mining exercise. Collating data
from world wide cohorts in a data bank would allow for retrospective hypotheses to
be performed and genotype-phenotype patterns of gait to be identified. This
certainly seems warranted given that the GAITRIte is an attractive clinical tool given
its ease of use, and the obvious impact of an impaired gait on the patient. This is
regardless of whether the gait abnormality is driven by cerebellar ataxia or
neuropathy, particularly as both are progressive in nature in NGD.
As previously mentioned, Velocity has been accepted as a primary endpoint in drug
trials by regulatory bodies. McDonald et al (2010) has also proposed that Velocity
can be utilised as a marker of disease status in neuromuscular disorders, not only
as a surrogate marker but as a meaningful clinical endpoint (McDonald et al. 2010).
Following their study comparing 21 ambulatory boys with Duchenne Muscular
Dystrophy (DMD) (median age 8 years) to 34 healthy controls (median age 9 years),
McDonald (2010) proposed that a change in performance on the 6MWT can be
defined as an intermediate, non-ultimate endpoint that directly assesses how an
ambulatory DMD patient functions.
McDonald and co-authors (2010) acknowledged that as their study was
observational, and that information regarding the MCID is necessary as the targeted
therapeutic difference in a clinical study is unknown. The necessity of
predetermining a MCID for establishing substantial evidence of effectiveness in the
therapy of a neurological disorder has been debated (Katz 2004). In the case of
Velocity however precedent does exist from the 6MWT.
189
Results from placebo-controlled, registration directed, randomised studies in MPS I,
MPS II and Pompe identified that Velocity in drug-treated patients increased
performance by 8% to 13% relative to placebo controlled patients. Based on this
McDonald et al (2010) suggest that a treatment effect of 30 to 40m (~8% to 11%)
might reasonably be targeted in future therapeutic clinical studies in DMD.
They do not address the confounding problem of accounting for age-related
increase, which could mistakenly be regarded as improvement in score. Based on
the assumption of looking for an 8 to 11% improvement, Velocity in NGD would
need to increase to between 100 and 103 cms/s. Based on the Alderson (2007)
LMS centile data however, in a 12 month period an expected improvement of 3-4%
would normally be expected with increasing age. 100-103cms/c would continue to
be 20% lower than that expected for a 10-11 year old age group however. This
highlights a complicated issue of incorporating the impact of growth on parameters,
but one that could be addressed with the use of Z scores.
The 6MWT calculates Velocity based on meters walked in 6 minutes. The GAITRite
calculates Velocity as centimetres walked per second. Transforming the data sets
we see that the NGD cohort covered less distance, despite the slightly older age
group (Table 5.2).
This may, of course be reflective of the different method of assessment. However,
both groups are much less than the normal values identified in a study examining
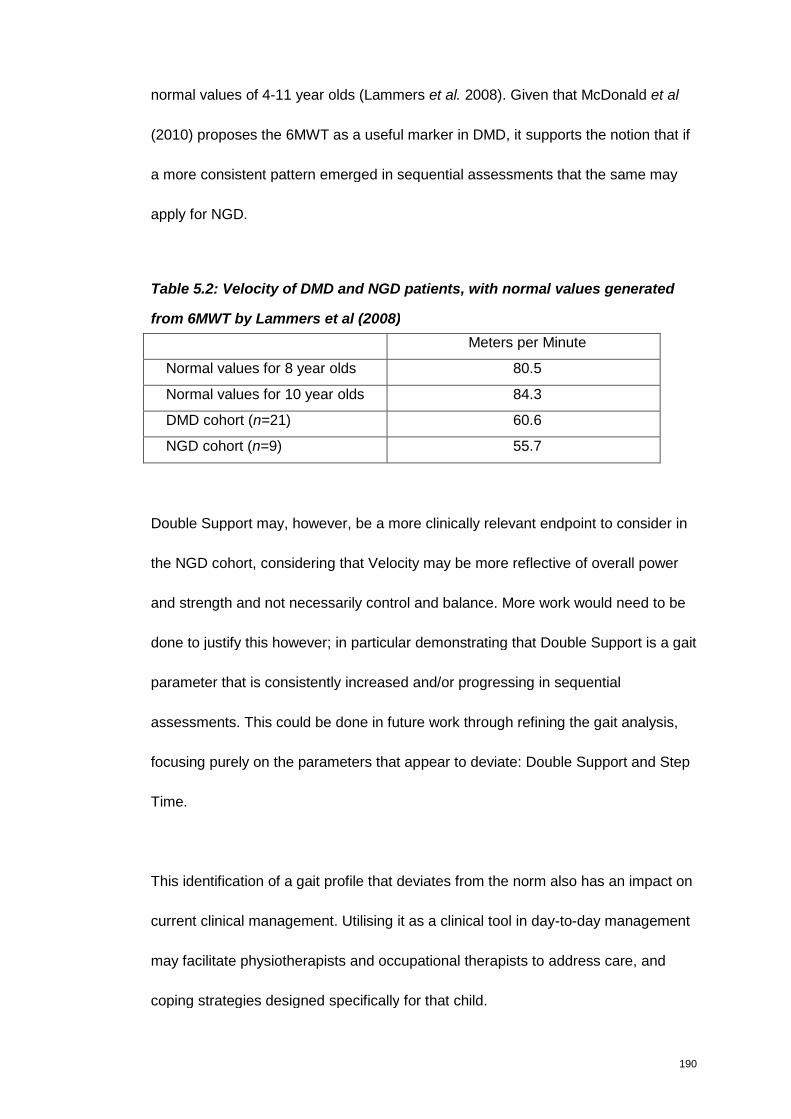
190
normal values of 4-11 year olds (Lammers et al. 2008). Given that McDonald et al
(2010) proposes the 6MWT as a useful marker in DMD, it supports the notion that if
a more consistent pattern emerged in sequential assessments that the same may
apply for NGD.
Table 5.2: Velocity of DMD and NGD patients, with normal values generated
from 6MWT by Lammers et al (2008)
Meters per Minute
Normal values for 8 year olds 80.5
Normal values for 10 year olds 84.3
DMD cohort (n=21) 60.6
NGD cohort (n=9) 55.7
Double Support may, however, be a more clinically relevant endpoint to consider in
the NGD cohort, considering that Velocity may be more reflective of overall power
and strength and not necessarily control and balance. More work would need to be
done to justify this however; in particular demonstrating that Double Support is a gait
parameter that is consistently increased and/or progressing in sequential
assessments. This could be done in future work through refining the gait analysis,
focusing purely on the parameters that appear to deviate: Double Support and Step
Time.
This identification of a gait profile that deviates from the norm also has an impact on
current clinical management. Utilising it as a clinical tool in day-to-day management
may facilitate physiotherapists and occupational therapists to address care, and
coping strategies designed specifically for that child.

191
Diffusion Tensor Imaging
DTI is a new and exciting assessment modality that has the potential to be
developed into a truly objective marker of disease. Its ability to identify an area of
statistical difference in a region of the brain that is in keeping with the clinical
presentation observed in this NGD cohort studied offers a ‘proof of concept’ to its
value, and makes it attractive for further exploratory work.
Although undergoing MR imaging is challenging for some children, its objectivity and
relative non-invasiveness compared to some assessments certainly makes it worthy
of further development. Notwithstanding their risks, complying with an MR can also
be facilitated with sedation or general anaesthetic. Particularly given the lack of
other in vivo alternatives.
A current disadvantage at this point is the lack of widespread use of the TBSS
approach in other therapeutic areas, along with the lack of complete agreement of
the trajectory of MD and FA changes during childhood. To enable larger number of
healthy and diseases children needs to be imaged, along with performing sequential
images. Addressing these issues will pave the way for encouraging regulatory
bodies to approve it as a clinical tool with the potential to be a disease marker. Once
again, this could be addressed in a global data mining exercise.
In summary, the mSST is believed to be the most valuable assessment tool out of
the three examined. This is based on the extensive work done to develop and
192
validate it and the ability of the data generated not only to demonstrate progression,
but also to demonstrate differentiation in scores according to genotype – indicating
its value to capture phenotype-genotype correlation.
The GAITRite and the DTI both generated interesting data, which justifies the value
of expanding the exploratory value of both. However, both needs further validation
before they can be considered as outcome measures in either clinical care or in
clinical trial use.

193
Chapter 6
Conclusion
“Commitment is doing the thing that you said you would do, long after the mood in
which you said it in has left you.”
Ben Saunders
194
During this development of the mSST this work has demonstrated its use as a
useful marker of disease severity in NGD. The sequential data generated in this
study has indeed demonstrated that the mSST is effective for purpose . It was
sensitive enough, not only to demonstrate its responsiveness to change, but to also
distinguish between phenotypes. This is a crucially important distinction to allow for
genotype-phenotype stratification in clinical trials, but also in providing counselling to
patients, parents and families on the expected disease course trajectory. Based on
that fact that it was used in three different European countries the findings are more
representative than if the study had been limited to one geographical region only,
which is a real strength in its validity and value.
The involvement of international experts in its development will encourage its use by
world wide experts managing NGD patients – ideally in a registry or database format.
Its inclusion in the revised guidelines (Vellodi et al. 2009) for the management of
NGD patients will also facilitate this – assisting in a comprehensive understanding of
the ‘natural history’ of the disease in the ERT era and the most frequently presenting
domains which can be used for disease monitoring.
While the data generated from the GAITRite and DTI assessments are currently
inconclusive for immediate use, the number of children recruited for each were small,
despite being reflective of the rarity of NGD and the difficulty of a single centre study.
However, the numbers studied can be considered as sufficient to justify that gait and
the white matter tract as areas worthy of further exploration. Ideally this should be
done in a larger multi centre study, encompassing the European cohort studied
195
during mSST development, would be valuable to corroborate these findings, and to
make further progress in determining their value as disease markers.
This work has highlighted the benefit of systematically assessing the neurological
manifestations of NGD. Incorporating the parameters of gait and DTI in databases
or registries will allow for data mining and retrospective hypothesis testing. All of
which will ultimately lead to an improved knowledge base that will facilitate the
design of future clinical trials for NGD patients.
196
Literature Cited
Literature Cited
Abdel Razek, A. A., N. bd El-Gaber, A. Abdalla, A. Fathy, A. Azab et al. 2009 Apparent
diffusion coefficient vale of the brain in patients with Gaucher's disease type II and
type III. Neuroradiology 51: 773-779.
Abrahamov, A., D. Elstein, V. Gross-Tsur, B. Farber, Y. Glaser et al. 1995 Gaucher's
disease variant characterised by progressive calcification of heart valves and unique
genotype. Lancet 346: 1000-1003.
Abrahamov, A., D. Elstein, and A. Zimran, 2000 Type IIIc Gaucher disease and
acrodysostosis. Isr.Med.Assoc.J. 2: 182.
Adams R. D., M. Victor, and A. H. Ropper, 1997 Disorders of stance and gait. McGraw-Hill,
New York.
Albrecht, J., P. R. Dellani, M. J. Muller, I. Schermuly, M. Beck et al. 2007 Voxel based
analyses of diffusion tensor imaging in Fabry disease. J
Neurol.Neurosurg.Psychiatry 78: 964-969.
Alderson, L. 2007. Measuring normal and impaired walking in children using the GAITRite
walkway. University of Hertfordshire.
Alderson, L., T. Watson, and E. Main, 2007 Assessment of Dynamic Walking Balance in
Children with Acquired Brain Injury. Physical Therapy Reviews 12: 3-20.
Altarescu, G., S. Hill, E. Wiggs, N. Jeffries, C. Kreps et al. 2001 The efficacy of enzyme
replacement therapy in patients with chronic neuronopathic Gaucher's disease. J
Pediatr 138: 539-547.
Aoki, M., Y. Takahashi, Y. Miwa, S. Iida, K. Sukegawa et al. 2001 Improvement of
neurological symptoms by enzyme replacement therapy for Gaucher disease type
IIIb. Eur.J.Pediatr. 160: 63-64.
Ashburner, J., and K. J. Friston, 2000 Voxel-based morphometry--the methods. NeuroImage
11: 805-821.
Barneveld, R. A., W. Keijzer, F. P. Tegelaers, E. I. Ginns, K. A. Geurts van et al. 1983
Assignment of the gene coding for human beta-glucocerebrosidase to the region
q21-q31 of chromosome 1 using monoclonal antibodies. Hum.Genet. 64: 227-231.
Barranger, J., E. Rice, J. Dunigan, C. Sansieri, N. Takiyama et al. 1997 Gaucher's disease:
studies of gene transfer to haematopoietic cells. Baillieres Clin Haematol 10: 765-
778.
197
Barton, N. W., F. S. Furbish, G. J. Murray, M. Garfield, and R. O. Brady, 1990 Therapeutic
response to intravenous infusions of glucocerebrosidase in a patient with Gaucher
disease. Proc.Natl.Acad.Sci.U.S.A 87: 1913-1916.
Basser, P. J., J. Mattiello, and D. LeBihan, 1994 MR diffusion tensor spectroscopy and
imaging. Biophys.J 66: 259-267.
Bava, S., R. J. Theilmann, M. Sach, S. J. May, L. R. Frank et al. 2010 Developmental
changes in cerebral white matter microstructure in a disorder of lysosomal storage.
Cortex 46: 206-216.
Berger, A., 2002 Magnetic resonance imaging. BMJ 324: 35.
Bladen, M., L. Alderson, K. Khair, R. Liesner, J. Green et al. 2007 Can early subclinical
gait changes in children with haemophilia be identified using the GAITRite walkway.
Haemophilia. 13: 542-547.
Bohlega, S., M. Kambouris, M. Shahid, H. M. Al, and S. W. Al, 2000 Gaucher disease with
oculomotor apraxia and cardiovascular calcification (Gaucher type IIIC). Neurology
54: 261-263.
Bowling A., 2001 Measuring Disease. Open University Press.
Cano, S. J., J. C. Hobart, P. E. Hart, L. V. Korlipara, A. H. Schapira et al. 2005 International
Cooperative Ataxia Rating Scale (ICARS): appropriate for studies of Friedreich's
ataxia? Mov Disord. 20: 1585-1591.
Cascio J.C, Gudio G & Piven J. Diffusion Tensor Imaging: Application to the Study of the
Developing Brain. J Am Acad Child Adolesc P 46[2], 213-223. 2007.
Ref Type: Electronic Citation
Chabas, A., B. Cormand, S. Balcells, R. Gonzalez-Duarte, C. Casanova et al. 1996
Neuronopathic and non-neuronopathic presentation of Gaucher disease in patients
with the third most common mutation (D409H) in Spain. J.Inherit.Metab Dis. 19:
798-800.
Chabas, A., B. Cormand, D. Grinberg, J. M. Burguera, S. Balcells et al. 1995 Unusual
expression of Gaucher's disease: cardiovascular calcifications in three sibs
homozygous for the D409H mutation. J Med.Genet. 32: 740-742.
Chang, Y. C., C. C. Huang, C. Y. Chen, and R. A. Zimmerman, 2000 MRI in acute
neuropathic Gaucher's disease. Neuroradiology 42: 48-50.
Charrow, J., H. C. Andersson, P. Kaplan, E. H. Kolodny, P. Mistry et al. 2000 The Gaucher
registry: demographics and disease characteristics of 1698 patients with Gaucher
disease. Arch.Intern.Med. 160: 2835-2843.
Cole, T. J., and P. J. Green, 1992 Smoothing reference centile curves: the LMS method and
penalized likelihood. Stat.Med. 11: 1305-1319.
198
Committee for Medicinal Products for Human Use & (CHMP). Concept Paper on the Need
for the Development of a Paediatric Addendum to the CHMP Guideline on the
Clinical Investigations of Medicinal Products for the treatment of Pulmonary
Arterial Hypertension. European Medicine Agency . 2009. 15-5-2010.
Ref Type: Electronic Citation
Committee for Medicinal Products for Human Use & CHMP. Guideline on Clinical Trials in
Small Populations. European Medicine Agency . 2007.
Ref Type: Electronic Citation
Cox, T. M., J. M. Aerts, G. Andria, M. Beck, N. Belmatoug et al. 2003 The role of the
iminosugar N-butyldeoxynojirimycin (miglustat) in the management of type I (non-
neuronopathic) Gaucher disease: a position statement. J.Inherit.Metab Dis. 26: 513-
526.
Davies, E. H., A. Erikson, T. Collin-Histed, E. Mengel, A. Tylki-Szymanska et al. 2007a
Outcome of type III Gaucher disease on enzyme replacement therapy: review of 55
cases. J.Inherit.Metab Dis. 30: 935-942.
Davies, E. H., R. Surtees, C. DeVile, I. Schoon, and A. Vellodi, 2007b A severity scoring
tool to assess the neurological features of neuronopathic Gaucher disease.
J.Inherit.Metab Dis. 30: 768-782.
Della, N. R., A. Ginestroni, C. Tessa, M. Cosottini, M. Giannelli et al. 2008 Brain structural
damage in spinocerebellar ataxia type 2. A voxel-based morphometry study. Mov
Disord. 23: 899-903.
Di Rocco, M., F. Giona, F. Carubbi, S. Linari, F. Minichilli et al. 2008 A new severity score
index for phenotypic classification and evaluation of responses to treatment in type I
Gaucher disease. Haematologica 93: 1211-1218.
Dickerson B.C. & Sperling R.A. Neuroimaging Biomarkers for Clinical Trials of Disease-
Modifying Therapies in Alzheimer's Disease. The American Society for
Experimental NeuroTherapeutics 2, 348-360. 2005.
Ref Type: Electronic Citation
Dreborg, S., A. Erikson, and B. Hagberg, 1980 Gaucher disease--Norrbottnian type. I.
General clinical description. Eur.J.Pediatr. 133: 107-118.
Dusing, S. C., and D. E. Thorpe, 2007 A normative sample of temporal and spatial gait
parameters in children using the GAITRite electronic walkway. Gait.Posture. 25:
135-139.
Dusing, S. C., D. E. Thorpe, V. S. Mercer, A. E. Rosenberg, M. D. Poe et al. 2007 Temporal
and spatial gait characteristics of children with Hurler syndrome after umbilical cord
blood transplantation. Phys.Ther. 87: 978-985.
Eisenhardt, A., 1996 Changes in temporal gait characteristics and pressure distribution for
bare feet versus heel height. Gait & Posture 4: 280-286.

199
Erikson, A., 2001 Remaining problems in the management of patients with Gaucher disease.
J.Inherit.Metab Dis. 24 Suppl 2: 122-126.
Erikson, A., H. Forsberg, M. Nilsson, M. Astrom, and J. E. Mansson, 2006 Ten years'
experience of enzyme infusion therapy of Norrbottnian (type 3) Gaucher disease.
Acta Paediatr. 95: 312-317.
Erikson, A., C. G. Groth, J. E. Mansson, A. Percy, O. Ringden et al. 1990 Clinical and
biochemical outcome of marrow transplantation for Gaucher disease of the
Norrbottnian type. Acta Paediatr.Scand. 79: 680-685.
Escolar, M., M. D. Poe, J. K. Smith, J. H. Gilmore, J. Kurtzberg et al. 2009 Diffusion tensor
imaging detects abnormalities in the corticospinal tracts of neonates with infantile
Krabbe disease. American Journal of Neuroradiology 30.
Fellgiebel, A., M. Mazanek, C. Whybra, M. Beck, R. Hartung et al. 2006 Pattern of
microstructural brain tissue alterations in Fabry disease: a diffusion-tensor imaging
study. J Neurol. 253: 780-787.
Fox N. & Growdon M.D. Biomarkers and Surrogates Editorial. The American Society for
Experimental NeuroTherapeutics 1, 181. 2004.
Ref Type: Electronic Citation
Fredrickson, D. M., and H. R. Sloan, 1972 Gucosyl ceramide lipidoses: Gaucher's disease, p.
730 in The Metabolic Basis of Inherited Diseases, edited by J. B. Stanbury, J. B.
Wyngaarden, and D. M. Fredrickson.
Furbish, F. S., H. E. Blair, J. Shiloach, P. G. Pentchev, and R. O. Brady, 1977 Enzyme
replacement therapy in Gaucher's disease: large-scale purification of
glucocerebrosidase suitable for human administration. Proc.Natl.Acad.Sci.U.S.A 74:
3560-3563.
Garbutt, S., and C. M. Harris, 2000 Abnormal vertical optokinetic nystagmus in infants and
children. Br.J Ophthalmol. 84: 451-455.
Geiger R., Strasak A., Treml B., Gasser K., Kleinsasser A. & Fischer V. Six-minute walk
test in children and adolescents. J Pediatr 150[4], 395-399. 2010.
Ref Type: Electronic Citation
Giannini, E. H., A. B. Mehta, M. J. Hilz, M. Beck, D. G. Bichet et al. 2010 A validated
disease severity scoring system for Fabry disease. Mol.Genet.Metab 99: 283-290.
Giannini, E. H., N. Ruperto, A. Ravelli, D. J. Lovell, D. T. Felson et al. 1997 Preliminary
definition of improvement in juvenile arthritis. Arthritis Rheum. 40: 1202-1209.
Goker-Alpan, O., R. Schiffmann, J. K. Park, B. K. Stubblefield, N. Tayebi et al. 2003
Phenotypic continuum in neuronopathic Gaucher disease: an intermediate phenotype
between type 2 and type 3. J.Pediatr. 143: 273-276.
200
Guo, A. C., J. R. Petrella, J. Kurtzberg, and J. M. Provenzale, 2001a Evaluation of white
matter anisotropy in Krabbe disease with diffusion tensor MR imaging: initial
experience. Radiology 218: 809-815.
Guo, A. C., J. R. Petrella, J. Kurtzberg, and J. M. Provenzale, 2001b Evaluation of white
matter anisotropy in Krabbe disease with diffusion tensor MR imaging: initial
experience. Radiology 218: 809-815.
Hannerieke, M. P., H. van den, W. Opd, T. Ans, and P. van der, 2003 The Natural Course of
Infantile Pompe's Disease: 20 Original Cases Compared with 133 Cases from the
Literature. Pediatrics 112: 332-339.
Hof, A. L., and W. Zijlstra, 1997 Comment on "Normalization of Temporal-Distance
Parameters in Pediatric Gait". Journal of Biomechanics 30: 299.
Hof, at. L., 1996 Scaling gait data to body size. Gait & Posture 4: 222-223.
Holm, I., A. T. Tveter, P. M. Fredriksen, and N. Vollestad, 2009 A normative sample of gait
and hopping on one leg parameters in children 7-12 years of age. Gait & Posture 29:
317-321.
Hruska, K. S., M. E. LaMarca, and E. Sidransky, 2007 Gaucher Disease: Molecular Biology
and Genotype-Phenotype Correlations, pp. 13-48 in Gaucher Disease, edited by A.
H. Futerman, and A. Zimran. Taylor & Francis, London.
Huiqi P. & Cole T.J. User's guide to ImsGrowth. Medical Research Council, UK . 2005.
Ref Type: Electronic Citation
International Conference on Harmonisation. Harmonised Tripartite Guideline on Statistical
Principles for Clinical Trials (E9). ICH . 1998. 6-12-2009.
Ref Type: Electronic Citation
International Conference on Harmonisation. Clinical Investigation of Medicinal Products in
the Pediatric Population E11. ICH . 2000.
Ref Type: Electronic Citation
Iturriaga, C., M. Pineda, E. M. Fernandez-Valero, M. T. Vanier, and M. J. Coll, 2006
Niemann-Pick C disease in Spain: clinical spectrum and development of a disability
scale. J.Neurol.Sci. 249: 1-6.
Jardim, L. B., M. M. Villanueva, C. F. de Souza, and C. B. Netto, 2010 Clinical aspects of
neuropathic lysosomal storage disorders. J Inherit.Metab Dis. 33: 315-329.
Katz, R., 2004 Biomarkers and surrogate markers: an FDA perspective. NeuroRx 1: 189-195.
Kierkegaard, M., and A. Tollback, 2007 Reliability and feasibility of the six minute walk test
in subjects with myotonic dystrophy. Neuromuscul.Disord. 17: 943-949.
Kirtley C., 2006 Clinical Gait Analysis Theory and Practice. Churchill Livingstone, London.
201
Kohlschutter, A., R. Laabs, and M. Albani, 1988 Juvenile neuronal ceroid lipofuscinosis
(JNCL): quantitative description of its clinical variability. Acta Paediatr.Scand. 77:
867-872.
Krebs, D. E. G. D., J. D. Lockert, L. G. Portney, and K. M. Gill-Body, 2002 Is Base of
Support Greater in Unsteady Gait? Physical Therapy 82: 138-147.
Kressig, R. W., and A. Beauchet, 2005 Guidelines for clinical applications of spatio-
temporal gait analysis in older adults. Aging Clinical Experience and Research 18:
1-3.
Lammers A.E., Hislop A.A., Flynn Y. & Haworth S.G. The 6-minute walk test: normal
values for children of 4-11 years of age. Arch.Dis.Child 93, 464-468. 2008.
Ref Type: Electronic Citation
LeBihan, D., J. F. Mangin, C. Poupon, C. A. Clark, S. Pappata et al. 2001 Diffusion tensor
imaging: concepts and applications. J Magn Reson.Imaging 13: 534-546.
Lee, R. E., 1982 The pathology of Gaucher disease. Prog.Clin.Biol.Res. 95: 177-217.
Lonser, R. R., R. Schiffman, R. A. Robison, J. A. Butman, Z. Quezado et al. 2007 Image-
guided, direct convective delivery of glucocerebrosidase for neuronopathic Gaucher
disease. Neurology 68: 254-261.
Lynch, D. R., J. M. Farmer, A. Y. Tsou, S. Perlman, S. H. Subramony et al. 2006 Measuring
Friedreich ataxia: complementary features of examination and performance
measures. Neurology 66: 1711-1716.
Lyon G., E. H. Kolodny, and G. Pastores, 2006 Neurology of Hereditary Metabolic Disease
of Children.
Masur A., 2007 Scales & Scores in Neurology. Thieme Verlag.
McDonald, C. M., E. K. Henricson, J. J. Han, and T. R. Abresch, 2010 The 6-minute walk
test as a new outcome measure in Duchenne Muscular Dystrophy. Muscle and Nerve
April: 500-510.
McDonough, A. L., M. Batavia, F. C. Chen, S. Kwon, and J. Ziai, 2001 The validity and
reliability of the GAITRite system's measurements: A preliminary evaluation.
Arch.Phys.Med.Rehabil. 82: 419-425.
McPartlan L., Vellodi A., Ahmed R. & Santosh P. Behavioural Aspects of Gaucher Disease -
An Explorative Study. European Gaucher Leadership Forum. 2010. 1-10-2010.
Ref Type: Conference Proceeding
Meikle, P. J., J. J. Hopwood, A. E. Clague, and W. F. Carey, 1999a Prevalence of lysosomal
storage disorders. JAMA 281: 249-254.
Meikle, P. J., E. Ranieri, E. M. Ravenscroft, C. T. Hua, D. A. Brooks et al. 1999b Newborn
screening for lysosomal storage disorders. Southeast Asian J.Trop.Med.Public
Health 30 Suppl 2: 104-110.
202
Meyer, A., K. Kossow, A. Gal, C. Muhlhausen, K. Ulrich et al. 2007 Scoring Evaluation of
the Natural Course of Mucopolysaccharidosis Type IIIA (Sanfilippo Syndrome Type
A). Pediatrics 120: e1255-e1261.
Migita, M., H. Hamada, J. Fujimura, A. Watanabe, T. Shimada et al. 2003
Glucocerebrosidase level in the cerebrospinal fluid during enzyme replacement
therapy--unsuccessful treatment of the neurological abnormality in type 2 Gaucher
disease. Eur.J.Pediatr. 162: 524-525.
Mistry, P. K., P. Deegan, A. Vellodi, J. A. Cole, M. Yeh et al. 2009 Timing of initiation of
enzyme replacement therapy after diagnosis of type 1 Gaucher disease: effect on
incidence of avascular necrosis. Br.J Haematol. 147: 561-570.
Mukherjee, P., J. H. Miller, J. S. Shimony, J. V. Philip, D. Nehra et al. 2002 Diffusion-
tensor MR imaging of gray and white matter development during normal human
brain maturation. AJNR Am.J Neuroradiol. 23: 1445-1456.
Nicoletti, G., R. Lodi, F. Condino, C. Tonon, F. Fera et al. 2006 Apparent diffusion
coefficient measurements of the middle cerebellar peduncle differentiate the
Parkinson variant of MSA from Parkinson's disease and progressive supranuclear
palsy. Brain 129: 2679-2687.
O'Malley, M. J., 1996 Normalization of temporal-distance parameters in pediatric gait. J
Biomech. 29: 619-625.
Pagano R. R., 2004 Understanding Statistics in Behavioural Sciences. Thomson Wadsworth,
London.
Peters, C., and W. Krivit, 2007 Hematopoietic Stem Cell Transplantation, pp. 423-438 in
Gaucher Disease, edited by A. H. Futerman, and A. Zimran. Taylor & Francis,
London.
Phoenix, C., Am. M. Schaefer, J. L. Elson, E. Morava, M. Bugiani et al. 2006 A scale to
monitor progression and treatment of mitochondrial disease in children.
Neuromuscular Diorders 16: 814-820.
Pierpaoli, C., and P. J. Basser, 1996 Toward a quantitative assessment of diffusion
anisotropy. Magn Reson.Med. 36: 893-906.
Pierpaoli, C., P. Jezzard, P. J. Basser, A. Barnett, and C. G. Di, 1996 Diffusion tensor MR
imaging of the human brain. Radiology 201: 637-648.
Platt, F. M., and T. M. Cox, 2007 Substrate Reduction Therapy, pp. 355-376 in Gaucher
Disease, edited by A. H. Futerman, and A. Zimran. Taylor & Francis, London.
Rider, L. G., E. H. Giannini, H. I. Brunner, N. Ruperto, L. James-Newton et al. 2004
International consensus on preliminary definitions of improvement in adult and
juvenile myositis. Arthritis Rheum. 50: 2281-2290.
203
Rinehart, N. J., B. J. Tonge, R. Iansek, J. McGinley, A. V. Brereton et al. 2006 Gait
function in newly diagnosed children with autism: Cerebellar and basal ganglia
related motor disorder. Dev.Med.Child Neurol. 48: 819-824.
Rowan, A., F. Vargha-Khadem, F. Calamante, J.-D. Tornier, F. J. Kirkham et al. 2007
Cortical abnormalities and language function in young patients with basal ganglia
stroke. NeuroImage 36: 431-440.
Rusca, C. L., 1921 Sul morbo del Gaucher. Hematoogica (Pavia) 2: 441.
Schiffman R., Heyes M.P., Aerts J.M., Dambrosia M.C. & Patterson M.C. Prospective study
of neurological responses to treatment with macrophage-targeted glucocerebrosidase
in patients with type 3 Gaucher's disease. Ann.Neurol. 42, 613-621. 1997.
Ref Type: Electronic Citation
Schiffmann, R., and A. Vellodi, 2007 Neuronopathic Gaucher Disease, pp. 175-196 in
Gaucher Disease, edited by A. H. Futerman, and A. Zimran. CRC Press, Florida.
Schiffmann, R., E. J. Fitzgibbon, C. Harris, C. DeVile, E. H. Davies et al. 2008 Randomized,
controlled trial of miglustat in Gaucher's disease type 3. Ann.Neurol. 64: 514-522.
Schmithorst, V. J., M. Wilke, B. J. Dardzinski, and S. K. Holland, 2002 Correlation of white
matter diffusivity and anisotropy with age during childhood and adolescence: a
cross-sectional diffusion-tensor MR imaging study. Radiology 222: 212-218.
Schneider, J. F., K. A. Il'yasov, J. Henning, and E. Martin, 2004 Fast quantitative diffusion-
tensor imaging of cerebral white matter from the neonatal period to adolescence.
Neuroradiology 46: 258-266.
Schulz, J. B., S. Boesch, K. Burk, A. Durr, P. Giunti et al. 2009 Diagnosis and treatment of
Friedreich ataxia: a European perspective. Nat.Rev.Neurol. 5: 222-234.
Selby-Silverstein, L., and S. O'Reilly, 2003 Temporal-Spatial Gait Paramaters and their
Variability in Children aged one to five years. Gait & Posture 18: S75.
Seunarine K.K., Clayden S., Jentschke M., Munoz M., Cooper M.J., Banks T., Vargha-
Khadem F. & Clark C.A. Investigating brain development in childhood using TBSS.
British Chapter Meeting. International Society for Magnetic Resonance in Medicine .
2010.
Ref Type: Conference Proceeding
Shapiro, B. E., G. M. Pastores, J. Gianutsos, C. Luzy, and E. H. Kolodny, 2009 Miglustat in
late-onset Tay-Sachs disease: a 12-month, randomized, controlled clinical study with
24 months of extended treatment. Genet.Med. 11: 425-433.
Shore, W. S., B. J. deLateur, K. V. Kuhlemeier, H. Imteyaz, G. Rose et al. 2005 A
comparison of gait assessment methods: Tinetti and GAITRite electronic walkway.
J.Am.Geriatr.Soc. 53: 2044-2045.
Sidransky, E., 2004 Gaucher disease: complexity in a "simple" disorder. Mol.Genet.Metab
83: 6-15.
204
Sidransky, E., 2005 Gaucher disease and parkinsonism. Mol.Genet.Metab 84: 302-304.
Smith S.M., Jenkinson H., Johansen-Berg D., Rueckert T.E. & Nicholas E. Tract-based
spatial statistics: voxelwise analysis of mulyi-subject diffusion data. NeuroImage 31,
1487-1505. 2006.
Ref Type: Electronic Citation
Stansfield, B. W., S. J. Hillman, M. E. Hazlewood, A. M. Lawson, A. M. Mann et al. 2003
Normalisation of gait data in children. Gait Posture 17: 81-87.
Steinfeld, R., P. Heim, G. H. von, K. Meyer, K. Ullrich et al. 2002 Late infantile neuronal
ceroid lipofuscinosis: quantitative description of the clinical course in patients with
CLN2 mutations. Am.J.Med.Genet. 112: 347-354.
Stolze, H., S. Klebe, G. Petersen, J. Raethjen, R. Wenzelburger et al. 2002 Typical features
of cerebellar ataxic gait. J.Neurol.Neurosurg.Psychiatry 73: 310-312.
Storey, E., K. Tuck, R. Hester, A. Hughes, and A. Churchyard, 2004 Inter-rater reliability of
the International Cooperative Ataxia Rating Scale (ICARS). Mov Disord. 19: 190-
192.
Sutherland, D., 1997 The develpoment pf a mature gait. Gait & Posture 6: 163-170.
Svennerholm, L., A. Erikson, C. G. Groth, O. Ringden, and J. E. Mansson, 1991
Norrbottnian type of Gaucher disease--clinical, biochemical and molecular biology
aspects: successful treatment with bone marrow transplantation. Dev.Neurosci. 13:
345-351.
Thomas, M., J. Jankovic, M. Suteerawattananon, S. Wankadia, K. S. Caroline et al. 2004
Clinical gait and balance scale (GABS): validation and utilization. J.Neurol.Sci. 217:
89-99.
Thorpe, D. E., S. C. Dusing, and C. G. Moore, 2005 Repeatability of temporospatial gait
measures in children using the GAITRite electronic walkway.
Arch.Phys.Med.Rehabil. 86: 2342-2346.
Trouillas, P., T. Takayanagi, M. Hallett, R. D. Currier, S. H. Subramony et al. 1997
International Cooperative Ataxia Rating Scale for pharmacological assessment of the
cerebellar syndrome. The Ataxia Neuropharmacology Committee of the World
Federation of Neurology. J.Neurol.Sci. 145: 205-211.
Tylki-Szymanska, A., M. Keddache, and G. A. Grabowski, 2006 Characterization of
neuronopathic Gaucher disease among ethnic Poles. Genet.Med. 8: 8-15.
Tylki-Szymanska, A., G. Millat, I. Maire, and B. Czartoryska, 1996 Types I and III Gaucher
disease in Poland: incidence of the most common mutations and phenotypic
manifestations. Eur.J.Hum.Genet. 4: 334-337.
Tylki-Szymanska, A., A. Vellodi, A. El-Beshlawy, J. A. Cole, and E. Kolodny, 2010
Neuronopathic Gaucher disease: demographic and clinical features of 131 patients
205
enrolled in the International Collaborative Gaucher Group Neurological Outcomes
Subregistry. J Inherit.Metab Dis. 33: 339-346.
van Gestel, A. M., M. L. Prevoo, M. A. van 't Hof, M. H. van Rijswijk, L. B. van de Putte et
al. 1996 Development and validation of the European League Against Rheumatism
response criteria for rheumatoid arthritis. Comparison with the preliminary
American College of Rheumatology and the World Health
Organization/International League Against Rheumatism Criteria. Arthritis Rheum.
39: 34-40.
Vellodi, A., 2005 Lysosomal storage disorders. Br.J.Haematol. 128: 413-431.
Vellodi, A., B. Bembi, T. B. de Villemeur, T. Collin-Histed, A. Erikson et al. 2001
Management of neuronopathic Gaucher disease: a European consensus.
J.Inherit.Metab Dis. 24: 319-327.
Vellodi, A., A. Tylki-Szymanska, E. H. Davies, E. Kolodny, B. Bembi et al. 2009
Management of neuronopathic Gaucher disease: revised recommendations.
J.Inherit.Metab Dis. 32: 660-664.
Verghese, J., R. F. Goldberg, R. J. Desnick, M. E. Grace, J. E. Goldman et al. 2000
Myoclonus from selective dentate nucleus degeneration in type 3 Gaucher disease.
Arch.Neurol. 57: 389-395.
Weinreb, N. J., J. Charrow, H. C. Andersson, P. Kaplan, E. H. Kolodny et al. 2002
Effectiveness of enzyme replacement therapy in 1028 patients with type 1 Gaucher
disease after 2 to 5 years of treatment: a report from the Gaucher Registry. Am.J.Med.
113: 112-119.
Whittle M. W., 2007 Gait Analysis: An intriduction. Elsevier Health Sciences, Oxford:
Butterworth-Heinemann.
Whybra, C., C. Kampmann, F. Krummenauer, M. Ries, E. Mengel et al. 2004 The Mainz
Severity Score Index: a new instrument for quantifying the Anderson-Fabry disease
phenotype, and the response of patients to enzyme replacement therapy. Clin.Genet.
65: 299-307.
Wondra, V. C., K. H. Pitetti, and M. W. Beets, 2007 Gait parameters in children with motor
disabilities using an electronic walkway system: assessment of reliability.
Pediatr.Phys.Ther. 19: 326-331.
Wong, K., 2007 Neuropathological Aspects of Gaucher Disease, pp. 225-248 in Gaucher
Disease, edited by A. H. Futerman, and A. Zimran. Taylor & Francis, London.
Wong, K., E. Sidransky, A. Verma, T. Mixon, G. D. Sandberg et al. 2004 Neuropathology
provides clues to the pathophysiology of Gaucher disease. Mol.Genet.Metab 82:
192-207.
Wood M., Cleary M.A., Alderson L. & Vellodi A. Changes in Gait Pattern as Assessed by
the GaitRite™ walkway system in MPS II patients undergoing enzyme replacement
206
therapy. J.Inherit.Metab Dis. 2009.
Ref Type: In Press
Wraith, J. E., 2002 Lysosomal disorders. Semin.Neonatol. 7: 75-83.
Wraith, J. E., M. Scarpa, M. Beck, O. A. Bodamer, M. L. De et al. 2008
Mucopolysaccharidosis type II (Hunter syndrome): a clinical review and
recommendations for treatment in the era of enzyme replacement therapy.
Eur.J.Pediatr. 167: 267-277.
Yanjanin, N. M., J. I. Velez, A. Gropman, K. King, S. E. Bianconi et al. 2010b Linear
clinical progression, independent of age of onset, in Niemann-Pick disease, type C.
Am.J Med.Genet.B Neuropsychiatr.Genet. 153B: 132-140.
Yanjanin, N. M., J. I. Velez, A. Gropman, K. King, S. E. Bianconi et al. 2010a Linear
clinical progression, independent of age of onset, in Niemann-Pick disease, type C.
Am.J Med.Genet.B Neuropsychiatr.Genet. 153B: 132-140.
Young, P. A., and P. H. Young, 1997 The Cerebellum: Ataxia, pp. 99-116 in Basic Clinical
Neuroanatomy, Williams & Wilkins, Baltimore.
Zhang, L., K. M. Thomas, M. C. Davidson, B. J. Casey, L. A. Heier et al. 2005 MR
quantification of volume and diffusion changes in the developing brain. American
Journal of Neuroradiology 26: 45-49.
Zijlstra, W., T. Prokop, and W. Berger, 1994 Adaptability of leg movements during normal
treadmill walking and split-belt walking in children. Gait & Posture 4: 212-221.
Zimran, A., J. Sorge, and A. Gross, 1989 Prediction of Severity of Gaucher's disease by
identification of mutations at DNA level. The Lancet 2: 349-352.
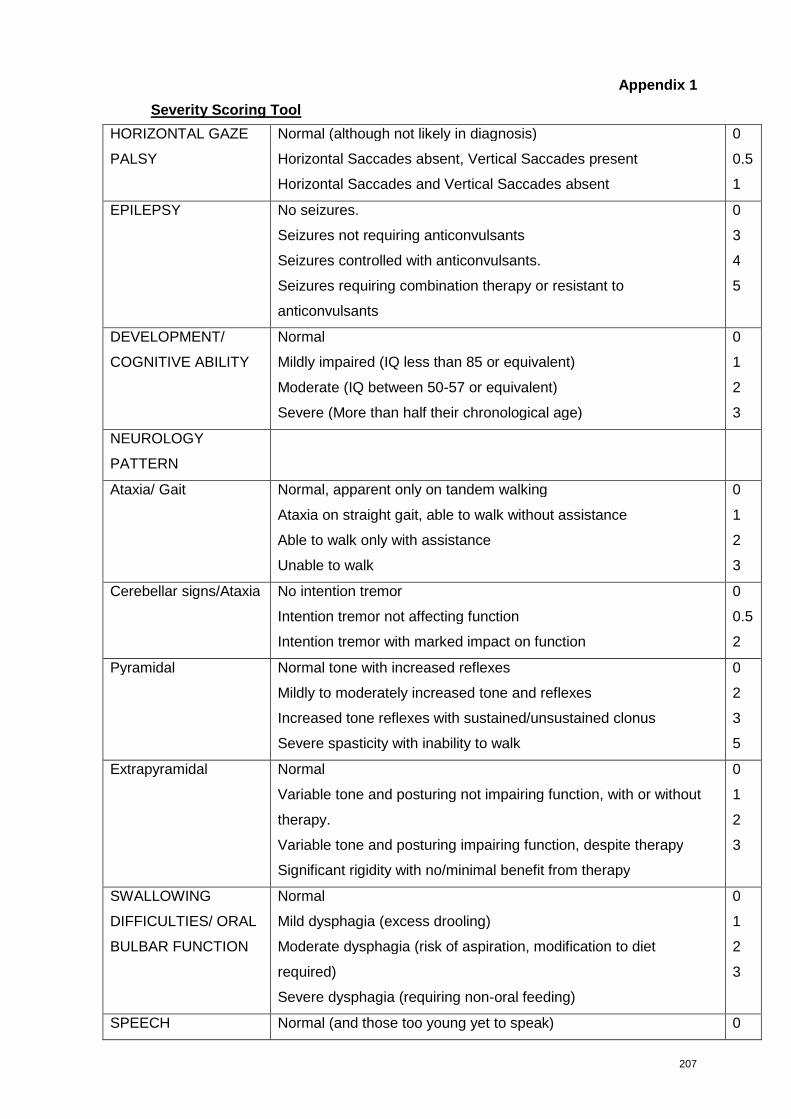
207
Appendix 1
Severity Scoring Tool
HORIZONTAL GAZE
PALSY
Normal (although not likely in diagnosis)
Horizontal Saccades absent, Vertical Saccades present
Horizontal Saccades and Vertical Saccades absent
0
0.5
1
EPILEPSY No seizures.
Seizures not requiring anticonvulsants
Seizures controlled with anticonvulsants.
Seizures requiring combination therapy or resistant to
anticonvulsants
0
3
4
5
DEVELOPMENT/
COGNITIVE ABILITY
Normal
Mildly impaired (IQ less than 85 or equivalent)
Moderate (IQ between 50-57 or equivalent)
Severe (More than half their chronological age)
0
1
2
3
NEUROLOGY
PATTERN
Ataxia/ Gait Normal, apparent only on tandem walking
Ataxia on straight gait, able to walk without assistance
Able to walk only with assistance
Unable to walk
0
1
2
3
Cerebellar signs/Ataxia No intention tremor
Intention tremor not affecting function
Intention tremor with marked impact on function
0
0.5
2
Pyramidal Normal tone with increased reflexes
Mildly to moderately increased tone and reflexes
Increased tone reflexes with sustained/unsustained clonus
Severe spasticity with inability to walk
0
2
3
5
Extrapyramidal Normal
Variable tone and posturing not impairing function, with or without
therapy.
Variable tone and posturing impairing function, despite therapy
Significant rigidity with no/minimal benefit from therapy
0
1
2
3
SWALLOWING
DIFFICULTIES/ ORAL
BULBAR FUNCTION
Normal
Mild dysphagia (excess drooling)
Moderate dysphagia (risk of aspiration, modification to diet
required)
Severe dysphagia (requiring non-oral feeding)
0
1
2
3
SPEECH Normal (and those too young yet to speak) 0
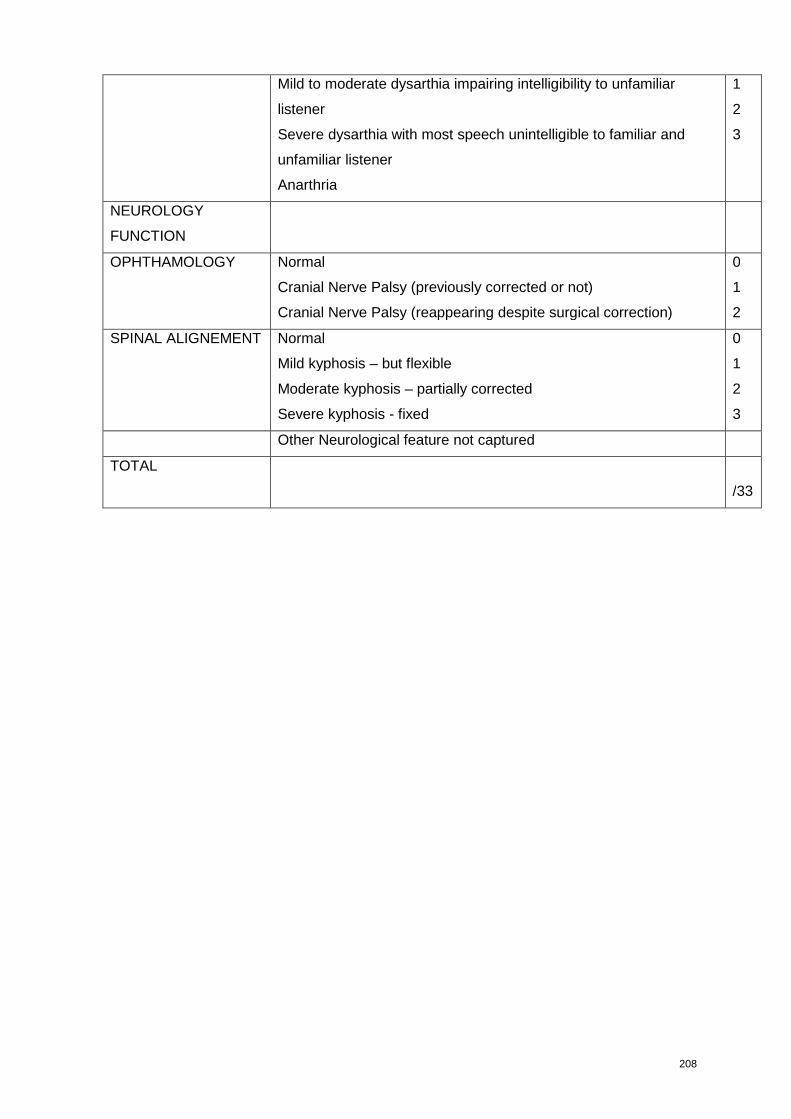
208
Mild to moderate dysarthia impairing intelligibility to unfamiliar
listener
Severe dysarthia with most speech unintelligible to familiar and
unfamiliar listener
Anarthria
1
2
3
NEUROLOGY
FUNCTION
OPHTHAMOLOGY Normal
Cranial Nerve Palsy (previously corrected or not)
Cranial Nerve Palsy (reappearing despite surgical correction)
0
1
2
SPINAL ALIGNEMENT Normal
Mild kyphosis – but flexible
Moderate kyphosis – partially corrected
Severe kyphosis - fixed
0
1
2
3
Other Neurological feature not captured
TOTAL
/33
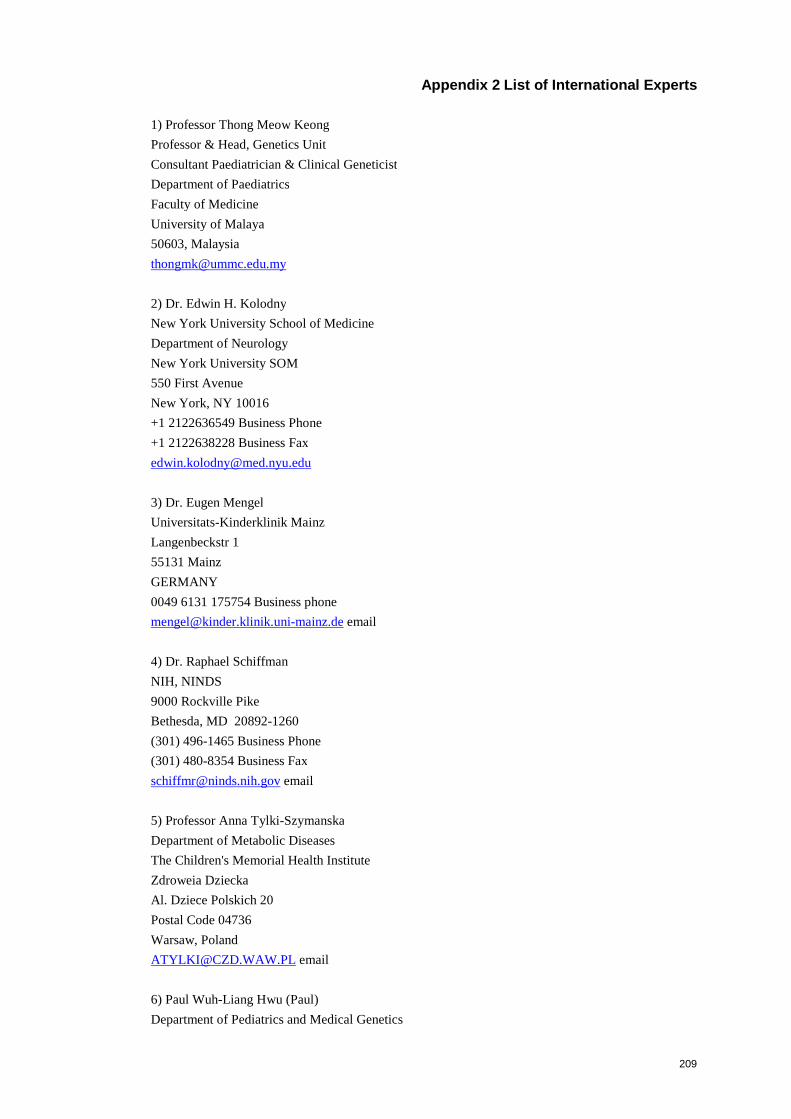
209
Appendix 2 List of International Experts
1) Professor Thong Meow Keong
Professor & Head, Genetics Unit
Consultant Paediatrician & Clinical Geneticist
Department of Paediatrics
Faculty of Medicine
University of Malaya
50603, Malaysia
2) Dr. Edwin H. Kolodny
New York University School of Medicine
Department of Neurology
New York University SOM
550 First Avenue
New York, NY 10016
+1 2122636549 Business Phone
+1 2122638228 Business Fax
3) Dr. Eugen Mengel
Universitats-Kinderklinik Mainz
Langenbeckstr 1
55131 Mainz
GERMANY
0049 6131 175754 Business phone
[email protected] email
4) Dr. Raphael Schiffman
NIH, NINDS
9000 Rockville Pike
Bethesda, MD 20892-1260
(301) 496-1465 Business Phone
(301) 480-8354 Business Fax
[email protected] email
5) Professor Anna Tylki-Szymanska
Department of Metabolic Diseases
The Children's Memorial Health Institute
Zdroweia Dziecka
Al. Dziece Polskich 20
Postal Code 04736
Warsaw, Poland
[email protected] email
6) Paul Wuh-Liang Hwu (Paul)
Department of Pediatrics and Medical Genetics
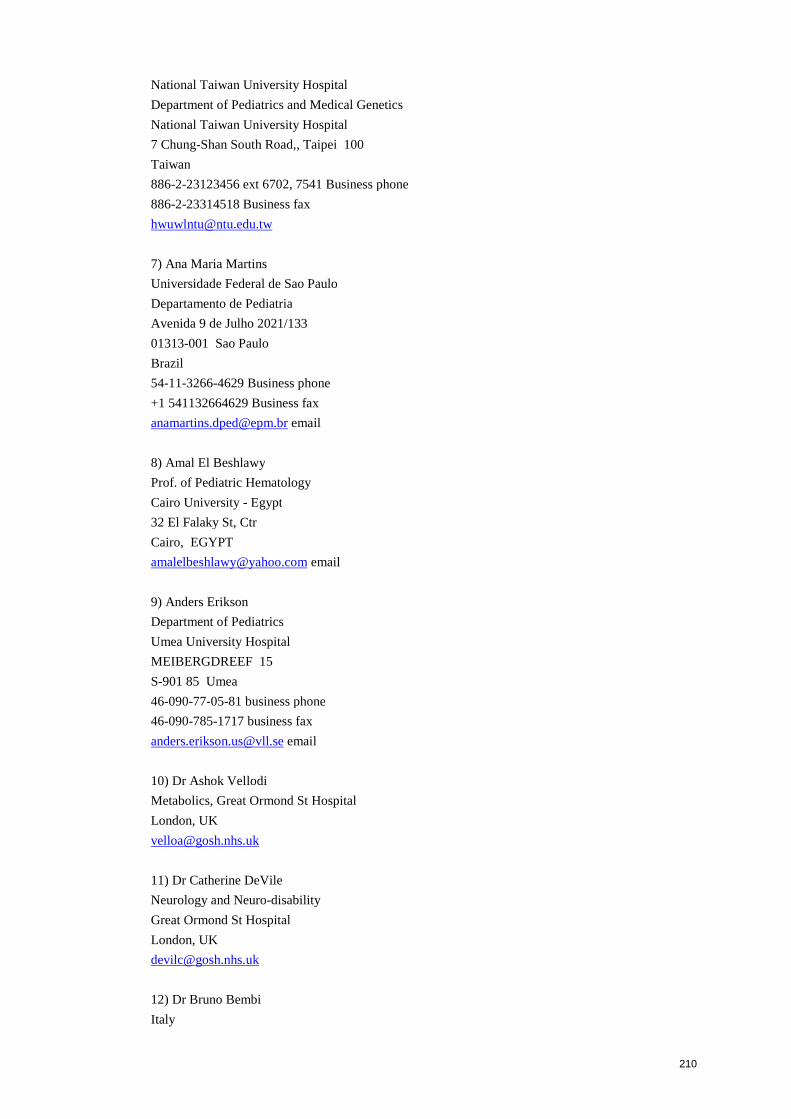
210
National Taiwan University Hospital
Department of Pediatrics and Medical Genetics
National Taiwan University Hospital
7 Chung-Shan South Road,, Taipei 100
Taiwan
886-2-23123456 ext 6702, 7541 Business phone
886-2-23314518 Business fax
7) Ana Maria Martins
Universidade Federal de Sao Paulo
Departamento de Pediatria
Avenida 9 de Julho 2021/133
01313-001 Sao Paulo
Brazil
54-11-3266-4629 Business phone
+1 541132664629 Business fax
[email protected] email
8) Amal El Beshlawy
Prof. of Pediatric Hematology
Cairo University - Egypt
32 El Falaky St, Ctr
Cairo, EGYPT
[email protected] email
9) Anders Erikson
Department of Pediatrics
Umea University Hospital
MEIBERGDREEF 15
S-901 85 Umea
46-090-77-05-81 business phone
46-090-785-1717 business fax
[email protected] email
10) Dr Ashok Vellodi
Metabolics, Great Ormond St Hospital
London, UK
11) Dr Catherine DeVile
Neurology and Neuro-disability
Great Ormond St Hospital
London, UK
12) Dr Bruno Bembi
Italy
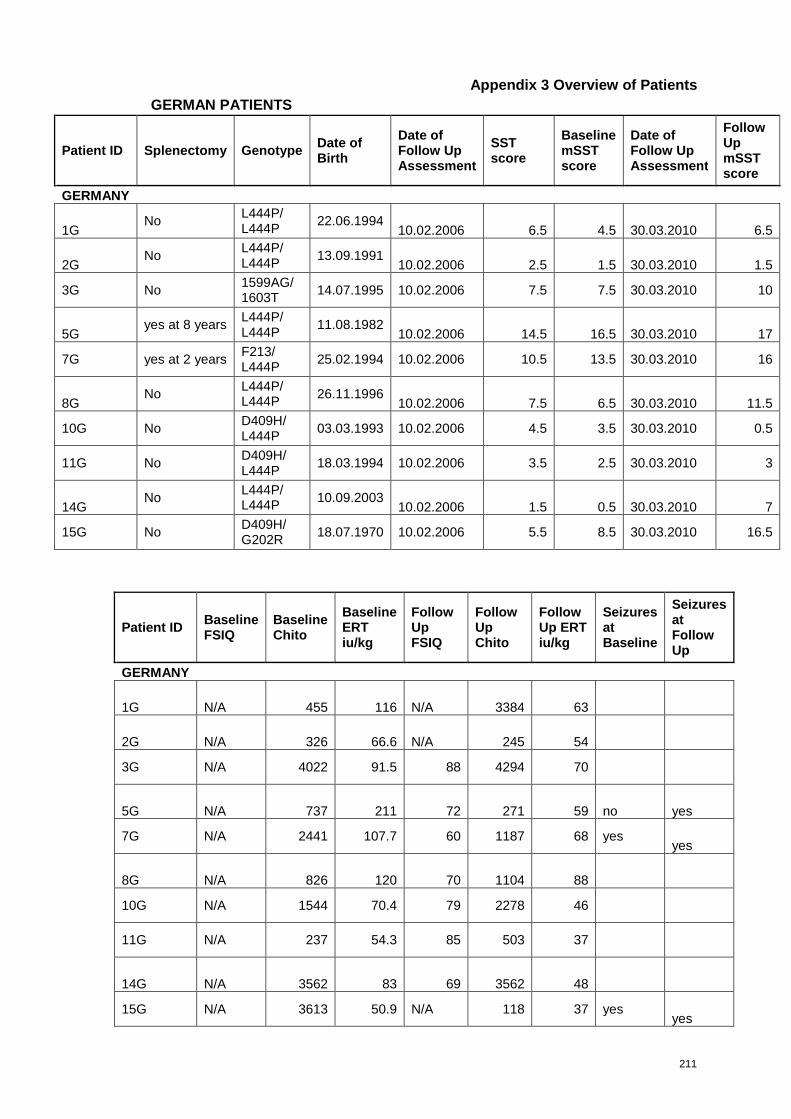
211
Appendix 3 Overview of Patients
GERMAN PATIENTS
Patient ID Splenectomy GenotypeDate ofBirth
Date ofFollow UpAssessment
SSTscore
BaselinemSSTscore
Date ofFollow UpAssessment
FollowUpmSSTscore
GERMANY
1GNo
L444P/L444P
22.06.199410.02.2006 6.5 4.5 30.03.2010 6.5
2GNo
L444P/L444P
13.09.199110.02.2006 2.5 1.5 30.03.2010 1.5
3G No1599AG/1603T
14.07.1995 10.02.2006 7.5 7.5 30.03.2010 10
5Gyes at 8 years
L444P/L444P
11.08.198210.02.2006 14.5 16.5 30.03.2010 17
7G yes at 2 yearsF213/L444P
25.02.1994 10.02.2006 10.5 13.5 30.03.2010 16
8GNo
L444P/L444P
26.11.199610.02.2006 7.5 6.5 30.03.2010 11.5
10G NoD409H/L444P
03.03.1993 10.02.2006 4.5 3.5 30.03.2010 0.5
11G NoD409H/L444P
18.03.1994 10.02.2006 3.5 2.5 30.03.2010 3
14GNo
L444P/L444P
10.09.200310.02.2006 1.5 0.5 30.03.2010 7
15G NoD409H/G202R
18.07.1970 10.02.2006 5.5 8.5 30.03.2010 16.5
Patient IDBaselineFSIQ
BaselineChito
BaselineERTiu/kg
FollowUpFSIQ
FollowUpChito
FollowUp ERTiu/kg
SeizuresatBaseline
SeizuresatFollowUp
GERMANY
1G N/A 455 116 N/A 3384 63
2G N/A 326 66.6 N/A 245 54
3G N/A 4022 91.5 88 4294 70
5G N/A 737 211 72 271 59 no yes
7G N/A 2441 107.7 60 1187 68 yesyes
8G N/A 826 120 70 1104 88
10G N/A 1544 70.4 79 2278 46
11G N/A 237 54.3 85 503 37
14G N/A 3562 83 69 3562 48
15G N/A 3613 50.9 N/A 118 37 yesyes
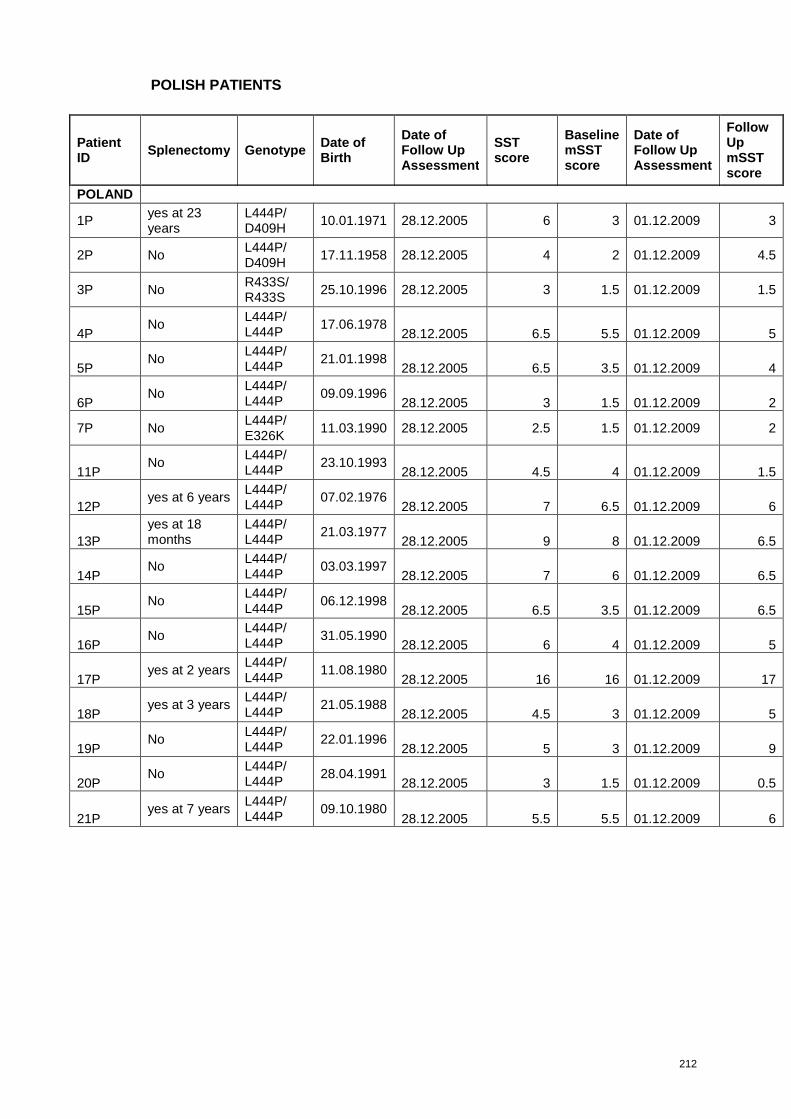
212
POLISH PATIENTS
PatientID
Splenectomy GenotypeDate ofBirth
Date ofFollow UpAssessment
SSTscore
BaselinemSSTscore
Date ofFollow UpAssessment
FollowUpmSSTscore
POLAND
1Pyes at 23years
L444P/D409H
10.01.1971 28.12.2005 6 3 01.12.2009 3
2P NoL444P/D409H
17.11.1958 28.12.2005 4 2 01.12.2009 4.5
3P NoR433S/R433S
25.10.1996 28.12.2005 3 1.5 01.12.2009 1.5
4PNo
L444P/L444P
17.06.197828.12.2005 6.5 5.5 01.12.2009 5
5PNo
L444P/L444P
21.01.199828.12.2005 6.5 3.5 01.12.2009 4
6PNo
L444P/L444P
09.09.199628.12.2005 3 1.5 01.12.2009 2
7P NoL444P/E326K
11.03.1990 28.12.2005 2.5 1.5 01.12.2009 2
11PNo
L444P/L444P
23.10.199328.12.2005 4.5 4 01.12.2009 1.5
12Pyes at 6 years
L444P/L444P
07.02.197628.12.2005 7 6.5 01.12.2009 6
13P
yes at 18months
L444P/L444P
21.03.197728.12.2005 9 8 01.12.2009 6.5
14PNo
L444P/L444P
03.03.199728.12.2005 7 6 01.12.2009 6.5
15PNo
L444P/L444P
06.12.199828.12.2005 6.5 3.5 01.12.2009 6.5
16PNo
L444P/L444P
31.05.199028.12.2005 6 4 01.12.2009 5
17Pyes at 2 years
L444P/L444P
11.08.198028.12.2005 16 16 01.12.2009 17
18Pyes at 3 years
L444P/L444P
21.05.198828.12.2005 4.5 3 01.12.2009 5
19PNo
L444P/L444P
22.01.199628.12.2005 5 3 01.12.2009 9
20PNo
L444P/L444P
28.04.199128.12.2005 3 1.5 01.12.2009 0.5
21Pyes at 7 years
L444P/L444P
09.10.198028.12.2005 5.5 5.5 01.12.2009 6
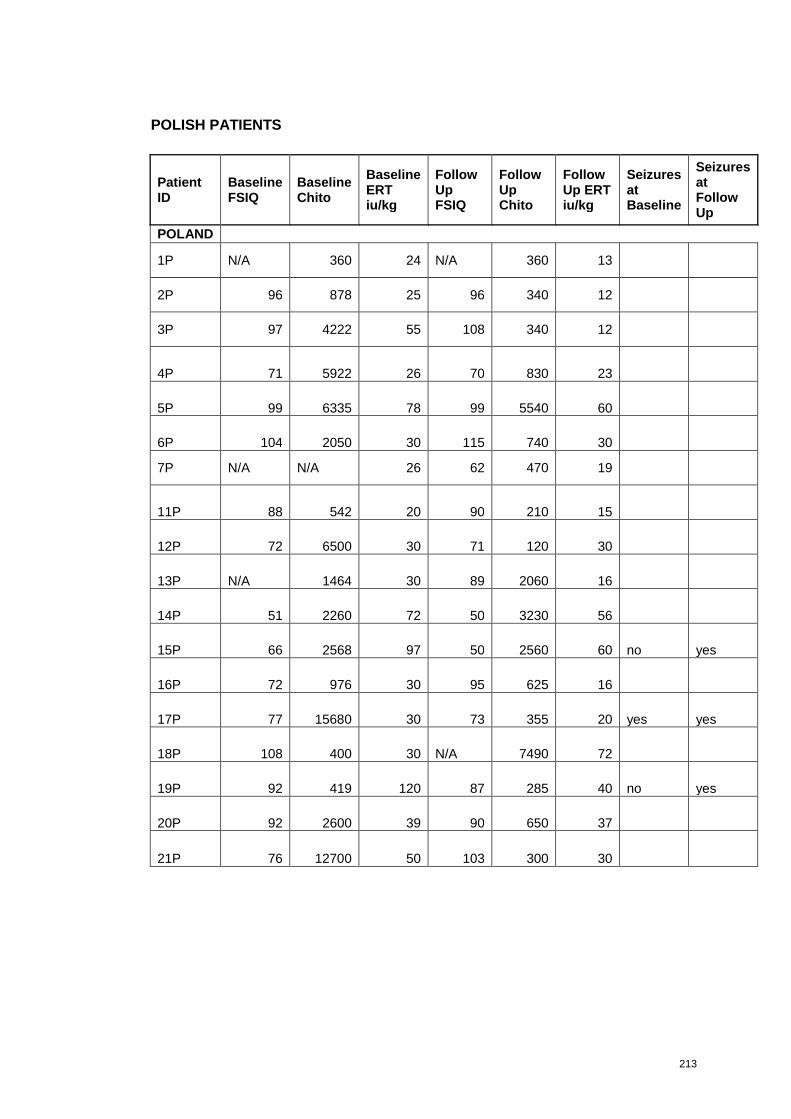
213
POLISH PATIENTS
PatientID
BaselineFSIQ
BaselineChito
BaselineERTiu/kg
FollowUpFSIQ
FollowUpChito
FollowUp ERTiu/kg
SeizuresatBaseline
SeizuresatFollowUp
POLAND
1P N/A 360 24 N/A 360 13
2P 96 878 25 96 340 12
3P 97 4222 55 108 340 12
4P 71 5922 26 70 830 23
5P 99 6335 78 99 5540 60
6P 104 2050 30 115 740 30
7P N/A N/A 26 62 470 19
11P 88 542 20 90 210 15
12P 72 6500 30 71 120 30
13P N/A 1464 30 89 2060 16
14P 51 2260 72 50 3230 56
15P 66 2568 97 50 2560 60 no yes
16P 72 976 30 95 625 16
17P 77 15680 30 73 355 20 yes yes
18P 108 400 30 N/A 7490 72
19P 92 419 120 87 285 40 no yes
20P 92 2600 39 90 650 37
21P 76 12700 50 103 300 30
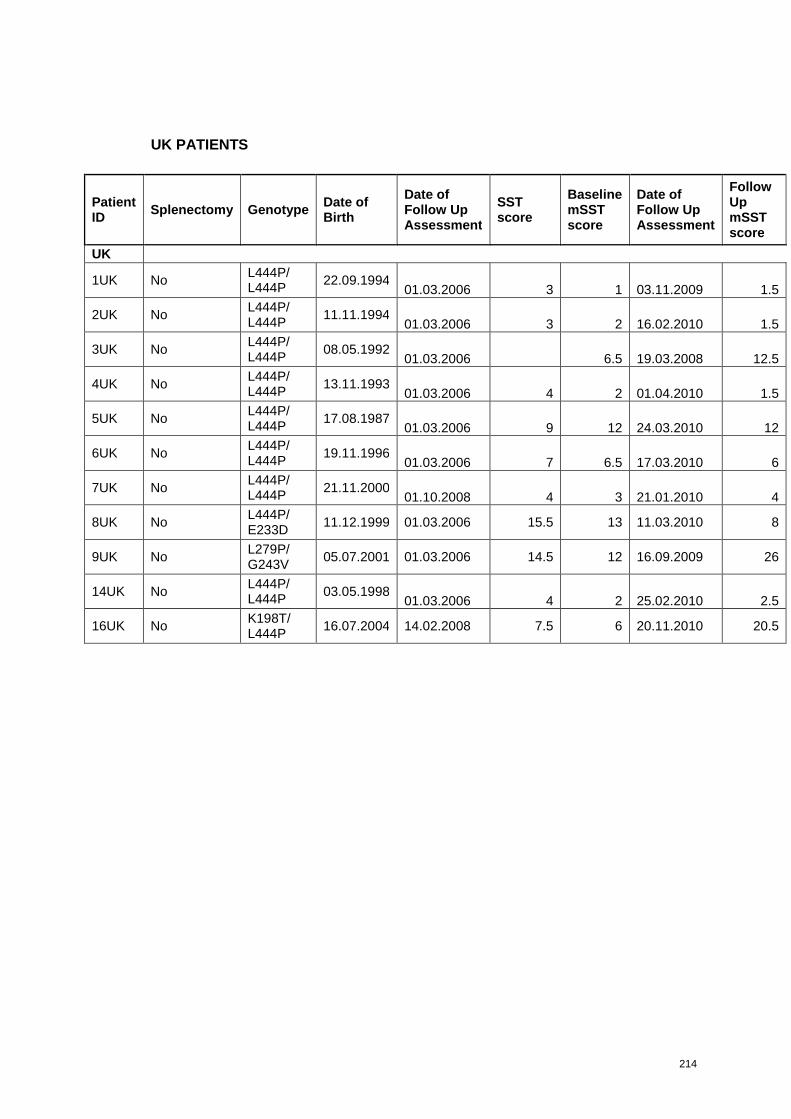
214
UK PATIENTS
PatientID
Splenectomy GenotypeDate ofBirth
Date ofFollow UpAssessment
SSTscore
BaselinemSSTscore
Date ofFollow UpAssessment
FollowUpmSSTscore
UK
1UK NoL444P/L444P
22.09.199401.03.2006 3 1 03.11.2009 1.5
2UK NoL444P/L444P
11.11.199401.03.2006 3 2 16.02.2010 1.5
3UK NoL444P/L444P
08.05.199201.03.2006 6.5 19.03.2008 12.5
4UK NoL444P/L444P
13.11.199301.03.2006 4 2 01.04.2010 1.5
5UK NoL444P/L444P
17.08.198701.03.2006 9 12 24.03.2010 12
6UK NoL444P/L444P
19.11.199601.03.2006 7 6.5 17.03.2010 6
7UK NoL444P/L444P
21.11.200001.10.2008 4 3 21.01.2010 4
8UK NoL444P/E233D
11.12.1999 01.03.2006 15.5 13 11.03.2010 8
9UK NoL279P/G243V
05.07.2001 01.03.2006 14.5 12 16.09.2009 26
14UK NoL444P/L444P
03.05.199801.03.2006 4 2 25.02.2010 2.5
16UK NoK198T/L444P
16.07.2004 14.02.2008 7.5 6 20.11.2010 20.5
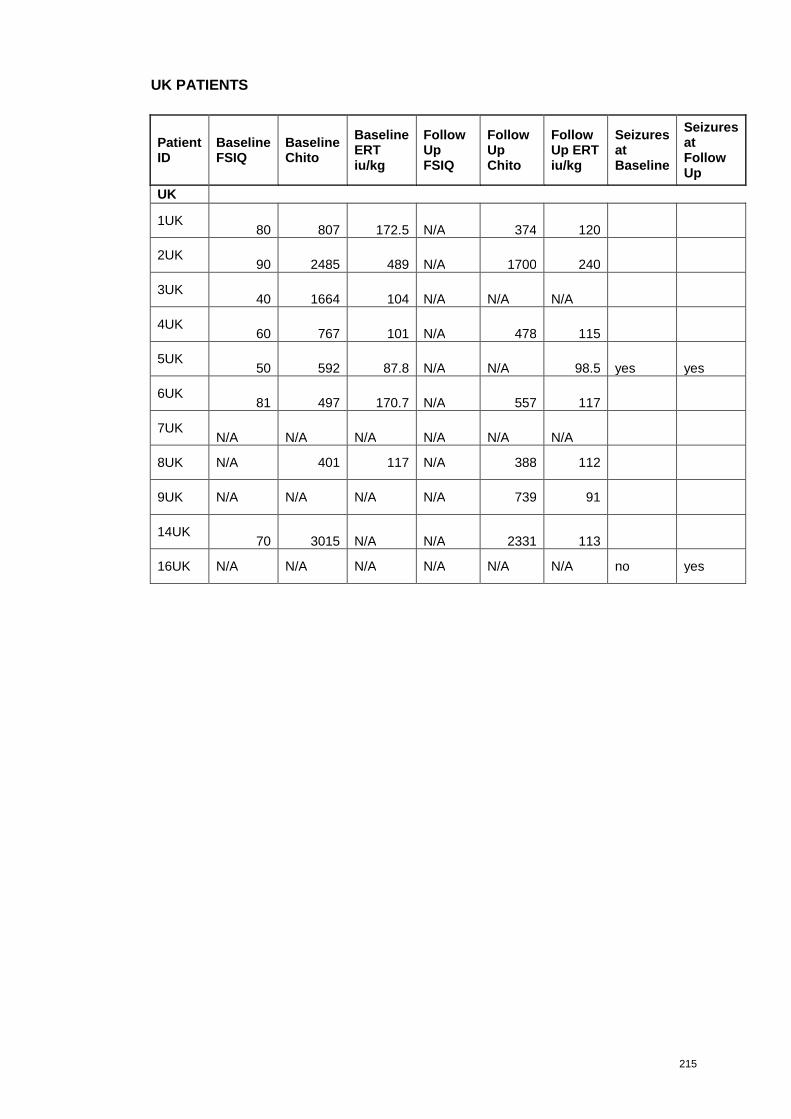
215
UK PATIENTS
PatientID
BaselineFSIQ
BaselineChito
BaselineERTiu/kg
FollowUpFSIQ
FollowUpChito
FollowUp ERTiu/kg
SeizuresatBaseline
SeizuresatFollowUp
UK
1UK80 807 172.5 N/A 374 120
2UK90 2485 489 N/A 1700 240
3UK40 1664 104 N/A N/A N/A
4UK60 767 101 N/A 478 115
5UK50 592 87.8 N/A N/A 98.5 yes yes
6UK81 497 170.7 N/A 557 117
7UKN/A N/A N/A N/A N/A N/A
8UK N/A 401 117 N/A 388 112
9UK N/A N/A N/A N/A 739 91
14UK70 3015 N/A N/A 2331 113
16UK N/A N/A N/A N/A N/A N/A no yes
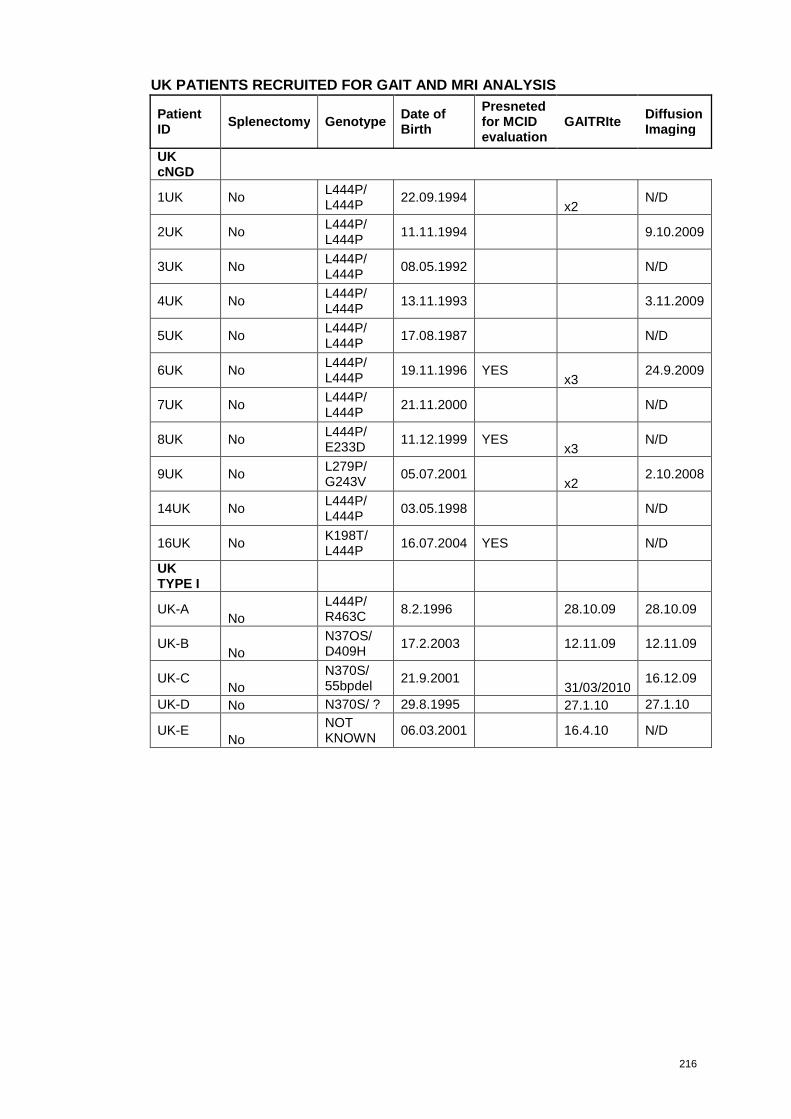
216
UK PATIENTS RECRUITED FOR GAIT AND MRI ANALYSIS
PatientID
Splenectomy GenotypeDate ofBirth
Presnetedfor MCIDevaluation
GAITRIteDiffusionImaging
UKcNGD
1UK NoL444P/L444P
22.09.1994x2
N/D
2UK NoL444P/L444P
11.11.1994 9.10.2009
3UK NoL444P/L444P
08.05.1992 N/D
4UK NoL444P/L444P
13.11.1993 3.11.2009
5UK NoL444P/L444P
17.08.1987 N/D
6UK NoL444P/L444P
19.11.1996 YESx3
24.9.2009
7UK NoL444P/L444P
21.11.2000 N/D
8UK NoL444P/E233D
11.12.1999 YESx3
N/D
9UK NoL279P/G243V
05.07.2001x2
2.10.2008
14UK NoL444P/L444P
03.05.1998 N/D
16UK NoK198T/L444P
16.07.2004 YES N/D
UKTYPE I
UK-ANo
L444P/R463C
8.2.1996 28.10.09 28.10.09
UK-BNo
N37OS/D409H
17.2.2003 12.11.09 12.11.09
UK-CNo
N370S/55bpdel
21.9.200131/03/2010
16.12.09
UK-D No N370S/ ? 29.8.1995 27.1.10 27.1.10
UK-ENo
NOTKNOWN
06.03.2001 16.4.10 N/D