DEVELOPING GIS-BASED DISASTER MANAGEMENT SYSTEM …...DEVELOPING GIS-BASED DISASTER MANAGEMENT...
6
DEVELOPING GIS-BASED DISASTER MANAGEMENT SYSTEM FOR LOCAL AUTHORITY – CASE STUDY IN MALAYSIA 1 Alias Abdul Rahman, 1 Hairi Karim, 1 Ivin A. Musliman, 1 Bernad Siew, 1 Hanis Rashidan, 2 Sharif Idros, 2 M. Al-Hafiz Azman, and 2 M. Fadzli Abdullah 1 Department of Geoinformation, Universiti Teknologi Malaysia, Malaysia. 2 Pengerang Local Authority, Johor, Malaysia. KEY WORDS: GIS, Map publishing, Disaster management ABSTRACT: This paper describes the development of geospatial-based disaster management system for an agency at regional level. Important aspects of the system such as spatial data, geospatial database, interface and specific modules for the disaster management system form major discussions of this paper. The Pengerang Disaster Management System (PDMS) is being developed for a local authority in one of the Malaysian states who’s been given a task to monitor the surrounding environmental aspects. The local authority manages one of the largest oil and gas refinery plant in South East Asia region in collaboration with national oil company, PETRONAS. The PDMS, is a one-stop centre (dashboard) for managing the operations with other agencies or stakeholders such as police, marine, army, medical team, fire and rescue units. We anticipate many aspects of disaster management could trigger from this pilot project and thus provide some interesting ideas for a local authority in managing man-made disaster such as fire, other oil and gas related incidents. Some features of the developed system such as online map publishing services, data flow and other geospatial analysis during the event will be discussed in this paper. Near-future work and a big picture of the disaster management approach (with an emphasis to oil and gas incident and scenario) also will be highlighted. 1. INTRODUCTION 1.1 Introduction Recently, we have seen more and more natural or man-made disasters happened and getting chaotic such as Hurricane Katrina in United States, Haiti, Japan, China and other disasters in Australia. Managing this kind of disasters is not easy and involves many parties or stakeholders. Many systems have been developed for disaster management where each provides different scopes of works and helps. It is not exaggerating to say that there is no system able to solve various level of disaster in Malaysia. However, the related agencies attempt to develop such system in the country such as National Agency for Disaster Management (NaDMA) as reported by NaDMA (2017) and Razak (2017). A GIS-based system could be utilised to manage small scale disaster. This paper describes a system development for such small scale rather than national scale - natural or man-made. Section 2 describes GIS datasets. System development in Section 3 and finally the conclusion in Section 4. 2. GIS DATA 2.1 Existing Data and Conversion The existing (provided) datasets is based on Kota Tinggi District Municipality (Majlis Daerah Kota Tinggi) archives and Figure 1 shows the boundary and area covered within PBT Pengerang jurisdiction. Below is the list of available datasets: • Environment • Economy • Planning concept • Transportation • Administrative • Social and Utility Unfortunately, most of the provided digital data needs to undergo some updates and corrections – e.g. editing (see Figure 2). The original data is in MapInfo format (*.tab) which then converted into shapefile format (*.shp) using FME Quick Translator. The converted data in *.shp format were then verified for a defined coordinate system transformation (Cassini Johor) and geometry/attribute validation. The International Archives of the Photogrammetry, Remote Sensing and Spatial Information Sciences, Volume XLII-3/W4, 2018 GeoInformation For Disaster Management (Gi4DM), 18–21 March 2018, Istanbul, Turkey This contribution has been peer-reviewed. https://doi.org/10.5194/isprs-archives-XLII-3-W4-3-2018 | © Authors 2018. CC BY 4.0 License. 3
Transcript of DEVELOPING GIS-BASED DISASTER MANAGEMENT SYSTEM …...DEVELOPING GIS-BASED DISASTER MANAGEMENT...
DEVELOPING GIS-BASED DISASTER MANAGEMENT SYSTEM FOR LOCAL
AUTHORITY – CASE STUDY IN MALAYSIA
1Alias Abdul Rahman, 1Hairi Karim, 1Ivin A. Musliman, 1Bernad Siew, 1Hanis Rashidan,
2Sharif Idros, 2M. Al-Hafiz Azman, and 2M. Fadzli Abdullah
1Department of Geoinformation, Universiti Teknologi Malaysia, Malaysia.
2Pengerang Local Authority, Johor, Malaysia.
KEY WORDS: GIS, Map publishing, Disaster management
ABSTRACT:
This paper describes the development of geospatial-based disaster management system for an agency at regional level. Important
aspects of the system such as spatial data, geospatial database, interface and specific modules for the disaster management system
form major discussions of this paper. The Pengerang Disaster Management System (PDMS) is being developed for a local authority
in one of the Malaysian states who’s been given a task to monitor the surrounding environmental aspects. The local authority
manages one of the largest oil and gas refinery plant in South East Asia region in collaboration with national oil company,
PETRONAS. The PDMS, is a one-stop centre (dashboard) for managing the operations with other agencies or stakeholders such as
police, marine, army, medical team, fire and rescue units. We anticipate many aspects of disaster management could trigger from this
pilot project and thus provide some interesting ideas for a local authority in managing man-made disaster such as fire, other oil and
gas related incidents. Some features of the developed system such as online map publishing services, data flow and other geospatial
analysis during the event will be discussed in this paper. Near-future work and a big picture of the disaster management approach
(with an emphasis to oil and gas incident and scenario) also will be highlighted.
1. INTRODUCTION
1.1 Introduction
Recently, we have seen more and more natural or man-made
disasters happened and getting chaotic such as Hurricane
Katrina in United States, Haiti, Japan, China and other disasters
in Australia. Managing this kind of disasters is not easy and
involves many parties or stakeholders. Many systems have been
developed for disaster management where each provides
different scopes of works and helps. It is not exaggerating to say
that there is no system able to solve various level of disaster in
Malaysia. However, the related agencies attempt to develop
such system in the country such as National Agency for Disaster
Management (NaDMA) as reported by NaDMA (2017) and
Razak (2017).
A GIS-based system could be utilised to manage small scale
disaster. This paper describes a system development for such
small scale rather than national scale - natural or man-made.
Section 2 describes GIS datasets. System development in
Section 3 and finally the conclusion in Section 4.
2. GIS DATA
2.1 Existing Data and Conversion
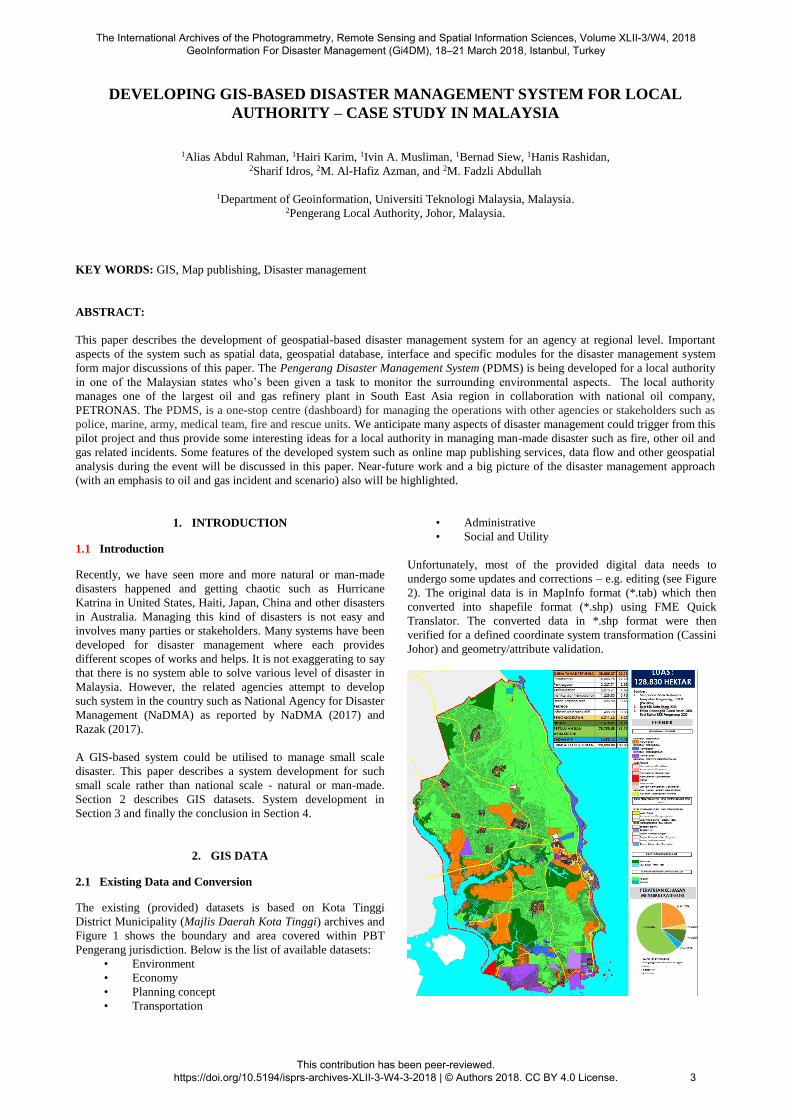
The existing (provided) datasets is based on Kota Tinggi
District Municipality (Majlis Daerah Kota Tinggi) archives and
Figure 1 shows the boundary and area covered within PBT
Pengerang jurisdiction. Below is the list of available datasets:
• Environment
• Economy
• Planning concept
• Transportation
• Administrative
• Social and Utility
Unfortunately, most of the provided digital data needs to
undergo some updates and corrections – e.g. editing (see Figure
2). The original data is in MapInfo format (*.tab) which then
converted into shapefile format (*.shp) using FME Quick
Translator. The converted data in *.shp format were then
verified for a defined coordinate system transformation (Cassini
Johor) and geometry/attribute validation.
The International Archives of the Photogrammetry, Remote Sensing and Spatial Information Sciences, Volume XLII-3/W4, 2018 GeoInformation For Disaster Management (Gi4DM), 18–21 March 2018, Istanbul, Turkey
This contribution has been peer-reviewed. https://doi.org/10.5194/isprs-archives-XLII-3-W4-3-2018 | © Authors 2018. CC BY 4.0 License.
3
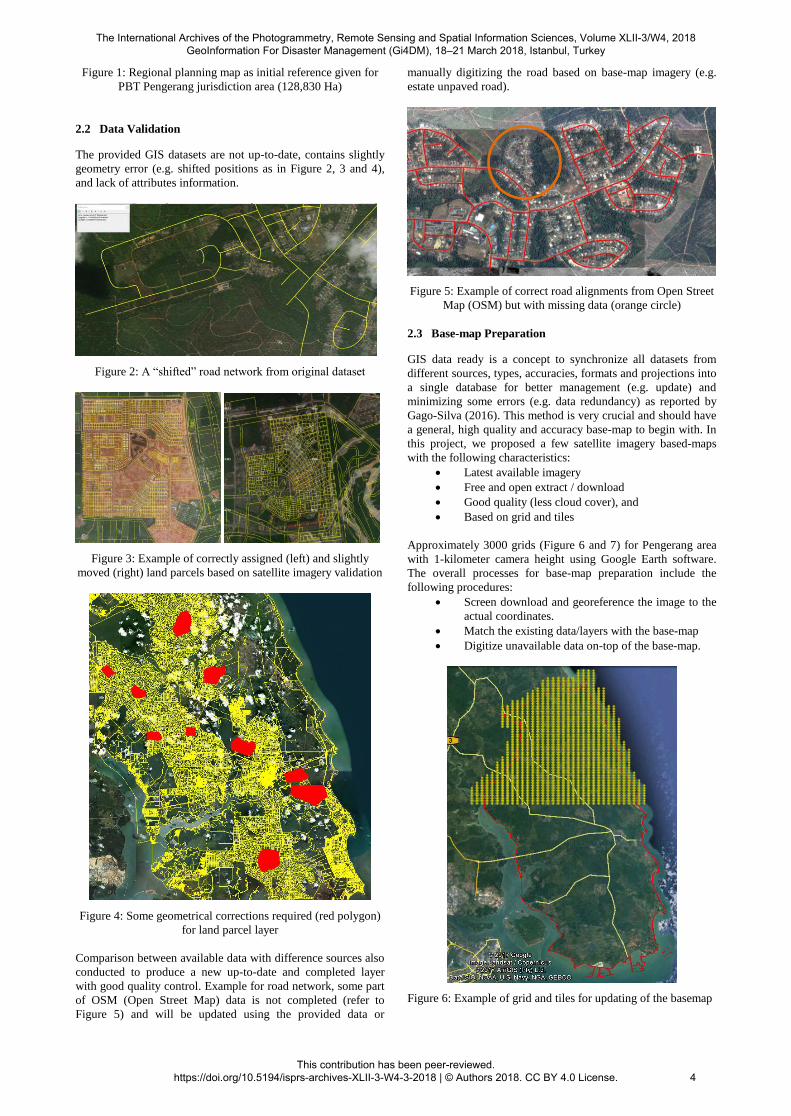
Figure 1: Regional planning map as initial reference given for
PBT Pengerang jurisdiction area (128,830 Ha)
2.2 Data Validation
The provided GIS datasets are not up-to-date, contains slightly
geometry error (e.g. shifted positions as in Figure 2, 3 and 4),
and lack of attributes information.
Figure 2: A “shifted” road network from original dataset
Figure 3: Example of correctly assigned (left) and slightly
moved (right) land parcels based on satellite imagery validation
Figure 4: Some geometrical corrections required (red polygon)
for land parcel layer
Comparison between available data with difference sources also
conducted to produce a new up-to-date and completed layer
with good quality control. Example for road network, some part
of OSM (Open Street Map) data is not completed (refer to
Figure 5) and will be updated using the provided data or
manually digitizing the road based on base-map imagery (e.g.
estate unpaved road).
Figure 5: Example of correct road alignments from Open Street
Map (OSM) but with missing data (orange circle)
2.3 Base-map Preparation
GIS data ready is a concept to synchronize all datasets from
different sources, types, accuracies, formats and projections into
a single database for better management (e.g. update) and
minimizing some errors (e.g. data redundancy) as reported by
Gago-Silva (2016). This method is very crucial and should have
a general, high quality and accuracy base-map to begin with. In
this project, we proposed a few satellite imagery based-maps
with the following characteristics:
Latest available imagery
Free and open extract / download
Good quality (less cloud cover), and
Based on grid and tiles
Approximately 3000 grids (Figure 6 and 7) for Pengerang area
with 1-kilometer camera height using Google Earth software.
The overall processes for base-map preparation include the
following procedures:
Screen download and georeference the image to the
actual coordinates.
Match the existing data/layers with the base-map
Digitize unavailable data on-top of the base-map.
Figure 6: Example of grid and tiles for updating of the basemap
The International Archives of the Photogrammetry, Remote Sensing and Spatial Information Sciences, Volume XLII-3/W4, 2018 GeoInformation For Disaster Management (Gi4DM), 18–21 March 2018, Istanbul, Turkey
This contribution has been peer-reviewed. https://doi.org/10.5194/isprs-archives-XLII-3-W4-3-2018 | © Authors 2018. CC BY 4.0 License.
4
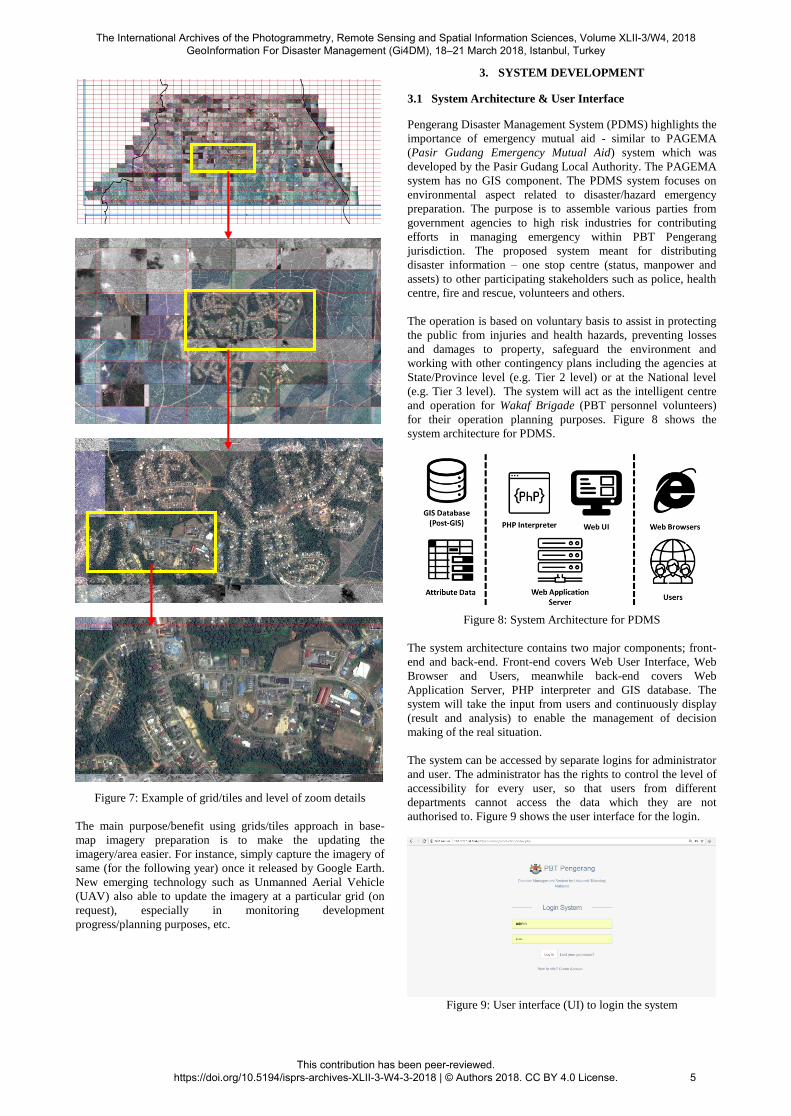
Figure 7: Example of grid/tiles and level of zoom details
The main purpose/benefit using grids/tiles approach in base-
map imagery preparation is to make the updating the
imagery/area easier. For instance, simply capture the imagery of
same (for the following year) once it released by Google Earth.
New emerging technology such as Unmanned Aerial Vehicle
(UAV) also able to update the imagery at a particular grid (on
request), especially in monitoring development
progress/planning purposes, etc.
3. SYSTEM DEVELOPMENT
3.1 System Architecture & User Interface
Pengerang Disaster Management System (PDMS) highlights the
importance of emergency mutual aid - similar to PAGEMA
(Pasir Gudang Emergency Mutual Aid) system which was
developed by the Pasir Gudang Local Authority. The PAGEMA
system has no GIS component. The PDMS system focuses on
environmental aspect related to disaster/hazard emergency
preparation. The purpose is to assemble various parties from
government agencies to high risk industries for contributing
efforts in managing emergency within PBT Pengerang
jurisdiction. The proposed system meant for distributing
disaster information – one stop centre (status, manpower and
assets) to other participating stakeholders such as police, health
centre, fire and rescue, volunteers and others.
The operation is based on voluntary basis to assist in protecting
the public from injuries and health hazards, preventing losses
and damages to property, safeguard the environment and
working with other contingency plans including the agencies at
State/Province level (e.g. Tier 2 level) or at the National level
(e.g. Tier 3 level). The system will act as the intelligent centre
and operation for Wakaf Brigade (PBT personnel volunteers)
for their operation planning purposes. Figure 8 shows the
system architecture for PDMS.
Figure 8: System Architecture for PDMS
The system architecture contains two major components; front-
end and back-end. Front-end covers Web User Interface, Web
Browser and Users, meanwhile back-end covers Web
Application Server, PHP interpreter and GIS database. The
system will take the input from users and continuously display
(result and analysis) to enable the management of decision
making of the real situation.
The system can be accessed by separate logins for administrator
and user. The administrator has the rights to control the level of
accessibility for every user, so that users from different
departments cannot access the data which they are not
authorised to. Figure 9 shows the user interface for the login.
Figure 9: User interface (UI) to login the system
The International Archives of the Photogrammetry, Remote Sensing and Spatial Information Sciences, Volume XLII-3/W4, 2018 GeoInformation For Disaster Management (Gi4DM), 18–21 March 2018, Istanbul, Turkey
This contribution has been peer-reviewed. https://doi.org/10.5194/isprs-archives-XLII-3-W4-3-2018 | © Authors 2018. CC BY 4.0 License.
5
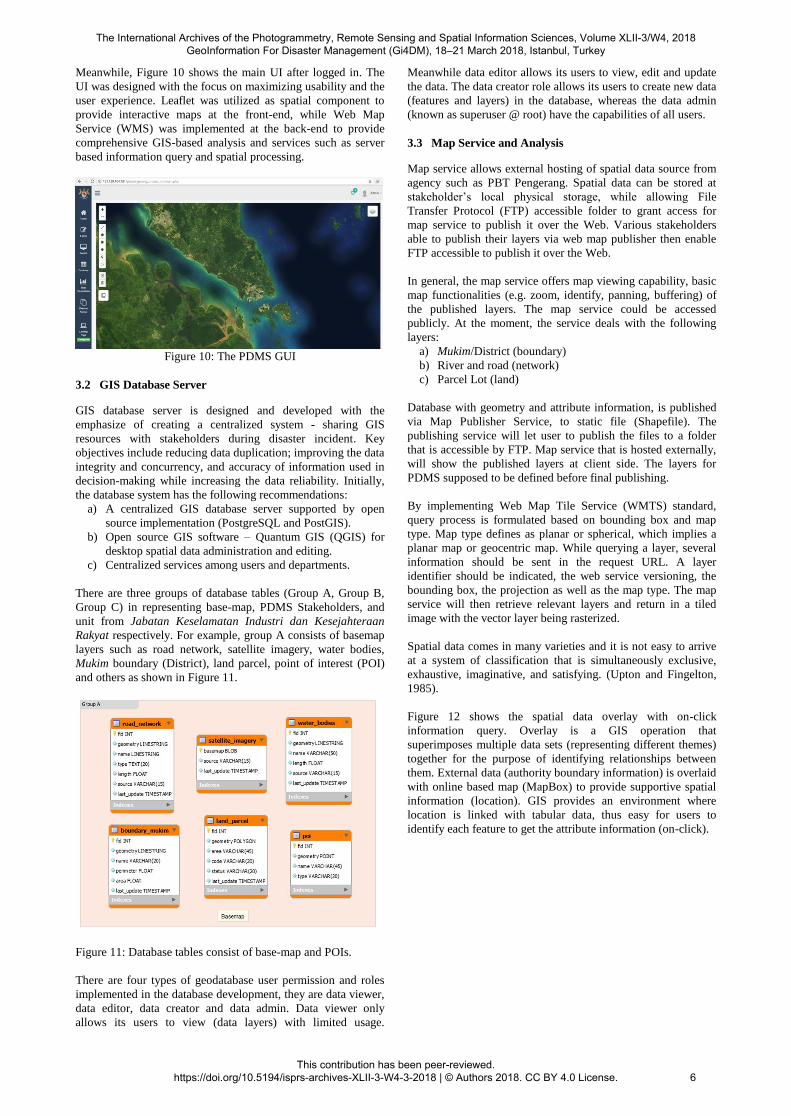
Meanwhile, Figure 10 shows the main UI after logged in. The
UI was designed with the focus on maximizing usability and the
user experience. Leaflet was utilized as spatial component to
provide interactive maps at the front-end, while Web Map
Service (WMS) was implemented at the back-end to provide
comprehensive GIS-based analysis and services such as server
based information query and spatial processing.
Figure 10: The PDMS GUI
3.2 GIS Database Server
GIS database server is designed and developed with the
emphasize of creating a centralized system - sharing GIS
resources with stakeholders during disaster incident. Key
objectives include reducing data duplication; improving the data
integrity and concurrency, and accuracy of information used in
decision-making while increasing the data reliability. Initially,
the database system has the following recommendations:
a) A centralized GIS database server supported by open
source implementation (PostgreSQL and PostGIS).
b) Open source GIS software – Quantum GIS (QGIS) for
desktop spatial data administration and editing.
c) Centralized services among users and departments.
There are three groups of database tables (Group A, Group B,
Group C) in representing base-map, PDMS Stakeholders, and
unit from Jabatan Keselamatan Industri dan Kesejahteraan
Rakyat respectively. For example, group A consists of basemap
layers such as road network, satellite imagery, water bodies,
Mukim boundary (District), land parcel, point of interest (POI)
and others as shown in Figure 11.
Figure 11: Database tables consist of base-map and POIs.
There are four types of geodatabase user permission and roles
implemented in the database development, they are data viewer,
data editor, data creator and data admin. Data viewer only
allows its users to view (data layers) with limited usage.
Meanwhile data editor allows its users to view, edit and update
the data. The data creator role allows its users to create new data
(features and layers) in the database, whereas the data admin
(known as superuser @ root) have the capabilities of all users.
3.3 Map Service and Analysis
Map service allows external hosting of spatial data source from
agency such as PBT Pengerang. Spatial data can be stored at
stakeholder’s local physical storage, while allowing File
Transfer Protocol (FTP) accessible folder to grant access for
map service to publish it over the Web. Various stakeholders
able to publish their layers via web map publisher then enable
FTP accessible to publish it over the Web.
In general, the map service offers map viewing capability, basic
map functionalities (e.g. zoom, identify, panning, buffering) of
the published layers. The map service could be accessed
publicly. At the moment, the service deals with the following
layers:
a) Mukim/District (boundary)
b) River and road (network)
c) Parcel Lot (land)
Database with geometry and attribute information, is published
via Map Publisher Service, to static file (Shapefile). The
publishing service will let user to publish the files to a folder
that is accessible by FTP. Map service that is hosted externally,
will show the published layers at client side. The layers for
PDMS supposed to be defined before final publishing.
By implementing Web Map Tile Service (WMTS) standard,
query process is formulated based on bounding box and map
type. Map type defines as planar or spherical, which implies a
planar map or geocentric map. While querying a layer, several
information should be sent in the request URL. A layer
identifier should be indicated, the web service versioning, the
bounding box, the projection as well as the map type. The map
service will then retrieve relevant layers and return in a tiled
image with the vector layer being rasterized.
Spatial data comes in many varieties and it is not easy to arrive
at a system of classification that is simultaneously exclusive,
exhaustive, imaginative, and satisfying. (Upton and Fingelton,
1985).
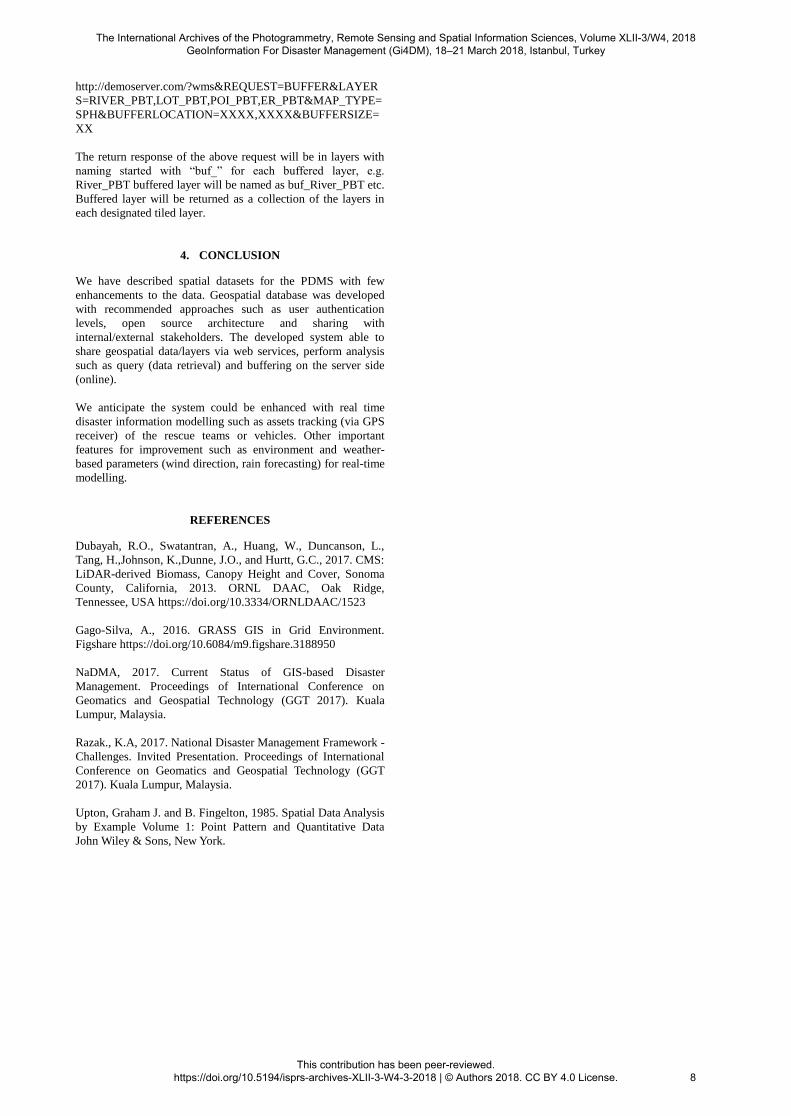
Figure 12 shows the spatial data overlay with on-click
information query. Overlay is a GIS operation that
superimposes multiple data sets (representing different themes)
together for the purpose of identifying relationships between
them. External data (authority boundary information) is overlaid
with online based map (MapBox) to provide supportive spatial
information (location). GIS provides an environment where
location is linked with tabular data, thus easy for users to
identify each feature to get the attribute information (on-click).
The International Archives of the Photogrammetry, Remote Sensing and Spatial Information Sciences, Volume XLII-3/W4, 2018 GeoInformation For Disaster Management (Gi4DM), 18–21 March 2018, Istanbul, Turkey
This contribution has been peer-reviewed. https://doi.org/10.5194/isprs-archives-XLII-3-W4-3-2018 | © Authors 2018. CC BY 4.0 License.
6
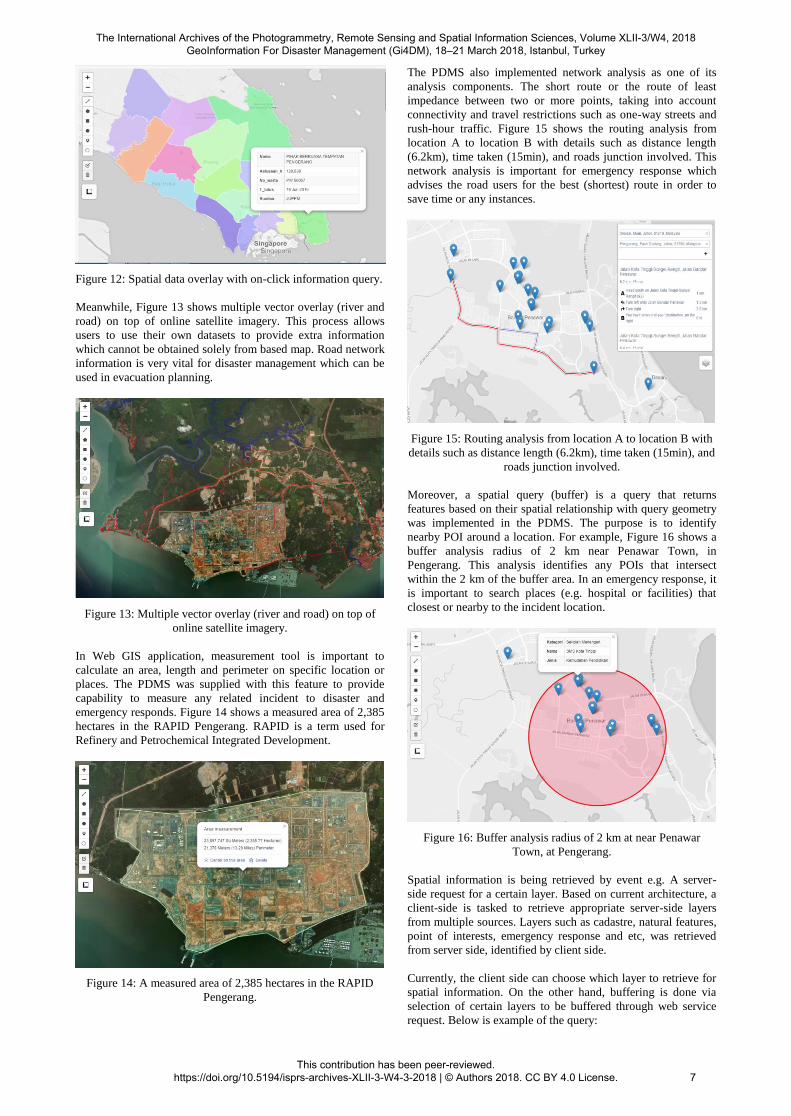
Figure 12: Spatial data overlay with on-click information query.
Meanwhile, Figure 13 shows multiple vector overlay (river and
road) on top of online satellite imagery. This process allows
users to use their own datasets to provide extra information
which cannot be obtained solely from based map. Road network
information is very vital for disaster management which can be
used in evacuation planning.
Figure 13: Multiple vector overlay (river and road) on top of
online satellite imagery.
In Web GIS application, measurement tool is important to
calculate an area, length and perimeter on specific location or
places. The PDMS was supplied with this feature to provide
capability to measure any related incident to disaster and
emergency responds. Figure 14 shows a measured area of 2,385
hectares in the RAPID Pengerang. RAPID is a term used for
Refinery and Petrochemical Integrated Development.
Figure 14: A measured area of 2,385 hectares in the RAPID
Pengerang.
The PDMS also implemented network analysis as one of its
analysis components. The short route or the route of least
impedance between two or more points, taking into account
connectivity and travel restrictions such as one-way streets and
rush-hour traffic. Figure 15 shows the routing analysis from
location A to location B with details such as distance length
(6.2km), time taken (15min), and roads junction involved. This
network analysis is important for emergency response which
advises the road users for the best (shortest) route in order to
save time or any instances.
Figure 15: Routing analysis from location A to location B with
details such as distance length (6.2km), time taken (15min), and
roads junction involved.
Moreover, a spatial query (buffer) is a query that returns
features based on their spatial relationship with query geometry
was implemented in the PDMS. The purpose is to identify
nearby POI around a location. For example, Figure 16 shows a
buffer analysis radius of 2 km near Penawar Town, in
Pengerang. This analysis identifies any POIs that intersect
within the 2 km of the buffer area. In an emergency response, it
is important to search places (e.g. hospital or facilities) that
closest or nearby to the incident location.
Figure 16: Buffer analysis radius of 2 km at near Penawar
Town, at Pengerang.
Spatial information is being retrieved by event e.g. A server-
side request for a certain layer. Based on current architecture, a
client-side is tasked to retrieve appropriate server-side layers
from multiple sources. Layers such as cadastre, natural features,
point of interests, emergency response and etc, was retrieved
from server side, identified by client side.
Currently, the client side can choose which layer to retrieve for
spatial information. On the other hand, buffering is done via
selection of certain layers to be buffered through web service
request. Below is example of the query:
The International Archives of the Photogrammetry, Remote Sensing and Spatial Information Sciences, Volume XLII-3/W4, 2018 GeoInformation For Disaster Management (Gi4DM), 18–21 March 2018, Istanbul, Turkey
This contribution has been peer-reviewed. https://doi.org/10.5194/isprs-archives-XLII-3-W4-3-2018 | © Authors 2018. CC BY 4.0 License.
7
http://demoserver.com/?wms&REQUEST=BUFFER&LAYER
S=RIVER_PBT,LOT_PBT,POI_PBT,ER_PBT&MAP_TYPE=
SPH&BUFFERLOCATION=XXXX,XXXX&BUFFERSIZE=
XX
The return response of the above request will be in layers with
naming started with “buf_” for each buffered layer, e.g.
River_PBT buffered layer will be named as buf_River_PBT etc.
Buffered layer will be returned as a collection of the layers in
each designated tiled layer.
4. CONCLUSION
We have described spatial datasets for the PDMS with few
enhancements to the data. Geospatial database was developed
with recommended approaches such as user authentication
levels, open source architecture and sharing with
internal/external stakeholders. The developed system able to
share geospatial data/layers via web services, perform analysis
such as query (data retrieval) and buffering on the server side
(online).
We anticipate the system could be enhanced with real time
disaster information modelling such as assets tracking (via GPS
receiver) of the rescue teams or vehicles. Other important
features for improvement such as environment and weather-
based parameters (wind direction, rain forecasting) for real-time
modelling.
REFERENCES
Dubayah, R.O., Swatantran, A., Huang, W., Duncanson, L.,
Tang, H.,Johnson, K.,Dunne, J.O., and Hurtt, G.C., 2017. CMS:
LiDAR-derived Biomass, Canopy Height and Cover, Sonoma
County, California, 2013. ORNL DAAC, Oak Ridge,
Tennessee, USA https://doi.org/10.3334/ORNLDAAC/1523
Gago-Silva, A., 2016. GRASS GIS in Grid Environment.
Figshare https://doi.org/10.6084/m9.figshare.3188950
NaDMA, 2017. Current Status of GIS-based Disaster
Management. Proceedings of International Conference on
Geomatics and Geospatial Technology (GGT 2017). Kuala
Lumpur, Malaysia.
Razak., K.A, 2017. National Disaster Management Framework -
Challenges. Invited Presentation. Proceedings of International
Conference on Geomatics and Geospatial Technology (GGT
2017). Kuala Lumpur, Malaysia.
Upton, Graham J. and B. Fingelton, 1985. Spatial Data Analysis
by Example Volume 1: Point Pattern and Quantitative Data
John Wiley & Sons, New York.
The International Archives of the Photogrammetry, Remote Sensing and Spatial Information Sciences, Volume XLII-3/W4, 2018 GeoInformation For Disaster Management (Gi4DM), 18–21 March 2018, Istanbul, Turkey
This contribution has been peer-reviewed. https://doi.org/10.5194/isprs-archives-XLII-3-W4-3-2018 | © Authors 2018. CC BY 4.0 License.
8