DEVELOPING A RECLAMATION COSTING FRAMEWORK FOR THE ...
77
DEVELOPING A RECLAMATION COSTING FRAMEWORK FOR THE ATHABASCA OIL SANDS by Kirsten Melnyk A thesis submitted to the Robert M. Buchan Department of Mining Engineering In conformity with the requirements for the degree of Master of Applied Science Queen’s University Kingston, Ontario, Canada (April, 2017) Copyright ©Kirsten Melnyk, 2017
Transcript of DEVELOPING A RECLAMATION COSTING FRAMEWORK FOR THE ...

DEVELOPING A RECLAMATION COSTING FRAMEWORK FOR THE
ATHABASCA OIL SANDS
by
Kirsten Melnyk
A thesis submitted to the Robert M. Buchan
Department of Mining Engineering
In conformity with the requirements for
the degree of Master of Applied Science
Queen’s University
Kingston, Ontario, Canada
(April, 2017)
Copyright ©Kirsten Melnyk, 2017

ii
Abstract
The Athabasca oil sands are a significant component of the economy in Alberta. However, they
also represent a large environmental risk. At the end of mining operations, companies are expected to
begin closure and reclamation activities, which tend to be very costly. The reclamation costs associated
with oil sands operations are currently unknown, creating the potential for unprepared operators and
leaving the citizens of Alberta and other stakeholders at risk of liabilities.
This thesis aims to create a method of determining the reclamation costs that can be expected for
each open pit oil sands operation. A framework is proposed that can be utilized to estimate the
reclamation costs associated with various operations. The framework attempts to use a logical thought
progression that estimators can follow. The intent is to offer guidance from a large, “big picture”
perspective down to minute details, which can then be synthesized into a cost estimate. The framework
also makes use of key performance indicators for progress tracking. An example of the framework being
applied to a tailings pond is included.
Public policies and regulations that have been implemented in the past have been misguided in
their attempts to improve the overall sustainability in the oil sands. Although the intentions were good,
regulations such as Directive 074 created unrealistic targets and timelines that operators were unable to
meet. This thesis discusses these issues and suggest possible improvements to future policies.
The state of reclamation in the oil sands is also examined. Historical data from the Alberta
Government, the Oil Sands Information Portal, and various oil sands operators is collected and analyzed.
The technology being developed by Canadian Oil Sands, Syncrude, Suncor, and Canadian Natural
Resources is summarized and the resulting reclamation progress is examined.

iii
Acknowledgements
The process of writing this thesis has been an incredible learning experience and opportunity for
growth. Moving my work from a loosely defined concept to a fully realized thesis has taught me the
importance of time management and maintaining momentum through independent work.
I would like to sincerely thank my supervisors, Dr. Ursula Thorley and Dr. Julián Ortiz, for their
technical and academic support throughout this process. This work would not have been possible without
their patience and guidance. I would also like to thank Dr. James Archibald for his guidance and for
reading through and offering suggestions on Chapter 2.
I would like to extend my gratitude to the faculty and staff in the Robert M. Buchan Department
of Mining for their continued support and positivity. I am extremely appreciative of the pleasant work
atmosphere within the department and for the financial support opportunities through grants and teaching
assistantships. I would especially like to thank Kate for her advice and supplying of resources.
Lastly, I am deeply appreciative to my family for their unending support and encouragement, and
Samantha, Rebecca, and Stefan for their endless patience and moral support throughout this process.

iv
Table of Contents
Abstract ......................................................................................................................................................... ii Acknowledgements ...................................................................................................................................... iii
List of Figures .............................................................................................................................................. vi List of Tables .............................................................................................................................................. vii List of Abbreviations ................................................................................................................................. viii Chapter 1 Introduction .................................................................................................................................. 1
1.1 Introduction to the Athabasca Oil Sands ............................................................................................. 1 1.2 Problem Definition .............................................................................................................................. 1 1.3 Objective of the Thesis ....................................................................................................................... 2 1.4 Methodology ....................................................................................................................................... 2 1.5 Thesis Organization ............................................................................................................................ 3
Chapter 2 Literature Review ......................................................................................................................... 4 2.1 The Athabasca Oil Sands .................................................................................................................... 4
2.1.1 Geology and Landscape ............................................................................................................... 4 2.1.2 Processing and Tailings ............................................................................................................... 5 2.1.3 Disturbance and Reclamation ...................................................................................................... 6
2.1.3.1 Reclamation Successes ....................................................................................................... 10 2.1.3.2 Directive 074 ....................................................................................................................... 11 2.1.3.3 Tailings Management Framework ...................................................................................... 12
2.2 Financial Requirements in Alberta ................................................................................................... 13
2.2.1 Mine Financial Security Program .............................................................................................. 14 2.2.2 Transparency and Disclosure ..................................................................................................... 17
2.3 Reclamation Costing ......................................................................................................................... 18 2.3.1 Issues and Challenges ................................................................................................................ 20 2.3.2 Process ....................................................................................................................................... 21
Chapter 3 Data Analysis and Discussion .................................................................................................... 24 3.1 Data Acquisition ............................................................................................................................... 24 3.2 Reclamation Progress ........................................................................................................................ 24
3.2.1 Canadian Oil Sands .................................................................................................................... 24
3.2.2 Syncrude .................................................................................................................................... 24 3.2.3 Suncor ........................................................................................................................................ 26 3.2.4 Canadian Natural Resources ...................................................................................................... 27

v
3.3 Alternate Sources .............................................................................................................................. 27 3.4 Analysis and Discussion ................................................................................................................... 29
3.4.1 Reclamation Tracking ................................................................................................................ 29 3.4.2 Reclamation Costs per Barrel .................................................................................................... 33 3.4.3 Reclamation Costs per Hectare .................................................................................................. 35
Chapter 4 Proposal for a Reclamation Costing Framework ........................................................................ 39 4.1 Framework Description .................................................................................................................... 39
4.1.1 Overview .................................................................................................................................... 39 4.1.2 Framework Rows ....................................................................................................................... 42 4.1.3 Framework Columns .................................................................................................................. 43
4.2 Example Framework Application ..................................................................................................... 44 4.2.1 Site Characteristics ..................................................................................................................... 46 4.2.2 Reclamation Objective ............................................................................................................... 46 4.2.3 Closure Measures ....................................................................................................................... 47
4.2.4 Activities .................................................................................................................................... 48 4.2.5 Inputs .......................................................................................................................................... 49
4.3 Scaling to an Operational Level ........................................................................................................ 54 Chapter 5 Conclusions and Recommendations ........................................................................................... 56
5.1 Summary ........................................................................................................................................... 56 5.2 Conclusions ....................................................................................................................................... 59 5.3 Recommendations and Further Work ............................................................................................... 59
References ................................................................................................................................................... 62

vi
List of Figures
Figure 1: Changes in oil sands land status over the period from 1987 to 2008 .......................................... 29 Figure 2: Changes in oil sands land status over the period from 2009 to 2014 .......................................... 31
Figure 3: Changes in oil sands land status over the period from 2009 to 2014 with cleared and................32
disturbed categories included Figure 4: Growth in volume of stored fluid fine tailings from 1968 to 2013 ............................................. 33 Figure 5: Tailings pond at Syncrude's Mildred Lake site used in framework example .............................. 45 Figure 6: Perimeter outlines of target area .................................................................................................. 46 Figure 7: Satellite image of all Athabasca oil sands operations currently active ........................................ 54

vii
List of Tables
Table 1: Weight properties of average oil sands ore ..................................................................................... 6 Table 2: Environmental issues associated with surface mining .................................................................... 7
Table 3: Financial security held under the MFSP for existing oil sands projects ....................................... 15 Table 4: Comparison of two approaches to costing .................................................................................... 22 Table 5: Data used in calculating Syncrude's reclamation costs per barrel ................................................ 34 Table 6: Data used in calculating Suncor's reclamation costs per barrel .................................................... 34 Table 7: Annual reclamation spending per barrel of oil produced .............................................................. 35 Table 8: Data used in calculating Syncrude's reclamation costs per hectare .............................................. 36 Table 9: Data used in calculating CNRL's reclamation costs per hectare ................................................... 36 Table 10: ARO accretion per area of land disturbed................................................................................... 37 Table 11: ARO per cumulative area of land disturbed ............................................................................... 37
Table 12: Proposed framework ................................................................................................................... 40 Table 13: Framework applied to sample tailings pond ............................................................................... 51 Table 14: Comparison of the proposed framework to established costing methods ................................... 58

viii
List of Abbreviations
AER Alberta Energy Regulator
ARO Asset Retirement Obligation
bbl Barrels
CERI Canadian Energy Research Institute
CNRL Canadian Natural Resources Limited
DDA Dedicated Disposal Area
ERCB Energy Resources Conservation Board
FFT Fine Fluid Tailings
KPI Key Performance Indicator
MFSP Mine Financial Security Program
MFT Mature Fine Tailings
OSIP Oil Sands Information Portal
RDA Residue Disposal Area
TRO Tailings Reduction Operations

1
Chapter 1
Introduction
1.1 Introduction to the Athabasca Oil Sands
The Athabasca oil sands are situated in northern Alberta, Canada and contain proven reserves of
approximately 168 billion barrels of bitumen. The bitumen in the oil sands is housed within a mixture of
thick, tar-like substance consisting of sand, water, and clay. This mixture presents unique processing and
reclamation challenges because the bitumen must be separated from the tar-like housing before it can be
processed and sold as a usable product. The ore is treated using the Clark Hot Water process, which
produces Mature Fine Tailings (MFT) as a byproduct. MFT is a mixture of very fine material and water
that can take many years to settle if left untreated. The reclamation of MFT is the most significant
reclamation challenge present in the oil sands.
1.2 Problem Definition
Any mining operation should have a thorough understanding of the financial requirements it will
be faced with upon mine closure. A thorough understanding of future financial requirements allows for
better preparation and ensures appropriate use of bonding and other financial instruments in the present.
When an operation is adequately prepared for the costs of closure, the local government and other
stakeholders are faced with greatly reduced risks.
In the Athabasca oil sands, the costs of reclamation are unclear. Although the Alberta
Government holds security for each operator, it is generally agreed upon that the security held is not
adequate for the requirements of closure. Without knowledge of the closure costs, operators are unable to
adequately prepare for closure activities (Brodie, 2013a). These inadequacies put the citizens of Alberta at
risk for liability.

2
1.3 Objective of the Thesis
In order to better prepare for reclamation and mine closure, it is important to have a standardized
method of determining the expected reclamation costs. Therefore, the main objective of this thesis is to
create and propose a framework that could be used as a guideline in determining the reclamation costs of
any open pit oil sands operation. Before a useful framework can be created, it is important to cultivate a
thorough understanding of the reclamation challenges associated with the oil sands and how they might
impact standard costing procedures. As a result, this thesis has three objectives:
a. Review the progress and current state of reclamation in the Athabasca oil sands.
b. Determine how reclamation costing must be adapted to account for unique challenges associated
with the oil sands.
c. Create and propose a reclamation costing framework that can be applied specifically to the oil
sands.
An effective framework should be logical, easy to follow, and simple to apply. Without these
characteristics, a framework risks being more cumbersome than the process would have been without its
involvement. To ensure this is not the case, these characteristics will be adhered to as closely as possible
when creating the framework.
1.4 Methodology
In order to achieve the objectives that have been identified, a research methodology has been
designed and followed.
The initial stages of research required the gathering and analysis of data. First, a review of the
current status of the oil sands was established. This review includes literature from news organizations,
the Alberta Government, oil sands operators, and third party critics and regulators. The review also
includes an overview and summary of standard costing procedures applied in the industry. Next, company
documents were gathered from a variety of operators. Only companies that either operate solely within
the oil sands or that report their oil sands information separate from any other operations were included.

3
These parameters ensured that the data was not artificially inflated with information from outside of the
oil sands. The company documents were analyzed for any relevant financial and
reclamation/sustainability data and information. The resulting data was compiled into spreadsheets using
Microsoft Excel. The data was analyzed using first principles and graphs as a visual supplement.
The knowledge and data gained from the preceding stages was then applied to the creation of the
framework. The general structure and process used in standard costing methods was identified. This
structure was then adapted to the oil sands. Lastly, an example of the framework being applied to the most
unique challenge in oil sands reclamation, a tailings pond, was demonstrated. The example was created
using first principles and satellite imagery publically available from the NASA Earth Observatory.
1.5 Thesis Organization
Chapter 1 of this thesis presents the problem definition, the objective of the thesis, and the methodology
used.
Chapter 2 presents a literature review of relevant information as well as details about the oil sands,
reclamation activity and requirements, relevant laws and regulations in Alberta, and an overview of
typical costing processes.
Chapter 3 offers the data collection, analysis, and discussion. The beginning of the chapter offers a
summary of the reclamation progress over time in the oil sands. Additional sources of information that
were explored as a possibility for supplementing the existing data are described. The data gathered is
analyzed and presented using charts and graphs and a discussion of the data is included.
Chapter 4 introduces the proposed framework and describes its various components and how it should be
used. An example of the framework application is also included.
Chapter 5 contains a final summary of the thesis, closing remarks, and recommendations for future work.

4
Chapter 2
Literature Review
2.1 The Athabasca Oil Sands
Alberta’s Athabasca oil sands are the third largest proven reserves of oil in the world following
Venezuela and Saudi Arabia (Alberta Canada, 2013). The proven reserves contain approximately 168
billion barrels of bitumen and cover 142,200 km2 of land in Northern Alberta. Of this area, only 4800 km2
(3%) is mineable using surface methods while the remaining area is accessible through in-situ extraction
(Alberta Government, 2014). The surface mineable areas will be the focus of this thesis due to the
differences in associated reclamation challenges between the two mining methodologies.
Although bitumen in the area was originally documented in 1778, the first geological assessment of
the oil sands was not conducted until 1848. Samples of oil sands were analyzed beginning in 1882 and
lasting until 1884 when the possibility of hot water separation, a method used to extract bitumen from ore,
was proposed. The need to secure a supply of oil during World War II led the Canadian Government to
begin drilling and coring the oil sands reserves, which were estimated at 1.75 billion tons by 1947 (Hein,
2000).
In 1954 one original mining operator, Oil Sands Ltd., was taken over by Great Canadian Oil Sands
Ltd. (now Suncor), a subsidiary of the Sun Oil Company. In the same decade, Royalite (now incorporated
into Syncrude) and Shell Oil also performed work in the oil sands area. Great Canadian Oil Sands opened
the first commercial oil sands extraction plant in 1967 (Suncor Energy Inc., n.d.). Today, the oil sands
production makes up a significant portion of the Alberta economy.
2.1.1 Geology and Landscape
A layer of Devonian strata lies at the base of the oil sands deposit in the McMurray Formation region.
This layer is mainly made up of limestone with some calcareous shale in the east (Waterways Formation)

5
and carbonate rocks in the west (Gingras & Rokosh, 2004). The strata are truncated by an angular
unconformity where the McMurray Formation begins.
Complex layers of sand, silt, and clay make up the McMurray Formation that hosts the bitumen
(Devenny, 2010). The McMurray Formation consists of three distinct depositional environments: fluvial
in the lower region, estuarine in the middle region, and marine in the upper region. The fluvial sediments
were the first to be deposited, resulting in layers of coarse sands. Following the fluvial deposits, tidal
channels migrated and created the estuarine depositional environment. This environment consists of an
upper member, made up of “clean, well-sorted tidal channel sands and tidal channel muds,” and a lower
member “represented by lower energy tidal environments” (Wilkinson Jr. & Heltke, n.d.). Lastly, the
marine environment in the upper region was created when the Clearwater Sea advanced on the area.
The Clearwater Formation and Grand Rapids Formation lie atop the McMurray Formation. The
Clearwater Formation is made up of clay-shale with some sandstone, while the Grand Rapids Formation
consists mainly of sandstone with some bitumen.
2.1.2 Processing and Tailings
Oil sands consist of bitumen that has naturally been mixed with sand, water, and clay. In order to
produce a useable product, the bitumen and sand must be separated through hot water extraction. The
extracted bitumen can then be upgraded to synthetic crude oil. Due to the complexity of the depositional
environments in the area, oil sands ores are highly variable. As a result, the processing systems are
designed to be robust and capable of handling these variations. According to Devenny (2010), average oil
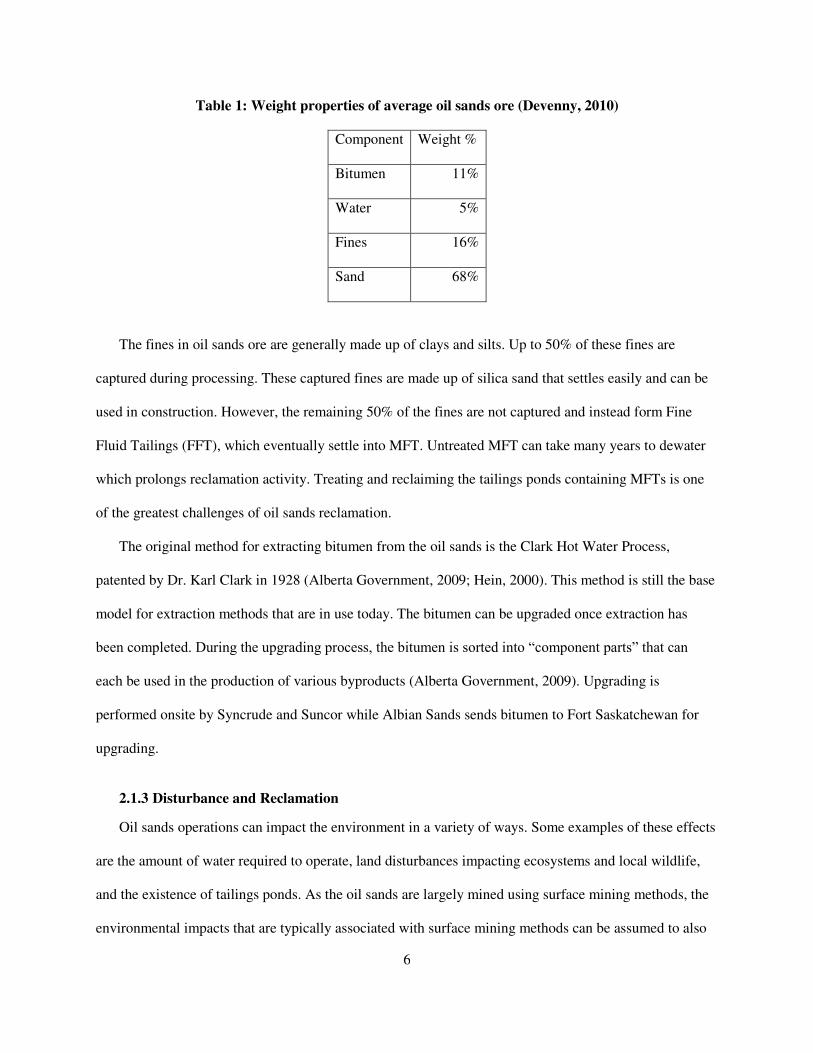
sands ore has the properties shown in Table 1.
6
Table 1: Weight properties of average oil sands ore (Devenny, 2010)
Component Weight %
Bitumen 11%
Water 5%
Fines 16%
Sand 68%
The fines in oil sands ore are generally made up of clays and silts. Up to 50% of these fines are
captured during processing. These captured fines are made up of silica sand that settles easily and can be
used in construction. However, the remaining 50% of the fines are not captured and instead form Fine
Fluid Tailings (FFT), which eventually settle into MFT. Untreated MFT can take many years to dewater
which prolongs reclamation activity. Treating and reclaiming the tailings ponds containing MFTs is one
of the greatest challenges of oil sands reclamation.
The original method for extracting bitumen from the oil sands is the Clark Hot Water Process,
patented by Dr. Karl Clark in 1928 (Alberta Government, 2009; Hein, 2000). This method is still the base
model for extraction methods that are in use today. The bitumen can be upgraded once extraction has
been completed. During the upgrading process, the bitumen is sorted into “component parts” that can
each be used in the production of various byproducts (Alberta Government, 2009). Upgrading is
performed onsite by Syncrude and Suncor while Albian Sands sends bitumen to Fort Saskatchewan for
upgrading.
2.1.3 Disturbance and Reclamation
Oil sands operations can impact the environment in a variety of ways. Some examples of these effects
are the amount of water required to operate, land disturbances impacting ecosystems and local wildlife,
and the existence of tailings ponds. As the oil sands are largely mined using surface mining methods, the
environmental impacts that are typically associated with surface mining methods can be assumed to also

7
impact the oil sands mines. These impacts, identified by Sengupta (1993), are summarized in Table 2.
Reclamation of the oil sands is necessary to mitigate any risks of long-term damage and to return the land
to a useable state after mining has ceased. In addition, the potential impacts listed in Table 2 must be
remedied where and when possible. Impacts relating to water quality and contamination, especially in the
long-term, tend to make up a significant portion of reclamation costs (Moran, n.d.).
Table 2: Environmental issues associated with surface mining adapted from (Sengupta, 1993)
Contamination
Mine water drainage
Pollution due to relocation of excavated materials
Noise pollution
Air pollution
Damage to soil
Vegetated soil loss
Geological problems
Structural changes in soil layers
Chemical changes in soil layers
Changes to landscape
Damage to
fauna
Eradication of natural fauna
Eradication of fish habitat
Damage to
flora
Eradication of natural flora
Plant withering due to dust
Damage to land
Eradication of agricultural lands, forests, and urban areas
Destruction of infrastructure
Cultural issues due to land damage
Environmental
damage
Destruction of landscapes and habitats
Health problems due to pollution
Water and wind erosion
According to the Alberta Government, reclamation requires that land be returned to a state that has
“an equivalent land capability” as the pre-mining land (Province of Alberta, 1993). However, this only
requires that land be equally productive; there is no requirement for the land to be returned to the same
productive use. Regulation 115/1993 specifies “equivalent land capability means that the ability of the
land to support various uses…is similar to the ability that existed prior…but that the individual land uses

8
will not necessarily be identical” (Province of Alberta, 1993). For example, land that was originally used
for farming and agricultural use does not need to be returned to agricultural use post-mining. The
regulation states that an equivalent land capacity will be “assessed using an evaluation of the physical,
chemical, and biological characteristics of the land” (Province of Alberta, 1993). However, productivity
of land is not easily quantifiable and could be left open to interpretation.
Tailings ponds represent the largest impact on the landscape as well as the greatest challenge for
reclamation in the oil sands. As of December 31st, 2012 mining in the oil sands had affected a total of
89,592 ha (Alberta Government, 2013). While 5,447 ha is permanently reclaimed, only 105 ha is certified
reclaimed, meaning that the land meets an equivalent land capability based on long-term monitoring
(Alberta Government, 2013). By the end of 2013, land disturbance in the form of tailings ponds
accounted for 22,000 ha of the disturbed land and housed a volume of 975.6 Mm3 (Oil Sands Information
Portal, 2015b).
The oil sands have received criticism related to environmental policy, including concerns that oil
sands land is being leased without conducting proper environmental assessments. Jennifer Grant of the
Pembina Institute noted the apparent disconnect between claims of striving towards “responsible resource
development” while at the same time attempting to reduce regulations and increase production (Grant,
2012). Additionally, journalists have questioned the lack of input that Albertans are given as well as the
minimal amounts of discussion in Parliament with regards to important policy decisions relating to the oil
sands, citing that widespread discussion did not occur until the Keystone XL Pipeline was being
discussed (Steward, 2015).
Presently, oil sands operators use tailings sand from processing as fill for areas that have been mined
out. This fill is then covered with overburden and capped with topsoil, which can be reforested with
native species (Alberta Government, 2009). However, the reclamation of tailings ponds is proving to be
more difficult.

9
The tailings produced from oil sands processes are a mixture of sands, clays, and fine silts. This
mixture is deposited into tailings ponds where the fines are able to settle out. Since the settling process
can take many years unassisted, oil sands operators often add flocculants in order to increase the rate of
settling.
Oil sands operators have been researching different methods of tailings reclamation for a number of
years. The main issue that must be addressed is the large amount of time required for FFT to settle enough
that a trafficable surface can be created. Some of the methods being researched include use of
centrifuging, composite or consolidated tails, water capping, coke capping, and carbon dioxide addition.
Syncrude and Suncor make use of a program where the tailings are altered to become inert through the
addition of gypsum or lime (Alberta Government, 2009). This program, called the Consolidated Fine
Tails Program, allows tailings ponds to be reclaimed in the same manner as mined areas. Syncrude has
also constructed a tailings centrifuge plant after successful testing of demonstration projects. Centrifuged
tailings form “clay soil material” that the company intends to use in reclamation land forming (Syncrude
Canada, 2011). Canadian Natural Resources has had success accelerating settling by treating their tailings
with carbon dioxide to form “non-segregated tailings” (Canadian Natural, 2015). Suncor uses their
Tailings Reduction Operations (TRO) technology to accelerate drying times, which they expect “to
significantly accelerate the rate of land and tailings reclamation, eliminate the need for new tailings ponds
at existing mine operations and, in the years ahead, reduce the number of tailings ponds at the present
mine site” (Suncor Energy Inc., 2011). Albian Sands uses an alternative approach of adding mechanical
thickeners to increase the rate of settling. These thickeners allow for the recovery of water and heat
(Alberta Government, 2009). Clearly, a number of different technologies and methods are being
investigated as potential solutions to the tailings issue.
For each barrel of bitumen produced, approximately 1.4 barrels of tailings are generated (Mikula,
2012). Currently, oil sands are producing 2.2 million bpd of bitumen (Steward, 2015). Surface mining
operations account for approximately 1.2 million bpd of this production (Oil Sands Review, 2015). If the

10
production rates remain the same, approximately 1.7 million bpd of tailings will be produced in 2015
from surface mining. Although the Canadian Association of Petroleum Producers is forecasting a
decrease in bitumen production for the current year, it is predicting an increase over the next three years
as new plants come online (Steward, 2015). If surface mining operators were to produce at capacity,
tailings production would increase to approximately 2.1 million bpd. The Canadian Energy Research
Institute (CERI) forecasts that bitumen production will grow to 3.7 million bpd by 2020 and 5.2 million
bpd by 2030 (Canadian Energy Research Institute, 2014).
Grant and Flanagan have identified a number of potential risks associated with the presence of
tailings ponds (Grant & Flanagan, 2013). Firstly, tailings contain a number of hazardous compounds
including napthenic acid, cyanide, and a variety of metals. Seepage from tailings ponds may result in the
contamination of both groundwater and surface water and the presence of these hazardous compounds
increases the potential harm if seepage does occur. Secondly, despite operator prevention efforts, tailings
ponds are sometimes mistaken for open water by wildlife (Grant & Flanagan, 2013). Birds that mistake
tailings ponds as open water and land in them often perish as a result of their feathers becoming saturated
with residual bitumen, preventing flight. Lastly, tailings ponds emit gases such as carbon dioxide and
methane, which are known to contribute to climate change (Grant & Flanagan, 2013).
2.1.3.1 Reclamation Successes
Despite widespread criticism, oil sands operators have achieved some success with regards to
reclamation. Syncrude’s Gateway Hill site was the first area of land to receive reclamation certification
from the Alberta Government. The 104 ha area of this site was originally reclaimed in the 1980s but did
not receive reclamation certification until 2008 (Government of Alberta, 2008; Syncrude Canada Ltd.,
n.d.). Although Gateway Hill was the first site to receive certification from the Alberta Government, it
also resulted in attention being focused on the shortcomings of the state of reclamation at the time.

11
2.1.3.2 Directive 074
In 2009, the Energy Resources Conservation Board (ERCB), now known as the Alberta Energy
Regulator (AER) introduced Directive 074 Tailings Performance Criteria and Requirements for Oil
Sands Mining Schemes in an attempt to manage the increasing volumes of stored tailings. The objective
of Directive 074 was to reduce long-term storage of FFT and the volumes of process-affected water while
increasing the rate of reclamation. To achieve this, a number of requirements were placed upon oil sands
operators, which included the following:
� To capture and deposit at least 50% of fines into a Dedicated Disposal Area (DDA)
� To ensure that the DDA fines exhibit a shear strength of 5 kPa within 1 year of deposit in
order to contribute to 50% fines capture, and
� To ensure that the DDA must be ready to reclaim and have a trafficable surface within 5 years
after deposition ends with fines exhibiting a minimum shear strength of 10 kPa
However, Directive 074 received a great deal of criticism and many believed it was not an adequate
solution. It was described as being “well intended but ineffective, and often set unnecessary objectives for
producers” (Snyder, 2015). Some of the requirements and targets set out in Directive 074 may have
caused more problems than they solved; working towards short-term targets within strict timelines may
have limited research and development while forcing technologies to be scaled up before they were viable
(Snyder, 2015). Although Directive 074 was introduced in 2009, the first tailings compliance reports were
not released until 2013 (Grant & Flanagan, 2013). These reports revealed that none of the oil sands
operators met the tailings reduction targets set out in 2009. Additionally, none of the producers were able
to meet the targets for drying and storing fine tailings. In 2010, the ERCB enabled itself to exempt
companies from its own regulations including Directive 074. These allowable exemptions were utilized
by all but one oil sands operator. Specifically, many companies have been exempt from annual particle
capture rates provided that cumulative requirements are met. However, some critics believe that creating
targets for annual capture rates misguidedly removes the focus from tailings ponds (Snyder, 2015). By
2012, all operators had failed to meet even the newer relaxed regulations (Grant & Flanagan, 2013).

12
Despite the continued examples of noncompliance, the ERCB chose not to enforce Directive 074 through
penalties or fines, stating that the original targets were too optimistic.
In March, 2015, Directive 074 was suspended and replaced by the Alberta Government’s Tailings
Management Framework for Mineable Athabasca Oil Sands (Bailey, 2015).
2.1.3.3 Tailings Management Framework
The Alberta Government implemented the Tailings Management Framework for Mineable Athabasca
Oil Sands, which the AER was expected to review and subsequently release its own draft framework. The
framework would provide guidance and direction as to what tailings regulations should be according to
the Alberta Government. The goals of the framework as stated were to:
x Manage fluid tailings accumulation
x Manage long-term liability and environmental risk
x Clarify government expectations
x Encourage technological innovation
x Support proactive management strategies
x Enhance transparency and assurance through monitoring, evaluation, and reporting
x Establish direction for managing legacy tailings (Alberta Government, 2015)
The framework was intended to support the Alberta Government’s Lower Athabasca Regional Plan,
including the objective of increasing the rate of reclamation. It attempts to manage both long-term
liability as well as environmental risk, thereby remedying some of the issues that critics had raised
concerning Directive 074. The framework is the first to handle legacy tailings as well as future tailings
generated through production (Flanagan, 2015). Any tailings generated after January 1, 2015 are
considered to be new fluid tailings and are therefore subject to a different set of targets, triggers, and
limits than legacy tailings. Due to the variation in oil sands projects, the AER will set project-specific
thresholds. The framework also focuses on final results rather than expecting operators to meet annual
targets (Snyder, 2015). Projects will be individually assessed for a volume of fluid tailings known as the

13
“end of mine life target” that can reasonably be ready-to-reclaim within 10 years of the end of mine life.
Triggers and limits for each project will be based on the end of mine life target.
However, the Pembina Institute raised concerns over loopholes that exist within the framework: in
order for it to be effective, the penalties for failing to comply must be set greater than the cost of the fees
or technologies associated with complying (Flanagan, 2015). Additionally, it was noted that the AER did
not penalize companies for failing to comply with Directive 074 and that they will continue to be
responsible for collecting penalties under the new framework. For the framework to be effective it will be
necessary that companies be held accountable and penalized for non-compliance, which was one of the
weaknesses of Directive 074. It was suggested that noncompliance be penalized earlier in the mine life
and that tolerances for deviation be lowered. The framework sets a “profile deviation trigger” that allows
for up to 20% more tailings volume growth than was originally approved for each project (Alberta
Government, 2015). There is also a total volume limit of 140% of the end of mine life target. This limit
allows the tailings inventories to be 40% greater than forecasted and will be approved with some potential
penalties and additional regulatory requirements. Despite these criticisms, Flanagan stated that the new
framework could represent “meaningful progress” if it is consistently and rigorously enforced (Flanagan,
2015).
2.2 Financial Requirements in Alberta
The mining industry has been aware of the high cost of reclamation for many years. In 1988, Lane
and Berdusco wrote:
…it is clearly apparent that the standards for acceptable reclamation have become increasingly complex and costly in response to expectations from the general public. Reclamation must now be recognized as a permanent source of expense in carrying out the business of mining and should therefore be accounted for in long term corporate financial plans. (Lane & Berdusco, 1988)

14
Despite this, companies have failed to adequately prepare for the cost of reclamation. The high costs of
reclamation are most effectively managed when they are included and accounted for in the mine plan
from its conception. Reclamation costs may exist as either “preventative costs, direct treatment costs, or
post-operational treatment costs” (Moran, n.d.). Due to the number and variety of potential cost sources,
there is potential for overlooked or unaccounted impacts that may place the financial burden on the
public.
By the end of 2014, mines in Alberta had an estimated $20.8 billion in reclamation liabilities while
only $1.57 billion of security was being held for these liabilities (Saher, 2015). In recent years, the
Alberta Government has made changes in an effort to improve environmental performance and enhance
reclamation securities in order to protect Albertans from these liabilities.
2.2.1 Mine Financial Security Program
One of the major efforts towards improved environmental performance in the oil sands was the
introduction of the Mine Financial Security Program (MFSP) in 2011. The MFSP places the
responsibility for reclamation, remediation, and abandonment on the Environmental Protection and
Enhancement Act approval holder and ensures that any reclamation work completed must meet provincial
standards. The main purpose of the MFSP is to secure reclamation funds to be used in the event that an
operator cannot perform reclamation. This ensures that Albertans are protected from liability and that land
is progressively reclaimed throughout the mine life, thereby reducing the risk of abandonment. Both
security and the estimated value of resources remaining in the ground are considered to be assets. As
resources are mined, security requirements increase to reflect the increased liability for reclamation.
Likewise, liability decreases as land is reclaimed. Under the MFSP, mine operators must submit an
annual report providing the information for security calculations. Each project must have a base amount
of security funding. Current as of October 31st, 2015, existing oil sands projects have posted securities as
listed in Table 3.

15
Table 3: Financial security held under the MFSP for existing oil sands projects adapted from
(Alberta Energy Regulator, 2015)
Approval Holder Project Name Base Security
Deposit Canadian Natural Resources Limited
Horizon Oil Sands $61,200,000
Fort Hills Energy Corporation Fort Hills Oil Sands $38,958,605
Imperial Oil Resources Ventures Limited
Kearl Oil Sands $64,655,000
Shell Canada Limited Muskeg River Mine $111,277,442
Shell Canada Limited Jackpine Mine $72,361,895
Suncor Energy Inc. Base Operations $359,096,654
Syncrude Canada Ltd. Mildred Lake, Aurora North/South
$205,303,024
Total E&P Canada Ltd. Joslyn North Mine $26,400,059
TOTAL $939,252,679
New oil sands mines will require $30,000,000 as a base security deposit or $60,000,000 if the mine
has an upgrader. No additional security is needed if a project is meeting the three requirements of having
assets that are three times larger than liabilities, having at least 15 years remaining in its mine life, and
meeting its reclamation targets. However, if a project does not meet these requirements, it will need
additional security deposits in the form of an asset safety factor deposit, an outstanding reclamation
deposit, and/or an operating life deposit, depending on which requirements are not being met.
The asset safety factor deposit is triggered when a project’s assets are less than three times its
liabilities. The calculation for this deposit is as follows:
MFSP = NRF
where N = 3-year average of annual netbacks
R = Gross proven and probable reserves
F = Forward price factor
The outstanding reclamation deposit is triggered if the approved reclamation plan is not being
followed. This deposit requires $75,000/hectare of reclamation work to be planned but not completed.

16
Lastly, an operating life deposit is triggered if a project is operating within its final 15 years of
reserves. This deposit increases as the project approaches its end of life and reserves near depletion. This
increasing deposit is intended to ensure that reclamation costs are fully secured by the final six years of
reserves. At this time, no oil sands operators have been required to post more than the base security
deposit.
The Tailings Management Framework for the Athabasca oil sands added two additional triggers for
posting security: if tailings growth is 20% greater than originally approved or if tailings volumes are
greater than the total volume limit (Alberta Government, 2015). The MFSP may also be used in
conjunction with the framework in other ways if other performance criteria are not met. These posted
securities can be released if the issue that caused the trigger is remedied and remains within approved
limits for a period of time.
Although the MFSP is an improvement over past methods of ensuring financial security, the program
has received some criticism. As recently as June, 2015 the Auditor General of Alberta, Merwan Saher,
expressed concerns that the MFSP did not provide adequate financial assurance for reclamation costs.
Saher recommended that it be adjusted to improve security calculations as well as the monitoring of
security amounts. In its current state, the province and the people of Alberta are at risk of liability in the
event that an oil sands operator cannot fulfill reclamation obligations (Saher, 2015). The Pembina
Institute also raised concerns that the Alberta Government still had not set the rate and frequency at which
operators must pay into the program, which could leave Albertans unprotected (Flanagan, 2015). In the
report, Saher suggests that there may be an overestimation in the value of mine assets and that potential
impacts of an extended mine life are not being appropriately analyzed. In addition, critics have noted that
there is no discount factor included in the asset calculations, which opens oil sands operations up to the
potential for underestimated liabilities (Saher, 2015; Thorley, 2012). Instead, the calculations use a
forward price factor that minimizes the potential impact of future price fluctuations on revenues and
operating costs, which may not be proportional to one another. The MFSP also considers proven and

17
probable reserves to be equally valuable and does not include any adjustment for the cost of developing
undeveloped reserves. Lastly, Saher notes that the calculation does not account for risks. The mine life of
a project may be extended if an operator uses workarounds not covered by the MFSP. In-situ techniques
that are only recently coming into use may allow an operator to include in-situ reserves in their total
reserves, thereby extending the mine life and delaying the posting of security deposits despite the minimal
impact that in-situ extraction has on surface disturbance and reclamation. Operators also have the ability
to amend mine approvals to include multiple areas or different areas. If this ability is used to include older
projects with new projects, the requirement to post end-of-life security could further be delayed.
In addition to remedying the two stated issues, Saher recommends that AER create a risk-based plan
for monitoring and verifying reclamation actions and the associated security guarantees (Saher, 2015).
Currently, four types of audits can be performed:
x Level 1 – Phone or in-person discussion
x Level 2 – Written questions and answers
x Level 3 – Detailed audit by government staff
x Level 4 – Detailed audit by third party auditor (Alberta Energy Regulator, 2017)
The MFSP does not indicate the frequency or type of audits to be performed. While eight oil sands mines
exist, only two level 4 audits and three level 3 audits have been conducted in the Alberta oil industry since
the implementation of the MFSP (Saher, 2015). Although thirty-two Level 2 audits have been completed
since the implementation of the MFSP, these audits do not provide the same level of confidence since
they are not verified. Finally, Saher notes that significant changes may occur between required annual
reports from mine operators. These changes may go unnoticed unless the AER increases monitoring of
available information such as press releases, financial statements, and share prices (Saher, 2015).
2.2.2 Transparency and Disclosure
The level of disclosure and the lack of transparency surrounding oil sands operations’ financial
information are under constant scrutiny. In particular, there is a significant lack of disclosure regarding

18
reclamation costs and liabilities of companies. The costs reported by companies are significantly lower
than what is actually being spent. An average reclamation cost of $11,969/hectare was reported to the
government in 2008 but much higher operational costs are seen in practice (Brooymans, 2008; Lemphers
& Logan, 2011). According to the Pembina Institute, there were up to $15 billion in unaccounted
liabilities in 2008 and this number could increase to between $17 and $33 billion by 2025 (Lemphers,
Dyer, & Grant, 2010).
2.3 Reclamation Costing
Reclamation costing is the act of estimating future reclamation costs based on presently available
data. Costing is an important component of planning and financially preparing for the end-of-life and
post-closure portion of a mining operation. According to Brodie, “planning and money” are necessary in
order to reduce any potential negative impacts from mining (Brodie, 2013b). The scientific literature on
reclamation costing is generally limited, although the consensus is that it is best performed based on
experience rather than strictly through education (Brodie, 2013a). There are a number of theoretically
acceptable methods of arriving at a reclamation cost estimate. Two commonly used methods seen in the
literature are developing mine models and costing using a case study approach (McKay et al., 2006;
Misiolek & Noser, 1982).
The term “reclamation cost estimate” can refer to a number of different estimates, depending on the
perspective from which it is prepared. Naturally, a cost estimate that is prepared later in the mine life will
be more accurate due to more complete data as well as a more developed understanding of reclamation
requirements. However, reclamation cost estimates can also vary depending on who the estimate is
prepared for and by with four possible perspectives: owner’s internal estimate, owner’s bonding estimate,
regulator’s estimate, and worst-case estimate (Brodie, 2013a). The owner’s bonding estimate and the
regulator’s estimate are the most useful for the purposes of this thesis as they are robust while remaining
realistic. These estimates are respectively used for determining and justifying reclamation security and for

19
determining expected costs in the event of abandonment (Brodie, 2013a). Although the worst-case
estimate is extremely conservative, it is intended for a major failure rather than a reasonable mine plan.
Once estimators have arrived at a cost estimate, some form of assurance is necessary to ensure that
adequate funding is available to cover the costs. A common phrase regarding reclamation assurance is
that the “polluter pays.” The “polluter pays principle” is often used by governments to state that the
remediation of pollution is the responsibility of whoever caused the pollution. In mining, the polluter pays
principle typically puts the cost of reclamation on the operator.
Governments and operators have a number of options available for providing reclamation assurance.
A third party-guarantee is an unconditional guarantee negotiated through a third party, typically a
financial institution. The guarantee of a financial institution means that the associated funds can be
available “on demand” (Spitz & Trudinger, 2009). A notable drawback of third party guarantees is that
they are often considered to be part of an operation’s working capital. A letter of credit is a type of third-
party guarantee with an associated term, often of one year. A letter of credit can be renewed once the term
has passed but the issuer also has the option to withdraw it. Letters of credit and third-party guarantees are
inexpensive for the operator to establish but they also limit other credit options that are available to the
operator. Alberta relies mostly on letters of credit for financial assurance. Another option is a cash deposit
given directly to the government. Because of the associated administrative requirements, cash deposits are
mostly limited to smaller operations. While cash deposits do require an upfront expense from the
operator, the cash can be returned to them once reclamation has been completed. A trust fund is a third
option for reclamation assurance. Like a third-party guarantee, trust funds require a third party. Trust
funds are associated with a specific closure plan and are established over time through structured
contributions. Trust funds are viewed positively because of the associated transparency – they are fully
visible to both the government and the public. Insurance policies, the final type of assurance, are
theoretically acceptable according to “several jurisdictions” (Spitz & Trudinger, 2009). An insurance

20
policy for reclamation costs would behave similarly to other insurance policies and require the payment
of an annual premium.
There is also the possibility of incorporating “soft” assurance options such as financial strength
ratings and corporate guarantees. These soft options are less desirable as they do not provide the same
level of security as the more concrete options listed above.
A model is typically the end-result of reclamation costing. A number of reclamation cost models are
publicly available (Nevada Standardized Reclamation Cost Estimator, British Columbia Ministry of
Energy and Mines Reclamation Costing Spreadsheet, etc.) but many were determined not to be suitable
for this thesis either due to proprietary limitations or because access to the inner workings of the model is
limited. In addition, models are created for specific geographical regions. Nevada’s climate and terrain
allows for a model that can be applied with relative ease across the state. British Columbia, however, has
variable terrain that poses different challenges for reclamation depending on the mine location. The
Athabasca oil sands pose a number of unique challenges for reclamation costing due to their scale, the
nature of tailings ponds, and MFTs. To address these challenges, a model specific to the oil sands is
necessary.
2.3.1 Issues and Challenges
By nature, reclamation costing is an imprecise exercise since a number of assumptions must be made
in order to arrive at a cost estimate. “Assumptions imply uncertainty, and uncertainty translates into
higher cost” (Marks et al., 2004). The required assumptions and the resulting uncertainty are the source of
many of the challenges associated with reclamation costing. There is potential for uncertainty in three
main areas: the mine plan, the reclamation plan, and the costs of performing reclamation work required
(Brodie, 2013b).
Uncertainty in the mine plan can impact the entire reclamation process. Costing is typically
performed based on mine plans, which are often changed throughout the mine life. The mine plan is used
as a basis for determining the amount of disturbed area that will need to be reclaimed as well as the nature

21
of the disturbances. Reclamation costs can be more accurately estimated as mine life progresses because
fewer assumptions are needed and any necessary adjustments to the mine plan will have been made and
can be accounted for in the estimate. However, there may be less income available for reclamation
security if the mine is ramping down production.
Overly ambitious reclamation plans are often proposed by mining companies eager to generate
interest from investors (Martin & Boxill, 2008). An unrealistic reclamation plan greatly increases the
likelihood that a company will underestimate the cost of reclamation. As these plans are reassessed
throughout the mine life, they are often found to be lacking in detail necessary to develop a reclamation
estimate. Reclamation plans often suggest progressive reclamation, which is the preferred method for
investors and regulatory agencies. Progressive reclamation allows for lower costs by taking advantage of
the equipment and personnel that are already present onsite (Ministry of Energy and Mines, 2015). In
addition, progressive reclamation may allow for reduced costs by way of releasing bonds as land is
reclaimed. Lastly, progressive reclamation can reduce uncertainty in the reclamation plan as it presents
the opportunity to gather data. Land that is reclaimed during mining can be used to test and improve the
revegetation process (Martin & Boxill, 2008).
The costs associated with performing reclamation tasks can vary widely depending on a number of
factors. Decisions relating to logistics and technical aspects of reclamation (such as fleet selection)
present a wide array of possible costs. Cost estimates can vary depending on who is assumed to perform
the reclamation: a contractor or the mining company itself. Although a contractor is more expensive at the
time of reclamation, it reduces the risk of default that may be associated with a junior mining company
(Martin & Boxill, 2008). Reclamation estimates should be updated throughout the mine life to ensure
adequate funds will be available.
2.3.2 Process
Although there is no standard process for reclamation costing, the steps outlined by John Brodie and
the USDA Forest Service Bond Guide are similar and may be used as a guideline (Brodie, 2013a; Marks

22
et al., 2004). A comparison of the two methods is shown in Table 4. The table has been organized to
group comparable steps from each source together. It should be noted that steps 0, 6, and 7 of the USDA
Forest Service Bond Guide are specific to bond administration and do not have comparable steps under
Brodie’s process.
Table 4: Comparison of two approaches to costing (Brodie, 2013a; Marks et al., 2004)
John Brodie USDA Forest Service Bond Guide
0. Not addressed by author 0. Determine the period of operation covered by the bond
1. Define closure objectives on a site-wide and individual mine component basis
1. Determine what is being reclaimed
2. Characterize expected site condition at the time reclamation commences
2. Identify the standards to be met
3a. Describe expected closure measures
3. Characterize the reclamation tasks necessary
3b. Determine quantities of work for each expected activity
3c. Divide each activity into specific tasks
3d. Characterize the level of effort or difficulty in completing the tasks
4. Identify appropriate unit costs for each task
4a. Estimate direct reclamation costs
4b. Estimate indirect reclamation costs
5. Present task list, quantities, unit costs, and calculation of total cost
5. Summarize and review the estimate
6. Not addressed by author 6. Administer the bond
7. Not addressed by author 7. Bond collection
Table 4 shows that the general process for costing is similar regardless of the source. The two main
differences between the Brodie and USDA approaches are in the presentation rather than the function.
Brodie’s process offers more detail on the tasks involved in Step 3, while the USDA’s process groups
those steps into a general statement. Likewise, the USDA process splits the act of estimating costs into
direct and indirect costs, while these are implicit in Brodie’s approach.

23
Although the steps are neatly outlined in Table 4, the level of detail and work associated with each
step lends itself to a much more complex undertaking. The processes shown are simply guidelines on how
to develop a cost estimate. When complete, a thorough cost estimate should include information on both a
cost-per-hectare for reclamation as well as the costs associated with long-term monitoring and treatment
activities (Martin & Boxill, 2008).

24
Chapter 3
Data Analysis and Discussion
3.1 Data Acquisition
All data used in the analysis is available in the public domain. The majority of data is sourced from
company documents including annual reports, reclamation reports, and sustainability reports. The Alberta
Government’s Oil Sands Information Portal (OSIP) was also used to complete information when
company documents were insufficient. The companies chosen as the focus of data acquisition were
Canadian Oil Sands, Syncrude, Suncor, and Canadian Natural Resources Limited (CNRL). These
companies were chosen because they contribute to a significant amount of the total open pit activity in the
oil sands, and because they either work exclusively in the oil sands or they report oil sands information
separately from their other areas of operation.
3.2 Reclamation Progress
3.2.1 Canadian Oil Sands
Prior to Suncor’s acquisition of the company in March 2016, Canadian Oil Sands was a 36.75%
stakeholder in the Syncrude operation. Canadian Oil Sands’ sole source of revenue generation was the
Syncrude project. As such, details of their reclamation progress can be found in the following Syncrude
section.
3.2.2 Syncrude
In total, Syncrude has permanently reclaimed over 3500 hectares. Their two oil sands operations,
Aurora North and Mildred Lake, have expected closure dates of 2050 and 2080 respectively. Syncrude’s
approach to reclamation is driven by its stated reclamation goal of ensuring that fully reclaimed land:
x “Has capability equivalent to that existing prior to development;
x Is integrated with the surrounding area;

25
x [Contains] established boreal forest upland and lowland communities;
x Yields water suitable for return to the natural environment;
x Is planned in direct consultation with the local, directly affected stakeholder, such as neighboring
Aboriginal communities and the Regional Municipality of Wood Buffalo” (Syncrude Canada,
2014)
To this end, Syncrude has established a number of research initiatives and reclamation projects. The
reclamation of their East Mine, a 11.5 km2 area, began in 2000 using their own composite tailings
technology, developed in cooperation with Suncor. This technology uses sand and gypsum mixed with
the tailings during placement to encourage faster settling (Syncrude Canada, 2011). Sand capping in the
East Mine was ongoing as of 2013. In addition, Syncrude piloted a 54 ha fen wetland project, the
Sandhills Fen, in the East Mine using composite tailings as the foundation and soil to act as a base for
revegetation. In 2013, the vegetation on the fen wetland was showing promising results and
“performance…comparable to the same plants on the natural site” (Syncrude Canada, 2013). The fen
wetland project was recognized in 2014 with the Mining Assocation of Canada’s Towards Sustainable
Mining Environmental Excellence Award (Syncrude Canada, 2014). It is expected to drive best practices
regarding wetland reclamation in the oil sands. The composite tailings technology is thus believed to have
been successful and Syncrude completed construction of an $800 million composite tails plant at their
Aurora North site in 2013 (Syncrude Canada, 2013).
Syncrude began researching water capping in the late 1980s and, through eleven test ponds, has found
that the resulting end-pit lakes can “evolve into natural ecosystems and, over time, support healthy
communities of aquatic plants, animals, and fish” (Syncrude Canada, 2011). In 2012, Syncrude began the
process of reclaiming their West Mine using water-capping technology. This was the first commercial-
scale demonstration of water capping in the oil sands. Capping was completed in 2013 and an extensive
research and monitoring campaign has been implemented for the next 20 years to monitor the progress of
the lake evolving into a functioning ecosystem (Syncrude Canada, 2012, 2013).

26
Syncrude’s centrifuged tails technology results in a soft tailings material that can be used in
landforming. Their commercial-scale demonstration of the technology began in 2012 to determine if the
technology would meet expectations on a commercial level. The demonstration was found to be
successful and a $1.9 billion full-scale tailings centrifuge plant was under construction with a planned
2015 start-up date (Syncrude Canada, 2014). The clay material that is produced by the centrifuge plant is
to be used in reclaiming the North Mine. Syncrude intends to place the material directly into the pit with
the intent of reducing the disturbances required as well as the hauling distances (Syncrude Canada, 2013).
3.2.3 Suncor
As a majority stakeholder in the company, Syncrude shares a number of Suncor’s reclamation
projects and successes. These projects, despite Suncor’s involvement, will not be discussed in this section
because they have already been covered in Section 3.2.2. Like Syncrude, Suncor successfully
reconstructed its own fen watershed area, the Nikanotee Fen. Additionally, Suncor was the first oil sands
company to successfully reclaim a tailings pond. Originally referred to as Pond 1, what is now known as
Wapisiw Lookout is a 220 ha watershed that is being continually monitored to ensure that it develops into
a self-sustaining ecosystem.
Suncor’s approach to tailings reclamation utilizes progressive reclamation and its proprietary TRO
technology, a dewatering method that it believes will “result in reclaimable surfaces 10 years after initial
disturbance” (Suncor Energy Inc., 2010). Suncor spent over $1.3 billion on the infrastructure required for
the TRO technology, which was completed in 2012. Currently, Suncor operates eight tailings ponds
containing 300 million m3 of fluid tailings (Suncor Energy Inc., 2015). It expects to reduce this to a single
pond using TRO. Suncor cancelled five planned ponds after the successful implementation of TRO
technology.
In addition to TRO, Suncor also uses petroleum coke capping and a $190 million wastewater
treatment facility to assist in tailings reclamation and management. The coke, which is a byproduct of the
bitumen processing, is used to cap the consolidated tails in Pond 5. Coke capping on Pond 5 is a field trial

27
of the method, and is expected to be complete by 2019 (Suncor Energy Inc., 2015). The wastewater
treatment facility aims to reuse water from the upgrading pond in operations, which would reduce the
total amount of fluid being directed to tailings ponds, therefore reducing the total volume of FFT (Suncor
Energy Inc., 2014).
In 2007, Suncor established four environmental targets to be achieved by 2015. These were the
reduction of water use, reduction of air emissions, increased reclamation, and improved energy efficiency.
By 2015, it had successfully met and surpassed all but the goal on energy efficiency. Compared to the
2007 baseline, reclamation of disturbed areas was increased by 100% (Suncor Energy Inc., 2015).
3.2.4 Canadian Natural Resources
CNRL’s Horizon mine is a relatively new oil sands site. Its progressive reclamation work has allowed
330 ha of land to be reclaimed since the start of operations in 2009. CNRL’s work on Horizon Lake
incorporates traditional knowledge in its research towards improving its habitat. CNRL has invested over
$1.6 billion towards tailings management research and technologies. CNRL uses non-segregated tailings
as its tailings management method. Non-segregated tailings have undergone significant dewatering using
cyclones, thickeners, and treatment with carbon dioxide. The addition of carbon dioxide improves the
settling rate of the fines, resulting in a “homogenous, semi-cohesive mass” (Canadian Natural, 2015).
CNRL believes that the non-segregated tailings technology will result in the size of tailings ponds being
reduced by half and that the time to a trafficable surface will also be reduced. CNRL is also incorporating
the use of smaller equipment and increasing mining selectivity to reduce fine in the tailings stream.
3.3 Alternate Sources
In an effort to supplement the available financial information on oil sands reclamation, other mining
industries were researched. In particular, the bauxite mining industry was chosen as a possible source of
information due to the challenges it faces regarding “red clay". Bauxite ore is processed using the Bayer
Process, which produces red clay as a by-product. Red clay contains oxides and insoluble ore that results
in a thick, clay-like material (World Aluminum, 2015). The issues that this material present have some

28
similarities to those of oil sands tailings. Although bauxite is mined in many countries worldwide, much
of the research available is from the Australian bauxite mining industry’s reclamation efforts.
Red clay was of particular interest due to the similarity of the issues in post-mining storage that it has
to oil sands tailings ponds. Typically, red clay is stored in Residue Disposal Areas (RDAs), which are
similar to the tailings ponds utilized by the Athabasca oil sands industry. RDAs present similar challenges
to tailings ponds, such as maintaining long-term stability, requiring long term monitoring, and the concern
of environmental risks. Additionally, some methods used to address the rehabilitation of RDAs are nearly
identical to those attempted in the oil sands. Like oil sands operators, bauxite mine operators have used
both dry stacking and ponding.
Although there are many similarities between bauxite’s red clay and the oil sands’ tailings, there are
also a number of significant differences between the two materials. The volume of red clay that the
Australian industry must address is on a much smaller scale than that of the oil sands tailings pond
volumes. Some of the disposal and rehabilitation methods used for red clay, such as dry disposal, are not
possible with oil sands tailings. Most importantly, red clay’s most significant reclamation challenge is its
high alkalinity, whereas the most significant challenge pertaining to oil sands tailings is the long period of
time required for fines to settle.
Like the oil sands industry, the bauxite industry provides a minimal amount of information relating to
reclamation costs. The only figure available estimated a reclamation cost of $0.16 per tonne of bauxite
based on an estimate from Alcoa (Auty & Frech Mikesell, 1998). However, context suggests that the
figure relates to the reclamation of mined-out areas rather than RDAs and the figure is over two decades
out of date. As such, there is not enough information available from the bauxite industry to act as
supplemental information and the information that is available is inadequate.

29
3.4 Analysis and Discussion
3.4.1 Reclamation Tracking
The reclamation status of oil sands land is difficult to track over time due to many changes in the
regulations relating to reclamation reporting over the years. Because of the significant differences in
reporting, it is not possible to equate the reclamation activity prior to 2009 to the activity from 2009
onwards.
From 1987 to 2008, land was reported as disturbed, reclaimed, or active. The changes in land
designations over this time period are shown in Figure 1. In 2008, the data shows 416 ha as “certified,”
but it is unclear how certification is defined in the dataset. During this period, the definition of each
category was not regulated. Operators were free to define the categories using their own judgment,
resulting in possible inconsistencies between companies. Land reported as being reclaimed may have
referenced areas that were permanently reclaimed or areas that had undergone temporary reclamation but
which would later be disturbed. It should also be noted that oil sands operations were active prior to 1987
but there was no requirement for land use tracking so data from this time period is unavailable. It should
also be noted that a number of new operations were established during the time period that the data spans.

30
Figure 1: Changes in oil sands land status over the period from 1987 to 2008. Adapted from Oil
Sands Information Portal, 2010
As of 2009, Alberta Environment introduced clearly defined and regulated categories for land status.
These categories are:
x EPEA Approved Footprint
x Mine Site Footprint
x Plant Site Footprint
x Total Active Footprint
x Cleared
x Disturbed: Used for Mine or Plant Purposes
x Ready for Reclamation: No Longer Used for Mine or Plant Purposes
x Soils Placed (Terrestrial; Wetlands and Aquatics)
x Temporary Reclamation (Terrestrial)
x Permanent Reclamation (Terrestrial; Wetlands and Aquatics)
x Certified
0
50.000
100.000
150.000
200.000
250.000
300.000
350.000
1987
1988
1989
1990
1991
1992
1993
1994
1995
1996
1997
1998
1999
2000
2001
2002
2003
2004
2005
2006
2007
2008
Land
Are
a (h
a)
Year
Disturbed Reclaimed Active

31
A graph of the reclamation progress from 2009 to 2014 reported under these categories can be seen in
Figure 2. For clarity and ease of reading, only the categories relevant to actual reclamation progress were
included in the graph.
Figure 2: Changes in oil sands land status over the period from 2009 to 2014. Adapted from (Oil
Sands Information Portal, 2015c)
Figure 3 shows the same graph with the data for the Cleared and Disturbed categories included in
order to demonstrate the scale of the disturbances compared to the reclamation progress. The data seen in
Figure 2 is visible in Figure 3 above the Disturbed category.
0
1.000
2.000
3.000
4.000
5.000
6.000
7.000
8.000
9.000
10.000
2009 2010 2011 2012 2013 2014
Land
Are
a (h
a)
Year
Ready for Reclamation Soils Placed
Permanent Reclamation (Terrestrail) Permanent Reclamation (Aquatic)
Temporary Reclamation Certified

32
Figure 3: Changes in oil sands land status over the period from 2009 to 2014 with cleared and
disturbed categories included. Adapted from (Oil Sands Information Portal, 2015c)
The tailings generation in the oil sands is a barrier to reclamation that is somewhat unique to the
industry. Figure 4 indicates that the volume of stored fluid fine tailings has grown steadily over time.
Note the gap in reported information from 2005 to 2007. Also note that the data from 1992 to 2012 are
estimates originating from OSIP.
0
10.000
20.000
30.000
40.000
50.000
60.000
70.000
80.000
90.000
100.000
2009 2010 2011 2012 2013 2014
Land
Are
a (h
a)
Year
Cleared Disturbed
Ready for Reclamation Soils Placed
Permanent Reclamation (Terrestrial) Permanent Reclamation (Aquatic)
Temporary Reclamation Certified

33
Figure 4: Growth in volume of stored fluid fine tailings from 1968 to 2013. Adapted from (Oil
Sands Information Portal, 2015a)
3.4.2 Reclamation Costs per Barrel
There were a number of obstacles to determining a reasonable reclamation cost estimate. The
financial and reclamation data available varied among the four companies reviewed, meaning that
comparing values and estimates among companies is challenging and, in some cases, not possible. In
addition, only data from 2011 onwards was deemed usable when analyzing data relating to land
reclamation. The introduction of defined and regulated land categories made it unreasonable to attempt to
compare reclamation activity before 2011 with activity taking place after 2011. Lastly, although the
companies chosen for analysis either operate exclusively in the oil sands or report oil sands financial
information separately from their other operations, some of the data available could not be reasonably
separated from the corporation’s overall operations.
The estimated amount of reclamation spending per barrel of oil produced by oil sands operators is
$1.56. This value was determined using data from Canadian Oil Sands, Syncrude, and Suncor. A rough
estimate of Syncrude’s total reclamation spending was determined using the reclamation spending
reported by Canadian Oil Sands and its share in Syncrude. Production information from Syncrude, shown
0
200
400
600
800
1000
1200
1968
1970
1972
1974
1976
1978
1980
1982
1984
1986
1988
1990
1992
1994
1996
1998
2000
2002
2004
2006
2008
2010
2012
Volu
me
(Mm
3)
Year

34
in Table 5, was used with the estimated reclamation spending to determine an annual cost per barrel
produced (Syncrude Canada, 2011, 2012, 2013, 2014). Syncrude’s reclamation spending was estimated
based on Canadian Oil Sands’ reported reclamation spending and the company’s 36.74% stake in
Syncrude (Canadian Oil Sands, 2010, 2011, 2012, 2013, 2014).
Table 5: Data used in calculating Syncrude's reclamation costs per barrel
Production
Estimated Reclamation
Spending
Million bbl Million $
2009 102.2 68.0
2010 107.0 130.6
2011 105.2 133.4
2012 104.9 147.0
2013 97.5 114.3
2014 94.2 49.0
Similarly, Suncor’s reported data on settlement of decommissioning and restoration liabilities was used to
determine an annual cost per barrel based on their production, shown in Table 6 (Suncor Energy Inc.,
2012, 2013, 2014, 2015).
Table 6: Data used in calculating Suncor's reclamation costs per barrel
Production Settlement of
Liabilities
Million bbl Million $
2012 131.1 380
2013 143.3 388
2014 154.0 324
2015 169.1 277
The averages of these values gave an overall estimated cost per barrel of $1.04 for Canadian Oil
Sands/Syncrude and $2.34 for Suncor. The average of all the data produced the estimate of $1.56 per
barrel.
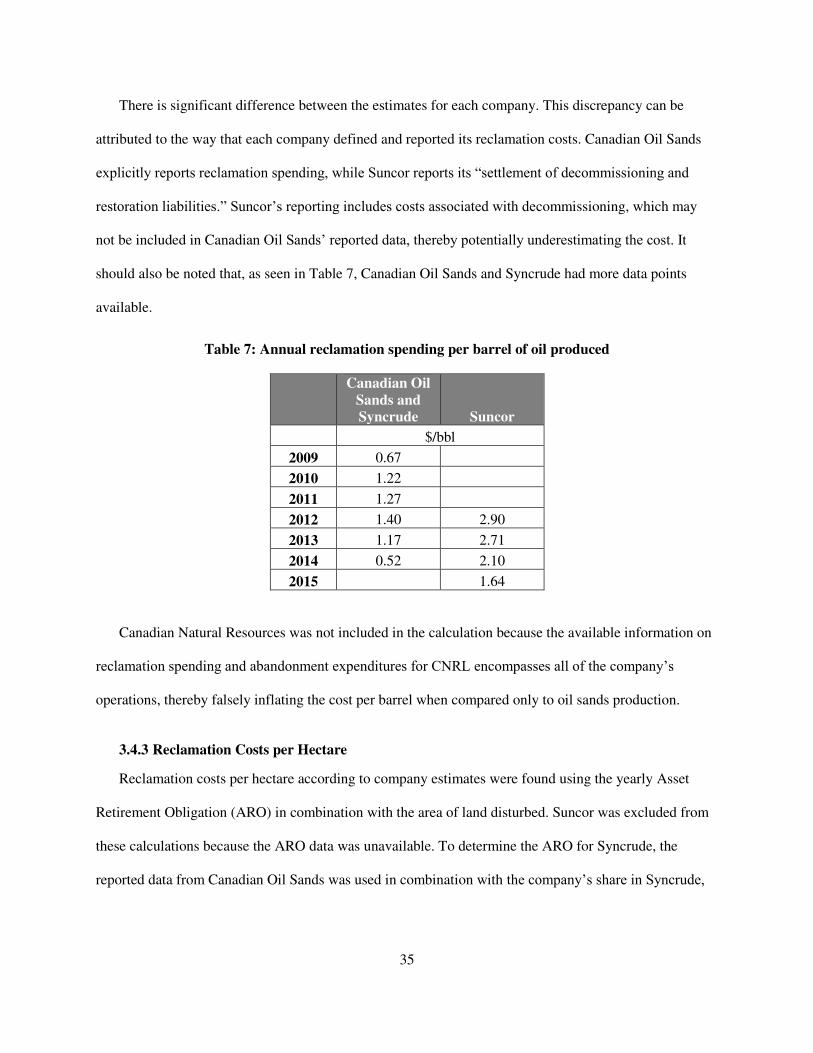
35
There is significant difference between the estimates for each company. This discrepancy can be
attributed to the way that each company defined and reported its reclamation costs. Canadian Oil Sands
explicitly reports reclamation spending, while Suncor reports its “settlement of decommissioning and
restoration liabilities.” Suncor’s reporting includes costs associated with decommissioning, which may
not be included in Canadian Oil Sands’ reported data, thereby potentially underestimating the cost. It
should also be noted that, as seen in Table 7, Canadian Oil Sands and Syncrude had more data points
available.
Table 7: Annual reclamation spending per barrel of oil produced
Canadian Oil Sands and Syncrude Suncor
$/bbl
2009 0.67
2010 1.22
2011 1.27
2012 1.40 2.90
2013 1.17 2.71
2014 0.52 2.10
2015 1.64
Canadian Natural Resources was not included in the calculation because the available information on
reclamation spending and abandonment expenditures for CNRL encompasses all of the company’s
operations, thereby falsely inflating the cost per barrel when compared only to oil sands production.
3.4.3 Reclamation Costs per Hectare
Reclamation costs per hectare according to company estimates were found using the yearly Asset
Retirement Obligation (ARO) in combination with the area of land disturbed. Suncor was excluded from
these calculations because the ARO data was unavailable. To determine the ARO for Syncrude, the
reported data from Canadian Oil Sands was used in combination with the company’s share in Syncrude,

36
shown in Table 8 (Canadian Oil Sands, 2011, 2012, 2013, 2014; Syncrude Canada, 2011, 2012, 2013,
2014).
Table 8: Data used in calculating Syncrude's reclamation costs per hectare
ARO ARO
Accretion
Cumulative Land
Disturbed Land
Disturbed
Million $ Ha
2011 6015 44 25858.0 1480.2
2012 5727 71 27861.0 1102.4
2013 5879 71 28120.0 485.2
2014 6464 76 28951.0 19984.0
The analysis for CNRL’s estimates was completed directly from the reported data, shown in Table 9
(Canadian Natural, 2011, 2012, 2013, 2014, 2015).
Table 9: Data used in calculating CNRL's reclamation costs per hectare
ARO ARO
Accretion
Cumulative Land
Disturbed Land
Disturbed
Million $ Ha
2011 798 20 476.2 476.2
2012 937 32 1,106.6 630.4
2013 1138 34 1,507.6 401.0
2014 783 47 8,322.6 6,815.0
This data was analyzed in two ways. Firstly, analysis was performed using the annual ARO accretion
with the amount of land disturbed in the corresponding year. The results are shown in Table 10. The
estimated cost using this method was $53,000/ha, with Canadian Oil Sands and Syncrude having an
average of $60,000/ha and CNRL having an average of $46,000/ha. This method of analysis offers an
estimate based on the reclamation work completed that year and how it has impacted the total ARO.

37
Table 10: ARO accretion per area of land disturbed
Canadian Oil Sands/Syncrude CNRL
Thousand $/ha
2011 29.42 42.00
2012 64.19 50.76
2013 145.87 84.79
2014 3.8136 6.90
Secondly, the companies’ total reported ARO was analyzed in combination with the cumulative land
disturbances. The results from these calculations are shown in Table 11. The estimated reclamation cost
using this second method was $227,000/ha based on a weighted average. The average value for Canadian
Oil Sands and Syncrude was $220,000/ha, while the average value for CNRL was $840,000/ha. This
method of analysis offers an estimate based on the total reclamation work completed and how the
company estimates it will progress over time.
Table 11: ARO per cumulative area of land disturbed
Canadian Oil Sands/Syncrude CNRL
Million $/ha
2011 0.23 1.68
2012 0.21 0.85
2013 0.21 0.75
2014 0.22 0.09
These two estimates differ by a very significant amount. Although the estimates differ, it is not
unreasonable that both values may be accurate estimates in different circumstances, depending on the
type of reclamation work completed. It is also important to note that ARO is a company’s estimate of its
expected reclamation costs based on presently available information. However, the actual costs at the time
of reclamation may differ significantly.
The method using the ARO accretion is based on each individual year’s reclamation work. Because
of the change to the definition of Disturbed in 2011, only four years of data were available. If the

38
reclamation work completed during those four years was on areas of land that are simpler to reclaim, the
costs would reflect that.
The method of using total ARO and cumulative land disturbed represents an estimate from a “bigger
picture” perspective. The complexity of the work completed in the years considered is less significant
because the total disturbances are being analyzed rather than just the work completed in the relevant
years.
It should also be noted that a single point estimate for reclamation costs is unlikely to be accurate. As
suggested, the cost of reclamation is highly dependent on the specific area of land being reclaimed.
Different areas have different reclamation challenges associated with them that can drastically increase or
decrease the necessary costs. The reclamation cost estimates calculated are also in line with the range of
actual reported reclamation costs from Syncrude such as the $115,705/ha spent reclaiming an upland site
and the targeted $939,847/ha for a wetland reclamation project (Brooymans, 2008a; Canadian Oil Sands,
2009).

39
Chapter 4
Proposal for a Reclamation Costing Framework
4.1 Framework Description
A framework is essentially a planning tool. Effective frameworks give structure to an otherwise
nebulous process. When designed well, a framework should allow its user to develop a clear and logical
process for completing the task at hand. For an oil sands reclamation framework, this means determining
the overall goal of reclamation and then identifying the steps necessary to move the oil sands from their
current state to the end state. Because of the large scale of the oil sands, attempting to apply a single
framework to the entire project would be overly complicated and confusing. Therefore, the ideal
framework for the oil sands involves breaking the reclamation into smaller tasks and applying a smaller
framework iteratively to each area.
4.1.1 Overview
The proposed framework is shown in Table 12. This table illustrates the layout of the framework
as well as a summary of the information to be included in each cell.

40
Table 12: Proposed framework
Site Characteristics
x What are the details about the site?
x Size? (Area, perimeter, volume, etc.)
x Topography? Slopes?
x Contamination concerns?
Overview Key Performance Indicators Assumptions
Reclamation Objective
x Overall Aim
x What do we intend to do?
x What will be achieved?
x When?
x How will the achievements be
measured?
x How can progress be measured against
the goals set?
x Where will the information that informs
these indicators originate?
x What would be the final result of
achieving the reclamation objective?
x What would completing this
framework lead to?
Closure Measures
x What actions are proposed to achieve
reclamation objective?
x Same as above x External conditions needed to get
results
x What could go wrong? What might
not work out? Phrase in the positive.
Activities
x What activities are necessary for each
proposed closure measure?
x On what scale or in what quantity?
x What are we missing and what might we
need?
x Same as above x Same as above

41
Inputs
x What resources are needed to carry out the
activities?
x Consider labour, materials, equipment
x Include a unit cost estimate for each input
[Intentionally blank] [Intentionally blank]

42
There is a large amount of information required to inform the reclamation costing procedure.
Before the framework can be implemented, a “target site” must be chosen. In this framework, a target site
refers to a relatively small and definable area that is reasonably constant in its characteristics. If the target
site chosen were too complex, the resulting framework would become unwieldy thereby negatively
affecting the accuracy of the final cost estimate. To estimate an entire mine site or project, the framework
would need to be applied iteratively with the target site changing each time until the entire mine site had
been estimated.
4.1.2 Framework Rows
Once a single target site has been identified, the framework can be filled in. For the purposes of
simplification and ease of use, the information required for the framework has been divided into five key
components:
1. Site Characteristics
2. Reclamation Objective
3. Closure Measures
4. Activities
5. Inputs
These five components form the rows of the framework. They are designed so that the estimator can
follow a logical procedure that leads to a cost estimate for the target site.
The first row describes the site characteristics. The relevant characteristics depend on the
individual target site but may include descriptions of its size, land types, the mining activities done on the
site, contamination concerns, unusual challenges, proximity to water sources, etc.
The second row describes the reclamation objective. In Alberta, the general reclamation objective
for an oil sands site is to achieve an equivalent land capability compared to the pre-mining land. When
completing this row, the goal of achieving an equivalent land capability should serve as a basis for the
proposed reclamation objectives. The reclamation objective should describe how the target site will look

43
and function once reclamation is completed. This may include details on vegetation, wildlife,
groundwater movements, intended use, etc. Ideally, the reclamation objective also includes proposed
timelines to completion.
The third row describes the closure measures required to achieve the reclamation objective laid
out in the row above. This row should be a general overview of what is required to bring the site
described in the Site Characteristics row to the state described in the Reclamation Objectives row.
Specific details should not be included here.
The fourth row describes the activities associated with each of the closure measures laid out in the
preceding row. Each closure measure should be broken down into small, manageable tasks from start to
finish. This row should be as specific as possible and include details on quantities of land, volume of
fluid, distances that must be travelled, etc. If necessary, any missing information can also be identified in
this row.
The fifth and final row describes the inputs associated with the fourth row’s activities. This row
should also be as detailed as possible. The estimator must consider necessary labor, materials, and
equipment as well as the quantities of each. If the closure measures were broken down into sufficiently
small and manageable tasks, the estimator should be able to easily identify the inputs required. This row
should also detail associated unit costs for each identified input. Once all the rows have been completed,
it will be possible to calculate a cost estimate for the reclamation of the target site.
4.1.3 Framework Columns
Although completing the five rows of the framework would be sufficient to arrive at a cost
estimate, an effective closure plan should include key performance indicators (KPIs) and measureable
achievements. The proposed framework includes additional columns to allow for these considerations.
The first column, labeled “Overview,” is where the information discussed in Section 4.1.2 is entered.
The second column, labeled “Key Performance Indicators,” allows for goal setting and tracking
of measurable achievements. With the exception of Inputs, each row should have identified methods of
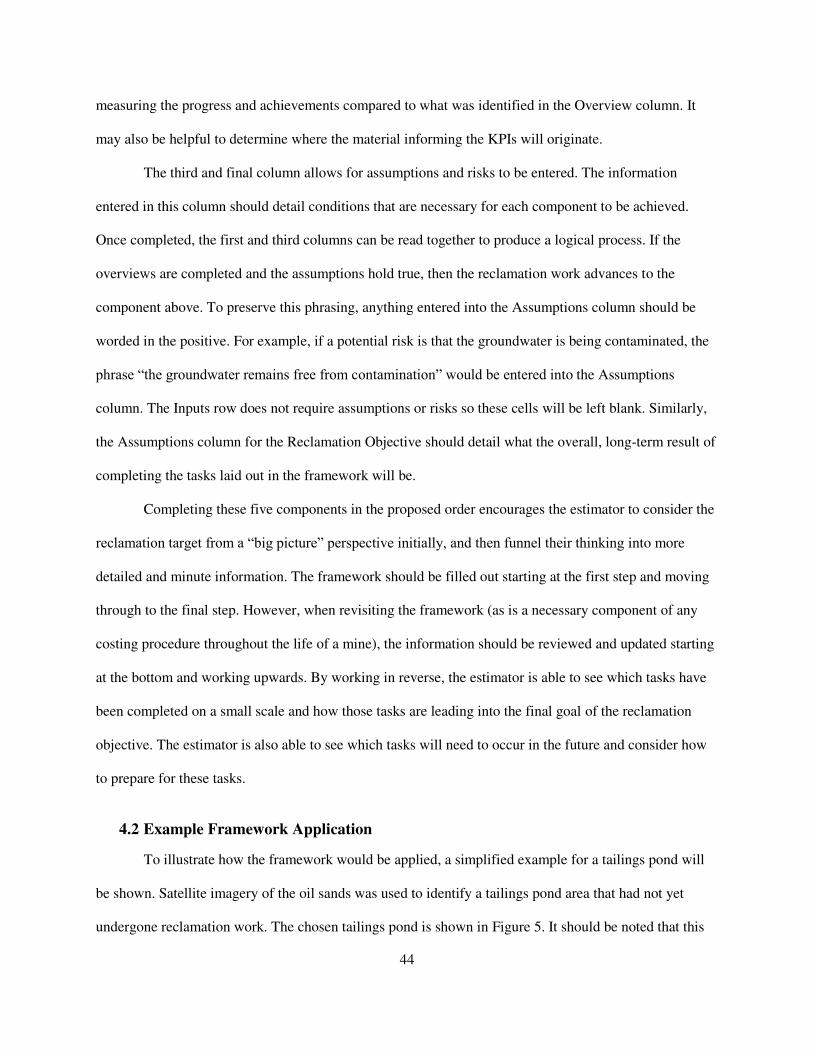
44
measuring the progress and achievements compared to what was identified in the Overview column. It
may also be helpful to determine where the material informing the KPIs will originate.
The third and final column allows for assumptions and risks to be entered. The information
entered in this column should detail conditions that are necessary for each component to be achieved.
Once completed, the first and third columns can be read together to produce a logical process. If the
overviews are completed and the assumptions hold true, then the reclamation work advances to the
component above. To preserve this phrasing, anything entered into the Assumptions column should be
worded in the positive. For example, if a potential risk is that the groundwater is being contaminated, the
phrase “the groundwater remains free from contamination” would be entered into the Assumptions
column. The Inputs row does not require assumptions or risks so these cells will be left blank. Similarly,
the Assumptions column for the Reclamation Objective should detail what the overall, long-term result of
completing the tasks laid out in the framework will be.
Completing these five components in the proposed order encourages the estimator to consider the
reclamation target from a “big picture” perspective initially, and then funnel their thinking into more
detailed and minute information. The framework should be filled out starting at the first step and moving
through to the final step. However, when revisiting the framework (as is a necessary component of any
costing procedure throughout the life of a mine), the information should be reviewed and updated starting
at the bottom and working upwards. By working in reverse, the estimator is able to see which tasks have
been completed on a small scale and how those tasks are leading into the final goal of the reclamation
objective. The estimator is also able to see which tasks will need to occur in the future and consider how
to prepare for these tasks.
4.2 Example Framework Application
To illustrate how the framework would be applied, a simplified example for a tailings pond will
be shown. Satellite imagery of the oil sands was used to identify a tailings pond area that had not yet
undergone reclamation work. The chosen tailings pond is shown in Figure 5. It should be noted that this

45
example is intended to show how the framework might be applied to a target area. It will not be possible
to determine a final reclamation estimate because many unit costs associated with the inputs are unknown,
particularly regarding the Consolidated Fine Tails Program. This example is a simplified application for
illustrative purposes. When applying the framework for costing purposes, it is likely that there will be
more steps and details for each cell.
The process for filling out the framework is discussed in Section 4.2.1. At the end of the section,
Table 9 shows the example framework that results from the process.
Figure 5: Tailings pond at Syncrude's Mildred Lake site used in framework example (NASA, 2016)

46
4.2.1 Site Characteristics
Although some data regarding tailings pond areas and volumes exists, it is not specific to
individual ponds. Therefore, first principles were used to estimate the area of the target site. The
perimeter of both the total tailings pond and the fluid area of the tailings pond were outlined as shown in
Figure 6. The resulting polygons were then used to calculate the areas. The slope area was calculated
from the two resulting areas values. Because it is not possible to determine the depth from the satellite
imagery, the volume of fluids and the slopes of the embankments could not be estimated.
Figure 6: Perimeter outlines of target area
4.2.2 Reclamation Objective
The reclamation objective was determined using the Alberta Government’s definition as a basis.
Pre-mining conditions for the specific site are not publicly available, but in general, an appropriate
reclamation objective is to achieve a self-sustaining ecosystem. This must include both flora and fauna
native to the Athabasca region.
The KPIs for this component must demonstrate that the reclamation work has resulted in a self-
sustaining ecosystem. Therefore, appropriate indicators would be the return of wildlife to the area. If
wildlife were to return to the area, it can be assumed that the area has been successfully converted into a

47
suitable natural habitat and that there is no need for further operator intervention, suggesting that it is self-
sustaining. Both of these indicators would best be determined through long-term monitoring programs.
If the goals set out in the framework were achieved, the site would be given reclamation
certification after a period of time, satisfying stakeholders.
4.2.3 Closure Measures
There are three distinct closure measures that must be completed in order to achieve the described
reclamation objective.
Firstly, a trafficable surface must be achieved. Without a trafficable surface, the subsequent
closure measures could not be completed because it would be impossible for the target area to support the
personnel or equipment necessary to undertake such measures. Although Directive 074 has been
discontinued, the guidelines set out in it are assumed to be valid. Therefore, an appropriate KPI for a
trafficable surface is that the surface exhibits a shear strength of at least 10 kPa, as outlined in Directive
074.
Next, the land must be formed in a way that appears natural. In the long term, the land should
reasonably blend into the surrounding area and have no evidence of mining activity. There is no
quantifiable KPI for land appearing natural. Instead, visual observation will determine if the landforming
is successful.
Lastly, revegetation of the area must occur. This should include strictly native grasses, plants, and
trees. The revegetation will be seen as successful once the flora is able to thrive on its own without
operator intervention. Therefore, the KPI for this measure is visually observing that the plants are not only
established, but also proliferating naturally without intervention. Achieving this KPI would indicate that
the reclamation activity has created an area that is capable of sustaining native plant species.
The assumptions for this row are simply that the vegetation process is successful and appropriate
for the region. If this holds true, the local wildlife is likely to return to the area, making it possible to

48
achieve the reclamation objective. It is not necessary to include assumptions for the first two closure
measures listed in this case because they all lead to the same outcome.
4.2.4 Activities
The measures described previously must now be broken down into more manageable tasks or
activities. Each measure should have distinct activities associated with achieving it. In this example, the
activities associated with achieving a trafficable surface are not listed. Oil sands operators have not
provided enough detail on the Consolidated Fine Tails Program used to strengthen the tailings. In
addition, much of the process would have been applied during processing, prior to the consolidated tails
being deposited into the tailings pond. If this framework were applied to a pond that had not been
constructed or filled, the details of processing would need to be included.
For grading and contouring, the first activity is to move the soil from the source area. In this
section, numerical estimates are given for each activity. For example, the volume of the soil is roughly
estimated at 16,300,000 m3 based on a 0.75 m soil depth. The distance to the source of the soil is chosen
to be 12,000 m based on the size of the mine site from satellite imagery. Once the soil has been moved to
the target site, the next activity of spreading it in naturalistic formations over the area of the site can be
completed. This should be done using suitably small dozers to ensure that the shear strength of the
consolidated tails is not exceeded. Grading is the final step that prepares the spread soil for vegetation.
Like dozing, it should be done using small graders to ensure that the shear strength of the surface is not
exceeded.
Lastly, the activities needed to achieve revegetation are listed. First, approximately 430 t of
fertilizer should be spread over the area to ensure adequate nutrients are available. Next, 85 t of seed
should be applied over the fertilized area using a mechanical seeder. Lastly, tree seedlings and shrubs
should be planted in a natural formation by laborers. A total of 2,169,000 seedlings allows for a plant
density of 1000 trees/shrubs per hectare.

49
Including numerical details ensures that the estimator will have a good foundation on which to
base cost estimates for each item. The more accurate the numerical estimates in the activities section, the
more accurate the final cost estimate will be. Many of the value estimates in this example were
determined by adapting Brodie’s estimates for a waste rock pile (Brodie, 2013a).
In order for this framework to be considered successful, a number of assumptions must hold true.
The Consolidated Fine Tails Program must successfully achieve a trafficable surface that is reliably
consistent over the entire target site. If any portion of the consolidated tails fails to meet the necessary
shear strength, the entire row will have failed. The vegetation must be able to grow successfully. For this
to happen, the soil and fertilizer combination placed on the target site must be able to provide adequate
nutrition to support the vegetation. In addition, the vegetation must receive an adequate amount of water
to support growth. Ideally, the water may originate from rainfall, although it is likely that some manual
watering will be necessary.
4.2.5 Inputs
The last section only includes the overview column. KPIs and assumptions are not relevant
because inputs are simply a breakdown of all the labour, materials, and equipment that are required for
the above rows. Like activities, inputs should be filled out in relation to each individual measure. The unit
cost information included in the example framework was sourced mainly from sections of InfoMine
USA’s Reclamation Cost Service handbook (“Equipment,” 2014, “Labor,” 2014, “Supplies and
Miscellaneous Items,” 2014).
The requirements for achieving a trafficable surface depend on the specifics of the Consolidated
Fine Tails Program, although some known inputs are gypsum, operators, and a consolidated tails plant.
The Mildred Lake site already has an operating consolidated tails plant onsite, so the costs associated with
the plant can be ignored. The amounts of gypsum used must be determined. In addition, the salary or
wage of any operators involved in the CT plant must be considered.

50
For grading and contouring, the inputs are: soil, backhoes and haul trucks to transport the soil,
dozers to spread the soil over the target area, graders to do fine work on the soil preparation, and
operators for the haul trucks, dozers, and graders. The cost of the soil is simply the price of soil multiplied
by the amount required. To estimate the cost of the haul trucks and dozers, further information is required.
It can be assumed that oil sands operators already have access to backhoes, haul trucks, and dozers from
their operations. Details on the distances to be travelled, the fleet sizes for each piece of equipment, and
the cycle times are needed. There is not enough information publicly available to make these estimates.
The number of operators required for the fleet size must also be estimated. Lastly, the amount of fuel
needed to operate the necessary equipment over the reclamation project period should be incorporated.
The activities for revegetation require fertilizer, seeds, and saplings, spreaders to apply the
fertilizer, mechanical seeders to apply the seeds, laborers to manually plant the trees and shrubs, and
operators for the equipment. The fuel necessary to run the equipment should also be accounted for. The
costs associated with seeds and saplings are estimated over a large range because they are dependent on
the variety of grasses, wildflowers, bushes, and trees chosen. Costs for a seed spreader were not available.
When estimating the costs for laborers, their efficiency should be considered.
At this point, the entire framework has been filled in for the example target site. The completed
framework is shown in Table 13. If the missing information and details, particularly relating to the
Consolidated Fine Tails Program, were found and filled in, an estimator would then be able to synthesize
all the information in the framework to arrive at a cost estimate for reclaiming the target site. The
example shown has been simplified for the purposes of demonstration. If applying the framework for
estimating purposes, it is likely that more closure measures would be identified, resulting in the inclusion
of more activities and inputs.

51
Table 13: Framework applied to sample tailings pond
Site Characteristics
x Tailings pond at Syncrude’s Mildred Lake Mine
x 2169 Ha total
x 1503 Ha of fluids
x 666 Ha of slope (bird’s eye view)
x Volume unknown
x Slopes unknown
Overview Key Performance Indicators Assumptions
Reclamation objective
x Return tailings pond area to state similarly
useful to pre-mining land
x Establish self-sustaining ecosystem with
appropriate vegetation and wildlife
x Native wildlife returns to area
x No need for further operator
interference
x Determined through long term
monitoring programs
x Stakeholders are satisfied with the
results of reclamation
x Reclamation certification is achieved
Closure Measures
x Establish trafficable surface on fluids
x Grade and contour land to achieve natural
appearance
x Revegetate with native plant species
x Surface exhibits shear strength of at
least 10 kPa
x Evidence of mining operation is no
longer present
x Plants are established and proliferate
naturally
x Determined through shear strength
testing and visual observation
x Revegetation is successful and
appropriate for the region

52
Activities
Trafficable Surface:
x Achieved through Consolidated Fine Tails
Program
Grade and contour:
x Transport 16,300,000 m3 soil to land area
from source over distance of 12,000 m
using haul trucks
x Spread soil in natural formations using
small dozers
x Further prepare the soil using a grader
Revegetate:
x Apply 430 t of fertilizer over land area
using spreader
x Spread 85 t of seeds over fertilized area
x Plant 2,169,000 trees and bushes as
necessary
x Area supports movement of people and
equipment
x Area is suitably covered in both soils
and vegetation
x Determined through testing and visual
observation
x Consolidated Fine Tails Program
successfully achieves trafficable
surface
x Consolidated tails are reliably and
uniformly trafficable
x Soil and fertilizer are able to support
the growth of the seeds, trees, and
saplings
x Vegetation receives adequate water
either from rainfall or by manual
watering
Inputs
Trafficable Surface:
x Operator
x Gypsum – US $155 – 228 per short ton
x CT Plant – Assumed available
Grade and contour:
x Backhoe Operator - $37.52 per hour
[Intentionally blank] [Intentionally blank]

53
x Haul Truck Operator - $33.86 per hour
x Dozer Operator - $33.86 per hour
x Grader Operator - $33.86 per hour
x Soil – US $5.97 - $8.95 per m3
x Backhoe – Assumed available
x Haul Truck – Assumed available
x Dozer – Assumed available
x Grader - $7270/month lease
x Fuel – C $1.296 per liter
Revegetate:
x Operator - $35.03 per hour
x Laborers - $29.73 per hour
x Fertilizer – US $17.20 – $52.25 per 50 lb
x Seeds US $4.00 - $75.00 per lb
x Saplings US $20 – 90.00 per lb
x Spreader – Unavailable
x Attachable Seeder – US $625 - $2680
x Tractor – US $75,000 - $32,100 per month
x Fuel – $1.296 per liter

54
4.3 Scaling to an Operational Level
The example shown only demonstrates a simplified application of the framework to a single
target site. In order to fully estimate the cost of an oil sands operation, the framework would need to be
applied repeatedly to every single aspect of that operation. Each tailings pond would need to be
individually assessed in the same manner as the example shown, adjusting for the target site’s specific
characteristics, reclamation requirements, and the appropriate closure method for the site. The entirety
of the oil sands operation is shown in Figure 7.
Figure 7: Satellite image of all Athabasca oil sands operations currently active

55
In this image, the tailings pond used in the preceding example is visible slightly to the lower
left of center. Clearly, the single framework example is just a small, simplified portion of the work that
will be necessary to fully reclaim the oil sands. Other aspects of the operation that may need to be
considered in a similar manner include waste piles, building demolition, pavement demolition, mined-
out pits, etc. It is also important to ensure that the target areas of the framework do not overlap.
Overlapping target areas could result in duplicated reclamation activities, thereby artificially inflating
the reclamation cost estimate.

56
Chapter 5
Conclusions and Recommendations
5.1 Summary
This thesis proposes a framework for determining the costs associated with reclamation in the
Athabasca oil sands. The implementation of a framework provides more structure and logic to the
costing process, which in turn creates a simple, consistent, and clear picture of the work and costs
required for reclamation. Having this clear picture will allow oil sands operators, the Alberta
government, and other stakeholders to better prepare for the eventual financial demands of reclamation
work.
The data informing the creation of the framework was sourced from publicly available
information published by oil sands operators, the Alberta government, and third party regulators.
Documents such as annual reports, environmental and sustainability reports, and news releases were
the focus of the research. Syncrude, Suncor, Canadian Oil Sands, and CNRL were the companies
targeted for information. Using the available information, an overview of the reclamation work
completed by the targeted companies was established. This overview offered a clear image of the
reclamation progress over time and the rate at which the oil sands are being reclaimed. Additionally,
first principles were used to establish a basic estimate of the costs associated with reclamation in the
oil sands on both a “per barrel” and “per hectare” basis. The data found provided the foundation on
which the proposed framework was based.
The framework proposed uses a structured format to guide the estimator from a high-level or
“big picture” perspective down to minute details associated with each reclamation activity. The
estimator must first identify the target site and its characteristics. Once the target site has been defined

57
and described in adequate detail, the estimator may begin identifying the reclamation objective, then
follow the structure of the framework through to determine the required closure measures, the
activities associated with these measures, and the inputs required. In addition, the estimator must
identify key performance indicators and assumptions for each section, thereby offering a quantifiable
method of tracking progress. An application of the framework to a tailings pond was provided as an
example of its use and purpose. The process of the proposed framework is compared to the established
processes of the USDA Forest Service Bond Guide and John Brodie in Table 14.

58
Table 14: Comparison of the proposed framework to established costing methods
John Brodie USDA Forest Service Bond
Guide Proposed Framework
0. Not addressed by author
0. Determine the period of operation covered by the bond
0. Not addressed
1.
Define closure objectives on a site-wide and individual mine component basis
1. Determine what is being reclaimed
1. Establish and define target site
2.
Characterize expected site condition at the time reclamation commences
2. Identify the standards to be met
2. Determine and describe reclamation objectives
3a. Describe expected closure measures
3. Characterize the reclamation tasks necessary
3a. Identify required closure measures
3b. Determine quantities of work for each expected activity
3b. Divide required closure measures into manageable activities
3c. Divide each activity into specific tasks
3c. Identify required resources for each activity
3d. Characterize the level of effort or difficulty in completing the tasks
4. Identify appropriate unit costs for each task
4a. Estimate direct reclamation costs
4. Source typical unit costs for each resource
4b. Estimate indirect reclamation costs
5.
Present task list, quantities, unit costs, and calculation of total cost
5. Summarize and review the estimate
5. Synthesize information into a final cost estimate
6. Not addressed by author
6. Administer the bond 6.
Review and adjust framework throughout mine life 7.
Not addressed by author
7. Bond collection
In summary, this thesis has provided an overview of the reclamation progress and rate in the
Athabasca oil sands, examined the preparedness of oil sands operators for the eventual reclamation
requirements, and proposed a framework as a possible approach to reclamation costing in the oil sands.

59
5.2 Conclusions
The oil sands are a significant contributor to the Alberta economy. However, despite
improving efforts from the Alberta Government and oil sands operators, the rate of land disturbance as
a result of oil sands operation continues to exceed the rate of reclamation. The Alberta Government
and regulatory agencies in Alberta have established a number of requirements and guidelines over the
years in an attempt to improve reclamation efforts to varying degrees of success. Some efforts have
introduced unnecessary targets within unreasonable timelines, forcing operators to advance potential
technologies before the technologies were ready. Additionally, oil sands operators have struggled to
meet the targets established by regulatory agencies in the past and taken advantage of the ability to
exempt themselves from the established regulations.
The high variation in reported data has added an additional layer of complexity when
attempting to review and analyze reclamation progress. Throughout the years, oil sands operators have
been required to report differing pieces of data, making it difficult to compare different time periods.
Most significantly in regards to this thesis, the change in land status definition in 2009 meant that data
prior to this change was unusable. The change was overall a positive move because it reduced
inconsistencies in the reported reclamation progress that were created as a result of the lack of
regulated land status definitions. However, going forward, it is necessary to maintain stable definitions
and reporting requirements so that historical data can be used and compared consistently over time.
5.3 Recommendations and Further Work
In order to accurately characterize the state of reclamation work and progress in the oil sands,
the work in this thesis must be expanded upon. Costing principles should be applied to all oil sands
operations to establish a concrete reclamation cost estimate for each site. This thesis analyzed a small
number of the operations within the oil sands. Similar work must be completed for all operations. In

60
addition, this thesis focused solely on open pit style mining within the oil sands. Some oil sands
operators also utilize in-situ extraction methods. These sites have unique reclamation challenges and
requirements that should be assessed in a similar manner. A complete understanding of the reclamation
progress made and the additional work needed can only be achieved when all oil sands operations,
both open pit and in-situ, are taken into account.
The ability to review past work and compare progress over time is necessary to track
improvement and ensure further progress. To this end, the current reporting requirements must be
assessed and improved. A stable, long-term standard of data reporting would reduce inconsistencies
within data and also allow for a more accurate analysis of progress. Similarly, regulations should be
implemented to ensure transparency in the data that is reported. Allowing for excessive loopholes and
exemptions, as shown by Directive 074, results in misleading data. It may be possible to determine
which data is important for reporting by completing cost estimates similar to the framework presented
and working backward to fill in missing information. Completing the framework for each site would
reveal any missing data, as shown in the example framework application in Chapter 4. Once key data
has been identified, it would be possible to begin building a long-term base of reclamation work and
progress for further analysis.
Despite the failure to supplement financial information, the information provided from the
research discussed in Chapter 3 regarding red clay proved useful. Best practices in the bauxite industry
suggest a number of potential areas for improvement in the Bayer Process (International Aluminium
Institute, 2010). Although the Bayer Process is not relevant to oil sands tailings, some of the areas of
improvement may be applicable for further research. Possible areas put forth include liquor
productivity, process control, silo design, unit operations from elsewhere, and particle behavior. Oil
sands operators already work to reduce the amount of water that is stored in tailings ponds and water

61
recycling is a distinct portion of the current sustainability efforts put forth by the oil sands industry.
Improving process control in any industry will reduce the amount of work required post-processing. A
better, more refined process will have less potential for waste generation. Silo design in the Bayer
Process refers to the tanks used in the processing itself and there may be room for improvement in oil
sands processing, although the design of tailings ponds is also a potential area for improvement. The
oil sands industry may benefit from researching other industries and the methods used for reclamation
within those industries. In particular, the bauxite industry may be a potential source of information and
research. Collaboration between the bauxite industry and the oil sands industry could prove mutually
beneficial.
Lastly, oil sands operators, the AER, and the Alberta Government must work together to
establish public policies that ensure oil sands operations remain sustainable in the long term. These
public policies must be reasonably achievable considering the limitations of current technology.
Although previous regulations were created with good intentions, they may have done more harm than
good by forcing operators to implement technologies that had not been fully tested and establishing
unrealistic targets. Regulations and public policies should be carefully constructed to ensure their
impact is positive while limiting the potential negative impacts that can result from forcing operators to
adhere to unreasonable timelines or targets.

62
References
Alberta Canada. (2013, September). Oil Sands The Resource. Retrieved June 24, 2015, from
http://oilsands.alberta.ca/FactSheets/Resource_FSht_Sep_2013_Online.pdf
Alberta Energy Regulator. (2015, October 31). Annual mine financial security program submissions.
Alberta Energy Regulator. Retrieved from
http://www.aer.ca/documents/liability/AnnualMFSPSubmissions.pdf
Alberta Energy Regulator. (2017, February). Guide to the Mine Financial Security Program. Alberta
Energy Regulator. Retrieved from https://www.aer.ca/documents/liability/MFSP_Guide.pdf
Alberta Government. (2009). Facts about Alberta’s oil sands and its industry (Fact sheet). Fort
McMurray, Alberta: Oil Sands Discovery Centre. Retrieved from
http://history.alberta.ca/oilsands/resources/docs/facts_sheets09.pdf
Alberta Government. (2013, September). Oil Sands: Reclamation. Retrieved April 18, 2015, from
http://www.oilsands.alberta.ca/FactSheets/Reclamation_FSht_Sep_2013_Online.pdf
Alberta Government. (2014, January). Alberta’s Oil Sands: The Facts. Retrieved June 24, 2015, from
http://www.energy.alberta.ca/OilSands/pdfs/AlbertasOilSandsFactsJan14.pdf
Alberta Government. (2015, March). Lower Athatbasca region tailings management framework for the
mineable Athabasca Oil Sands. Retrieved from http://esrd.alberta.ca/focus/cumulative-
effects/cumulative-effects-management/management-frameworks/documents/LARP-
TailingsMgtAthabascaOilsands-Mar2015.pdf
Auty, R. M., & Frech Mikesell, R. (1998). Sustainable Development in Mineral Economies. Clarendon
Press.
Bailey, K. (2015, March 13). Bulletin 2015-11. Alberta Energy Regulator. Retrieved from
http://www.aer.ca/documents/bulletins/Bulletin-2015-11.pdf

63
Brodie, J. (2013a). Considerations in mine reclamation costing (pp. 1 – 17). Presented at the British
Columbia Mine Reclamation Symposium. Retrieved from
https://circle.ubc.ca/bitstream/handle/2429/45285/Brodie_John_BC_Mine_2013.pdf?sequence
=1
Brodie, J. (2013b). Issues and methods in mine reclamation costing.
Brooymans, H. (2008, March 20). Reclaimed oilsands site receives provinical blessing. Edmonton
Journal. Edmonton, Alberta, Canada. Retrieved from
http://www.canada.com/edmontonjournal/story.html?id=7c4804d6-4ad7-4b9c-8327-
a51d4b8c9f5a&k=60261
Canadian Energy Research Institute. (2014). Canadian economic impacts of new and existing oil sands
development in Alberta (2014-2038) (Briefing paper) (pp. 1–10). Calgary, Alberta: Canadian
Energy Research Institute. Retrieved from
http://www.ceri.ca/images/stories/CDN_Economic_Impacts_of_New_and_Existing_Oil_Sand
s_Development_in_Alberta_-_November_2014_-_Final.pdf
Canadian Natural. (2011). 2011 Annual Report. Retrieved from
http://www.cnrl.com/upload/media_element/496/01/w_cnq-2011-ar.pdf
Canadian Natural. (2012). 2012 Annual Report. Retrieved from
http://www.cnrl.com/upload/media_element/599/01/cnq_2012_ar.pdf
Canadian Natural. (2013). 2013 Annual Report. Retrieved from
http://www.cnrl.com/upload/media_element/776/02/cnq_2013_ar.pdf
Canadian Natural. (2014). 2014 Annual Report. Retrieved from
http://www.cnrl.com/upload/media_element/910/01/cnq-2014-annual-report.pdf

64
Canadian Natural. (2015). 2015 Annual Report. Retrieved from
http://www.cnrl.com/upload/media_element/1005/01/cnq-2015-annual-report.pdf
Canadian Oil Sands. (2009). 2009 Annual Report. Retrieved from http://www.suncor.com/investor-
centre/financial-reports/archived-annual-reports
Canadian Oil Sands. (2010). 2010 Annual Report. Retrieved from http://www.suncor.com/investor-
centre/financial-reports/archived-annual-reports
Canadian Oil Sands. (2011). 2011 Annual Report. Retrieved from http://www.suncor.com/investor-
centre/financial-reports/archived-annual-reports
Canadian Oil Sands. (2012). 2012 Annual Report. Retrieved from http://www.suncor.com/investor-
centre/financial-reports/archived-annual-reports
Canadian Oil Sands. (2013). 2013 Annual Report. Retrieved from http://www.suncor.com/investor-
centre/financial-reports/archived-annual-reports
Canadian Oil Sands. (2014). 2014 Annual Report. Retrieved from http://www.suncor.com/investor-
centre/financial-reports/archived-annual-reports
Devenny, D. W. (2010). Part B Report: A screening study of oil sands tailings technologies and
practices (No. AERI Contract 2008 0326) (pp. 1 – 66). Alberta Energy Research Institute.
Equipment. (2014). In Reclamation Cost Services (pp. EQ1 – EQ25). Infomine USA.
Flanagan, E. (2015, March 16). Tailings management framework: a new chapter in Alberta’s oilsands
story? Retrieved from http://www.pembina.org/blog/tailings-management-framework-a-new-
chapter-in-albertas-oilsands-story
Gingras, M., & Rokosh, D. (2004). A brief overview of the geology of heavy oil, bitumen and oil sand
deposits (pp. 1–3). Presented at the 2004 CSEG National Convention, Canadian Society of
Exploration Geologists. Retrieved from

65
http://cseg.ca/assets/files/resources/abstracts/2004/122S0227-
Gingras_M_heavy_oil_bitumen_oil_sands.pdf
Government of Alberta. (2008, March 19). Alberta issues first-ever oil sands land reclamation
certificate. Government of Alberta. Retrieved from
http://alberta.ca/release.cfm?xID=23196C8880E90-A0E1-9CE0-1B3799BC38A51E3E
Grant, J. (2012, August 27). “Responsible resource development” must be more than a slogan. Hill
Times. Retrieved from http://www.pembina.org/op-ed/2369
Grant, J., & Flanagan, E. (2013, August 19). Losing ground: Why the problem of oilsands tailings
waste keeps growing. Pembina Institute. Retrieved from http://www.pembina.org/pub/2470
Hein, F. J. (2000). Historical overview of the Fort McMurray Area and oil sands industry in Northeast
Alberta (Earth Sciences Report No. 2000-05) (pp. 1 – 32). Alberta: Alberta Energy and
Utilities Board. Retrieved from
http://www.ags.gov.ab.ca/publications/ESR/PDF/ESR_2000_05.pdf
International Aluminium Institute. (2010). Alumina Technology Roadmap. Retrieved from
http://bauxite.world-aluminium.org/fileadmin/_migrated/content_uploads/fl0000422_02.pdf
Labor. (2014). In Reclamation Cost Services (pp. LA73 – LA76). Infomine USA.
Lane, D. P., & Berdusco, R. J. (1988). Planning for the cost of final reclamation (pp. 103 – 112).
Presented at the British Columbia Mine Reclamation Symposium 1988, Vernon, B.C.
Retrieved from https://circle.ubc.ca/bitstream/handle/2429/12875/1988%20-
%20Lane%2c%20Berdusco%20-
%20Planning%20for%20the%20Cost%20of%20Final.pdf?sequence=1

66
Lemphers, N., Dyer, S., & Grant, J. (2010). Toxic liability: how Albertans could end up paying for
oilsands mine reclamation (pp. 1–58). The Pembina Institute. Retrieved from
http://www.pembina.org/pub/2075
Lemphers, N., & Logan, A. (2011). Full disclosure: Environmental liabilities in Canada’s oilsands
(pp. 1–5). The Pembina Institute. Retrieved from https://www.pembina.org/pub/2224
Marks, M. B., Buchta, T., Newman, C., Lentz, R., Gabardi, J., Werner, P., Doran, M. (2004, April).
Training guide for reclamation bond estimation and administration. United States Department
of Agriculture - Forest Service. Retrieved from
http://www.fs.fed.us/geology/bond_guide_042004.pdf
Martin, T. E., & Boxill, E. (2008). Reclamation and closure cost planning and estimation and the
mining life cycle (pp. 291–302). Presented at the Tailings and Mine Waste ’08.
https://doi.org/10.1201/9780203882306.ch27
McKay, S., Funk, W., Rimbey, S., & Butler, H. (2006). Computer simulation model for determining
reclamation liability costs of the Ekati Diamond Mine(TM) in the Northwest Territories,
Canada. Journal of Cleaner Production, 14(12-13), 1096–1100.
Mikula, R. (2012). Advances in oil sands tailings handling: building the base for reclamation. In D.
Vitt & J. Bhatti (Eds.), Restoration and reclamation of boreal ecosystems (pp. 103 – 122).
Cambridge University Press.
Ministry of Energy and Mines. (2015, January). Mine reclamation costing and spreadsheet.
Government of British Columbia. Retrieved from http://www2.gov.bc.ca/assets/gov/farming-
natural-resources-and-industry/mineral-exploration-mining/documents/reclamation-and-
closure/reclamationcostingmanualjan2015.pdf

67
Misiolek, W. S., & Noser, T. C. (1982). Coal surface mine land reclamation costs. Land Economics,
58(1), 67–85. https://doi.org/10.2307/3146077
Moran, R. (n.d.). Mining environmental impacts - integrating an economic perspective, 1–12.
NASA. (2016). Earth Observatory. Retrieved from
https://earthobservatory.nasa.gov/Features/WorldOfChange/athabasca.php
Oil Sands Information Portal. (2010, October 29). Historical Oil Sands Mine Land Disturbance and
Reclamation Tracking, 1987 - 2008. Alberta Environment and Parks. Retrieved from
http://osip.alberta.ca/library/Dataset/Details/24
Oil Sands Information Portal. (2015a, March 4). Tailings Pond Volume Over Time. Alberta
Environment and Parks. Retrieved from http://osip.alberta.ca/library/Dataset/Details/545
Oil Sands Information Portal. (2015b, March 4). Total area of the oil sands tailings ponds over time.
Alberta Environment and Parks. Retrieved from
http://osip.alberta.ca/library/Dataset/Details/542
Oil Sands Information Portal. (2015c, May 19). Oil Sands Mine Reclamation and Disturbance
Tracking by Year. Alberta Environment and Parks. Retrieved from
http://osip.alberta.ca/library/Dataset/Details/27
Oil Sands Review. (2015, July 15). Canadian oilsands navigator: bitumen production. JuneWarren-
Nickle’s Energy Group. Retrieved from http://navigator.oilsandsreview.com/charts#production
Province of Alberta. (1993, September 1). Alberta Regulation 115/93 Conservation and Reclamation
Regulation. Alberta Queen’s Printer. Retrieved from
http://www.qp.alberta.ca/documents/Regs/1993_115.pdf

68
Saher, M. N. (2015). Report of the Auditor General of Alberta (pp. 1 – 112). Edmonton, Alberta,
Canada: Office of the Auditor General of Alberta. Retrieved from
http://www.oag.ab.ca/webfiles/reports/OAG%20Report%20July%202015.pdf
Sengupta, M. (1993). Environmental impact of mining monitoring, restoration and control. Mining and
Environment, 1–33.
Snyder, J. (2015, July 28). A fine mess: The AER’s Directive 074. Alberta Oil. Retrieved from
http://www.albertaoilmagazine.com/2015/07/alberta-energy-regulator-directive-074/
Spitz, K., & Trudinger, J. (2009). Mining and the Environment: From Ore to Metal. Leiden, The
Netherlands: CRC Press/Balkema.
Steward, G. (2015, August 28). Alberta’s oilsands trade-off. The Torono Star. Toronto, ON. Retrieved
from http://www.thestar.com/news/atkinsonseries/2015/08/28/albertas-oilsands-trade-off.html
Suncor Energy Inc. (2010). 2010 Annual Report. Retrieved from http://www.suncor.com/investor-
centre/financial-reports/archived-annual-reports
Suncor Energy Inc. (2011). 2011 Summary Report on Sustainability. Retrieved from
http://sustainability.suncor.com/2011/pdf/ROS11_E_Final_July14.pdf
Suncor Energy Inc. (2012). 2012 Annual Report. Retrieved from http://www.suncor.com/investor-
centre/financial-reports/archived-annual-reports
Suncor Energy Inc. (2013). 2013 Annual Report. Retrieved from http://www.suncor.com/investor-
centre/financial-reports/archived-annual-reports
Suncor Energy Inc. (2014). 2014 Annual Report. Retrieved from http://www.suncor.com/investor-
centre/financial-reports/archived-annual-reports
Suncor Energy Inc. (2015). 2015 Annual Report. Retrieved from http://www.suncor.com/investor-
centre/financial-reports/archived-annual-reports

69
Suncor Energy Inc. (n.d.). The oil sands story (1960s, 1970s & 1980s). Retrieved from
http://www.suncor.com/en/about/744.aspx
Supplies and Miscellaneous Items. (2014). In Reclamation Cost Services (pp. SU21 – SU31). Infomine
USA.
Syncrude Canada. (2011). 2010/11 Sustainability Report. Fort McMurray, AB. Retrieved from
http://syncrudesustainability.com/2011/media/pdf/Sycrude%202010-
11%20CSR%20Report.pdf
Syncrude Canada. (2012). 2012 Sustainability Report. Fort McMurray, AB. Retrieved from
http://syncrudesustainability.com/2012/assets/Uploads/Syncrude-Sustainability-2012.pdf
Syncrude Canada. (2013). 2013 Sustainability Report. Fort McMurray, AB. Retrieved from
http://syncrudesustainability.com/2013/pdfs/Syncrude-CSR2013.pdf
Syncrude Canada. (2014). 2014 Sustainability Report. Fort McMurray, AB. Retrieved from
Syncrude Canada Ltd. (n.d.). Our Progress. Retrieved from http://www.syncrude.ca/environmental-
commitment/land-reclamation/our-progress/
Thorley, U. (2012). Mine reclamation costs in the Alberta oil sands. Mining Engineering, 64(8), 93–
99.
Wilkinson Jr., W. A., & Heltke, H. (n.d.). Using computer software to identify ore and waste in
Alberta Oil Sands deposits. Mincom Inc. and Suncor Energy Inc.
World Aluminum. (2015, July). Bauxite Residue Management: Best Practice. Retrieved from
http://bauxite.world-
aluminium.org/fileadmin/_migrated/content_uploads/Bauxite_Residue_Management_-
_Best_Practice__English_.pdf