Deutsche bank june_2016
31
June 8, 2016 7 th Annual Global Industrials & Materials Summit Kathleen L. Quirk Executive Vice President & CFO
-
Upload
irfreeport -
Category
Investor Relations
-
view
131 -
download
0
Transcript of Deutsche bank june_2016

June 8, 2016
7th Annual Global
Industrials & Materials Summit
Kathleen L. QuirkExecutive Vice President & CFO

2
Cautionary Statement
Regarding Forward-Looking Statements
This presentation contains forward-looking statements in which FCX discusses its potential future performance. Forward-looking statements are all statements other than statements of historical facts, such as projections or expectations relating to ore grades and milling rates, production and sales volumes, unit net cash costs, cash production costs per barrel of oil equivalents (BOE), operating cash flows, capital expenditures, debt reduction initiatives, exploration efforts and results, development and production activities and costs, liquidity, tax rates, the impact of copper, gold, molybdenum, cobalt, crude oil and natural gas price changes, the impact of deferred intercompany profits on earnings, reserve estimates, future dividend payments, and share purchases and sales. The words “anticipates,” “may,” “can,” “plans,” “believes,” “estimates,” “expects,” “projects,” “targets,” “intends,” “likely,” “will,” “should,” “to be,” ”potential" and any similar expressions are intended to identify those assertions as forward-looking statements. Under its Term Loan and Revolving Credit Facility, as amended, FCX is not permitted to pay dividends on common stock on or prior to March 31, 2017. The declaration of dividends is at the discretion of the Board, subject to restrictions under FCX’s credit agreement, and will depend on FCX’s financial results, cash requirements, future prospects, and other factors deemed relevant by the Board.
FCX cautions readers that forward-looking statements are not guarantees of future performance and actual results may differ materially from those anticipated, projected or assumed in the forward-looking statements. Important factors that can cause FCX's actual results to differ materially from those anticipated in the forward-looking statements include supply of and demand for, and prices of, copper, gold, molybdenum, cobalt, crude oil and natural gas, mine sequencing, production rates, drilling results, potential effects of cost and capital expenditure reductions and production curtailments on financial results and cash flow, completion of Tenke sale and other potential sales, the outcome of FCX’s debt reduction initiatives, potential additional oil and gas property impairment charges, potential inventory adjustments, potential impairment of long-lived mining assets, the outcome of ongoing discussions with the Indonesian government regarding PT Freeport Indonesia’s (PT-FI) Contract of Work, PT-FI’s ability to obtain renewal of its export license after August 8, 2016, the potential effects of violence in Indonesia generally and in the province of Papua, the resolution of administrative disputes in the Democratic Republic of Congo, industry risks, regulatory changes, political risks, labor relations, weather- and climate-related risks, environmental risks, litigation results and other factors described in more detail under the heading “Risk Factors” in FCX’s Annual Report on Form 10-K for the year ended December 31, 2015, filed with the U.S. Securities and Exchange Commission (SEC), as updated by FCX’s subsequent filings with the SEC.
Investors are cautioned that many of the assumptions upon which FCX's forward-looking statements are based are likely to change after the forward-looking statements are made, including for example commodity prices, which FCX cannot control, and production volumes and costs, some aspects of which FCX may not be able to control. Further, FCX may make changes to its business plans that could affect its results. FCX cautions investors that it does not intend to update forward-looking statements more frequently than quarterly notwithstanding any changes in its assumptions, changes in business plans, actual experience or other changes, and FCX undertakes no obligation to update any forward-looking statements.
This presentation also includes forward-looking statements regarding mineralized material and potential resources not included in proven and probable mineral reserves. The mineralized material and potential resources described in this presentation will not qualify as reserves until comprehensive engineering studies establish their economic feasibility. Accordingly, no assurance can be given that the estimated mineralized material and potential resources not included in reserves will become proven and probable reserves.
This presentation also contains certain financial measures such as unit net cash costs per pound of copper and molybdenum, oil and gas realized revenues, cash production costs, cash operating margin and Adjusted EBITDA, which are not recognized under generally accepted accounting principles in the U.S. As required by SEC Regulation G, reconciliations of these measures to amounts reported in FCX's consolidated financial statements are in the supplemental schedules of FCX’s 1Q 2016 press release, which are available on FCX’s website, “fcx.com.”

3
“Proving Our Mettle”
met·tle /ˈmedl/ n: 1. a person’s ability to cope well with difficulties or to facea demanding situation in a spirited and resilient way.
Executing Clearly Defined Strategy
Maintaining Cost Focus and Capital Discipline
Strengthen Balance Sheet
Highly Attractive Portfolio of Assets
• Provides Opportunities for Significant Asset Sale
Proceeds at Attractive Valuations
• Retain High Quality Portfolio to Build Future Values
Industry Leading Copper Position – Attractive
Long-Term Fundamentals
2015 Annual Report Highlights
4
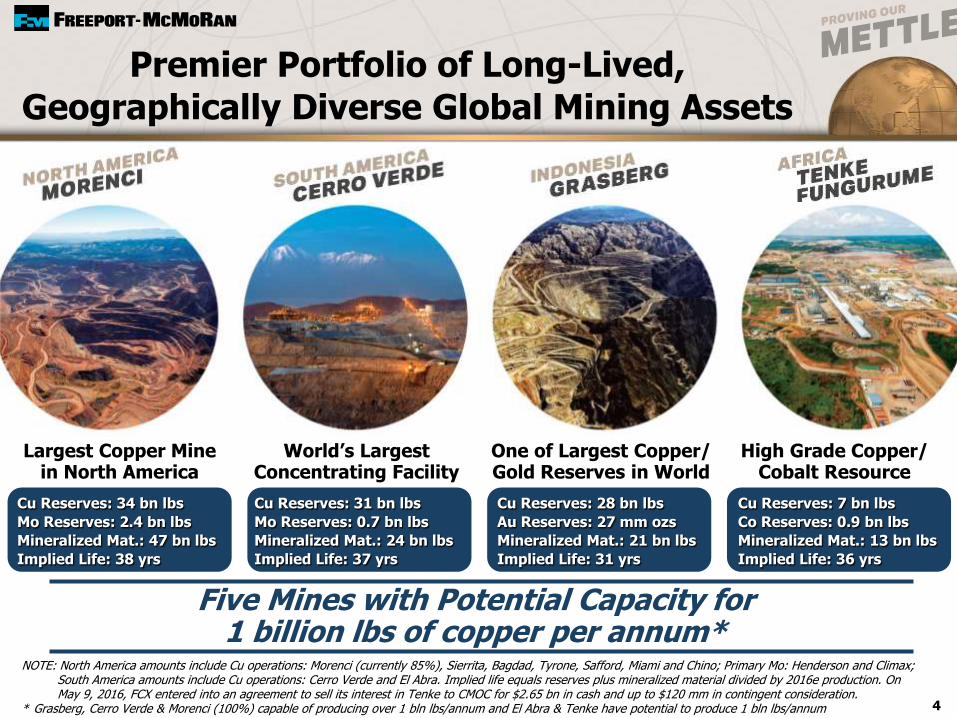
Premier Portfolio of Long-Lived,
Geographically Diverse Global Mining Assets
Five Mines with Potential Capacity for 1 billion lbs of copper per annum*
Cu Reserves: 34 bn lbs
Mo Reserves: 2.4 bn lbs
Mineralized Mat.: 47 bn lbs
Implied Life: 38 yrs
Cu Reserves: 7 bn lbs
Co Reserves: 0.9 bn lbs
Mineralized Mat.: 13 bn lbs
Implied Life: 36 yrs
Cu Reserves: 28 bn lbs
Au Reserves: 27 mm ozs
Mineralized Mat.: 21 bn lbs
Implied Life: 31 yrs
Cu Reserves: 31 bn lbs
Mo Reserves: 0.7 bn lbs
Mineralized Mat.: 24 bn lbs
Implied Life: 37 yrs
NOTE: North America amounts include Cu operations: Morenci (currently 85%), Sierrita, Bagdad, Tyrone, Safford, Miami and Chino; Primary Mo: Henderson and Climax; South America amounts include Cu operations: Cerro Verde and El Abra. Implied life equals reserves plus mineralized material divided by 2016e production. On May 9, 2016, FCX entered into an agreement to sell its interest in Tenke to CMOC for $2.65 bn in cash and up to $120 mm in contingent consideration.
* Grasberg, Cerro Verde & Morenci (100%) capable of producing over 1 bln lbs/annum and El Abra & Tenke have potential to produce 1 bln lbs/annum
Largest Copper Minein North America
World’s Largest Concentrating Facility
One of Largest Copper/Gold Reserves in World
High Grade Copper/Cobalt Resource

5
Long-term Structural Deficit in Copper Generally Expected
=
• $3.30/lb incentive copper price required to balance market
• Significant time (7-10 years) to bring new mines into production
NOTE: Based on WoodMackenzie estimates per global copper long-term outlook dated March 24, 2016
~1.7% CompoundAnnual Growth Rate
~18% Decline Over
Next 10 Years
~7 MtSUPPLY GAP
by 2025(with No New
Projects)
+
DemandSupply Shortfall
Reasonable Long-term Demand
Estimates
Declinesin Base
Production

6
Executing in a Weak Commodity Market
Supported by Portfolio of High Quality Assets
• Execution of Clearly Defined Strategy
• Strengthen Balance Sheet
• Maintain High Quality Portfolio of Assets
• Positioned for Value Creation
Adjusted Mine
Plans Curtailed
High Cost
ProductionCompletion
of Major
Projects
Dividend
Suspended &
Completion of
$2 Bn in Equity
Sales in 2015
CAPEX
Reductions &
Cost Management
Align O&G
Business with
Corporate
Objectives
Asset Sales
Progressing

* Consisting of $60 mm if the average copper price exceeds $3.50/lb and $60 mm if the average cobalt price exceeds $20/lb, both during the 24-month period between 2018 and 2019. 7
Announced Definitive Agreement
on May 9, 2016
China Molybdenum Co. Ltd. (CMOC) to
Acquire 70% of TF Holdings Limited
$2.65 Billion Cash to FCX
− Plus Contingent Consideration of Up to $120 mm*
− Exclusive Negotiations with CMOC to Sell Freeport Cobalt and Kisanfu Exploration Project for $150 mm
Expected to Close in 4Q16
Use of Proceeds: Repay Debt
Sale of 56% Interest in Tenke
Statistics
7% of FCX Cu Reserves
11% of FCX 2015 Production
13% of 2015 Consolidated EBITDA
8% of 2015 Attributable EBITDA

8
Asset Sale Transactions To Date in 2016
Morenci (13% Interest) 2/15/16 $1.0 $115 Closed
Timok Exploration Project 3/3/16 $0.3 $(16) Closed
Oil and Gas Royalty Interests 4/21/16 $0.1 ~$10 2Q16
Tenke Fungurume(3) 5/9/16 $2.8 $300 4Q16
Total $4.2 $409
2015Date of EBITDA@ Expected
Agreement Consideration ~$2.43 Cu Closing
(2)
(1) Attributable EBITDA for 13% of Morenci based on 2015 average copper price of $2.44/lb; attributable EBITDA for 56% of Tenke Fungurume based on 2015 average copper price of $2.42/lb and 2015 average cobalt price of $8.21/lb.
(2) Includes $135 million received at closing and $128 million payable to FCX in stages upon the achievement of defined milestones.(3) FCX entered into exclusive negotiations with CMOC to sell Freeport Cobalt and Kisanfu Exploration Project for $150 mm.(4) Includes contingent consideration of up to $120 mm.NOTE: EBITDA equals operating income plus depreciation, depletion and amortization costs.
($ in billions)
(1)
($ in millions)
(1)(4)

9
• Completed Construction of World’s Largest Concentrating Facility
• Strong Performance on Capital Cost Management and Startup
• Achieved Full Capacity Operating Rates During 1Q16
Cerro Verde Project Execution
• Scale Reflects Size of Resource
• Positioned to be Major Large Scale Producer for Decades
Sep-15 Oct-15 Nov-15 Dec-15 Jan-16 Feb-16 Mar-16
Cerro Verde Mill Rate Performance000’s t/d milled
148
189222
309 301338
373
Concentrator #1
Concentrator #2(Expansion Project)

10
Significant CopperResources & Potential
Reserves*
* Estimate of recoverable proven and probable copper reserves using a long-term average copper price of $2.00/lb; 79 billion pounds net to FCX’s interest.
** On May 9, 2016, FCX entered into an agreement to sell its interest in Tenke to CMOC for $2.65 bn in cash and up to $120 mm in contingent consideration.
*** Estimate of consolidated contained copper mineralized material using a long-term copper price of $2.20/lb. Mineralized Material is not included in reserves and will not qualifyas reserves until comprehensive engineering studies establish their economic feasibility. Accordingly, no assurance can be given that the estimated mineralizedmaterial will become proven and probable reserves. See Cautionary Statement.
*** Our estimates of potential are based on geologically reasonable interpolation and extrapolation of more limited information than is used for Mineralized Material (measured andindicated) and requires higher Cu prices. Significant additional drilling is required and no assurance can be given that the potential quantities of metal will be produced.
99
204
billion lbs of copperN
ort
hA
me
rica
So
uth
Am
eri
ca
Afr
ica
**
Ind
on
esia
MineralizedMaterial***
(contained Cu)
Reserves
Reserves & Mineralized Material
Potential****(contained Cu)
Se
rbia 460+
Reserves &Mineralized
Material
Reserves,Mineralized
Material& Potential
El Abra Major Sulfide Deposit
North America Sulfides
Tenke
Future ResourceDevelopment Opportunities

11
Positive Free Cash Flow in Mining Business
with Significant Leverage to Recovery
NOTE: EBITDA equals operating income plus depreciation, depletion and amortization costs. Assumes average prices of $1,200/oz gold, $6.00/lb molybdenum for 2016; each $100/oz change in gold would have an approximate $150 mm impact, each $2/lb change in molybdenum would have an approximate $55 mm impact. 2016e EBITDA includes Indonesian export duties which are under discussion with GOI.
(1) Includes $350 mm for major projects.(2) Assumed noted copper price for 2Q16e – 4Q16e; adjusted for closing of Morenci transaction on May 31, 2016 and includes results for Tenke, which FCX
reached agreement to sell with closing expected in 2Q16.e = estimate. See Cautionary Statement.
2015
EBITDA CAPEX
2016e EBITDA
$4.6
$3.3 $3.3
($ in billions)
CAPEX
$5.7
Each 10¢ Change in Copper: $425 mm Impact on 2016e EBITDA
Other$0.9
MajorProjects
$2.4
CAPEX
$0.4
$1.4
$1.8
$6.8
@ $2.00Copper
@ $2.25Copper
@ $2.50Copper
Avg. Cu:$2.42
EBITDA CAPEX
Avg. Cu:$2.17
$0.8$0.5
1Q162016e
(1)
(2) (2) (2)
(2)

12
New Organization Structure
- Reduce Costs
- Align Capital Allocation with Corporate Objectives
Significant Capital Investment Winding Down
- Maintain Near Term Production Without Additional Drilling
Production from 6 100%-Owned Deepwater GOM Tiebacks Commencing in 2016
Reached Agreement with Contractors to Terminate Contracts for 3 Deepwater GOM Drill Ships
- ~ $350 mm in Savings
Oil & Gas Highlights
1Q16 Sales – 12.1 MMBOE
California
25%
GOM
61%
Other
14%
Focused on Managing Costs and Enhancing Asset Values
LOE ($/bbl) $15.85 $20.26
CAPEX (mm’s) $523 $1,033
1Q16* 1Q15
* LOE (i.e. cash production cost) and CAPEX exclude $165 mm in idle rig costs.

Deepwater Gulf of Mexico Focus Areas
13
Walker Ridge
Atwater Valley
Viosca Knoll
Facilities
Development
Discovery
FM O&G Leases
Alaminos Canyon
Garden Banks
Louisiana
Hoover
Marlin
East Breaks
Green Canyon
Keathley Canyon
MississippiCanyon
\
Holstein Deep
Holstein
Heidelberg
King
Vito
HornMountain
Lucius
KO/QV
Dorado
Asset Area MBOE/d
Holstein Facility 9Marlin Facility 30Horn Mountain Facility 8Lucius 18Other 3
Deepwater GOM Total 68
1Q 2016 Net Production Rates
Power Nap
Horn Mountain Deep

14
2017e Oil & Gas EBITDAat Various Prices and CAPEX
($ in billions)
$0.6
$1.0
$1.4
@ $35 Brent @ $45 Brent @ $55 Brent @ $65 Brent
$1.8
e = estimate. See Cautionary Statement.
NOTE: EBITDA equals operating income plus depreciation, depletion and amortization. Amounts are estimates for illustrative purposes based on model results. Model reflects FM O&G cost and production mix for 2017e including 149 MBOE per day, $13/BOE operating cost, average Brent crude differential of 89% and $2.90/mmbtu natural gas price.
$0.5
2017e CAPEX

0
2
4
6
2015 2016e* 2017e*
4.1
5.04.6
Copper Sales (billion lbs)
15
Sales Profile
Note: Consolidated copper sales include 688 mm lbs in 2015, 990 mm lbs in 2016e and 965 mm lbs in 2017e for noncontrolling interest; excludes purchased copper.
e = estimate. See Cautionary Statement.
Note: Consolidated gold sales include 115k ozs in 2015, 170k ozs in 2016e and 235k ozs in 2017e for noncontrolling interest.
0
1
2
3
2015 2016e 2017e
1.251.85
2.5
0
30
60
90
2015 2016e 2017e
8971 74
0
20
40
60
2015 2016e 2017e
52.6 54.4 54
Gold Sales (million ozs)
Molybdenum Sales (million lbs)
Oil & Gas Sales (MMBOE)
Copper Sales (billion lbs)
* Adjusted for closing of the Morenci transaction on May 31, 2016. Includes ~485 mm lbs associated with Tenke, which FCX reached agreement to sell with closing expected in 4Q 2016.

$0
$3
$6
$9
Cu $2.00/lb Cu $2.25/lb Cu $2.50/lb
$0
$2
$4
$6
Cu $2.00/lb Cu $2.25/lb Cu $2.50/lb
16
EBITDA and Cash Flow at Various Copper Prices
Average EBITDA ($1,200 Gold, $6 Molybdenum & $47 Oil)*
Average Operating Cash Flow (excluding Working Capital changes)($1,200 Gold, $6 Molybdenum & $47 Oil)*
(US$ billions)
(US$ billions)
Note: For 2016e and 2017e price sensitivities see slides 29 and 30. EBITDA equals operating income plus depreciation, depletion and amortization. Includes Indonesian export duties which are under discussion with GOI.
* Average prices as noted for 2Q16-2017; adjusted for Morenci sale, which closed on May 31, 2016; includes Tenke which FCX reached agreement to sell with closing expected in 4Q 2016.
e = estimate. See Cautionary Statement.
2016e/2017e
Average
2016e/2017e
Average

2015 2016e 2017e
17
Capital Expenditures
(US$ billions)
(1) Excludes idle GOM rig cash costs totaling $0.8 billion in 2016e and $0.5 billion in 2017e, which will reduce operating cash flows.
Note: Includes capitalized interest and CAPEX for Tenke, which FCX reached agreement to sell with closing expected in 4Q 2016.
e= estimate. See Cautionary Statement.
$6.35
Other Mining
Oil & Gas
3.0
0.9
MajorMining
Projects
2.4
1.5
0.4
1.4
$3.3
1.8
0.5
0.9
0.8
$2.2
3.3
TOTALMINING
Future Spending Dependent on Improvement in Market Conditions
(1)
(1)
1.7

$0
$1
$2
$3
2016 2017
Committed to Balance Sheet Management – Strong Track Record
$0
(US$ billions)
$1.5
FCX2.15% & 2.30%
Sr. Notes
PF FCX Debt Structure as of 3/31/16(US$ billions)
* For purposes of this schedule, maturities of uncommitted lines of credit and other short-term lines are included in FCX’s revolver balance that matures in 2019.
*
18
CV Non-Recourse
$3.5 bn Revolver $ 0.5
Bank Term Loans 1.1
FCX & FMC Sr. Notes 12.3
FM O&G Senior Notes 2.5
Cerro Verde Non-Recourse Loan 1.8
Bank Bilateral & Other 0.7
Total Debt $18.9
Cash $2.2
NOTE: 2016 & 2017 term loan maturities have been reduced for 50% of net proceeds from Morenci, Timok & Tenke transactions, including $189 mm in 2016and $272 mm in 2017.
Manageable Near-Term Debt Maturity SchedulePro Forma for Morenci, Timok & Tenke Transactions
$2.2 Bn of Pro Forma Cash

Cost, Capital & Production
Performance
Securing Long-term Rights in
Indonesia
Debt ReductionAsset Sales
Safety & Environmental Management
19
Focused on Execution
Strong Track Record

20
Reference
Slides

21
Financial Highlights
CopperConsolidated Volumes (mm lbs) 1,123 960
Average Realization (per lb) $2.17 $2.72
Site Production & Delivery Costs (per lb) $1.51 $1.93
Unit Net Cash Costs (per lb) $1.38 $1.64
GoldConsolidated Volumes (000’s ozs) 201 263
Average Realization (per oz) $1,227 $1,186
Oil Equivalents Consolidated Volumes (MMBOE) 12.1 12.5
Realized Revenues (per BOE) $23.79 $43.71
Cash Production Costs (per BOE) $15.85 $20.26
Sales Data 1Q16 1Q15
Financial Results (in billions, except per share amounts) 1Q16 1Q15
(1) Realized revenues per BOE include realized cash gains on crude oil derivative contracts of $8/BOE.(2) Includes net charges of $4.0 bn ($3.19/share) in 1Q16 and $2.4 bn ($2.32/share) in 1Q15, primarily for the reduction of the carrying value of oil
and gas properties and idle rig costs. See slide 32 for additional details.(3) Includes net working capital sources (uses) and changes in other tax payments of $188 mm for 1Q16 and $(86) mm for 1Q15.
Revenues $3.5 $4.2
Net Loss Attributable to Common Stock $(4.2) $(2.5)
Diluted Net Loss Per Share $(3.35) $(2.38)
Operating Cash Flows $0.7 $0.7
Capital Expenditures $1.0 $1.9
Total Debt $20.8 $20.3
Consolidated Cash $0.3 $0.5
(2)
(2)
(3)
(1)

22
Consideration to FCX Includes:
- $135 mm Payable at Closing
- Up to $20 mm to be Spent by Purchaser in Connection with Agreed Exploration and
Study Work on the Lower Zone
- $45 mm Payable to FCX Upon the Earliest to Occur of (i) a Build Decision on the
Upper Zone, and (ii) Access to Any Ore Body for Direct Ship Ore
- $50 mm Upon the Achievement of Commercial Production
- Up to $12.5 mm in Recoupment of Project Expenditures
Accelerates Exploration of Lower Zone and Exploration and Development of
High-Grade Upper Zone
FCX Retains Longer-term Option and Control of Lower Zone, which Could
Potentially be Developed as Block Cave
FCX Interest: 39.6% Currently, Would Increase to 54% Upon Delivery of
Feasibility Study
Benefit to FCX − Provides Near-term Funds, while Retaining Long-Term
Exposure to Potentially Significant Resource
Sale of Interest in Timok Copper-Gold Project Located in Serbia

23
FCX Will Pay Rowan $215 mm in Cash
FCX Agreed to Contingent Payment of Up To $30 mm Based on Oil Prices over Next 12-Months
Rowan Released FCX of $0.3 bn in Payment Obligations for One Drilling Rig Contract
Rowan Settlement Noble Settlement
FCX to Provide Noble with $540 mm in Cash, FCX Stock or Noble Bonds (at FCX option)
FCX Agreed to Contingent Payment of Up To $75 mm Based on Oil Prices Over Next 12-Months
Noble Released FCX of $0.8 bn in Payment Obligations for Two Drilling Rig Contracts
Termination & Settlement ofDeepwater Rig Contracts
~$350 mm in Aggregate Savings

1,750
71(5)
1,3701,410
1.85
485 35
24
2016e Operating Estimates
(1) Estimates assume average prices of $2.25/lb for copper, $1,250/oz for gold, $5.00/lb for molybdenum and $10/lb for cobalt for the remainder of 2016. Quarterly unit costs will vary significantly with quarterly metal sales volumes.
(2) Production costs include profit sharing in South America and severance taxes in North America.(3) Adjusted for closing of the Morenci transaction on May 31, 2016. (4) On May 9, 2016, FCX entered into an agreement to sell its interest in Tenke to CMOC with closing expected in 4Q 2016.(5) Includes molybdenum produced in South America.
Momm lbs
North America South America Indonesia Africa (4)
(per pound of copper) North SouthAmerica America Indonesia Africa (4) Consolidated
Cash Unit Costs (1)
Site Production & Delivery (2) $1.41 $1.26 $1.21 $1.62 $1.33
By-product Credits (0.06) (0.08) (1.66) (0.35) (0.54)
Treatment Charges 0.10 0.24 0.27 - 0.18
Royalties & Export Duties - 0.01 0.25 0.05 0.08
Unit Net Cash Costs $1.45 $1.43 $0.07 $1.32 $1.05
2016e Sales by Region
2016e Unit Production Costs
Cumm lbs
Aumm ozs
Comm lbs
Note: e = estimate. See Cautionary Statement.
(3)

0
500
1,000
1,500
1Q16 2Q16e 3Q16e 4Q16e
1,123 1,150
1,3351,405
25
2016e Quarterly Sales
0
250
500
750
1000
1Q16 2Q16e 3Q16e 4Q16e
201 195
505
950
Gold Sales (thousand ozs)
0
10
20
1Q16 2Q16e 3Q16e 4Q16e
1719 18 17
Molybdenum Sales (million lbs)
0
5
10
15
1Q16 2Q16e 3Q16e 4Q16e
12.1 13.5 14.6 14.2
Oil & Gas Sales (MMBOE)
Note: Consolidated gold sales include approximately 18k ozs in 1Q16, 18k ozsin 2Q16e, 47k ozs in 3Q16e and 87k ozs in 4Q16e for noncontrolling interest.
e = estimate. See Cautionary Statement.
Note: Consolidated copper sales include approximately 222 mm lbs in 1Q16, 238 mm lbs in 2Q16e, 265 mm lbs in 3Q16e and 265 mm lbs in 4Q16e for noncontrolling interest; excludes purchased copper.
Copper Sales* (million lbs)
* Adjusted for closing of the Morenci transaction on May 31, 2016. Includes sales associated with Tenke, which FCX reached agreement to sell with closing expected in 4Q 2016.

26
PT-FI Mine Plan PT-FI’s Share of Metal Sales, 2016e-2022e
1.4
1.85
1.3
2.5
1.0 1.0 1.0
1.2 1.21.3
1.2
1.6
2016e 2017e 2018e 2019e 2020e 2020e-
2022e
Copper, billion lbs
Gold, million ozs
2016e – 2020e PT-FI ShareTotal: 5.9 billion lbs copper
Annual Average: 1.18 billion lbs
2016e – 2020e PT-FI ShareTotal: 7.85 million ozs gold
Annual Average: 1.57 million ozs
Note: Timing of annual sales will depend upon mine sequencing, shipping schedules and other factors.
e = estimate. Amounts are projections; see Cautionary Statement. Annual Average

Copper: +/- $0.10/lb $425 $340
Molybdenum: +/- $1.00/lb $28 $22
Gold: +/- $50/ounce $75 $45
Oil Sales: +/- $5/bbl(1) $150 $120
Oil Sales Net of Diesel Costs:(1,2)
+/- $5/bbl $125 $100
Natural Gas: +/- $0.50/Mcf $20 $16
Currencies:(3) +/- 10% $110 $77
OperatingChange EBITDA Cash Flow
Sensitivities (US$ millions)
(1) Oil sales sensitivity calculated using average base Brent price assumption of $45/bbl in 2Q16 – 4Q16e.(2) Amounts are net of mining cost impacts of a $5/bbl change in oil prices.(3) U.S. Dollar Exchange Rates: 690 Chilean peso, 13,000 Indonesian rupiah, $0.75 Australian dollar, $1.10 Euro, 3.44 Peruvian Nuevo Sol base case assumption.
Each +10% equals a 10% strengthening of the U.S. dollar; a strengthening of the U.S. dollar against forecasted expenditures in these foreign currencies equates to a cost benefit of noted amounts.
NOTE: Based on impact of price change for remainder of 2016e. EBITDA equals operating income plus depreciation, depletion and amortization costs. Operating cash flow amounts exclude working capital changes. Adjusted for closing of Morenci transaction on May 31, 2016 and includes results for Tenke, which FCXreached agreement to sell with closing expected in 2Q16.
e = estimate. See Cautionary Statement.
2016e
27

Copper: +/- $0.10/lb $435 $350
Molybdenum: +/- $1.00/lb $35 $28
Gold: +/- $50/ounce $125 $75
Oil Sales: +/- $5/bbl(1) $200 $160
Oil Sales Net of Diesel Costs:(1,2)
+/- $5/bbl $160 $130
Natural Gas: +/- $0.50/Mcf $23 $19
Currencies:(3) +/- 10% $145 $103
OperatingChange EBITDA Cash Flow
Sensitivities (US$ millions)
(1) Oil sales sensitivity calculated using average base Brent price assumption of $48/bbl in 2017e.(2) Amounts are net of mining cost impacts of a $5/bbl change in oil prices.(3) U.S. Dollar Exchange Rates: 690 Chilean peso, 13,000 Indonesian rupiah, $0.75 Australian dollar, $1.10 Euro, 3.44 Peruvian Nuevo Sol base case assumption.
Each +10% equals a 10% strengthening of the U.S. dollar; a strengthening of the U.S. dollar against forecasted expenditures in these foreign currencies equates to a cost benefit of noted amounts.
NOTE: Based on 2017e annual impacts. EBITDA equals operating income plus depreciation, depletion and amortization costs. Operating cash flow amounts exclude working capital changes. Adjusted for closing of Morenci transaction on May 31, 2016 and includes results for Tenke, which FCX reached agreement to sell with closing expected in 2Q16.
e = estimate. See Cautionary Statement.
2017e
28

29
2016e Oil & GasOperating Estimates
California
Operating Cost: $29/bbl
Gulf of Mexico
Operating Cost: $11/bblPricing: HLS/NYMEX
Operating Cost: $1.90/McfePricing: NYMEX
California Haynesville/Madden/Other
GOM
NOTE: Operating costs exclude DD&A and G&A. DD&A is expected to approximate $18/BOE in 2016e. Oil realizations are expected to average 85% of Brent in 2016e. e = estimate. See Cautionary Statement.
Includes ~5 MMcf/d of Natural gas Includes ~2 MMcfe/d of LiquidsIncludes ~7 MBbls/d of NGLsand GOM Shelf/ILT Production
84
32
OilMBOE/D
89
GasMMCFE/D
104
GasMMCF/D
OilMBOE/D
2016e Oil & Gas Sales by Region
Madden &Haynesville

30
Adjusted EBITDA Reconciliation
(in millions)
1Q 2016
12 Months
Ended 3/31/2016
Net loss attributable to common stock $(4,184) $(13,946)
Interest expense, net 200 699
Income tax provision (benefit) 70 (1,170)
Depreciation, depletion and amortization 722 3,280
Impairment of oil and gas properties 3,787 13,827
Copper and molybdenum inventory adjustments 4 338
Net noncash MTM losses on crude oil derivatives - 271
Accretion 36 136
Other special items (1) 200 588
Other (income) loss, net (38) 55
Gain on shareholder derivative litigation - (92)
Preferred dividends attributable to redeemable NCI 11 42
Net income attributable to NCI 72 120
Equity in affiliated companies’ net earnings (7) (3)
Adjusted EBITDA (2) $873 $4,145
(1) Other special items for 1Q 2016 include charges primarily for idle rig costs ($165 million) and inventory write downs ($35 million). For the 12 month period ended March 31, 2016, other special items include charges for (i) idle rig costs ($178 million), (ii) other asset impairments and inventory write-downs at oil and gas operations and prior period tax assessments related to California properties ($193 million), (iii) mining asset impairments, restructuring and other net charges ($156 million), (iv) adjustment to environmental obligations and related litigation reserves ($43 million) and (iv) executive retirement benefits ($18 million).
(2) Adjusted EBITDA is a non-GAAP financial measure that is frequently used by securities analysts, investors, lenders and others to evaluate companies’ performance, including, among other things, profitability before the effect of financing and similar decisions. Because securities analysts, investors, lenders and others use Adjusted EBITDA, management believes that our presentation of Adjusted EBITDA affords them greater transparency in assessing our financial performance. Adjusted EBITDA should not be considered as a substitute for measures of financial performance prepared in accordance with GAAP. Adjusted EBITDA may not necessarily be comparable to similarly titled measures reported by other companies, as different companies calculate them differently.

$0
$2
$4
$6
$8
$10
2016 2017 2018 2019 2020 2021 2022 2023 Thereafter
FCX Debt Maturities as of 3/31/16
Pro Forma for Morenci, Timok & Tenke Transactions
$0
$2.8
$1.9
(US$ billions)
$0.9
$4.0
FCX
4.55%,
5.40%,
& 5.45%
Sr. Notes
and
FMC
Sr. Notes
$1.5
$2.4 $2.5
CV Non-Recourse FM O&G6.125% Sr. Notes
FM O&G6.625%Sr. Notes
FM O&G 6.5%Sr. Notes
PF Total Debt & Cash at 3/31/16
FCX Revolver & Term Loan $ 1.6
FCX & FMC Sr. Notes 12.3
FM O&G Senior Notes 2.5
Other 2.5
Total Debt $18.9
Consolidated Cash $ 2.2
(US$ billions)
FM O&G6.75%
Sr. Notes
* For purposes of this schedule, maturities of uncommitted lines of credit and other short-term lines are included in FCX’s revolver balance that matures in 2019.
* *
Term Loan Term Loan
Uncommitted & CV Non-Recourse
31
FM O&G6.875%Sr. Notes
$2.9
NOTE: Term loan maturities have been reduced for 50% of net proceeds from Morenci, Timok & Tenke transactions, including $189 mm in 2016, $272 mm in 2017, $651 mm in 2018, $313 mm in 2019 and $468 mm in 2020.
Revolver
FCX 3.875% Sr. Notes
FCX 3.55%
Sr. NotesFCX 4% Sr. Notes
FCX 3.1%
Sr. Notes
FCX 2.375%Sr. Notes
FCX2.15% & 2.30%
Sr. Notes
CV Non-Recourse