Determination of THC CBD in Cannabis (014329 01)
5
Introduction The medicinal use of cannabis and cannabis-related products has experienced astronomical growth over the past decade. Canada, Germany, New Zealand and Columbia now have legal cannabis markets. In the United States, 30 states plus the District of Columbia have passed legislation permitting the use of medicinal cannabis. Of these 30 states, nine have laws permitting the use of recreational cannabis. As the industry moves towards legitimization, understanding the cannabinoid concentrations along the cultivation and processing path is critical for assuring the quality and safety of cannabis products. The Determination of Total THC and CBD Content in Cannabis Flower by Fourier Transform Near Infrared Spectroscopy FT-IR Spectroscopy APPLICATION NOTE Authors: Doug Townsend 1 Ian Eustis 2 Mark Lewis 3 Steven Rodgers 3 Kevin Smith 3 Ariel Bohman 1 1 PerkinElmer, Inc. Shelton, CT 2 LightScale Labs Portland, OR 3 Napro Research Sacramento, CA
Transcript of Determination of THC CBD in Cannabis (014329 01)

Introduction The medicinal use of cannabis and cannabis-related products has experienced astronomical growth over the past decade. Canada, Germany, New Zealand and Columbia now have legal cannabis markets. In the United States, 30 states plus the District of Columbia have passed legislation permitting the
use of medicinal cannabis. Of these 30 states, nine have laws permitting the use of recreational cannabis. As the industry moves towards legitimization, understanding the cannabinoid concentrations along the cultivation and processing path is critical for assuring the quality and safety of cannabis products.
The Determination of Total THC and CBD Content in Cannabis Flower by Fourier Transform Near Infrared Spectroscopy
FT-IR Spectroscopy
A P P L I C A T I O N N O T E
Authors:
Doug Townsend1
Ian Eustis2
Mark Lewis3
Steven Rodgers3
Kevin Smith3
Ariel Bohman1
1 PerkinElmer, Inc. Shelton, CT
2 LightScale Labs Portland, OR
3 Napro Research Sacramento, CA

2
Figure 1. Chemical structures of the two predominant cannabinoids THCA (left) and CBDA (right).
Figure 2. Spectrum Two NIR equipped with a Near Infrared Reflectance Module and sample spinner.
The potency of cannabis flower is commonly defined as the concentration of the two predominant cannabinoids, namely tetrahydrocannabinolic acid (THCA) and cannabidiolic acid (CBDA) (Figure 1). Valuation of the flower is influenced by this potency metric. As such, the accurate and reliable determination of potency is of great economic importance to all stakeholders in the cannabis supply chain.
Traditionally, potency has been determined by high performance liquid chromatography (HPLC). Although HPLC provides a full cannabinoid profile, several disadvantages are associated with its use. Sample destruction, complex instrumentation, hazardous chemicals and longer sample preparation times limit its deployment directly at the grow site where a rapid and non-destructive process is desirable. These limitations have prompted cultivators to seek a faster and user-friendly alternative to HPLC.
One such technique is Fourier transform near-infrared (FT-NIR) spectroscopy. FT-NIR is a remarkably versatile and robust analytical technique and has enjoyed tremendous success in a variety of applications for both the qualitative and quantitative determination of analytes on the percent level. To this end, we present FT-NIR spectroscopy as a rapid and cost-effective tool for the quantitative determination of potency in dried cannabis flower.
FT-NIR Measures the Chemical Composition of SubstancesFT-NIR utilizes energy in the 14,000 – 4000 cm-1, or 714 – 2500 nm, region of the electromagnetic spectrum to elucidate sample chemistry. When a sample is irradiated with near infrared light, the chemical bonds of the sample absorb light at discrete wavelengths. The resulting spectrum gives information about the chemical bonds present in the sample. This is where FT-NIR derives its power; it allows users to chemically fingerprint substances and when calibrated correctly, yields quantitative results.
Potency Determination by FT-NIR Poses a Unique ChallengeBotanicals, such as the cannabis flower, are heterogeneous by nature. This poses a unique challenge as the cannabis flower is a complex matrix consisting of a variety of plant tissue types and over 500 naturally produced chemicals. It is also widely accepted that the distribution of these chemicals can vary greatly between plants of the same cultivar, over an individual plant and even within a single flower.1 Consequently, no two parts of the cannabis flower are the same and are likely to vary greatly in their cannabinoid content. Therefore, a technique
that can overcome the inherent heterogeneity of the cannabis flower is of great analytical importance to ensure an accurate and representative measurement of flower potency.
FT-NIR is ideally suited for the analysis of heterogeneous substances due to the high penetration depth of NIR light and relative insensitivity to scattering effects. Using the Near Infrared Reflectance Module (NIRM) which employs the diffuse reflectance technique, a large sample volume is irradiated with NIR light through the use of the Sample Spinner. The light reflected by the sample is then recorded, resulting in the generation of a spectrum. Peak positions give insight to the chemical bonds present within the sample while peak intensities correlate to concentration.
Spectrum Two NIRThe PerkinElmer Spectrum Two FT-NIR featuring the Near Infrared Reflectance Module (NIRM) offers fast and easy measurements of potency in dried cannabis flower (Figure 2). The instrument optics are designed to provide tight control of the optical geometry, generating excellent spectral uniformity across the beam and a high collection efficiency. Gold-coated optics are used to maximize the energy throughput and a high sensitivity Indium Gallium Arsenide (InGaAs) detector gives excellent performance over the entire NIR spectral range. The combination of all these design optimizations results in a sampling module that facilitates easy transferability of methods from one instrument to another, a key requirement for method deployment on multiple instruments.²
3
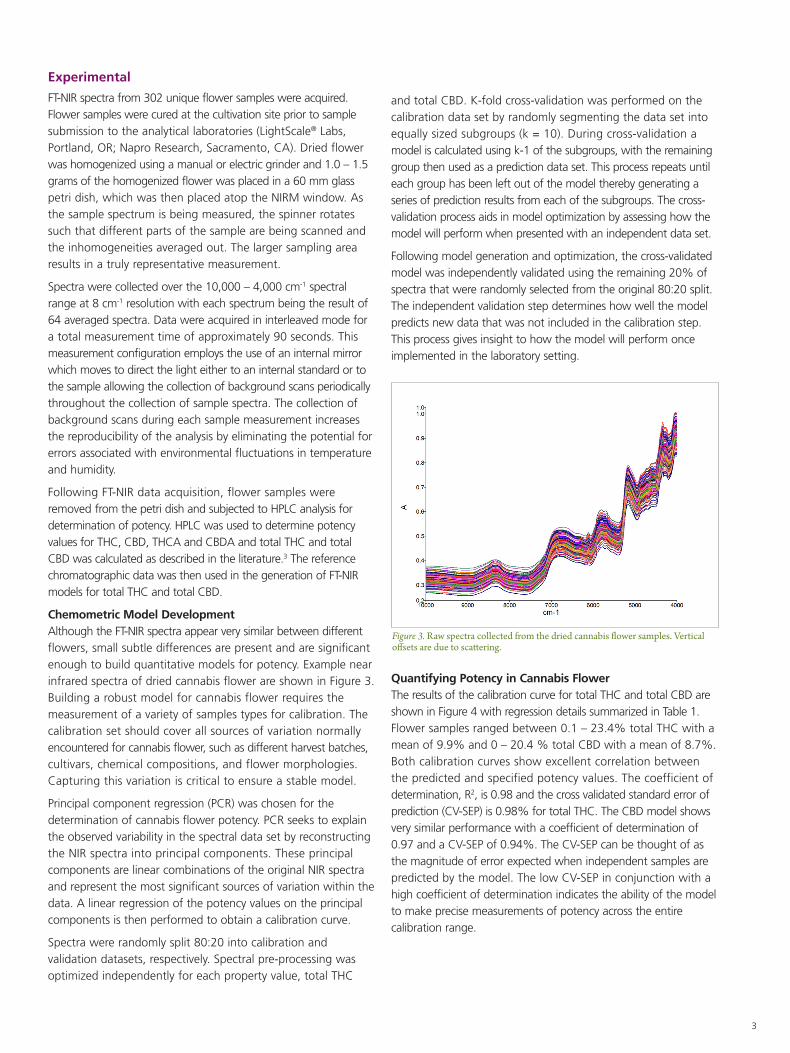
Figure 3. Raw spectra collected from the dried cannabis flower samples. Vertical offsets are due to scattering.
Experimental
FT-NIR spectra from 302 unique flower samples were acquired. Flower samples were cured at the cultivation site prior to sample submission to the analytical laboratories (LightScale® Labs, Portland, OR; Napro Research, Sacramento, CA). Dried flower was homogenized using a manual or electric grinder and 1.0 – 1.5 grams of the homogenized flower was placed in a 60 mm glass petri dish, which was then placed atop the NIRM window. As the sample spectrum is being measured, the spinner rotates such that different parts of the sample are being scanned and the inhomogeneities averaged out. The larger sampling area results in a truly representative measurement.
Spectra were collected over the 10,000 – 4,000 cm-1 spectral range at 8 cm-1 resolution with each spectrum being the result of 64 averaged spectra. Data were acquired in interleaved mode for a total measurement time of approximately 90 seconds. This measurement configuration employs the use of an internal mirror which moves to direct the light either to an internal standard or to the sample allowing the collection of background scans periodically throughout the collection of sample spectra. The collection of background scans during each sample measurement increases the reproducibility of the analysis by eliminating the potential for errors associated with environmental fluctuations in temperature and humidity.
Following FT-NIR data acquisition, flower samples were removed from the petri dish and subjected to HPLC analysis for determination of potency. HPLC was used to determine potency values for THC, CBD, THCA and CBDA and total THC and total CBD was calculated as described in the literature.3 The reference chromatographic data was then used in the generation of FT-NIR models for total THC and total CBD.
Chemometric Model DevelopmentAlthough the FT-NIR spectra appear very similar between different flowers, small subtle differences are present and are significant enough to build quantitative models for potency. Example near infrared spectra of dried cannabis flower are shown in Figure 3. Building a robust model for cannabis flower requires the measurement of a variety of samples types for calibration. The calibration set should cover all sources of variation normally encountered for cannabis flower, such as different harvest batches, cultivars, chemical compositions, and flower morphologies. Capturing this variation is critical to ensure a stable model.
Principal component regression (PCR) was chosen for the determination of cannabis flower potency. PCR seeks to explain the observed variability in the spectral data set by reconstructing the NIR spectra into principal components. These principal components are linear combinations of the original NIR spectra and represent the most significant sources of variation within the data. A linear regression of the potency values on the principal components is then performed to obtain a calibration curve.
Spectra were randomly split 80:20 into calibration and validation datasets, respectively. Spectral pre-processing was optimized independently for each property value, total THC
and total CBD. K-fold cross-validation was performed on the calibration data set by randomly segmenting the data set into equally sized subgroups (k = 10). During cross-validation a model is calculated using k-1 of the subgroups, with the remaining group then used as a prediction data set. This process repeats until each group has been left out of the model thereby generating a series of prediction results from each of the subgroups. The cross-validation process aids in model optimization by assessing how the model will perform when presented with an independent data set.
Following model generation and optimization, the cross-validated model was independently validated using the remaining 20% of spectra that were randomly selected from the original 80:20 split. The independent validation step determines how well the model predicts new data that was not included in the calibration step. This process gives insight to how the model will perform once implemented in the laboratory setting.
Quantifying Potency in Cannabis FlowerThe results of the calibration curve for total THC and total CBD are shown in Figure 4 with regression details summarized in Table 1. Flower samples ranged between 0.1 – 23.4% total THC with a mean of 9.9% and 0 – 20.4 % total CBD with a mean of 8.7%. Both calibration curves show excellent correlation between the predicted and specified potency values. The coefficient of determination, R2, is 0.98 and the cross validated standard error of prediction (CV-SEP) is 0.98% for total THC. The CBD model shows very similar performance with a coefficient of determination of 0.97 and a CV-SEP of 0.94%. The CV-SEP can be thought of as the magnitude of error expected when independent samples are predicted by the model. The low CV-SEP in conjunction with a high coefficient of determination indicates the ability of the model to make precise measurements of potency across the entire calibration range.

4
The independent validation results are summarized in Table 2. These results show accurate prediction across the entire calibration range indicating that there aren’t any gaps in the calibration curve.
Starter calibrations are available for use with the Spectrum Two N and NIRM for determination of total THC and total CBD in dried cannabis flower. The use of starter calibrations greatly reduces method development time as a quantitative chemometric model has already been developed with consideration in mind for the large amount of variation inherent in the cannabis flower. Implementation of these starter calibrations requires on-site method validation to ensure the selected cannabis flower is representative of those used in generating the calibration model. On-site validation entails measurement of a small sample population with reference HPLC potency values. These on-site validation samples are then incorporated into the starter calibration model, further increasing the modelled sample variation.
Process Control and OptimizationFT-NIR spectroscopy has the potential to fundamentally change our understanding of the cannabis growth process by delivering time-resolved potency data that can be used to optimize growth conditions and trend cannabinoid expression in real-time. The near infrared spectrum of a cannabis flower provides a unique chemical snapshot, or immediate potency update, that can be used to establish batch trajectories. The ability to trend batches over time allows for identification of abnormal trends before harvest. Alternatively, trending data can be used to investigate conditions to maximize the cannabinoid expression behavior of the plant by manipulating external factors such as temperature, feeding schedules and light exposure. This data would provide cultivators with critical insight to early plant growth as well as future cannabinoid and potency yield.
Figure 4. Correlation plots showing calibration (blue) and validation (red) data points for percent Total THC (top) and Total CBD (bottom).
Property Value Average Range R2 Number of PCs CV-SEP (%) SEP (%)
Total THC (%) 9.8 0.1 – 23.4 0.98 9 0.98 0.92
Total CBD (%) 8.7 0 – 20.4 0.97 12 0.94 0.72
Table 1. Summary of the regression details for Total THCA and Total CBDA chemometric models.
Property Value R2 Average Reference Value
Average Predicted Value SEP (%)
Total THC (%) 0.989 9.9 9.9 0.92
Total CBD (%) 0.988 8.1 7.9 0.73
Table 2. Results from the independent validation procedure.

For a complete listing of our global offices, visit www.perkinelmer.com/ContactUs
Copyright ©2018, PerkinElmer, Inc. All rights reserved. PerkinElmer® is a registered trademark of PerkinElmer, Inc. All other trademarks are the property of their respective owners. 014329_01 PKI
PerkinElmer, Inc. 940 Winter Street Waltham, MA 02451 USA P: (800) 762-4000 or (+1) 203-925-4602www.perkinelmer.com
Conclusion
The cannabis cultivation industry would benefit from an on-site, rapid and low-cost technique for the accurate measurement of flower potency. FT-NIR spectroscopy provides rich information regarding the chemical composition of cannabis flower. When combined with chemometrics, the FT-NIR offers unparalleled speed and simplicity that cannot be matched by traditional techniques. In this application note, we have shown how the PerkinElmer Spectrum Two NIR with the Near Infrared Reflectance Module (NIRM) can be used to quantify total THC and total CBD in dried cannabis flower. The use of FT-NIR directly at the grow site would eliminate the lag time and cost associated with submitting samples to third party laboratories and reduce overall research and development costs for cultivators.
References
1. Warner, Marcus L., et al. “Comparative analysis of freshly harvested cannabis plant weight and dried cannabis plant weight.” Forensic Chemistry 3 (2017): 52-67.
2. Near-Infrared Reflectance Sampling Accessories for the Frontier and Spectrum Two N FT-NIR Spectrometers, PerkinElmer, Inc.
3. Jikomes, Nick, and Michael Zoorob. “The Cannabinoid Content of Legal Cannabis in Washington State Varies Systematically Across Testing Facilities and Popular Consumer Products.” Scientific Reports 8 (2018): 4519. PMC. Web. 16 Aug. 2018.