Determination of dynamic loads in a high-frequency direct ...
34
Transcript of Determination of dynamic loads in a high-frequency direct ...


^1< , m
Bflfc
-\ •.-
I A.*-
I I I V »
H
Lew!H
I
<S
Il
Vuv
ffatfonal Bureau of Standards
Library, E-01 Admin. Bldg
JUL 1 2 1971
NBS TECHNICAL NOTE 578
Determination of Dynamic Loads
in a High-Frequenoy
Direct-Stress Fatigue Machine

NATIONAL BUREAU OF STANDARDS
The National Bureau of Standards 1 was established by an act of Congress March 3,
1901. The Bureau's overall goal is to strengthen and advance the Nation's science andtechnology and facilitate their effective application for public benefit. To this end, the
Bureau conducts research and provides: (1) a basis for the Nation's physical measure-ment system, (2) scientific and technological services for industry and government, (3)
a technical basis for equity in trade, and (4) technical services to promote public safety.
The Bureau consists of the Institute for Basic Standards, the Institute for Materials
Research, the Institute for Applied Technology, the Center for Computer Sciences andTechnology, and the Office for Information Programs.
THE INSTITUTE FOR BASIC STANDARDS provides the central basis within theUnited States of a complete and consistent system of physical measurement; coordinates
that system with measurement systems of other nations; and furnishes essential services
leading to accurate and uniform physical measurements throughout the Nation's scien-
tific community, industry, and commerce. The Institute consists of a Center for Radia-tion Research, an Office of Measurement Services and the following divisions:
Applied Mathematics—Electricity—Heat—Mechanics—Optical Physics—LinacRadiation2—Nuclear Radiation 2—Applied Radiation 2—Quantum Electronics3—Electromagnetics3—Time and Frequency 3—Laboratory Astrophysics3—Cryo-genics3
.
THE INSTITUTE FOR MATERIALS RESEARCH conducts materials research lead-
ing to improved methods of measurement, standards, and data on the properties of
well-characterized materials needed by industry, commerce, educational institutions, andGovernment; provides advisory and research services to other Government agencies;
and develops, produces, and distributes standard reference materials. The Institute con-
sists of the Office of Standard Reference Materials and the following divisions:
Analytical Chemistry—Polymers—Metallurgy—Inorganic Materials—Reactor
Radiation—Physical Chemistry.
THE INSTITUTE FOR APPLIED TECHNOLOGY provides technical services to pro-
mote the use of available technology and to facilitate technological innovation in indus-
try and Government; cooperates with public and private organizations leading to the
development of technological standards (including mandatory safety standards), codes
and methods of test; and provides technical advice and services to Government agencies
upon request. The Institute also monitors NBS engineering standards activities andprovides liaison between NBS and national and international engineering standards
bodies. The Institute consists of the following technical divisions and offices:
Engineering Standards Services—Weights and Measures—Flammable Fabrics
—
Invention and Innovation—Vehicle Systems Research—Product Evaluation
Technology—Building Research—Electronic Technology—Technical Analysis
—
Measurement Engineering.
THE CENTER FOR COMPUTER SCIENCES AND TECHNOLOGY conducts re-
search and provides technical services designed to aid Government agencies in improv-
ing cost effectiveness in the conduct of their programs through the selection, acquisition,
and effective utilization of automatic data processing equipment; and serves as the prin-
cipal focus within the executive branch for the development of Federal standards for
automatic data processing equipment, techniques, and computer languages. The Center
consists of the following offices and divisions:
Information Processing Standards—Computer Information—Computer Services
—Systems Development—Information Processing Technology.
THE OFFICE FOR INFORMATION PROGRAMS promotes optimum dissemination
and accessibility of scientific information generated within NBS and other agencies of
the Federal Government; promotes the development of the National Standard Reference
Data System and a system of information analysis centers dealing with the broader
aspects of the National Measurement System; provides appropriate services to ensure
that the NBS staff has optimum accessibility to the scientific information of the world,
and directs the public information activities of the Bureau. The Office consists of the
following organizational units:
Office of Standard Reference Data—Office of Technical Information and
Publications—Library—Office of Public Information—Office of International
Relations.
1 Headquarters and Laboratories at Gaithersburg, Maryland, unless otherwise noted; mailing address Washing-ton, D.C. 20234.
2 Part of the Center for Radiation Research.3 Located at Boulder, Colorado 80302.
)NAL BUREAU OF STANDARDS
\0UNITED STATES DEPARTMENT OF COMMERCE
Maurice H. Stans, Secretary
\) , j NATIONAL BUREAU OF STANDARDS • Lewis M. Branscomb, Director
VI
NBS TECHNICAL NOTE 578ISSUED JUNE 1971
Nat. Bur. Stand. (U.S.), Tech. Note 578, 24 pages (June 1971)
CODEN: NBTNA
Determination of Dynamic Loadsin a High-Frequency
Direct-Stress Fatigue Machine
Donald C. Robinson
Engineering Mechanics Section
Mechanics Division
Institute for Basic StandardsNational Bureau of StandardsWashington, D.C. 20234
NBS Technical Notes are designed to supplement the
Bureau's regular publications program. They provide a
means for making available scientific data that are of
transient or limited interest. Technical Notes may be
listed or referred to in the open literature.
For sale by the Superintendent of Documents, U.S. Government Printing Office, Washington, D.C, 20402.
(Order by SD Catalog No. C 13.46:578). Price 35 cents.
Stock Number 0303-0869
Contents
Page1.- Introduction 1
2. Fatigue Machine Characteristics 2
3. Test Bar Design 3
4. Instrumentation 3
5. Measurement Procedure
5.1. Static Machine. 4
5.2. Fatigue Machine 5
6. Results 6
7. Discussion 7
8. References 9
Determination of Dynamic Loads in a High-FrequencyDirect-Stress Fatigue Machine
Donald C. Robinson
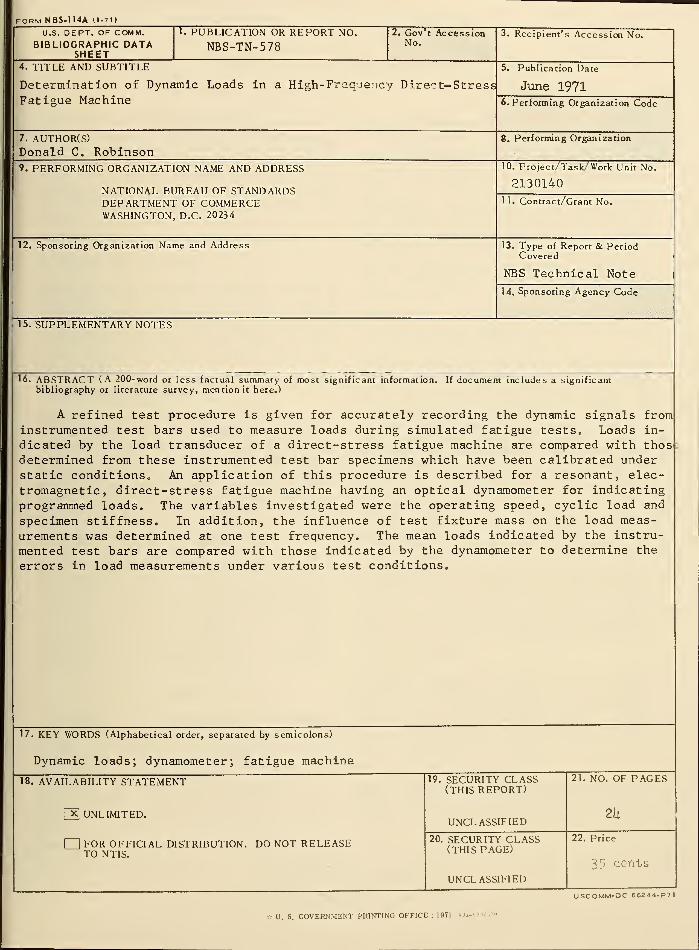
A refined test procedure is given foraccurately recording the dynamic signals frominstrumented test bars used to measure loadsduring simulated fatigue tests. Loads indi-cated by the load transducer of a direct-stressfatigue machine are compared with those deter-mined from these instrumented test bar specimenswhich have been calibrated under static condi-tions. An application of this procedure is
described for a resonant, electromagnetic, direct-stress fatigue machine having an optical dynamom-eter for indicating programmed loads. Thevariables investigated were the operating frequency,cyclic load and specimen stiffness. In addition,the influence of test fixture mass on the loadmeasurements was determined at one test frequency.The mean loads indicated by the instrumented testbars are compared with those indicated by thedynamometer to determine the errors in load mea-surements under various test conditions.
Key words: Dynamic loads; dynamometer; fatiguemachine.
1. Introduction
In the fatigue testing of structural and mechanical members, it is
necessary to have some means of verifying the loads indicated by themachine, since the fatigue life of a specimen depends critically on theapplied loads [1] . To evaluate the performance of a fatigue-machineload-indicating device a method is to compare the intended, or program-med, loads with those indicated by a test specimen over the machine loadand frequency operating ranges [2] . From this information, it is possi-ble to determine corrections to apply to the static calibration of the
machine to account for differences in the programmed and indicated loads
due to undesired inertial effects, which vary for different types of
equipment and test conditions.
In this investigation, instrumented test bars, calibrated stati-cally, were used as dummy fatigue test specimens to determine the loads
in a resonant, direct-stress fatigue machine. A new recording procedureis described for measuring the cyclic loads applied to the test bars.The equipment includes a comparator type differential amplifier with an
4e
Figures in brackets indicate the literature references at the end of
this paper.
adjustable offset voltage control for comparison of the alternatingsignal from the test bars with a reference voltage signal. Due to the
wide dynamic range of this unit, it was possible to expand the effectivescreen height of a conventional type oscilloscope by several orders of
magnitude to permit voltage measurements to be made with high resolution.
2. Fatigue Machine Characteristics
it
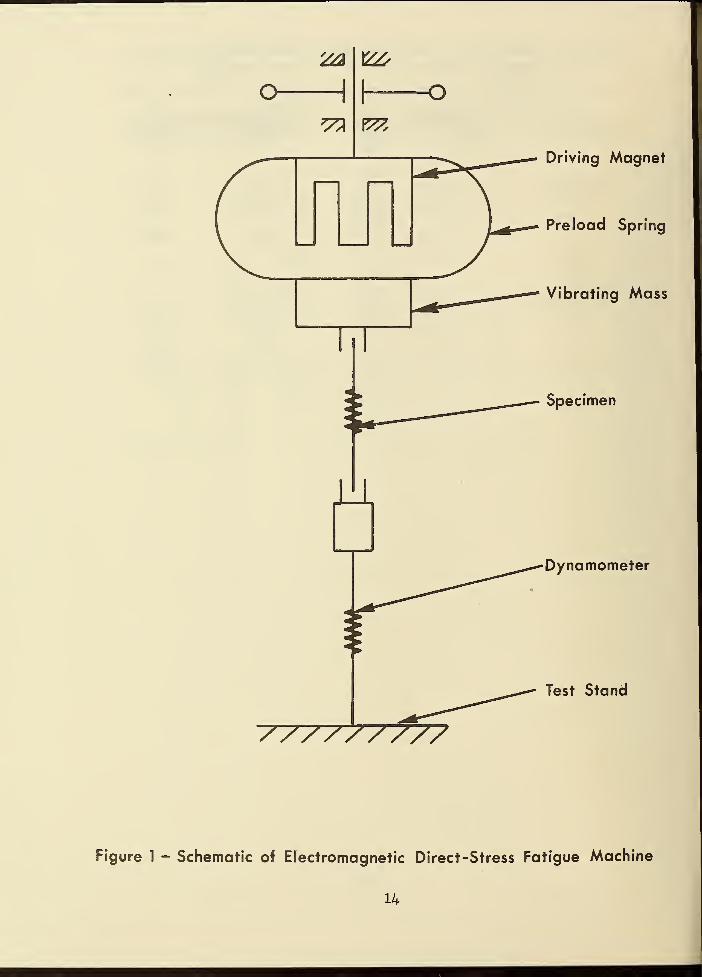
The machine used in this investigation is a 15 ton capacity, elec-tromagnetic, direct-stress fatigue machine which operates at the resonantfrequency of the vibrating parts. A schematic of the test machine is
shown in figure 1. The principal oscillating members consist of a mainmoving mass which oscillates on the specimen and dynamometer connected in
series. The output from the impulse generator, fixed between the speci-men and dynamometer, is amplified and fed back to the driving magnet to
maintain operation of the machine at the resonant frequency. The testfrequency is varied by manually altering the moving mass.
The deflection of the dynamometer was measured visually by a beam of
light which indicated the static and dynamic loads directly on a scale.
The static loads were indicated by a sharp line of light and the dynamicloads were indicated by a band of light. The mean load, which appearedas a narrow line when the machine did not oscillate, corresponded to theaverage of the extreme values of the light band during operation of themachine. The load range was controlled automatically by means of a
photo-electric regulating device actuated by the light beam of the dyna-mometer and thereby controlling the power input to the electrical drive.
When a fatigue machine is in operation, sources of error in load mea-surements appear due to unrecognized inertial forces. These forces are
caused by the flexibility of elastic members and the complicated distri-bution of masses within a machine. According to the manufacturer's oper-ating manual for the machine investigated, transverse and torsionalparasitic oscillations may occur in addition to the desired longitudinaloscillation. By control of the geometry and location of the main movingmass, it is usually possible to keep such parasitic frequencies away from
the actual test frequency. The longitudinal frequency of all the oscil-lating elements of the dynamometer is well above the operating frequency
range of the machine. The highest operating frequency is governed bycritical frequencies of the upper crosshead which makes control of the
machine difficult at a test frequency above 200 Hz. An investigation of
the dynamic load indication of the dynamometer is given in reference 3.
In this study it was found that the differences between the loads
U. S. customary units are used throughout this paper since these are
the units most frequently used in fatigue testing work in the U. S. Con-version to SI units can be made by use of the relationships found in ASTMStandard Metric Practice Guide, ASTM Designation: E 380-70 (available
from American Society for Testing and Materials, 1916 Race St., Philadel-phia, Pa. 19103).
indicated by an instrumented specimen and the dynamometer at high testfrequencies was caused by the mass of the dynamometer and the grippinghead carried at its end.
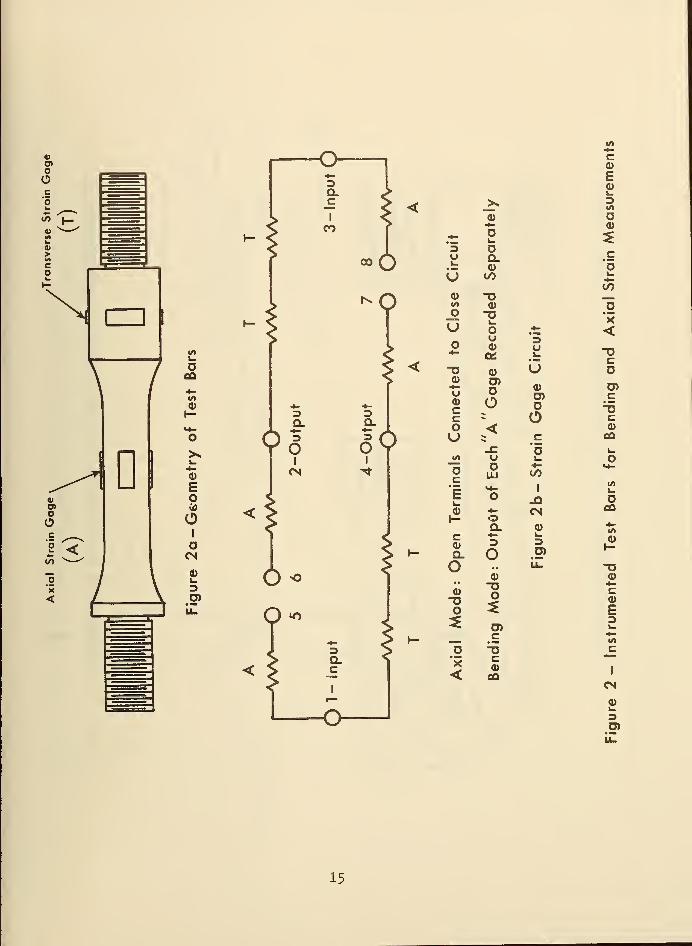
3. Test Bar Design
Three test bars were used to determine the dynamic loads in thefatigue machine for a range of specimen stiffnesses. The diameters ofthe reduced section of the bars were 0.375 in, 0.500 in and 0.750 in andtheir capacities were 4,500 lbf, 6,500 lbf and 15,000 lbf, respectively.The bars were fabricated from type AISI 4150 steel and their load capac-ity was based on a design stress of 41,000 lbf/in 2
. The geometry of thetest bars is given in figure 2a.
Strain gages were attached to the bars in a manner which permitteddetermining the bending due to misalinement as well as measuring theaxial loads while the bars were installed in the fatigue machine. Thegage circuit designed for this purpose is shown in figure 2b. This cir-cuit permitted measuring the output of each of the axial gages separatelyto determine bending in the bar or, by connecting 5 to 6 and 7 to 8, de-termining the combined strain of the four active gages due to appliedaxial loads. Connectors with silver plated contacts and shielded cableshaving the shield grounded were used to simplify the measurement processand minimize noise signals.
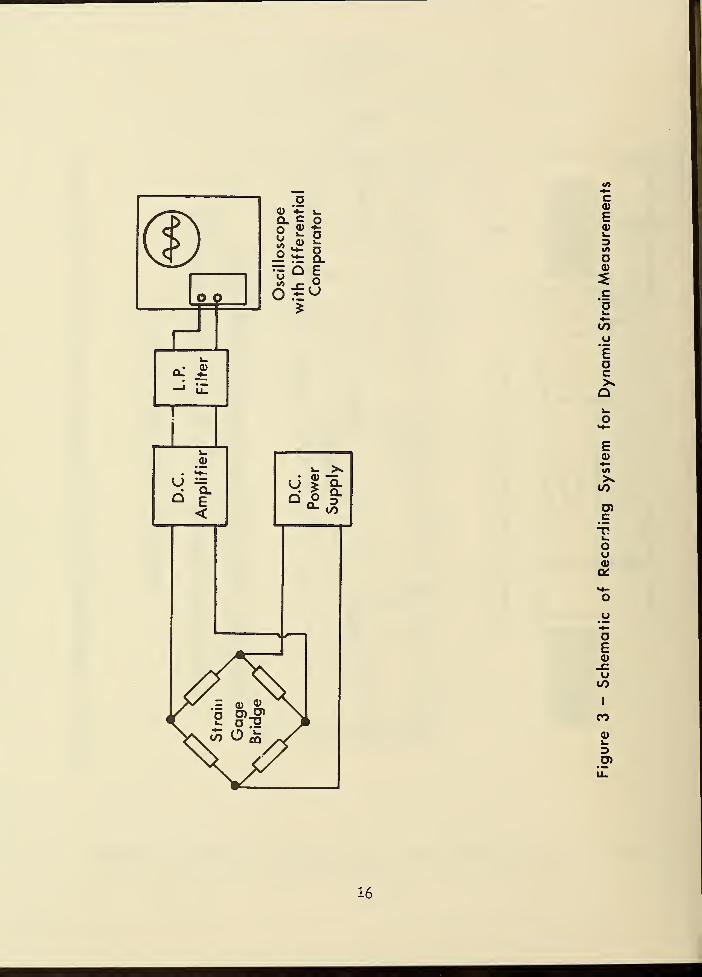
4. Instrumentation
A portable strain indicator and a switching and balancing unit wereused to determine the amount of bending in the test bars due to eccentricloading while they were installed in the machine. For measuring the
average axial strain, the power for the strain gage bridge was providedby a regulated d-c power supply. The recording equipment for the cyclic
load measurements consisted of a d-c amplifier, a low-pass filter to sup-
press noise components, and a conventional oscilloscope with a plug-inunit having modes as a differential comparator and as a differential pre-
amplifier [4] .
When used as a differential comparator, the plug-in unit has an ad-
justable d-c offset voltage control for comparison of an input signal
with respect to a reference signal established within the unit. Princi-
pal requirements for this equipment were (1) negligible drift of the
reference signal, and (2) capacity for measuring the lowest signals of
interest, in the order of 100 millivolts. The unit employed in this in-
vestigation had a recently improved solid state source follower stage for
achieving stability of the reference signal. The measured drift after
warm up was within 400 microvolts per hour at room temperature. Similar
amplifiers having greater trace stability were not compatible with the
recording oscilloscope used. A schematic of the measurement system is
shown in figure 3.
The comparison voltage amplitude could be read to four significantfigures on a graduated dial. The accuracy of the comparison voltagereading of the comparator amplifier was evaluated by correlating its out-put with that of a four digit precision voltmeter as a constant voltagewas applied. The manufacturer's stated accuracy for the comparison volt-age was ±0.15 percent of the indicated value plus 0.05 percent of the
full scale range. The full scale range used during the load measurementsfor the fatigue machine was ±1.1 volts. The indicated voltage on thecomparator unit was found, on the average, to occur within 0.03 percentof the digital voltmeter value within this voltage range.
5. Measurement Procedure
5.1. Static Machine
The test bars were calibrated statically by determining their re-
sponse to a series of axial loads in a 20,000 lbf capacity universaltesting machine. The errors in static calibration for the latter ma-chine were less than 1 percent, and it complied with the requirements of
ASTM Method E4 [5]. After inserting the test bar in the machine, the
bending in the bar due to eccentric loading was determined by measuringthe axial strain using the strain indicator and switching and balancingunit. The bar and threaded members connecting it to the machine fixtureswere oriented and alined until the strain indicated by any one of the
axial gages did not vary by more than 4 percent from the mean strain in-dicated by all the gages.
The response of a bar to static loads was determined in the orien-tation where the bending was found to be minimum. Loads were applied in
5 or 6 increments up to the capacity of the bar. Several series of read-ings were taken using different sensitivity ranges of the differentialcomparator unit and different values for amplification and filter cutofffrequency. The values of these test parameters which would be used dur-ing dynamic load measurements could not be determined in advance.
The output voltage from the gaged test bars was measured using a
"slide-back" feature of the differential comparator unit. For this mea-surement, the display switch of the unit was placed in the A-V
cmode,
where A is the input and V is an adjustable d-c comparison voltagewhich is added differentially to the input signal. A reference line for
this measurement was established before the test bar was loaded by posi-tioning the trace on the oscilloscope at the center of the screen for
the highest sensitivity range which could be conveniently used. For the
static tests this range was 5 to 10 mV/cm. After the load was applied
to the bar, the comparison voltage was adjusted to slide the signal from
the test bar to the reference line. Curves were then plotted of the re-
lationship between the static load and test bar electrical output.
These curves were used to determine the dynamic loads during cyclicloading tests.
5.2. Fatigue Machine
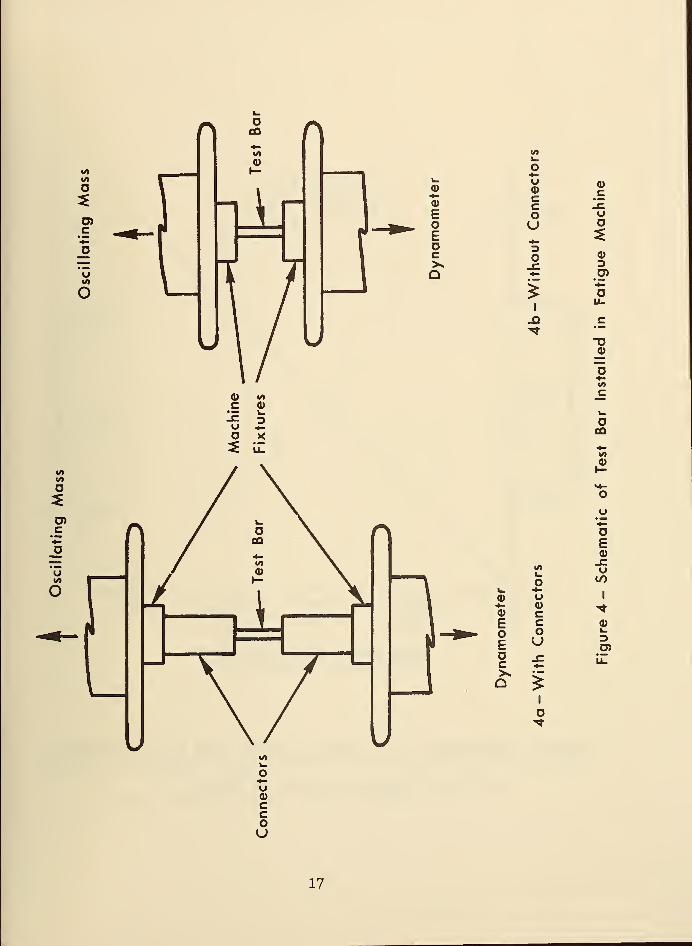
The alinement and voltage measurements in the fatigue machine weremade in essentially the same manner as during the static tests. Gen-erally, the test bars were installed directly into the machine fixturesby the use of appropriate bushings. For this arrangement, it was pos-sible to orient and aline a bar until the strain indicated by any oneof the axial gages did not vary by more than 5 percent from the meanstrain indicated by all the gages. For one test arrangement, additionalfixtures (connectors) were used to install a test bar into the machinein order to determine the influence of the additional fixture massplaced between the specimen and machine dynamometer. Due to the addedplay introduced between mating parts when using these connectors, it waspossible to aline the bar so that the strain indicated by any one of theaxial gages was within 3 percent of the mean strain indicated by all ofthe gages. Schematics showing the two test arrangements are given infigure 4.
In the determination of the loads indicated by the test bar undercyclic loading, the comparison voltage was adjusted to slide the upperand lower peaks of the oscillating waveform to the reference line. Theoffset voltage values were recorded and the corresponding loads weredetermined by use of curves plotted for the output voltage versus thestatic load. The polarities for the upper and lower portions of thewaveform were established by a range switch in the comparator unit.
In order to obtain an adequate sensitivity range for the compari-son voltage measurement, it was necessary during some of the tests to
adjust the reference line on the oscilloscope to some voltage greaterthan zero. Generally, it was possible to use the 10 mV/cm range of the
comparator unit. Although the noise level was high while the machinewas running, spurious signals due to the noise were suppressed by thelow pass filter whose cutoff frequency was set at 300 Hz, well above thetest frequency range.
The test bars were generally installed directly into the fatiguemachine using bushings supplied with the machine. In this arrangement,the lower end of the specimen was in the immediate proximity of the up-per end of the machine dynamometer and the bushing mass was negligible.For some fatigue tests, however, it is convenient to employ the connec-tors to facilitate rapid installation and removal of specimens. Theseconnectors are sometimes large and since it was known that such a massintroduced between the specimen and dynamometer can influence the loadmeasurement, one set of tests was made using the connectors for the
0.375 in diameter test bar.
6. Results
Because of the different capacities of the test bars, the loadrange varied for each bar. For the 0.750 in diameter bar, the portionsof the load range investigated were 300 - 3000 lbf, 600 - 6000 lbf, 900 -
9000 lbf, 1200 - 12,000 lbf, and 1500-15,000 lbf. For the 0.500 in di-ameter bar, the load ranges investigated were 300 - 3000 ltf, 450 - 4500lbf, and 600 - 6000 lbf. For the 0.375 in diameter bar, load ranges of150 - 1500 lbf, 300 - 3000 lbf, and 450 - 4500 lbf were investigated.The ratio of the minimum to maximum load of 1:10 is often used in fa-
tigue testing of airframe fasteners. The minimum loads were selected in
multiples of 150 or 300 lbf which were found to be convenient incrementsfor the 15 ton capacity dynamometer used.
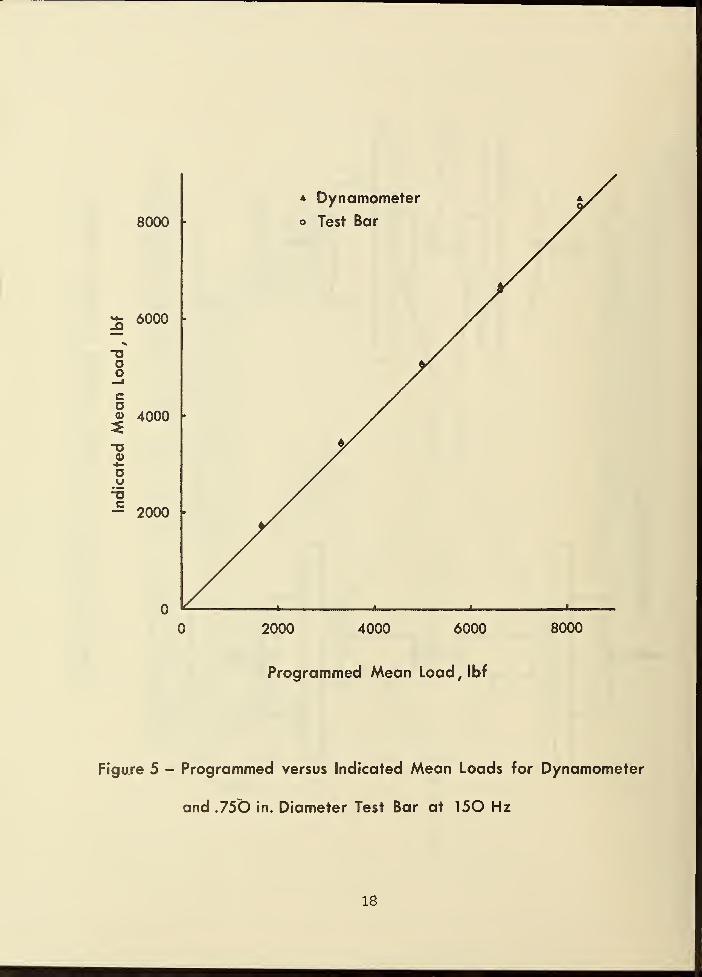
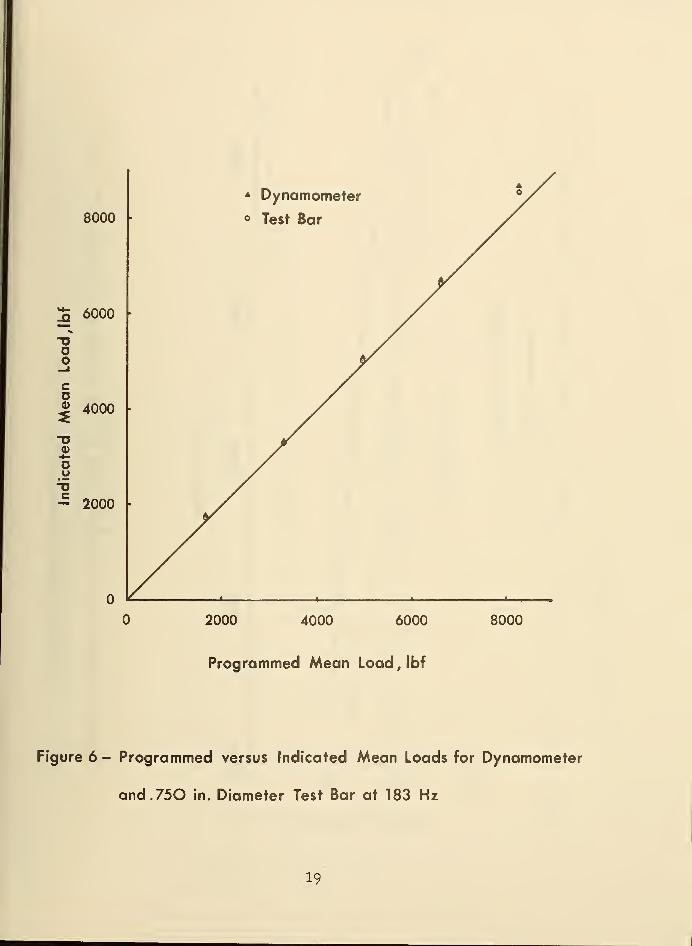
A comparison of the programmed and indicated mean loads determinedusing the 0.750 in diameter test bar is given in table 1 for test fre-quencies of 150, 183 and 200 Hz. The data for frequencies of 150 and183 Hz are plotted in figures 5 and 6, respectively, to show the rela-tion between the programmed mean loads and those indicated by the machinedynamometer and test bars. A solid 45 degree line is plotted in thesefigures showing the locus of points where the programmed and indicatedloads would be exactly correlated. No data were recorded at the highestload range at 200 Hz due to difficulty in operating the machine at thisfrequency.
Test frequencies of 142, 162 and 195 Hz were obtained when usingthe 0.500 in diameter bar. A comparison of the programmed and indicatedmean loads using this test bar are given in table 2.
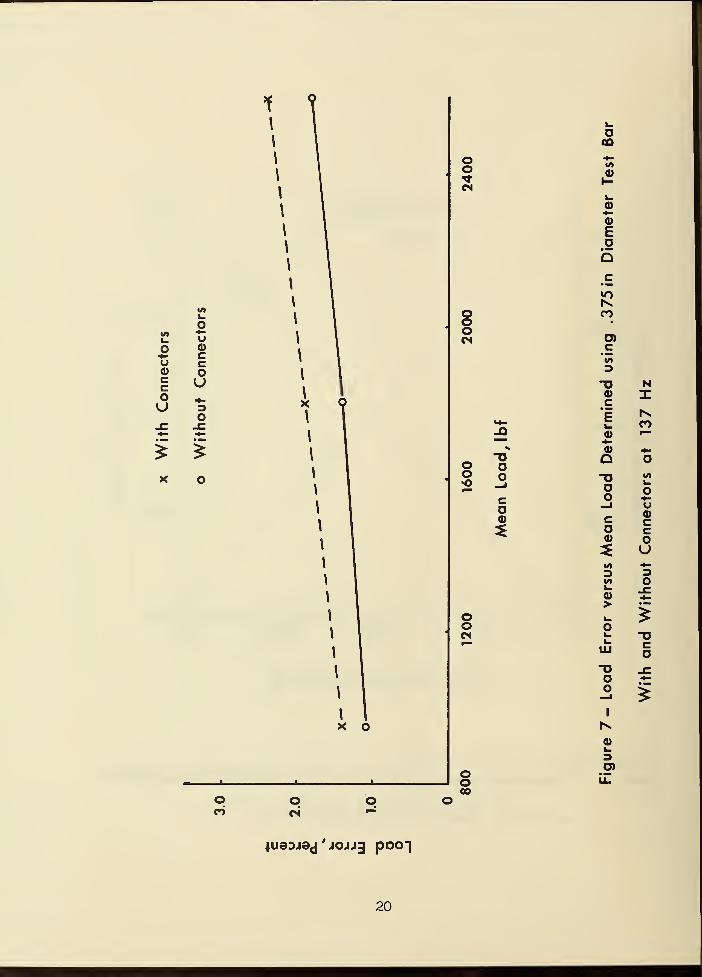
The test frequencies when using the 0.375 in diameter test bar were125, 137 and 167 Hz. A comparison of the programmed and indicated meanloads when using this bar are given in table 3. This data and the pre-viously tabulated results were taken when the test bars were installeddirectly into the machine fatigue fixtures. The tests run at 137 Hzwere repeated with the test bar inserted in the connectors. The differ-ence in the loads measured for both installations are listed in table 4
and are plotted in figure 7.
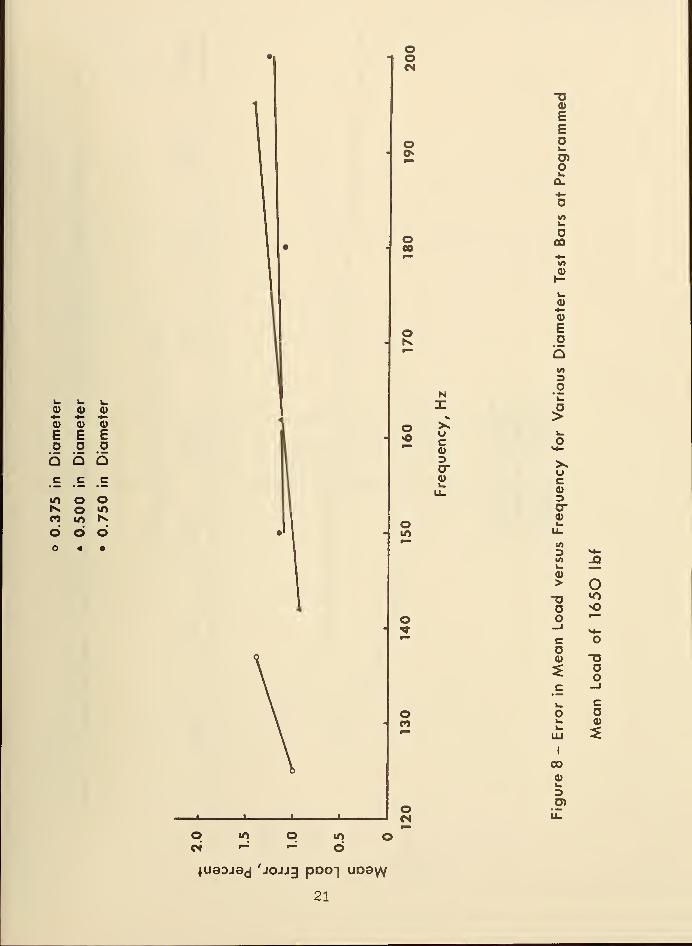
In figure 8, the mean load error is plotted against the test fre-
quency for the three size test bars at a programmed mean load of 1650
lbf. This error is defined as
Mean Load (Programmed Mean Load) - (Indicated Mean Load) „
Error (percent) Indicated Mean Load
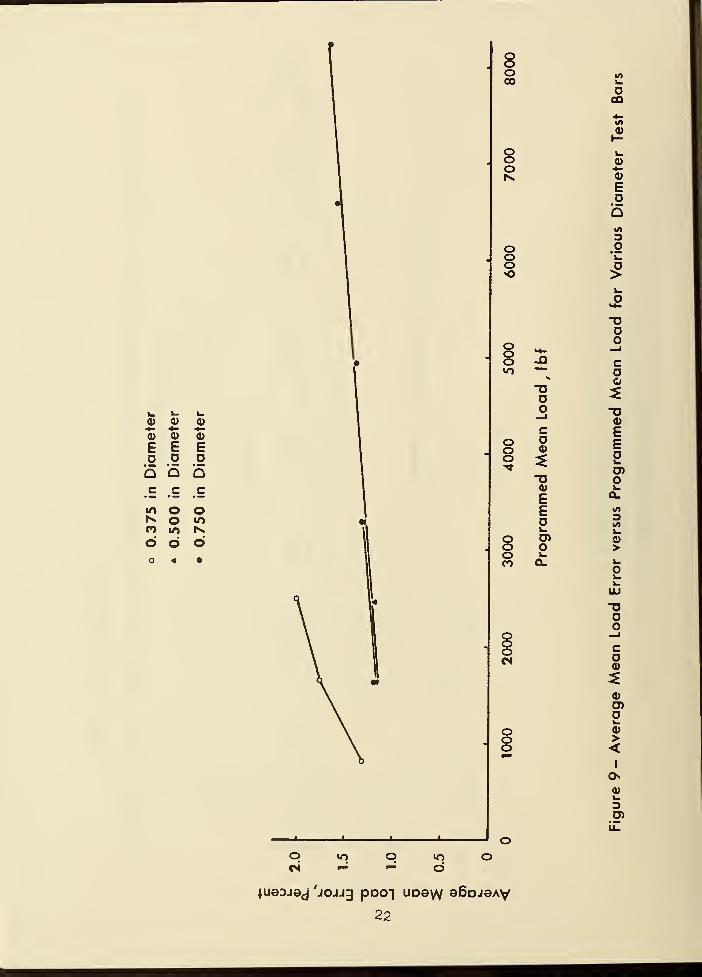
The average of the mean load error of the test bars at various test fre-
quencies is plotted against the programmed mean load in figure 9.
7. Discussion
A test procedure is presented which can be used to provide moreaccurate measurement of load data during fatigue tests. By accuratelyrecording the dynamic signals from instrumented test bars simulatingtt t specimens and comparing these signals with the output of the ma-chine dynamometer, it is possible to provide corrections to account forsuch variables as specimen stiffness and changes in the test fixturemass. A specialized component of the recording system is a differentialcomparator amplifier used to increase the resolving power of an oscillo-scope and to provide a reference voltage with which to compare the elec-trical output of the test bars. Using the maximum sensitivity which maybe achieved, the displayed signal amplitude is magnified by severalorders of magnitude, thus increasing the effective oscilloscope screenheight. To implement this procedure, it is necessary to ensure that thevoltage reference has adequate stability for the environment in whichthe equipment is used.
When reading the optical dynamometer while the fatigue machine wasoperating, it was sometimes difficult for the operator to determine theloads in a consistantly reliable manner. Reading errors could perhapsbe reduced by photographing the light beam projected on the scale andthen examining a magnified portion of the photograph to determine theload. Since the dynamometer readings when using the 0.375 in and 0.750in diameter bars were taken by one machine operator and the data for the0.500 in diameter bar by a second operator, some of the difference inthe loads determined when using these bars may reflect the operator'sability to read the dynamometer. The use of a lower capacity dynamom-eter would perhaps have enabled the operator to determine the loads in-
dicated on the light scale with somewhat better resolution than the 15
ton capacity dynamometer employed.
The dynamometer and the optical scale for the machine described in
this paper are calibrated under static loading by inserting a measuringspring designed by the manufacturer in place of a specimen. It is rec-
ommended that the dynamometer be sent to the manufacturer for checkingif its readings deviate by more than 1.5 percent from the indications of
the spring. The overall uncertainty in the calibration of the instru-
mented test bars is estimated to be not more than 1.2 percent. The com-parison between the two load measuring devices was complicated somewhatby the difficulty in reading the machine dynamometer and controlling the
load. The comparison would have been more direct if both devices werestrain gage based transducers.
The mean loads indicated by the dynamometer were larger than thoseindicated by the test bar. This has been found to be characteristic ofthe type machine investigated [6]. The load errors, due to the differ-ence in the loads indicated by the dynamometer and test bar, increasedwith the test speed. Further investigation would be required to verifythe apparent tendency for the load errors to increase with the cyclicload range. The load error was found to be greater when the 0.375 in

diameter test bar was inserted in the connectors than when it was in-
stalled directly in the machine fixtures by use of small bushings. Dueto the relatively smaller difference between the loads indicated by the
dynamometer and the largest two bars, the load errors determined for the
two conditions of fixturing might have been less for the larger bars.
The manufacturer of the fatigue machine supplies correction termsfor each dynamometer used with a particular machine. As the results of
this investigation and related studies have shown, it is necessary to
account for the influence of any mass introduced between the dynamometerand the specimen in applying corrections to load measurements due to un-
desired inertial effects [6,7].
The results of this investigation indicate that the difference be-tween the loads indicated by the machine dynamometer and the test barsvaried with the size, and therefore the stiffness, of the bar. As notedin reference 6, changes in the specimen stiffness cause the dynamicproperties of the entire vibrating system to be altered. Furthermore,the influence of the specimen stiffness on the load errors may dependon the position of the specimen in the mass-elastic arrangement of the
machine. It is therefore generally necessary to determine a range of
test bar sizes, which may be considered representative of the fatiguespecimens to be tested, during the calibration of a particular fatiguemachine [2]
.
The author is indebted to Mr. G. Meyer of Standard Pressed SteelCompany for permission to conduct tests on fatigue equipment at their
plant in Jenkintown, Pennsylvania. The valuable assistance of Mr. R.
E. Snyder in the construction of the test bars and Mr. G. D. Boswell in
conducting the tests is gratefully acknowledged.
8. References
[1] Weibull, W. , Fatigue Testing and Analysis of Results (PergamonPress, 1961).
[2] International Organization for Standardization, Draft proposalfor dynamic force calibration of direct stress fatigue testingmachines, ISO/TC 17/WG 1 (Secretariat-165) 324 (May 1969).
[3] Russenberger, M. and Foldes, G. , High-speed universal testingmachine, verification of statically calibrated mechanical-opticaldynamometer, Experimental Stress Analysis, 1_2, No. 2 (1955).
[4] Middlebrook, R. D. , Differential Amplifiers, John Wiley & Sons
(1963).
[5] ASTM Designation: E 4 - 64 , Standard methods of verification of
testing machines, ASTM Book of Standards, Part 31 (1967).
[6] Serensen, S. V., Garf, M. E. and Kuz'menko, V. A., The Dynamicsof a Fatigue-Testing Machine (1970) . Translated from Russian(1967 publication). TT 70-50033. Available from NationalTechnical Information Service, Springfield, Va. 22151.
[7] Schloss, F. , Recent advances in mechanical impedance instrumen-
tation and applications, David Taylor Model Basin Report 1960
(Feb. 1965).

Table 1 - Comparison of Programmed and Indicated Mean LoadsDuring Cyclic Loading Using the 0.750 in DiameterTest Bar
Test Pre)grammec I loadMean
Indicated mean loadfrequency Range Dynamometer Test bar
Hz lbf lbf lbf lb~f
150 300 - 3,000 1650 1760 1740
600 - 6,000 3300 3500 3460
900 - 9,000 4950 5125 5070
1,200 - 12,000 6600 6730 6630
1,500 - 15,000 8250 8520 8380
183 300 - 3,000 1650 1800 1780
600 - 6,000 3300 3350 3310
900 - 9,000 4950 5120 5050
1,200 - 12,000 6600 6775 6670
1,500 - 15,000 8250 8350 8115
200 300 - 3,000 1650 1390 1372
600 - 6,000 3300 3325 3275
900 - 9,000 4950 - -
1,200 - 12,000 6600 6825 6710
Mean load1
2
rPmax
+ P .mm*
10
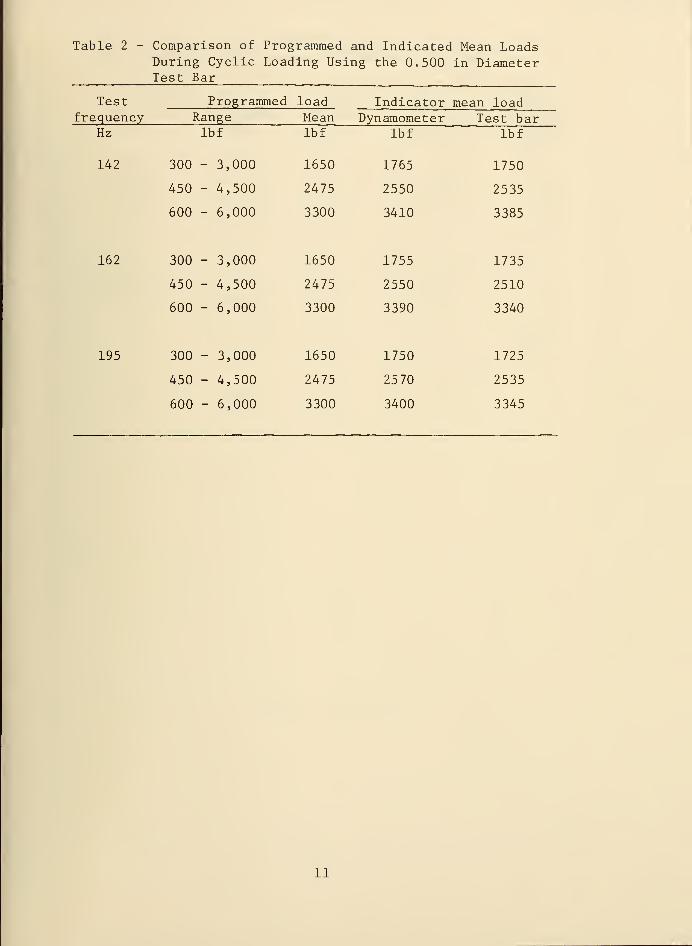
Table 2 - Comparison of
During CyclicTest Bar
ProgLoad
rammed and
ing UsingIndicatec
the 0.500Mean Loadsin Diameter
Test ProgrammedRange
loadMean
Indicator mean loadfrequency Dynamometer Test bar
Hz lbf lbf lbf lbf
142 300 - 3,000 1650 1765 1750
450 - 4,500 2475 2550 2535
600 - 6,000 3300 3410 3385
162 300 - 3,000 1650 1755 1735
450 - 4,500 2475 2550 2510
600 - 6,000 3300 3390 3340
195 300 - 3,000 1650 1750 1725
450 - 4,500 2475 2570 2535
600 - 6,000 3300 3400 3345
11
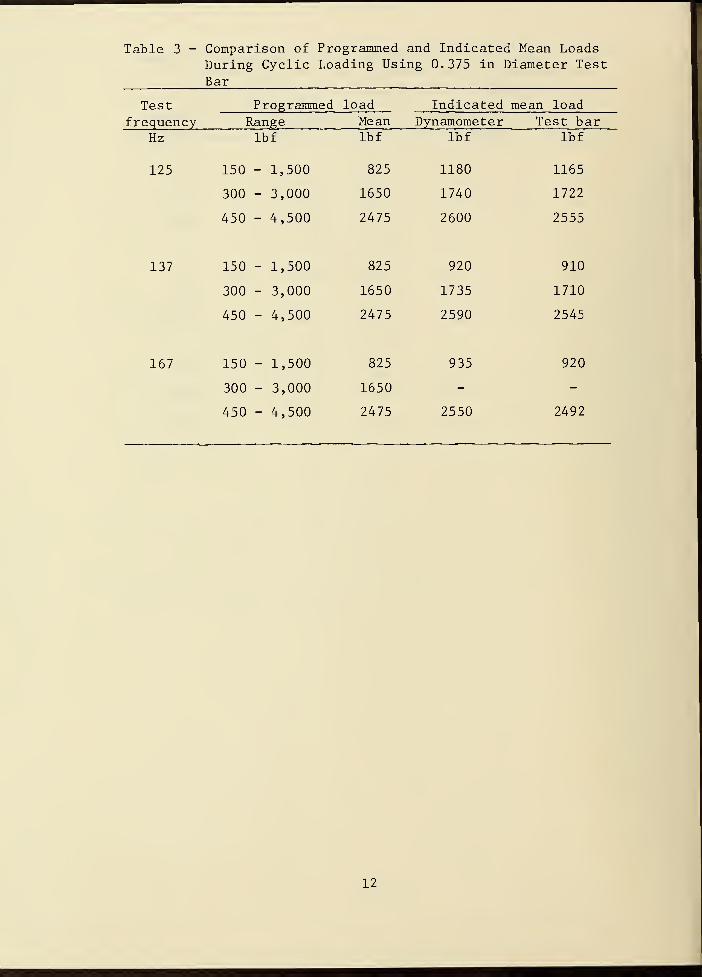
Table 3 - Comparison of Programmed and Indicated Mean LoadsDuring Cyclic Loading Using 0.375 in Diameter Test
Bar
Test
frequency
Programmed load Indicated mean load
Rang e Mean Dynamometer Test barHz lbf lbf lbf lbf
125
137
167
150 - 1,500 825 1180 1165
300 - 3,000 1650 1740 1722
450 - 4,500 2475 2600 2555
150 - 1,500 825 920 910
300 - 3,000 1650 1735 1710
450 - 4,500 2475 2590 2545
150 - 1,500 825 935 920
300 - 3,000 1650 - -
450 - 4,500 2475 2550 2492
12
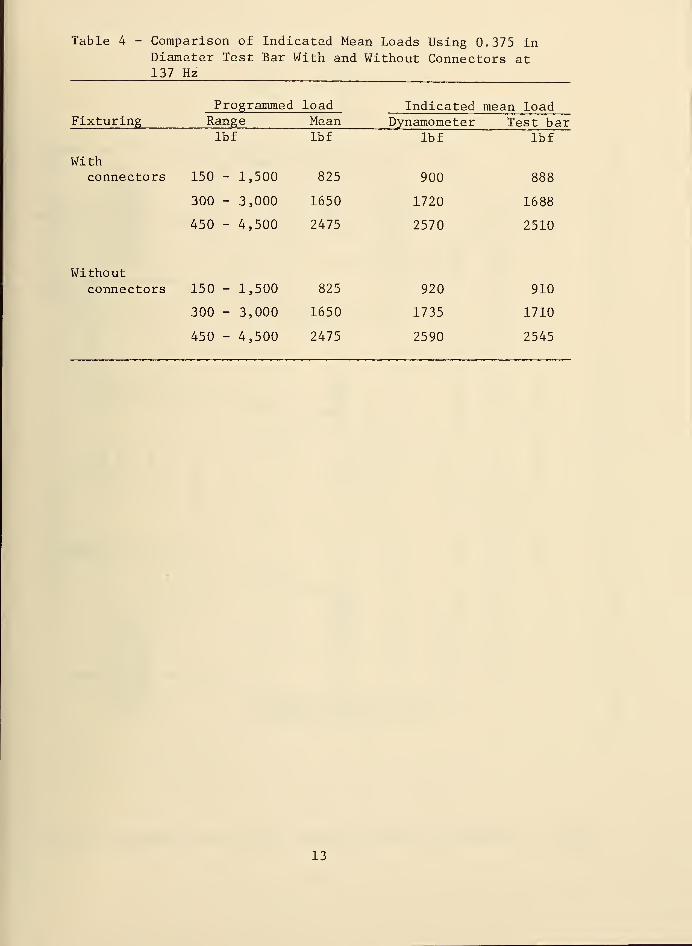
Table 4 - Comparison of Indicated Mean Loads Using 0.375 inDiameter Test Bar With and Without Connectors at137 Hz
ProgrammedRange
loadMean
Indica ted mean loadFixturing Dynamometer Test bar
lbf lbf lbf lbf
Withconnectors 150 - 1,500 825 900 888
300 - 3,000 1650 1720 1688
450 - 4,500 2475 2570 2510
Withoutconnectors 150 - 1,500 825 920 910
300 - 3,000 1650 1735 1710
450 - 4,500 2475 2590 2545
13
20
a^
V6
W7,
Driving Magnet
Preload Spring
Vibrating Mass
Specimen
Dynamometer
Test Stand
Figure 1 - Schematic of Electromagnetic Direct-Stress Fatigue Machine
14
00
3u
O
0)
o>sL.
0)
Eo&O
I
oCN
<Di_
3O)
6 *
«o
oc
'i
c
Q_
Oa>
o
o*x<
0)
ooa.
i_0)
u CO
0) "D«/> 0)ou O ^_
ou 3
U* az l_
"D <D Ua> U)ua>cc
aO
0)
^ Oo <u c
u
o
3o
O
O)#c
ca)
co
CO
l
i_
3
c<u
Ei_
3«/>
o
c'5
CO
'x<-acao>c
0)
CO
oCO
to
a>
ca>
E3
I
CN
0)
O)
15
c0)
Eok-
3«/>
O0)
c'oL.
COu'ioc>sQ
Ea>
CO
O)
ou0)
O
OEa)
_cuCO
I
CO
(1)
J-
3
16
ua>ccoV*-
o
I
JQ
a>
#cIEuo
3
c
oCO
o%EoEoc
a
ua>ccou
o
o
u
oE0)_cutO
I
^r
a>i_
3
u<D
CCou
17
8000
^ 6000
OO
c
J 4000
a>
o
- 2000
2000 4000 6000 8000
Programmed Mean Load,lbf
Figure 5 - Programmed versus Indicated Mean Loads for Dynamometer
and .750 in. Diameter Test Bar at 150 Hz
18
8000
6000
oo
co* 4000
t>0)*-ou
- 2000
2000 4000 6000 8000
Programmed Mean Load,lbf
Figure 6 - Programmed versus indicated Mean Loads for Dynamometer
and.750 in. Diameter Test Bar at 183 Hz
19
</»
i-
o«/)
+-u uO 0)•4- cu c0) occ Uo ^.U 3
o_c -C^ ^
£ £X o
ooCN
ooo
g 1I °
co<D
3
Oocs
oCO
o
oo00
oCO
*-«/>
<Dt-
i_
0)+-0)
Eo
• ™«
oc
•—u->
hvCO
O)cv>3-D N0) XcE tv>- COo ^~^m0) .*.
Q o
"Oo oo -_l u
0)c co c0) o3 Uto ^3 3u> oi_ _c0) +->1_ £ob. "OLU c
oT3 _co *—
O £rs
4)k.3O)
4U9DJ9J 'JOJJ3 pDO"|
20
ooCM
oc*
0)
EEoi_
o
o00
0) a>^— ^— 4b0) 0) <u
E E Eo o oa Q ac c c
m o ors o oCO m rs
o o o
o
o>0
NI>suc0)3cra>
om
o
oCO
oCM
o
o00
a>
a)
ED5</>
3o
>suca)Dcra>
3w>u,
a>>
Oo
coa>
3
o
i
CO
o3
O
OO
ca
oCM
md
jusDjaj 'jojjg poo"| uoayy
21
o a> <D^D +• <^>
o a> a>
E E Eaa a Qc c c
m o oK o mCO m ko o o
8o00
ooo
oooo
1 5
ao
ooo
coo
<u
EEo
8 ?co Q-
oooCI
ooo
o00
a>
Eo5</>
g
5
OO—i
coo^a>
EEo
o
>u.
o
UJ
-Doo_l
coa>
O)ol.
a>><
o «od
lUQDJdtf 'jojjg pDO~| uosyv a6oJ3Ay
22

Latest developments in the subject area of this publication, as well as
in other areas where the National Bureau of Standards is active, are
reported in the NBS Technical News Bulletin. See following page.
HOW TO KEEP ABREAST OF IMBS ACTIVITIES
Your purchase of this publication indicates an interest in the research,
development, technology, or service activities of the National Bureau of
Standards.
The best source of current awareness in your specific area, as well as in
other NBS programs of possible interest, is the TECHNICAL NEWS BULLETIN,
a monthly magazine designed for engineers, chemists, physicists, research
and product development managers, librarians, and company executives.
If you do not now receive the TECHNICAL NEWS BULLETIN and would like to
subscribe, and/or to review some recent issues, please fill out and return the
form below.
sft
ET
i-tMail to: Office of Technical Information and Publications
National Bureau of Standards
Washington, D. C. 20234
Name
Affiliation
Address
City State Zip
| |
Please send complimentary past issues of the Technical News Bulletin.
| |
Please enter my 1— yr subscription. Enclosed is my check or moneyorder for $3.00 (additional $1.00 for foreign mailing).
Check is made payable to: SUPERINTENDENT OF DOCUMENTS.
TN 578
form NBS-1HA (i-7i)
U.S. DEPT. OF COMM.BIBLIOGRAPHIC DATA
SHEET
1. PUBLICATION OR REPORT NO.
NBS-TN-5782. Gov't Accession
No.
4. TITLE AND SUBTITLE
Determination of Dynamic Loads in a High-Frequency Direct- StressFatigue Machine
3. Recipient's Accession No.
5. Publication Date
June 19716. Performing Organization Code
7. AUTHOR(S)Donald C. Robinson
8. Petforming Organization
9. PERFORMING ORGANIZATION NAME AND ADDRESS
NATIONAL BUREAU OF STANDARDSDEPARTMENT OF COMMERCEWASHINGTON, D.C. 20234
10. Project/Task/Work Unit Nc
2130140
11. Contract/Grant No.
12. Sponsoring Organization Name and Address 13. Type of Report & PeriodCovered
NBS Technical Note
14. Sponsoring Agency Code
15. SUPPLEMENTARY NOTES
16. ABSTRACT (A 200-word or less factual summary of most significant information. If document includes a significantbibliography or literature survey, mention it here.)
A refined test procedure is given for accurately recording the dynamic signals frominstrumented test bars used to measure loads during simulated fatigue tests. Loads in-
dicated by the load transducer of a direct-stress fatigue machine are compared with thos^determined from these instrumented test bar specimens which have been calibrated understatic conditions* An application of this procedure is described for a resonant, elec-
tromagnetic, direct-stress fatigue machine having an optical dynamometer for indicating
programmed loads. The variables investigated were the operating speed, cyclic load and
specimen stiffness. In addition, the influence of test fixture mass on the load meas-
urements was determined at one test frequency. The mean loads indicated by the instru-
mented test bars are compared with those indicated by the dynamometer to determine the
errors in load measurements under various test conditions.
17. KEY WORDS (Alphabetical order, separated by semicolons)
Dynamic loads; dynamometer; fatigue machine
18. AVAILABILITY STATEMENT
|~x] UNLIMITED.
I |FOR OFFICIAL DISTRIBUTION. DO NOT RELEASETO NTIS.
19. SECURITY CLASS(THIS REPORT)
UNCLASSIFIED
20. SECURITY CLASS(THIS PAGE)
UNCLASSIFIED
21. NO. OF PAGES
2U
22. Price
3S cents
USCOMM-OC 66244-P71
v U. S. GOVERNMENT PRINTING OFFICE : 1971 131


NBS TECHNICAL PUBLICATIONS
PERIODICALS
JOURNAL OF RESEARCH reports NationalBureau of Standards research and development in
physics, mathematics, chemistry, and engineering.
Comprehensive scientific papers give complete details
of the work, including laboratory data, experimentalprocedures, and theoretical and mathematical analy-
ses. Illustrated with photographs, drawings, andcharts.
Published in three sections, available separately:
• Physics and Chemistry
Papers of interest primarily to scientists working in
these fields. This section covers a broad range of
physical and chemical research, with major emphasison standards of physical measurement, fundamentalconstants, and properties of matter. Issued six times
a year. Annual subscription: Domestic, $9.50; for-
eign, $11.75*.
• Mathematical Sciences
Studies and compilations designed mainly for the
mathematician and theoretical physicist. Topics in
mathematical statistics, theory of experiment design,
numerical analysis, theoretical physics and chemis-
try, logical design and programming of computersand computer systems. Short numerical tables.
Issued quarterly. Annual subscription: Domestic,
$5.00; foreign, $6.25*.
• Engineering and Instrumentation
Reporting results of interest chiefly to the engineer
and the applied scientist. This section includes manyof the new developments in instrumentation resulting
from the Bureau's work in physical measurement,data processing, and development of test methods.
It will also cover some of the work in acoustics,
applied mechanics, building research, and cryogenic
engineering. Issued quarterly. Annual subscription:
Domestic, $5.00; foreign, $6.25*.
TECHNICAL NEWS BULLETIN
The best single source of information concerning the
Bureau's research, developmental, cooperative andpublication activities, this monthly publication is
designed for the industry-oriented individual whosedaily work involves intimate contact with science andtechnology
—
for engineers, chemists, physicists, re-
search managers, product-development managers, andcompany executives. Annual subscription: Domestic,
$3.00; foreign, $4.00*.
* Difference in price is due to extra cost of foreign mailing.
NONPERfODICALS
Applied Mathematics Series. Mathematical tables,
manuals, and studies.
Building Science Series. Research results, test
methods, and performance criteria of building ma-terials, components, systems, and structures.
Handbooks. Recommended codes of engineeringand industrial practice (including safety codes) de-
veloped in cooperation with interested industries,
professional organizations, and regulatory bodies.
Special Publications. Proceedings of NBS confer-
ences, bibliographies, annual reports, wall charts,
pamphlets, etc.
Monographs. Major contributions to the technical
literature on various subjects related to the Bureau's
scientific and technical activities.
National Standard Reference Data Series.NSRDS provides quantitative data on the physical
and chemical properties of materials, compiled fromthe world's literature and critically evaluated.
Product Standards. Provide requirements for sizes,
types, quality and methods for testing various indus-
trial products. These standards are developed coopera-
tively with interested Government and industry groups
and provide the basis for common understanding of
product characteristics for both buyers and sellers.
Their use is voluntary.
Technical Notes. This series consists of communi-cations and reports (covering both other agency andNBS-sponsored work) of limited or transitory interest.
Federal Information Processing Standards Pub-lications. This series is the official publication within
the Federal Government for information on standards
adopted and promulgated under the Public Law89-306, and Bureau of the Budget Circular A-86entitled, Standardization of Data Elements and Codesin Data Systems.
Consumer Information Series. Practical informa-
tion, based on NBS research and experience, covering
areas of interest to the consumer. Easily understand-
able language and illustrations provide useful back-
ground knowledge for shopping in today's technolog-
ical marketplace.
NBS Special Publication 305, Supplement 1,
Publications of the NBS, 1968-1969. When order-
ing, include Catalog No. C 13.10: 305. Price $4.50;
foreign, $5.75.
Order NBS publications from: Superintendent of DocumentsGovernment Printing Office
Washington, D.C. 20402

U.S. DEPARTMENT OF COMMERCEWASHINGTON, D.C. 20230
OFFICIAL BUSINESS POSTAGE AND FEES PAIDU.S. DEPARTMENT OF COMMERCE
PENALTY FOR PRIVATE USE, $300