
Determinants of tax revenue performance in the Southern African … · Determinants of tax revenue...
28
The views expressed are those of the author(s) and do not necessarily represent those of the funder, ERSA or the author’s affiliated institution(s). ERSA shall not be liable to any person for inaccurate information or opinions contained herein. Determinants of tax revenue performance in the Southern African Development Community (SADC) Michael Ade, Jannie Rossouw and Tendai Gwatidzo ERSA working paper 762 August 2018
Transcript of Determinants of tax revenue performance in the Southern African … · Determinants of tax revenue...
The views expressed are those of the author(s) and do not necessarily represent those of the funder, ERSA or the author’s affiliated institution(s). ERSA shall not be liable to any person for inaccurate information or opinions contained herein.
Determinants of tax revenue performance
in the Southern African Development
Community (SADC)
Michael Ade, Jannie Rossouw and Tendai Gwatidzo
ERSA working paper 762
August 2018
Determinants of tax revenue performance inthe Southern African Development
Community
Michael Ade∗, Jannie Rossouw†and Tendai Gwatidzo‡
August 22, 2018
Abstract
This paper investigates the determinants of tax revenue perfor-mance in all 15 Southern African Development Community countriesduring 1990-2010, using panel data. The investigation makes use oftwo estimation techniques in testing for country specificity. Theseare the least squares dummy variables fixed effects and the feasiblegeneralised least squares by Park (1967) and Kmenta (1986). Theextreme-bound analysis technique is also used in delineating the var-ious causal relationships (including a sensitivity analysis). Prior tothe estimation process, the study tested and controlled for applica-ble errors in the panel such as endogeneity, serial correlation, cross-sectional dependence of the error term, group-wise heteroscedasticityand contemporaneous correlation. The process addressed some majorcritique of panel data estimations involving large and small economiesin a regional grouping like the SADC. The paper also introduces avalue added tax harmonisation variable (and additionally made useof the corporate income tax harmonisation variables) through a taxpolicy harmonisation measure in investigating the impact of foreigndirect investment and taxation on tax revenue collected. The resultsgenerally highlight the robust role of taxation (tax rates and tax pol-icy harmonisation variables) (alongside other important determinants)
∗Michael Ade is a PhD student at the School of Economic and Business Sciences, Uni-versity of the Witwatersrand. E-mail: [email protected] (corresponding author).†Jannie Rossouw is the head of the School of Economic and Business Sciences, Univer-
sity of the Witwatersrand E-mail: [email protected]‡Tendai Gwatidzo is an associate professor at the School of Economic and Business
Sciences, University of the Witwatersrand E-mail: [email protected]
1

in improving tax revenue in the region, providing empirical supportfor extant anecdotal evidence. The final empirical findings also con-firm the importance of FDI inflows towards tax revenue collected inthe SADC and the existence of reverse causality (that is, a causalrelationship between FDI and taxation or vice versa). Policy consid-erations include the need for SADC countries to carry out extensivepro-regional (coordinated) tax reforms, create a regional tax forumand promote initiatives aimed at improving FDI and ultimately taxrevenue (as per existing regional protocols).JEL Classification: E60; F15; H11 H20; H71Keywords: SADC and Tax Revenue Collected; Tax Policy Har-
monisation; Panel data; CSD; Sensitivity analysis.
1 Introduction
Taxation has been a topic of discussion for decades in the global arena ascountries strive to maximise tax revenue collection in order to raise the rev-enue needed for economic development without eroding the tax base. Anec-dotal evidence from different countries globally (including African countries)shows that most countries rely on FDI and taxation (effective tax rates andtax policy) to boost tax revenue collection (Deloitte and Touché, 2013).However, anecdotal evidence also indicates that half or more of the taxesthat could be collected remain uncollected and/or unaccounted for, due toa combination of tax incentives, tax inversion, tax evasion and avoidance,tax exemptions and corruption in general (Fuest and Riedel 2009). Conse-quently African countries (including Southern African Development Commu-nity (SADC1) countries) have been considering additional robust means ofmobilising tax revenue2 (as part of a broader Domestic Resource Mobilisa-tion (DRM) initiative3) in order to collectively meet revenue targets. This is
1The SADC consists of Angola, Botswana, DR Congo, Lesotho, Madagascar, Malawi,Mauritius, Mozambique, Namibia, Seychelles, South Africa, Swaziland, Tanzania, Zambiaand Zimbabwe (SADC, 2011).
2Tax revenues in Africa have been positively trending (2001-2013), strongly comple-menting total external flows as an additional source of finance. However, there’s still aneed to improve on revenue especially as most Sub-Saharan African (SSA) countries (in-cluding some SADC countries), collect tax revenues at levels below 20% of GDP (AEO,2013; 2015). The recommendation is that the SADC countries raise their tax-to-GDP ra-tios by roughly four percentage points if they intend to meet the UN’s development goalsand other developmental imperatives by 2030 (UN, 2012).
3This includes increasing and enhancing domestic savings (both private domestic andpublic savings), improving financial sector performance, and also enhancing public sectorrevenue collection and expenditure (including tax reforms) (UN, 2012).
2

in line with the general agenda of enhanced fiscal policy coordination on thecontinent (African Economic Outlook (AEO) 2013).Effi cient means of taxation could help improve the governments’revenue
positions, reduce public sector borrowing requirement (PSBR), reduce de-pendency on aid, reduce over-reliance on commodity exports and increasecountries’ownership of their development agenda (AEO, 2013). Moreover,better tax management and revenue mobilisation could improve on tax rev-enue performance and reinforce the relationship amongst state-citizenry, in-cluding the private sector and civil society. Also, there is increased confidencein the government’s ability to use tax revenue sparingly to provide basic ser-vices, providing a strong basis for trust in the government, leading to moretax compliance. This is often referred to as the fiscal exchange propositionor the quid pro quo (that is, in return for paying taxes, a citizen expectsquality service delivery) (Fjeldstad, Schulz-Herzenberg and Sjursen, 2012).The objective of this paper is to investigate empirically the determinants
of tax revenue performance in the SADC using panel data for the period 1990to 2010. The paper represents a first attempt at investigating the impact ofFDI flows (including bi-directional causal effect or reverse causality4), taxrates, tax policy harmonisation measure (TPHM) and other variables ontax revenue collection for all 15 member countries. The investigation buildson a previous study by Sudsawasd and Mongsawad (2011) who confirmedthe existence of a causal relationship between taxation and FDI in regionalgroupings globally. In addition, the paper tests the robustness and sensitivitylevels of tax revenue collected to changes in capital flows and taxation (taxrates and tax policy harmonisation) on revenue positions in the SADC. Theempirical findings could generally assist in providing more policy options fortax administrators and policy makers aimed at maximising tax revenue inregional groupings.The rest of the study is organised as follows: Section 2 entails a brief
literature review. Sections 3 and 4 present the data, study methodology andempirical results. Section 5 presents the robustness and sensitivity analyses.Section 6 concludes the study.
2 Review of literature
The Heller (1975) and Leuthold (1991) applied tax models generally offera framework which accounts for the effects of economic policies (including
4Reverse causality occurs when a dependent variable can cause a change in one (ormore) explanatory variable and vice versa (Ramcharan, 2006).
3

policies on FDI), corruption and elements of the tax base on tax revenue col-lection (including tax performance). The Leuthold (1991) model specificallyassumed that the actual tax revenue-GDP ratio is a function of the desiredtax revenue-GDP ratio and the availability of certain tax bases (includingFDI, tax rates and tax policy); as well as the status of economic policies andthe tax level of corruption. That is:
T/Y = f {(T/Y )∗, B , E , C} (1)
Where T/Y is the actual tax revenue-GDP ratio, T/Y* the desired taxrevenue-GDP ratio, B refers to tax bases, E is economic policies and C isthe tax level of corruption.Effectively, increased FDI inflows expand the tax base (B), contribute to
growth and provide additional channels (together with the tax rates and taxpolicy) for improved tax revenue.The main offerings of the applied tax models have been complemented by
relative theories in support of this strand of tax literature. See for instancestudies by Gropp and Kostial (2001), Montiel (2003), Garikai (2009), Hinesand Summers (2009) and Mankiw, Weinzieri and Yagan (2009). The theorieshighlight the importance of choosing appropriate revenue instruments or taxhandles (tax bases) aimed at influencing tax performance.Anecdotal and theoretical evidence support the rationale for using tax
rates and tax administrative reforms to increase the amount of tax revenuecollected. However, a general increase in tax rates may have an adverse effecton revenue collection while a reduction in tax rates (coupled with expansionof the tax base) may help improve tax revenue. This is further explained bythe Laffer curve (Slavin, 2008; Trabandt, and Uhlig, 2011; Kazman, 2014)5.Policy makers are therefore encouraged to explore other means of tax rev-enue maximisation apart from increasing tax rates. For example, revenuegenerating potential for VAT can be maximised by instead expanding thebases (through both tax policy changes and improving compliance) ratherthan increasing standard VAT rates (IMF, 2009). This is consistent with themain offering of the revenue mobilisation model. The model highlights theimportance of two policy choice variables (namely, the definition of the taxbase or B and the tax ratio or TR) and three administrative related vari-ables (explicitly the size of the coverage ratio or CVR, the valuation ratio
5The Laffer curve generally shows that at a tax rate of 0%, the government wouldcollect no tax revenue, just as it would collect no tax revenue (TR) at a tax rate of 100%because of workers’unwillingness to work for an after-tax wage of zero. Slavin (2008),Trabandt and Uhlig (2011), and Kazman (2014) all argue that there is more than oneLaffer curve with various revenue and growth maximising points, thereby modifying themain premise of the original Laffer curve showing tax rate peaking at 50%.
4

or VR, and the collection ratio or CLR) in maximising tax revenue (Kelly,2000; IMF, 2009). The main proposition of the revenue mobilisation modelis applicable to tax policy in Africa (including the SADC). Given that inAfrica, " tax policy is tax administration6", the revenue mobilisation modelalso provides a useful framework for tax administration to complement taxpolicy in improving tax revenue collection (IMF, OECD, UN and WB, 2011).Theoretical models (including the neo-classical trade theory) focusing on
the effect that FDI has on a host country’s general welfare and tax revenueshowed that FDI could increase national welfare, particularly through in-creased tax revenue (Faeth, 2011). Welfare and revenue from FDI can alsobe improved by introducing an optimal tax on foreign-owned capital. Coun-tries could lose out on tax revenue when incentives are paid to multi-nationalenterprise (MNEs) or when transfer pricing (including other strategies tominimise taxes) is an issue (Faeth, 2011). The MNEs could set unreasonablyhigh transfer prices to avoid high taxes in the host country, thereby min-imising the host country’s welfare by worsening potential tax revenue andbalance of payments position.Ahmed and Muhammad (2010) investigate the determinants of tax buoy-
ancy (total response of tax revenue to changes in national income and dis-cretionary tax policy) in a number of developing countries. The authorsused panel data for 25 countries inclusive of seven African countries (Zim-babwe was the only SADC country included) for 11 years (1998-2008), andemployed the pooled least square method for result analysis. The findingsshowed that import, manufacturing sector, services sector, monetisation7 andbudget deficit influence positively the tax buoyancy, while growth in grantsimpact negatively on tax buoyancy.Palil and Mustapha (2011) examine the determinants of tax compliance
in Malaysia, aimed at improving tax revenue collection. The results sug-gested that tax knowledge has a significant impact on tax compliance and,ultimately, on revenue collection, even though the level of tax knowledgevaries significantly among respondents. The results also indicated that taxcompliance is influenced specifically by probability of being audited, percep-tions of government spending, penalties, personal financial constraints, andthe influence of referent groups. The findings generally align with Fjeldstadet al. (2012) who examined the key determinants of taxpayer compliance inAfrica, leading to improved tax revenue.
6That is, tax policy sets the framework within which the revenue administration mustoperate. In practice, the distinction between administration and policy is especially hardto make in developing countries (IMF, OECD, UN and WB, 2011:18).
7Also see arguments made by Montiel, (2003) and Musgrave (1969 and 1984) on theeffect of monitisation on tax performance and the choice of revenue instruments.
5

Gupta (2007) investigates the principal determinants of tax revenue per-formance across developing countries, including SSA, by using a broad datasetfor 120 countries. The results confirm that factors such as per capita GDP,trade openness and foreign aid significantly affect revenue performance ofan economy. Other factors include corruption, political stability and shareof direct and indirect taxes (specifically VAT). The paper also employs thefindings of a revenue performance index to argue that, with the current lev-els of tax rates and increasing tax competition in Africa, further increasesin tax rates (particularly on mobile production factors) are neither feasiblenor desirable8. Increase in tax rates result in tax avoidance and evasion, taxinversion and higher tax administrative and compliance costs for the revenueadministrations and businesses. Instead, broadening the tax base (and bring-ing the informal sector into the tax net) is a more effective way of generatingdomestic revenue and improving the perceived equity of the tax system9.This argument is consistent with both ActionAid and Eurodad (2011) andATAF (2012) who later proposed an element of regional co-operation or har-monisation in SSA countries, aimed at broadening the tax base and collectedtax revenue (ActionAid and Eurodad, 2011:5).Garikai (2009) examines the determinants of tax buoyancy in the SADC.
Using panel data for fourteen10 SADC countries during 1994-2005, the studyfound that monetisation, external aid growth and the growth of fiscal deficit(that is, increased government expenditure in relation to tax revenue col-lected) negatively affect annual tax buoyancy and tax performance in theSADC. The fiscal deficit increase can be reduced by limiting governmentexpenditure or raising tax revenues. Variables such as growth in the agri-cultural and industrial (mining and manufacturing) sectors and governmentexpenditure contributed positively to tax buoyancy; while trade openness(XM) and economic development (ECON) are found to be insignificant.Chaudhry and Munir (2010) and Muibi and Sinbo (2013) have also inves-
tigated the determinants of tax revenue performance and tax efforts. Mostprevious theories and empirical studies on tax revenue performance and taxefforts have focused on regional groupings in the rest of the world (ROW),with limited attention on Africa. The closest attempts made on the African
8Also, African countries like Burundi, Ethiopia, Guinea-Bissau and Zimbabwe did notrely much on raising tax rates on existing tax bases in order to improve tax revenue butinstead on broadening indirect tax bases (by taxing the shadow economy activities andeffectively collecting VAT).
9The recommendations generally align with that of both Robinson (2004) who investi-gated commodity tax reform in southern Africa and Mendoza (1998) who delineated theinternational ramifications of tax reforms10Madagascar is excluded due to lack of comprehensive country data for variables used.
6

continent were by Gupta (2007) and Garikai (2009), who scarcely employedFDI and tax variables in their investigations. Given the importance of FDI toAfrica11, there is need to understand how variations in FDI inflows, coupledwith tax rates and tax policy, influence the amount of tax revenue raised.Considering that the majority of African countries are increasingly usingthese orthodox means to raise revenue in order to improve on the budgetarypositions (and developmental requirements), the need to understand theireffectiveness becomes even more necessary.The concise survey of existing literature conducted thus far, highlights the
effectiveness of some factors (or determinants) affecting tax revenue perfor-mance and tax efforts globally and in Africa (including the SADC). However,no study has taken a keen interest in exploring the impact (and sensitivitylevels) of FDI flows (including bi-directional causal effect), tax rates and taxpolicy harmonisation variables on tax revenue collection in the SADC12. Thispaper intends to fill this gap in the tax literature. The analyses further buildon both Mesa and Para-Pena (2008); and Sudsawasd and Mongsawad (2011)(in particularly highlighting a seemingly one-way causal relationship betweentaxation and FDI); by further investigating a possible reverse causality.
3 Data source and methodology
All data series are obtained from the World Bank Development Indicators,the SADC online databases and the United Nations Conference on Trade andDevelopment (UNCTAD), complemented with data from the InternationalMonetary Fund (IMF).13 In the panel estimation process the investigationproduces two models; contrasts the empirical findings and provides insightsinto which set of variables (that is, FDI and existing tax rates or FDI andTPHM), are better in improving tax revenue in the SADC. The TPHM asmotivated by Sudsawasd and Mongsawad (2011:665) is specified as follows:
TPHi,t =τ i,t − τ̄ tτ̄ t
x100 (2)
Where TPH it is the tax policy harmonisation index for country i at timet, τ i,t is the tax rate for country i at time t, τ̄ is the group average, t is thetime.11As discussed in detail by UNCTAD (2006), Mijiyawa (2012), AEO (2013), and World
Bank (201312For further discussion see SADC (2002) and the African Economic Outlook (AEO)
(2013).13See Tables A.1 and A.2 of Appendix A, for the dataset (including data series mea-
surement) and economic expectations.
7

The study employs panel data14 estimation techniques, namely the LSDVfixed effects model (FEM) and the feasible generalised least squares (FGLS)by Park (1967) and Kmenta (1986) in testing for country specificity. Thetechniques are further complemented by Leamer’s (1983) extreme-boundanalysis (EBA) approach to perform a robustness test and sensitivity analy-sis.
3.1 Preliminary tests (full sample, 1990-2010)
Preliminary investigations (namely, unit root tests (URTs), Kao (1999) co-integration tests, descriptive statistics and cross-correlation analysis15) areconducted on the panel prior to the model specification, to test the relation-ships between the dependent variable (TREV) and explanatory variables.Selected UR tests which assume individual UR processes and accommo-date CSD (spatial dependence) to some extent16 (Baltagi, 2008) are applied.Specifically, the Im, Pesaran and Shin (IPS) (2003) test results (with bettersmall sample properties and intuitive construction) for both models denoteall variables to be stationary in first difference, that is I (1), (implying arejection of the null hypothesis). Other preliminary results illustrate the ex-tent, nature and depth of the relationships and the existence of a long-runco-integrating equilibrium relationship.
3.1.1 Initial diagnostic tests results (IDTs) - (models 1 and 2,sample 1990-2010)
Initial Diagnostic Tests (IDTs) are also conducted on the data to ascertainthe direction of the empirical modeling (see the entire tests results, includingresults for poolability, random effects, fixed effects, endogeneity and CSD inTable B.1 of Appendix B). The results reject the pool model and denote thatindividual or random effects are valid and time-specific effects are invalid inboth models 1 and 2. Consequently, the error term (µit) takes a one-way er-ror component form. The Breusch-Pagan (1980) LM test results suitable forlarge T (De Hoyos and Sarafidis, 2006:484) confirms the existence of CSD,groupwise heteroscedasticity and contemporaneous correlation in the errorterm of both models. The LM test for first-order serial correlation given
14See Baltagi (2008) for further exposition, including the merits of using panel data.15Cross-correlation results between tax revenue collected (TREV) and all explana-
tory variables FDI(0.16***), CIT1(0.08), VAT1(-0.25***), CHAR(0.05), VHAR(-0.01),DCR(0.08), EXPO(0.14***), GOV(0.54***), INF(0.01) are significant at (*)10%, (**)5%,(***)1%.16Namely, the IPS (2003) test and ADF-Fisher Chi-Square and PP-Fisher Chi-square
(Fisher) (1932) tests.
8

fixed effects is complemented by a second test for serial correlation in bothmodels - the Durbin-Watson statistics for panel data (despite large T). Bothtests reject the null hypothesis that the model is void of first-order serialcorrelation. The Hausman (1978) specification test fails to reject the null ofexogeneity. The IDTs results reveal no endogeneity between the regressorsand the error term of both models 1 and 2. However, the FGLS estima-tor (which is also perfectly suited to data with individual effects, groupwiseheteroscedasticity, contemporaneous correlation, serial correlation and inter-dependent cross-sections - CSD) is employed to control for limited (mild)form of endogeneity of the regressors (Park, 1967; Kmenta, 1986; Hicks,1994; Gupta, 2007).
3.2 Model specification and estimation technique (mod-els 1 and 2)
The investigation in this section of the study employs the LSDV model toaccount for country differences17, with specification as follows:
TREVit = X ′itβ +N−1∑J=1
δiDjit + µit (3)
Where TREVit = tax revenue share of GDP, Xit = the set of explanatoryvariables, β = the slope coeffi cient, Djit = the set of country dummies, µit= idiosyncratic error term. In the above LSDV specification, each individualcountry dummy "absorbs" the individual fixed effects ui that are hidden inthe error term uit = ui+vit. The LSDV model is complemented by the FGLSmodel.Empirical specifications:The final one-way model motivated by Sudsawasd and Mongsawad (2011)
and as directed by the IDTs results for models 1 and 2 are successivelyspecified as follows:
TREVit = α0 + β1FDIit + β2CIT1it + β3V AT1it + β4GOVit+ (4)
β5DCRit + β6EXPOit + β7INFit + µi + vit
17Given the wide divergences across countries in the SADC on most variables, generalisedexplanations (pooling) of findings are problematic. Cross-national variations thereforerequire a more detailed examination of country-specific factors (Fjeldstad et al. 2012).
9

TREVit = α0 + β1FDIit + β2CHARit + β3V HARit + β4GOVit+ (5)
β5DCRit + β6EXPOit + β7INFit + µi+
Where i in both specifications is the index for cross-section of country, tis the time index, TREVit is tax revenue collected, α is a simple constant,β1, β2. . .β7 are positive slope coeffi cients, FDIit is the FDI share of GDP ,GOVit is government expenditure, DCRit is the growth rate of domesticcredit, EXPOit is export share of GDP, INFit is inflation. In equation 3CIT1it is the statutory CIT tax rate, V AT1it represents the standard VATrates. In equation 4 CHARit is the statutory CIT policy harmonisationindicator, V HARit is the standard VAT policy harmonisation indicator. µiis the unobservable individual effect (country-specific effects) and vit is thestochastic disturbance (idiosyncratic error term). The error term µit is thesum of the above two components (µi and vit).Corrective interventions are made for errors in the panel including serial
correlation, heteroscedasticity and mild levels of endogeneity in tax models(Baltagi, 2008; Mesa and Para-Pena, 2008). In correcting for serial correla-tion the Prais-Winston transformation is used to transform correlated errorsinto serially uncorrelated classical errors. After correction, the model is ab-solved of serial correlation with better reconstructed Dp and improved DWstatistics. The Swamy and Aurora estimator for component variances andthe white diagonal standard errors and covariance (d.f. corrected) are used tocorrect for heteroscedasticity. Post the interventions; there is improvementin the standard errors and t-statistics. Having corrected for errors (and po-tential errors) in the panel, the respective estimated results are presented.
4 Empirical results (models 1 and 2)
Table 1 below presents the panel estimation results for models 1 and 2 derivedby estimating equations 4 and 5 on the full sample. The coeffi cients ofthe REM estimations in both models (which assumes µi to be orthogonalto the independent variables, that is, E(µit | Xit) = 0) ) and the LSDV1with fixed effects or ’within Q’estimations) are largely insignificant. TheLSDV1 estimates have been corrected upwards, as captured by the improvedcoeffi cients of both the LSDV218 and FGLS estimation results.18The LSDV2 model accounts for differences (in tax administration, political, institu-
tional and economic policy systems) amongst the SADC countries, not explicitly includedin the specification but accounted for, in the estimation. An initial estimation inclusive
10
The findings reveal that the coeffi cients of the LSDV2 estimates comparefavourably with the FGLS results, highlighting the possibility of the coef-ficients being likely good estimates of the true parameters of the variables.Despite the absence of endogeneity (as revealed by the IDTs results), theFGLS estimator (which builds on the LSDV2) with the most robust esti-mators and the most representative estimates of the panel (as denoted byimproved results) is the preferred model in this study. The estimation tech-nique only becomes ineffi cient when the regressors are endogenous and theerror process has a large number of parameters (Kmenta, 1986). Also due toexogeneity of the regressors, there is no need for instrumental variables (IV)in the panel data (Baltagi, 2008).
4.1 Discussion of the empirical results (models 1 and2)
As per the adopted FGLS results for models 1 and 2, the coeffi cients of theFDI indicators are both positively signed and statistically significant at the1% level. The results denote that increases in FDI flows to the SADC coun-tries would expand the tax base and tax revenue positions. The findingsalign with Muibi and Sinbo (2013), who generally highlight the benefits ofimproved economic activities (including FDI) on collected tax revenue, con-firming reverse causality. The results also align with the correlation analysisand the positively argued a priori expectations.As expected, the coeffi cients of the corporate income tax rate (CIT1)
and Value Added Tax (VAT) rate indicators in model 1 are negatively signedand statistically significant at the 1% level. The CIT coeffi cient has been cor-rected upward from the LSDV2 estimation after errors in the error term havebeen rectified. The results denote that during the period under consideration(1990-2010), CIT and VAT rates increased business costs leading to a reduc-tion in tax revenue collected in the SADC. The evidence is consistent withfindings from previous studies which generally highlight the negative effect(and perception) of uncoordinated levels of CIT and VAT rates by countriesin a region on tax revenue. See for example Robinson (2004), Fjeldstad et al.(2012) and Tax Justice Network-Africa & ActionAid International (2012).The finding for CIT modifies the correlation analysis results while that ofVAT is consistent with the results.The coeffi cients of both the CIT policy harmonisation indicator (CHAR)
and the VAT policy harmonisation indicator (VHAR) in model 2 are posi-
of a recession dummy produced insignificant and unimportant findings and was left out ofthe LSDV regression to mitigate the degrees of freedom problem.
11
tively signed and statistically significant at the 1% level (after rectifying er-rors in the panel). The findings suggest that increased harmonisation (moresychronisation) in CIT and VAT rates (including tax policy) in line with theSADC average would enhance tax revenue positions of governments. The evi-dence on CHAR is consistent with findings from previous studies (Sudsawasdand Mongsawad, 2011; Gupta, 2007; Chaudhry and Munir, 2010) which gen-erally highlight the positive effect of improved coordination in CIT and directtaxes on tax revenue. The finding on VHAR modifies that of Gupta (2007)and Sudsawasd and Mongsawad (2011), but generally corroborates Fjeldstadet al. (2012). Both findings modify the results from the correlation analysisand are generally consistent with the economic specifications.The coeffi cient result for domestic credit (DCR) in model 1 is surprisingly
insignificant. However, as expected, it becomes statistically significant andpositively signed at the 1% level in model 2. The results for both governmentexpenditure (GOV) and export (EXPO) in both models are also positivelysigned and statistically significant at the 1% level as expected. Finally, asexpected, the coeffi cient for the inflation variable (INF) is positively signedand statistically significant at the 5% level in model 1 and at the 1% level inmodel 2. All the significant findings are consistent with empirical studies inthe field.Adjudging from the empirical results, the tax rates and tax policy har-
monisation indicators provide quite strong support for maintaining currenttax rates and coordinating tax policy in the SADC in order to maximise taxrevenue. However, the entire estimation results in model 2 reveal the combi-nation of FDI and tax policy harmonisation (CHAR, VHAR) to be slightlybetter in influencing tax revenue than the combination of FDI and tax rates(CIT1, VAT1). The end results significantly highlight the impact of enhancedharmonisation of regional tax policy (as opposed to countries having individ-ual tax rates) in the SADC, on tax revenue positions. On the basis of theestimation results, the study further investigates the responsive (sensitive)levels of TREV to changes in FDI, tax rates or tax policy harmonisation inthe region, using the EBA technique.
5 EBA - robustness and sensitivity check (FDI,tax rates and TPHM)
In applying the EBA model of Leamer (1983) to a panel data regressionexplaining tax revenue collected (TREV) sensitivity levels, the model takesthe form:
12

Yit = αi +
n∑j=1
δjXjit + βMit +
m∑j=1
γjZjit + εit (6)
Where Yit is collected tax revenue in country i at time t , Xjit is thejth explanatory variable of country i at time t that is included in everyregression (usually an important explanatory variable, for example export),Mit is the variable of interest for country i at time t whose robustnessis under investigation (for example, FDI or a tax variable), Zjit is the jthpotentially important explanatory variable in country i at time t and εit isthe error term.Based on equation 6, an EBA equation for the first set (tax rates and FDI)
and second set (TPHM and FDI) of variables of interest are consecutivelyspecified as:Tax rates:
TREVit = αi + δiEXPOit + βV AT1it +k∑j=1
γiZjit + εit (7)
TREVit = αi + δiEXPOit + βCIT1it +k∑j=1
γiZjit + εit (8)
TREVit = αi + δiEXPOit + βFDI1it +k∑j=1
γiZjit + εit (9)
TPHM:
TREVit = αi + δiEXPOit + βV HARit +
k∑j=1
γiZjit + εit (10)
TREVit = αi + δiEXPOit + βCHARit +
k∑j=1
γiZjit + εit (11)
TREVit = αi + δiEXPOit + βFDIit +k∑j=1
γiZjit + εit (12)
Where TREVit is tax revenue collected in country i at time t, EXPOitis the export variable, V AT1 and CIT1it are the VAT and CIT rates re-spectively, FDIit is inward FDI flows, V HARit and CHARit are the VAT
13

and CIT harmonisation indicators respectively, Zjit is the set of optional ex-planatory variables (such as domestic credit, inflation rate) and εit is theerror term.Subsequently two EBA models are estimated based on equations 7 to 12,
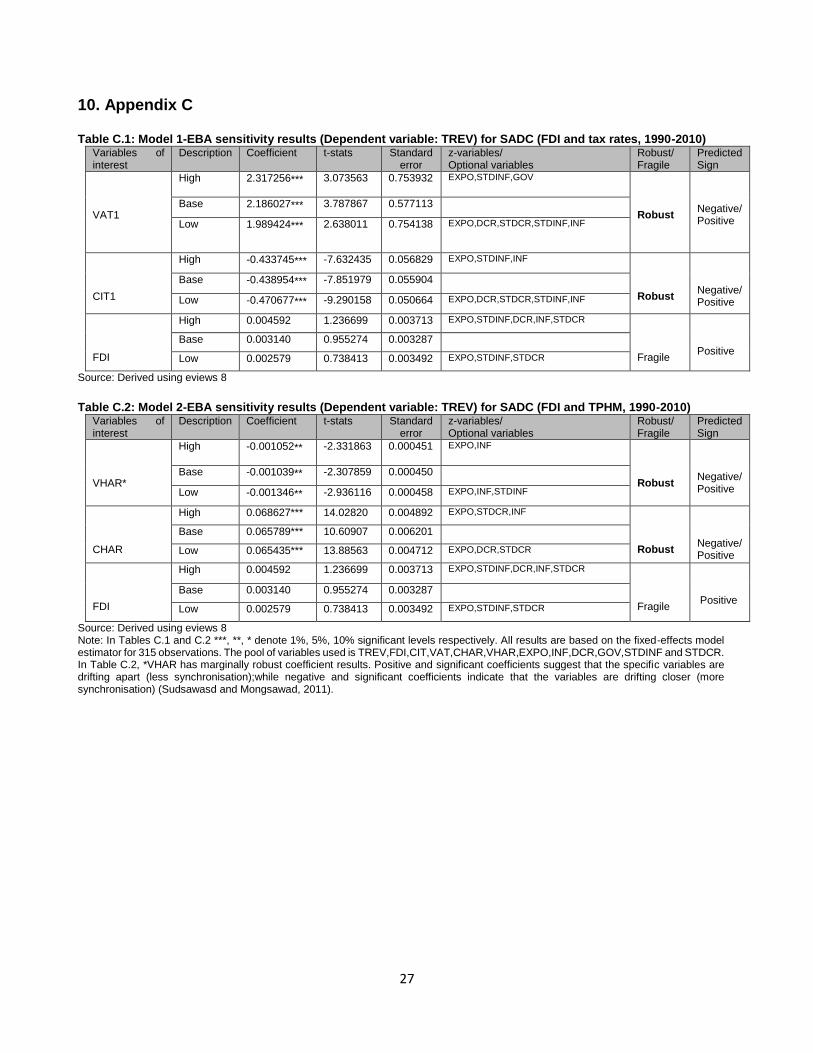
yielding varying results on the sensitive levels of tax revenue collected tochanges in FDI, tax rates and TPHM19. The EBA results are displayed inTables C.1 and C.2 of Appendix C.In model 1 the estimated coeffi cients of the VAT rate are shown to have a
significant positive robust correlation with TREV at the 1% level. The coef-ficient results indicate that tax revenue collected is very sensitive to changesin VAT rates during the period under investigation. This is generally consis-tent with the findings of Sudsawasd and Mongsawad (2011) and the earliereconomic expectation. The estimated coeffi cients results of CIT rate areshown to have a significant negative but robust correlation with TREV atthe 1% level. The coeffi cient results indicate the extent to which tax revenuecollection is sensitive to changes in CIT rates during the period under in-vestigation. The finding is also consistent with Sudsawasd and Mongsawad(2011) and the a priori expectation.In model 2 the estimated coeffi cients of the VAT harmonisation indicator
(VHAR) are shown to have a significant negative robust correlation withTREV at the 5% level. The results show that tax revenue collected is verysensitive to VAT policy harmonisation during the period under investigation.The finding is generally in accordance with the economic expectation. Theestimated coeffi cients of the CIT harmonisation indicator (CHAR) are shownto have a significant positive robust correlation with TREV at the 1% level.The coeffi cient results indicate the extent to which tax revenue collected issensitive to CIT policy harmonisation during the period under investigation.The finding is consistent with the a priori expectation and the FGLS result.Jointly, the results of both tax harmonisation variables (VHAR and CHAR)in model 2 generally corroborate that of Sudsawasd and Mongsawad (2011).In both models, the estimated coeffi cients of FDI are found to be statis-
tically insignificant and fragile, surprisingly indicating that changes in FDIinflows do not relate to the level of tax revenue collected in the SADC. Theresult is contrary to the FGLS and correlation analysis results which pointstowards reverse causality. The insignificant findings provide impetus to thearguments in the literature against using excessive tax incentives to attract
19In interpreting the EBA results, if the extreme values of the variable of interest remainsignificant, of the same predicted economic sign and within a narrow band, one can inferthat the result (and tax variable of interest) is robust. Otherwise, the variable is describedas being “fragile”(Gujarati, 1995; Sudsawasd and Mongsawad, 2011).
14

FDI, as this could adversely affect tax revenue collected20. Collectively, itcan be observed from the EBA results that tax revenue collected (TREV)is sensitive (very responsive) to all the tax variables (VAT, CIT, VHARand CHAR) within the time-frame 1990 to 2010, as captured by the robustfindings. Despite TREV not being sensitive to the FDI variable, there is asignificant causal relationship between TREV and FDI as captured by theFGLS empirical results.
6 Conclusion
This paper investigates the determinants of tax revenue performance in theSADC for the period 1990-2010, using panel data estimation techniques.Specifically, the aim is to ascertain the level of causality of FDI and taxation(CIT rates, VAT rates, tax policy harmonisation variables) amongst othervariables on collected tax revenue in the region. The broad question posedis which combination of variables (FDI and tax rates or FDI and TPHM)amongst other variables, has a better effect on the amount of tax revenue col-lected. Accordingly this paper first established a theoretical base, conducteddetailed empirical analyses and tested for robust sensitive levels of FDI andtaxation on tax revenue in the SADC. The empirical results generally supportusing a combination of TPHM variables (CHAR and VHAR), as opposed tousing a combination of tax rates (standard VAT and statutory CIT) (in-cluding FDI and macro-economic variables) towards improved tax revenueperformance. Specifically the TPHM variables are found to have a signifi-cantly positive effect on revenue performance across all specifications (that is,inclusive of all other explanatory variables), while the tax rates variables arefound to affect revenue performance only across certain specifications. Also,the EBA results show that tax revenue collected in the SADC is sensitiveto tax rates (VAT and CIT rates) and tax policy harmonisation variables(CHAR and VHAR), but insensitive to FDI inflows. The results generallyprovide empirical support for anecdotal evidence that tax rates and tax pol-icy harmonisation ultimately determine the amount of tax revenue collectedin countries and regional groupings.In terms of country specificity (as captured by the cross-sectional SUR
results), the study found individual effects to be valid in model 1 (usingFDI, tax rates) for all SADC countries except for Lesotho and SA towards
20Additionally, unnecessary tax exemptions, tax credits, deductions, deferrals and re-funds to taxpayers (including tax evasion and avoidance), do negatively affect tax revenuecollected; eventually adding to tax expenditure (Tax Justice Network-Africa & ActionAidInternational, 2012).
15

improved regional tax revenue performance. This is perhaps due to the SACUeffect where tax revenue is mainly boosted by the share of SACU revenuedistributed to members based on an agreed formula (SADC, 2011; AEO,2013). Individual effects are also found to be valid in model 2 (using FDI,TPHM) for all SADC countries, except for Seychelles, towards improvedregional tax revenue performance. This is perhaps due to the lower level oftax policy coordination in Seychelles (including having no Personal IncomeTax) vis-a-vis other SADC countries (Deloitte and Touché, 2013).Three policy implications emanate. First, a deliberate policy should be
geared towards broadening tax reforms (including better synchronisation oftax rates and policy) and strengthening FDI regimes in the SADC, in orderto boost tax revenue. This is given that differences in tax rates and taxpolicy could negatively affect investing decisions (including policies on FDI),and impact negatively on tax revenue (Heller, 1975).Second, SADC countries need to carry out extensive pro-regional tax re-
forms and create a regional forum (inclusive of all member countries) in taxrelated matters if they are to be successful in pursuing tax harmonisationtowards increased FDI and revenue (as per the objectives of the 2006 FIPand 2002 MOU on taxation). The SADC forum could assist members in co-ordinating taxable activities (including collectively setting revenue targets),overseeing tax administration, effectively managing tax systems (while stillremaining as part of the African Tax Administration Forum (ATAF) andintroducing a regional revenue statistics report (as is currently done in theEAC, to collectively improve tax revenue positions and consolidate the re-spective domestic budgetary situations).Third, in pursuing tax policy harmonisation, policy makers must continue
to monitor the SADC regional tax dynamics (including the trends), consultbroadly on the way forward and develop a progressive systematic agendabased on timelines. For the countries that have large economies, good in-frastructure, natural resources and attractive non-tax related FDI determi-nants, the case for tax harmonisation does not appear to be overwhelming.However for countries that have small economies, poor infrastructure, rela-tively low level of natural resources and less attractive non-tax related FDIdeterminants, the merits for tax policy harmonisation may be more appeal-ing.Two research issues not addressed in this paper need further investigation.
First, the need exists to periodically monitor tax reforms (including new taxrates and regional tax policy initiatives) (at the aggregate level), and makeuse of recent available information. Second, the current methodology andresearch design could also be used to assess the robustness and impact of taxpolicy harmonisation on tax revenue collected in other regional groupings in
16

Africa.
References
[1] ActionAid and Eurodad (2011). Approaches and Impacts. IFI tax policy in developing countries. [Online]. Available:http://www.actionaid.org.uk/sites/default/files/doc_lib/ifi_tax_ pol-icy_developing_countries.pdf. (Accessed 9 June 2013).
[2] AEO (2013). Financial Flows and Tax Receipts [Online]. Available:http:// www.africaneconomicoutlook.org/en/outlook/financial_flows(Accessed 03 December 2013).
[3] AEO (2015). African Economic Outlook. [Online]. Available:http://www.africaneconomicoutlook.org/en/countries/ (Accessed 08June 2015).
[4] Ahmed, Q.M and Muhammad, S.D (2010). Determinants of TaxBuoyancy: Empirical Evidence from Developing Countries. EuropeanJournal of Social Sciences, 13(3):408-418.
[5] ATAF (2012). ATAF Regional Studies on Reform Priorities of AfricanTax Administrators. Africa Wide Report. African Tax AdministrationForum Study. Pretoria, South Africa.
[6] Baltagi, B.H. (2008). Econometric Analysis of Panel Data. 4th edi-tion. West Sussex. John Wiley & Sons Ltd.
[7] Breusch, T. and Pagan, A. (1980). The LM Test and Its Appli-cations to Model Specification in Econometrics. Review of EconomicStudies, 47, 239-254.
[8] Chaudhry, I.S. and Munir, F. (2010). Determinants of Low TaxRevenue in Pakistan. Pakistan Journal of Social Sciences (PJSS), 30(2):439-452.
[9] De Hoyos, R.E and Sarafidis, V. (2006). Testing for cross-sectionaldependence in panel-data models. The STATA Journal, 6(4): 482-496.
[10] Deloitte and Touché (2013). Guide to Fiscal Information. KeyEconomies in Africa 2012/13. Deloitte & Touché Publishing.
17

[11] Faeth, I. (2011). Foreign Direct Investment in Australia: Determi-nants and Consequences. Custom Book Center , University of Mel-bourne.
[12] Fisher, R.A (1932). Statistical Methods for Research Workers. Oliverand Boyd. Edingurgh. 4th Edition.
[13] Fjeldstad, O. H. and Moore, M. (2009). Revenue authorities andpublic authority in sub-Saharan Africa.The Journal of Modern AfricanStudies,47 (01), 1-18.
[14] Fjeldstad, O-H.,Schulz-Herzenberg, C. and Sjursen, I.H.(2012). People’s views of Taxation in Africa: A review of Researchon Determinants of Tax Compliance. ICTD Working Paper No.8.
[15] Fuest, C. and Riedel, N. (2009). Tax evasion, tax avoidance and taxexpenditures in developing countries: A review of the literature.Reportprepared for the UK Department for International Development (DFID).
[16] Garikai, B.W. (2009). An empirical Analysis of the Determinantsof Tax Buoyancy in Developing Nations. An experience from the SADCEconomies using Panel Data Analysis. Unpublished MSc thesis, Univer-sity of Zimbabwe: Department of Economics, Faculty of social studies,University of Zimbabwe.
[17] Gropp, K. and Kostial, K. (2001). "FDI and Corporate Tax Rev-enue: Tax Harmonisation or Competition?" Finance and Development,38 (2).
[18] Gupta, S.A. (2007). Determinants of Tax Revenue Efforts in Devel-oping Countries. IMF Working Paper WP/07/184. Washington D.C.
[19] Gujarati, D.N. (1995). Basic Econometrics. 3rd Edition. McGraw-Hill:New York.
[20] Hausman, J.A. (1978). Specification Tests in Econometrics. Econo-metrica, 46:1251-1271.
[21] Heller, P.S. (1975). AModel of Public Fiscal Behaviour in DevelopingCountries: Aid, Investment and Taxation. American economic Review,65: 429-45.
[22] Hicks, A. (1994). Introduction to Pooling, in Janoski, T and Hicks, A.The Comparative Policitcal Economy of the Welfare State. CambridgeUniversity Press. Cambridge.
18

[23] Hines Jr, J.R., and Summers, L.H. (2009). How globalisationaffects tax design. InTax Policy and the Economy, 23: (123-157). Uni-versity of Chicago Press.
[24] IMF (2009). Revenue Mobilisation in Sub-Saharan Africa: Challengesfrom Globalisation. IMF Working Paper WP/09/157.
[25] IMF, (2014). International Financial Statistics (IFS). [Online]. IMF.Available: http://www.imf.org/external/data.htm. (Accessed January31 2014).
[26] IMF, OECD, UN and WB (2011). Supporting the Development ofMore Effective Tax Systems. Report to the G-20 Development WorkingGroup.
[27] Im, K., Pesaran, M.H. and Shin, V. (IPS) (2003). Testing forunit roots in heterogeneous panels. Journal of Econometrics 115, 53-74.
[28] Kao, C. (1999). Spurious regression and residual-based tests for co-integration in panel data. Journal of Econometrics. 90, 1- 44.
[29] Kazman, S.B. (2014). Exploring the Laffer Curve: Behavioral Re-sponses to Taxation.
[30] Kelly, R. (2000). Designing a Property Tax Reform Strategy for Sub-Saharan Africa: An Analytical Framework Applied to Kenya. PublicBudgeting and Finance, 20(4): 36-51.
[31] Kmenta, J. (1986). Elements of Econometrics. 2nd edition. New York.Mcmillan. London. Collier McMillan.
[32] Leamer, E.E. (1983). Let’s take the Con Out of Econometrics. Amer-ican Economic Review. 73:31-43.
[33] Leuthold, J.H., (1991). "Tax Shares in Developing Countries: APanel Study," Journal of Development Economics, 35,173-85
[34] Mankiw, G.N., Weinzierl, M.C. and Yagan, D. (2009). Opti-mal Taxation in Theory and Practice. Havard Business School WorkingPapers. 09-140, Harvard Business School.
[35] Mendoza, E.G. and Tesar, L.L. (1998). "The International Ramifi-cations Of Tax Reforms: Supply-Side Economics in a Global Economy".American Economic Review. 88:226-245.
19

[36] Mesa, F. and Parra-Pena, R.I. (2008). Tax Policy as a competitive-ness mechanism to attract manufacturing FDI inflows: An applicationto the Latin-American case.
[37] Mijiyawa. G.A. (2012). What Drives Foreign Direct Investments inAfrica? An Empirical Investigation with Panel Data. African Center forEconomic Transformation (ACET), Accra, Ghana.
[38] Montiel, P.J. (2003). Macro-economics in Emerging Markets. Cam-bridge. Cambridge University Press.
[39] Muibi, S.O. and Sinbo, O.O. (2013).Macroeconomic Determinantsof Tax Revenue in Nigeria.World Applied Sciences Journal,28 (1), 27-35.
[40] Musgrave, R.A. and Musgrave, P.B. (1984). "Public Finance inTheory and Practice," McGraw-Hill, New York.
[41] Musgrave, R.A. (1969). Fiscal Systems. New Haven, C.T: Yale Uni-versity Press.
[42] Palil, M.R. and Mustapha, A.F. (2011). Determinants of tax com-pliance in Asia: A case of Malaysia. European Journal of Social Sciences,24(1).
[43] Park, R.W. (1967). Effi cient Estimation of a system of RegressionEquations when Disturbances are both serially and ContemporaneouslyCorrelated. Journal of the American Statistical Association. 62:500-509.
[44] Ramcharan, R. (2006). "Regressions: Why Are Economists Obsessedwith Them?" Finance and Development, 43 (1).
[45] Robinson, Z. (2004). An Overview of Commodity Tax Reform inSouthern Africa. SAJEMS NS, 7(2):387-426.
[46] SADC (2002). Memorandum of Understanding on Co-operationin Taxation and Related Matters. [Online]. Available from:http://www.sadc.int/documents-publications/show/1020. (Accessed 6July 2014).
[47] SADC (2006). Finance and Investment Protocol. Pretoria: The Na-tional Treasury.
[48] SADC (2011). SADC Statistics Yearbook. [Online]. Availablefrom: http://www.sadc.int/information-services/sadc-statistics/sadc-statiyearbook. (Accessed 22 July 2013).
20

[49] Slavin, S.L. (2008). Economics. 8th edition. McGraw-Hill Companies,Inc.
[50] Sudsawasd, S. and Mongsawad, P. (2011). Tax policy harmoni-sation and FDI: An empirical assessment. International conference onapplied economics. ICOAE 2011.
[51] Tax Justice Network-Africa & ActionAid International (2012).Tax competition in East Africa: A race to the bottom? [Online]. Avail-able: http://www.actionaid.org/sites/files/actionaid/eacreport.pdf.(Accessed 1 August 2012).
[52] Trabandt, M., and Uhlig, H. (2011). The Laffer curve revis-ited.Journal of Monetary Economics,58 (4), 305-327.
[53] UN (2012). Foreign Aid as a Catalyst to Improving Domestic ResourcesMobilisation. United Nations Economic and Social Council DCF Ana-lytical study, New York and Geneva.
[54] UNCTAD (2006). World Investment Report (2006). FDI fromDeveloping and Transition Economies: Implications for Development.United Nations Conference on Trade and Development Report, NewYork and Geneva.
[55] UNCTAD (2015). Foreign Direct InvestmentDatabase. [Online]. UNCTADSTAT. Available:http://unctadstat.unctad.org/wds/TableViewer/tableView.aspx?ReportId=88.(Accessed February 17 2015).
[56] World Bank, (2013). World Development In-dicators (WDI). [Online]. World Bank. Available:http://data.worldbank.org/indicator/BX.KLT.DINV.CD.WD. (Ac-cessed July 17 2013).
21

22
Table 1: Models 1 and 2: Empirical results - country-specific results (sample: 1990-2010). Dependent Variables:TREV
Model 1: FDI and tax rates Model 2: FDI and TPHM
Variables REM LSDV1 LSDV21 FGLS REM LSDV1 LSDV2 FGLS
(Random effects
model)
(Least squares
dummy
variables-Fixed-
effects)
(Least square
dummy
variables-Fixed-
effects CS SUR)
(Feasible
generalised
least squares)
(Random effects
model)
(Least
squares
dummy
variables-
Fixed-effects)
(Least square
dummy
variables-Fixed-
effects CS SUR)
(Feasible
generalised least
squares)
FDI 0.076 0.075 0.062 0.152 0.096 0.093 0.079 0.180
(0.282) (0.290) (0.000) *** (0.000) *** (0.174) (0.189) (0.000) *** (0.000) ***
CIT1 -0.165 -0.239 -0.197 -0.072
(0.470) (0.390) (0.024) ** (0.000) ***
VAT1 -0.316 3.030 2.906 -0.559
(0.720) (0.171) (0.000) *** (0.000) ***
CHAR 0.057 0.060 0.050 0.033
(0.033) ** (0.027) ** (0.000) *** (0.000) ***
VHAR 0.005 0.003 0.004 0.023
(0.704) (0.818) (0.023) ** (0.000) ***
DCR -0.029 -0.033 -0.027 0.001 0.0271 -0.033 -0.027 0.000
(0.120) (0.100) (0.000) *** (0.969) (0.150) (0.104) (0.000) *** (0.000) ***
GOV 0.501 0.498 0.419 0.617 0.496 0.487 0.412 0.649
(0.000) *** (0.000) *** (0.000) *** (0.000) *** (0.000) *** (0.000) *** (0.000) *** (0.000) ***
EXPO -0.019 -0.023 -0.015 0.029 0.012 0.007 0.010 0.009
(0.593) (0.539) (0.000) *** (0.000) *** (0.750) (0.848) (0.028) ** (0.000) ***
INF 1.94e-08 1.93e-08 4.34e-09 1.80e-08 1.94e-08 1.86e-08 8.29e-09 2.12e-08
(0.463) (0.466) (0.526) (0.027) ** (-0.463) (0.481) (0.183) (0.006) ***
Adjusted R2
0.148 0.696 0.938 0.163 0.698 0.925
Observations 315 315 315 315 315 315 315 315
RSS 10668.94 10267.17 289.397 10552.85 10162.73 293.382
Source: Derived using Eviews 8 and statistical analysis software (STATA) 13 P-values are in parentheses. Significance levels are 10% (*), 5% (**) and 1% (***). Models 1 and 2 reflect the results using FDI and tax rates; and FDI and the TPHM variables respectively.
1 The result of the LSDV fixed-effects (with better adjusted R2) is preferred to that of the REM, as the FEM allows μ to be expressed
freely. The LSDV2 result is better than LSDV1 result as it corrects for errors in the panel and there is no LSDV bias due to a large T. The LSDV2 result therefore involves fixed-effect with cross-sections (CS) SUR, which was applied to the model to account for heteroscedasticity, contemporaneous correlation and also for mild levels of CSD in the errors across equations. Applying the CS SUR improves the overall explanatory power of the model (See the adjusted R2 and RSS from LSDV1 to LSDV2).

23
Appendix A
Table A.1: Sources and definition of variables Applicable abbreviation
Variable Sources Definition of variables
TREV Tax revenue SADC (2011), IMF (2014). Collected corporate tax on profits, income, and capital gains (CIT2) and also from value added tax as a percentage of GDP and (VAT2).
FDI Foreign direct investment net inflows to the SADC
World Bank (2013); UNCTAD, 2015 Foreign direct investment net inflows share of GDP. Measured as the net foreign inflow into the SADC (% of GDP).
CIT1 Corporate Income Tax (maximum statutory rate)
SADC (2011) Maximum statutory corporate tax rate,
calculated on profit before tax
VAT1 Value Added Tax
(standard rate). (Also a
proxy for general sales
tax, GST)
SADC (2011) Applicable standard VAT rate or GST on
goods and services as a percentage of
value-added of industry and services.
GOV Government expenditure
World Bank (2013). Share of government expenditure in GDP
(GOV)
DCR Domestic credit World Bank (2013). Growth rate of (net) domestic credit at constant prices
EXPO Export World Ban ( 2013) Total trade exports of SADC countries to
the developed world, share of GDP
INF Inflation World Bank (2013); IMF (2014). Rate of inflation for SADC countries
Source: Compiled from various sources Note: CIT1 and VAT1 are used to calculate the CHAR and VHAR variables. Model 1 employs TREV,FDI and tax rates; while Model 2 employs TREV,FDI and TPHM.

24
Table A.2: A priori expectations Variable Expected
signs Deduction made
TREV Dependent variable
Dependent variable
FDI Positive
A general growth in FDI will expand the tax base, improve tax efforts and tax revenue collection. Hence an increase in FDI would improve tax revenue collection in the SADC (ceteris paribus) (positive relationship).
CIT1 Negative/ Positive
The CIT rates applied in the SADC during the period under investigation increased business costs and significantly affected the amount of tax revenue collected (negative sign). Alternatively, CIT rates applied during the period under investigation did not increase business costs and have instead improved on tax revenue collection (positive sign).
VAT1 Negative/ Positive
The VAT rates applied by the SADC countries during the period under investigation increased business costs and significantly affected the amount of tax revenue collected (negative sign). Alternatively, the VAT rates applied by the SADC countries during the period under investigation did not negatively affect businesses, instead improving tax revenue collection (positive sign).
CHAR Negative/ Positive
More variation upward (more deviation) in a country’s statutory CIT rate from that of the SADC group average would lead to tax avoidance, ax evasion and net FDI outflows, subsequently reducing total tax revenue collected (negative relationship). More harmonisation (less deviation) in a country’s statutory CIT rate in accordance with that of the SADC group average would improve investors’ confidence and overall investment, leading to increased tax revenue collection (positive relationship).
VHAR Negative/ Positive
More variation upward (more deviation) in a country’s standard VAT rate from that of the SADC group average would lead to increased business administrative costs, regulatory requirements burden, cost of doing business and the potential for VAT fraud, negatively affecting tax revenue (negative relationship). More sychronisation (less deviation) in VAT rates by a member country in accordance with that of the SADC group average would improve investors’ confidence, general investment levels and tax revenue collection (positive sign).
Expo Positive
An increase in exports from the SADC countries would increase the amount of tax revenue collected. Increased exports mean business is booming for local companies in the respective countries which will be taxed accordingly thereby improving revenue collection (positive relationship).
DCR Positive
An unrestricted growth in domestic credit extended to foreign investors would create new businesses and improve business activities. The robust business climate would lead to increase taxable activities and better tax revenue collection (positively relationship).
Gov Positive A parsimonious increase in government expenditure on traded goods and services, infrastructure and other equally important sectors of the economy would boost the economy and income levels. These would (through the multiplier effect) boost businesses and subsequently tax revenue (ceteris paribus) (positive relationship).
INF Negative/ positive
A consistent increase in inflation would erode business fundamentals and increase the cost of doing business especially if companies cannot easily pass the price increases onward to the consumers. This may increase tax evasion and tax avoidance or even result to tax resistance, leading to a reduction in overall tax revenue collected (negative relationship). Alternatively, provided inflation is fairly low and does not change too quickly, business profits will increase in line with increase in inflation in the economy. The effect is further enhanced when governments do not raise tax threshold levels for corporations. Resultantly high inflation could lead to increase in both corporate and personal tax revenue for tax administrations (positive relationship)
Source: Table motivated by various studies (including Gupta, 2007; Slavin, 2008, Sudsawasd and Mongsawad, 2011) Note: In both models the standard deviation of inflation (STINF) and domestic credit growth (STDCR) are used exclusively in the EBA. These are traditionally used to increase the pool of variables employed in robustness tests (Sudsawasd and Mongsawad, 2011).

25
Appendix B
Table B.1: Initial Diagnostic Tests (IDTs) results (sample wide,1990-2010) Tests and hypotheses Model 1
(FDI and tax rates)
Model 2
(FDI and TPHM)
Basis for Inference and
Inferences (Models 1 and
2)
Test statistics and critical value
Joint validity of cross-sectional individual effects (Pool or FEM)
0: ...210 INH
AH not all equal to 0
-The critical value, F crit is defined as
))(1( KNNTNF
FStat =27.720097
F crit =F )287,20,05.0( =
1.72565
FStat = 26.623146
F crit =F )293,14,05.0( =
1.72565
Basis for Inference:
Reject 0H if FStats > Fcrit,
Inference:
Cross-sections are
heterogeneous.
Joint validity test for random effects (Pool versus REM)
0:2
0 H
AH 0:2
LM = 872.0526
)1(2 = 3.841459
(One-way ECM)
LM = 743.2290
)1(2 = 3.841459
(One-way ECM)
Basis for Inference:
Reject 0H if LM >
)1(2
Inference:
The random model individual
effects are better (recognises
heterogeneity).
Joint validity of time (period) fixed-effects (tests validity of specific time-effects)
0: 1210 ... H
AH not all equal to 0
FStat = 0.293295
F crit = F )287,20,05.0( =
1.60727
F Stat = 0.274310
F crit = F )287,20,05.0( =
1.607275
Basis for Inference:
Reject 0H if F stat > F crit
Inference:
We do not reject Ho.
Time-specific effects are invalid. (Error term takes a one-way error
component form).
LM test for serial correlation given fixed-effects (two-way model)
:0H = 0 (given 1 are fixed
parameters)
AH : >
LM = 11.80747
Critical value:
)1,0(N = 1.64485 (for large
T)
LM = 11.80747
Critical value:
)1,0(N =1.64485 (for large T)
Basis for Inference:
Reject 0H if LM > crit value
Inference:
Positive first order serial
correlation exists, given the
existence of fixed-effects.
Heteroscedasticity
220: iH for all i
AH not all equal for all i
(The variance of μi or Vit may be heteroscedastic).
LM = 115.0907352
LM crit =2 (
)1N = )14(2 =
23.68479
LM = 118.215224
LM crit =2 ( )1N
= )14(2 = 23.684791
Basis for Inference:
Reject 0H if LM >
LMcrit
Inference:
Reject null hypotheses.
Heteroscedasticity is present.
Hausman (1978) specification test
0)/(: ,,0 titi XEH
3m = 4.465728
3m = 4.247405
Basis for Inference:
Reject 0H if 3m > )7(2
26
0)/(: ,, titiA XEH
06714.14)7(2
06714.14)7(2
Inference:
Regressors are exogenous. There’s no endogeneity.
Breusch-Pagan (1980) LM test 1 Cross-sectional dependence (CSD) (and contemporaneous correlation).
0),,,(: tjtiO corrH for i≠j
0),,,(: tjtiA corrH for
some i≠j Breusch-Pagan (1980) LM test 2 CSD (and groupwise heteroscedasticity).
22)(:
sigmaisigmaHOfor
all i
22)(:
sigmaisigmaH A for
all i
Chi2(105)=277.927 Prob=0.0000 Chi2(15)= 41345.07 Prob >chi2=0.0000
Chi2(105)=284.536 Prob=0.0000 (Breush-pagan LM test of independence). Chi2(15)=30704.86 Prob >chi2 = 0.0000 (Breush-pagan LM test of independence).
Basis for Inference:
Reject 0H if LM values are greater than critical P-values. Also when p value is significant
Inference:
The null hypotheses are all decisively rejected. The errors exhibit contemporaneous correlation, groupwise heteroscedasticity and inter-dependent cross-sections (CSD)
Source: Derived using eviews 8 and STATA 13
27
10. Appendix C
Table C.1: Model 1-EBA sensitivity results (Dependent variable: TREV) for SADC (FDI and tax rates, 1990-2010) Variables of interest
Description Coefficient t-stats Standard error
z-variables/ Optional variables
Robust/ Fragile
Predicted Sign
VAT1
High 2.317256*** 3.073563 0.753932 EXPO,STDINF,GOV
Robust
Negative/ Positive
Base 2.186027*** 3.787867 0.577113
Low 1.989424*** 2.638011 0.754138 EXPO,DCR,STDCR,STDINF,INF
CIT1
High -0.433745*** -7.632435 0.056829 EXPO,STDINF,INF
Robust
Negative/ Positive
Base -0.438954*** -7.851979 0.055904
Low -0.470677*** -9.290158 0.050664 EXPO,DCR,STDCR,STDINF,INF
FDI
High 0.004592 1.236699 0.003713 EXPO,STDINF,DCR,INF,STDCR
Fragile
Positive
Base 0.003140 0.955274 0.003287
Low 0.002579 0.738413 0.003492 EXPO,STDINF,STDCR
Source: Derived using eviews 8
Table C.2: Model 2-EBA sensitivity results (Dependent variable: TREV) for SADC (FDI and TPHM, 1990-2010)
Variables of interest
Description Coefficient t-stats Standard error
z-variables/ Optional variables
Robust/ Fragile
Predicted Sign
VHAR*
High -0.001052** -2.331863 0.000451 EXPO,INF
Robust
Negative/ Positive
Base -0.001039** -2.307859 0.000450
Low -0.001346** -2.936116 0.000458 EXPO,INF,STDINF
CHAR
High 0.068627*** 14.02820 0.004892 EXPO,STDCR,INF
Robust
Negative/ Positive
Base 0.065789*** 10.60907 0.006201
Low 0.065435*** 13.88563 0.004712 EXPO,DCR,STDCR
FDI
High 0.004592 1.236699 0.003713 EXPO,STDINF,DCR,INF,STDCR
Fragile
Positive
Base 0.003140 0.955274 0.003287
Low 0.002579 0.738413 0.003492 EXPO,STDINF,STDCR
Source: Derived using eviews 8 Note: In Tables C.1 and C.2 ***, **, * denote 1%, 5%, 10% significant levels respectively. All results are based on the fixed-effects model estimator for 315 observations. The pool of variables used is TREV,FDI,CIT,VAT,CHAR,VHAR,EXPO,INF,DCR,GOV,STDINF and STDCR. In Table C.2, *VHAR has marginally robust coefficient results. Positive and significant coefficients suggest that the specific variables are drifting apart (less synchronisation);while negative and significant coefficients indicate that the variables are drifting closer (more synchronisation) (Sudsawasd and Mongsawad, 2011).