BUSINESS INTELLIGENCE TOWARDS REVENUE ASSURANCE … · BUSINESS INTELLIGENCE TOWARDS REVENUE...
20
BUSINESS INTELLIGENCE TOWARDS REVENUE ASSURANCE Erik Saayman July 2012 – South African Revenue Protection Association (SARPA) Improved Visibility on your Operations
Transcript of BUSINESS INTELLIGENCE TOWARDS REVENUE ASSURANCE … · BUSINESS INTELLIGENCE TOWARDS REVENUE...
BUSINESS INTELLIGENCE TOWARDS REVENUE ASSURANCE
Erik Saayman July 2012 – South African Revenue Protection Association (SARPA)
Improved Visibility on your Operations
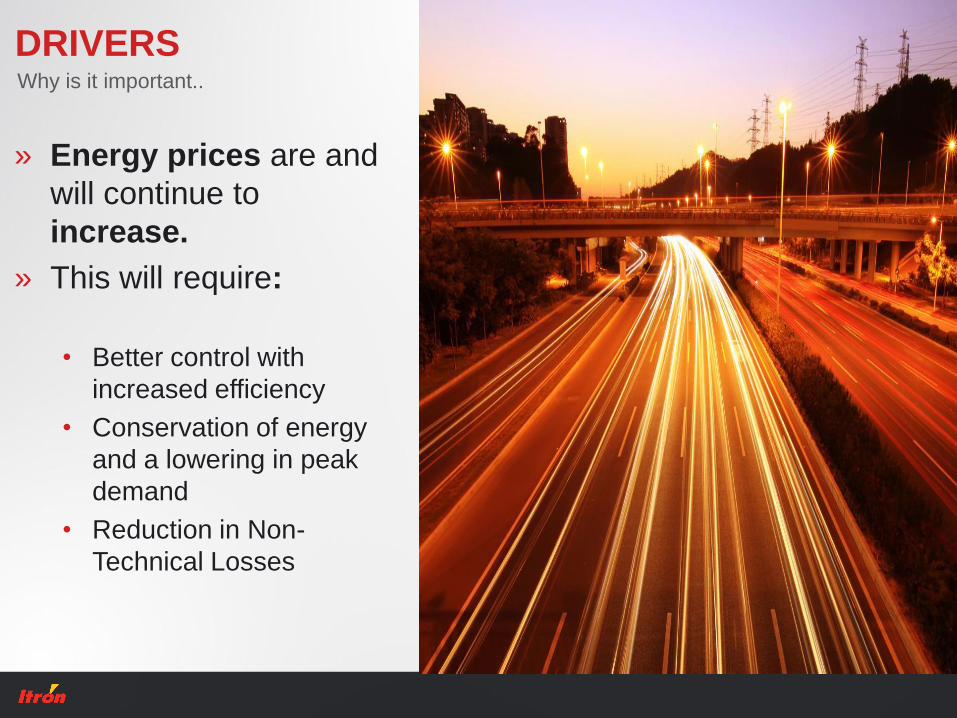
DRIVERS
» Energy prices are and
will continue to
increase.
» This will require:
• Better control with
increased efficiency
• Conservation of energy
and a lowering in peak
demand
• Reduction in Non-
Technical Losses
Why is it important..
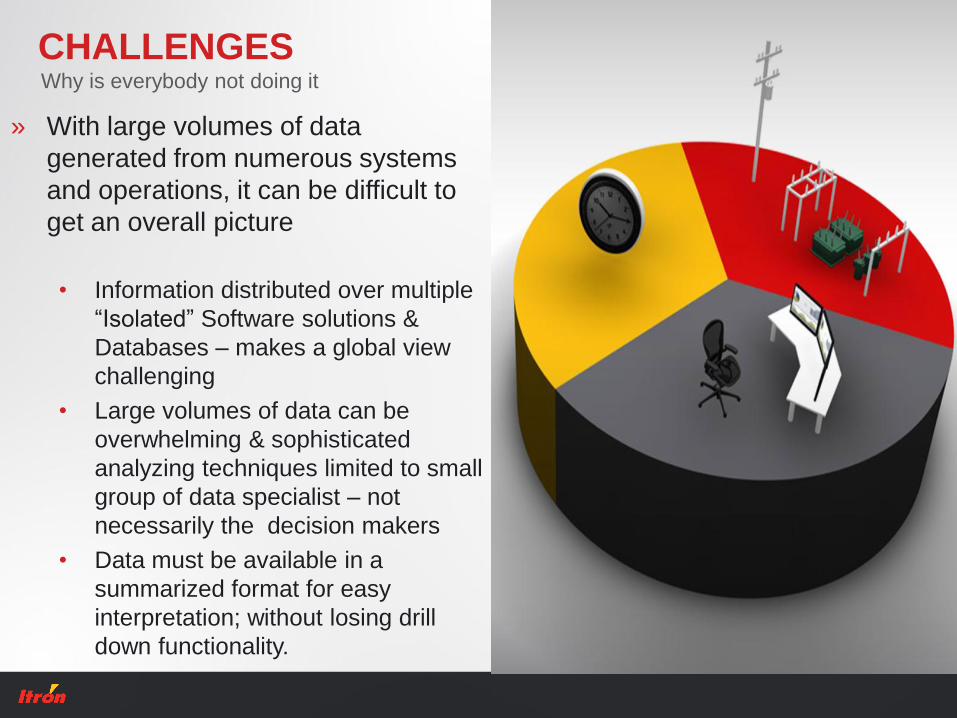
CHALLENGESWhy is everybody not doing it
» With large volumes of data
generated from numerous systems
and operations, it can be difficult to
get an overall picture
• Information distributed over multiple
“Isolated” Software solutions &
Databases – makes a global view
challenging
• Large volumes of data can be
overwhelming & sophisticated
analyzing techniques limited to small
group of data specialist – not
necessarily the decision makers
• Data must be available in a
summarized format for easy
interpretation; without losing drill
down functionality.
OPPORTUNITIESWhy is it becoming a reality
» Software design & deployment strategies are increasing towards
maximizing the availability of information:
• Web based software & cloud computing - accessibility and data sharing
between different workstations/systems via internet
• Web application design includes standard plug-ins (API’s is a specification
used as an interface by software components to communicate with each other)
• Mobile Solutions designed for smart devices
» Key for success will be the ability to utilize the advantages offered by:
• Spatial data & GIS techniques
• Energy balancing calculations
• New generation smart & prepayment meters with AMR capabilities
A central business intelligence output must be available in a clear
online dashboard format which is critical for end-to-end visibility.
5
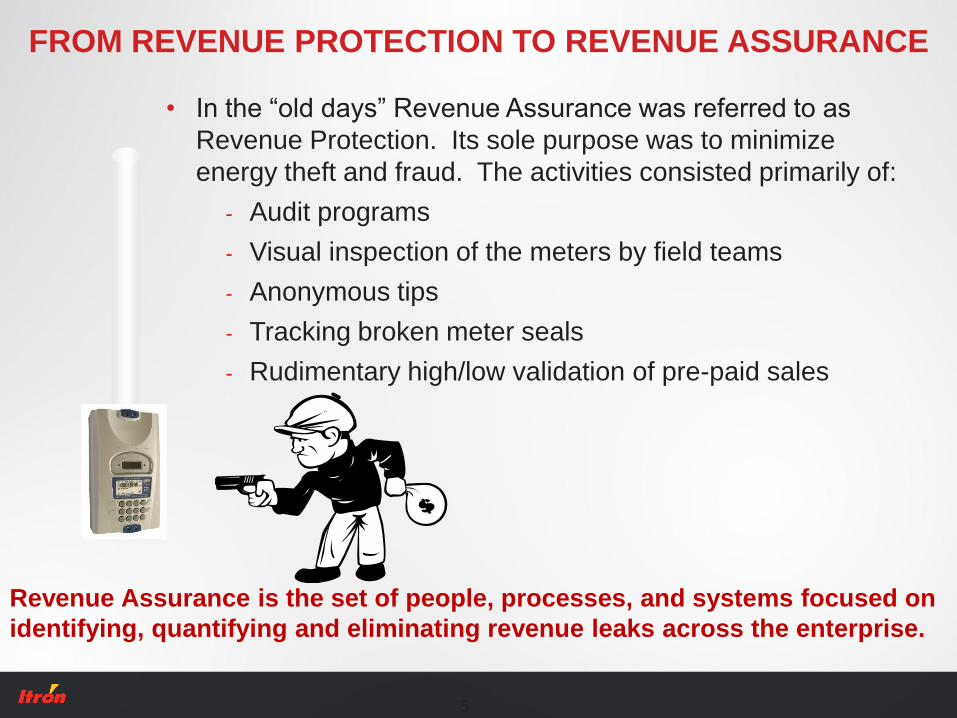
• In the “old days” Revenue Assurance was referred to as
Revenue Protection. Its sole purpose was to minimize
energy theft and fraud. The activities consisted primarily of:
- Audit programs
- Visual inspection of the meters by field teams
- Anonymous tips
- Tracking broken meter seals
- Rudimentary high/low validation of pre-paid sales
FROM REVENUE PROTECTION TO REVENUE ASSURANCE
Revenue Assurance is the set of people, processes, and systems focused on
identifying, quantifying and eliminating revenue leaks across the enterprise.
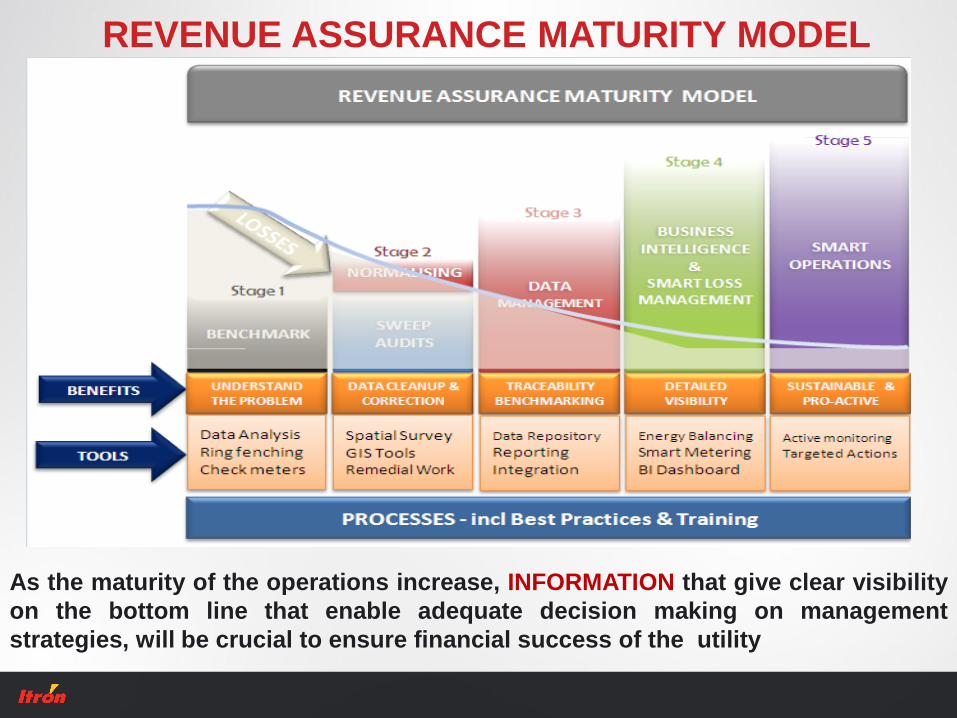
REVENUE ASSURANCE MATURITY MODEL
As the maturity of the operations increase, INFORMATION that give clear visibility
on the bottom line that enable adequate decision making on management
strategies, will be crucial to ensure financial success of the utility
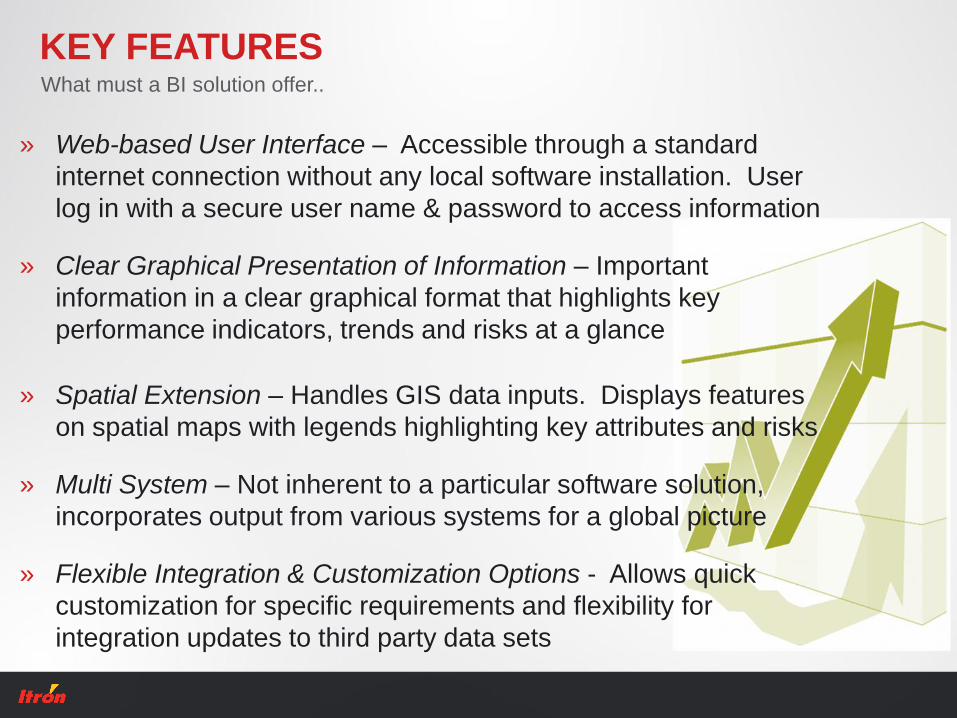
KEY FEATURES
» Web-based User Interface – Accessible through a standard
internet connection without any local software installation. User
log in with a secure user name & password to access information
» Clear Graphical Presentation of Information – Important
information in a clear graphical format that highlights key
performance indicators, trends and risks at a glance
» Spatial Extension – Handles GIS data inputs. Displays features
on spatial maps with legends highlighting key attributes and risks
» Multi System – Not inherent to a particular software solution,
incorporates output from various systems for a global picture
» Flexible Integration & Customization Options - Allows quick
customization for specific requirements and flexibility for
integration updates to third party data sets
What must a BI solution offer..
WHY BUSINESS INTELLIGENCE “DASHBOARD”
» Time Saving
Less time spent maintaining spreadsheets and manual reports
» Cost Saving
Tracks incomes and costs, revealing exceptions and cost saving opportunities.
» Early Warnings
Visual output ensures warning signs are picked up early, ensuring a rapid
response to critical issues
» Recognize Trends
Graphical plots of data brings trends to the forefront
» Clear Communication
The visual output is designed towards easy and quick interpretation, even for
non-technical people within your organization.
» Drill Down Functionality
Interactive interfaces and selection options allow you to easily drill down into your
data with only a few mouse clicks, without getting lost
Information to Optimize your Bottom Line
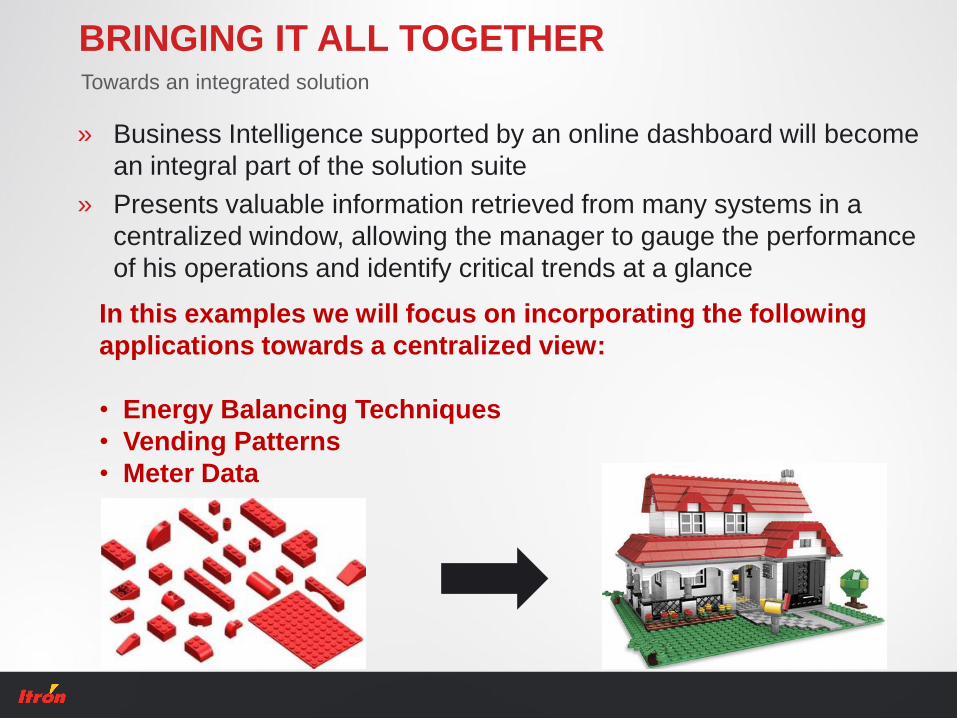
BRINGING IT ALL TOGETHER
» Business Intelligence supported by an online dashboard will become
an integral part of the solution suite
» Presents valuable information retrieved from many systems in a
centralized window, allowing the manager to gauge the performance
of his operations and identify critical trends at a glance
Towards an integrated solution
In this examples we will focus on incorporating the following
applications towards a centralized view:
• Energy Balancing Techniques
• Vending Patterns
• Meter Data
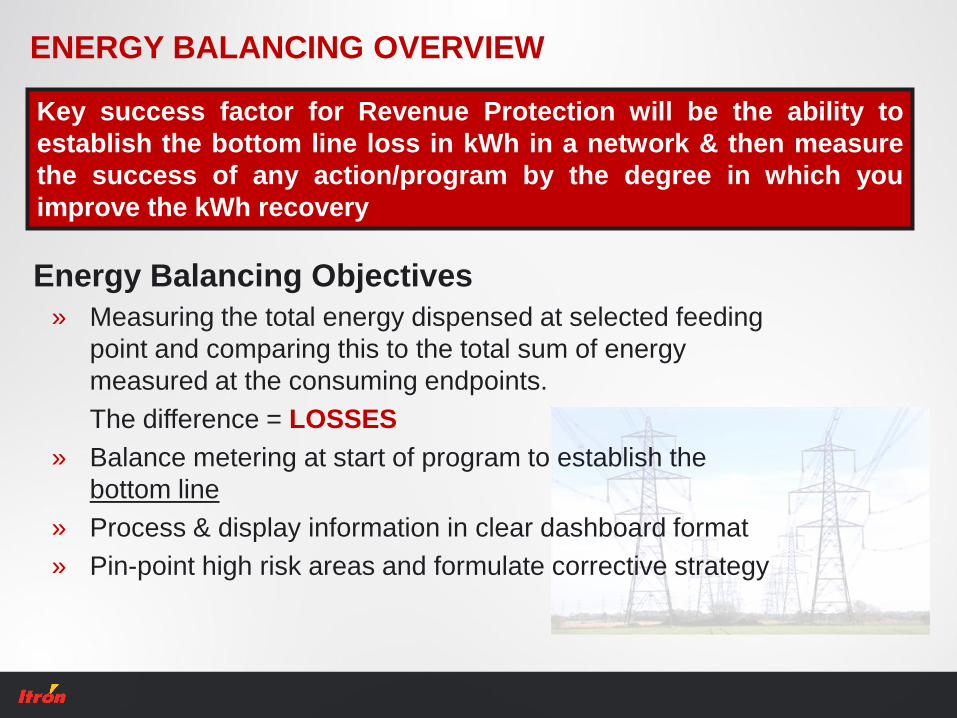
ENERGY BALANCING OVERVIEW
Energy Balancing Objectives
» Measuring the total energy dispensed at selected feeding
point and comparing this to the total sum of energy
measured at the consuming endpoints.
The difference = LOSSES
» Balance metering at start of program to establish the
bottom line
» Process & display information in clear dashboard format
» Pin-point high risk areas and formulate corrective strategy
Key success factor for Revenue Protection will be the ability to
establish the bottom line loss in kWh in a network & then measure
the success of any action/program by the degree in which you
improve the kWh recovery
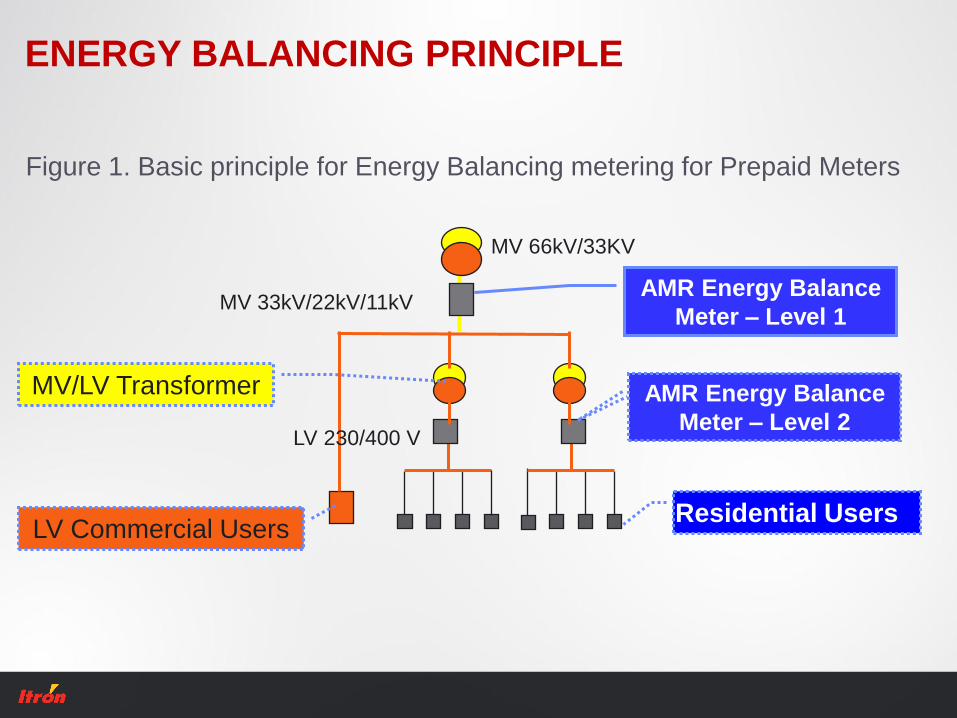
ENERGY BALANCING PRINCIPLE
Figure 1. Basic principle for Energy Balancing metering for Prepaid Meters
LV Commercial UsersResidential Users
MV/LV Transformer
LV 230/400 V
AMR Energy Balance
Meter – Level 1
MV 66kV/33KV
MV 33kV/22kV/11kV
AMR Energy Balance
Meter – Level 2
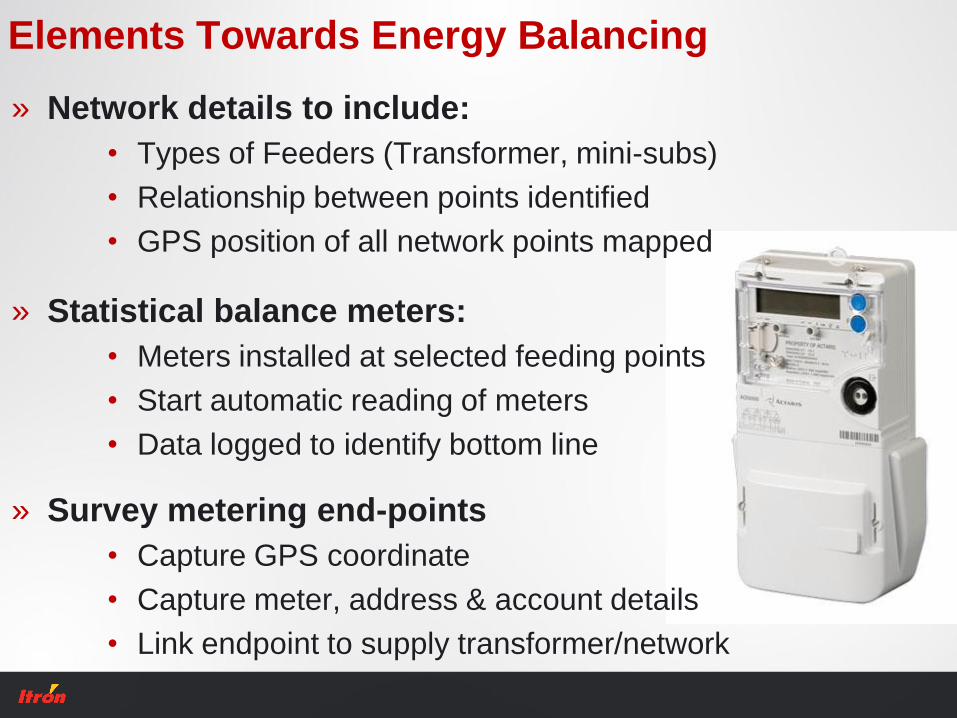
Elements Towards Energy Balancing
» Network details to include:
• Types of Feeders (Transformer, mini-subs)
• Relationship between points identified
• GPS position of all network points mapped
» Statistical balance meters:
• Meters installed at selected feeding points
• Start automatic reading of meters
• Data logged to identify bottom line
» Survey metering end-points
• Capture GPS coordinate
• Capture meter, address & account details
• Link endpoint to supply transformer/network
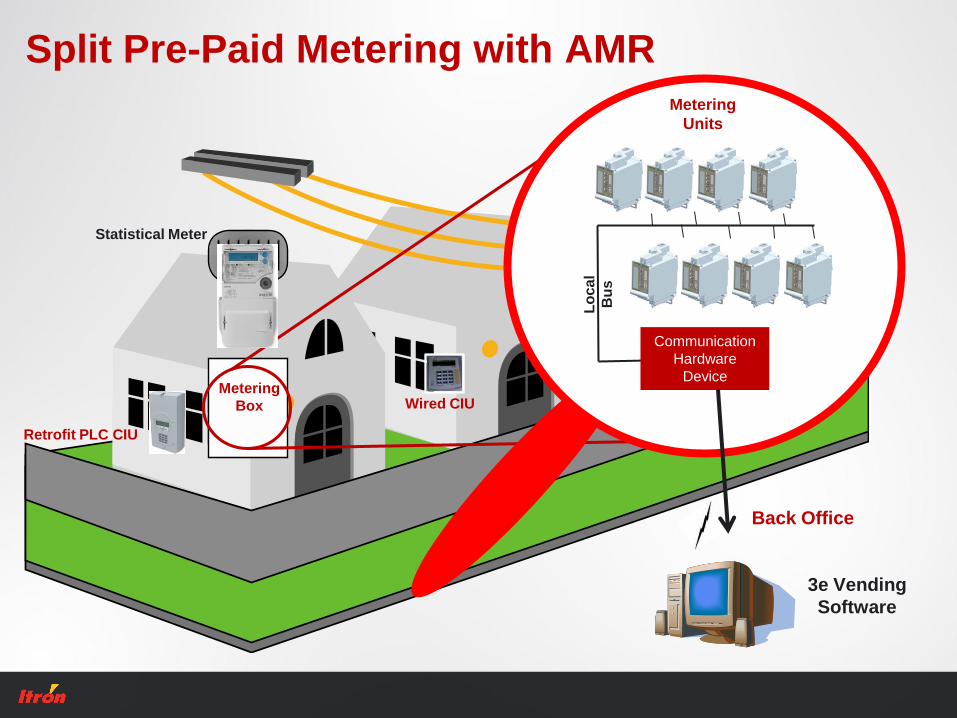
Back Office
3e Vending
Software
Metering
Box
Communication
Hardware
Device
Lo
cal
Bu
s
Metering
Units
Retrofit PLC CIU
Split Pre-Paid Metering with AMR
Statistical Meter
Wired CIU
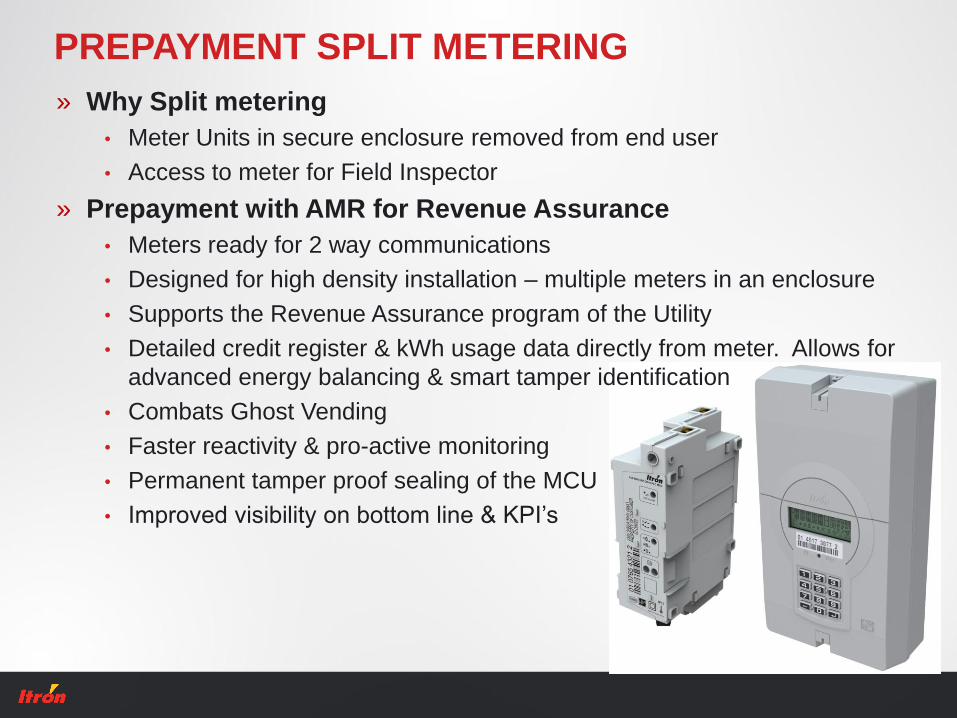
PREPAYMENT SPLIT METERING
» Why Split metering
• Meter Units in secure enclosure removed from end user
• Access to meter for Field Inspector
» Prepayment with AMR for Revenue Assurance
• Meters ready for 2 way communications
• Designed for high density installation – multiple meters in an enclosure
• Supports the Revenue Assurance program of the Utility
• Detailed credit register & kWh usage data directly from meter. Allows for
advanced energy balancing & smart tamper identification
• Combats Ghost Vending
• Faster reactivity & pro-active monitoring
• Permanent tamper proof sealing of the MCU
• Improved visibility on bottom line & KPI’s
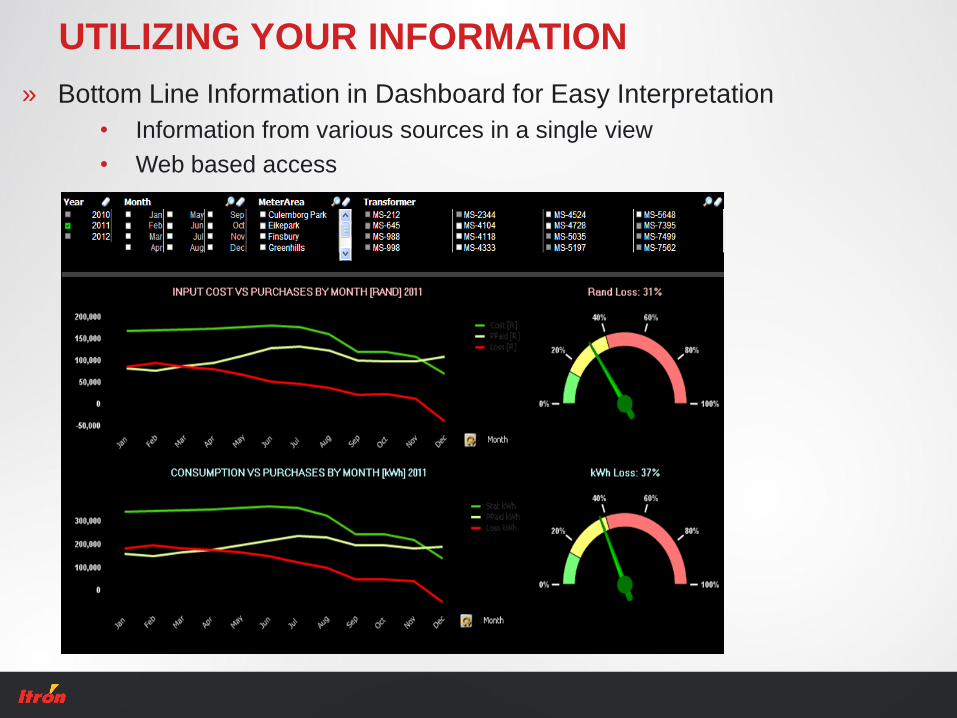
UTILIZING YOUR INFORMATION
» Bottom Line Information in Dashboard for Easy Interpretation
• Information from various sources in a single view
• Web based access
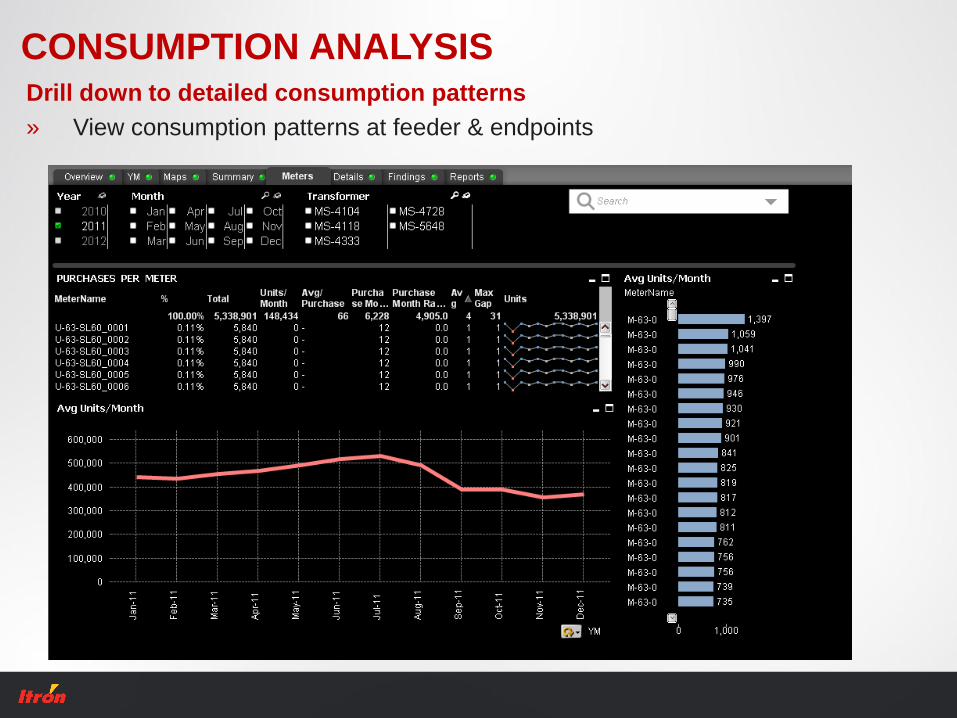
CONSUMPTION ANALYSISDrill down to detailed consumption patterns
» View consumption patterns at feeder & endpoints
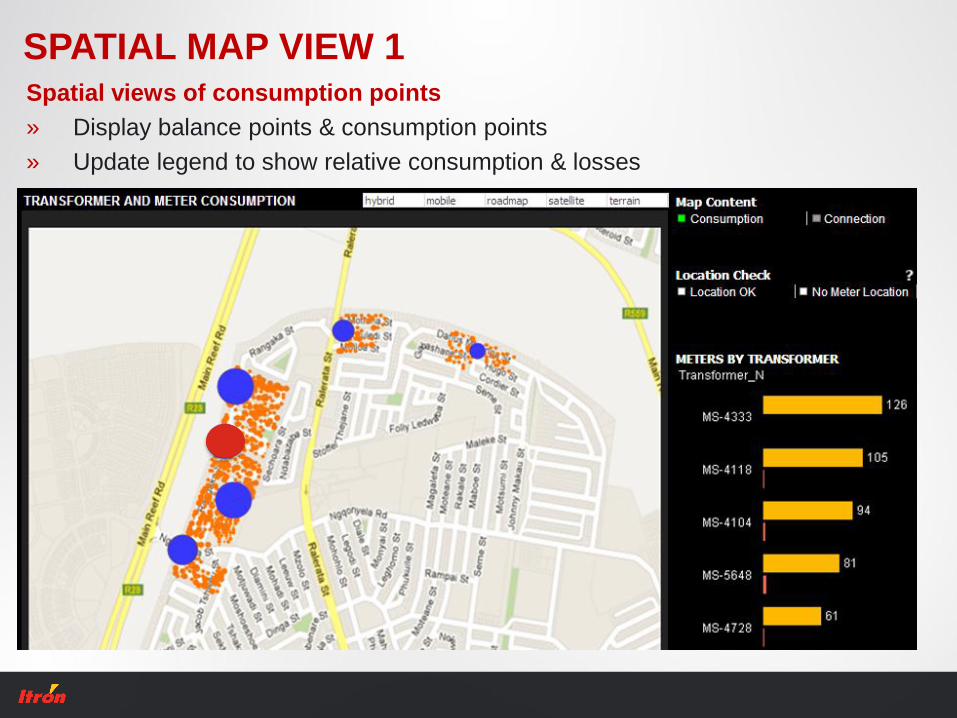
SPATIAL MAP VIEW 1Spatial views of consumption points
» Display balance points & consumption points
» Update legend to show relative consumption & losses
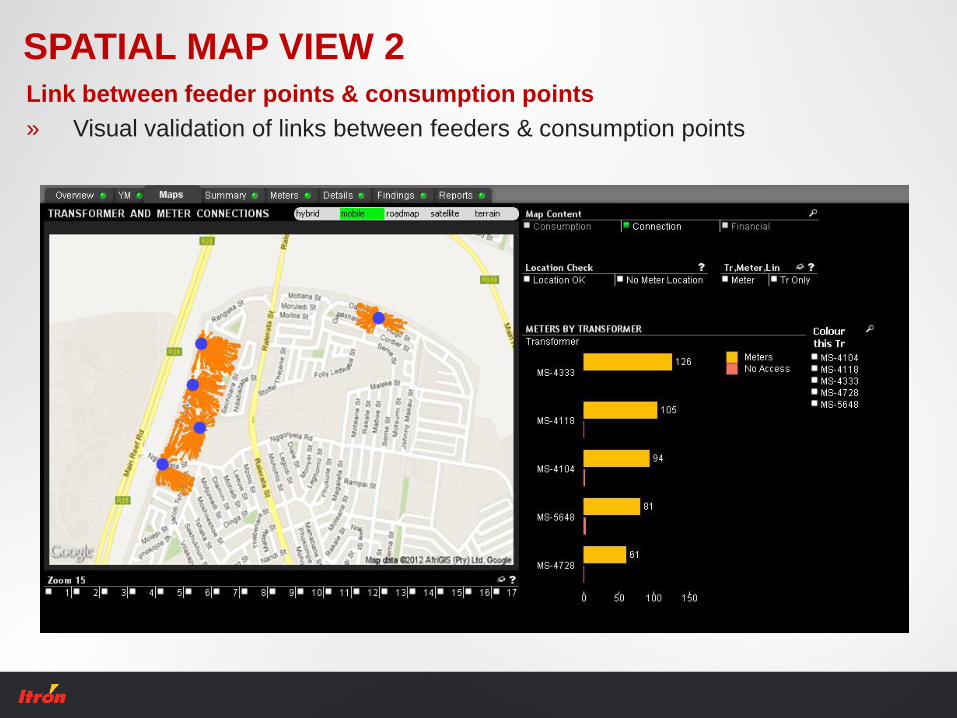
SPATIAL MAP VIEW 2Link between feeder points & consumption points
» Visual validation of links between feeders & consumption points
LAST NOTES
» Communication Infrastructure Improving, but still limiting in areas.
» Quality of Data
The information is only as good as the data it is based on.
» Experience & Skills Evaluating, extracting & processing data towards an optimal
Business Intelligence output which still requires skill.

THANK YOU
www.itron.com
ITRON HOUSE SEA