DETERMINANTS OF MARRIED WOMEN LABOR …1)/2012(2.1-59).pdfDETERMINANTS OF MARRIED WOMEN LABOR FORCE...
24
Academic Research International ISSN-L: 2223-9553, ISSN: 2223-9944 Vol. 2, No. 1, January 2012 Copyright © 2012 SAVAP International www.savap.org.pk www.journals.savap.org.pk 599 DETERMINANTS OF MARRIED WOMEN LABOR FORCE PARTICIPATION IN WAH CANTT: A DESCRIPTIVE ANALYSIS Anbreen Bibi Department of Economics, University of Wah, Wah Cantt PAKISTAN [email protected] Asma Afzal Department of Economics, University of Wah, Wah Cantt PAKISTAN [email protected] ABSTRACT This paper is an attempt to determine the factors which effect the decision of married women to participate in the labor force. We found that education of the respondent, number of off springs, number of dependents, family size, income of husband, monthly expenditures of the family, positive attitude of husband and family towards the job of women, job satisfaction, have a positive impact on the labor force participation of married women. While age of the respondent, living with husband, strong relationship with spouse before marriage, satisfaction of house wives with their current life, restrictions from family regarding job, other earners in the family negatively affect the decision of married women to participate in the labor force. Rate of inflation prevailing in the economy of a country largely effect the labor force participation of married women. Keywords: labor force participation, Married women INTRODUCTION Labor force participation rate of married women in Pakistan is increasing day by day, the main reason behind which is high rate of inflation prevailing in our economy. With more and better job opportunities married women will participate more in the labor force which will accelerate overall growth of the economy, but a long time is needed for women to develop because of limited thinking pattern of our society. Ijaz and tasnim (2009) found that poverty pushes married women into labor force participation. Bordia (2006) cocluded that countries like in Pakistan and India limited employment opportunities are responsible for women’s low participation in the labor force. According to Faridi, Sharif, et al. (2009) the basic level of education is not sufficient to enter in the labor market; the minimum criterion for female labor market participation is Metric level education. According to Bratti (2003) education increases the job attachment of women. Highly educated women have low fertility and high labor force participation. When the labor force participation rate of a nation increases, the real GNP per capita also rises. Yang (2000) found that an increase in the labor force participation rate mostly comes from an increase in the educational expenditures of children. Women who are older, better educated, female head of the household, or coming from smaller better off urban families are more empowered to take decisions on their own about whether to get a job or not. In contrast, younger, poorly educated women who are from larger families enter the labor market not out of their own choice (Naqvi and Shahnaz 2002). Fertility also has a strong impact on the labor force participation rate of married women(Carrasco 2001). Leslie, Averett, et al. (2000) in their study reported that most of the women exit from labor force when they give born to new baby. The presence of children, especially young children, tends to reduce the participation of women, women leave employment to have children and re-enter employment as their children approach school age (Hyslop 1999) (Cohany and Sok 2007).
Transcript of DETERMINANTS OF MARRIED WOMEN LABOR …1)/2012(2.1-59).pdfDETERMINANTS OF MARRIED WOMEN LABOR FORCE...
Academic Research International
ISSN-L: 2223-9553, ISSN: 2223-9944
Vol. 2, No. 1, January 2012
Copyright © 2012 SAVAP International
www.savap.org.pk www.journals.savap.org.pk
599
DETERMINANTS OF MARRIED WOMEN LABOR FORCE
PARTICIPATION IN WAH CANTT: A DESCRIPTIVE ANALYSIS
Anbreen Bibi
Department of Economics,
University of Wah, Wah Cantt PAKISTAN
Asma Afzal Department of Economics,
University of Wah, Wah Cantt PAKISTAN
ABSTRACT
This paper is an attempt to determine the factors which effect the decision of married women to
participate in the labor force. We found that education of the respondent, number of off springs,
number of dependents, family size, income of husband, monthly expenditures of the family, positive
attitude of husband and family towards the job of women, job satisfaction, have a positive impact on
the labor force participation of married women. While age of the respondent, living with husband,
strong relationship with spouse before marriage, satisfaction of house wives with their current life,
restrictions from family regarding job, other earners in the family negatively affect the decision of
married women to participate in the labor force. Rate of inflation prevailing in the economy of a
country largely effect the labor force participation of married women.
Keywords: labor force participation, Married women
INTRODUCTION
Labor force participation rate of married women in Pakistan is increasing day by day, the main reason
behind which is high rate of inflation prevailing in our economy. With more and better job
opportunities married women will participate more in the labor force which will accelerate overall
growth of the economy, but a long time is needed for women to develop because of limited thinking
pattern of our society.
Ijaz and tasnim (2009) found that poverty pushes married women into labor force participation. Bordia
(2006) cocluded that countries like in Pakistan and India limited employment opportunities are
responsible for women’s low participation in the labor force.
According to Faridi, Sharif, et al. (2009) the basic level of education is not sufficient to enter in the
labor market; the minimum criterion for female labor market participation is Metric level education.
According to Bratti (2003) education increases the job attachment of women. Highly educated women
have low fertility and high labor force participation. When the labor force participation rate of a
nation increases, the real GNP per capita also rises. Yang (2000) found that an increase in the labor
force participation rate mostly comes from an increase in the educational expenditures of children.
Women who are older, better educated, female head of the household, or coming from smaller better
off urban families are more empowered to take decisions on their own about whether to get a job or
not. In contrast, younger, poorly educated women who are from larger families enter the labor market
not out of their own choice (Naqvi and Shahnaz 2002). Fertility also has a strong impact on the labor
force participation rate of married women(Carrasco 2001). Leslie, Averett, et al. (2000) in their study
reported that most of the women exit from labor force when they give born to new baby.
The presence of children, especially young children, tends to reduce the participation of women,
women leave employment to have children and re-enter employment as their children approach school
age (Hyslop 1999) (Cohany and Sok 2007).

Academic Research International
ISSN-L: 2223-9553, ISSN: 2223-9944
Vol. 2, No. 1, January 2012
Copyright © 2012 SAVAP International
www.savap.org.pk www.journals.savap.org.pk
600
Labor force participation of married women is highly influenced by a cut in wage or number of
working weeks of their husbands. Roberts (2003) found in his study that women are more responsive
to decrease in the weeks of work as compared to a cut off in wages of their husbands.
According to (Nam 1991) Women, particularly married women whose male household heads were
self-employed in the tertiary sector, family workers, or unemployed, were almost two to three times
more likely to participate in the labor market than those in high status families.
There is a negative impact of household extension on the labor force participation rate of married
women. The reason for this that some householders are taking in family or friends, whose child care
responsibilities are focused on their own children rather than on the householder's children It is likely
that another subfamily in the household increases the woman's overall domestic duties and thus
reduces even further the amount of time she might have for paid employment (Osenbaum and
Ilbertson 1995). On the other hand Co residence with one's own parents or in-laws has a significant
positive effect on married women's labor force participation. This suggests that co residence allows
married women to share the burden of household work with their parents or in-laws, thus leading to
the in- creased probability of labor force participation (Sasaki 2000).
With the increase in average cost of child care, the participation of mothers in the labor force
decreases. By controlling the cost of child care, an increase in the predicted number of infants has no
effect on the probability of participating, while an increase in the number of preschoolers actually
raises the probability of participating (Connelly 1992).
Objective of the Study
This study is an attempt mainly to explore why some married women are engaged in earning
activities, and why some married women are not participating in labor force.
DATA AND VARIABLES
Our sample consists of 146 married women aging from 20 to 70 in the city of Wah Cantt(Pakistam).
The study uses both quantitative and qualitative data, collected through structured interviews and
questionnaires. The dependent variable is labor force participation of married women.
The explanatory variables are age and education of the respondent, her current marital status,
empowerment, decision power, wage rate, number of children, type of family in which she is living,
family size, employment status of husband, income and education of husband, other earners in the
family and their relationship with the respondent, rate of inflation in the economy, sex ratio, monthly
expenditures of her family, attitude of her husband and family towards working women, family
restrictions, views of the respondent regarding labor force participation decision. All these variables
have direct and indirect influence on the labor force participation rate of married women.
All sampling units are selected randomly from each area (includes 40 various places). Combined
information was collected on women and their households through questionnaire. In the questionnaire
two separate parts were formed for participating/employed and non-participating/unemployed women.
RESULTS AND DESCRIPTIVE ANALYSIS
In general the participation of women in the labor force is thought to have a good impact on the
economic condition of the whole family as well as on the economy of the country. Even then many of
the women are reluctant to go outside home and work. One of the reasons for this is that the first and
major duty of a woman in our society is to look after her children and perform household duties
properly. Still a large number of women who have enough education and training are participating in
the labor force.
Respondents’ opinions regarding their job status are recorded and thoroughly analyzed. The analysis
shows that most of the respondents are satisfied with their current status regarding employment. The
women who are participating in the labor force are happy with it and are not ready to quit their job

Academic Research International
ISSN-L: 2223-9553, ISSN: 2223-9944
Vol. 2, No. 1, January 2012
Copyright © 2012 SAVAP International
www.savap.org.pk www.journals.savap.org.pk
601
until and unless they are confronted with some serious problem. Same is true for house wives i.e. they
are not willing to work outside home except some serious problem.
It was also observed from the data analysis that for almost all the women children are the main
consideration in taking decision about participating in the labor force. Majority of the women who are
participating in the labor force are doing for the welfare of their children, similarly majority of the
house wives are not doing job in order to look after their children in a proper way.
Now we will presents the observed relationship of labor force participation of married women with
the different variables in the study.
General Characteristics of Respondents
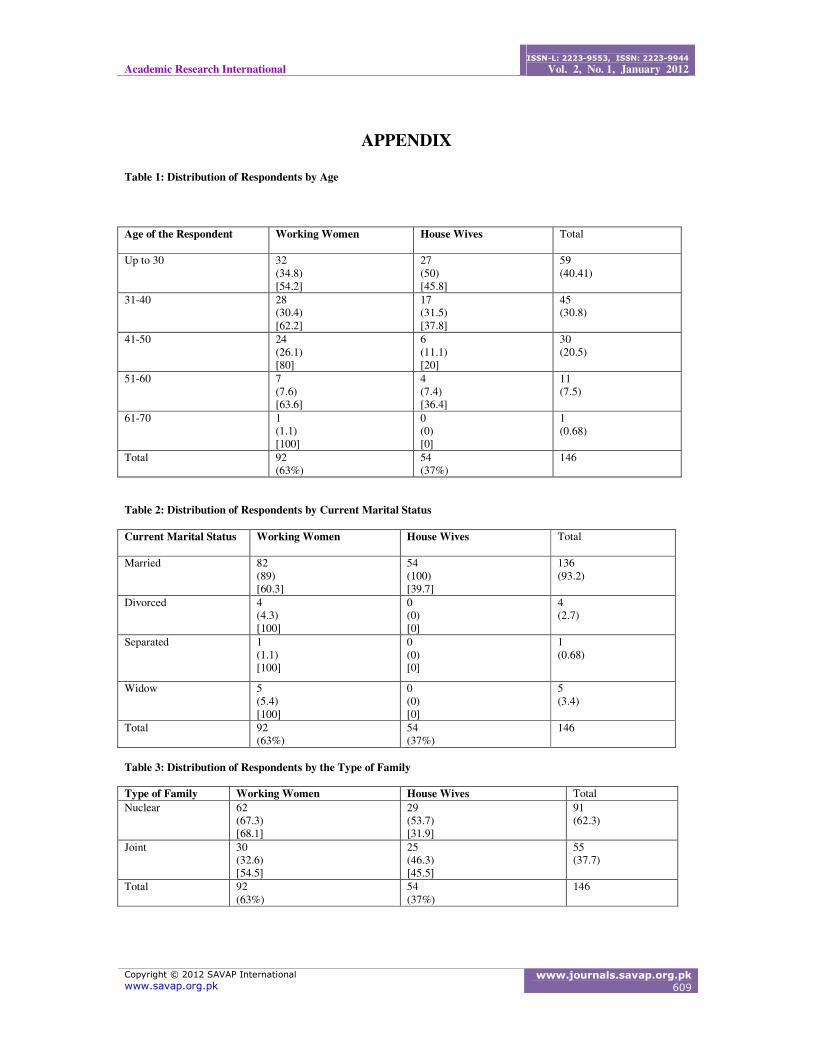
Age of the respondent
One of the main determinants of labor force participation rate of married women is their age. There
exist a negative relationship between the age and the labor force participation of married women i.e.
LFP of married women decreases with the increase in age. The labor force participation is maximum
at the age up to 30 years. After that it gradually goes down. The reason for this can be that in younger
age women are more energetic and (up to the age of 30 they are more often childless) and have less
family responsibilities so they have more time to work outside home. On the other hand in case of
house wives, the number of house wives decreases with the increase in the age. The women with the
age of less than 30 years constitute the major portion of married women not participating in the labor
force. The main reason for this might be the change of station after marriage and increased family
responsibility
Marital status
Marital status of women is an important determinant of the decision of women to work in the market.
In this study all the women who are not living with their husband (i.e. divorced, separated or widow)
are doing job. It shows that living with husband has a negative relation with the labor force
participation of married women. On the other hand in this study all the housewives are living with
their husbands.
Family type
In Pakistan two types of family setups exist nuclear, i.e. living only with husband and children, and
joint, i.e. living with some other people (mostly parents and siblings of the husband) in addition to
husband and children.
67% of total working women in the study are living in the nuclear family while 37% are living in joint
family system. The proposition of women who are living in nuclear family and doing job is
comparatively high. One reason for this might be that in nuclear families there is only one earner (i.e.
husband) so women also participate in labor force to finance the expenditures of their family. On the
other hand out of total housewives 54% are living in nuclear family while 46% were living in joint
family. Most of these women were not participating in the LF because they want to look after their
children more properly and due to lack of qualification and training.
Family size
Family size is an important variable in the decision of women to participate in the LF. Women with
small family size are more likely to participate in the labor force as compared to the women with
larger family size. women having family size below 5 have a greater participation rate, it is because of
less house hold responsibilities on them so they have more time to work outside home. The women
with the family size from 5 to 10 are more likely to participate in the LF, it is because with the
increase in the family size number of dependents increases (dependents are mostly their own
children), so the women participate more in the labor force to finance high expenditures of their
children. Another reason for this might be that with the increase in the family size there might be
some other persons to perform household duties so mothers are free to go out and work. The women
with family size greater than 10 are less likely to participate in the labor force, the reason for this is

Academic Research International
ISSN-L: 2223-9553, ISSN: 2223-9944
Vol. 2, No. 1, January 2012
Copyright © 2012 SAVAP International
www.savap.org.pk www.journals.savap.org.pk
602
that with the increase in the family size the number of earners also increases, (as women with family
size more than 10 are usually living in a joint family), so they participate less in the LF.
On the other hand the reason of women who are not participating in the LF is that regardless of family
size, to perform household duties and to look after her children is considered as the first duty of a
married woman in Pakistan.
Relationship with spouse before marriage
The labor force participation of women who had no relationship with their spouse before marriage is
more. As the before marriage relationship becomes stronger the participation rate of women in the
labor force decreases. The reason for this might be that in blood relationships more attachment is
involved and husband does not want to put much work burden on her wife.
Personal Characteristics of Participating and Non Participating Women
Education of the respondent
There is a positive relation between level of education and LFP of married women. The increase in
education the chance of not working in the market decreases. There is a remarkable increase in the
LFP after intermediate. It is because the women with high education have more job opportunities. The
small proposition of women having who are having enough education but still are not participating in
the LF accounts for family customs, non willingness to do job, extra burden of household duties.
Employment status of the respondents
In our study almost 63% women were participating in the labor force while 37% were house wives.
Occupation of the respondents
Selection of occupation depends upon the choice and preference of the person. Most of the women
think of teaching as the most suitable and feasible profession for them because of a lot of benefits
attached to this profession for example long summer and winter vacations, less working hours, least
public dealing etc. One of the reasons of women who are not participating in the labor force could be
that they are unable to get a job of their choice. So instead of acquiring an occupation in which they
are not interested they prefer to stay unemployed.
Number of years of job of the respondents
Number of years of job should also be considered while studying the LFP of married women. Most of
the women have less job experience and fewer women lie in the category of more number of years of
job. The reason for this is that with time women quit job because of various reasons (for example ill
health, much workload etc) and very less women participate in LF till their age of retirement.
Income of the respondents
Income is an important variable in determining the LFP of married women. It acts as an incentive for
job. There is a positive relation between income and LFP. We made income categories in the light of
data obtained. E.g. (2000-10000), (11000-15000), (16000-20000)....... above 650000. As we know
that for high income high education and experience is required. For this reason there are fewer women
in the categories of high income and women are concentrated in the categories showing middle level
of income.
Reasons of participating in the labor force
Presence of children is one of the most important determinants of labor force participation rate of
married women. Most of the women in our society are doing job because they want to give their
children a better life. So children are the basic reason of participation of married women in the labor
force. Among other reasons for the utilization of knowledge and high rates of expenditures are
important. It is noteworthy that for all the reasons for which women are participating in the labor
force has a positive impact on the LFP rate of married women.

Academic Research International
ISSN-L: 2223-9553, ISSN: 2223-9944
Vol. 2, No. 1, January 2012
Copyright © 2012 SAVAP International
www.savap.org.pk www.journals.savap.org.pk
603
Reasons of entering into the labor force
All the reasons for which the women will enter into the labor force have a positive relationship with
the labor force participation rate of married women. High rates of expenditures and financial down
fall are the two major reasons for the women to enter into the labor force. High rates of expenditures
will be most probably because of children so it indirectly points out children to be the main reason for
house wives to enter into the labor force. Almost 48% house wives are ready to entre into the labor
force due to high rates of expenditures while 30% will enter in to the LF due to financial downfall.
Reasons to quit job
All the reasons for which the women will quit job have a negative relationship with the labor force
participation rate of married women. As told earlier the children are the most important reason for
women to be in the labor force but it is also note worthy that children are also one of the main reason
for which women will leave the labor force. Most of the women are ready to quit job if their children
needs more time. Much work load and ill health are also major reasons to quit job.
Financial status: a reason to quit job
To be financially strong is thought to be a reason to quit job. But decision to leave the labor force is
more likely to be dependent on the job satisfaction than on the financial status. So majority of the
women do not want to quit job even if they financially become strong.
Almost 64% of women are not willing to quit their job while almost 36% of women will quit job if
they financially become strong.
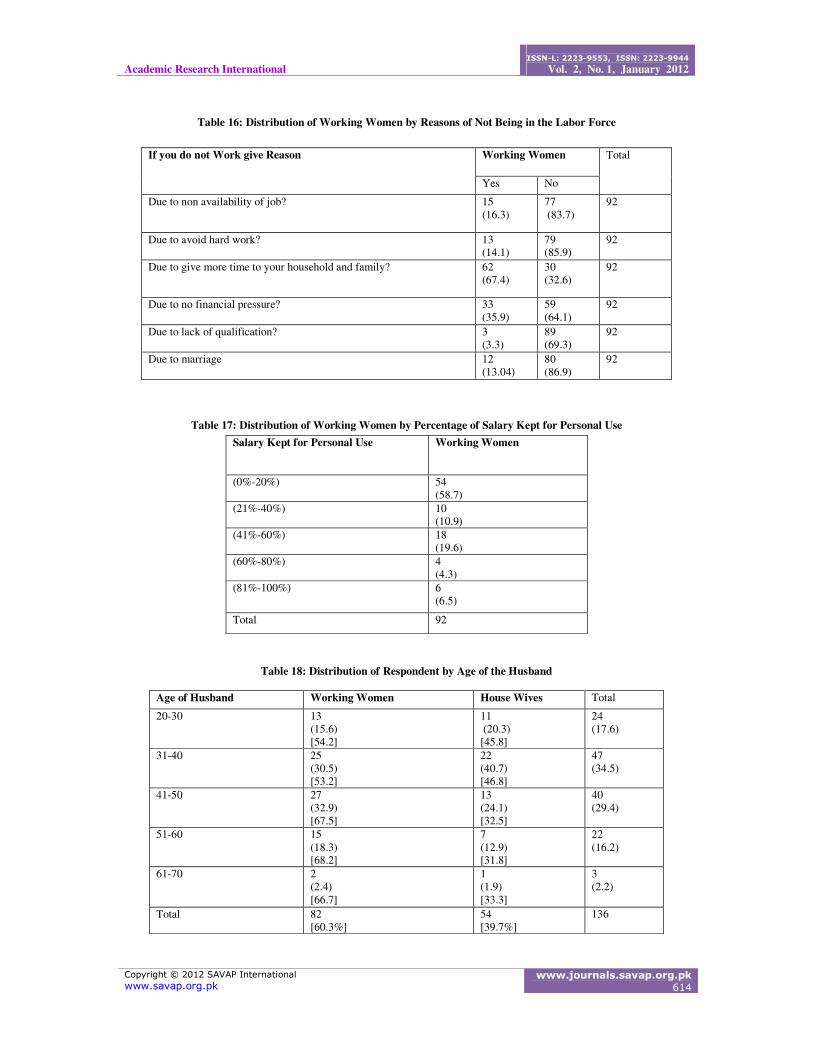
Reasons of not being in the labor force
There are various reasons for which women are not participating in the labor force and women who
are currently are participating in the labor force will not be working outside home anymore. Some of
the important reasons are non availability of job, to avoid hard work, to give more time to children
and household, no financial pressure, lack of qualification and training, due to marriage. Most of the
women, working as well as house wives, do not consider non availability of job and to avoid hard
work as reasons of their not being in the LB. If we talk about giving more time to household and
children, then almost 82% housewives are not doing job due to this reason while 67% of working
women think of it as a reason of their not being in the labor force. So to give more time to household
and children largely effect the decision of women to participate in the labor force. 70% of housewives
are not doing job because of no financial pressure. So this is also one of the main reasons of their low
participation in the labor force. On the other hand 40% of the women think of no financial pressure as
a reason of not doing job. In case of lack of qualification a large amount of house wives do not
participate in the LF because they do not have enough education. While only a few working women
consider it a reason of their not being in the LF. Marriage is a reason of many house wives for their
not being in the labor force while a few working women think of their being married to be a reason of
their non participation in the LF.
Salary for personal usage
By the salary kept for personal use we mean that portion of the respondent’s income which she
entirely spends on her own self. Majority of the women keep only 0% to 20% of their salary for their
personal use. And major part of their salary is utilized to run house or to meet the necessities of their
children. Women who keep 21% to 40% and 41% to 60% of their salary for their own use are 11%
and 20% respectively. Most of which are childless or have children who are not dependent on them.
So from this pattern we can say that most of the women participate in the LF to meet the high
expenditures of their children and family.
Age of the husband
Age of the husband is thought to have some effect the participation rate of married women. But in this
study no definite relationship between participation rate of married women and age of their husband
has been found. In case of working women the LFP increases up to the age of 50 years and then it

Academic Research International
ISSN-L: 2223-9553, ISSN: 2223-9944
Vol. 2, No. 1, January 2012
Copyright © 2012 SAVAP International
www.savap.org.pk www.journals.savap.org.pk
604
decreases. Similarly in the case of house wives, the number of house wives increases and then
decreases. So we can see that there is no definite relationship between LFP rate of married women
and age of their husbands.
Education of the husband
Education of the husband has a positive relationship with the labor force participation rate of wife.
Along with the increase in the level of education of husband the labor force participation of women
increases. It is also note worthy that the participation rate of those women whose husbands are
illiterate is higher. 50% women whose husbands are illiterate are participating in the LF. It is so
because being illiterate one cannot earn that much (as wage rate is mostly determined by the level of
education). So in order to meet the expenditures of family the wives of illiterate husbands are also
participating in the labor force. Then there is a decrease in the participation rate as education of
husband increases. The ratio of house wives is more than those of participating in the labor force at
husband’s educational levels of middle and matric. The reason for this might be that the level of
education of these women is also low and they are unable of getting a reasonable job. After matric
there is an increase in the participation rate of women. As the level of education of husbands increases
the labor force participation rate of married women also increases. The reason is that these women are
also having enough qualification to get a reasonable job. Moreover besides the fact that there
husbands are going job they also participate in the labor force due to high rate of inflation prevailing
in our economy. They have to work outside home to meet the high rates of expenditures of their
family.
Employment status of the husband
Employment status of husband is an important determinant of labor force participation rate of married
women. The women whose husbands are unemployed are more likely to participate in the labor force.
But in the country like Pakistan, where high rate of inflation prevails, employment status of the
husband has a little effect on the participation rate of wife in the labor force. A large number of
women are doing job, regardless of the fact that husbands are employed, high rate of inflation and
expenditures and high level of education of women account for reasons of this.
Income of the husband
Though income of the husband is thought to have a strong impact on the participation rate of wife but
similar to the employment status of the husband in the countries like Pakistan it has a little impact on
the labor force participation rate of married women due to the high rate of inflation prevailing in the
economy of Pakistan. The participation rate of married women first increases along with the increase
in the income of their husbands. At low levels of income (for example 2000-10000 or 11000-15000)
the ratio of housewives is greater. The reason for this can be that as income level of these husbands is
low characterized by low level of education, likewise the education level of their wives is also low (in
most of the cases), so they have less job opportunities. In the income categories of husbands above
15000, the participation rate of women increases because these women must be educated enough to
get a job.
Attitude of husband and family towards the job of respondent
Attitude of husband and family towards the job of women matters a lot. The positive attitude of
husband and family has a positive impact while a negative attitude has a negative impact on the
participation rate of married women in the labor force. In the present study the attitude of majority of
husbands and families towards the job of women is co operative.
Empowerment in household decisions
Women who are participating in the labor force are thought to be more empowered in house hold
decisions. The ratio of women who are not at all empowered in household decisions is higher in house
wives than in working women. Similarly the ratio of women who are more than 80% empowered in
household decisions is greater in working women. So we can say that at the lower extreme i.e. below
20% are those women who are not participating in the labor force while at the upper extreme i.e.

Academic Research International
ISSN-L: 2223-9553, ISSN: 2223-9944
Vol. 2, No. 1, January 2012
Copyright © 2012 SAVAP International
www.savap.org.pk www.journals.savap.org.pk
605
above 81% are those women who are participating in the labor force. This shows the strong position
of working women. The most important reason for this might be that they are earning something for
their family. So participation in the labor force has a positive impact on the position of women at
home.
Empowerment in the decision of doing job
The empowerment in the decision to do job is very important in determining the participation rate of
married women in the labor force. Most of the women now a day are empowered regarding their
decision to do job. In this study 91% women were empowered in the decision of doing job while only
9% were not.
Satisfaction of working women regarding their current status
Satisfaction level of working women regarding their job and other aspects of life is very important.
The more the women are satisfied with their current life the more will be their chances to stay in the
labor force. There is a positive relationship between job satisfaction and labor force participation of
married women because if the women are not satisfied with their job they will quit from that job and
labor force participation rate will be decreased.
Satisfaction of house wives regarding their current status
Satisfaction level of a house wife regarding their current unemployed status and other aspects of life is
very important. The more the house wives are satisfied with their current life the less they will be
willing to enter the labor force. Most of the house wives were satisfied with their present life so their
chances to enter into the labor force are low.
Restrictions regarding job
Restrictions are hurdles in the participation of married women in the labor force. So there is a
negative impact of restrictions on labor force participation rate of married women. Restrictions
decreases the level of job satisfaction hence negatively affects the participation rate of married
women. Now a days majority of the working women do not face any restriction from their family
regarding their job.
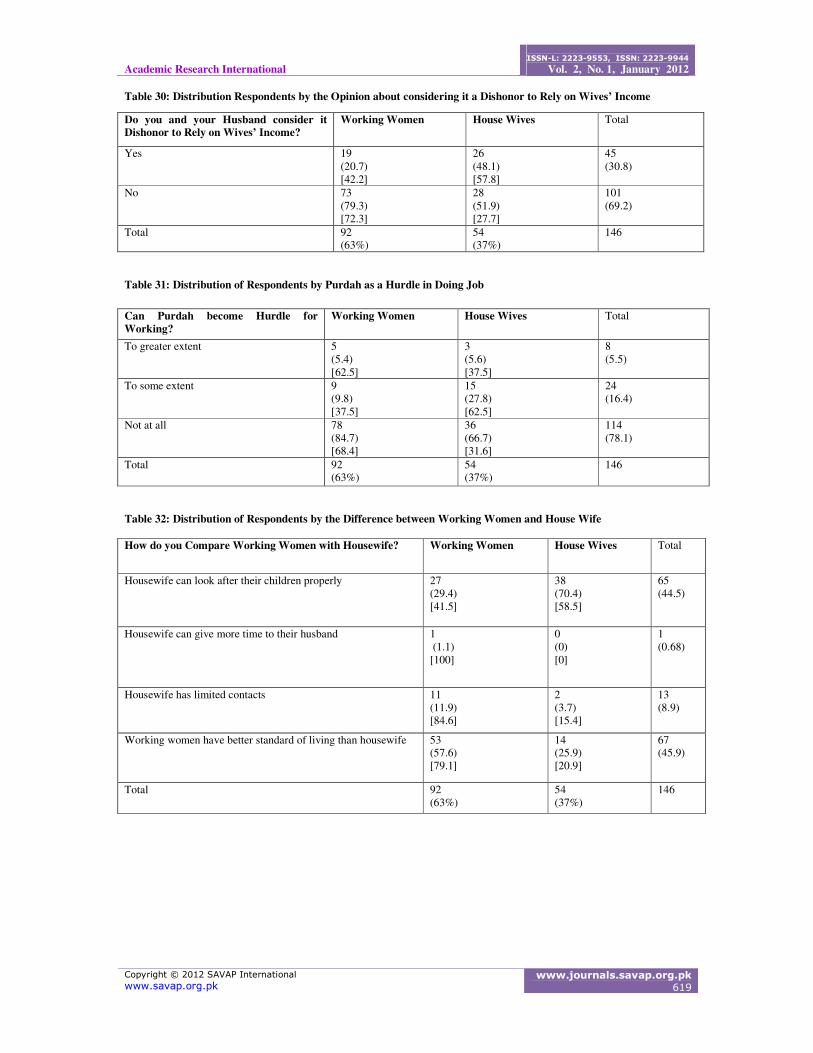
To rely on wives’ income; a dishonour
Most of the people in our society do not consider it a dishonour to rely on wives’ income. It has a
positive impact on the participation rate of married women in the labor force. It can be considered as
one of the reasons of increased labor force participation of married women.
The positive opinion of both husband and wife regarding considering relying on wives’ income a
dishonour has a negative impact on labor force participation of married women.
Impact of purdah on labor force participation of married women
Purdah has no negative impact on labor force participation rate of married women. A small proportion
of women considered purdah as a hurdle in the job while majority of women do not considered it as a
hurdle in their job.
Demographic Characteristics of Families of the Respondents
Number of off springs
Off springs is the most important part of a woman’s life. The whole world of a mother revolves
around her children. Off springs are one of the main reasons of both participation and non
participation of married women in the labor force. Presence of children has a positive impact on the
labor force participation of married women i.e. over all proportion of working women having children
is higher. Most of the childless ladies also do job because they do not have children so they have less
household responsibilities and have more time to work outside home.

Academic Research International
ISSN-L: 2223-9553, ISSN: 2223-9944
Vol. 2, No. 1, January 2012
Copyright © 2012 SAVAP International
www.savap.org.pk www.journals.savap.org.pk
606
Number of dependents
Presence of dependents has a positive impact on the rate of participation of married women in the
labor force. Number of dependents is one of the main reasons for married women to work outside
home. In majority of cases the dependents are their own off springs. Most of the women who do not
have any dependent are childless ladies. Fewer women have more dependent because all the children
do not entirely depend upon their mother. There are only a few cases in which all the children depends
upon the respondent (most of these respondents are widow, separated or divorced and they are very
less in proposition).
Other earners in the family and relationship of respondent with other earner
There is a negative relationship between the other earners in the family and labor force participation
of married women. The reason for this might be that with more earners in the family there might be
less financial problem so women are more likely to stay at home. Moreover when other members of
the family are involved in the job outside home the burden of household activities will be all on the
married women so they will not be able to work outside home. Along with the presence of other
earner in the family, his/her relationship with the woman is also important. If he/she is not supporting
the woman and her family then his/her presence has no effect on the LFP of woman, that is why many
women participate in the labor force besides the presence of other earners in the family.
Household Monthly Expenditures, Household Major Expenditure Items And Assets
Ownership
Monthly expenditures of the family and major expenditure items
High rates of expenditures are one of the major reasons of high labor force participation of married
women. As the expenditures increase, the participation rate also increases. Mostly women participate
in the labor force to meet the high rates of expenditures of their families. Most of the women mainly
spend on the education of their children, as education of off springs is the major expenditure item we
can say that the expenditures on education of off springs have a very strong impact on the labor force
participation rate of married women. An increase in the labor force participation rate mostly comes
from an increase in the educational expenditures (Yang 2000). Second major expenditure item of
majority of the women is food.
Net assets
By net assets we mean total amount of assets a person holds minus his total amount of liabilities. Net
assets tells us the overall economic condition of a family. The more the amount of net assets the more
will be the family financially sound. Respondents were fully investigated in order to estimate the true
value of their net assets. The possibility of participation of married women in the labor force rises
when net assets of the family are zero. Then there are consecutive increasing and decreasing patterns
in the participation rate which shows no strong effect of net assets on labor force participation rate of
married women. The women whose net assets are in negative value i.e. they have liabilities on them
are more likely to participate in the labor force, the reason for this is that the resources of their family
are not enough to run the household and to pay back the loan so they also do job to support their
family. So net assets of a family only affects the labor force participation of married women in two
cases i.e. either net assets are in negative or are zero.
From the above discussion, it is concluded that majority of the variables affect the labor force
participation of married women in the same way as they were thought to affect it. But there are also
some variables which gave opposite results for example education, employment status, income of
husband and number of off springs. They were thought to be in a negative relation with labor force
participation of married women but in actual they positively affect labor force participation of married
women.

Academic Research International
ISSN-L: 2223-9553, ISSN: 2223-9944
Vol. 2, No. 1, January 2012
Copyright © 2012 SAVAP International
www.savap.org.pk www.journals.savap.org.pk
607
CONCLUSION AND POLICY IMPLICATIONS
The study arrives at several interesting results. Off springs are the main reason of both participation
and non participation of married women in the LF. Many variables e.g. income, education and
employment status of husband, which were thought to have a negative impact on the LFP of married
women, positively affect the LFP of married women. It is because of the high rate of inflation
prevailing in the economy of Pakistan. Moreover we can say that working women are leading a better
life than housewives. Working women are more empowered to take household decisions (regarding
education, job, children etc). They are financially more sound, their children are more confident, they
are more independent and most importantly their standard of living is far better than a housewife.
From these results following policy implications are suggested:
1. To increase the labor force participation of married women, it is necessary that they should be
educated enough to get a reasonable job. So government should establish educational and
vocational institutions for adult women so that they can increase their skills and be able to
participate in the labor force.
2. More childcare centers should be established and childcare allowance should be given so that
women can to participate in the labor force.
3. Real wages should be increase. As a result the labor cut off rate of married women along with
their age will be decreased to greater extent. Minimum wage rate should also be determined.
4. Women should be taught through different awareness programs about the importance of their
participation in the labor force, its benefits to them, their family and whole nation.
REFRENCES
Anderson, B. J. and Dimon, D. (1998) “Married Women’s Labor Force Participation in Developing Countries:
A Case Study of Mexico” Estusios Economicos, Vol. 13, No. 1, pages 3-34, January-June 1998
Bordia, M. (2006) “Do Traditional Axes of Exclusion Affect Labor Market Outcomes in India?” Social
Development Papers-South Asia Series, Paper No. 97 June 2006
Bratti, M. (2003) “Labor Force Participation and Marital Fertility of Italian Women: The Role of Education”
Journal of Economic Population, Springer, Vol. 16, No. 3, pages 525-554, August 2003
Carrasco, R. (2001) “Binary Choice with Binary Endogenous Regressors in Panel Data: Estimating the Effects
of Fertility on Female Labor Force Participation” Journal Of Business and Economic Statistics, Vol. 19, No. 4,
pages 385-394, October 2001
Cohany, S. and Sok, E. (2007) “Trends in the Labor Force Participation of Married Mothers of Infants” Monthly
Labor Review, pages 9-16, February 2007
Connelly, R. (1992) “The Effect of Childcare Cost on Married Women’s Labor Force Participation” The Review
of Economics and Statistics, Vol. 74, No. 1, pages 83-90, February 1992
Faridi, Z. et al. (2009) “The Socio-Economic and Demographic Determinants of Women Work Participation in
Pakistan: Evidence from Bahawalpur District” A Research Journal of South Asian Studies, Vol. 24, No. 2, pages
351-367, July 2009,
Hyslop, R. (1999) “State Dependence, Serial Correlation and Heterogeneity in Intertemporal Labor Force
Participation of Married Women” Econometrica, Journal of the Econometric Society, Vol. 67, No. 6, pages
1255-1294, November 1999
Ijaz, R. and Tasnim, K. (2009) “Labor Force Participation of Married Women in Punjab (Pakistan)” Journal of
Economic and Social Research, 11(2) 2009, pages 77-106

Academic Research International
ISSN-L: 2223-9553, ISSN: 2223-9944
Vol. 2, No. 1, January 2012
Copyright © 2012 SAVAP International
www.savap.org.pk www.journals.savap.org.pk
608
Kornstad, T. and Thoresen, T. (2007) “A Discrete Choice Model for Labor Supply and Childcare” Journal of
Population Economics, Vol. 20, No. 4, pages 781-803, October 2007
Kwasi, A. (2000) “Labor Force Participation of Married Women: Do Region Matters?” The American
Economist, Vol. 44, No. 1, Pages 70-80, spring 2000
Naqvi, Z. and Lubna, S. (2002) “How Do Women Decide To Work In Pakistan?” The Pakistan Development
Review, 41:4 Part II, pages 495–513, winter 2002
Ondrich, J. et al. (1996) “Barefoot and in a German Kitchen: Federal Parental Leave and Benefit Policy and the
Return to Work after Child Birth in Germany” Journal of Population Economics, Springer, Vol. 9, No. 3, pages
247-266, August 1996
Osenbaum, E. and Ilbertson, G. (1995) “Mother’s Labor Force Participation in New York City: A Reappraisal
of the Influence of the Household Extension” Journal of Marriage and Family, Vol.57, No. 1, pages 343-249,
February 1995
Roberts, E. (2003) “Labor Force Participation by Married Women in the United States” Paper Presented at the
28th Social Science History Association Conference Baltimore (MD), 13-16 November 2003
Sasaki, M. (2000) “The Casual Effects of Family Structure on Labor Force Participation among Japanese
Married Women” The Journal of Resources Human, Vol. 37, No.2, pages 429-440, spring 2000
Sunghee, N. (1991) “Determinants of Female Labor Force Participation: A Study of Souel, South Korea, 1970-
1980” Sociological Forum, Springer, Vol. 6, No. 4, pages 641-659, December 1991
Union Council Census Report of Rawalpindi, Population Census Organization, Statistics Division, Government
of Pakistan, Islamabad, 1998
Whittington, L. et al. (2000) “Choosing Children over Carrier? Changes in the Postpartum Labor Force
Behavior of Professional Women” Population Research and Policy Review, Vol. 19, No.4, pages 339-355,
August 2000
Yang, H. (2000) “Education, Married Women’s Participation Rate, Fertility and Economic Growth” Journal of
Economic Development, Vol. 25, No. 2, pages 101-118, December 2000
Academic Research International
ISSN-L: 2223-9553, ISSN: 2223-9944
Vol. 2, No. 1, January 2012
Copyright © 2012 SAVAP International
www.savap.org.pk www.journals.savap.org.pk
609
APPENDIX
Table 1: Distribution of Respondents by Age
Table 2: Distribution of Respondents by Current Marital Status
Table 3: Distribution of Respondents by the Type of Family
Age of the Respondent
Working Women House Wives Total
Up to 30 32
(34.8)
[54.2]
27
(50)
[45.8]
59
(40.41)
31-40 28
(30.4)
[62.2]
17
(31.5)
[37.8]
45
(30.8)
41-50 24
(26.1)
[80]
6
(11.1)
[20]
30
(20.5)
51-60 7
(7.6)
[63.6]
4
(7.4)
[36.4]
11
(7.5)
61-70 1
(1.1)
[100]
0
(0)
[0]
1
(0.68)
Total 92
(63%)
54
(37%)
146
Current Marital Status
Working Women House Wives Total
Married 82
(89)
[60.3]
54
(100)
[39.7]
136
(93.2)
Divorced 4
(4.3)
[100]
0
(0)
[0]
4
(2.7)
Separated 1
(1.1)
[100]
0
(0)
[0]
1
(0.68)
Widow 5
(5.4)
[100]
0
(0)
[0]
5
(3.4)
Total 92
(63%)
54
(37%)
146
Type of Family Working Women House Wives Total
Nuclear 62
(67.3)
[68.1]
29
(53.7)
[31.9]
91
(62.3)
Joint 30
(32.6)
[54.5]
25
(46.3)
[45.5]
55
(37.7)
Total 92
(63%)
54
(37%)
146

Academic Research International
ISSN-L: 2223-9553, ISSN: 2223-9944
Vol. 2, No. 1, January 2012
Copyright © 2012 SAVAP International
www.savap.org.pk www.journals.savap.org.pk
610
Table 4: Distribution of Respondents by Family Size
Table 5: Distribution of Respondents by the Relationship with Spouse before Marriage
Table 6: Distribution of Respondents by Education
Education
Working Women House Wives Total
Illiterate 7
(7.6)
[46.7]
8
(14.8)
[5..3]
15
(10.3)
Primary 2
(2.2)
[28.6]
5
(9.3)
[71.4]
7
(4.8)
Middle 1
(1.1)
[20]
4
(7.4)
[80]
5
(3.4)
Matric 7
(7.6)
[29.2]
17
(31.5)
[70.8]
24
(16.4)
Intermediate 11
(11.9)
[61.1]
7
(12.9)
[38.9]
18
(12.3)
Graduate 23 6 29
Family Size Working Women House Wives Total
Below 5 31
(33.7)
[70.5]
13
(24.1)
[29.5]
44
(30.1)
(5-10) 56
(60.9)
[62.9]
33
(61.1)
[37.1]
89
(61)
(11-15) 5
(5.4)
[45.5]
6
(11.1)
[54.5]
11
(7.5)
Above 15 0
(0)
[0]
2
(3.7)
[100]
2
(1.4)
Total 92
(63%)
52
(37%)
146
Relationship with spouse before
marriage
Working Women House Wives Total
1st cousin 15
(16.3)
[40.5]
22
(40.7)
[59.5]
37
(25.3)
2nd cousin 18
(19.3)
[64.3]
10
(18.5)
[35.7]
28
(19.2)
Other relative 7
(7.6)
[77.8]
2
(3.7)
[22.2]
9
(6.2)
Members of zaat/ biradari 11
(11.9)
[73.3]
4
(7.4)
[26.7]
15
(10.3)
Unrelated and unknown 27
(29.3)
[73]
10
(18.5)
[27]
37
(25.3)
Unrelated but known 14
(15.2)
[70]
6
(11.1)
[30]
20
(13.6)
Total 92
(63%)
54
(37%)
146

Academic Research International
ISSN-L: 2223-9553, ISSN: 2223-9944
Vol. 2, No. 1, January 2012
Copyright © 2012 SAVAP International
www.savap.org.pk www.journals.savap.org.pk
611
(25)
[79.3]
(11.1)
[20.7]
(19.9)
Masters 36
(39.1)
[83.7]
7
(12.9)
[16.3]
43
(29.5)
M.Phill 5
(5.4)
[100]
0
(0)
[0]
5
(3.4)
Above M.Phill 0
(0)
[0]
0
(0)
[0]
0
(0)
Total 92
(63%)
54
(37%)
146
Table 7: Distribution of Respondents by Employment Status
Labor Force Participation
Working Women Housewives Total
92
(63%)
54
(37%)
146
Table 8: Distribution of Working Women by Occupation
Occupation of the Respondent Working Women
Professional 3
(3.2)
Business 4
(4.3)
Govt. Service 50
(54.3)
Private Service 32
(34.8)
Other 3
(3.2)
Total 92
Table 9: Distribution of Working Women by Number of Years of Job
Number of Years of Job Working Women
(0-5) 30
(32.6)
(6-10) 25
(27.1)
(11-15) 10
(10.9)
(16-20) 17
(18.4)
(21-25) 4
(4.3)
(26-30) 6
(6.5)
above 30 0
(0)
Total 92

Academic Research International
ISSN-L: 2223-9553, ISSN: 2223-9944
Vol. 2, No. 1, January 2012
Copyright © 2012 SAVAP International
www.savap.org.pk www.journals.savap.org.pk
612
Table 10: Distribution of Working Women by Income
Income of Working Women Working Women
(2000-10000) 29
(31.5)
(11000-15000) 11
(11.9)
(16000-20000) 15
(16.3)
(21000-25000) 11
(11.9)
26000-35000) 15
(16.3)
(36000-45000) 5
(5.4)
(46000-65000) 3
(3.2)
above 65 3
(3.2)
Total 92
Table 11: Distribution of Working Women by Reason Of Doing Job
Table 12: Distribution of Housewives by Reason to Enter Into the Labor Force
Reason of Doing Job? Working Women
To b independent 7
(7.6)
Husband unemployed 2
(2.2)
To give your children better life 43
(45.6)
Utilize knowledge 20
(21.7)
Grand salary 3
(3.3)
High expenditures 9
(9.8)
Time pass 2
(2.2)
Any other 6
(6.5)
Total 92
If you ever enter in job, what will be the
reason?
House Wives
To be independent 6
(11.1)
Financial down fall 16
(29.6)
Increased expenditures 26
(48.1)
Any other 6
(11.1)
Total 54

Academic Research International
ISSN-L: 2223-9553, ISSN: 2223-9944
Vol. 2, No. 1, January 2012
Copyright © 2012 SAVAP International
www.savap.org.pk www.journals.savap.org.pk
613
Table 13: Distribution of Working Women by Reason to Quit Job
If you ever quit your job, what will be the reason? Working Women
Salary is less 5
(5.4)
Negative attitude of people towards working women 2
(2.2)
B/c of children 32
(34.8)
B/c of husband 2
(2.2)
Workload 30
(30.4)
U r expecting 1
(1.1)
Other 20
(20.7)
Total 92
Table 14: Distribution of Working Women by the Decision of Continuing Job If Financially Becomes Strong
If you Financially become Strong then will you
Continue your Job?
Working Women
Yes 59
(64.1)
No 33
(35.9)
Total 92
Table 15: Distribution of Housewives by Reasons of Not Being in the Labor Force
If you do not Work give Reason House Wives Total
Yes No
Due to non availability of job? 12
(22.2)
42
(77.8)
54
Due to avoid hard work? 15
(27.8)
39
(72.2)
54
Due to give more time to your household and
family?
44
(81.5)
10
(18.5)
54
Due to no financial pressure? 38
(70.4)
16
(29.6)
54
Due to lack of qualification? 32
(59.3)
22
(40.7)
54
Due to marriage 24
(44.4)
30
(55.6)
54
Academic Research International
ISSN-L: 2223-9553, ISSN: 2223-9944
Vol. 2, No. 1, January 2012
Copyright © 2012 SAVAP International
www.savap.org.pk www.journals.savap.org.pk
614
Table 16: Distribution of Working Women by Reasons of Not Being in the Labor Force
Table 17: Distribution of Working Women by Percentage of Salary Kept for Personal Use
Table 18: Distribution of Respondent by Age of the Husband
Age of Husband Working Women House Wives Total
20-30 13
(15.6)
[54.2]
11
(20.3)
[45.8]
24
(17.6)
31-40 25
(30.5)
[53.2]
22
(40.7)
[46.8]
47
(34.5)
41-50 27
(32.9)
[67.5]
13
(24.1)
[32.5]
40
(29.4)
51-60 15
(18.3)
[68.2]
7
(12.9)
[31.8]
22
(16.2)
61-70 2
(2.4)
[66.7]
1
(1.9)
[33.3]
3
(2.2)
Total 82
[60.3%]
54
[39.7%]
136
If you do not Work give Reason Working Women Total
Yes No
Due to non availability of job? 15
(16.3)
77
(83.7)
92
Due to avoid hard work? 13
(14.1)
79
(85.9)
92
Due to give more time to your household and family? 62
(67.4)
30
(32.6)
92
Due to no financial pressure? 33
(35.9)
59
(64.1)
92
Due to lack of qualification? 3
(3.3)
89
(69.3)
92
Due to marriage 12
(13.04)
80
(86.9)
92
Salary Kept for Personal Use Working Women
(0%-20%) 54
(58.7)
(21%-40%) 10
(10.9)
(41%-60%) 18
(19.6)
(60%-80%) 4
(4.3)
(81%-100%) 6
(6.5)
Total 92

Academic Research International
ISSN-L: 2223-9553, ISSN: 2223-9944
Vol. 2, No. 1, January 2012
Copyright © 2012 SAVAP International
www.savap.org.pk www.journals.savap.org.pk
615
Table 19 Distribution of Respondents by Education of the Husband
Education of husband Working Women House Wives Total
Illiterate 3
(3.7)
[50]
3
(5.6)
[50]
6
(4.4)
Primary 0
(0)
[0]
1
(1.9)
[100]
1
(0.74)
Middle 3
(3.7)
[37.5]
5
(9.3)
[62.5]
8
(5.9)
Matric 17
(20.7)
[45.9]
20
(37.03)
[54.1]
37
(27.2)
Intermediate 17
(20.7)
[68]
8
(14.8)
[32]
25
(18.4)
Graduation 21
(25.6)
[67.7]
10
(18.5)
[32.3]
31
(22.8)
Masters 20
(24.4)
[74.1]
7
(12.9)
[25.9]
27
(19.9)
M.phil 1
(1.2)
[100]
0
(0)
[0]
1
(0.7)
Above M.phil 0
(0)
0
(0)
0
Total 82
(60.3%)
54
(39.7%)
136
Table 20: Distribution of Respondents by the Employment Status of the Husband
Employment Status of Husband Working Women House Wives Total
Working husbands 76
(92.7)
[59.4]
52
(96.3)
[40.6]
128
(94.1)
Non working husbands 6
(7.3)
[75]
2
[3.7]
[25]
8
(5.9)
Total 82
(60.3%)
54
(39.7%)
136

Academic Research International
ISSN-L: 2223-9553, ISSN: 2223-9944
Vol. 2, No. 1, January 2012
Copyright © 2012 SAVAP International
www.savap.org.pk www.journals.savap.org.pk
616
Table 21: Distribution of Respondents by Occupation of the Husband
Table 22: Distribution of Respondents by Income of the Husband
Occupation of Husband Working Women House Wives Total
Professional 1
(1.3)
[50]
1
(1.9)
[50]
2
Business 12
(15.8)
[57.1]
9
(17.3)
[42.9]
21
Govt. Service 48
(63.2)
[58.5]
34
(65.4)
[41.5]
82
Private Service 11
(14.5)
[73.3]
4
(7.7)
[26.7]
15
Farmer 0
(0)
[0]
1
(1.9)
[100]
1
Other 4
(5.3)
[57.1]
3
(5.7)
[42.9]
7
Total 76
(59.4%)
52
(40.6%)
128
Income of Husband Working Women House Wives Total
(2000-10000) 9
(11.1)
[42.9]
11
(20.4)
[55]
20
(14.8)
(11000-15000) 11
(13.6)
[36.7]
19
(35.2)
[63.3]
30
(22.2)
(16000-20000) 11
(13.6)
[68.75]
5
(9.3)
[31.3]
16
(11.9)
(21000-25000) 9
(11.1)
[75]
3
(5.6)
[25]
12
(8.9)
(26000-35000) 18
(22.2)
[81.8]
4
(7.4)
[18.2]
22
(16.3)
(36000-45000) 7
(8.6)
[58.3]
5
(9.3)
[41.7]
12
(8.9)
(46000-65000) 9
(11.1)
[90]
1
(1.9)
[10]
10
(7.4)
Above 65 7
(8.6)
[53.8]
6
(11.1)
[46.2]
13
(9.6)
Total 81
(60%)
54
(40%)
135

Academic Research International
ISSN-L: 2223-9553, ISSN: 2223-9944
Vol. 2, No. 1, January 2012
Copyright © 2012 SAVAP International
www.savap.org.pk www.journals.savap.org.pk
617
Table 23: Distribution of Working Women by the Attitude of Husband towards their Job
Attitude of Husband towards Job of the
Respondent
Working Women
Cooperative 75
(91.5)
Non cooperative 2
(2.4)
Against 0
(0)
Respectful 4
(4.9)
Not respectful 0
(0)
Helpful 1
(1.2)
Not helpful 0
(0)
Total 82
Table 24: Distribution of Working Women by the Attitude of the Family towards their Job
Table 25: Distribution of Respondents by Empowerment in the Household Decisions
Attitude of Family towards the Job of Respondent Working Women
Cooperative 79
(85.9)
Non cooperative 3
(3.2)
Against 2
(2.2)
Respectful 3
(3.2)
Not respectful 0
(0)
Helpful 5
(5.4)
Not helpful 0
(0)
Total 92
Empowered in the
Household Decisions
Working Women House Wives Total
0% 3
(3.3)
[30]
7
(12 .9)
[70]
10
(6.8)
(1%-20%) 3
(3.3)
[33.3]
6
(11.1)
[66.7]
9
(6.2)
(21%-40%) 4
(4.3)
[44.4]
5
(9.2)
[55.6]
9
(6.2)
(41%-60%) 45
(48.9)
[64.3]
25
(46.3)
[35.7]
70
(47.9)
(60%-80%) 10
(10.9)
[52.6]
9
(16.7)
[47.4]
19
(13)
(81%-100%) 27
(29.3)
[93.1]
2
(3.7)
[6.9]
29
(19.9)
Total 92
(63%)
54
(37%)
146

Academic Research International
ISSN-L: 2223-9553, ISSN: 2223-9944
Vol. 2, No. 1, January 2012
Copyright © 2012 SAVAP International
www.savap.org.pk www.journals.savap.org.pk
618
Table 26: Distribution of Respondents by the Empowerment in the Decision of Doing Job
Table 27: Distribution of Working Women by Job Satisfaction
Table 28: Distribution of Housewives by satisfaction regarding current status
Do you think you are leading a better life than a
Working Woman?
House Wives
Yes 44
(81.5)
No 10
(18.5)
Total 54
Table 29: Distribution of Working Women by Restrictions from the Family Regarding Job
Respondent’s Empowerment in
Decision of doing Job
Working Women House Wives Total
Yes 91
(98.9)
[68.4]
42
(77.8)
[31.6]
133
(91.1)
No 1
(1.1)
[7.7]
12
(22.2)
[92.3]
13
(8.9)
Total 92
(63%)
54
(37%)
146
Do you think you are leading a better life than a
Housewife?
Working Women
Yes 85
(92.4)
No 7
(7.6)
Total 92
What Are The Family Restrictions On You
Regarding To Your Job?
WORKING WOMEN
Come home early 7
(7.6)
Can’t attend office parties 2
(2.2)
Can’t invite male colleagues at home 12
(13.04)
Can’t work with males 2
(2.2)
Any other 0
(0)
No restrictions 69
(75)
Total 92
Academic Research International
ISSN-L: 2223-9553, ISSN: 2223-9944
Vol. 2, No. 1, January 2012
Copyright © 2012 SAVAP International
www.savap.org.pk www.journals.savap.org.pk
619
Table 30: Distribution Respondents by the Opinion about considering it a Dishonor to Rely on Wives’ Income
Table 31: Distribution of Respondents by Purdah as a Hurdle in Doing Job
Table 32: Distribution of Respondents by the Difference between Working Women and House Wife
How do you Compare Working Women with Housewife? Working Women House Wives Total
Housewife can look after their children properly 27
(29.4)
[41.5]
38
(70.4)
[58.5]
65
(44.5)
Housewife can give more time to their husband 1
(1.1)
[100]
0
(0)
[0]
1
(0.68)
Housewife has limited contacts 11
(11.9)
[84.6]
2
(3.7)
[15.4]
13
(8.9)
Working women have better standard of living than housewife 53
(57.6)
[79.1]
14
(25.9)
[20.9]
67
(45.9)
Total 92
(63%)
54
(37%)
146
Do you and your Husband consider it
Dishonor to Rely on Wives’ Income?
Working Women House Wives Total
Yes 19
(20.7)
[42.2]
26
(48.1)
[57.8]
45
(30.8)
No 73
(79.3)
[72.3]
28
(51.9)
[27.7]
101
(69.2)
Total 92
(63%)
54
(37%)
146
Can Purdah become Hurdle for
Working?
Working Women House Wives Total
To greater extent 5
(5.4)
[62.5]
3
(5.6)
[37.5]
8
(5.5)
To some extent 9
(9.8)
[37.5]
15
(27.8)
[62.5]
24
(16.4)
Not at all 78
(84.7)
[68.4]
36
(66.7)
[31.6]
114
(78.1)
Total 92
(63%)
54
(37%)
146

Academic Research International
ISSN-L: 2223-9553, ISSN: 2223-9944
Vol. 2, No. 1, January 2012
Copyright © 2012 SAVAP International
www.savap.org.pk www.journals.savap.org.pk
620
Table 33: Distribution of Respondents by Number of Off Springs
Table 34: Distribution of Working Women by the Number of Dependents
Number of Dependents Working Women
0 21
(22.8)
(1-3) 56
(60.9)
(4-6) 13
(14.1)
(7-9) 2
(2.2)
Total 92
(100%)
Table 35: Distribution of Working Women by Relationship with Dependents
Number of Off Springs Working Women House Wives Total
0 10
(10.9)
[58.8]
7
(12.9)
[41.2]
17
(11.6)
1-2 36
(39.1)
[62.1]
22
(40.7)
[37.9]
58
(39.7)
3-5 41
(44.6)
[64.1]
23
(42.6)
[35.9]
64
(43.8)
6-8 4
(4.3)
[66.7]
2
(3.7)
[33.3]
6
(4.1)
Above 8 1
(1.1)
[100]
0
(0)
[0]
1
(0.68)
Total 92
(63%)
54
(37%)
146
Relationship with Dependents Working Women
Children 58
(82.9)
Other 5
(7.04)
Whole family 5
(7.04)
Children + other 3
(4.2)
Total 70
(100%)

Academic Research International
ISSN-L: 2223-9553, ISSN: 2223-9944
Vol. 2, No. 1, January 2012
Copyright © 2012 SAVAP International
www.savap.org.pk www.journals.savap.org.pk
621
Table 36: Distribution of Respondents by Others Earners in the Family
Table 37: Distribution of Respondents by Other Earner’s Relationship with the Respondent
Table 38: Distribution of Respondents by Total Monthly Expenditures of the Family
Other Earners in the Family Working Women House Wives Total
Yes 24
(26.1)
[51.1]
23
(42.6)
[48.9]
47
(32.2)
No 68
(73.9)
[68.7]
31
(57.4)
[31.3]
99
(67.8)
Total 92
(63%)
54
(37%)
146
Other Earner’s Relationship with
Respondent
Working Women House Wives Total
Children 10
(41.7)
[62.5]
6
(26.1)
[37.5]
16
(34.04)
In-laws 10
(41.7)
[38.5]
16
(69.6)
[61.5]
26
(55.3)
Parents 4
(16.7)
[100]
0
(0)
[0]
4
(8.5)
Children + in-laws 0
(0)
[0]
1
(4.3)
[100]
1
(2.1)
Total 24
(51.1%)
23
(48.9%)
47
Total Monthly Expenditure of the
Family
Working Women House Wives Total
(8000-15000) 18
(19.6)
[51.4]
17
(31.5)
[48.6]
35
(23.9)
(16000-20000) 19
(20.6)
[76]
6
(11.1)
[24]
25
(17.1)
(21000-25000) 8
(8.7)
[61.5]
5
(9.3)
[38.5]
13
(8.9)
(26000-30000) 12
(13.04)
[60]
8
(14.8)
[40]
20
(13.7)
(31000-35000) 4
(4.3)
[50]
4
(7.4)
[50]
8
(5.5)
(36000-45000) 8
(8.7)
[61.5]
5
(9.3)
[38.5]
13
(8.9)
(46000--65000) 15
(16.3)
[75]
5
(9.3)
[25]
20
(13.7)
(66000-80000) 3
(3.3)
[60]
2
(3.7)
[40]
5
(3.4)
Above 80000 5
(5.4)
2
(3.7)
7
(4.8)

Academic Research International
ISSN-L: 2223-9553, ISSN: 2223-9944
Vol. 2, No. 1, January 2012
Copyright © 2012 SAVAP International
www.savap.org.pk www.journals.savap.org.pk
622
Table 39: Distribution of Respondents by Major Expenditure Items
Table 40: Distribution of Respondents by Net Assets
Net Assets Working Women House Wives Total
Nil 20
(21.7)
[100]
0
(0)
[0]
20
(13.7)
Up to 20000 1
(1.1)
[25]
3
(5.6)
[75]
4
(2.7)
Above 20000-50000 7
(7.6)
[87.5]
1
(1.9)
[12.5]
8
(5.5)
Above 50000-1 lac 5
(5.4)
[83.3]
1
(1.9)
[16.7]
6
(4.1)
Above 1 lac- 5 lac 8
(8.7)
[80]
2
(3.7)
[20]
10
(6.8)
Above 5 lac-20 lac 19
(20.7)
[52.8]
17
(31.5)
[47.2]
36
(24.7)
Above 20 lac-50 lac 10
(10.9)
[43.5]
13
(24.1)
[56.5]
23
(15.8)
Above 50 lac-1 billion 13
(14.1)
[56.5]
10
(18.5)
[43.5]
23
(15.8)
Above 1 billion 6
(6.5)
[50]
6
(11.1)
[50]
12
(8.2)
Net assets in negative 3
(3.3)
[75]
1
(1.9)
[25]
4
(2.7)
Total 92
(63%)
54
(37%)
146
.Note (For each table): Values in round brackets are percentages from the column totals, while the
values in the square brackets are percentages from the row totals.
[71.4] [28.6]
Total 92
(63%)
54
(37%)
146
Major Expenditure Items Working Women House Wives Total
Food 30
(32.6)
[50.8]
29
(53.7)
[49.2]
59
(40.4)
Clothing 3
(3.2)
[60]
2
(3.7)
[40]
5
(3.4)
Utility bills 14
(15.2)
[93.3]
1
(1.9)
[6.6]
15
(10.3)
Education 45
(48.9)
[67.2]
22
(40.7)
[32.8]
67
(45.9)
Transportation 0
(0)
[0]
0
(0)
[0]
0
(0)
Total 92
(63%)
54
(37%)
146