Detection of Larval Aggregations Using a Drone Mounted ...
164
University of New Haven Digital Commons @ New Haven Master's eses Student Works 5-2019 Detection of Larval Aggregations Using a Drone Mounted ermal Imaging Camera Megan Descalzi University of New Haven Follow this and additional works at: hps://digitalcommons.newhaven.edu/masterstheses Part of the Forensic Science and Technology Commons Comments Commiee members: Peter Massey, Sasha Voss Recommended Citation Descalzi, Megan, "Detection of Larval Aggregations Using a Drone Mounted ermal Imaging Camera" (2019). Master's eses. 108. hps://digitalcommons.newhaven.edu/masterstheses/108
Transcript of Detection of Larval Aggregations Using a Drone Mounted ...

University of New HavenDigital Commons @ New Haven
Master's Theses Student Works
5-2019
Detection of Larval Aggregations Using a DroneMounted Thermal Imaging CameraMegan DescalziUniversity of New Haven
Follow this and additional works at: https://digitalcommons.newhaven.edu/mastersthesesPart of the Forensic Science and Technology Commons
CommentsCommittee members: Peter Massey, Sasha Voss
Recommended CitationDescalzi, Megan, "Detection of Larval Aggregations Using a Drone Mounted Thermal Imaging Camera" (2019). Master's Theses. 108.https://digitalcommons.newhaven.edu/masterstheses/108

THE UNIVERSITY OF NEW HAVEN
DETECTION OF LARVAL AGGREGATIONS USING
A DRONE MOUNTED THERMAL IMAGING CAMERA
A THESIS
Submitted in partial fulfillment
of the requirements for the degree of
MASTER OF SCIENCE IN FORENSIC SCIENCE
BY
Megan Descalzi
University of New Haven West Haven, Connecticut
May 2019

iii
ACKNOWLEDGEMENTS
First and foremost, I would like to thank my supervisor, Dr. Chris O’Brien, for his
unconditional support and guidance over the past two years. The knowledge I have gained and
the experiences I have had in being your student have been far greater than anything I could have
ever learned within a classroom. Every single day you have made me a better scientist and a
better person by challenging me to “think smarter, not harder,” and by pushing me outside of my
comfort zone where I have learned, time and time again, that I am capable of anything. Thank
you for providing me with such incredible opportunities to learn and grow from, and that have
made my time here worthwhile. From our research trips to Horse Island, to traveling to present in
Western Australia, to a horse necropsy and to even just sitting around laughing our asses off in
the lab at your endless jokes – these moments, and so many more, will be what I remember most
from my time in this program. This entire research experience is one of the best things to ever
happen to me, and I am so grateful to have had the chance to be your student. While there were
many times where I wanted to call it quits throughout this research, I am incredibly thankful that
you constantly pushed me to keep working hard because I am now so proud of what I have been
able to achieve and how far I have come since the beginning. It is above and beyond what I ever
thought I could accomplish two years ago, and it all would not have been possible without you.
We make a pretty good team and have accomplished a lot in this short amount of time, and I am
excited to see what we continue to accomplish in the future. You are not getting rid of me that
easily! Thank you for everything and for giving me the experience of a lifetime. Mad love.
Thank you to Dr. Sasha Voss and Dr. Michael Lee for collaborating with me and
allowing me to further their incredible work. Also, a big thank you to Dr. Voss for always being
iv
willing to look at my writing and presentations, and for providing such detailed and thorough
feedback. It has been a pleasure working with you and I am so glad that I got the opportunity to
meet you in person at the ANZFSS conference.
Thank you to Pete Massey for generously allowing me to use his handheld FLIR
throughout the entirety of this research. Also, thank you for all of your moral support over the
last two years and for always taking time out of your busy schedule to listen to me when I show
up at your office door. I am so grateful to you for everything you have done for me and all of the
opportunities you have included me in.
Thank you to all of those who have helped me at various points throughout my research,
whether it was helping to maintain my fly colonies or recording data measurements during field
experiments. Specifically, thank you to Emily Neverett, Mandy Pascu, Julie Pinto, Sarai
Santofimio, Amanda Dye, Laura Jankowski and Bethany Hoschar. This work would not have
been possible without all of your time and support.
Thank you to Dr. Robert Powers and Dr. Roman Zajac for being a part of my support
team over these past two years and for always encouraging me to continue on in my education.
Thank you for always keeping me laughing even through the most difficult times of completing
this research. The numerous afternoons we have all spent at the lab were significant moments in
my time here and will be something that I never forget. Also, thank you to Dr. Zajac for allowing
us to use your boat to get to Horse Island, and to Dr. Powers for helping to teach me the ins and
outs of boating.

v
Thank you to Rich Boardman for allowing us to utilize Horse Island as one of the
experimental sites for this research. Thank you to Dr. Jeff Tomberlin, Dr. Amanda Roe and Dr.
Christine Picard for donating fly pupae to help get my fly colonies up and running. Thank you to
Emily Powers for her time and talent in creating the maggot drawings for this thesis document.
Finally, thank you to the University of New Haven and the Henry C. Lee College of Criminal
Justice and Forensic Science.

vi
ABSTRACT
When a body’s temperature reaches ambient temperature after death, remote detection of
the body can become difficult. At this point, useful search tactics include the use of cadaver
dogs, search parties and aerial imaging devices, all of which can be costly and time-consuming
for every day law enforcement use. This study investigated the potential of a novel search
technique in which a small, unmanned aerial system (drone) mounted with a forward-looking
infrared radar (FLIR) was utilized to detect decomposing animal carcasses via the heat generated
by associated Diptera larval aggregations. Hot water baths were utilized as analogs for larval
aggregations in order to simulate varying conditions that could be encountered during a search
and recovery mission, such as different sized aggregations and varying differences in
temperature between aggregations and the environment. Animal carcasses were also utilized to
determine the effectiveness of this search technique within the Connecticut region based on the
formation of larval aggregations and the associated detection of the carcass on the days following
its placement. While this research demonstrated that a thermal drone could successfully detect
larval aggregations associated with a decomposing carcass, it also demonstrated that there are
limitations to when or how this technique can be implemented during a search and recovery
mission. An increase in drone height limited the capability of detection due to the masking of the
hot water analog’s and carcass’s thermal signature by the surrounding environment, with a
smaller heat source experiencing greater masking effects. Detection and accurate location of
larval aggregations was also more likely to occur when there was minimal wind and sunlight at
the time of deployment, and when ambient temperature was ideal for larval growth and
development. Ultimately, the successful detection of larval aggregations was dependent upon the

vii
ability of the drone operator to understand how these factors can affect detection and how to
adjust search parameters to optimize the success of this search technique.

viii
TABLE OF CONTENTS
Acknowledgements .............................................................................................................. iii
Abstract ............................................................................................................................... vi
Table of contents ................................................................................................................ viii
List of tables ......................................................................................................................... xi
List of figures ....................................................................................................................... xii
Glossary ............................................................................................................................. xvi
Chapter 1: Introduction .......................................................................................................... 1
1.1 Entomology .......................................................................................................................1 1.1.1 Medicolegal Entomology ....................................................................................................................... 2
1.1.1.1 Forensically Important Insects ..................................................................................................... 2 1.1.1.2 Estimating Minimum Postmortem Interval (PMImin) using Entomology ...................................... 4 1.1.1.3 Other Uses of Insects for Death Investigation ........................................................................... 10
1.1.2 Diptera .................................................................................................................................................. 12 1.1.2.1 Life Cycle ..................................................................................................................................... 14 1.1.2.2 Colonization ................................................................................................................................ 17 1.1.2.3 Larval Aggregation ...................................................................................................................... 18 1.1.2.4 Benefits of forming aggregations ............................................................................................... 21 1.1.2.5 Larval Mass Effect ....................................................................................................................... 23
1.2 Decomposition of Terrestrial Remains .............................................................................. 24 1.2.1 Chemical Decomposition ..................................................................................................................... 24 1.2.2 Stages of Decomposition ..................................................................................................................... 25
1.2.2.1 Fresh Stage ................................................................................................................................. 26 1.2.2.2 Bloated Stage .............................................................................................................................. 27 1.2.2.3 Decay Stage ................................................................................................................................ 28 1.2.2.4 Post Decay Stage ........................................................................................................................ 29 1.2.2.5 Skeletal or Remains Stage .......................................................................................................... 29
1.2.3 Factors Affecting the Rate of Decomposition ...................................................................................... 30 1.2.3.1 Abiotic Factors ............................................................................................................................ 30 1.2.3.2 Biotic Factors .............................................................................................................................. 31
Chapter 2: Imaging .............................................................................................................. 33
2.1 Infrared Radiation ............................................................................................................ 34 2.1.1 Forward Looking Infrared Radar (FLIR) ................................................................................................ 35
2.2 Aerial Imaging .................................................................................................................. 36 2.2.1 Unmanned Aerial Systems (UAS) ......................................................................................................... 36
2.2.1.1 UAS Classification ....................................................................................................................... 37
2.3 Forensic Implications ....................................................................................................... 38
2.4 Research Statement ......................................................................................................... 40
2.5 Aims and Objectives ......................................................................................................... 41

ix
Chapter 3: Materials and Methods ....................................................................................... 43
3.1 Drone and Thermal Camera Integration ............................................................................ 44 3.1.1 DJI Phantom™ 3 Standard Drone and FLIR Duo® Camera .................................................................... 44 3.1.2 DJI Phantom™ 2 Drone and FLIR Duo® Camera .................................................................................... 45 3.1.3 Parrot Bebop-Pro Thermal™ Drone ..................................................................................................... 50
3.2 Fly Colonies ..................................................................................................................... 54 3.2.1 Colony room ......................................................................................................................................... 55 3.2.2 Fly Maintenance ................................................................................................................................... 56 3.2.3 Fly Breeding .......................................................................................................................................... 58
3.3 Maggot Mass Temperatures in Lab ................................................................................... 60 3.3.1 Determination of Egg Weight .............................................................................................................. 60 3.3.2 Experimental Set-up for Lab-Controlled Studies ................................................................................. 61 3.3.3 Data Collection ..................................................................................................................................... 65
3.4 Hot Water Analog ............................................................................................................ 66 3.4.1 Hot Water Analog Experimental Set-Up .............................................................................................. 66 3.4.2 Locations .............................................................................................................................................. 68 3.4.3 Data Collection ..................................................................................................................................... 69
3.5 Field-Based Study ............................................................................................................ 70 3.5.1 Field-Based Experimental Set-Up......................................................................................................... 70 3.5.2 Location ................................................................................................................................................ 71 3.5.3 Data Collection ..................................................................................................................................... 72
3.6 Statistical Analysis ........................................................................................................... 73
Chapter 4: Results ................................................................................................................ 74
4.1 Drone and Thermal Camera Integration ............................................................................ 75
4.2 Egg Weight ...................................................................................................................... 80 4.2.1 Maggot Mass Temperature.................................................................................................................. 84
4.3 Hot Water Analog ............................................................................................................ 90 4.3.1 Hot Spot Size ........................................................................................................................................ 96 4.3.2 Wind Effect ........................................................................................................................................... 99
4.4 Field-Based Study .......................................................................................................... 104 4.4.1 Coyote (Canis latrans) Carcass ........................................................................................................... 105
4.4.1.1 Decomposition and Insect Activity ........................................................................................... 105 4.4.1.2 Drone Detection ....................................................................................................................... 108
4.4.2 White-Tailed Deer Fawn (Odocoileus virginianus) Carcass................................................................ 113
Chapter 5: Discussion ......................................................................................................... 116
5.1 Maggot Mass Temperatures ........................................................................................... 117
5.2 Factors Affecting the Capability of Detection .................................................................. 118 5.2.1 Drone Height ...................................................................................................................................... 118 5.2.2 Maggot Mass Size............................................................................................................................... 119 5.2.3 Wind ................................................................................................................................................... 120 5.2.4 Solar Radiation ................................................................................................................................... 121 5.2.5 Ambient Temperature........................................................................................................................ 122
5.3 Operator ability ............................................................................................................. 124

x
5.4 Applicability in Forensic Science ..................................................................................... 125 5.4.1 Suggested Search Parameters............................................................................................................ 127
5.5 Limitations..................................................................................................................... 128
5.6 Further Research............................................................................................................ 129
Chapter 6: Conclusions ....................................................................................................... 131
6.1 Conclusions ................................................................................................................... 132

xi
LIST OF TABLES Table 2:1 - United States Department of Defense Classification of Unmanned Aerial Systems ......................................................................................................................................... 38 Table 4:1 - Summary of weights and counts recorded in calculating the average egg weight for Phormia regina and Lucilia sericata and the average larva weight for Sarcophaga bullata ........................................................................................................................................... 80 Table 4:2 - Summary of the estimated number of Phormia regina eggs placed on different sized carcasses in both replicates of the lab-controlled study ................................................................ 84 Table 4:3 - a-b - Analyses of drone height on the difference in temperature between the handheld FLIR and drone FLIR recordings by hot water baths and substrates a) with outliers, b) without outliers........................................................................................................................................... 96 Table 4:4 - a-b - Analyses of drone height on the difference in temperature between handheld FLIR and drone FLIR recordings by hot water bath size a) with outliers, b) without outliers .......................................................................................................................................... 99 Table 4:5 - Analyses of drone height on the difference in temperature between handheld FLIR and drone FLIR recordings by coyote (Canis latrans) carcass and background substrate error ............................................................................................................................................. 113

xii
LIST OF FIGURES
Figure 1:1 - a-b - Insect succession of Diptera and Coleoptera species at the Anthropological Research Facility in Knoxville, TN, a) succession of adults, b) succession of larvae ............................................................................................................................................... 6 Figure 1:2 - Spring succession of insects at the agricultural study site in Perth, Western Australia .......................................................................................................................................... 8 Figure 1:3 - a-b - Diptera flies, a) Lucilia sericata adult fly, b) Sarcophaga bullata adult fly ......................................................................................................................................... 14 Figure 1:4 - Diptera life cycle ...................................................................................................... 16 Figure 1:5 - a-b - Diptera larva a) body, b) mouth hooks ............................................................. 22 Figure 1:6 - Graph illustrating chemical decomposition ............................................................. 25 Figure 3:1 - DJI Phantom™ 3 Standard drone with remote controller and DJI© GO mobile application ..................................................................................................................................... 44 Figure 3:2 - FLIR Duo® thermal camera ...................................................................................... 45 Figure 3:3 - DJI Phantom™ 2 drone and FLIR Duo® camera set-up, with the remote controller and Flysight® Black Pearl Monitor ............................................................................................... 46 Figure 3:4 - DJI Phantom™ 2 drone connections for FPV set-up ................................................ 48 Figure 3:5 - Parrot Bebop-Pro Thermal™ drone set-up, with Skycontroller™ 2 and Samsung Galaxy Tab® A tablet ................................................................................................................... 51 Figure 3:6 - Thermal analysis using the FreeFlight Thermal™ mobile application ..................... 52 Figure 3:7 - Megan Descalzi flying the Parrot Bebop-Pro Thermal™ drone during a test flight..................................................................................................................................... 53 Figure 3:8 - Rabbit (Sylvilagus floridanus) carcass ...................................................................... 54 Figure 3:9 - a-b - Colony room set-up, a) fly colony rack, b) rearing dish rack ........................... 56 Figure 3:10 - a-b - Colony cages, a) PVC structure of cage, b) cage covered with curtain liner and secured with rubber bands and a clamp ................................................................................. 57

xiii
Figure 3:11 - Sugar, water and Sarcophaga bullata pupae placed inside colony cages ............... 58 Figure 3:12 - a-b - Rearing dish, a) ground beef with pigs blood placed on sand, b) dish covered with curtain liner ........................................................................................................................... 59 Figure 3:13 - Egg raft collected from pigs blood feed .................................................................. 61 Figure 3:14 - a-c - Experimental set-up (Replicate One), a) chipmunk (Tamias striatus) carcass, b) rabbit (Sylvilagus floridanus) carcass, c) coyote (Canis latrans) carcass ................................ 62 Figure 3:15 - a-b - Egg rafts placed in lacerations made on coyote (Canis latrans) carcasses, a) lateral cervical region (Replicate One), b) abdominal region (Replicate Two) ........................ 64 Figure 3:16 - FLIR® E6 infrared camera ...................................................................................... 65 Figure 3:17 - a-b - Experimental set-up, a) 5-gallon plastic container on the North-West side of Horse Island, b) 50-gallon plastic container outside Dr. R. Christopher O’Brien’s laboratory ...................................................................................................................................... 67 Figure 3:18 - Horse Island ............................................................................................................ 68 Figure 3:19 - Dr. R. Christopher O’Brien’s laboratory ................................................................ 69 Figure 3:20 - a-b - Field-based experimental set-up, a) Coyote (Canis latrans) carcass (Day 0), b) White-tailed deer fawn (Odocoileus virginianus) carcass (Day 0) .......................................... 71 Figure 3:21 - University of New Haven, Orange Campus............................................................ 72 Figure 4:1 - FreeFlight Thermal™ mobile application features ................................................... 77 Figure 4:2 - a-c - Damage to the Parrot Bebop-Pro Thermal™ drone, a) drone damage after crash in August 2018, b) battery damage after crash in March 2019, c) drone damage after crash in March 2019 ................................................................................................................................... 79 Figure 4:3 - a-b - Differences in means of egg/larva weight by species, a) oviparous Diptera species, b) oviparous and larviparous Diptera species.................................................................. 82 Figure 4:4 - Differences in means of egg weight by Phormia regina cage .................................. 83 Figure 4:5 - Differences in means of carcass temperatures by instrument ................................... 85
xiv
Figure 4:6 - a-d - Chipmunk carcasses (Tamias striatus) on the days when the greatest temperature differences between the carcass and ambient temperature were recorded, a) thermal image of carcass on Day Five for Replicate One, b) real image of carcass on Day Five for Replicate One, c) thermal image of carcass on Day Eight for Replicate Two, d) real image of carcass on Day Eight for Replicate Two....................................................................................... 86 Figure 4:7 - a-d - Rabbit carcasses (Sylvilagus. floridanus) on the days when the greatest temperature differences between the carcass and ambient temperature were recorded, a) thermal image of carcass on Day Four for Replicate One, b) real image of carcass on Day Four for Replicate One, c) thermal image of carcass on Day Three for Replicate Two, d) real image of carcass on Day Three of Replicate Two ....................................................................................... 87 Figure 4:8 - a-d - Coyote carcasses (Canis latrans) on the days when the greatest temperature differences between the carcass and ambient temperature were recorded, a) thermal image of carcass on Day Five for Replicate One, b) real image of carcass on Day Four for Replicate One, c) thermal image of carcass on Day Eight for Replicate Two, d) real image of carcass on Day Four for Replicate Two ................................................................................................................. 88 Figure 4:9 - a-b - Differences in means of temperature between the handheld FLIR recordings of developing maggot masses and ambient temperature a) egg raft size placed on each carcass, b) egg raft size placed on the rabbit (Sylvilagus floridanus) and coyote (Canis latrans) carcasses ........................................................................................................................................ 89 Figure 4:10 - Differences in means of temperature measurements by instrument and substrate.................................................................................................................................. 91 Figure 4:11 - Differences in means of hot water bath temperatures at two meters by instrument ..................................................................................................................................... 92 Figure 4:12 - a-d - Small hot water bath at varying drone heights, a) real image at 5 meters, b) thermal image at 5 meters, c) thermal image at 25 meters, d) thermal image at 50 meters ....................................................................................................................................... 94 Figure 4:13 - a-b - Relationship between drone height and difference in temperature of the handheld FLIR and drone FLIR readings by hot water baths and substrate (backgrounds), a) with outliers, b) without outliers ........................................................................................................... 95 Figure 4:14 - a-b - Visual effects of drone height on the thermal signature of the hot spot for the 5 gallon and 50 gallon hot water bath containers, a) thermal image of 5 gallon hot water bath at 15 meters, b) thermal image of 50 gallon hot water bath at 15 meters ........................................ 97 Figure 4:15 - a-b - Relationship between height and difference in temperature between handheld FLIR and drone FLIR readings by hot water bath size, a) with outlier, b) without outliers........................................................................................................................................... 98

xv
Figure 4:16 - a-b - Direction of emitted infrared waves from the hot water bath, a) without wind, b) with wind ................................................................................................................................ 100 Figure 4:17 - a-b - Visual effects of wind on the thermal signature of the hot water bath, a) real image depicting the location of the hot water bath, b) thermal image depicting the thermal signature of the hot water bath .................................................................................................... 101 Figure 4:18 - Relationship between windspeed and the difference in temperature between probe and drone FLIR recordings of the hot water baths ..................................................................... 103 Figure 4:19 - Relationship between drone height and the difference in temperature between probe and drone FLIR recordings of the hot water baths ........................................................... 104 Figure 4:20 - a-b - Coyote (Canis latrans) carcass, a) Day Zero, b) Day One ........................... 105 Figure 4:21 - Coyote (Canis latrans) carcass on Day Two ........................................................ 106 Figure 4:22 - a-c - Coyote (Canis latrans) carcass, a) Day Three, b) Day Four, c) Day Five .................................................................................................................................. 107 Figure 4:23 - a-b - Coyote (Canis. latrans) carcass on Day Zero in August 2018, a) real image at 25 meters, b) thermal image at 25 meters ................................................................................... 108 Figure 4:24 - a-b -Coyote (Canis latrans) carcass on Day Two in August 2018, a) real image at 25 meters, b) thermal image at 25 meters ................................................................................... 109 Figure 4:25 - a-b - Coyote (Canis latrans) carcass on Day Three in August 2018, a) real image at 25 meters, b) thermal image at 25 meters ............................................................................... 110 Figure 4:26 - a-b - Coyote (Canis latrans) carcass at on Day Four in August 2018, a) real image at 25 meters, b) thermal image at 25 meters ............................................................................... 111 Figure 4:27 - Relationship between height and difference in temperature between handheld FLIR and drone FLIR readings by coyote (Canis latrans) carcass and substrate ............................... 112 Figure 4:28 - a-c - White-tailed deer fawn (Odocoileus virginianus) carcass in November 2018, a) Day Two, b) Day Four, c) Day Eight ..................................................................................... 114

xvi
GLOSSARY Diapause
Physiological state of dormancy during unfavorable environmental conditions
Geosynchronous hovering Synchronous rotation with the Earth’s orbit resulting in a constant position at the same point above the ground
Kariomone Chemical signals used for interspecific communication which benefit the receiver, but harm the producer
Pheromone Chemical signals used for intraspecific communication, which can regulate the behavior and/or physiological response of the receiver

CHAPTER 1: INTRODUCTION

1
Current search methods for missing individuals can be costly and inefficient for every day
law enforcement use. Extensive search areas make it difficult for timely detection and often
require expensive techniques and/or excessive manpower. Recent research has demonstrated the
potential of a more effective search technique by studying the phenomenon of heat generation
produced by larval aggregations and the capability of detection using an aerial system equipped
with thermal imaging (Amendt et al., 2017; Lee, Voss, Franklin, & Dadour, 2018). Larval
aggregations on decomposing pig carcasses were detected by comparing temperature differences
between the aggregations and the surrounding environment. Despite the success of the search
technique under different climatic conditions, this study relied upon the availability of police
helicopters and expensive infrared technology (Amendt et al., 2017; Lee et al., 2018). Recent
advances in both unmanned aerial systems (UAS) (drones), in particular small unmanned aerial
systems (sUAS), and thermal imaging technology offer a cost-effective alternative to traditional
search options with the added benefit of rapid maneuverability. The aim of this study was to
investigate the effectiveness of using a small, unmanned aerial system mounted with a forward-
looking infrared radar to detect the heat signature of larval aggregations associated with
decomposition, and to determine the factors and conditions that would affect the capability of
detection when using this device in search and recovery missions.
1.1 Entomology
Entomology, which is the study of insects, provides contextual importance to the presence
of insects via the examination of their life history and behavior (Anderson, 2014). One common
application is forensic entomology, which applies to the broad study of insects as it pertains to
the legal system and can encompass such circumstances as insect damage to buildings (urban
entomology), food infestations (stored products entomology), and death investigations

2
(medicolegal entomology) (Hall, 1990). In these circumstances, insects can provide probative
information to aid in the legal proceedings of forensic cases.
1.1.1 Medicolegal Entomology
Insects associated with a crime scene are important to examine, as they can be used to
provide probative information about the circumstances surrounding a death. This practice is
referred to as medicolegal entomology, and the earliest account of its use dates back to a
homicide investigation in thirteenth-century China by the death investigator, Sung Tz’u
(Mcknight, 1981). In this case, a body was found near rice fields and the stab wound located on
the body was determined to be consistent with a sickle, a tool commonly used by workers in the
field (Mcknight, 1981). Sung Tz’u examined all of the workers tools in the village and noticed
that flies were located only on and around one sickle (Mcknight, 1981). Sung Tz’u began to
question the owner of this sickle and soon after, the worker confessed to the murder (Mcknight,
1981). The presence of flies surrounding the sickle was attributed to trace amounts of blood still
present on the blade that was attracting the flies to it (Mcknight, 1981). Additional case work and
extensive research has since contributed to a better understanding of the common association
between insects and decomposing remains, and how the presence of insects can be utilized for
death investigations.
1.1.1.1 Forensically Important Insects
Insect species commonly associated with decomposing remains are classified into four
categories (Catts & Goff, 1992; Rivers & Dahlem, 2014; Smith, 1986):
3
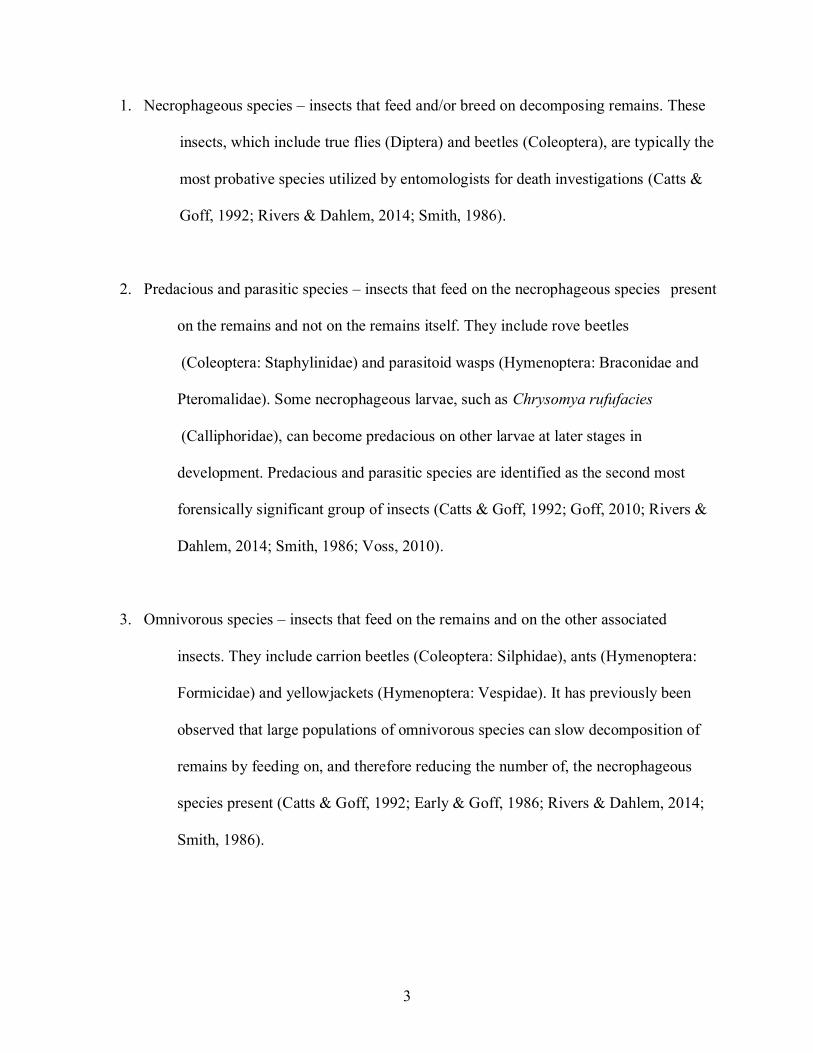
1. Necrophageous species – insects that feed and/or breed on decomposing remains. These
insects, which include true flies (Diptera) and beetles (Coleoptera), are typically the
most probative species utilized by entomologists for death investigations (Catts &
Goff, 1992; Rivers & Dahlem, 2014; Smith, 1986).
2. Predacious and parasitic species – insects that feed on the necrophageous species present
on the remains and not on the remains itself. They include rove beetles
(Coleoptera: Staphylinidae) and parasitoid wasps (Hymenoptera: Braconidae and
Pteromalidae). Some necrophageous larvae, such as Chrysomya rufufacies
(Calliphoridae), can become predacious on other larvae at later stages in
development. Predacious and parasitic species are identified as the second most
forensically significant group of insects (Catts & Goff, 1992; Goff, 2010; Rivers &
Dahlem, 2014; Smith, 1986; Voss, 2010).
3. Omnivorous species – insects that feed on the remains and on the other associated
insects. They include carrion beetles (Coleoptera: Silphidae), ants (Hymenoptera:
Formicidae) and yellowjackets (Hymenoptera: Vespidae). It has previously been
observed that large populations of omnivorous species can slow decomposition of
remains by feeding on, and therefore reducing the number of, the necrophageous
species present (Catts & Goff, 1992; Early & Goff, 1986; Rivers & Dahlem, 2014;
Smith, 1986).

4
4. Adventive species – insects and other arthropods that do not feed on decomposing
remains or associated insects, but rather use remains as an extension of their
environment to hide and protect themselves under. They include spiders, centipedes
and springtails (Catts & Goff, 1992; Rivers & Dahlem, 2014; Smith, 1986).
1.1.1.2 Estimating Minimum Postmortem Interval (PMImin) using Entomology
Entomological evidence found at death scenes is most commonly utilized to estimate the
minimum postmortem interval (PMImin). PMImin refers to the amount of time that has elapsed
since the initial wave of insect colonization, and thus, the minimum amount of time that has
passed since death. Estimation of PMImin is important to forensic investigations as it can provide
a timeline as to when an individual may have died, which can contribute to the reconstruction of
events that occurred and can aid in the exclusion (or inclusion) of a suspect.
There are additional methods that can be utilized to estimate PMImin, including livor,
algor and rigor mortis (Rivers & Dahlem, 2014). These factors are associated with the natural
changes that occur within the body immediately following death, such as the blood settling
(livor), and the body cooling (algor) and stiffening (rigor) (Rivers & Dahlem, 2014). However,
approximately 72 hours after death (post mortem), the decay of the body progresses to a state
where it becomes more difficult to accurately determine the PMImin using these factors (Rivers &
Dahlem, 2014; Sharma, 2015). Comparatively, insects are attracted to remains throughout all
stages of decomposition, and therefore can be utilized to estimate PMImin even 72 hours post
mortem. In particular, knowledge of the expected arrival time and the predictable development
of a species on a body can be utilized to estimate PMImin (Anderson, 2014).

5
The predictable succession of insects on decomposing remains is one way in which
forensic entomologists utilize insect evidence to determine the minimum amount of time that has
elapsed since death (Anderson, 2001, 2014; Rivers & Dahlem, 2014). This predictable
succession results from the chemical and physical changes a body undergoes throughout the
decomposition process, which alters the attractiveness and nutritional value of remains to various
decomposers, including insects (Anderson, 2001, 2014). As a result, groups of insects will
colonize decomposing remains at different times and in a predictable sequence (Anderson, 2001,
2014). For example, research on insect colonization at the Anthropological Research Facility in
Knoxville, TN observed the succession pattern of flies (Diptera) and beetles (Coleoptera) on
decaying human remains (Figure 1:1 a-b). Variation in the succession patterns between and
within these two insect groups was observed. Flies were present on the remains in greater
numbers during the earlier stages of decomposition, with blowflies (Diptera: Calliphoridae)
being the first species to arrive, followed by muscid flies (Diptera: Muscidae) and then flesh flies
(Diptera: Sarcophagidae) (Rodriguez & Bass, 1983). Beetles were observed at various stages of
decomposition depending on the species. Carrion beetles (Coleoptera: Silphidae) were present in
the bloated and decay stages while dermestid beetles (Coleoptera: Dermestidae) were most
prevalent in the final stage of decomposition (Rodriguez & Bass, 1983).

6
Figure 1:1 - a-b - Insect succession of Diptera and Coleoptera species at the Anthropological Research Facility in Knoxville, TN, a) succession of adults, b) succession of
larvae (Rodriguez & Bass, 1983, as adapted in Hall, 2001)
Additional research on insect colonization has demonstrated similar succession patterns
of Diptera and Coleoptera species and have also noted the observed patterns of other forensically
significant species during different stages of decomposition and within various environmental or
climatic conditions (Bornemissza, 1957; Grassberger & Frank, 2004; Johnston & Villeneuve,
1897; Reed, 1958; Voss, Spafford, & Dadour, 2009). For example, research conducted in Perth,

7
Western Australia observed succession patterns of various Diptera, Coleoptera and Hymenoptera
species on domestic guinea pig carcasses (Cavia porcellus) over a two year time period (Figure
1:2) (Voss et al., 2009). Replications occurred within seasons and at two different study sites, a
bushland wildlife reserve and an agricultural field station, in order to determine the temporal and
spatial succession patterns of insects in Western Australia. Diptera were the first insects observed
on the carcasses throughout all seasons and between locations, with Lucilia sericata (Diptera:
Calliphoridae) and Calliphora dubia (Diptera: Calliphoridae) consistently being the first to
arrive. The predatory Hymenoptera species of Diptera, including Tachinaephagus zealandicus
(Hymenoptera: Encryptidae) and Nasonia vitripennis (Hymenoptera: Pteromalidae), were
observed on the carcasses soon after Diptera colonization and were present throughout all stages
of decomposition. Coleoptera species did not arrive to the carcass until the bloat stage and were
represented in greater numbers towards the end of decomposition. This study found that the
successional patterns of these three insect species in Western Australia was consistent between
sites but not between seasons (Voss et al., 2009).

8
Figure 1:2 - Spring succession of insects at the agricultural study site in Perth, Western
Australia (Voss et al., 2009)
Research on succession patterns has provided known sequences and timeframes of
colonization for various groups of insects, which have been applied by forensic entomologists in
death investigations (Anderson, 2001, 2014). The presence (or absence) of certain species on
remains at the time of discovery can be compared to these known sequences and timeframes of
colonization in order to aid in the estimation of PMImin (Anderson, 2001, 2014).
Rate of larvae development, particularly of fly larvae, is the second approach forensic
entomologists use when estimating PMImin (Anderson, 2014; Rivers & Dahlem, 2014). The first
known use of development rates for PMImin estimation was in 1850 by Louis Bergeret, when the
mummified body of a baby was found behind a fireplace in a house (Greenberg & Kunich, 2002;
Hall, 2005). Bergeret found empty pupae of Sarcophaga carnaria (Diptera: Sarcophagidae) on
the body and used the known development rate of this species to determine that this colonization

9
event occurred in 1848, soon after the baby’s death (Greenberg & Kunich, 2002; Hall, 2005).
Bergeret’s estimation of when the baby died was used to exclude the tenants who occupied the
house at the time of discovery as suspects (Greenberg & Kunich, 2002; Hall, 2005). Since this
time, developmental rates have become a key indicator for determining the minimum amount of
time that has elapsed since death.
Developmental rates of different fly species have been studied in order to determine the
amount of time each species spends in the egg, larval and pupal stages (Anderson, 2000;
Donovan, Hall, Turner, & Moncrieff, 2006; Grassberger & Reiter, 2001, 2002). For example,
developmental data was collected for the forensically important blowfly, Calliphora varifrons
(Diptera: Calliphoridae), which is native to Western Australia (Voss, Cook, Hung, & Dadour,
2014). C. varifrons was reared at constant temperatures between 12 °C and 30 °C to determine
how temperature influenced development time, or the amount of time between larviposition to
adult emergence (Voss et al., 2014). The developmental data collected showed that as the
temperature increased, the development time also increased. At 27°C the development time of
C. varifrons was 16.65 ± 0.17 days while at 12°C the time was 49.93 ± 0.26 days (Voss et al.,
2014). The results of this study also found that mortality was higher at the temperature extremes,
the adult body size was smaller at the temperature extremes and the maximum larval length
decreased as temperature increased (Voss et al., 2014).
Developmental data has also been collected by rearing fly species under cyclic
temperatures in order to simulate the normal fluctuating temperatures that would be experienced
within the environment. Cyclic temperature conditions have varying effects on the rate of
development in comparison to constant temperatures as it can accelerate the rate for some fly
10
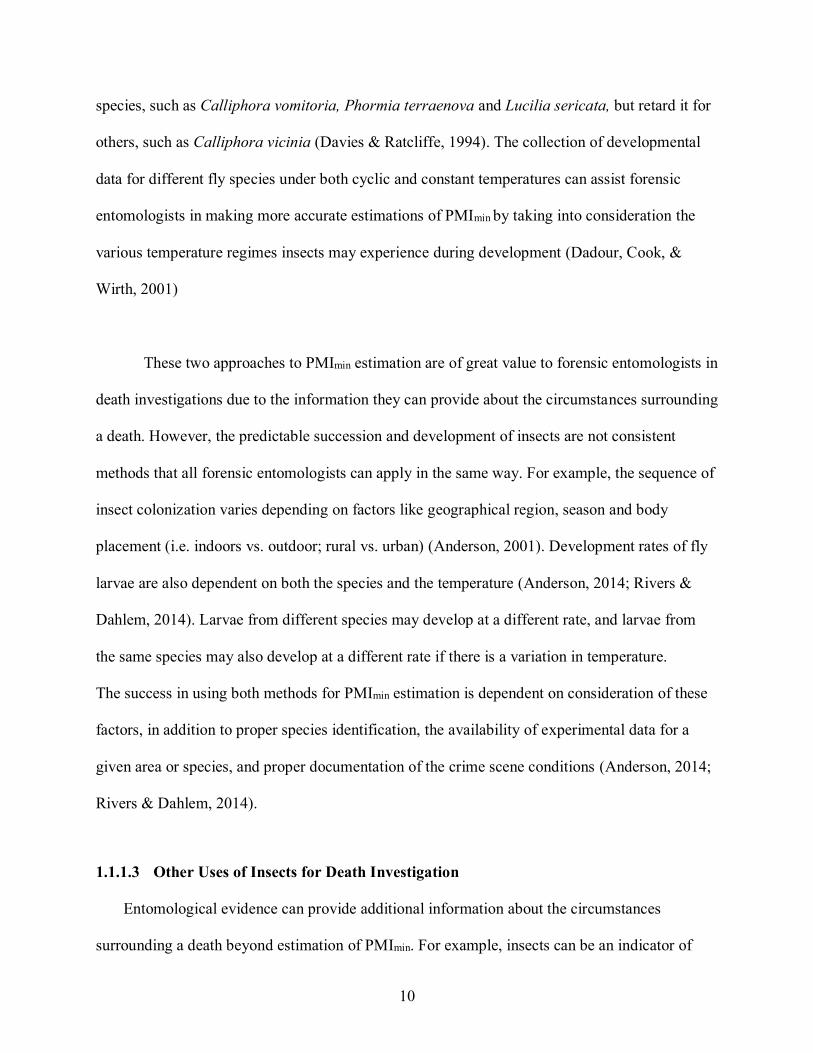
species, such as Calliphora vomitoria, Phormia terraenova and Lucilia sericata, but retard it for
others, such as Calliphora vicinia (Davies & Ratcliffe, 1994). The collection of developmental
data for different fly species under both cyclic and constant temperatures can assist forensic
entomologists in making more accurate estimations of PMImin by taking into consideration the
various temperature regimes insects may experience during development (Dadour, Cook, &
Wirth, 2001)
These two approaches to PMImin estimation are of great value to forensic entomologists in
death investigations due to the information they can provide about the circumstances surrounding
a death. However, the predictable succession and development of insects are not consistent
methods that all forensic entomologists can apply in the same way. For example, the sequence of
insect colonization varies depending on factors like geographical region, season and body
placement (i.e. indoors vs. outdoor; rural vs. urban) (Anderson, 2001). Development rates of fly
larvae are also dependent on both the species and the temperature (Anderson, 2014; Rivers &
Dahlem, 2014). Larvae from different species may develop at a different rate, and larvae from
the same species may also develop at a different rate if there is a variation in temperature.
The success in using both methods for PMImin estimation is dependent on consideration of these
factors, in addition to proper species identification, the availability of experimental data for a
given area or species, and proper documentation of the crime scene conditions (Anderson, 2014;
Rivers & Dahlem, 2014).
1.1.1.3 Other Uses of Insects for Death Investigation
Entomological evidence can provide additional information about the circumstances
surrounding a death beyond estimation of PMImin. For example, insects can be an indicator of

11
drug use. If the victim consumes drugs or poisons preceding death, those toxins will still be
present within the tissues of the body post mortem. The insects feeding on these remains, such as
blowfly larvae, will ingest and accumulate these toxins into their own tissues, which can then be
analyzed by toxicologists to determine what toxins are present. Insects are useful for drug
detection, especially when a body is too decomposed for the tissues to be analyzed directly. The
analysis of toxins in insects is referred to as entomotoxicology (Anderson, 2014).
Additionally, insects can be used to indicate if a body has been moved postmortem. In this
circumstance, a body may have been moved from the initial scene of the crime to another
location in an attempt to hide the body and conceal the crime. If the body was left exposed at the
initial scene, blowfly species local to that area can colonize the body within minutes. However,
these species at the initial scene may not be common to the area where the body was moved to.
Therefore, when the entomological evidence is analyzed, it will be noted that some of the species
identified were not common in that location, and therefore the body could have been moved.
This information is important for investigators to learn as they can focus their investigation on
locating the primary scene of the crime, which may possess more key evidence (Anderson,
2014).
Insects can also be used to link a suspect to a scene. Suspects can unknowingly take
entomological evidence with them when they leave the scene of a crime or can be affected by the
insects located at the scene. For example, in a particular case in Southern California, bites
located on the suspect were used to link the suspect to a homicide scene after determining that
the bites were from chiggers (Trombidiformes), or mite larvae, which were only located in the
region where the crime occurred. In another case, a suspect was linked to the scene of a robbery

12
and homicide based on the presence of bumble bee (Hymenoptera: Apidae) hairs discovered on a
bank note in his possession. These hairs could be linked to the scene as there was a bumble bee
located in the drawer where the money stolen was known to be kept. Discovery of entomological
evidence associated with a suspect can provide the probative information needed to link the
suspect to the scene or the victim (Anderson, 2014).
Insects, particularly blowflies, can be utilized to locate the position of a wound. Blowflies
will colonize open wounds, such as a stab wound or a slashed throat, because it is a protein rich
site that will promote larval growth and development. Analysis of where larvae are located on
the body can indicate the possible presence of wounds. For example, if older larvae are found in
the abdominal region and younger larvae are found in a natural orifice it is likely that an open
wound is located in the abdominal region. This information is probative for determining cause of
death in forensic investigations when wounds do not reach the hard tissue and remains are too
decomposed for wound analysis (Anderson, 2014).
1.1.2 Diptera
True flies, which are insects in the Order Diptera, are of considerable forensic
significance as they are among the first insects to colonize decomposing remains (Anderson,
2014). Knowledge of the development, behavior and geographic distribution of fly species
associated with decomposing remains assists forensic entomologists in evaluating the
circumstances surrounding a death (Byrd & Castner, 2001).
Diptera commonly associated with decomposing remains include blowflies (Diptera:
Calliphoridae) and flesh flies (Diptera: Sarcophagidae). Blowflies, which appear metallic green
or blue in color, are typically the first to arrive at remains, and can do so within minutes after

13
death (Anderson & VanLaerhoven, 1996). In total, 93 North American blowfly species have
been identified, including species in the genus Lucilia, Calliphora, Phormia, Cochliomyia and
Chrysomya (Whitworth, 2017). The distribution and morphological characteristics for many of
these species have been defined in order to assist entomologists in identifying each species
(Whitworth, 2017). Lucilia sericata (Figure 1:3 a) and Phormia regina are among the most
prevalent blow fly species found in association with decomposing remains, and are both widely
distributed throughout North America (Rivers & Dahlem, 2014; Whitworth, 2017).
Flesh flies (Diptera: Sarcophagidae) typically colonize decomposing remains soon after
blowflies (J.H Byrd & Castner, 2001; Rivers & Dahlem, 2014). There are approximately 320
species of flesh flies common to North America, many of which are in the genus Sarcophaga.
Some of the most common species associated with decomposing remains include Sarcophaga
bullata (Figure 1:3 b), Sarcophaga haemorrhoidalis, Sarcophaga crassipalpis and Blaesoxipha
plinthopyga (Byrd & Castner, 2001; Rivers & Dahlem, 2014). The necrophageous flesh flies are
characterized by their red eyes and dark stripes on the dorsal aspect of the thorax and are distinct
from other families of flies as they lay live larvae as opposed to eggs (Rivers & Dahlem, 2014).
Unlike blowflies, the identification and differentiation of Sarcophagidae species is difficult due
to the similarity in morphological features (Byrd & Castner, 2001).

14
a) b)
Figure 1:3 - a-b - Diptera flies, a) Lucilia sericata adult fly, b) Sarcophaga bullata adult fly (Photographs by Megan Descalzi)
1.1.2.1 Life Cycle
Flies undergo holometabolous development, meaning they progress through multiple
stages of life beginning as eggs, developing into larvae and then pupae before becoming adults
(Figure 1:4) (Castner, 2001). Once eggs develop into larvae, or maggots, they progress through
three stages, or instars, each marked by shedding of the skin and an increase in size (Castner,
2001). The instar of larvae can be determined by examining the number of slits in the posterior
spiracles, or respiratory openings (Flores et al., 2016; Liu & Greenberg, 1989). First instar larvae
will have one slit in each spiracle, second instar will have two slits and third instar will have
three slits (Figure 1:4) (Flores et al., 2016; Liu & Greenberg, 1989). Larvae feed on the substrate
where they are laid, and it is the cessation of this feeding and movement away from the substrate
that begins the pupae stage of the lifecycle (Castner, 2001). In this stage, the larvae will find a
dark and cooler location, usually soil, where they will form a hard, outer casing (puparium) that
allow them to develop and later emerge as adult flies (Castner, 2001).
Most fly species are oviparous, meaning they lay eggs (Rivers & Dahlem, 2014). These
flies, such as calliphorids, proceed accordingly through the life cycle (Figure 1:4). However,

15
there are some flies, such as the sarcophagids, that do not lay eggs. These flies are considered
larviparous because they lay live larvae instead (Rivers & Dahlem, 2014). While larviparous
species proceed through the same life cycle as oviparous flies, the egg stage is absent (Figure
1:4).

16
Figure 1:4 - Diptera life cycle (Photographs by Megan Descalzi, Drawings by Emily Powers)
Oviparous species
Larviparous species
Third Instar Second Instar First Instar

17
Flies are poikilotherms, meaning that they rely on ambient temperature to regulate their
own body heat (Grassberger & Reiter, 2002; Higley & Haskell, 2001; Rivers & Dahlem, 2014).
Therefore, the development rate of flies through the stages of the life cycle is dependent on
ambient temperature. As temperature increases, the development rate of flies also increases
because the enzymatic and metabolic processes that regulate growth work optimally at greater
temperatures (Higley & Haskell, 2001). For example, when Phormia regina was reared at 19°C,
the average minimum duration of the pre-adult stages was 15.6 days (Greenberg & Kunich,
2002). At 35°C, the duration was 10 days (Greenberg & Kunich, 2002). As the rearing
temperature increased, the amount of time it took for P. regina to develop from eggs to adult
flies decreased.
The development rate of flies also varies between species. For example, in comparison to
the average minimum duration of the pre-adult stages for P. regina at 19°C, the duration at this
same temperature for Phaenicia sericata was 16.3 days and for Calliphora vicina it was 22.8
days (Greenberg & Kunich, 2002). Due to these differences in developmental rates, data has
been collected for various species at different temperatures in order to aid forensic entomologists
in using development rates for estimation of PMImin.
1.1.2.2 Colonization
Necrophageous flies seek out nutrient-rich sources, such as decomposing remains, that
promote growth and development at the adult and larval stages. Decomposing remains are an
optimal feeding site for adult flies and larvae because of the abundant amount of protein that is

18
available (Rivers & Dahlem, 2014). Female flies rely on the consumption of protein for
oogenesis, or development of eggs, to occur, and larvae require protein to grow (Rivers &
Dahlem, 2014). Therefore, female flies will feed on decomposing remains to consume enough
protein to become gravid, and then will oviposit, or lay eggs, on the remains, knowing it is an
ideal site for larval growth (Rivers & Dahlem, 2014).
Prior to colonization, adult flies will sense and become attracted to the volatile chemicals
released from decomposing remains, such as butane-1,4-diamine (putrescine), pentane-1,5-
diamine (cadaverine), indole and dimethyl disulfide (Dekeirsschieter et al., 2009; Eisemann &
Rice, 1987; Frederickx, Dekeirsschieter, Verheggen, & Haubruge, 2012). This odor provides a
cue, to female flies in particular, that the remains are an optimal site for the consumption of
protein and is a suitable host for larval development (Eisemann & Rice, 1987). Then, when
oviposition starts to occur, female flies initially attracted to the remains will send chemical
signals, such as pheromones or kairomones, to other female flies and additional eggs will be laid
(Barton Browne, Bartell, & Shorey, 1969; Eisemann & Rice, 1987; Hammack, 1990). Female
flies will oviposit in the moist areas of the organism where sources of protein for development
are abundant (Rivers, Thompson, & Brogan, 2011). The areas that will be colonized first include
any orifices (i.e. mouth, eyes, anus), folds in the skin and wounds (Rivers et al., 2011).
1.1.2.3 Larval Aggregation
Fly larvae are often found in large aggregations, or maggot masses, on decomposing
carcasses during the second or third instar of development (Rivers & Dahlem, 2014). These
aggregations can be comprised of one or multiple fly species and may consist of hundreds to

19
thousands of larvae depending on the size of the remains (Campobasso, Di Vella, & Introna,
2001; Rivers & Dahlem, 2014).
It is unclear as to how these aggregations form, but multiple hypotheses have been
developed to explain this behavior. These hypotheses include (i) positive thigmotaxis, (ii)
clustered oviposition or larviposition, (iii) random formation, and (iv) foraging (Rivers &
Dahlem, 2014).
Positive thigmotaxis is the innate behavior of an organism to seek contact with an object
in response to touch or physical stimuli (Gennard, 2007; Rivers & Dahlem, 2014). Fly larvae are
characterized as displaying positive thigmotaxis when they seek contact with nearby larvae and
form large aggregations (Gennard, 2007; Rivers & Dahlem, 2014). Thigmotaxis explains why
larvae continually seek contact with one another and remain aggregated until the end of the third
instar. However, thigmotaxis does not explain why larvae are close enough for contact to initially
occur (Rivers & Dahlem, 2014). Aggregations do not form until after the first instar, during
which some larvae species disperse from the site where oviposition/larviposition occurred and
the cluster of eggs were deposited (Greenberg & Kunich, 2002; Rivers & Dahlem, 2014). Larval
aggregations produced by thigmotactic behavior will occur if larvae are in close proximity to
each other, not dispersed on the carcass. Thigmotaxis is likely a reason for why aggregations
persist, but not for how they are initiated (Rivers & Dahlem, 2014).
Clustered oviposition and larviposition results from pheromone and kariomone signaling
between and within Diptera species (Rivers & Dahlem, 2014). These chemicals will attract flies
to decomposing remains and will stimulate oviposition/larviposition to occur, often at the same
location, producing egg clusters. This explanation supposes that clusters of eggs inevitably lead

20
to aggregation formation and that larvae must therefore feed and grow cooperatively at the site
where oviposition/larviposition occurred. Larvae do work together to cooperatively digest the
tissues of the decomposing carcass, but similar to the idea of positive thigmotaxis, the limitation
in this hypothesis is that species tend to move away from the site of oviposition/larviposition
during the first instar (Rivers & Dahlem, 2014).
The explanation of random formation hypothesizes that larval aggregations form by
chance, as a result of overcrowding and competition (Rivers & Dahlem, 2014). Decomposing
remains are an ephemeral food source, which means that as hundreds to thousands of larvae
grow and feed at a single time, they are forced to interact with each other as they compete for
food. However, this hypothesis also does not take in to consideration the dispersal of first instar
larvae and does not consider that overcrowding may not occur on larger remains, especially for
the first wave of colonizers (Rivers & Dahlem, 2014).
The foraging by larvae explanation proposes that aggregations form in response to
chemical signals, similar to pheromone trails (Rivers & Dahlem, 2014). This hypothesis
supposes that these signals are sensed and then utilized by larvae to detect other larvae feeding
on the remains, ultimately leading to the formation of an aggregation. There is little evidence to
suggest that chemical cues are the reason for the formation of larval aggregations (Rivers &
Dahlem, 2014). However, previous research has supported the presence of chemical cues
influencing the foraging behavior of larvae, when second and third instar S. bullata larvae were
able to locate beef liver from a distance of 33 centimeters using these signals (Christopherson &
Gibo, 1997).
21
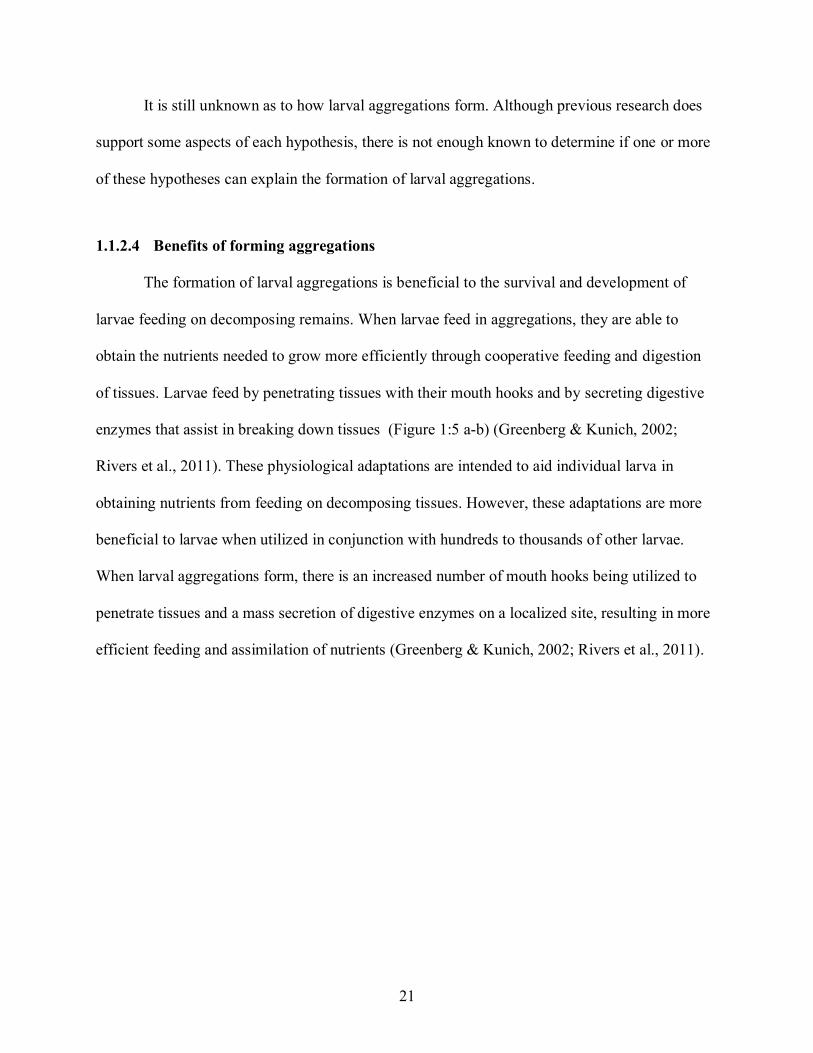
It is still unknown as to how larval aggregations form. Although previous research does
support some aspects of each hypothesis, there is not enough known to determine if one or more
of these hypotheses can explain the formation of larval aggregations.
1.1.2.4 Benefits of forming aggregations
The formation of larval aggregations is beneficial to the survival and development of
larvae feeding on decomposing remains. When larvae feed in aggregations, they are able to
obtain the nutrients needed to grow more efficiently through cooperative feeding and digestion
of tissues. Larvae feed by penetrating tissues with their mouth hooks and by secreting digestive
enzymes that assist in breaking down tissues (Figure 1:5 a-b) (Greenberg & Kunich, 2002;
Rivers et al., 2011). These physiological adaptations are intended to aid individual larva in
obtaining nutrients from feeding on decomposing tissues. However, these adaptations are more
beneficial to larvae when utilized in conjunction with hundreds to thousands of other larvae.
When larval aggregations form, there is an increased number of mouth hooks being utilized to
penetrate tissues and a mass secretion of digestive enzymes on a localized site, resulting in more
efficient feeding and assimilation of nutrients (Greenberg & Kunich, 2002; Rivers et al., 2011).

22
Figure 1:5 - a-b - Diptera larva a) body, b) mouth hooks (Drawings by Emily Powers)
The formation of aggregations also benefits larval development by assisting in the
regulation of larval body temperature (Rivers et al., 2011). When larval aggregations form, heat
is produced which contributes positively to the developmental rate of larvae. This heat
production by larval aggregations is called the larval mass effect and is discussed in more detail
in the following section (Charabidze, Bourel, & Gosset, 2011; Rivers & Dahlem, 2014).
a)
b)

23
1.1.2.5 Larval Mass Effect It is well reported that larval aggregations produce a significant amount of heat
(Charabidze et al., 2011; Deonier, 1940; Turner & Howard, 1992). Larval aggregation
temperatures that exceed ambient temperature by more than 30°C have been observed (Anderson
& VanLaerhoven, 1996; Slone & Gruner, 2007; Turner & Howard, 1992). However, the reason
for this heat production is unknown. It has been hypothesized that heat could be a result of
microbiotic activity or a result from the frenetic movement and high metabolism rate of the
larvae feeding on the organism (Campobasso et al., 2001; Greenberg & Kunich, 2002).
Although the cause is not well understood, heat production is believed to be necessary for
larvae development. In conditions where ambient temperature is not optimal for development,
massing behavior and associated heat production elevates the temperature of each larvae in the
mass to allow for continued development and food consumption (Rivers et al., 2011). Heat
production behavior allows for temperature dependent growth of larvae when conditions are not
ideal and hastens development. Faster development during the larval feeding period reduces the
time larvae are vulnerable to predation and provides an advantage over other carrion feeding
species that are competing for the limited food resource offered by decomposing remains (Rivers
et al., 2011).
The amount of heat produced has been reported to be influenced by a variety of intrinsic
and extrinsic factors. Slone & Gruner (2007) reported that larger (more dense) and more tightly
packed larval aggregations produce the greatest amount of heat, and thus have the highest
temperatures. Charabidze, Bourel, and Gosset (2011) reported that heat production is affected by
the instar of the larvae and the size of the food source. The older the larvae and the larger the

24
food source, the greater the amount of heat produced. Additional influences on heat production
includes species composition, location of aggregation on remains and surrounding abiotic factors
(i.e. ambient temperature and sunlight) (Catts & Goff, 1992; Hall, 2005; Joy, Liette, & Harrah,
2006; Rivers, Ciarlo, Spelman, & Brogan, 2010).
1.2 Decomposition of Terrestrial Remains
Decomposition is continuous process that consists of chemical and physical changes within
a body following death (Rivers & Dahlem, 2014). Taphonomy, which is the study of
decomposing organisms over time, aims to observe these changes and to observe how various
abiotic and biotic factors affect the rate at which the organisms decay (Rivers & Dahlem, 2014).
1.2.1 Chemical Decomposition
Decomposition begins immediately after death when the body’s cells become deprived of
oxygen, causing a cascade of biochemical events that advance the physical decay of the body.
(Rivers & Dahlem, 2014; Vass, 2001). As the condition of the body shifts to an anaerobic state,
lysosomes will release enzymes in response to unfavorable intracellular conditions, resulting in
the self-digestion of the body’s cells, or autolysis, and the release of nutrient rich fluids (Figure
1:6) (Rivers & Dahlem, 2014; Vass, 2001). Autolysis occurs more rapidly in tissues with higher
enzyme activity, such as the liver, or higher water content, such as the brain (Rivers & Dahlem,
2014; Vass, 2001). The effects of cell digestion on the body become visible within a few days
following death as blisters form on the skin and skin slippage occurs (Vass, 2001).

25
After a few days, all of the cells in the body will be broken down and the release of
nutrient rich fluids will promote microbial activity and subsequently, putrefaction (Figure 1:6)
(Vass, 2001). Putrefaction is the process by which bacteria and fungi digest the body’s tissues,
and in doing so, release volatile gases, liquids and small molecules (Vass, 2001). The effects of
putrefaction quickly become visible as the body develops a greenish discoloration and begins to
swell as a result of these by-products (Vass, 2001).
Figure 1:6 - Graph illustrating chemical decomposition (Rivers & Dahlem, 2014)
1.2.2 Stages of Decomposition
Decomposition is typically categorized into discrete stages defined by the visible changes
that occur to a body over time and the associated insect activity (Goff, 2010). These stages are
utilized by researchers to link decomposition events to expected timeframes, in order to aid in
estimating the amount of time that has elapsed since death (Rivers & Dahlem, 2014).
26
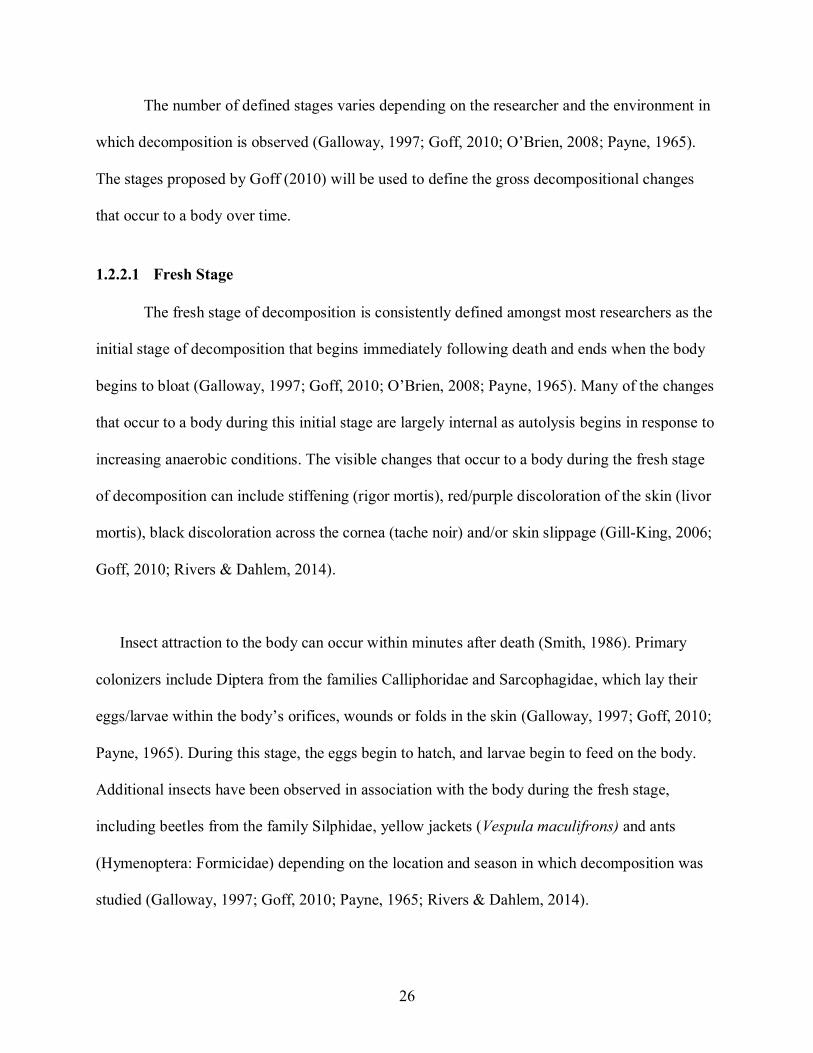
The number of defined stages varies depending on the researcher and the environment in
which decomposition is observed (Galloway, 1997; Goff, 2010; O’Brien, 2008; Payne, 1965).
The stages proposed by Goff (2010) will be used to define the gross decompositional changes
that occur to a body over time.
1.2.2.1 Fresh Stage
The fresh stage of decomposition is consistently defined amongst most researchers as the
initial stage of decomposition that begins immediately following death and ends when the body
begins to bloat (Galloway, 1997; Goff, 2010; O’Brien, 2008; Payne, 1965). Many of the changes
that occur to a body during this initial stage are largely internal as autolysis begins in response to
increasing anaerobic conditions. The visible changes that occur to a body during the fresh stage
of decomposition can include stiffening (rigor mortis), red/purple discoloration of the skin (livor
mortis), black discoloration across the cornea (tache noir) and/or skin slippage (Gill-King, 2006;
Goff, 2010; Rivers & Dahlem, 2014).
Insect attraction to the body can occur within minutes after death (Smith, 1986). Primary
colonizers include Diptera from the families Calliphoridae and Sarcophagidae, which lay their
eggs/larvae within the body’s orifices, wounds or folds in the skin (Galloway, 1997; Goff, 2010;
Payne, 1965). During this stage, the eggs begin to hatch, and larvae begin to feed on the body.
Additional insects have been observed in association with the body during the fresh stage,
including beetles from the family Silphidae, yellow jackets (Vespula maculifrons) and ants
(Hymenoptera: Formicidae) depending on the location and season in which decomposition was
studied (Galloway, 1997; Goff, 2010; Payne, 1965; Rivers & Dahlem, 2014).

27
1.2.2.2 Bloated Stage
The fresh stage ends and the bloated stage begins when the body starts to bloat, or swell
(Goff, 2010; Rivers & Dahlem, 2014). A strong indicator that the body is entering the bloat stage
is when the abdomen becomes distended due to the accumulation of gases, such as ammonia,
methane and hydrogen sulfide, within the gastrointestinal tract (Clark, Evans, & Wall, 2006;
Rivers & Dahlem, 2014). These gases are byproducts of the microbiotic activity in which
anaerobic bacteria putrefy the body’s tissues (Catts & Goff, 1992; Rivers & Dahlem, 2014).
Putrefaction will continue throughout the bloated stage, resulting in the continual build-up of
gases and bloating of the body.
In addition to bloating, the body will experience marbling, which is a mosaic pattern of
purple to greenish discoloration within the blood vessels (Goff, 2010; Rivers & Dahlem, 2014).
This discoloration results from the putrefaction of proteins within the body and the subsequent
formation of sulfhemoglobin within pooled blood (Gill-King, 2006; Goff, 2010; Rivers &
Dahlem, 2014).
Eventually the build-up of gases within the body will lead to an increase in pressure,
which will cause some of the internal liquids and gases to slowly seep out of the body through
the natural orifices (Rivers & Dahlem, 2014). The chemical odor of these liquids and gases are
sensed by Diptera species that then make their way to the body. Additional colonization by
Diptera species from the families Calliphoridae, Sarcophagidae, Muscidae and Piophilidae
occurs (Goff, 2010; Payne, 1965; Rivers & Dahlem, 2014). Predatory insects also make their

28
way to the body during the bloated stage in order to feed on the Diptera eggs and larvae present.
These predatory insects include beetles from the families Silphidae and Staphylinidae, and ants
and wasps from the order Hymenoptera (Goff, 2010; Payne, 1965; Rivers & Dahlem, 2014).
The end of the bloated stage is marked by deflation of the body when all of the gasses
and internal fluids are purged as a result of an extreme built-up of pressure and as larvae begin to
penetrate the body’s skin (Goff, 2010; Payne, 1965; Rivers & Dahlem, 2014).
1.2.2.3 Decay Stage
The decay stage is the stage of decomposition which varies the most between researchers.
While Goff (2010) proposes a single stage, others divide the decay stage into two stages (Goff,
2010; Rivers & Dahlem, 2014). For example, Payne (1965) divides the decay stage into the
active decay and advanced decay stages. While the number of decay stages may vary between
researchers, all agree that the stage begins when the bloated body becomes deflated (Goff, 2010;
Rivers & Dahlem, 2014).
The decay stage of decomposition is often characterized by a strong odor due to the
release of the liquids and gasses from the body (Goff, 2010; Rivers & Dahlem, 2014). Although
most of the moisture within the body’s tissue have been lost, it is not yet dry and therefore
continues to serve as a nutritional resource for insects and microbes (Goff, 2010; Rivers &
Dahlem, 2014).

29
During the decay stage, Diptera larvae form large aggregations on the body which result
in consumption of most of the body’s tissues (Goff, 2010; Rivers & Dahlem, 2014). Predatory
insects, including beetles from the families Silphidae, Staphylinidae and Histeridae, increase in
numbers as larval aggregations form (Goff, 2010; Rivers & Dahlem, 2014).
By the end of the decay stage, the Diptera larvae will complete feeding and will begin to
disperse from the body in search of a location to pupate (Goff, 2010; Rivers & Dahlem, 2014).
The end of this stage is marked by the removal of most of the body’s tissue, leaving just skin,
cartilage and bone (Goff, 2010; Rivers & Dahlem, 2014)
1.2.2.4 Post Decay Stage
As the body transitions to the post decay stage, the remaining tissue dries out as all
moisture is lost. At this point, the body no longer has nutritional value to some necrophagous
insects, such as Diptera. However, the dried tissue does attract other necrophageous species, such
as beetles in the family Dermestidae and flies in the family Piophilidae, which remove all
remaining tissue (Goff, 2010; Rivers & Dahlem, 2014). The end of the post decay stage is
marked by complete removal of the body’s tissues (Goff, 2010; Rivers & Dahlem, 2014).
1.2.2.5 Skeletal or Remains Stage
In the final stage of decomposition, only bones and hair are left of the body (Goff, 2010;
Rivers & Dahlem, 2014). There is no insect activity that is associated with the body during the
skeletal/remains stage as there is no nutritional value left for the insects to feed on (Goff, 2010;
Rivers & Dahlem, 2014). However, remnants of the presence of insects, such as pupariums, may

30
provide insight into past insect activity (Goff, 2010; Rivers & Dahlem, 2014). There is no
defined end point to this last stage of decomposition (Goff, 2010; Rivers & Dahlem, 2014).
1.2.3 Factors Affecting the Rate of Decomposition
Although predictable in progression, decomposition is a complex process that is
influenced by various environmental (abiotic) factors and living (biotic) organisms (Rivers &
Dahlem, 2014). The abiotic and biotic factors can affect the chemical and physical changes that
occur and the rate at which decomposition proceeds.
1.2.3.1 Abiotic Factors
Abiotic factors associated with the immediate environment in which a body is located can
affect the decomposition of a body (Rivers & Dahlem, 2014). Temperature is considered to be
the most influential abiotic factor on the rate of decomposition as it directly affects the chemical
breakdown of the body’s tissues and the activity of living organisms (i.e. microbes and insects)
(Rivers & Dahlem, 2014). Warmer temperatures speed up the rate of decomposition, while lower
temperatures slow it down, which is why bodies located in direct sunlight decompose faster than
those in the shade (Joy et al., 2006).
Environmental moisture can also affect the progression of decomposition (Rivers &
Dahlem, 2014). Moisture is needed for autolysis and putrefaction to proceed, and maintains the
nutritional value of the body for feeding insects (Goff, 2010; Rivers & Dahlem, 2014). A body
located in moist regions, such as tropical environments, can rapidly decompose and become

31
skeletonized within two weeks (Ubelaker, 2006). However, environments with low moisture can
cause mummification, or drying of the body’s tissue, which preserves the body and prevents
skeletonization from occurring (Galloway, 1997; Goff, 2010). Dry climates with low moisture
can occur in regions with high temperatures and subzero temperatures, although the rate of
mummification varies between the two (Goff, 2010; Rivers & Dahlem, 2014). A body located in
a region with high temperatures and low moisture can become mummified within weeks, but will
take much longer to occur when temperatures are low (Goff, 2010; Rivers & Dahlem, 2014). A
body can also be preserved in moist environments if it is located in wet, anaerobic conditions,
such as being buried in soil (Goff, 2010; Rivers & Dahlem, 2014). In these conditions, adipocere
can form, which is a thick, waxy layer that forms on the body when fatty tissues are hydrolyzed
during decomposition (Notter, Stuart, Rowe, & Langlois, 2009).
Precipitation in the form of rain can slow the rate of decomposition by deterring insects
from colonizing and/or feeding on the remains (Rivers & Dahlem, 2014). Many Diptera species
are unable to successfully search for decomposing organism as flying becomes difficult in heavy
rains (Catts & Goff, 1992; Rivers & Dahlem, 2014). Additionally, if rain occurs post-
colonization, feeding larvae can become disturbed and wander elsewhere (Rivers & Dahlem,
2014). Therefore, rain results in decreased insect activity, which in turn results in slower rates of
decomposition.
1.2.3.2 Biotic Factors
Living organisms can also affect the rate of decomposition. These organisms, which
include microorganisms, insects and scavengers, feed on the body’s tissues, increasing the rate at

32
which decay occurs (Goff, 2010; Rivers & Dahlem, 2014). Microorganisms, such as bacteria and
fungi, play a crucial role in the chemical decomposition of a body, while insects and scavengers
affect the physical deterioration of a body (Rivers & Dahlem, 2014).
Research conducted by DesMarais (2014) demonstrated the pivotal role insect activity
plays during decomposition. In this research, control carcasses were sprayed with insecticide to
prevent insect activity from occurring. An extended bloat stage and an overall slower rate of
decomposition was observed for the control carcasses in comparison to the experimental
carcasses that were not subjected to insecticide (DesMarais, 2014). Insect activity significantly
affects the rate at which decomposition occurs (Rivers & Dahlem, 2014)
Vertebrate scavengers, which can include a variety of avian, mammalian and reptilian
species, utilize decomposing bodies as a food source (Goff, 2010; O’Brien, 2008). These
scavengers can consume much of the body’s tissue, thus decreasing the time to skeletonization
(Goff, 2010). Scavenging has been shown to eliminate the difference in decompositional rates
between seasons by removing the tissues more quickly during colder seasons than would
typically occur by insect and microbial activity alone (O’Brien, 2008)

CHAPTER 2: IMAGING

34
2.1 Infrared Radiation
In 1800, Frederick William Herschel was the first to discover the infrared (IR) region of
the electromagnetic spectrum. Herschel used thermometers and a prism to measure the
temperatures of different visible regions of the electromagnetic spectrum. However, Herschel
discovered that maximum heat was detected beyond the exposure of the prism to the maximum
amount of visible light (i.e. red). Therefore, Hershel concluded that there must be wavelengths of
light in the electromagnetic spectrum that is beyond what is visible to the human eye (Herschel,
1800). Soon after this discovery, it was established that any living or non-living body with a
temperature above zero does emit IR (Brewster, 1992; Vollmer & Mollmann, 2017).
The electromagnetic spectrum describes the frequencies and wavelengths of both visible
and invisible light (i.e. UV and infrared). The IR region is considered low energy due to its low
frequencies and long wavelengths (Petersen, 2007). Although these wavelengths are not
detectable by the human eye, our senses have evolved to sense IR through its associated heat
(Petersen, 2007).
The emissivity of IR by an object is dependent upon the object’s properties and ability to
absorb infrared. An object with a high emissivity is considered a blackbody, which absorbs all IR
placed upon it. Comparatively, a greybody, which has a low emissivity, will reflect some IR. An
object will have a greater emissivity the more IR it absorbs (Brewster, 1992; Vollmer &
Mollmann, 2017). To put this into perspective, a black vehicle would appear hotter than a silver
vehicle using an infrared camera due to its high emissivity (Lee, 2017). Understanding the
concept of emissivity is vital in understanding how thermal imaging technology can be used to
detect differences in temperature between an object and its surroundings.

35
Properties of IR radiation have been implemented in thermal imaging techniques to detect
components of the world that would otherwise go unnoticed. Some applications of IR imaging
techniques include the use in search and surveillance operations for the military, in
photographing crime scenes, and in medical diagnoses (Edelman, Hoveling, Roos, van Leeuwen,
& Aalders, 2013; Lloyd, 1975)
2.1.1 Forward Looking Infrared Radar (FLIR)
Forward looking infrared radar (FLIR) is a type of thermal imaging often used in aerial
operations. The FLIR operates in the far-infrared spectrum with a wavelength of about 20-1000
µm (Petersen, 2007). The field of view will consist of the object of interest (target) and the
environment surrounding it (background), all emitting different amounts of IR. There may also
be additional objects (clutter) that can obscure the detected radiation (Petersen, 2007). Therefore,
the image gathered must be deciphered in order to distinguish the target from its surroundings.
FLIR technology has recently been utilized in two research studies to detect larval
aggregations on decomposing pig carcasses (Amendt et al., 2017; Lee et al., 2018). These
research studies aimed to determine if the heat produced from larval aggregations was significant
enough to be detected by a FLIR mounted on a police helicopter under different climatic
conditions (Amendt et al., 2017; Lee et al., 2018). The recent success of these studies supports
the need for further research using FLIR technology to detect larval aggregations in different
regions and investigate options to improve the techniques with the aim of providing cost-
effective and adaptable system for law enforcement agencies when searching for missing
individuals.

36
2.2 Aerial Imaging
Aerial imaging pertains to the capturing or surveillance of the world from an elevated
surface above ground. The development of aerial imaging technology began in early 1700’s, and
has continued to advance for various purposes, such as surveillance, disaster assessment,
ecosystem monitoring, and search and rescue missions (Petersen, 2007). Devices used
historically and/or presently for such purposes include planes, satellites, helicopters and
unmanned aerial systems. Many of these devices use electromagnetic surveillance techniques,
such as infrared radars, for greater visualization of the area of interest (Petersen, 2007). With
aerial imaging technology, the world can be seen in a way that is not possible through the human
eye alone.
2.2.1 Unmanned Aerial Systems (UAS)
Unmanned aerial systems (UAS), or drones, are aircrafts that require no onboard operator
and are controlled by computer or remote technology (Perritt & Spraque, 2017). UAS were
developed in the early 1900’s due to advancements in technology that was driven by military and
model-aircraft interests. The initial use of UAS was for anti-aircraft target practice during World
War II. However, by the end of the war and during the wars to follow, UAS became involved in
additional operations, including surveillance and reconnaissance missions (Perritt & Spraque,
2017).This unique aircraft system allowed the military to save lives and to go places that would
otherwise be unreachable. UAS have since become a common technique used for aerial imaging
purposes.

37
Further advancement in technology has allowed for the development of smaller systems with
increased aerial imaging capabilities, including capturing photos/videos and live streaming
images to operators (Cheng, 2016). Within the past decade, these small, unmanned aerial
systems (sUAS) have become a well-known and easily acquired technological device for both
business and pleasure. Besides military operations, sUAS are currently being used for landscape
photography, movie and T.V. production, search and rescue missions and law enforcement
(Perritt & Spraque, 2017).
2.2.1.1 UAS Classification
There is no standard classification system for UAS. As the use of UAS has readily increased
for a variety of applications, it has become more difficult to create a classification system that
can incorporate all of the different UAS being utilized. Therefore, UAS are typically classified
based on a number of performance specifications and/or by mission aspects (Agbeyangi, Odiete,
& Olorunlomerue, 2016).
UAS can be classified according to one or more performance specifications, including
weight, endurance and range, maximum altitude, wing loading, engine type and power
(Arjomandi, Agostino, Mammone, Nelson, & Zhou, 2006). For example, the United States
Department of Defense has specified five categories of military UAS based on four of these
performance specifications (Table 2:1) (Arjomandi et al., 2006).

38
Table 2:1 - United States Department of Defense Classification of Unmanned Aerial Systems (adapted in Arjomandi et al., 2006)
Category
Size Maximum
Gross Takeoff Weight
(MGTW) (lbs)
Normal Operating
Altitude (ft)
Airspeed (knots)
Group 1 Small 0-20 <1200 AGL <100
Group 2 Medium 21-55 <3500 <250
Group 3 Large
<1320 <18000 MSL <250
Group 4 Larger >1320 <18000 MSL Any
Group 5 Largest >1320 >18000 Any
AGL = Above Ground Level MSL = Mean Sea Level
UAS can also be classified according to mission aspects, which are based on functional
applications (Agbeyangi et al., 2016; Arjomandi et al., 2006). These functional categories
include UAS target and decoy, reconnaissance (surveillance), combat, logistics (delivery), and
civil and commercial purposes (Arjomandi et al., 2006). `
2.3 Forensic Implications
The use of sUAS in law enforcement is quickly growing. Aerial imaging by helicopters has
historically been used by law enforcement for surveillance, pursuits, incident investigations and
accident reconstructions. However, helicopters are expensive and not all agencies have access to
one (Perritt & Spraque, 2017). Also, helicopters can be restricted to priority applications due to
cost, they are unable to fly over certain areas and compared to sUAS, have less adaptability in

39
rapid height adjustment and positioning. Therefore, sUAS are becoming incorporated into these
situations due to low cost and ease of use. For example, in March 2017, a Maryland police
department used a sUAS to fly over a suspected area and capture images of stolen construction
equipment worth nearly $400,000 (Warren, 2017). In March 2019, police in Texas used a sUAS
to follow and catch a suspect who was on the run (“Arlington police now using drones to catch
criminals,” 2019). These are just two of the many examples in which the technological
advancements of sUAS are providing new possibilities to law enforcement that would otherwise
be too expensive or difficult to undertake.
One of the benefits of using sUAS, especially in law enforcement, is that they can be
equipped with various types of cameras, including infrared cameras (Cheng, 2016). The
combining of aerial and thermal imaging into a single, compatible device has provided law
enforcement with greater visualization capabilities in operations like search and rescue missions.
The first time a sUAS equipped with an infrared camera was used in a search and rescue mission
was in May 2013 by the Royal Canadian Mounted Police. A man’s car had flipped over into the
snow in a remote, wooded area. He tried calling 911 for assistance but was not able to provide
his exact location. Other search methods were used, such as helicopters and search parties, but
only the sUAS was able to locate the man, due to the difference in temperature between the man
and his surroundings (Franzen, 2013). Since then, many search and rescue organizations have
incorporated the use of this technology into their procedures. For example, sUAS with infrared
technology have also been utilized by police for detection of suspects in pursuits. In March 2019,
Murrysville police used a sUAS with an infrared camera to track two suspects who had fled into
the woods after crashing a stolen car. The sUAS operator was able to detect two heat signatures
and dispatched officers to the area where the two suspects were hiding (Peirce, 2019).

40
Despite the increasing use of sUAS by law enforcement agencies, this technology has not
yet been utilized in search and recovery missions for missing, deceased individuals. Currently,
law enforcement agencies rely on expensive and/or time-consuming search tactics including
cadaver dogs, search parties and aerial imaging devices. However, previous research has shown
the success of utilizing an aircraft system mounted with a FLIR to detect decomposing carcasses
more than four days after death, as a result of the heat produced from associated larval
aggregations (Amendt et al., 2017; Lee et al., 2018). Therefore, a smaller aircraft system, such as
a drone, mounted with a FLIR could be utilized to detect larval aggregations on decomposing
remains, providing a more cost-effective and less-time consuming method to search extensive
areas for missing, deceased individuals.
2.4 Research Statement In an international collaboration with Dr. Sasha Voss and Dr. Michael Lee from the
University of Western Australia, this research aims to determine if a sUAS mounted with a FLIR
can detect larval aggregations on decomposing carcasses in an effort to develop a more effective
search and recovery method for law enforcement agencies.

41
2.5 Aims and Objectives
This research aims to develop a user-friendly, portable, field adaptable and cost-effective
search method for law enforcement by:
1. Determining if a sUAS and a thermal imaging camera are compatible and can be
used to detect differences in temperature while in flight.
2. Determining a baseline for the amount of heat generated by Phormia regina
maggot masses in the Connecticut region.
3. Evaluating the relationship between sUAS height and temperature detection using
FLIR technology.
4. Determining if larval aggregations on decomposing carcasses can be detected
using a sUAS with thermal imaging technology.
The objectives of this research are to:
1. Integrate the FLIR with the sUAS for real time imaging of thermal differences at
varying heights.
2. Record the temperature of different sized maggot masses in a lab-controlled study
in order to calculate the daily differences in temperature between each maggot
mass and the ambient temperature.
3. Utilize the FLIR and sUAS to detect artificial heat sources that model the
temperature of maggot masses.

42
4. Utilize the FLIR and sUAS to determine if larval aggregations on decomposing
organisms can be detected.

CHAPTER 3: MATERIALS AND METHODS

44
3.1 Drone and Thermal Camera Integration Drone and thermal camera devices were integrated and tested to determine which set-up
would be optimal for the aims of this research. Each system was assessed for compatibility, as
well as for individual drone and thermal camera capabilities.
3.1.1 DJI Phantom™ 3 Standard Drone and FLIR Duo® Camera
The DJI Phantom™ 3 Standard drone (Figure 3:1) was the initial sUAS tested for this
research. The drone’s features included live Global Positioning System (GPS), geosynchronous
hovering for stability and ease of control, and a built-in camera to capture images and videos.
This drone was also compatible with the DJI© GO mobile application, which provided a live
video feed, or first-person view (FPV), and control of the on-board camera during flight.
Figure 3:1 - DJI Phantom™ 3 Standard drone with remote controller and DJI© GO mobile application (Photograph by Megan Descalzi)
The FLIR Duo® (Figure 3:2) was a dual-sensor thermal camera designed for drones. This
camera was compact and lightweight, making it suitable for on-board attachment during drone

45
flight. The FLIR Duo® was controlled via the FLIR UAS™ mobile application, which could be
utilized to capture real-time thermal and visual images and videos. These images could then be
uploaded to the FLIR Tools® software program for analysis. This program could be utilized to
determine the temperature of an area and to optimize thermal signatures by adjusting the color
palette and optical parameters, such as emissivity and reflected temperature.
Figure 3:2 - FLIR Duo® thermal camera (Photograph by Megan Descalzi)
While both devices were independently valuable for this research, they could not be
integrated into one system. The aim was to remove and replace the built-in camera on the DJI
Phantom™ 3 Standard drone with the FLIR Duo®. However, it was not possible to remove the
built-in camera as it had been integrated into the drone hardware during manufacturing. Without
removing the built-in camera, the thermal camera could not be mounted on to the drone. It was
concluded that these two devices were not compatible for drone flight.
3.1.2 DJI Phantom™ 2 Drone and FLIR Duo® Camera
The FLIR Duo® was then tested with the DJI Phantom™ 2 drone, as these devices were
advertised by FLIR® as compatible. The DJI Phantom™ 2 drone (Figure 3:3) had GPS and was
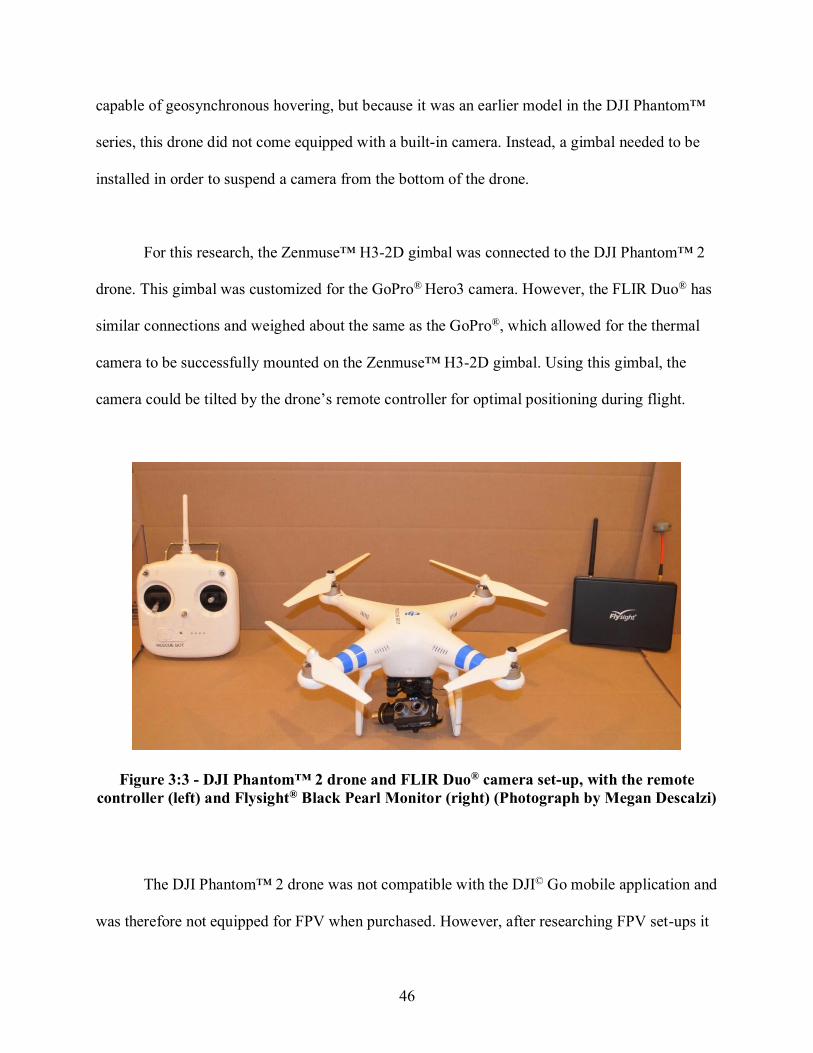
46
capable of geosynchronous hovering, but because it was an earlier model in the DJI Phantom™
series, this drone did not come equipped with a built-in camera. Instead, a gimbal needed to be
installed in order to suspend a camera from the bottom of the drone.
For this research, the Zenmuse™ H3-2D gimbal was connected to the DJI Phantom™ 2
drone. This gimbal was customized for the GoPro® Hero3 camera. However, the FLIR Duo® has
similar connections and weighed about the same as the GoPro®, which allowed for the thermal
camera to be successfully mounted on the Zenmuse™ H3-2D gimbal. Using this gimbal, the
camera could be tilted by the drone’s remote controller for optimal positioning during flight.
Figure 3:3 - DJI Phantom™ 2 drone and FLIR Duo® camera set-up, with the remote controller (left) and Flysight® Black Pearl Monitor (right) (Photograph by Megan Descalzi)
The DJI Phantom™ 2 drone was not compatible with the DJI© Go mobile application and
was therefore not equipped for FPV when purchased. However, after researching FPV set-ups it

47
was discovered that with the connection of additional drone parts, FPV could be established
using the FLIR Duo® and the DJI Phantom™ 2 drone. To accomplish this FPV set-up, the top
cover of the drone was removed and a plug and play cable was used to connect the DJI© iOSD
Mini On-Screen Display and the ImmersionRC© 600MW 5.8GHz A/V Transmitter to the drone
board (Figure 3:4) (Iftirbashir, 2006). A FatShark® ImmersionRC© 5.8GHz Circular Polarized
SpiroNET Antenna with SMA connector was attached to the transmitter, and a FatShark®
ImmersionRC© 5.8GHz Circular Polarized SpiroNET Antenna with RP-SMA connector was
attached to the receiver, a Flysight® Black Pearl Monitor (Iftirbashir, 2006). This FPV set-up
transmitted a real time video from the mounted thermal camera to the monitor while the drone
was in flight. Flight information, such as height and velocity, was also transmitted to the monitor
from the connected DJI© iOSD Mini On-Screen Display (Iftirbashir, 2006).
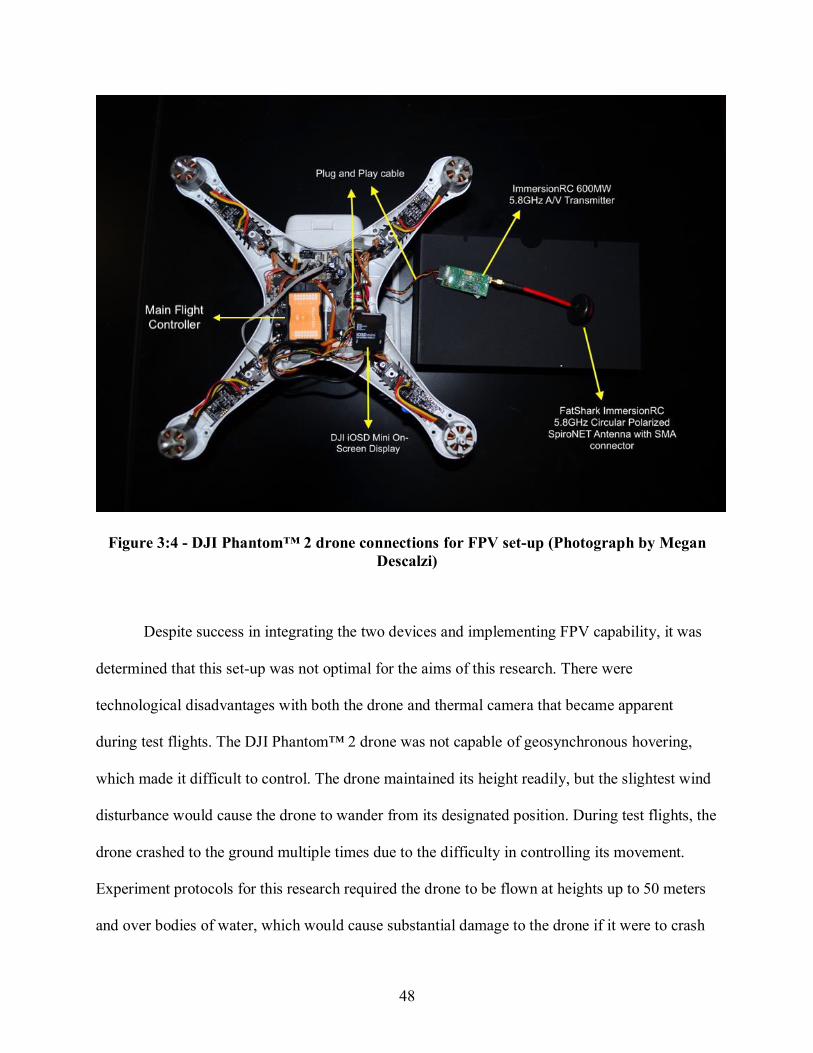
48
Figure 3:4 - DJI Phantom™ 2 drone connections for FPV set-up (Photograph by Megan Descalzi)
Despite success in integrating the two devices and implementing FPV capability, it was
determined that this set-up was not optimal for the aims of this research. There were
technological disadvantages with both the drone and thermal camera that became apparent
during test flights. The DJI Phantom™ 2 drone was not capable of geosynchronous hovering,
which made it difficult to control. The drone maintained its height readily, but the slightest wind
disturbance would cause the drone to wander from its designated position. During test flights, the
drone crashed to the ground multiple times due to the difficulty in controlling its movement.
Experiment protocols for this research required the drone to be flown at heights up to 50 meters
and over bodies of water, which would cause substantial damage to the drone if it were to crash

49
under these conditions. Therefore, it was essential to this research that the drone utilized could
maintain its position steadily and be maneuvered easily because if the drone were to wander or
crash, further research could be inhibited.
The FLIR Duo® could not be utilized to determine the temperature measurement in real
time of a certain area within the field of view. The only way to determine the temperature was to
capture an image of an object or area using the FLIR UAS™ mobile application, and then upload
the image to the FLIR® Tools program for analysis. This was a time-consuming, multi-step
process which prevented efficient analysis of the temperature differences between a targeted
object and its surroundings in real time.
Although the FPV set-up was able to display real time video to the monitor during drone
flight, the image transmitted was often pixelated and lacked sufficient detail to discern what the
FLIR Duo® was detecting in its field of view. FPV is an essential component to this research as it
is the visual component needed to detect the temperature differences between the targeted object
and its surroundings. The lack of quality in this FPV imaging was problematic for this research
as it made it difficult to visualize these temperature differences during drone flight. Additionally,
flight information transmitted from the DJI© iOSD Mini On-Screen Display was difficult to read
and report during flight. The values displayed on the Flysight® Black Pearl Monitor were
sometimes blocked by the edges of the screen, and it was difficult to discern which values
corresponded to specific flight information. Drone height in particular was an important value to
read and report for this research, but using this drone set-up, it was not always possible to
determine the drone’s height during flight.

50
It was determined after multiple test flights that the DJI Phantom™ 2 drone and FLIR
Duo® set-up was not efficient or practical for this research. There were too many technological
disadvantages needed to be overcome before experiments could begin. Therefore, a new set-up
was needed to proceed.
3.1.3 Parrot Bebop-Pro Thermal™ Drone
A search for thermal drones revealed the Parrot Bebop-Pro Thermal™ drone (Figure 3:5),
which was released in December 2017. This new thermal drone was advertised for professional
use, such as by first responders for search and rescue missions and by builders for roof
inspections. This drone had GPS, geosynchronous hovering and was equipped with two built-in
cameras, including a visual camera and a FLIR One Pro® thermal imaging camera. The drone
was controlled using the Parrot Skycontroller™ 2, in conjunction with the FreeFlight Thermal™
mobile application, which was downloaded on a Samsung Galaxy Tab® A tablet for this
research. The FreeFlight Thermal™ mobile application provided a live stream view from the
visual and thermal cameras during drone flight. This mobile application was also utilized to
capture images and videos, switch between cameras and adjust the thermal color pallet for
optimal visualization of thermal signatures.

51
Figure 3:5 - Parrot Bebop-Pro Thermal™ drone set-up, with Skycontroller™ 2 (top left) and Samsung Galaxy Tab® A tablet (bottom left) (Photograph by Megan Descalzi)
The FreeFlight Thermal™ mobile application was capable of thermal analysis during and
after flight. The temperature of an object or area could be determined by simply touching the
tablet screen at the location of interest within the image. The detected temperature was then
reported on the screen (Figure 3:6). This feature was utilized for this research to analyze and
record the temperature of objects and surroundings within captured thermal images after flight.

52
Figure 3:6 - Thermal analysis using the FreeFlight Thermal™ mobile application
Before the Parrot Bebop-Pro Thermal™ drone was utilized for research purposes, test
flights (Figure 3:7) were performed in order to learn the features of the drone, such as switching
between cameras mid-flight and capturing images and videos. Considerable time was also taken
to practice flying the drone at various heights and maneuvering it to a designated position to
ensure that operation of the drone was efficient for future research. After multiple test flights, it
was determined that the Parrot Bebop-Pro Thermal™ was a more optimal drone for the aims of
this research because it was easier to maneuver and provided greater quality imaging to detect
differences in temperature between an object and its surroundings

53
Figure 3:7 - Megan Descalzi flying the Parrot Bebop-Pro Thermal™ drone during a test flight (Photograph by Dr. R. Christopher O’Brien)
Although the test flights and most of the experimental replicates were successful,
catastrophic complications were encountered when the Parrot Bebop-Pro Thermal™ drone
crashed twice during flight. The first crash occurred in August 2018 due to GPS failure and the
second crash occurred in March 2019 because of a battery failure. Damage occurred to the drone
in both instances, which prevented continued use of the drone and inhibited additional
experimental replicates from being completed until the drone was replaced by Parrot. After the
first crash in August 2018, a replacement drone was not received from Parrot until October 2018,
which delayed the progress of this research for two months. The drone could not be replaced
after the crash in March 2019 because the Parrot Bebop-Pro Thermal™ drone was no longer
manufactured.

54
3.2 Diptera Colonies Fly colonies were maintained throughout the duration of this research in order to rear the
eggs needed for developing maggot masses for laboratory experiments. Colonies of Lucilia
sericata (Meigen, 1826), Phormia regina (Meigen, 1826), Sarcophaga bullata (Parker, 1916)
and collected wild flies were maintained. Lucilia sericata pupae was donated from Dr. Jeff
Tomberlin’s laboratory at Texas A&M University and Dr. Amanda Roe’s laboratory at the
College of Saint Mary. Phormia regina pupae was donated from Dr. Christine Picard’s
laboratory at Indiana University-Purdue University Indianapolis and Sarcophaga bullata pupae
was purchased from Carolina® Biological Supply Company. The larvae of the wild flies were
collected from a rabbit (Sylvilagus floridanus) (Figure 3:8) carcass placed outside Dr. R.
Christopher O’Brien’s laboratory at the University of New Haven in West Haven, Connecticut,
and were reared to emergence. The wild sample flies were identified as Phormia regina
(Whitworth, 2017).
Figure 3:8 - Rabbit (Sylvilagus floridanus) carcass (Photograph by Megan Descalzi)

55
3.2.1 Colony room
All fly colonies were located in the colony room within Dr. R. Christopher O’Brien’s
laboratory in West Haven, Connecticut. The colony room was temperature controlled, but the
room temperature would fluctuate depending on the ambient conditions in the Connecticut
region, which exposed the flies to varying temperatures throughout the rearing process. During
colder seasons, a space heater was used in addition to the heating system, in order to keep the
space warm enough for fly rearing and survival. A humidifier was also placed in the room to
keep the environment moist for optimal larvae survival.
There were two metal racks in the colony room utilized for fly colony maintenance and
breeding. The first rack held all of the fly colony cages and by the end of this research, there was
a total of 14 cages located on the first rack (3:9 a). The second rack held all of the rearing dishes
for fly larvae (3:9 b). Fly colony and rearing dish consumables were also kept on both racks.

56
a) b)
Figure 3:9 - a-b - Colony room set-up, a) fly colony rack, b) rearing dish rack (Photographs by Megan Descalzi)
The room had one large window, which provided natural light throughout the day.
However, due to the onset of diapause in response to increased hours of darkness in November
2018, a light timer was installed and set to a 16:8 hour (light:dark) photoperiod (Heaton, Moffatt,
& Simmons, 2014; Ody, Bulling, & Barnes, 2017).
3.2.2 Diptera Maintenance
Colony cages (12 in ×12 in × 12 in) were built with ½” PVC pipes, fastened together with
PVC side outlet elbows and PVC cement (Figure 3:10 a). Sides of curtain liner were sewed

57
together and used as mesh to cover the cages. The opened ends of the liner were secured with
rubber bands and clamps to keep the flies contained (Figure 3:10 b).
a) b)
Figure 3:10 - a-b - Colony cages, a) PVC structure of cage, b) cage covered with curtain liner and secured with rubber bands and a clamp (Photographs by Megan Descalzi)
Each cage was given a continual supply of sugar and water. Sugar cubes were placed on a
petri dish and water was contained in a urine collection cup, which had a fabric square placed
through a hole cut in the lid (Figure 3:11). The fabric was used to wick the water upward, where
the flies could easily drink from it. Sugar and water were monitored daily for replacement. A log
was utilized to keep track of when the sugar and water was replaced in each cage (Appendix A).

58
Figure 3:11 - Sugar, water and Sarcophaga bullata pupae placed inside colony cages (Photograph by Megan Descalzi)
3.2.3 Diptera Breeding
A blood feed was prepared a minimum of once a week for each cage. A blood feed
consisted of either pig liver or ground beef placed in a large weigh boat and covered in pigs
blood. After 24 hours, the blood feed was removed and examined for fly eggs or larvae. If
present, a rearing dish (Figure 3:12 a) was prepared. An extra-large GLAD® plastic container
was filled halfway with sieved sand. Ground beef was placed on a plastic plate or weight boat
and was covered in pigs blood. The ground beef placed in the rearing dishes was mixed with
water crystals in order to keep the meat moist for optimal larvae growth through all three instars
(Johnson, Wighton, & Wallman, 2014).

59
The fly eggs laid by the oviparous species or the larvae laid by the larviparous species
were transferred to the ground beef, and the plate was placed on the sand. A mesh square was
placed on top of the plastic container (Figure 3:12 b), and a rubber band was placed over the
mesh to secure it, in order to prevent the larvae from leaving the dish. Each rearing dish was
sprayed twice a day with water and larvae were monitored for wandering and pupation. Once all
larvae had pupated, the meat was removed, and the sand was sieved. The pupae were either
placed directly in a new colony to emerge (Figure 3:11) or were placed in a urine collection
container in a 4°C refrigerator for preservation. Each colony and rearing dish had an associated
log that was maintained to keep track of daily operations and larvae development (Appendix A).
This process was continually repeated in order to develop a large quantity of pupae that was later
used to generate maggot masses.
a.) b.)
Figure 3:12 - a-b - Rearing dish, a) ground beef with pigs blood placed on sand, b) dish covered with curtain liner (Photographs by Megan Descalzi)

60
3.3 Maggot Mass Temperatures in Laboratory
In laboratory-controlled studies, different sized maggot masses were generated, and
temperatures were recorded in order to determine a baseline for the amount of heat generated by
maggot mass temperatures in the Connecticut region.
3.3.1 Determination of Egg Weight
Egg rafts removed from blood feeds (Figure 3:13) were weighed and counted in order to
determine the average weight of an individual egg for each of the oviparous fly species in
colony. Five rafts from the L. sericata blood feeds and eight rafts from P. regina blood feeds
were used. The number of egg rafts weighed and counted varied between the species because
greater complications were encountered with maintaining the L. sericata colonies than the P.
regina colonies, which reduced the number of egg rafts that were collected from the L. sericata
blood feeds. The egg rafts from the L. sericata flies all came from Colony Three, while the egg
rafts from P. regina flies came from Colonies One, Four, Five and Eight.
After being removed from the blood feeds, the egg rafts were immediately weighed using
a Mettler® B5 analytical scale. The eggs were preserved in 70% ethanol and the number of eggs
in each sample were counted. The weight of each egg raft was then divided by the number of
eggs counted in order to determine the weight of each individual egg, in micrograms. This same
procedure was followed for the S. bullata in colony, but a small quantity of larvae from three
blood feeds were weighed and counted instead of egg rafts, as it is a larviparous species. The
same calculations were made in order to determine the weight of an individual larvae for S.
bullata.

61
Figure 3:13 - Egg raft collected from pigs blood feed (Photograph by Megan Descalzi)
3.3.2 Experimental Set-up for Laboratory-Controlled Studies
The average egg weight of P. regina flies was used to estimate the weight of different
sized egg rafts containing approximately 200, 1,000 and 5,000 eggs. Blood feeds were placed in
the P. regina species cages and were removed after 24 hours. The eggs laid were used to
generate the different egg raft sizes based on the previously calculated weights. These eggs were
then placed on carcasses large enough to support the developing maggot masses. The estimated
200 eggs were placed on a chipmunk (Tamias striatus) carcass (Figure 3:14 a), 1,000 eggs on a
rabbit (Sylvilagus floridanus) carcass (Figure 3:14 b) and 5,000 eggs on a coyote (Canis latrans)
carcass (Figure 3:14 c).
A total of six carcasses were utilized for two experimental replicates. The chipmunks and
rabbits were donated from the Veterinary Clinic for Birds and Exotics in New York, and the
coyotes were donated from a hunter in Connecticut. Each carcass was previously frozen and was
thawed for at least 24 hours prior to the experiment beginning. The carcasses were placed in a
plastic bin containing sand and were covered with either curtain liner or aluminum screen mesh,
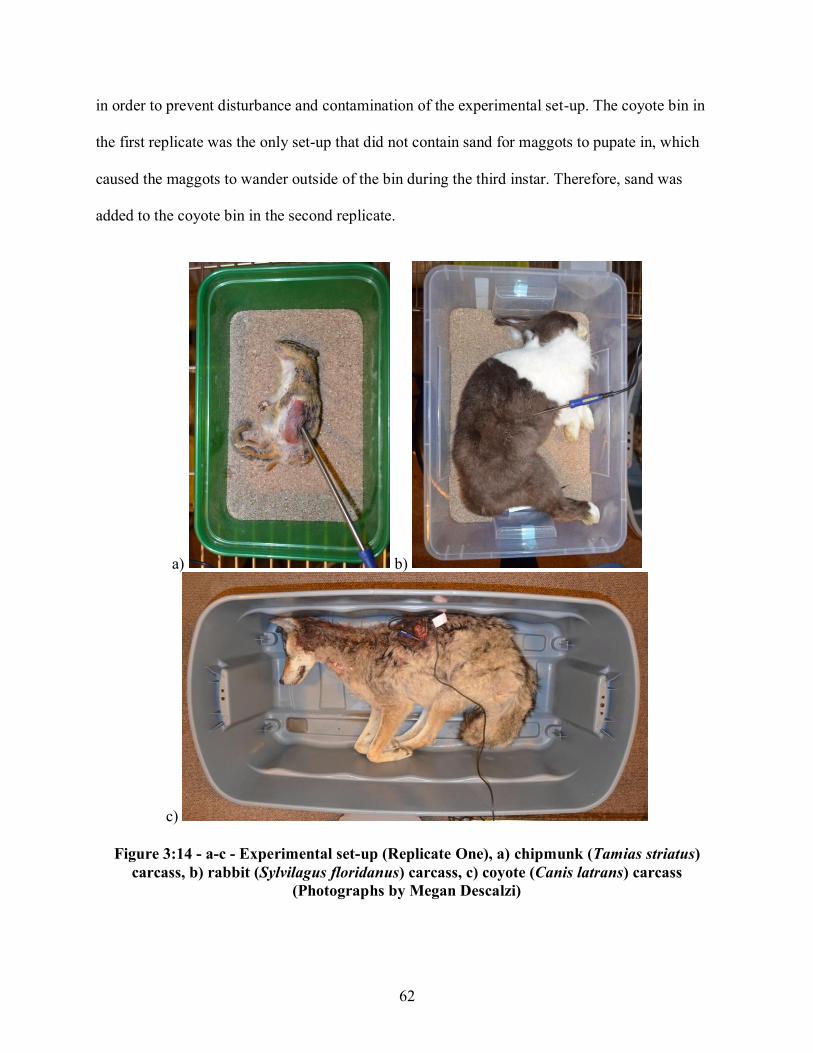
62
in order to prevent disturbance and contamination of the experimental set-up. The coyote bin in
the first replicate was the only set-up that did not contain sand for maggots to pupate in, which
caused the maggots to wander outside of the bin during the third instar. Therefore, sand was
added to the coyote bin in the second replicate.
a) b)
c)
Figure 3:14 - a-c - Experimental set-up (Replicate One), a) chipmunk (Tamias striatus) carcass, b) rabbit (Sylvilagus floridanus) carcass, c) coyote (Canis latrans) carcass
(Photographs by Megan Descalzi)

63
Prior to placing the egg rafts, lacerations were made on each carcass, which provided the
eggs with a moist, protected environment, optimal for larval growth. For the first replicate, an
egg raft was placed within a laceration that was made with a scalpel in the lateral cervical region
of each carcass (Figure 3:15 a). However, larval aggregations only formed in the cervical region,
not in the abdominal region where the probe was positioned to measure aggregation
temperatures. Therefore, lacerations in the subsequent replicate were made in the abdominal
region of each carcass (Figure 3:15 b).

64
a)
b)
Figure 3:15 - a-b - Egg rafts (indicated by black arrow) placed in lacerations made on
coyote (Canis latrans) carcasses, a) lateral cervical region (Replicate One), b) abdominal region (Replicate Two) (Photographs by Megan Descalzi)

65
3.3.3 Data Collection
Temperature readings of the carcasses were recorded using a FLIR® E6 infrared camera
(Figure 3:16) and General® IRT207 Infrared Laser Thermometer. The FLIR® E6 camera is
capable of visually assessing infrared signatures and was therefore used to locate the warmer
regions of the carcasses where maggot masses may have developed and to record the temperature
of those regions. Once the warmer regions were identified, the infrared thermometer was utilized
to record an additional temperature reading of the area. Both instruments were also used to
record the temperature of an area of a carcass unaffected by larval activity. This temperature
served as a baseline for the carcass temperature when equivalent to the ambient temperature of
the colony room.
Figure 3:16 - FLIR® E6 infrared camera (Photograph by Megan Descalzi)

66
Additional temperature readings were recorded using a Tinytag® dual external temperature
logger with two thermistor probe attachments (TGP-4520) and a Gemini Tinytag®
internal/external temperature logger with one thermistor probe attachment (TGP-4510) from
Gemini Data Loggers UK Ltd. Each probe was inserted into the abdomen of a carcass used in the
experimental set-up (Figure 3:14 a-c). The Tinytag® TGP-4510 temperature logger was also
utilized to record ambient temperature of the room in which the experiment was taking place.
Temperature readings were recorded daily until larval activity ceased and pupation began to
occur.
3.4 Hot Water Analog
A hot water source was utilized as an analog for maggot masses, in order to determine how
temperature detection varied with increasing drone height. Hot water sources were placed on and
near a variety of substrates at two different locations. The Parrot Bebop-Pro Thermal™ drone
was flown at different search heights and was utilized to determine the temperature of the water
source and the substrates at those heights.
3.4.1 Hot Water Analog Experimental Set-Up
A plastic container filled with water was placed on a substrate at one of the two locations. A
5-gallon (Figure 3:17 a) and 50-gallon (Figure 3:17 b) plastic container were both utilized in
different replicates of this research. Water temperature was kept constant using a PolyScience®
Sous Vide® DISCOVERY Circulator and was set between 10°C and 50°C depending on the
ambient temperature at the time of each replicate. A Digi-Sense Traceable® Remote Probe
Digital Thermometer was placed in the water source, and a Tinytag® internal temperature and

67
relative humidity logger (TGP-4500) from Gemini Data Loggers UK Ltd was placed near the
experimental set-up. A HoldPeak® 866B digital anemometer was not initially used in earlier
replicates of this research but was later added to the experimental protocol. The anemometer was
assembled on a tripod next to the water source in order to measure wind speed.
a)
b)
Figure 3:17 - a-b - Experimental set-up, a) 5-gallon plastic container on the North-West side of Horse Island, b) 50-gallon plastic container outside Dr. R. Christopher O’Brien’s
laboratory (photographs by Megan Descalzi)

68
3.4.2 Experimental Locations
Horse Island is located in the Long Island Sound and is owned by Yale University and
managed by the Peabody Museum (Figure 3:18). Two sites on the island were utilized for this
research. The hot water source was placed on a rock on the East side of the island and on a
concrete dock on the North-West side of the island. The substrates analyzed include rock, marsh
and the sound on the East side and rock, concrete and the sound on the west side. Only the hot
water source on the North-West side of the island was replicated due to the continued difficulty
in accessing the East side of the island with the boat during tide changes.
Figure 3:18 - Horse Island (placement of hot water baths is indicated by the blue stars)

69
Dr. R. Christopher O’Brien’s laboratory at the University of New Haven in West Haven,
Connecticut was utilized as a second location (Figure 3:19). The hot water source was placed
outside on concrete near the East side of the building. The surrounding substrates analyzed also
included bitumen and dirt. The hot water source outside the lab was replicated six times, three
for each hot water source size.
Figure 3:19 - Dr. R. Christopher O’Brien’s laboratory (placement of hot water bath is indicated by blue star) (Photograph by Megan Descalzi)
3.4.3 Data Collection
The Parrot Bebop-Pro Thermal™ drone was utilized to capture thermal images of the hot
water source and the surrounding substrates at heights between two and 50 meters. These images
were later analyzed using the FreeFlight Thermal™ mobile application to determine the
temperature of the water and substrates at each height. During drone flight, the FLIR® E6

70
infrared camera was also utilized to record the temperature of the water and substrates from a
consistent height of about two meters. Two individuals, a drone operator and a data recorder,
were needed to carry out these processes. Additional measurements including windspeed using
the HoldPeak® 866B digital anemometer, water temperature using the Digi-Sense Traceable®
Remote Probe Digital Thermometer and ambient temperature using the Tinytag® TGP-4500
logger were recorded throughout the duration of the experiment. A data collection sheet was
created to record all temperature measurements and flight information for each replicate.
3.5 Field-Based Study
The temperature of developing maggot masses on animal carcasses placed outside was
analyzed at different drone heights using the Parrot Bebop-Pro Thermal™ drone. Similar
experimental protocols used to analyze the hot water sources were followed.
3.5.1 Field-Based Experimental Set-Up
Two carcasses were utilized for this experimental set-up. A coyote (Canis latrans)
carcass (Figure 3:20 a) was placed at the location on 30 July 2018 and a white-tailed deer fawn
(Odocoileus virginianus) carcass (Figure 3:20 b) was placed at the same location in 05
November 2018. Both carcasses were secured with rope to prevent scavengers from moving the
carcass away from the experimental site. A Moultrie® M-990i Digital Game Camera was set-up
to record any scavenging activity that occurred on the carcasses. The Tinytag® TGP-4500 logger
was also set-up nearby. The HoldPeak® 866B digital anemometer was added to the experimental
protocols following the first replicate and therefore was only utilized to measure windspeed
during the second replicate

71
a) b) Figure 3:20 - a-b - Field-based experimental set-up, a) Coyote (Canis latrans) carcass (Day
0), b) White-tailed deer fawn (Odocoileus virginianus) carcass (Day 0)
3.5.2 Experimental Location
The University of New Haven has a satellite campus in Orange, Connecticut surrounded
by 47 acres of wooded land (Figure 3:21). A site in the south-east corner of the campus was
utilized for the purposes of this field research. The ground at this specific site consisted of wood
chips and was only partially covered by trees.

72
Figure 3:21 - University of New Haven, Orange Campus (placement of carcasses indicated
by the yellow arrow)
3.5.3 Data Collection
Similar to the hot water sources, the Parrot Bebop-Pro Thermal™ drone was flown above
each carcass at heights between two and 50 meters. Thermal images were captured and were
later analyzed using the FreeFlight Thermal™ mobile application to determine the temperature
of the carcass and wood chips at each height. The drone was utilized on the day of placement to
record carcass temperature prior to fly colonization. Each carcass was then monitored daily for
the presence of larval activity, and the drone was utilized daily once larvae became visible. The
FLIR E6 was again used to record temperature of both the carcass and substrate at a constant

73
height of about two meters. The Tinytag® TGP-4500 logger recorded ambient temperature and
the HoldPeak® 866B digital anemometer recorded wind speed during the time of flight.
3.6 Statistical Analysis
Statistical analysis was conducted using the VSN International GenStat® 19th edition
statistical package. Linear regression and analysis of variance (ANOVA) tests were used to
determine relationships and differences between different variables and factors from this
research. Additional statistical tests were run as necessary.

CHAPTER 4: RESULTS

75
4.1 Drone and Thermal Camera Integration
The compatibility of the DJI Phantom™ 3 Standard drone and DJI Phantom™ 2 drone
with the FLIR Duo® thermal camera was tested. The DJI Phantom™ 3 Standard drone was not
compatible with the FLIR Duo® because the built-in drone camera could not be removed and
replaced with the thermal camera. The DJI Phantom™ 2 drone and FLIR Duo® were successfully
integrated using the Zenmuse™ H3-2D gimbal and additional FPV drone parts but was difficult
to maneuver and lacked sufficient detail to detect temperature differences between a target and
its surroundings. These drone and thermal camera set-ups were not optimal for the aims of this
research, and as a result, the Parrot Bebop-Pro Thermal™ drone was tested.
After multiple test flights, it became apparent that the Parrot Bebop-Pro Thermal™ drone
was a more practical drone set-up for the purposes of this research. This drone was easier to
maneuver as it was capable of maintaining its position even with wind disturbance. This drone
was flown in winds recorded up to 3.5 meters per second (mps). It did not wander or crash
during these test flights, which provided confidence in the drone’s ability to remain stable while
being utilized in various conditions during research.
A beneficial feature of this set-up proved to be the integration of the drone, camera and
mobile application systems prior to purchasing. Unlike the previous drone set-ups, the Parrot
Bebop-Pro Thermal™ drone did not require manipulation to integrate the drone and thermal
camera or additional drone parts to provide an FPV set-up. These technologies were
manufactured to be compatible, which resulted in the transmission of greater quality imaging and
flight information. The image and video transmitted from the thermal camera to the mobile
application during flight was of sufficient detail to detect objects within the field of view and to

76
visualize temperature differences between an object and its surroundings. The flight information
was also clearly displayed along the top of the mobile application, making it easier to maneuver
the drone to a desired height. This pre-integrated system benefited this research as it reduced the
number of technological disadvantages that needed to be overcome and provided more detailed
imaging and information that was key for data analysis.
Test flights also provided the opportunity to explore the features of the FreeFlight
Thermal™ mobile application (Figure 4:1). During flight, FreeFlight Thermal™ displays flight
information and imaging in real time, captures and stores images and videos, and provides the
ability to switch between cameras at any time. This mobile application can also be utilized to
monitor battery levels of the drone and Skycontroller™ 2, adjust drone speed, and change the
thermal color palette for optimal visualization while in flight.

77
Despite the beneficial features of the Parrot Bebop-Pro Thermal™ drone, there were
some complications encountered throughout the course of this research. The first complication
was finding a tablet compatible with the FreeFlight Thermal mobile application. Parrot
advertised that FreeFlight Thermal™ could be downloaded on an Android™ tablet. However,
two Android™ tablets were purchased prior to the Samsung Galaxy Tab® A Tablet that were not
compatible with this application. A lot of time and money was spent trying to find a compatible
tablet, which impacted the timeline of this research as the drone could not be utilized until the
FreeFlight Thermal™ mobile application could be downloaded.
Figure 4:1 - FreeFlight Thermal™ mobile application features

78
Additional problems occurred with the functioning of the mobile application throughout
this research. In one of the first experiments where the drone was used, the images captured by
the thermal camera could not be viewed with the thermal color palette after flight. Only visual
images could be viewed despite having captured images in the thermal setting. After contacting
Parrot customer support and downloading an update for FreeFlight Thermal™, this problem was
fixed, and the thermal images could be viewed. A common occurrence also included the mobile
application crashing when trying to view and analyze images. After some time, the mobile
application would again function properly, but this malfunction inhibited the ability to analyze
experimental images in a timely manner.
Major complications occurred in August 2018 (Figure 4:2 a) and March 2019
(Figure 4:2 b-c) when the drone crashed during experiments. In August 2018, the drone was
being flown at approximately five meters when it suddenly fell to the ground. Damage did occur
to the drone as the platform attaching the thermal camera came loose. After filing a report with
Parrot© and sending the drone in for evaluation, it was determined that the GPS associated with
the drone malfunctioned and caused the crash. The drone was replaced by Parrot©, but it took
about two months for a new drone to be received, which delayed further research from taking
place. In March 2019, the drone was flying at 48 meters when it also fell to the ground, causing
the thermal camera to detach and the battery to shatter. The thermal camera could not be re-
attached because the plastic holding the camera in place broke. According to flight logs, the
drone crashed due to a battery failure. This second crash concluded this research as the drone
could no longer be flown. In discussing the second crash with Parrot©, it was discovered that the
Parrot Bebop-Pro Thermal™ drone is no longer manufactured and therefore could not be
replaced by the company.

79
a) b)
c)
Figure 4:2 - a-c - Damage to the Parrot Bebop-Pro Thermal™ drone, a) drone damage after crash in August 2018, b) battery damage after crash in March 2019, c) drone damage
after crash in March 2019 (Photographs by Megan Descalzi)

80
4.2 Egg Weight
Prior to generating different sized maggot masses, egg rafts were weighed and counted to
determine the weight of an individual egg/larva for the species maintained in colony. The
average weight of an individual egg was calculated for L. sericata and P. regina flies based on
the egg rafts weighed and counted from each species (Table 4:1). The average individual larva
weight for S. bullata flies, a larviparous species, was also calculated from the groups of larvae
weighed and counted (Table 4:1).
Table 4:1 - Summary of weights and counts recorded in calculating the average egg weight
for Phormia regina and Lucilia sericata and the average larva weight for Sarcophaga bullata
Species Weight of egg raft (g)
Number of eggs in raft
Individual Egg weight (g)
Average egg weight (g)
Phormia regina
0.030 326 0.00009202
0.00009093
0.014 130 0.00001077 0.013 158 0.00008228 0.015 157 0.00009554 0.051 631 0.00008082 0.012 143 0.00008392 0.008 108 0.00007407 0.013 117 0.00001111
Lucilia sericata
0.012 152 78.95
0.00010858 0.013 117 111.11 0.008 106 75.47 0.005 58 86.21 0.013 68 191.18
Sarcophaga
bullata*
0.114 66 1727.27 0.00167256 0.349 213 1638.50
0.261 158 1651.90
*Larviparous species.
81
There was no difference between the average egg weight of L. sericata and P. regina flies
(Figure 4:3 a). However, there was a difference between the weight of the larviparous and
oviparous offspring, with the average larva weight of S. bullata flies being greater than the
average egg weights of L. sericata and P. regina flies (Figure 4:3 b). Even though the same
amount of time had elapsed between the placement of blood feeds within colonies and the
removal of eggs and larvae from blood feeds for all species in colony, the average larva weight
of S. bullata was more than ten times the weight of the L. sericata and P. regina eggs.

82
a)
b)
Figure 4:3 - a-b - Differences in means of egg/larva weight by species, a) oviparous Diptera species (ANOVA, F (1,11) = 1.00, p = 0.338, s.e.d. = standard error of differences),
b) oviparous and larviparous Diptera species (ANOVA, F (1.14) = 5268.62, p = <0.001, s.e.d. = standard error of differences)

83
Since the nine P. regina egg rafts that were weighed and counted originated from four
cages, it was necessary to determine if the individual egg weight for P. regina varied between
cages. In comparing the mean individual egg weight for P. regina, there was no difference in the
calculated egg weights by cage (Figure 4:4). The five L. sericata egg rafts and the three S.
bullata groups of larvae that were weighed and counted originated from only one colony for each
species.
Figure 4:4 - Differences in means of egg weight by Phormia regina cage (ANOVA, F (3,4) =
0.57, p = 0.662, s.e.d. = standard error of differences)
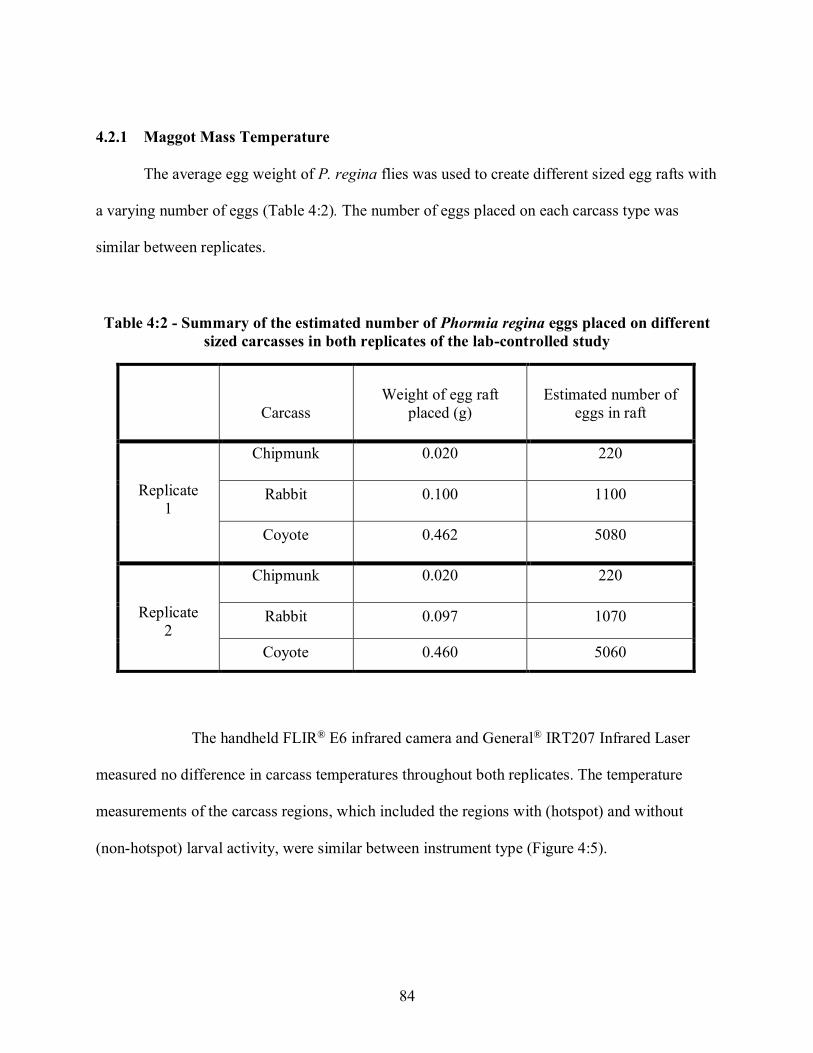
84
4.2.1 Maggot Mass Temperature
The average egg weight of P. regina flies was used to create different sized egg rafts with
a varying number of eggs (Table 4:2). The number of eggs placed on each carcass type was
similar between replicates.
Table 4:2 - Summary of the estimated number of Phormia regina eggs placed on different sized carcasses in both replicates of the lab-controlled study
Carcass
Weight of egg raft
placed (g)
Estimated number of
eggs in raft
Replicate 1
Chipmunk
0.020
220
Rabbit
0.100 1100
Coyote
0.462 5080
Replicate 2
Chipmunk
0.020 220
Rabbit 0.097 1070
Coyote 0.460 5060
The handheld FLIR® E6 infrared camera and General® IRT207 Infrared Laser
measured no difference in carcass temperatures throughout both replicates. The temperature
measurements of the carcass regions, which included the regions with (hotspot) and without
(non-hotspot) larval activity, were similar between instrument type (Figure 4:5).

85
There was a difference in the temperature measurements of the hotspot and non-hotspot
regions (Figure 4:5). This difference was expected as the hotspot regions are emitting more heat
than the non-hotspot regions due to larval aggregation activity. The statistical interaction
between the instruments and the carcass regions was significant (Figure 4:5). However, this
interaction was an anomaly as the handheld FLIR and the infrared laser did not influence each
other’s temperature measurements of the carcass regions.
Figure 4:5 - Differences in means of carcass temperatures by instrument (ANOVA, F Inst (1,173) = 0.004, p = 0.851; F Sub (1,173) = 52.91, p <0.001; F Int (1,173) = 4.17, p = 0.043,
s.e.d= standard error of differences)

86
The greatest temperature recorded by the handheld FLIR of the chipmunk carcass was
2.3°C above ambient temperature on Day Five of Replicate One (Figure 4:6 a-b) and 1.8°C
above ambient temperature on Day Eight of Replicate Two (Figure 4:6 c-d). Maggot masses did
not form at any point throughout the decomposition process. In Replicate Two, the maggots were
wandering from the chipmunk carcass on Day Eight when the greatest temperature difference
was recorded. These differences in temperature between the chipmunk carcasses and the ambient
temperature were independent of larval aggregations.
a) b)
c) d) Figure 4:6 - a-d - Chipmunk carcasses (Tamias striatus) on the days when the greatest temperature differences between the carcass and ambient temperature were recorded,
a) thermal image of carcass on Day Five for Replicate One, b) real image of carcass on Day Five for Replicate One, c) thermal image of carcass on Day Eight for Replicate Two, d) real
image of carcass on Day Eight for Replicate Two

87
a) b)
c) d) Figure 4:7 - a-d - Rabbit carcasses (Sylvilagus floridanus) on the days when the greatest temperature differences between the carcass and ambient temperature were recorded,
a) thermal image of carcass on Day Four for Replicate One, b) real image of carcass on Day Four for Replicate One, c) thermal image of carcass on Day Three for Replicate Two,
d) real image of carcass on Day Three of Replicate Two
The greatest temperature recorded from the rabbit carcass was 5.5°C above ambient
temperature on Day Four for Replicate One (Figure 4:7 a-b) and 8.6°C above ambient
temperature on Day Three for Replicate Two (Figure 4:7 c-d). The greatest temperature recorded
from the coyote carcass was 15.1°C above ambient temperature on Day Five for Replicate One
(Figure 4:8 a-b) and 10.6°C above ambient temperature on Day Four for Replicate Two (Figure
4:8 c-d). Maggot masses were visible on both of the rabbit and coyote carcasses in the regions
where this temperature difference was recorded.

88
a) b)
c) d) Figure 4:8 - a-d - Coyote carcasses (Canis latrans) on the days when the greatest
temperature differences between the carcass and ambient temperature were recorded, a) thermal image of carcass on Day Five for Replicate One, b) real image of carcass on Day
Four for Replicate One, c) thermal image of carcass on Day Eight for Replicate Two, d) real image of carcass on Day Four for Replicate Two
There was a difference in the amount of heat generated by the larvae on the chipmunk
(200 eggs) carcasses compared to the rabbit (1000 eggs) and coyote carcasses (5000 eggs)
(Figure 4:9 a). The mean difference in temperature between the hotspot regions and ambient
temperature was lower for the chipmunk carcasses than the rabbit and coyote carcasses.
However, there was no difference in the amount of heat generated by larvae between the rabbit
and coyote carcasses (Figure 4:9 b). The larvae on both of these carcasses produced similar
amounts of heat despite the different egg raft sizes initially placed on the carcasses.

89
a)
b)
Figure 4:9 - a-b - Differences in means of temperature between the handheld FLIR recordings of developing maggot masses and ambient temperature a) egg raft size placed on each carcass (ANOVA, F (2,57) =6.02, p = 0.004, s.e.d. = standard error of differences),
b) egg raft size placed on the rabbit (Sylvilagus floridanus) and coyote (Canis latrans) carcasses (ANOVA, F (1,38) =0.46, p = 0.503, s.e.d. = standard error of differences)
90
4.3 Hot Water Analog The drone and handheld FLIR measured the temperature of the hot water baths and the
surrounding substrates from various heights. There was no difference in temperature between
these two FLIR instruments for each substrate, even when the height between the instruments
varied (Figure 4:10).
There was a difference in each substrate’s temperature (Figure 4:10). However, this
difference was expected due to the varying emissivities of the substrates and the ambient
conditions at the time of each replicate.
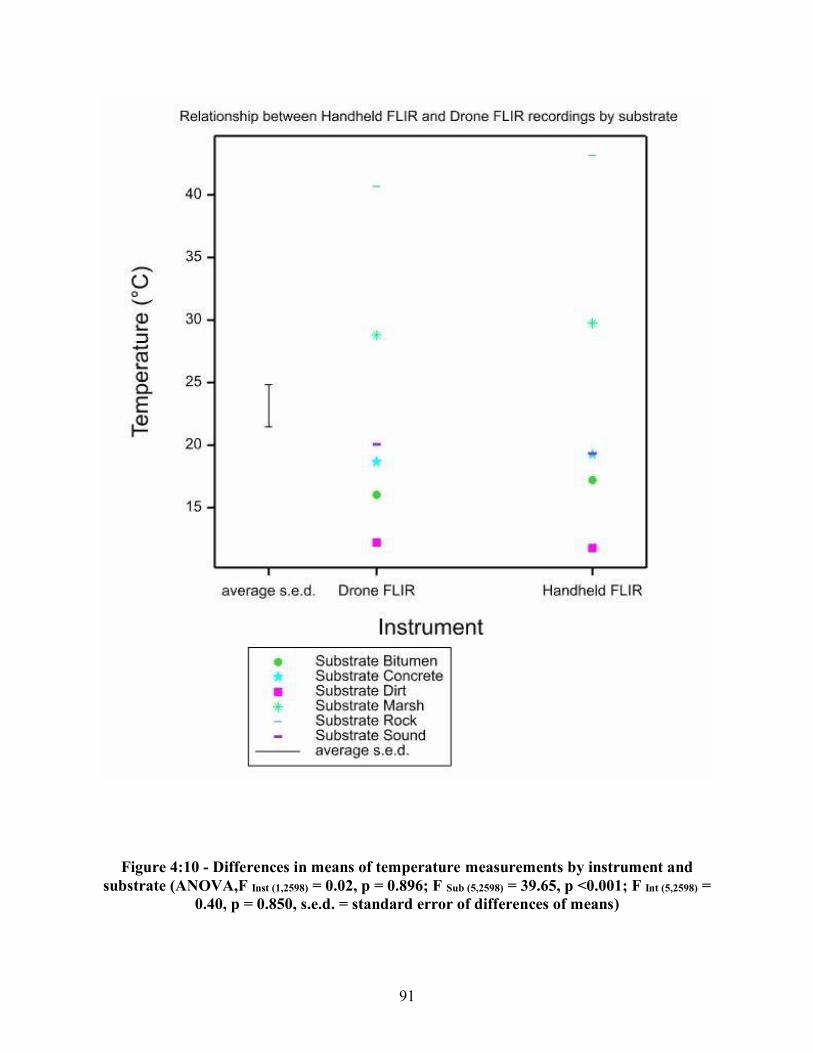
91
Figure 4:10 - Differences in means of temperature measurements by instrument and substrate (ANOVA,F Inst (1,2598) = 0.02, p = 0.896; F Sub (5,2598) = 39.65, p <0.001; F Int (5,2598) =
0.40, p = 0.850, s.e.d. = standard error of differences of means)

92
There was also no difference in the temperature of the hot water bath between the
handheld and the drone FLIR at two meters (Figure 4:11).
Figure 4:11 - Differences in means of hot water bath temperatures at two meters by
instrument (ANOVA, F (1,48) = 0.23, p = 0.631, s.e.d. = standard error of differences of means)

93
Visual observations were made to assess the capability of detecting differences in the hot
water bath at differing heights. It was difficult to visualize the thermal signature of the hot water
bath as height increased (Figure 4:12 a-d). When the drone reached 50 meters, hot water bath
was nearly undetectable (Figure 4:12d).
Both FLIR instruments measured the temperature of the hot water bath and the
temperature of the substrates at varying heights similarly, therefore the relationship between
height and the difference in temperature could be determined. The difference in temperature was
calculated by subtracting the handheld FLIR temperature from the drone FLIR temperature at
various heights for both the hot water bath and the substrates among all of the replicates
completed.
There was a negative relationship between drone height and temperature for the hot water
bath (Figure 4:13 b) (Table 4:3 b). As the height of the drone increased, the temperature of the
hot water bath measured by the drone FLIR decreased. However, there was no relationship
between drone height and substrate temperature (Figure 4:13 b) (Table 4:3 b).
After analysis of the data, it was determined that there were two sets of outliers that were
then removed when analyzing the relationship between drone height and the difference in
temperature. These outliers displayed an increase in the hot water bath temperature with an
increase in drone height (Figure 4:13 a) (Table 4:3 a). Removing these outliers from the data set
did not affect the overall negative relationship between drone height and the temperature of the
hot water bath by the drone FLIR (Figure 4:13 a-b) (Table 4:3 a-b).

94
a) b)
c) d) Figure 4:12 - a-d - Small hot water bath (indicated by red circles) at varying drone heights,
a) real image at 5 meters, b) thermal image at 5 meters, c) thermal image at 25 meters, d) thermal image at 50 meters

95
a)
b) Figure 4:13 - a-b - Relationship between drone height and difference in temperature of the
handheld FLIR and drone FLIR readings by hot water baths (hot spot) and substrate (backgrounds), a) with outliers (R2 = 0.55, p = <0.001, overall with no consideration of
groups), b) without outliers [Green nablas above 0°C] (R2 = 0.61, p = <0.00, overall with no consideration of groups)

96
Table 4:3 - a-b - Analyses of drone height on the difference in temperature between the handheld FLIR and drone FLIR recordings by hot water baths and substrates a) with
outliers, b) without outliers (s.e. = standard error)
a) Parameter s.e. t(1716) p value Constant 0.172 -2.11 0.035 Height (m) 0.006 0.24 0.814 Grouping 0.329 -1.14 0.254
b) Parameter s.e. t(1716) p value Constant 0.167 -2.73 0.0006 Height (m) 0.00572 0.62 0.538 Grouping 0.318 -3.60 <0.001
4.3.1 Hot Spot Size
The strength of the thermal signatures varied between the small and large hot water baths,
even when both hot water baths were set at the same temperature and viewed at the same height.
For example, the thermal signature of the 50-gallon hot water bath (Figure 4:14 b) was more
readily detected than the 5-gallon hot water bath (Figure 4:14 a) at 15 meters. The larger hot
water bath was red, indicating a warmer temperature, which was distinguishable from the
surrounding environment. However, the smaller hot water bath was green, indicating a lower
temperature, which made it more difficult to differentiate between the hot water bath and the
surroundings.

97
a) b)
Figure 4:14 - a-b - Visual effects of drone height on the thermal signature of the hot spot for the 5 gallon and 50 gallon hot water bath containers, a) thermal image of 5 gallon hot
water bath at 15 meters, b) thermal image of 50 gallon hot water bath at 15 meters
There was a negative relationship between drone height and the difference in temperature
for both the large and small hot water baths (Figure 4:15 b). With increasing drone height, the
temperature measured of both hot water bath sizes by the drone FLIR decreased. However, the
temperature measurement of the large hot water bath was warmer than the small hot water bath
at each height (Figure 4:15 b). The two sets of outliers as removed in Figure 4:13, which
displayed a positive relationship between drone height and temperature, were removed from this
analysis. Removing these outliers did not affect the negative relationship between drone height
and temperature for the small and large hot water bath but did eliminate the ability to
differentiate between the two (Figure 4:15 a-b) (Table 4:4 a-b).
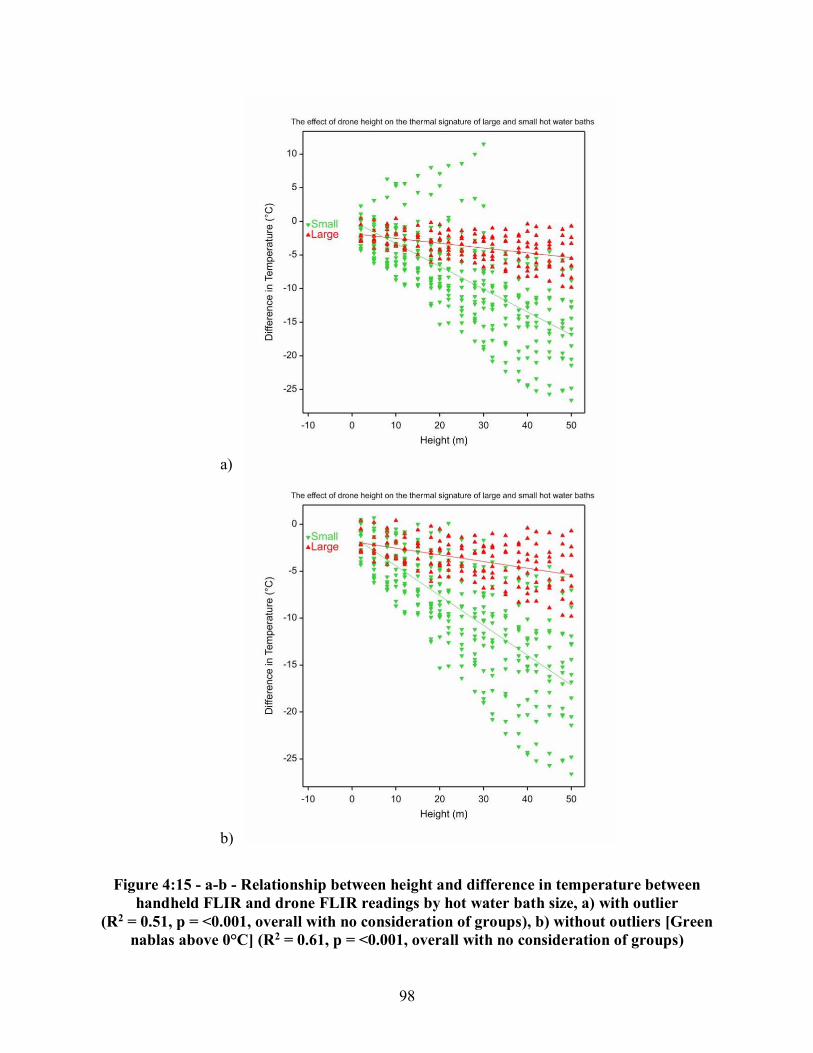
98
a)
b)
Figure 4:15 - a-b - Relationship between height and difference in temperature between handheld FLIR and drone FLIR readings by hot water bath size, a) with outlier
(R2 = 0.51, p = <0.001, overall with no consideration of groups), b) without outliers [Green nablas above 0°C] (R2 = 0.61, p = <0.001, overall with no consideration of groups)

99
Table 4:4 - a-b - Analyses of drone height on the difference in temperature between handheld FLIR and drone FLIR recordings by hot water bath size a) with outliers,
b) without outliers (s.e. = standard error)
a) Parameter s.e. t(1716) p value Constant 0.726 -2.52 0.012 Height 0.0242 -2.94 0.003 Grouping 0.873 2.18 0.029
b) Parameter s.e. t(1716) p value Constant 0.600 -3.05 0.002 Height 0.0200 -3.56 <0.001 Grouping 0.732 0.80 0.425
4.3.2 Wind Effect
Wind had a visual effect on the thermal signature of the hot water bath in the thermal
images captured by the drone FLIR. When there was no wind, infrared waves emitted from the
hot water bath traveled upward. As a result, the thermal signature of the hot water bath was
detected by the drone FLIR at the actual location of the container (Figure 4:16 a). However,
when there was wind, the infrared waves were blown downwind, resulting in a displacement of
the hot water bath’s thermal signature from the location of the container (Figure 4:16 b).
Displacement was observed at wind speeds as low as 1.0 mps. Wind affected the accurate
detection of the hot water bath’s location and indicated a hot spot where there was none (Figure
4:17 a-b).
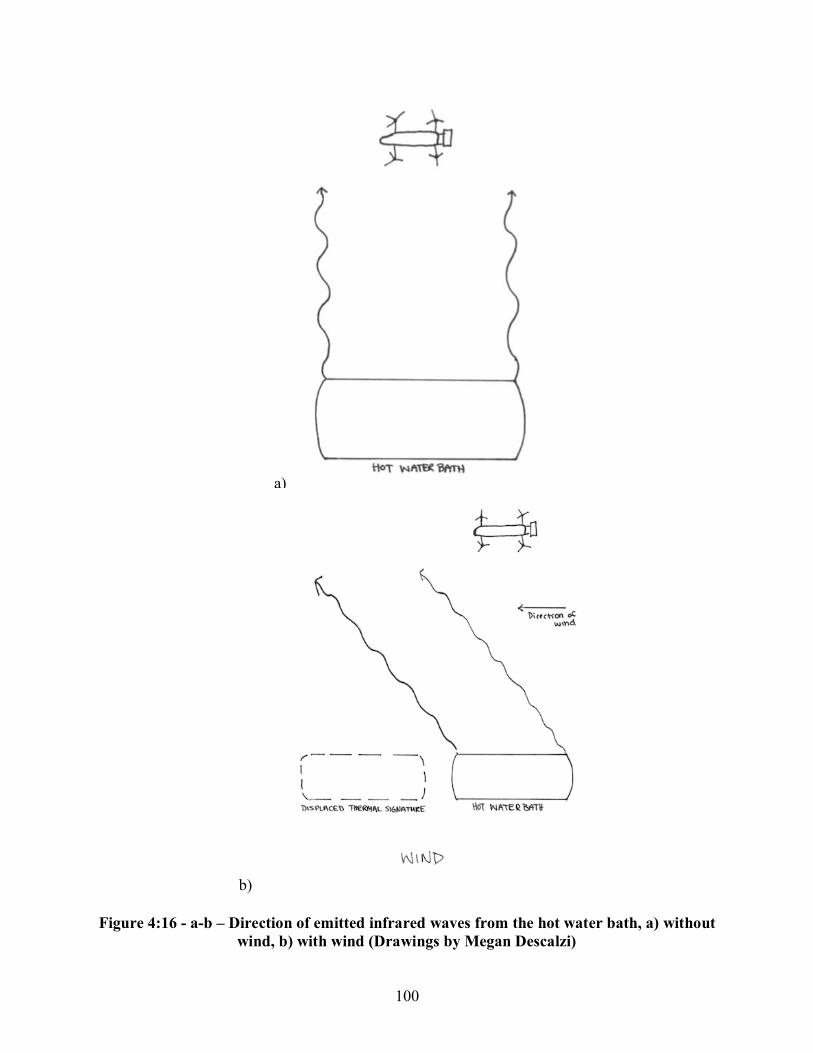
100
a)
b) Figure 4:16 - a-b – Direction of emitted infrared waves from the hot water bath, a) without
wind, b) with wind (Drawings by Megan Descalzi)

101
a)
b)
Figure 4:17 - a-b - Visual effects of wind on the thermal signature of the hot water bath (indicated by red circle), a) real image depicting the location of the hot water bath,
b) thermal image depicting the thermal signature of the hot water bath

102
The relationship between wind speed and the difference in temperature for the hot water
bath was analyzed, in order to determine if wind speed affected the temperature measurement of
the hot water bath by the drone FLIR. The difference in temperature was calculated by
subtracting the drone FLIR temperature of the hot water bath at each height from the probe
thermometer temperature. The probe thermometer was placed within the hot water bath and was
considered to be the actual temperature of the water.
The positive relationship showed that as wind speed increased, so did the difference in
temperature between the probe thermometer and drone FLIR of the hot water bath (Figure 4:18).
However, wind speed only accounted for 2% (R2 = 0.02) of this difference in temperature
(Figure 4:18).

103
Figure 4:18 - Relationship between windspeed and the difference in temperature between
probe and drone FLIR recordings of the hot water baths (R2 = 0.02, p = 0.002)
The relationship between wind speed and temperature was compared to the relationship
between height and temperature. As the height increased, the difference in temperature also
increased between the probe thermometer and the drone FLIR (Figure 4:19). The relationship
with height accounted for 33% (R2 = 0.33) of the difference in temperature (Figure 4:19).
Therefore, while both wind speed and height affect the measurement of the hot water bath,
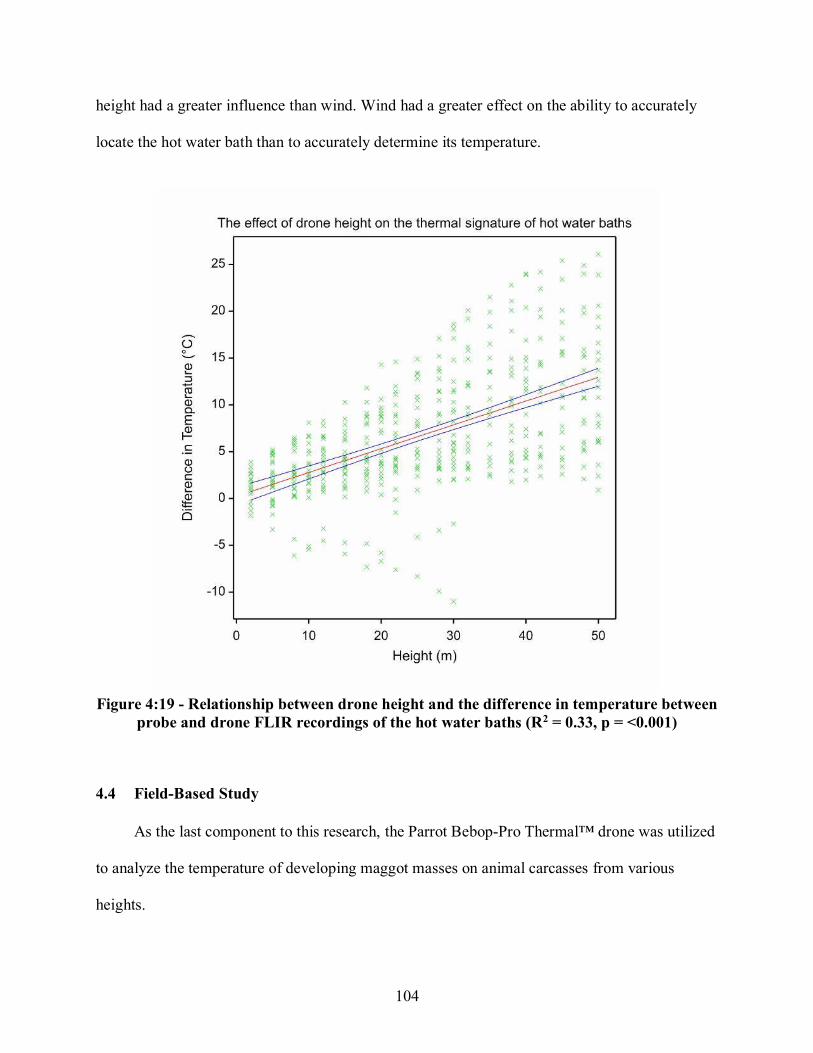
104
height had a greater influence than wind. Wind had a greater effect on the ability to accurately
locate the hot water bath than to accurately determine its temperature.
Figure 4:19 - Relationship between drone height and the difference in temperature between
probe and drone FLIR recordings of the hot water baths (R2 = 0.33, p = <0.001)
4.4 Field-Based Study
As the last component to this research, the Parrot Bebop-Pro Thermal™ drone was utilized
to analyze the temperature of developing maggot masses on animal carcasses from various
heights.

105
4.4.1 Coyote (Canis latrans) Carcass
A coyote (Canis latrans) carcass was placed outside on an area of wood chips at the
University of New Haven’s Orange Campus in August 2018 and was monitored daily for the
presence of insect activity.
4.4.1.1 Decomposition and Insect Activity
Within minutes of placement (Day Zero) (Figure 4:20 a), Diptera (true flies) and
Hymenoptera (honey bees) were observed on the carcass. On Day One (Figure 4:20 b), there was
no change in the gross appearance of the carcass and similar insect activity was observed,
including Diptera and Hymenoptera with the inclusion of Araneae (spiders). There was also
some larval activity present within the mouth of the coyote. The handheld FLIR temperature of
the carcass on Day Zero and Day One was approximately 27°C, similar to that of the
surrounding wood chips (~ 26°C) and ambient temperature (~ 24°C).
a) b)
Figure 4:20 - a-b - Coyote (Canis latrans) carcass, a) Day Zero, b) Day One

106
On Day Two (Figure 4:21), sloughing of the fur began to occur, exposing the skin on the
coyote’s legs. In addition to the continued presence of Diptera and Hymenoptera, there were
large amounts of larvae observed on the carcass, concentrated near the legs. The handheld FLIR
temperature of the carcass on Day Two was approximately 10°C above ambient temperature and
the temperature of the surrounding wood chips.
Figure 4:21 - Coyote (Canis latrans) carcass on Day Two (yellow arrow indicates area of sloughing)
On Day Three (Figure 4:22 a) and Day Four (Figure 4:22 b), the coyote was mostly
skeletonized (approximately 90% soft tissue loss) and was covered with large maggot masses.
Additional insect activity on Day Three included Diptera, Coleoptera (beetles) and Lepidoptera
(butterflies). The handheld FLIR temperature of the carcass on Day Three was about 18°C above
ambient temperature, while on Day Four it had decreased to about 5°C above ambient
temperature. Larvae began to wander from the carcass on Day Four, which could have resulted
in this decrease in temperature. On the final day of this replicate, Day Five (Figure 4:22 c), the
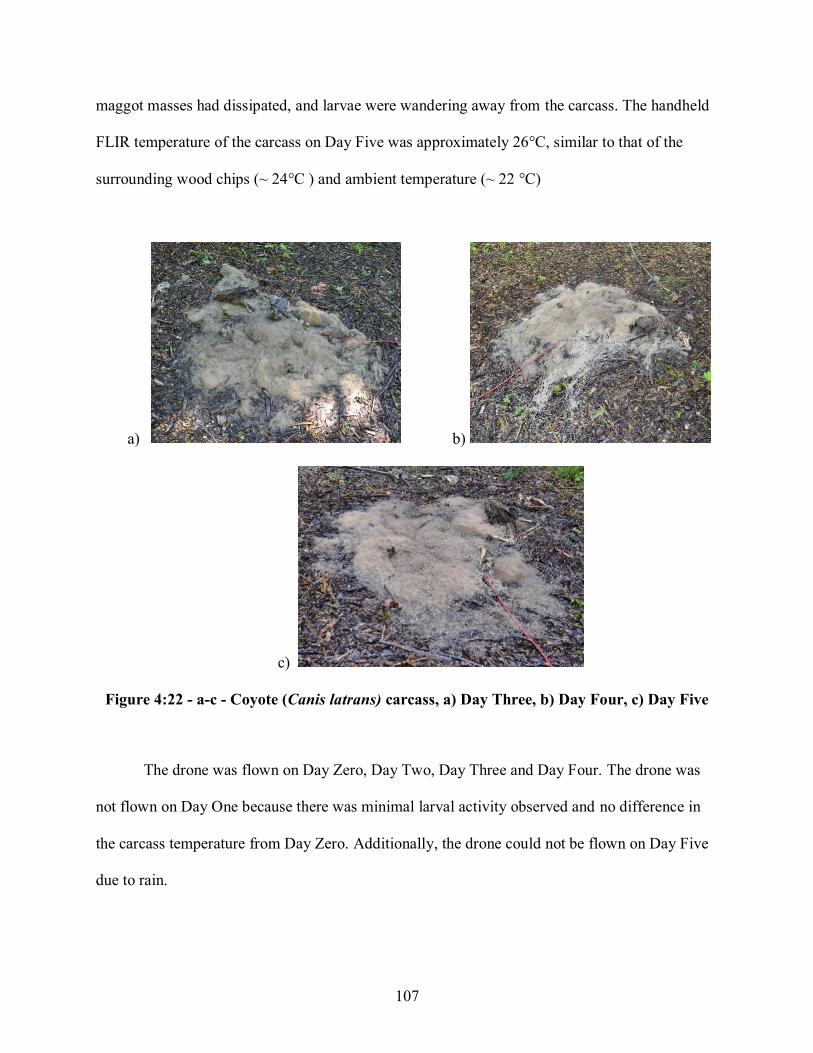
107
maggot masses had dissipated, and larvae were wandering away from the carcass. The handheld
FLIR temperature of the carcass on Day Five was approximately 26°C, similar to that of the
surrounding wood chips (~ 24°C ) and ambient temperature (~ 22 °C)
a) b)
c)
Figure 4:22 - a-c - Coyote (Canis latrans) carcass, a) Day Three, b) Day Four, c) Day Five
The drone was flown on Day Zero, Day Two, Day Three and Day Four. The drone was
not flown on Day One because there was minimal larval activity observed and no difference in
the carcass temperature from Day Zero. Additionally, the drone could not be flown on Day Five
due to rain.

108
4.4.1.2 Drone Detection
On Day Zero, the carcass could not be differentiated from the surrounding wood chips and
trees due to the similarity in temperature and color (Figure 4:23 a-b). The carcass and trees were
blue, and the surrounding wood chips were turquoise.
a) b)
Figure 4:23 - a-b - Coyote (Canis latrans) carcass (indicated by the red circle) on Day Zero in August 2018, a) real image at 25 meters, b) thermal image at 25 meters
By Day Two, the carcass could be differentiated from the surrounding environment at a
height of 25 meters. The carcass was red, indicating a warmer temperature, while the
surrounding trees and wood chips were blue, indicating a cooler temperature (Figure 4:24 b).
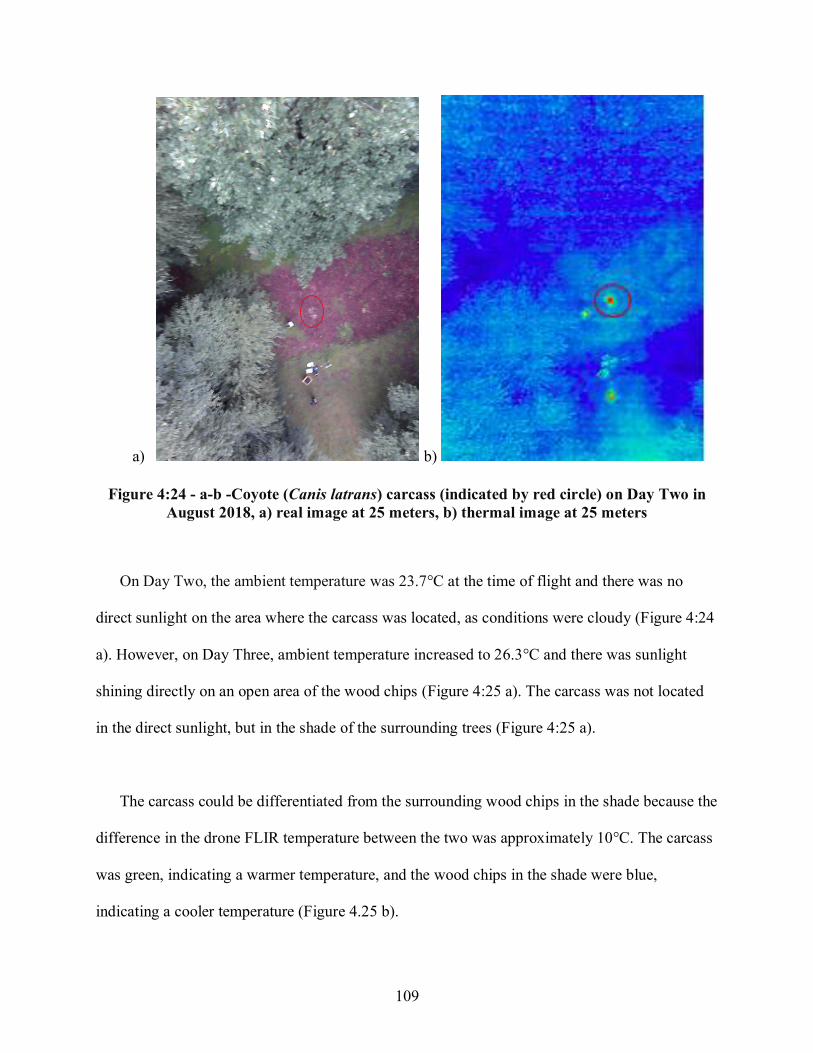
109
a) b)
Figure 4:24 - a-b -Coyote (Canis latrans) carcass (indicated by red circle) on Day Two in August 2018, a) real image at 25 meters, b) thermal image at 25 meters
On Day Two, the ambient temperature was 23.7°C at the time of flight and there was no
direct sunlight on the area where the carcass was located, as conditions were cloudy (Figure 4:24
a). However, on Day Three, ambient temperature increased to 26.3°C and there was sunlight
shining directly on an open area of the wood chips (Figure 4:25 a). The carcass was not located
in the direct sunlight, but in the shade of the surrounding trees (Figure 4:25 a).
The carcass could be differentiated from the surrounding wood chips in the shade because the
difference in the drone FLIR temperature between the two was approximately 10°C. The carcass
was green, indicating a warmer temperature, and the wood chips in the shade were blue,
indicating a cooler temperature (Figure 4.25 b).

110
However, the carcass could not be differentiated from the surrounding wood chips in the
direct sunlight because the difference in the drone FLIR temperature between the two was
approximately 2.5°C. The thermal signature of the carcass and surrounding wood chips in the
direct sunlight both displayed a similar green color (Figure 4:25 b). Therefore, although the
thermal signature of the carcass was visible at a height of 25 meters, the direct sunlight on the
surrounding area made it difficult to differentiate between the carcass and the surrounding wood
chips in direct sunlight.
a) b)
Figure 4:25 - a-b - Coyote (Canis latrans) carcass (indicated by red circle) on Day Three in August 2018, a) real image at 25 meters, b) thermal image at 25 meters
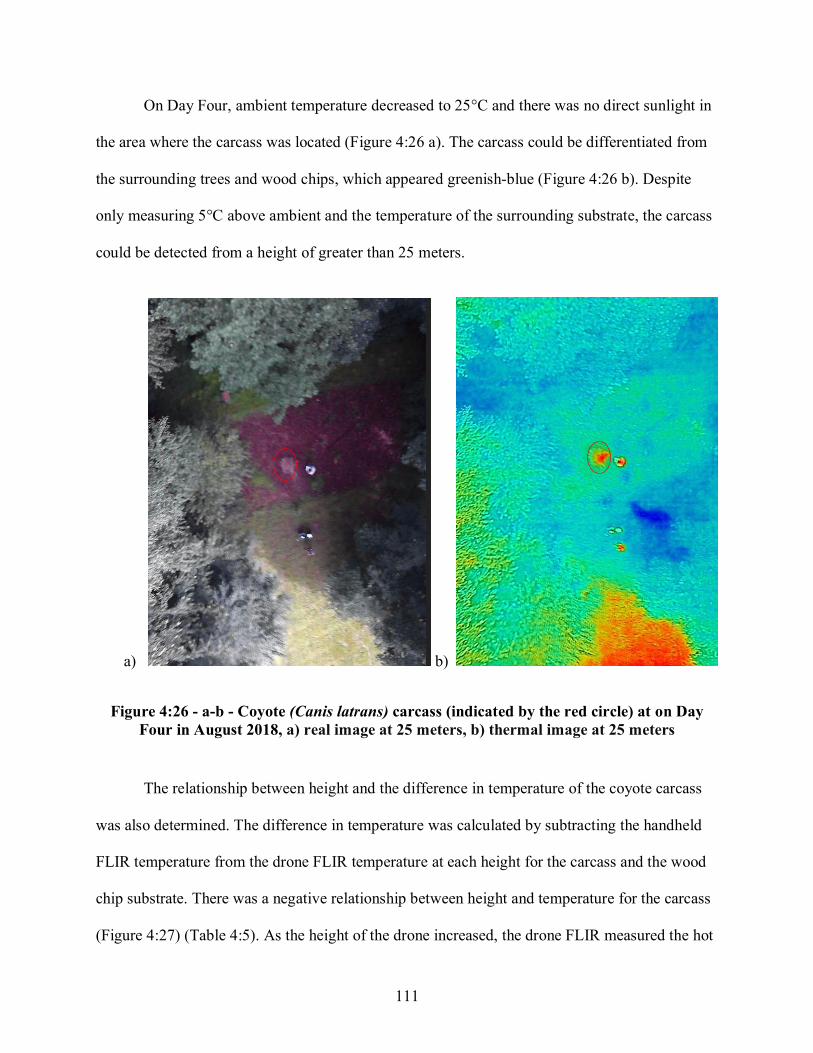
111
On Day Four, ambient temperature decreased to 25°C and there was no direct sunlight in
the area where the carcass was located (Figure 4:26 a). The carcass could be differentiated from
the surrounding trees and wood chips, which appeared greenish-blue (Figure 4:26 b). Despite
only measuring 5°C above ambient and the temperature of the surrounding substrate, the carcass
could be detected from a height of greater than 25 meters.
a) b)
Figure 4:26 - a-b - Coyote (Canis latrans) carcass (indicated by the red circle) at on Day Four in August 2018, a) real image at 25 meters, b) thermal image at 25 meters
The relationship between height and the difference in temperature of the coyote carcass
was also determined. The difference in temperature was calculated by subtracting the handheld
FLIR temperature from the drone FLIR temperature at each height for the carcass and the wood
chip substrate. There was a negative relationship between height and temperature for the carcass
(Figure 4:27) (Table 4:5). As the height of the drone increased, the drone FLIR measured the hot
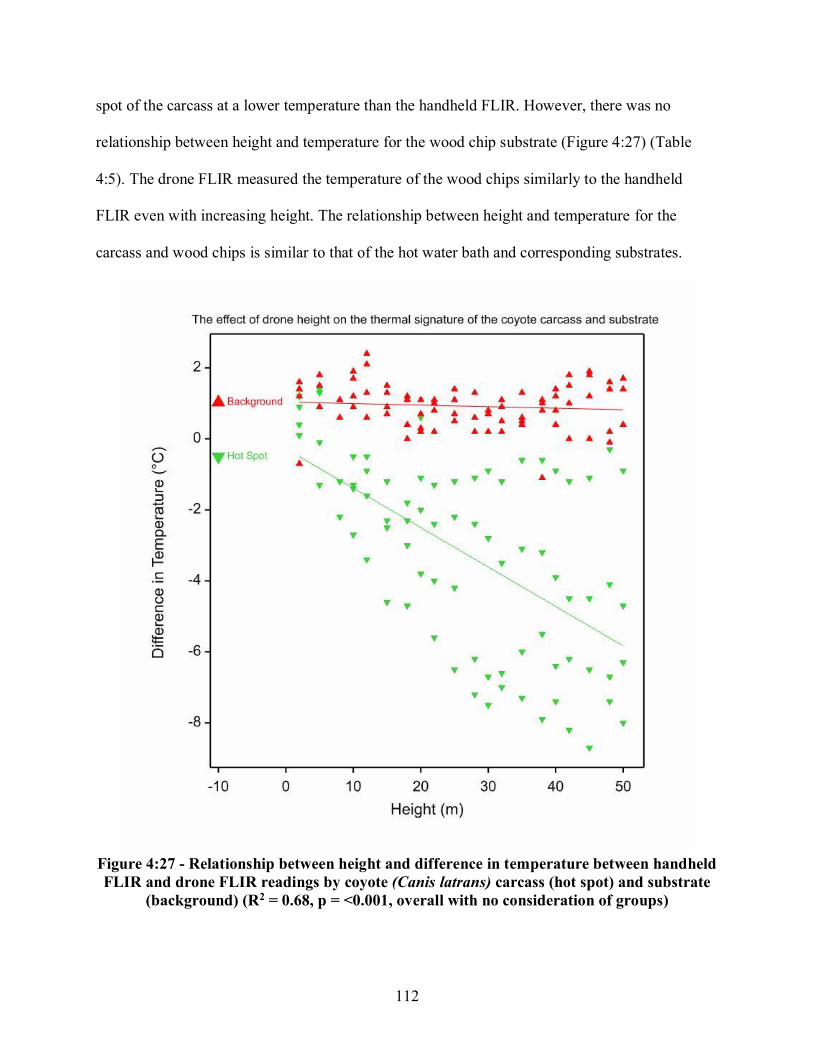
112
spot of the carcass at a lower temperature than the handheld FLIR. However, there was no
relationship between height and temperature for the wood chip substrate (Figure 4:27) (Table
4:5). The drone FLIR measured the temperature of the wood chips similarly to the handheld
FLIR even with increasing height. The relationship between height and temperature for the
carcass and wood chips is similar to that of the hot water bath and corresponding substrates.
Figure 4:27 - Relationship between height and difference in temperature between handheld FLIR and drone FLIR readings by coyote (Canis latrans) carcass (hot spot) and substrate
(background) (R2 = 0.68, p = <0.001, overall with no consideration of groups)

113
Table 4:5 - Analyses of drone height on the difference in temperature between handheld
FLIR and drone FLIR recordings by coyote (Canis latrans) carcass and background substrate (s.e. = standard error)
Parameter s.e. t(1716) p value Constant 0.390 2.66 0.009 Height 0.0129 -0.34 0.736 Grouping 0.552 -2.38 0.018
4.4.2 White-Tailed Deer Fawn (Odocoileus virginianus) Carcass
The white-tailed deer fawn (Odocoileus virginianus) carcass was placed at the same
location at the University of New Haven’s Orange Campus in November 2018 and was
monitored for 11 days. The average ambient temperature over this time period was 10°C.
Although some Diptera were seen on the carcass on Day Two and Day Six, no larvae were ever
observed. The temperature of the fawn carcass was never greater than 2.0°C above ambient
temperature or the temperature of the surrounding substrates. The experiment was ended when
the carcass was covered by more than 10 centimeters of snow on Day 11.
The drone was flown on Day Two, Day Four and Day Eight. The fawn carcass could not
be differentiated from the surrounding substrate on any of these days due to the similarity in
temperatures (Figure 4:28 a-c).

114
a)
b)
c)
Figure 4:28 - a-c - White-tailed deer fawn (Odocoileus virginianus) carcass (indicated by the red circle) in November 2018, a) Day Two, b) Day Four, c) Day Eight
115
Additional replicates could not be completed in this field-based study due to the drone
crashing in August 2018 and March 2019. The drone crashed soon after the coyote replicate was
completed in August 2018 and was not replaced until two months later. Therefore, no additional
replicates could be completed during this time period. When the replacement drone was
received, the fawn replicate was immediately placed at the experimental site, but the ambient
temperature was too low for larval aggregations to form. The ambient temperature did not
become warm enough for another replicate to be completed before the drone crashed for the
second time in March 2019.

CHAPTER 5: DISCUSSION
117
When a body reaches ambient temperature after death, remote detection of the body can
become difficult. At this point, useful search tactics include the use of cadaver dogs, search
parties and aerial imaging, all of which can be expensive and/or time consuming for law
enforcement agencies. This research presented a novel search and recovery technique by
utilizing a drone mounted with a thermal imaging camera to successfully detect larval
aggregations on a decomposing carcass.
5.1 Maggot Mass Temperatures
The lab-controlled study aimed to determine a baseline for the amount of heat generated by
larval aggregations within the Connecticut region. Different sized larval aggregations were
generated using the Phormia regina flies that were collected outside Dr. R Christopher O’Brien’s
laboratory in West Haven, Connecticut. In completing two experimental replicates, this study
confirmed previous research in that different sized larval aggregations did produce varying
amounts of heat (Slone & Gruner, 2007). Additionally, this study established that within the
laboratory alone, the temperature of larval aggregations in the Connecticut region can reach
greater than 15°C above ambient temperature. This temperature difference between larval
aggregations and ambient temperature also verifies previous research, which have reported
similar differences in temperature (Anderson & VanLaerhoven, 1996; Slone & Gruner, 2007;
Turner & Howard, 1992).
The consistency in reported larval aggregation temperatures between researchers allows
for differences in temperature to be estimated between larval aggregations and ambient
conditions during search and recovery missions (Anderson & VanLaerhoven, 1996; Slone &
Gruner, 2007; Turner & Howard, 1992). Drone operators can use previously collected

118
aggregation temperatures to determine the likelihood of detecting a larval aggregation on a
decomposing body, when also taking into consideration circumstances of the case, such as the
size of the missing individual, and the environmental conditions of the suspected area.
5.2 Factors Affecting the Capability of Detection of Larval Aggregations
The capability of detecting the hot water analogs and the carcasses using a drone mounted
with a thermal imaging camera varied depending on different factors. These factors can include
drone height, maggot mass size, wind, sunlight and ambient temperature.
5.2.1 Drone Height
This study demonstrated that the detection of the hot water baths and coyote (Canis
latrans) carcass was affected by the height of the drone. As the drone height increased, the
thermal signature of the hot water baths and carcass became masked, or overwhelmed, by the
thermal signature of the surrounding substrates (O’Brien, pers. comm., September 2018). This
thermal masking resulted in decreased temperature measurements and decreased visibility of the
hot spots by the drone FLIR. At greater heights, the thermal signature of these hot spots became
indistinguishable from its surroundings due to this masking effect. Thermal drones should
therefore be flown at the lowest height possible in order to limit the effect of thermal masking
and to optimize the detection of larval aggregations on decomposing remains during search and
recovery missions.
Due to the lack of research pertaining to optimal drone search heights, this study aimed to
determine at what heights the thermal drone was capable of detecting larval aggregations. Based

119
on the thermal images captured from this study, a drone search height greater than approximately
25 meters can subject the thermal signature to greater masking and can prevent detection of the
hot spot. While lower drone heights are optimal for greater detection of heat signatures, it may
not always be possible for drone operators to maneuver the drone at lower heights, such as if the
search area contains tall objects such as trees or buildings. Therefore, when flying the drone at
heights above 25 meters in search and recovery missions, drone operators should be aware that
decomposing remains may be located within the search region but could be undetectable due to
this thermal masking effect.
Height had a greater impact on the detection of larval aggregations when utilizing a
thermal drone than a helicopter mounted with a FLIR. In the research conducted by Lee et al.
(2018), a helicopter mounted with a FLIR successfully detected larval aggregations on
decomposing pig (Sus scrofa) carcasses at heights greater than 1000 meters. In comparison, the
thermal drone had difficulty in detecting the coyote carcass at a height of 50 meters. The
discrepancy in the capability of detection at different heights demonstrates one of the limitations
of this search technique. Although the helicopter mounted with a FLIR is more expensive and
time-consuming to utilize, this more advanced technology does have greater capabilities for
detection and, therefore, may be more successful in locating larval aggregations than a thermal
drone.
5.2.2 Maggot Mass Size
The different sized hot water baths utilized for this research demonstrated that a smaller
heat source yields greater thermal masking potential, making it more difficult to detect at each
height. The hot water baths were utilized as analogs for maggot masses, which produce specific

120
amounts of heat depending on the size of the mass and the amount of food source available
(Charabidze et al., 2011; Slone & Gruner, 2007). Therefore, the smaller the size of the remains,
the smaller the larval aggregations that can form and the more difficult it will be to detect the
remains at increasing drone height.
In search and recovery missions, the size of the missing person should be taken into
consideration in order to determine the optimal drone height for detection. For example, a child
will be more difficult to detect at a drone search height of 20 meters than that of a grown adult,
as the larval aggregation is likely to be smaller in size. This smaller aggregation will not only
emit less heat but will also be subjected to greater thermal masking effects.
5.2.3 Wind
This research demonstrated that while the ability to detect the thermal signature is not
affected by wind, the ability to detect the exact location of the hot spot can be. Even when wind
speeds were mild (1.0 mps) and did not affect the stability of the drone platform, thermal
signatures of the hot spots were displaced within the drone images by approximately a meter.
Therefore, during search and recovery missions, this wind effect may mislead the drone operator
in determining the exact location of the detected hot spot and may require additional ground
searching of the surrounding area to successfully locate the body.
In this study, the effect of wind on the location of the hot water bath’s or carcass’s hot spot
was overcome by removing the thermal filter and viewing the area as a real image. By removing
the thermal filter when wind was suspected to affect the thermal signature, the true location of
121
the heat source was identified. The limitation to this methodology is that these experiments were
not conducted blind, meaning that the true location of the heat source was known, therefore
making it easier to determine its exact location within the image. However, in search and
recovery missions, this may not be as efficient as the location of the body is not known and may
not be detectable even when removing the thermal signature.
Drone operators should therefore be aware that when wind seems to be affecting the
drone’s thermal imaging, caution should be taken in providing exact coordinates for the location
of the thermal signature. Drone operators should make personnel conducting a ground search
aware that the true location of the body may not be where the hot spot was detected, but rather in
the surrounding area.
5.2.4 Solar Radiation
This research demonstrated that on days when sunlight is shining directly on an area of
interest, a thermal drone may not be the most effective search technique for law enforcement to
utilize. The thermal signature of the larval aggregations associated with decomposing remains
will likely be overlooked by the drone operator if it is located within or near the area in direct
sunlight, as thermal equilibrium will be reached between the aggregation and the area absorbing
the solar radiation (O’Brien, pers. comm., May 2019). The larval aggregations will become
similar in temperature to the surrounding environment, therefore limiting the capability of
detection by the thermal drone.

122
Lee et. al (2018) observed similar effects on the capability of detection as sunlight
prevented the helicopter mounted FLIR from differentiating between the larval aggregations and
the areas warmed by sunlight. Based on the observations made during this research, it was
suggested that the optimal time of day for detection is pre-dawn (Lee et al., 2018). It is during
this time that the solar radiation absorbed from sunlight during the day has dissipated and the
ambient temperature is lowest, contributing to a greater temperature difference between the
larval aggregations and the surrounding substrates (Lee et al., 2018).
Therefore, based on the current and previous research, a thermal drone would be more
effective in detecting larval aggregations in the hours preceding sunrise or on days when direct
sunlight is minimal (i.e. cloudy conditions).
5.2.5 Ambient Temperature
The lack of fly colonization on the white-tailed deer fawn (Odocoileus virginianus) carcass
in November 2018 displayed the limitation of using this search technique in temperate regions
experiencing seasonal changes in temperature. The survival of Diptera is strongly influenced by
temperature, and as ambient temperature becomes low, survival decreases (Rivers & Dahlem,
2014; Voss et al., 2014). Minimum developmental temperatures for forensically significant fly
species have been reported between 10°C and 15°C (Byrd & Allen, 2001; Nabity, Higley, &
Heng-Moss, 2006). Any temperature below the minimum developmental temperature will
negatively affect the growth and survival of fly species, limiting the success of this search
technique.

123
Throughout the time the fawn carcass was placed at the experimental site, the average
ambient temperature was approximately 10°C, which was too low for larvae to survive.
Therefore, a thermal drone would not be successful in detecting decomposing remains below
ambient temperatures of at least 10°C in the Connecticut region, as no larval aggregations will
form, and the body will be indistinguishable from the surrounding substrates. This search
technique could only be utilized by law enforcement for search and recovery missions when
ambient conditions were optimal for Diptera growth and development.
The low temperatures (~ 10°C) that occurred in November 2018 prevented Diptera growth
and development entirely. However, when temperatures are low but above the minimum
developmental temperature, larval development does occur, just at a slower rate. The research
conducted by Lee et al. (2018) demonstrated that lower temperatures can actually benefit the use
of this search technique in missing person cases. During the winter trial, the lower ambient
temperatures (average of 19.3°C during the day and 4.9°C at night) resulted in a longer duration
of larval aggregation activity and therefore an increase in the time window for detection by the
helicopter FLIR (Lee et al., 2018). Lower temperatures can provide law enforcement with a
greater timeframe in which they can utilize this search technique to locate larval aggregations on
decomposing remains.
The capability of detection can also be affected if ambient temperature becomes too warm,
as was reported in the research by Lee et al. (2018). High temperatures during the autumn trial
(average of 33.4°C during the day and 13.1°C at night) led to larval death on the pig carcasses,
which resulted in decreased visibility by the helicopter FLIR. In this current research, ambient

124
temperatures did not become high enough for larval death to occur, and therefore did not affect
the capability of detection within the Connecticut region.
The current and previous research demonstrates that the implementation of this search
technique can vary between geographic regions due to the varying climatic conditions, such as
ambient temperature, that affected the capability of detection. These two regions experienced
opposite extremes in temperature which affected the capability of detection. In this current study,
ambient temperature in Connecticut became too low for larval aggregations to form, while in the
previous research conducted by Lee et al. (2018) in Western Australia, ambient conditions
became too high for larvae to survive. Therefore, in order to successfully implement this search
technique into search and recovery missions, drone operators need to become aware of the
temperature thresholds of Diptera species, which will require collaboration with entomologists
that have developmental data of forensically significant species within each region
5.3 Operator ability
In completing this research, it became apparent that successful detection of larval
aggregations will ultimately be dependent on the ability of the drone operator. Lee et al. (2018)
came to the same conclusion when the success of locating the pig carcasses was limited by the
ability of the FLIR operator to calibrate the instrument. When the helicopter FLIR was poorly
calibrated, larval aggregations associated with the pig carcasses went undetected. Lee et al.
(2018) demonstrated that the success of this search technique is dependent on the ability of the
operator to utilize the equipment properly and to optimize the technology for successful
detection. Therefore, drone operators not only need to possess the skills to maneuver the drone,

125
but also need to be aware of the factors that can affect the capability of detection, such as drone
height, maggot mass size, wind and direct sunlight.
Through multiple replicates and utilization of different drones, the primary investigator in
this research acquired the skills needed to successfully detect larval aggregations associated with
a decomposing carcass. Therefore, drone operators need to undergo training in order to enhance
their understanding of how these factors can affect detection, and to learn how search parameters
can be adjusted to optimize the success of locating larval aggregations. This research
demonstrated that hot water baths work well as an analog for larval aggregations, with the added
ability to adjust the temperature and size in order to simulate various circumstances that may be
encountered during a search mission. Thus, operators could utilize hot water baths to practice
maneuvering the drone and adjusting search parameters to enhance detection of the hot spots. It
is also important for drone operators to become aware of and keep up to date on research and
concepts related to larval aggregations and developmental thresholds of forensically significant
fly species in each region.
5.4 Applicability in Forensic Science
. Thermal drones are increasingly being used by law enforcement agencies in every day
operations, such as for surveillances and pursuits (Perritt & Spraque, 2017). This technology has
also been incorporated in search and rescue missions but has not yet been utilized in
circumstances when a missing individual is believed to be deceased.

126
In missing persons cases, law enforcement can search a suspected area, which is often
remote and extensive, for an extended period of time in hope of locating a body. More often than
not, these search tactics fail to locate the missing individual. For example, in the case of Mollie
Tibbetts, who disappeared on 18 July 2018, search parties and helicopters scoured the area near
where she was living for a month after her disappearance, looking for any clues to her
whereabouts (Earl, 2018). However, Mollie Tibbetts’s body was not located until 21 August
2018, when the primary suspect in the case led police officers to the cornfield where he had
hidden her body (Earl, 2018).
The disappearance of Mollie Tibbett is an example of when a thermal drone would have
been useful for searching a large area for a body. Having disappeared in summer when ambient
temperatures are ideal for insect development, larval activity would have been prevalent on the
body soon after death. A thermal drone could have easily been deployed in an attempt to detect
the thermal signature of larval aggregations that would have been present on the body. This
technique, if successful, could have led to the discovery of the body sooner. Cases like Mollie
Tibbett’s hinder law enforcement due to the amount of time and money that is spent searching
for a body. Thus, this novel search technique provides law enforcement with an alternative
search tactic that is more cost effective, less time-consuming and easier to use.
However, while this research demonstrates that a thermal drone can detect larval
aggregations on a decomposing carcass, it also demonstrates that there are limitations to when or
how this technique can be implemented during search and recovery missions. Different factors
including drone height, maggot mass size, wind, sunlight and ambient temperature were shown

127
to limit the capability of detecting heat sources. Therefore, operators need to be trained for
detecting dynamic heat sources like larval aggregations, in order to learn how to adjust search
parameters to enhance the success of this search technique during search and recovery missions
5.4.1 Suggested Search Parameters
The following are suggested search parameters to optimize the success of using a thermal
drone to detect larval aggregations on decomposing remains:
• Prior to deployment, drone operators should gather important information to guide the
search such as:
o Size of the missing individual (i.e. child vs. adult)
o Ambient temperature and environmental conditions
o Layout of suspected area
• The thermal drone should be deployed prior to sunrise or on days when conditions are
cloudy
o The thermal drone should not be utilized when there is direct sunlight in the
suspected area as the hot spot could go undetected
• The thermal drone should be flown at the lowest height possible to increase the likelihood
of detecting a hot spot region.
o In areas where heights below 25 meters cannot be achieved, ground searches
should continue as hot spots could become indistinguishable from the surrounding
substrates due to thermal masking
o The smaller the size of the individual, the lower the height of the drone should be

128
• Light winds should be assumed to affect the displacement of the thermal signature within
the drone images.
o Drone operators can attempt to locate the exact location of the thermal signature
by removing the thermal filter and viewing the area as a real image
5.5 Limitations
The greatest limitation of this study was the technological complications encountered with
the drones and thermal cameras throughout the course of this research. A considerable amount of
time was spent attempting to integrate the FLIR Duo™ thermal imaging camera with the DJI
Phantom™ 3 Standard drone and DJI Phantom™ 2 drone, before determining that the
technologies were not viable or optimal for the aims of this research. Although the Parrot Bebop-
Pro Thermal™ drone was optimal for the aims of this research, having both an integrated
thermal imaging camera and first-person view (FPV) capability, there were complications
encountered with the drone which delayed the progress of this research. These complications
included finding a tablet that was compatible with the FreeFlight Thermal™ mobile application,
the mobile application frequently quitting and not connecting to the drone, and the drone
crashing twice due to a GPS and battery failure. These complications delayed this research for
variable amounts of time, which ultimately limited the number of hot water bath and carcass
replicates that could be completed.
An initial aim of this research was to conduct a blind experiment in which the thermal
drone would be utilized to search for a carcass in an unknown location. However, the drone
complications encountered also inhibited this blind detection experiment from being conducted.

129
The ability to replicate the field-based study was limited due to the low ambient
temperatures that occurred during the winter season in the Connecticut region. This low
temperature prevented larval aggregations from forming on the white-tailed deer fawn
(Odocoileus virginianus) that was placed outside in November 2018. When ambient temperature
remained below the developmental threshold for Diptera species, which was approximately a
five month time period, no data could be collected from the formation of larval aggregations.
Another limitation in this study was the difficulty in maintaining viable fly colonies during
the transition to the winter months between November 2018 and February 2019. Daylight from a
window in the colony room was the only source of light for the flies, and as the hours of daylight
decreased during this time period, the flies did not have enough light throughout the day and
entered diapause. Diapause prevented some of the flies in colony from laying eggs, while other
flies did lay eggs, but the eggs were not viable. By February 2019, many of the fly colonies had
died off and the stock of fly pupae needed to be replenished in order to replenish the colonies.
This difficulty severely suppressed the success of the fly colonies and prevented additional
replicates from taking place in the lab-controlled study of this research.
5.6 Further Research
In order to conduct further research, a more reliable drone and thermal camera set-up
would be needed. The Parrot Bebop-Pro Thermal™ drone is no longer manufactured and can
therefore not be utilized for any future research or by law enforcement for search and recovery
missions. Parrot© is currently manufacturing a new thermal drone, Anafi™ Thermal. However,
based on experience with the Parrot© company and their manufactured products, this new
thermal drone is not suggested as a viable option for search and recovery purposes. Additional

130
research needs to take place to determine if there are any new thermal drones being
manufactured that is still cost effective and efficient for law enforcement use.
Blind detection experiments could be conducted in order to simulate an experience
similar to that encountered by law enforcement in search and recovery missions. Carcasses
would be placed in a location unknown to the drone operator. The operator would then utilize the
drone with the thermal camera to attempt to determine the location of the carcass via the heat
signature of associated larval aggregations.
Further research could also aim to understand how the capability of detection is affected
by concealment of a carcass. In homicide cases, the perpetrator may attempt to conceal the body
in order to prevent its discovery. Attempts at concealment could include covering the body with
debris or fabric, placing the body within a bag or container, and/or placing the body in a remote,
wooded area with dense tree coverage. These circumstances could further mask the thermal
signature of the larval aggregations associated with the body, potentially limiting the success of
the drone and thermal camera in search and recovery missions. To investigate this aim, the same
experimental protocols as utilized in this research could be followed, but with the added
component of covering the hot water bath and/or carcasses.

CHAPTER 6: CONCLUSIONS

132
6.1 Conclusions The research conducted for this thesis had the following conclusions:
• The success of the drone technology to detect thermal signatures was dependent on
several factors.
o The DJI Phantom™ 3 Standard drone was unable to be used for this research as
the built-in camera was completely integrated into the flight system and could not
be replaced with the FLIR Duo® thermal camera. Additionally, the drone’s
payload limit prevented an external thermal camera from being mounted to it.
o The DJI Phantom™ 2 drone was configured to have a thermal camera with first
person view capabilities. However, due to the instability of the flight platform and
pixelated imaging, it was not found to be a viable search and recovery instrument.
o The Parrot Bebop-Pro Thermal™ drone was an initially viable flight platform as
it had a real time camera and thermal camera installed.
▪ The Parrot Bebop-Pro Thermal™ drone was eventually found to be flawed
in its design as both GPS and battery malfunctions occurred, leading to
catastrophic failures.
▪ This drone is no longer manufactured, therefore its applicability to search
and recovery personnel is irrelevant.
• The lab-controlled study established that different sized larval aggregations produce
different amounts of heat.

133
o The temperature of larval aggregations in the Connecticut region can reach
greater than 15°C above ambient temperature.
• The sensitivity of detection of hotspots decreases with increasing drone height.
o The thermal signature of the hot spot becomes masked by the thermal signature of
the surrounding environment.
o The effect of thermal masking is impacted by both the size of the hot spot and the
height of the drone.
• A drone mounted with a thermal imaging camera can be utilized to detect larval
aggregations on decomposing carcasses and could therefore be implemented by law
enforcement for search and recovery missions.
o Detection depends on the height of the drone, size of the maggot mass, ambient
conditions and operator ability.
134
References
Agbeyangi, A. O., Odiete, J. O., & Olorunlomerue, A. B. (2016). Review on UAVs used for
Aerial Surveillance. Journal of Multidisciplinary Engineering Science and Technology,
3(10), 2458–9403.
Amendt, J., Rodner, S., Schuch, C. P., Sprenger, H., Weidlich, L., & Reckel, F. (2017).
Helicopter thermal imaging for detecting insect infested cadavers. Science and Justice,
57(5), 366–372.
Anderson, G. S. (2000). Minimum and maximum development rates of some forensically
important Calliphoridae (Diptera). Journal of Forensic Sciences, 45(4), 824–832.
Anderson, G. S. (2001). Chapter 5: Insect succession on carrion and its relationship to
determining time of death. In J.H Byrd & J. Castner (Eds.), Forensic entomology: the utility
of arthropods in legal investigations (pp. 143–175). Boca Raton: CRC Press.
Anderson, G. S. (2014). Chapter 7: Forensic entomology. In S. H. James, J. J. Nordby, & S. Bell
(Eds.), Forensic science: An introduction to scientific and investigative techniques (Fourth,
pp. 171–199). Boca Raton, FL: Taylor & Francis Group.
Anderson, G. S., & VanLaerhoven, S. L. (1996). Initial observations on insect succession on
carrion in British Columbia. Journal of Forensic Sciences, 41(4), 613–621.
Arjomandi, M., Agostino, S., Mammone, M., Nelson, M., & Zhou, T. (2006). Classification of
unmanned aerial vehicles. Adelaide, Australia.
Arlington police now using drones to catch criminals. (2019). Retrieved March 29, 2019, from
http://www.fox4news.com/news/arlington-police-now-using-drones-to-catch-criminals

135
Barton Browne, L., Bartell, R. J., & Shorey, H. H. (1969). Pheromone-mediated behaviour
leading to group oviposition in the blowfly Lucilia cuprina. Journal of Insect Physiology,
15(6), 1003–1014.
Bornemissza, G. F. (1957). An analysis of arthropod succession in carrion and the effect of its
decomposition on the soil fauna. Australian Journal of Zoology, 5, 1–12.
Brewster, M. Q. (1992). Thermal radiative transfer and properties. Canada: John Wiley & Sons,
Ltd.
Byrd, J.H, & Castner, J. (2001). Chapter 2: Insects of forensic importance. In J. Castner & J.
Byrd (Eds.), Forensic entomology: the utility of arthropods in legal investigations (pp. 43–
75). Boca Raton.
Byrd, Jason H., & Allen, J. C. (2001). The development of the black blow fly, Phormia regina
(Meigen). Forensic Science International, 120(1–2), 79–88.
Campobasso, C. Pietro, Di Vella, G., & Introna, F. (2001). Factors affecting decomposition and
Diptera colonization. Forensic Science International, 120(1–2), 18–27.
Catts, E. P., & Goff, M. L. (1992). Forensic Entomology in Criminal Investigations. Annu. Rev.
Entomol., 37, 253–272.
Charabidze, D., Bourel, B., & Gosset, D. (2011). Larval-mass effect: Characterisation of heat
emission by necrophageous blowflies (Diptera: Calliphoridae) larval aggregates. Forensic
Science International, 211(1–3), 61–66.
Cheng, E. (2016). Aerial photography and videography using drones. Berkley, CA: Peachpit
Press.
Christopherson, C., & Gibo, D. L. (1997). Forgaing by food deprived larvae of Neobellieria
bullata (Diptera: Sarcophagidae). Journal of Forensic Sciences, 42(1), 71–73.
136
Clark, K., Evans, L., & Wall, R. (2006). Growth rates of the blowfly, Lucilia sericata, on
different body tissues. Forensic Science International, 156(2–3), 145–149.
Dadour, I. R., Cook, D. F., & Wirth, N. (2001). Rate of development of Hydrotaea rostrata
under summer and winter (cyclic and constant) temperature regimes. Medical and
Veterinary Entomology, 15, 177–182.
Davies, L., & Ratcliffe, G. G. (1994). Development rate of some pre-adult stages in blowflies
with reference to low temperatures. Medical and Veterinary Entomology, 8, 245–254.
Dekeirsschieter, J., Verheggen, F. J., Gohy, M., Hubrecht, F., Bourguignon, L., Lognay, G., &
Haubruge, E. (2009). Cadaveric volatile organic compounds released by decaying pig
carcasses (Sus domesticus L.) in different biotopes. Forensic Science International, 189(1–
3), 46–53.
Deonier, C. C. (1940). Carcass Temperatures and Their Relation to Winter Blowfly Populations
and Activity in the Southwest. Journal of Economic Entomology, 33(1), 166–170.
DesMarais, A. M. (2014). Detection of cadaveric remains by thermal imaging cameras. Journal
of Forensic Identification, 64(5), 489–512.
Donovan, S. E., Hall, M. J. R., Turner, B. D., & Moncrieff, C. B. (2006). Larval growth rates of
the blowfly, Calliphora vicina, over a range of temperatures. Medical and Veterinary
Entomology, 20(1), 106–114.
Earl, J. (2018). Mollie Tibbetts, University of Iowa student, found dead: A timeline of events.
Early, M., & Goff, M. L. (1986). Arthropod succession patterns in exposed carrion on the island
of O’ ahu, Hawaiian Islands, USA. Journal of Medical Entomology, 23, 520–531.

137
Edelman, G. J., Hoveling, R. J. M., Roos, M., van Leeuwen, T. G., & Aalders, M. C. G. (2013).
Infrared imaging of the crime scene: Possibilities and pitfalls. Journal of Forensic Sciences,
58(5), 1156–1162.
Eisemann, C. H., & Rice, M. J. (1987). The origin of sheep blowfly, Lucilia cuprina
(Wiedemann) (Diptera: Calliphoridae), attractants in media infested with larvae. Bulletin of
Entomological Research, 77(2), 287–294.
Flores, D., Miller, A. L., Showman, A., Tobita, C., Shimoda, L. M. N., Sung, C., Turner, H.
(2016). Fluorescence Imaging of Posterior Spiracles from Second and Third Instars of
Forensically Important Chrysomya rufifacies (Diptera: Calliphoridae). Journal of Forensic
Sciences, 61(6), 1578–1587.
Franzen, C. (2013). Canadian mounties claim first person’s life saved by a police drone.
Retrieved March 29, 2019, from https://www.theverge.com/2013/5/10/4318770/canada-
draganflyer-drone-claims-first-life-saved-search-rescue
Frederickx, C., Dekeirsschieter, J., Verheggen, F. J., & Haubruge, E. (2012). Responses of
Lucilia sericata Meigen (Diptera: Calliphoridae) to Cadaveric Volatile Organic
Compounds. Journal of Forensic Sciences, 57(2), 386–390.
Galloway, A. (1997). The process of decomposition: A model from the Arizona-Sonoran desert.
In W. D. Haglund & M. H. Sorg (Eds.), Forensic taphonomy: The postmoretm fate of
human remains (pp. 139–150). Boca Raton, FL: CRC Press.
Gennard, D. E. (2007). Forensic entomology: An introduction. Chichester, UK: John Wiley &
Sons, Ltd.

138
Gill-King, H. (2006). Chapter 6: Chemical and ultrastructural aspects of decomposition. In W. D.
Haglund & M. H. Sorg (Eds.), Forensic taphonomy: The postmortem fate of human remains
(pp. 93–108). Boca Raton, FL: CRC Press.
Goff, M. L. (2009). Early post-mortem changes and stages of decomposition in exposed
cadavers. Experimental and Applied Acarology, 49(1–2), 21–36.
Goff, M. L. (2010). Chapter 1: Early postmortem changes and stages of decomposition. In J.
Amendt, C. Pietro Campobasso, M. L. Goff, & M. Grassberger (Eds.), Current Concepts in
Forensic Entomology (pp. 1–24). Springer.
Grassberger, M., & Frank, C. (2004). Initial study of arthropod succession on pig carrion in a
central European urban habitat. Journal of Medical Entomology, 41(3), 511–523.
Grassberger, M., & Reiter, C. (2001). Effect of temperature on Lucilia sericata (Diptera:
Calliphoridae) development with special reference to the isomegalen- and isomorphen-
diagram. Forensic Science International, 120(1–2), 32–36.
Grassberger, M., & Reiter, C. (2002). Effect of temperature on development of the forensically
important holarctic blow fly Protophormia terraenovae (Robineau-Desvoidy) (Diptera:
Calliphoridae). Forensic Science International, 128(3), 177–182.
Greenberg, B., & Kunich, J. C. (2002). Entomology and the law: Flies as forensic indicators.
New York: Cambridge University Press.
Hall, R. D. (2005). Chapter 1: Medicocriminal entomology. In E. P. Catts & N. H. Haskell
(Eds.), Entomology & death, a procedural guide. Clemson: Joyce’s Print Shop, Inc.
Hammack, L. (1990). Protein Feeding and Oviposition Effects on Attraction of Screw worm
Flies (Diptera: Calliphoridae) to Host Fluids. Ann Entomol. Soc Am., 83(1), 97–102.

139
Heaton, V., Moffatt, C., & Simmons, T. (2014). Quantifying the temperature of maggot masses
and its relationship to decomposition. Journal of Forensic Sciences, 59(3), 676–682.
Herschel, W. (1800). To Heat and Illuminate Objects; With Remarks , That Prove. Phil. Trans.
R. Soc. Lond., 90(January), 255–283.
Higley, L. G., & Haskell, N. . (2001). Chapter 9: Insect development and forensic entomology.
In J.H Byrd & J. . Castner (Eds.), Forensic entomology: the utility of arthropods in legal
investigations (pp. 287–300). Boca Raton, FL: CRC Press.
Iftirbashir. (2006). #7: DJI Phantom 2 - Complete FPV Setup Guide & Test - Step-By-Step!
Retrieved February 21, 2018, from https://www.youtube.com/watch?v=hMxXQE_UAyQ
Johnson, A. P., Wighton, S. J., & Wallman, J. F. (2014). Tracking Movement and Temperature
Selection of Larvae of Two Forensically Important Blow Fly Species Within a “Maggot
Mass.” Journal of Forensic Sciences, 59(6), 1586–1591.
Johnston, W., & Villeneuve, G. (1897). On the medico-legal application of entomology.
Montreal Medical Journal, 26, 81–90.
Joy, J. E., Liette, N. L., & Harrah, H. L. (2006). Carrion fly (Diptera: Calliphoridae) larval
colonization of sunlit and shaded pig carcasses in West Virginia, USA. Forensic Science
International, 164(2–3), 183–192.
Lee, M., Voss, S. C., Franklin, D., & Dadour, I. R. (2018). Preliminary investigation of aircraft
mounted thermal imaging to locate decomposing remains via the heat produced by larval
aggregations. Forensic Science International, 289, 175–185.
Lee, M. J. (2017). Utilising aircraft mounted forward looking infrared radar to locate
decomposing remains via the heat signature of blowfly larval aggregations. University of
Western Australia.

140
Liu, D., & Greenberg, B. (1989). Immature stages of some flies of forensic importance. Ann
Entomol. Soc Am., 82(1), 80–93.
Lloyd, J. M. (1975). Thermal imaging systems. New York: Springer Science + Business Media.
Mcknight, B. . (1981). The washing away of wrongs: Forensic medicine in thirteenth-century
china. University of Michigan, Ann Arbor.
Nabity, P. D., Higley, L. G., & Heng-Moss, T. M. (2006). Effects of temperature on
development of Phormia regina (Diptera: Calliphoridae) and use of developmental data in
determining time intervals in forensic entomology. Journal of Medical Entomology, 43(6),
1276–1286.
Notter, S. J., Stuart, B. H., Rowe, R., & Langlois, N. (2009). The initial changes of fat deposits
during the decomposition of human and pig remains. Journal of Forensic Sciences, 54(1),
195–201.
O’Brien, R. C. (2008). Forensic animal necrophagy in the South-West of Western Australia :
species, feeding patterns and taphonomic effects. The University of Western Australia.
Ody, H., Bulling, M. T., & Barnes, K. M. (2017). Effects of environmental temperature on
oviposition behavior in three blow fly species of forensic importance. Forensic Science
International, 275, 138–143.
Payne, J. A. (1965). A Summer Carrion Study of the Baby Pig Sus Scrofa Linnaeus. Ecology,
46(5), 592–602.
Peirce, P. (2019). Murrysville police make 1st arrests using drone to tack suspects. Retrieved
March 28, 2019, from https://triblive.com/local/westmoreland/murrysville-police-use-
drone-to-track-2-suspects-after-rt-22-crash/

141
Perritt, H. H., & Spraque, E. O. (2017). Domesticating drones: The technology, law, and
economics of unmanned aircraft. New York, NY: Routledge.
Petersen, J. K. (2007). Understanding surveillance technologies: Spy devices, privacy, history &
applications (2nd ed.). Boca Raton, FL: Taylor & Francis Group.
Reed, H. B. (1958). A study of dog carcase communities in Tennessee, with special reference to
the insects. The American Midland Naturalist, 59, 213–245.
Rivers, D. B., Ciarlo, T., Spelman, M., & Brogan, R. (2010). Changes in Development and Heat
Shock Protein Expression in Two Species of Flies Sarcophaga bullata [Diptera:
Sarcophagidae] and Protophormia terraenovae [Diptera: Calliphoridae] Reared in Different
Sized Maggot Masses. Journal of Medical Entomology, 47(4), 677–689.
Rivers, D. B., & Dahlem, G. A. (2014). The Science of Forensic Entomology (First). John Wiley
& Sons, Ltd.
Rivers, D. B., Thompson, C., & Brogan, R. (2011). Physiological trade-offs of forming maggot
masses by necrophagous flies on vertebrate carrion. Bulletin of Entomological Research,
101, 599–611.
Rodriguez, W. C., & Bass, W. M. (1983). Insect activity and its relationship to decay rates of
human cadavers in east Tennessee. Journal of Forensic Sciences, 28, 423–432.
Sharma, R. (2015). Various methods for the estimation of the post mortem interval from
Calliphoridae : A review. Egyptian Journal of Forensic Sciences, 5(1), 1–12.
Slone, D. H., & Gruner, S. (2007). Thermoregulation in Larval Aggregations of Carrion-Feeding
Blow Flies (Diptera: Calliphoridae). Journal of Medical Entomology, 44(3), 516–523.
Smith, K. G. V. (1986). A Manual of Forensic Entomology. London: Trustees of the British
Museum (Natural History) and Cornell University Press.
142
Turner, B., & Howard, T. (1992). Metabolic heat generation in dipteran larval aggregations: a
consideration for forensic entomology. Medical and Veterinary Entomology, 6(2), 179–181.
Ubelaker, D. H. (2006). Chapter 5: Taphonomic applications in forensic anthropology. In W. D.
Haglund & M. H. Sorg (Eds.), Forensic taphonomy: The postmortem fate of human remains
(pp. 77–90). Boca Raton, FL: CRC Press.
Vass, A. A. (2001). Beyond the grave - understanding human decomposition. Microbiology
Today, 28, 190–192.
Vollmer, M., & Mollmann, K. . (2017). Infrared thermal imaging: Fundamentals, research and
applications (2nd ed.). Weinheim, Germany: John Wiley & Sons.
Voss, S.C. (2010). Investigation of hymenopteran parasitoids of forensic importance: indicators
of post-mortem interval. University of Western Australia.
Voss, S.C., Cook, D. F., Hung, W. F., & Dadour, I. R. (2014). Survival and development of the
forensically important blow fly, Calliphora varifrons (Diptera: Calliphoridae) at constant
temperatures. Forensic Science, Medicine, and Pathology, 10(3), 314–321.
Voss, S.C., Spafford, H., & Dadour, I. R. (2009). Annual and seasonal patterns of insect
succession on decomposing remains at two locations in Western Australia. Forensic Science
International, 193(1–3), 26–36.
Warren, P. (2017). Md. police dept. drone helps find $394K in stolen construction equipment
from multiple states. Retrieved March 29, 2019, from
https://baltimore.cbslocal.com/2017/03/16/md-police-dept-drone-helps-find-394k-in-stolen-
construction-equipment-from-multiple-states/

143
Whitworth, T. (2017). Keys to the Genera and Species of Blow Flies (Diptera: Calliphoridae) of
America, North of Mexico. Proceedings of the Entomological Society of Washington,
108(3), 689–725.

144
APPENDICES
APPENDIX A: Protocol for Fly Colony Maintenance and Breeding .................................. 145

145
APPENDIX A: Protocol for Fly Colony Maintenance and Breeding
Fly Colony Maintenance
• New cage set-up: o Place the previously cut mesh over the PVC cage. o Ensure that there is enough mesh on both sides so they can be closed. Close one side
with a rubber band → this will be the back of the cage. o The other side can be closed with a clip → this will be the front of the cage. o It is very important that you make sure both sides are closed completely so the flies
don’t escape! • Each fly colony will need:
o A petri dish of sugar cubes. These cubes will need to be changed about once a month depending on the size of the colony. You will know they need to be changed when they are crumbling and falling apart.
o Water. A hole should be made in the lid of the urine collection cup. Then a square from a T-shirt (previously cut in one of the baskets) should be put through the hole. Some of the shirt should be sticking out the top, while most should be sitting inside the cup. Fill the cup with water and ensure that the water is wicked up before placing inside the colony.
▪ The water probably needs to be changed about once a week. Again, this change depending on how large the colony is. I recommend checking this daily to ensure that they have water.
• To begin the colony: o If pupae are in refrigerator: put contents from urine collection cup on a petri dish and
place in colony. Wait to emerge. o If using pupae directly from a rearing dish: remove meat and place dish (with sand and
pupae) directly into colony. Wait to emerge. o If using a fly trap: place trapped flies into the colony
Blood Feed Instructions
• A blood feed should be done a minimum of once a week, sometimes twice depending on the colony. This can be based off of how many eggs are being laid.
• Liver should be cut up into cubed form and placed in a large weigh boat (there is a sharp knife and cutting board to do this)
o Use a pipette to transfer blood from the bottom of the liver container to the weigh boat. Place a good amount of blood onto the liver, but do not saturate it as you do not want to drown the eggs. You can also spray the liver meat with a little bit of water, but also do not saturate it. There should not be a pool of liquid at the bottom.
• Place the weigh boat in the colony. • Make sure to wash the knife, pipette and cutting board after finishing. When the blood dries it is
difficult to wash off. • Another thing to keep in mind is the amount of liver you have in the fridge. If you are running
low, make sure to take out another liver far enough in advance so that it has time to thaw. You can stick the liver in a plastic container and place it into the fridge.

146
Rearing Dish Preparation and Maintenance
• The liver should be in the fly colony for about 24 hours. A rearing dish needs to be prepped the
following day after the protein feed. • If the flies did not lay, you can throw the weigh boat away. If the flies did lay, do the following,
o Fill the plastic container with sand (about 1⁄2 full) o Place a good amount of ground beef on a plate or weigh boat. Place on top of the sand. o Similar to the protein feed, use a pipette to transfer some of the blood (from the liver
container) on to the ground beef. Again, this is not to saturate it. o Place the liver cubes that have eggs laid on them on top of the ground beef. Try to get as
many eggs as possible on to the beef. o Spray the beef with water. Hold the spray bottle about a foot away from the meat, and
spray about 3 or 4 times. Again, we do not want to saturate them, just keep them moist! o Place a mesh square (already pre-cut) on top of the plastic container. Place a rubber band
over the rearing mesh. You should make sure that there are no holes where wandering maggots can escape from. The rubber band should be tight and close to the rim of the container.
o Place the rearing dish on the shelf and label with correct number for binder keeping. • The rearing dishes need to be sprayed TWICE A DAY
o Make sure to take the mesh off and spray the meat directly (as directed above) o Again, make sure to put it on correctly so there are no holes for the maggots to escape o If the maggots are wandering to the outer rim of the plastic, be careful when taking the
mesh off as the maggots will fall onto the table. At this point they are probably about to pupate so you can just leave the mesh on and just spray through the mesh.
• Once the maggots pupate, remove the meat and throw away. o Sieve the sand o Either put the pupae in a urine container and place in fridge (with species name, date and
initials) or place directly into a fly colony • Again, be aware of how much ground beef you have in the fridge. When you run low you need to
take some out in advance so that it has time to thaw before you need it again o We are putting water crystals in the beef to keep it moist. When the meat you have taken
out thaws completely, mix the water crystal beads with water. Wait for the beads to absorb the water and then mix in with the meat.
Other Important Information to Know
• You must fill out the binder each time you do something! This is so you and everyone else knows what has been done and which colony/dish is which.
• The binder consists of tabs for: Colony Sheets, Rearing Dish Sheets, Old Colony Sheets and Old Rearing Dish Sheets
• The codes for these sheets for what you have done are located on the wall next to the whiteboard • On the top right of each sheet be sure to put which species is present in the colony/rearing dish (if
known) • Numbering system for Rearing Dishes:
o This will be based off of which colony the eggs came from and how many rearing dishes are going.
o Number = cage number; Letter = how many rearing dishes are already going o For example, if you set up a rearing dish for the first eggs laid in your colony, which is
cage #4, your rearing dish number would be 4A. However, if you do a few more blood

147
feeds and you have two previous dishes from Cage #4 going, your new rearing dish number would be 4C.