Detection of EEG Signal Post-Stroke Using FFT and ...
6
Detection of EEG Signal Post-Stroke Using FFT and Convolutional Neural Network Esmeralda C. Djamal*, Widiyanti Isni Furi, Fikri Nugraha Department of Informatics, Universitas Jenderal Achmad Yani Cimahi, Indonesia *Corresponding author email: [email protected] Abstract— Stroke is a condition that occurs when the blood supply to the brain is disrupted or reduced. It may be caused by a blockage (ischemic stroke) or rupture of a blood vessel (hemorrhagic stroke) so that it can cause disability. Therefore patients need to undergo rehabilitation. One of the procedures of monitoring of the recovery of stroke patients using the National Institutes of Health Stroke Scale (NIHSS) method, but sometimes subjectively. Electroencephalogram (EEG) is an instrument that can measure electrical activity in the brain, including abnormalities caused by stroke. This study investigates EEG signal detection in post-stroke patients using Fast Fourier Transform (FFT) and 1D Convolutional Neural Network (1D CNN). Fast Fourier Transform (FFT) extraction can increase accuracy from 60% to 80.3% from the use of Adam's optimization model. Meanwhile, the AdaDelta model gave 20% accuracy without FFT. And its condition increased to 79.9% with FFT extraction. Therefore, Adam's stability has the advantage of remembering to use hyper-parameter. On the other hand, FFT is beneficial for directing information used for the use of 1D CNN, thus increasing accuracy. The results showed that using of Fast Fourier Transform (FFT) in identification could increase accuracy by 45-80% compared to identification using only 1D CNN. Meanwhile, the results of the study show that the relative weight correction model using Adaptive Moment Estimation (Adam) provided higher accuracy compared to the Adaptive learning rate (AdaDelta). Although both provide training data accuracy of 100%, the accuracy of training data is very dependent on variations in training data. Keywords— post-stroke; rehabilitation; EEG signal; FFT; 1D CNN; I. INTRODUCTION Stroke is a condition that occurs when the blood supply to the brain is disrupted or reduced due to blockage (ischemic stroke) or rupture of a blood vessel (hemorrhagic stroke). Without blood, the brain will not get oxygen and nutrients [1], so cells in some areas of the brain will die such as muscle disorders, loss of senses in the body, aphasia or impaired speech function, and cognitive and visuospatial problems [2]. According to the research of the Indonesian Ministry of Health in 2013, more than 15% of deaths in Indonesia were caused by ischemic strokes. The consequences of stroke not only caused depression, physical disability, but even ischemic stroke can also cause death. In healing stroke, rehabilitation is usually needed [2], to restore the patient's abilities such as the original or no stroke condition. So that need monitoring the patient's development to observation brain recovery. One method that is used to monitor and evaluate the progress of patients is the National Institutes of Health Stroke Scale (NIHSS). The method to determine the recovery level of stroke patients. NIHSS examines 11 criteria from standard neurological examinations that assess levels of consciousness, sensory function, hand movements, leg movements, facial muscle function, patient's eye, sensory censorship, given command response, language ability, speech, and no attention [3]. One way of observing electrical signals in the brain is through rhythm information or amplitude density, amplitude, amplitude changes, differences in amplitude between symmetric channels, and the presence of Alpha, Delta, and Theta waves and amplitude on the Electroencephalogram (EEG) and motor signals -imagery to think of movements that can be obtained on EEG signals [4]. Ischemic stroke occurs because of obstruction that can make The Cerebral Blood Flow (CBF) lower than CBF on no stroke person so that the EEG signal has a deceleration through the Alpha, Beta, Delta, Theta, and Gamma wave features [5]. Electroencephalogram (EEG) is an instrument for capturing electrical activity in the brain. The signal generated from this EEG device can achieve the state of mind and electrical abnormalities in the brain. However, the EEG signal is non-stationary, has a small amplitude, so it is not easy in visual observation. The EEG signal consists of wave components based on frequencies, namely Alpha waves (8-13 Hz), Theta waves (4-7 Hz), and Delta waves (0.5-3 Hz) [6]. Therefore, extracting the EEG signal into a frequency component becomes useful [7]. Other studies detected epilepsy disorders using the FFT and wavelet methods [8] [9], to the analysis of brain signal activity in ischemic stroke patients using FFT [10]. One method of signal extraction into frequency components is the Fast Fourier Transform (FFT). Although the FFT method is more appropriate for stationary signals if segmented in a short time, the stationer signal approach for EEG signals can be used [11]. Deep learning is part of machine learning with increased accuracy. This method used depth computing through convolution with the kernel and provided with more training data. Graphics Processing Unit (GPU) devices support using Deep learning to solve obstacles in speed and memory. Some methods that are often used in deep learning use Convolutional Neural Network (CNN) and Recurrent Neural Networks (RNN). Both have their characteristics and capabilities in signal processing. CNN is very often used in image or video processing [12]. However, for signal processing, convolution is carried out on a one-dimensional kernel, so-called one dimension CNN. Previous studies used the 1D CNN method to identify ischemic stroke with EEG using 1D CNN and normalization batches [5]. The research showed that 1D CNN method gives accurate results in the classification process, considering convolution with many previous layers. Also, 1D CNN was used to analyze epileptiform spikes on EEG signals [13], then classify emotions accurately [14][15]. EEG signal information can predict left and right movements using CNN. [16]. Post-stroke patients who have undergone rehabilitation allow the electrical disturbances in the brain to improve. To monitor the progress of recovery, accompanied by NIHSS, the EEG signal detection model was used. The EEG signal is extracted first in the frequency domain, namely Alpha, Theta, Proc. EECSI 2019 - Bandung, Indonesia, 18-20 Sept 2019 18
Transcript of Detection of EEG Signal Post-Stroke Using FFT and ...
Detection of EEG Signal Post-Stroke Using FFT and Convolutional Neural Network
Esmeralda C. Djamal*, Widiyanti Isni Furi, Fikri NugrahaDepartment of Informatics, Universitas Jenderal Achmad Yani
Cimahi, Indonesia *Corresponding author email: [email protected]
Abstract— Stroke is a condition that occurs when the blood supply to the brain is disrupted or reduced. It may be caused by a blockage (ischemic stroke) or rupture of a blood vessel (hemorrhagic stroke) so that it can cause disability. Therefore patients need to undergo rehabilitation. One of the procedures of monitoring of the recovery of stroke patients using the National Institutes of Health Stroke Scale (NIHSS) method, but sometimes subjectively. Electroencephalogram (EEG) is an instrument that can measure electrical activity in the brain, including abnormalities caused by stroke. This study investigates EEG signal detection in post-stroke patients using Fast Fourier Transform (FFT) and 1D Convolutional Neural Network (1D CNN). Fast Fourier Transform (FFT) extraction can increase accuracy from 60% to 80.3% from the use of Adam's optimization model. Meanwhile, the AdaDelta model gave 20% accuracy without FFT. And its condition increased to 79.9% with FFT extraction. Therefore, Adam's stability has the advantage of remembering to use hyper-parameter. On the other hand, FFT is beneficial for directing information used for the use of 1D CNN, thus increasing accuracy. The results showed that using of Fast Fourier Transform (FFT) in identification could increase accuracy by 45-80% compared to identification using only 1D CNN. Meanwhile, the results of the study show that the relative weight correction model using Adaptive Moment Estimation (Adam) provided higher accuracy compared to the Adaptive learning rate (AdaDelta). Although both provide training data accuracy of 100%, the accuracy of training data is very dependent on variations in training data.
Keywords— post-stroke; rehabilitation; EEG signal; FFT; 1D CNN;
I. INTRODUCTION
Stroke is a condition that occurs when the blood supply to the brain is disrupted or reduced due to blockage (ischemic stroke) or rupture of a blood vessel (hemorrhagic stroke). Without blood, the brain will not get oxygen and nutrients [1], so cells in some areas of the brain will die such as muscle disorders, loss of senses in the body, aphasia or impaired speech function, and cognitive and visuospatial problems [2]. According to the research of the Indonesian Ministry of Health in 2013, more than 15% of deaths in Indonesia were caused by ischemic strokes. The consequences of stroke not only caused depression, physical disability, but even ischemic stroke can also cause death.
In healing stroke, rehabilitation is usually needed [2], to restore the patient's abilities such as the original or no stroke condition. So that need monitoring the patient's development to observation brain recovery. One method that is used to monitor and evaluate the progress of patients is the National Institutes of Health Stroke Scale (NIHSS). The method to determine the recovery level of stroke patients. NIHSS examines 11 criteria from standard neurological examinations that assess levels of consciousness, sensory function, hand movements, leg movements, facial muscle function, patient's eye, sensory censorship, given command response, language ability, speech, and no attention [3]. One way of observing
electrical signals in the brain is through rhythm information or amplitude density, amplitude, amplitude changes, differences in amplitude between symmetric channels, and the presence of Alpha, Delta, and Theta waves and amplitude on the Electroencephalogram (EEG) and motor signals -imagery to think of movements that can be obtained on EEG signals [4]. Ischemic stroke occurs because of obstruction that can make The Cerebral Blood Flow (CBF) lower than CBF on no stroke person so that the EEG signal has a deceleration through the Alpha, Beta, Delta, Theta, and Gamma wave features [5].
Electroencephalogram (EEG) is an instrument for capturing electrical activity in the brain. The signal generated from this EEG device can achieve the state of mind and electrical abnormalities in the brain. However, the EEG signal is non-stationary, has a small amplitude, so it is not easy in visual observation. The EEG signal consists of wave components based on frequencies, namely Alpha waves (8-13 Hz), Theta waves (4-7 Hz), and Delta waves (0.5-3 Hz) [6]. Therefore, extracting the EEG signal into a frequency component becomes useful [7]. Other studies detected epilepsy disorders using the FFT and wavelet methods [8] [9], to the analysis of brain signal activity in ischemic stroke patients using FFT [10].
One method of signal extraction into frequency components is the Fast Fourier Transform (FFT). Although the FFT method is more appropriate for stationary signals if segmented in a short time, the stationer signal approach for EEG signals can be used [11].
Deep learning is part of machine learning with increased accuracy. This method used depth computing through convolution with the kernel and provided with more training data. Graphics Processing Unit (GPU) devices support using Deep learning to solve obstacles in speed and memory. Some methods that are often used in deep learning use Convolutional Neural Network (CNN) and Recurrent Neural Networks (RNN). Both have their characteristics and capabilities in signal processing. CNN is very often used in image or video processing [12]. However, for signal processing, convolution is carried out on a one-dimensional kernel, so-called one dimension CNN. Previous studies used the 1D CNN method to identify ischemic stroke with EEG using 1D CNN and normalization batches [5]. The research showed that 1D CNN method gives accurate results in the classification process, considering convolution with many previous layers. Also, 1D CNN was used to analyze epileptiform spikes on EEG signals [13], then classify emotions accurately [14][15]. EEG signal information can predict left and right movements using CNN. [16].
Post-stroke patients who have undergone rehabilitation allow the electrical disturbances in the brain to improve. To monitor the progress of recovery, accompanied by NIHSS, the EEG signal detection model was used. The EEG signal is extracted first in the frequency domain, namely Alpha, Theta,
Proc. EECSI 2019 - Bandung, Indonesia, 18-20 Sept 2019
18

and Delta wave using FFT. The EEG signal involved comes from 14 channels. The extraction results were passed through training using 1D CNN before detecting the "No Stroke" and "Stroke" classes.
II. RELATED WORKS
A. Fast Fourier Transform
Fast Fourier Transform (FFT) is an implementation of theDiscrete Fourier Transform (DFT). Previous research used FFT for emotional recognition [17], identification of emotion changes in TBI patients [18], identification of dyslexia in children using FFT [18], identified healthy and epilepsy from EEG signals using FFT [19].
DFT is signal processing, and digital filtering carried out on each frame of the signal that has been carried out in the windowing stage. Implementation of Fourier transforms with vector length N defined by (1). ( ) = ∑ ( ) / (1)
The signal is divided on the same frame and does overlap 50% of data length to reduce the discontinuity. To improve the side lobe fluctuations, which can interfere with the spectral resolution, to each frame is made windowing is being then averaged as (2)
)()()( kwkxkxw = (2)
Each signal frame is divided into components say real with (3) and (4) to find imaginary values. ( ) = ∑ ( ) ∗ cos (3) ( ) = ∑ ( ) ∗ (4)
N = number of data, u = 1, 2, 3, ..., N / 2, X (u) = value at the u - frequency point and f (x) = signal value of the x - windowing result. Equations 3 and (4) can be expressed by (5) based on transformation, which aims to convert each sample N frame from the time domain to the frequency domain. ( ) = ∑ cos − sin (5)
The magnitude of the FFT uses (6). | ( )| = ( ) + ( ) (6)
B. 1D Convolutional Neural Network
Convolutional Neural Networks (CNN) consists of twolayers, namely the feature layer and the classification layer as detection/identification, as shown in Fig. 1.
In the feature layer, it consists of convolution between data with a fixed-size kernel, and subsampling. Especially for signals or one dimension, CNN is adapted to the convolution process using one aspect as well.
In previous studies, CNN was used to identify ischemic stroke patients and no stroke people throughout looking at EEG signals into one-dimensional objects [3]. While in other studies, CNN was used to identify motorists' awareness of
EEG signals [19], and epilepsy [20]. Also, previous researches used 1D CNN to human biometric identification [20], classification of motor-imagery in the Brain-Computer Interface (BCI) field [21], predicting the accuracy of carotid endarterectomy in stroke patients [22], and identified acute ischemia in stroke patients [1].
Fig. 1. CNN Architecture
In this feature extraction layer, an encoding process occurs to find several features for the detection stage. The feature extraction layer consists of the convolution and pooling stages.
1) ConvolutionConvolution consists of neurons arranged so that they have
the length of pixels that make up the kernel. The kernel is used as a shift as much as the stride value to the right until the end. The convolution stage must determine the activation value used for the contents of the kernel. To obtain the output value by dots product between input and result of the kernel to produce an output called the Feature Map (FM) using (7) as an operator. ( ) = ∑ ( 1) ∗ ( ) (6)
Where FM is a feature map, I is input, C is convolution filter, ci is column index of i filter, m is feature map number, and ji is feature map column.
In this layer, the convolution between the signal and the kernel shift as much Stride value. It determines the next output dimension. While zero-padding determines the number of added values for zero intensity in the surrounding area or input side, to get the map feature can be seen in (7). = + 1 (7)
If the signal is convoluted with stride 1, then there is a right shift of 1 point.
2) Rectified Linear Unit
ReLU, The activation process, using the Rectified Linear Unit (ReLU) function to eliminate the negative value to zero, Activation function x called as (8). ( ) = (0, ) (8)
3) Max PoolingAt the stage of the Max, Pooling feature map produces a smaller size by reducing but does not eliminate the dominant feature, by taking the highest value from the activation
Strok
No St
Input Convolution
Pooling
Flatten
Fully Connected
Output
.
.
.
.
Feature Learning Identification
Proc. EECSI 2019 - Bandung, Indonesia, 18-20 Sept 2019
19
results. This study took a pooling distance of 2x1 pixels to 1x1 pixel.
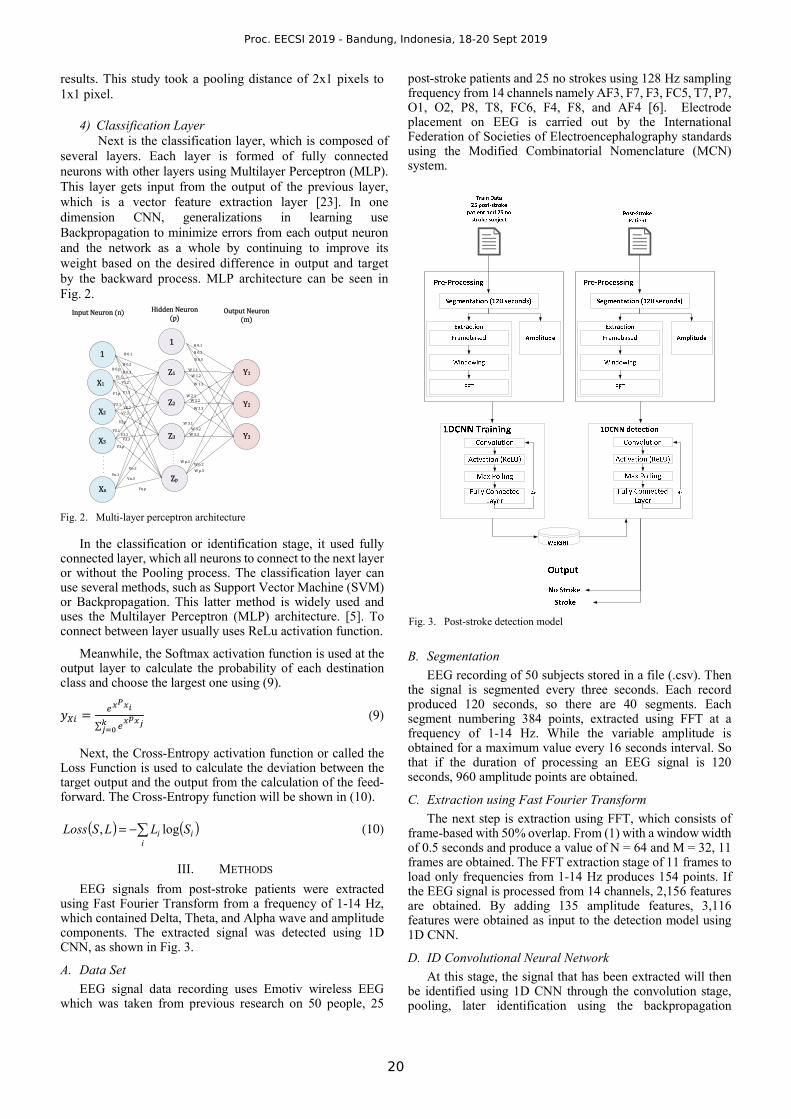
4) Classification LayerNext is the classification layer, which is composed of
several layers. Each layer is formed of fully connected neurons with other layers using Multilayer Perceptron (MLP). This layer gets input from the output of the previous layer, which is a vector feature extraction layer [23]. In one dimension CNN, generalizations in learning use Backpropagation to minimize errors from each output neuron and the network as a whole by continuing to improve its weight based on the desired difference in output and target by the backward process. MLP architecture can be seen in Fig. 2.
Fig. 2. Multi-layer perceptron architecture
In the classification or identification stage, it used fully connected layer, which all neurons to connect to the next layer or without the Pooling process. The classification layer can use several methods, such as Support Vector Machine (SVM) or Backpropagation. This latter method is widely used and uses the Multilayer Perceptron (MLP) architecture. [5]. To connect between layer usually uses ReLu activation function.
Meanwhile, the Softmax activation function is used at the output layer to calculate the probability of each destination class and choose the largest one using (9). = ∑ (9)
Next, the Cross-Entropy activation function or called the Loss Function is used to calculate the deviation between the target output and the output from the calculation of the feed-forward. The Cross-Entropy function will be shown in (10).
( ) ( )−=i
ii SLLSLoss log, (10)
III. METHODS
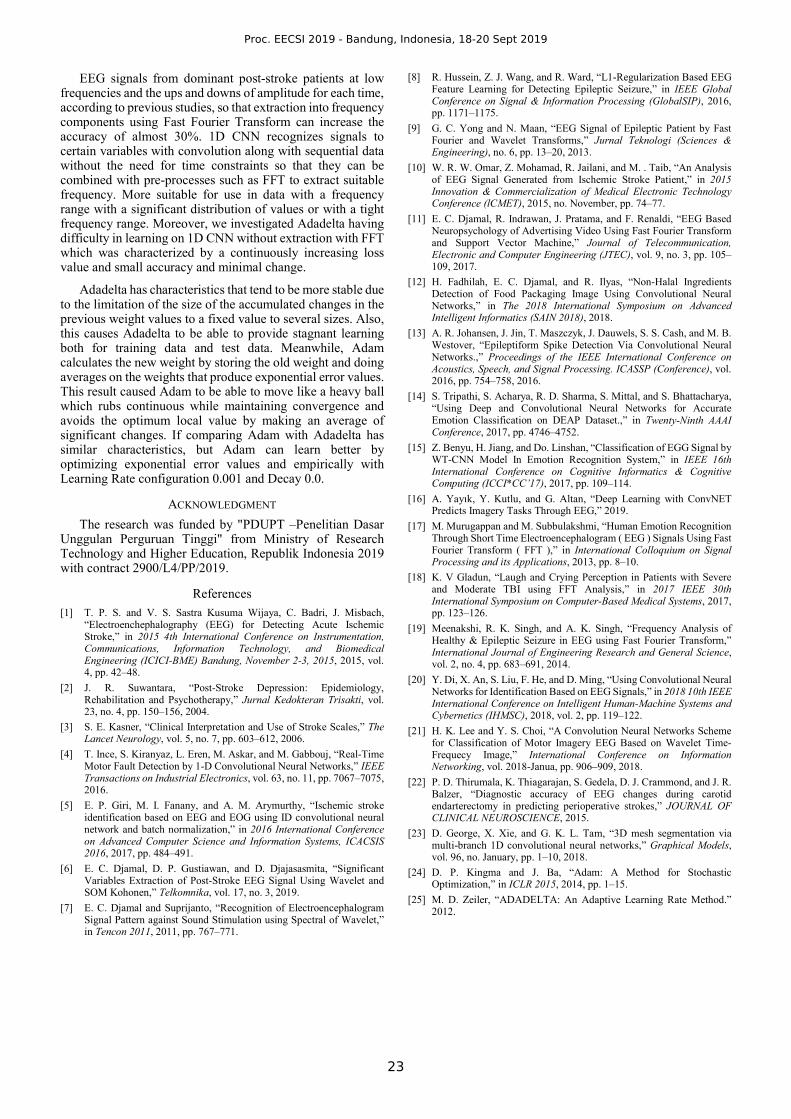
EEG signals from post-stroke patients were extracted using Fast Fourier Transform from a frequency of 1-14 Hz, which contained Delta, Theta, and Alpha wave and amplitude components. The extracted signal was detected using 1D CNN, as shown in Fig. 3.
A. Data Set
EEG signal data recording uses Emotiv wireless EEGwhich was taken from previous research on 50 people, 25
post-stroke patients and 25 no strokes using 128 Hz sampling frequency from 14 channels namely AF3, F7, F3, FC5, T7, P7, O1, O2, P8, T8, FC6, F4, F8, and AF4 [6]. Electrode placement on EEG is carried out by the International Federation of Societies of Electroencephalography standards using the Modified Combinatorial Nomenclature (MCN) system.
Fig. 3. Post-stroke detection model
B. Segmentation
EEG recording of 50 subjects stored in a file (.csv). Thenthe signal is segmented every three seconds. Each record produced 120 seconds, so there are 40 segments. Each segment numbering 384 points, extracted using FFT at a frequency of 1-14 Hz. While the variable amplitude is obtained for a maximum value every 16 seconds interval. So that if the duration of processing an EEG signal is 120 seconds, 960 amplitude points are obtained.
C. Extraction using Fast Fourier Transform
The next step is extraction using FFT, which consists offrame-based with 50% overlap. From (1) with a window width of 0.5 seconds and produce a value of N = 64 and M = 32, 11 frames are obtained. The FFT extraction stage of 11 frames to load only frequencies from 1-14 Hz produces 154 points. If the EEG signal is processed from 14 channels, 2,156 features are obtained. By adding 135 amplitude features, 3,116 features were obtained as input to the detection model using 1D CNN.
D. ID Convolutional Neural Network
At this stage, the signal that has been extracted will thenbe identified using 1D CNN through the convolution stage, pooling, later identification using the backpropagation
X1X2X3Xn
Z11
Z2Z3Zp
1 Y1Y2Y3
..........
B0.1B0.2B0.3B0.pV1.1V1.2V1.3V1.pV2.1 V2.2V2.3V2.pV3.1 V3.2V3.3V3.p
Vn.1 Vn.2Vn.pVn.3
B0.1B0.2B0.3W1.1W1.2W1.3W2.1W2.2W2.3
W3.1W3.2W3.3Wp.1 Wp.2Wp.3
InputNeuron(n) OutputNeuron(m)HiddenNeuron(p)
Proc. EECSI 2019 - Bandung, Indonesia, 18-20 Sept 2019
20

algorithm, which can be seen in Fig 1, then input for 1D CNN is 3.116 features.
In the learning phase, what is very important is the method for weighting, which is called the optimization model. This study used the Adaptive Moment Estimation (Adam) model [24] and Adaptive learning rate (AdaDelta), whichdynamically adapts over time [25].
Although compared to the Stochastic Gradient Descent (SGD) model or other models, the AdaDelta method is relatively faster at converging because it reduces errors, thus approaching the best results. However, Adam achieved convergence much faster.
IV. RESULT AND DISCUSSION
The experimental results are split into four parts, namely FFT extraction, configuration optimization, and the effect of using FFT. In this study, data used 80% for training and 20% validation data. The test was carried out with two models for renewal of weights, model Adam and AdaDelta.
A. FFT Extraction
EEG signal with x(n) during 40 segments as shown in Fig.4, then after the frame-based windowing, and Fast Fourier Transform of EEG signal in 1-14 Hz frequency range. Fig 4 shows the original EEG signal from one of the post-stroke patients, while Fig 5 is the result of FFT extraction.
Fig. 4. Original EEG signal of 14 channels
Fig. 5. FFT extraction of 1-14 frequency band
B. Configuration Optimization
Experiments were carried out with a 1D CNNconfiguration model that provided the best accuracy. The four configurations are based on the number of layers and filters of the input layer where convolution continues to increase. The setting is intended to minimize errors and revise the weight to produce better accuracy. This model uses Adam optimization with a learning rate of 0.001 and a dropout of 0.5. Can be seen
in Table I, which is a variation of the 1D CNN model with each configuration. Each setting has its kernel size.
TABLE I. CONFIGURATION OF 1D CNN
Variable 1D CNN Model Config 1 Config 2 Config 3 Config 4
Convolution 1 3115x8 3115x8 3115x8 3115x8
Max Pooling 1
779x8 779x8 779x8 779x8
Convolution 2 - 778x8 3115x8 3115x8 Max Pooling 2
- 194x8 779x8 779x8
Convolution 3 - - 193x8 193x8 Max Pooling 3
- - 48x8 48x8
Convolution 4 - - - 47x16 Max Pooling 4
- - - 10 x 16
Flatten_1 6232 1552 384 160 Dense_1 30 30 30 30 Dense_2 2 2 2 2 Dropout_1 0.5 0.5 0.5 0.5
From Table II, configuration 4 has a higher size convolution and Max Pooling while Flatten less. The accuracy of the four settings is shown in Table III.
TABLE II. CONFIGURATION 1D CNN MODEL
No Configuration Accuracy (%)
Train Data Test Data 1 Configuration 1 73.29 50.76 2 Configuration 2 80.85 60.22 3 Configuration 3 95.26 73.19 4 Configuration 4 100 80.30
In Table II is the result of the accuracy of the four configuration models but the best results with the correctness of 80.30% use configuration 4. This way performed by adding convolution and filters to produce flatten 752 compared to the other three forms.
C. Influence of FFT as Feature Extraction
The EEG signal detection model of post-stroke patientsconsists of two parts, extraction, and detection. In this section, it is necessary to examine the effect of using FFT on detection performance, as in Table III. It is seen that the accuracy of the detection model using FFT is higher, which achieved 100% of training data and 80.3% of validation data. This result higher than using without FFT that are 58.63% of validation data. These results indicate that FFT can help recognize EEG signals and reduce computing time.
TABLE III. ACCURACY AND LOSS OF ADAM AND ADADELTA MODEL
Configure Feature Training Data Validation Data
Accuracy (%)
Loss Accuracy (%)
Loss
Adam With FFT 100 0,1272 80,30 0,552 Without FFT
100 0,538 60 0,538
AdaDelta FFT 100 0,0182 79,90 2,992 Without FFT
70 0,581 20,10 0,866
Proc. EECSI 2019 - Bandung, Indonesia, 18-20 Sept 2019
21

D. Comparing Two Models of Optimization Using FFTExtraction
This section tests the accuracy of the two optimizationmethods, particularly Adam and AdaDelta. The experiment showed that testing using the Adam optimization model with FFT extraction like Fig. 6, the accuracy of the training data is 100% since the 38th epoch, but accuracy has fluctuated up to epoch to 92 after 102.7 seconds while the testing of new data gave an accuracy of 80.30%. Losses of Adam model with FFT, as shown in Fig. 7.
Fig. 6. Accuracy of the Adam model with FFT
Fig. 7. Loss of the Adam model with FFT
Meanwhile, the AdaDelta model also provides enough accuracy, which is almost the same as the performance of the Adam model, which is 79.90%. The accuracy and Losses of the AdaDelta model are shown in Fig. 8 and Fig. 9
Fig. 8. Accuracy of AdaDelta model with FFT
Fig. 9. Loss of AdaDelta model with FFT
The Adam method relatively does not take up much memory, so the computing process more efficient and is suitable for non-stationary data.
Another advantage of Adam is the size of the parameter update is not the same as the gradient scale; the shortcomings of Adam's size are limited by hyper-parameter. Meanwhile, AdaDelta's model does not require hyper-parameter to improve learning on each iteration.
E. Comparing Two Models of Optimization Without FFTExtraction
Experiments using the Adam optimization model withoutFFT extraction can be seen in Fig. 10. The accuracy of training data is convergent since the 71st epoch is 100%, and the new data fluctuated from epoch 40-98, and the final accuracy is 60% with a length of training time of 238.2. This result is
because all the features in the direct data are identified using 1D CNN without going through the FFT extraction stage so that it does not take the essential elements. For the loss value on Adam, it experiences very fast convergence on the 4th epoch, and the accuracy starts to stabilize at the 40th epoch but fluctuated up to epoch to 100 with an accuracy of 0.538 and for test data the loss accuracy is 0.538 which starts converging to 10rd epoch and stable correctness to epoch to 100 which can be seen in Fig. 11.
Fig. 10. Accuracy of the Adam model without FFT
Fig. 11. Loss of the Adam model without FFT
Adadelta model without FFT extraction gave 70% accuracy of training data and 20.10% of new data (Fig. 12). It took 301.8 seconds of the learning process. For Adadelta's loss value from fluctuating accuracy 0.581. Meanwhile, the loss from validation data varies to epoch to 100, which is 0.866. There is a much higher loss compared to Adam's optimization up to 4,78593, which can be seen in Fig. 13.
Fig. 12. Accuracy of AdaDelta model without FFT
Fig. 13. Loss of AdaDelta model without FFT
If using FFT with Adam optimization for test data, it is prepared with epochs up to 100, and the use of 0.001 learning rate can improve accuracy for the better. However, if using Adadelta optimization, there is a decrease in truth up to 0.4%. Detection without FFT extraction gave lower accuracy, 39.90 only of same configuration and epoch. Therefore, FFT extraction is greatly influenced accuracy both optimation model.
V. CONCLUSION
Detection of EEG signals from post-stroke patients using Fast Fourier Transform and 1D CNN can provide the best accuracy of 100% of training data and 80.3% of validation data.
Proc. EECSI 2019 - Bandung, Indonesia, 18-20 Sept 2019
22
EEG signals from dominant post-stroke patients at low frequencies and the ups and downs of amplitude for each time, according to previous studies, so that extraction into frequency components using Fast Fourier Transform can increase the accuracy of almost 30%. 1D CNN recognizes signals to certain variables with convolution along with sequential data without the need for time constraints so that they can be combined with pre-processes such as FFT to extract suitable frequency. More suitable for use in data with a frequency range with a significant distribution of values or with a tight frequency range. Moreover, we investigated Adadelta having difficulty in learning on 1D CNN without extraction with FFT which was characterized by a continuously increasing loss value and small accuracy and minimal change.
Adadelta has characteristics that tend to be more stable due to the limitation of the size of the accumulated changes in the previous weight values to a fixed value to several sizes. Also, this causes Adadelta to be able to provide stagnant learning both for training data and test data. Meanwhile, Adam calculates the new weight by storing the old weight and doing averages on the weights that produce exponential error values. This result caused Adam to be able to move like a heavy ball which rubs continuous while maintaining convergence and avoids the optimum local value by making an average of significant changes. If comparing Adam with Adadelta has similar characteristics, but Adam can learn better by optimizing exponential error values and empirically with Learning Rate configuration 0.001 and Decay 0.0.
ACKNOWLEDGMENT
The research was funded by "PDUPT –Penelitian Dasar Unggulan Perguruan Tinggi" from Ministry of Research Technology and Higher Education, Republik Indonesia 2019 with contract 2900/L4/PP/2019.
References [1] T. P. S. and V. S. Sastra Kusuma Wijaya, C. Badri, J. Misbach,
“Electroenchephalography (EEG) for Detecting Acute Ischemic Stroke,” in 2015 4th International Conference on Instrumentation, Communications, Information Technology, and Biomedical Engineering (ICICI-BME) Bandung, November 2-3, 2015, 2015, vol. 4, pp. 42–48.
[2] J. R. Suwantara, “Post-Stroke Depression: Epidemiology, Rehabilitation and Psychotherapy,” Jurnal Kedokteran Trisakti, vol. 23, no. 4, pp. 150–156, 2004.
[3] S. E. Kasner, “Clinical Interpretation and Use of Stroke Scales,” The Lancet Neurology, vol. 5, no. 7, pp. 603–612, 2006.
[4] T. Ince, S. Kiranyaz, L. Eren, M. Askar, and M. Gabbouj, “Real-Time Motor Fault Detection by 1-D Convolutional Neural Networks,” IEEE Transactions on Industrial Electronics, vol. 63, no. 11, pp. 7067–7075, 2016.
[5] E. P. Giri, M. I. Fanany, and A. M. Arymurthy, “Ischemic stroke identification based on EEG and EOG using ID convolutional neural network and batch normalization,” in 2016 International Conference on Advanced Computer Science and Information Systems, ICACSIS 2016, 2017, pp. 484–491.
[6] E. C. Djamal, D. P. Gustiawan, and D. Djajasasmita, “Significant Variables Extraction of Post-Stroke EEG Signal Using Wavelet and SOM Kohonen,” Telkomnika, vol. 17, no. 3, 2019.
[7] E. C. Djamal and Suprijanto, “Recognition of Electroencephalogram Signal Pattern against Sound Stimulation using Spectral of Wavelet,” in Tencon 2011, 2011, pp. 767–771.
[8] R. Hussein, Z. J. Wang, and R. Ward, “L1-Regularization Based EEG Feature Learning for Detecting Epileptic Seizure,” in IEEE Global Conference on Signal & Information Processing (GlobalSIP), 2016, pp. 1171–1175.
[9] G. C. Yong and N. Maan, “EEG Signal of Epileptic Patient by Fast Fourier and Wavelet Transforms,” Jurnal Teknologi (Sciences & Engineering), no. 6, pp. 13–20, 2013.
[10] W. R. W. Omar, Z. Mohamad, R. Jailani, and M. . Taib, “An Analysis of EEG Signal Generated from Ischemic Stroke Patient,” in 2015 Innovation & Commercialization of Medical Electronic Technology Conference (lCMET), 2015, no. November, pp. 74–77.
[11] E. C. Djamal, R. Indrawan, J. Pratama, and F. Renaldi, “EEG Based Neuropsychology of Advertising Video Using Fast Fourier Transform and Support Vector Machine,” Journal of Telecommunication, Electronic and Computer Engineering (JTEC), vol. 9, no. 3, pp. 105–109, 2017.
[12] H. Fadhilah, E. C. Djamal, and R. Ilyas, “Non-Halal Ingredients Detection of Food Packaging Image Using Convolutional Neural Networks,” in The 2018 International Symposium on Advanced Intelligent Informatics (SAIN 2018), 2018.
[13] A. R. Johansen, J. Jin, T. Maszczyk, J. Dauwels, S. S. Cash, and M. B. Westover, “Epileptiform Spike Detection Via Convolutional Neural Networks.,” Proceedings of the IEEE International Conference on Acoustics, Speech, and Signal Processing. ICASSP (Conference), vol. 2016, pp. 754–758, 2016.
[14] S. Tripathi, S. Acharya, R. D. Sharma, S. Mittal, and S. Bhattacharya, “Using Deep and Convolutional Neural Networks for Accurate Emotion Classification on DEAP Dataset.,” in Twenty-Ninth AAAI Conference, 2017, pp. 4746–4752.
[15] Z. Benyu, H. Jiang, and Do. Linshan, “Classification of EGG Signal by WT-CNN Model In Emotion Recognition System,” in IEEE 16th International Conference on Cognitive Informatics & Cognitive Computing (ICCI*CC’17), 2017, pp. 109–114.
[16] A. Yayık, Y. Kutlu, and G. Altan, “Deep Learning with ConvNET Predicts Imagery Tasks Through EEG,” 2019.
[17] M. Murugappan and M. Subbulakshmi, “Human Emotion Recognition Through Short Time Electroencephalogram ( EEG ) Signals Using Fast Fourier Transform ( FFT ),” in International Colloquium on Signal Processing and its Applications, 2013, pp. 8–10.
[18] K. V Gladun, “Laugh and Crying Perception in Patients with Severe and Moderate TBI using FFT Analysis,” in 2017 IEEE 30th International Symposium on Computer-Based Medical Systems, 2017, pp. 123–126.
[19] Meenakshi, R. K. Singh, and A. K. Singh, “Frequency Analysis of Healthy & Epileptic Seizure in EEG using Fast Fourier Transform,” International Journal of Engineering Research and General Science, vol. 2, no. 4, pp. 683–691, 2014.
[20] Y. Di, X. An, S. Liu, F. He, and D. Ming, “Using Convolutional Neural Networks for Identification Based on EEG Signals,” in 2018 10th IEEE International Conference on Intelligent Human-Machine Systems and Cybernetics (IHMSC), 2018, vol. 2, pp. 119–122.
[21] H. K. Lee and Y. S. Choi, “A Convolution Neural Networks Scheme for Classification of Motor Imagery EEG Based on Wavelet Time-Frequecy Image,” International Conference on Information Networking, vol. 2018-Janua, pp. 906–909, 2018.
[22] P. D. Thirumala, K. Thiagarajan, S. Gedela, D. J. Crammond, and J. R. Balzer, “Diagnostic accuracy of EEG changes during carotid endarterectomy in predicting perioperative strokes,” JOURNAL OF CLINICAL NEUROSCIENCE, 2015.
[23] D. George, X. Xie, and G. K. L. Tam, “3D mesh segmentation via multi-branch 1D convolutional neural networks,” Graphical Models, vol. 96, no. January, pp. 1–10, 2018.
[24] D. P. Kingma and J. Ba, “Adam: A Method for Stochastic Optimization,” in ICLR 2015, 2014, pp. 1–15.
[25] M. D. Zeiler, “ADADELTA: An Adaptive Learning Rate Method.” 2012.
Proc. EECSI 2019 - Bandung, Indonesia, 18-20 Sept 2019
23