Detecting Vortex Formation and Shedding in Cylinder Wakes using Lagrangian Coherent...
21
* † ‡ Q Re ∇ u * † ‡
Transcript of Detecting Vortex Formation and Shedding in Cylinder Wakes using Lagrangian Coherent...

Detecting Vortex Formation and Shedding in Cylinder
Wakes using Lagrangian Coherent Structures
Matthew P. Rockwood∗
Syracuse University, Syracuse, NY, 13244
Kunihiko Taira†
Florida State University, Tallahassee, Florida 32310
Melissa A. Green‡
Syracuse University, Syracuse, NY, 13244
The wake behind a circular cylinder is studied to investigate the complex vortex shedding
physics in the near-wake region. Both the Q criterion and a Lagrangian coherent structure
(LCS) analysis are applied to ow elds acquired from a numerical simulation as well
as from experimental particle image velocimetry (PIV) to determine the properties of
the wake. A rate-of-strain lter is applied to the nite-time Lyapunov exponent (FTLE)
eld to lter out ridges corresponding to local shear, and yields ridges along which uid
trajectories separate hyperbolically. This strain lter reveals a sudden loss of hyperbolicity
along an LCS as a new vortex begins to form. The LCS are also shown to identify and
track topological Lagrangian saddle points in the cylinder near wake. This information
characterizes the behavior of the vortices as they form, shed, and convect downstream.
In particular, a Lagrangian saddle point is observed to remain attached to the cylinder
surface until the vortex separates and then consequently accelerates downstream with a
similar track in both numerical and experimental results. The present approach provides
a novel criterion for the identication of vortex shedding.
Nomenclature
Re Reynolds Number
∇ Gradient function
u Velocity vector
∗Ph.D. Student, Mechanical and Aerospace Engineering Department, Syracuse University, AIAA Student Member.†Assistant Professor, Mechanical Engineering Department, Florida State University, AIAA Senior Member.‡Assistant Professor, Mechanical and Aerospace Engineering Department, Syracuse University, AIAA Senior Member.
1 of 21
American Institute of Aeronautics and Astronautics

S Rate of strain tensor
Ω Rate of rotation tensor
x Location vector
T Shedding period
τ Integration time
στ Coecient of expansion
λmax Maximum matrix eigenvalue
n Normal vector
D Cylinder diameter
I. Introduction
The wake behind a circular cylinder is a canonical ow that has implications in the control of vortex
shedding from a variety of blu bodies. At low Reynolds numbers based on cylinder diameter (Re > 47)
an unsteady wake develops behind the circular cylinder due to instabilities in the separation bubble that
result in periodic shedding of vortices in a 2S pattern, or von Kármán vortex street.1 This vortex shedding
results in oscillating uid forces being experienced by the cylinder that lead to the risk of problems related
to structural fatigue.2,3
At Reynolds numbers below the critical value of 47, a steady separation bubble forms in the wake of the
cylinder. As the Reynolds number increases beyond 47, the transition to the unsteady wake occurs. The
physical mechanism that brings about this change has been analyzed and discussed thoroughly in previous
studies. The formation of a vortex behind the cylinder at Reynolds numbers below 350 is attributed to
the presence of high shear near the base of the cylinder along with the induced velocity eld caused by the
momentum decit.4 As the vortex grows, its induced velocity begins to pull uid from the opposite shear
layer towards the vortex core.5 Since this uid is from the opposite shear layer, it has opposite vorticity
and causes the vortex to push away from the cylinder. Once it begins to move downstream, it no longer has
access to the strong shear that formed it, so the vortex strength no longer increases. Inside the separation
bubble, vortex sheets undergo multiple folds that eventually lead to the vortex roll-up.6 It was later found
that an absolute instability in the near wake creates a self-sustaining motion of uid just behind the cylinder
that allows the uid to enter the separation bubble in an alternating periodic manner.7 This absolute
instability determines the shedding frequency of the vortices by controlling the rate at which the uid enters
the separation bubble. The interaction between the two sides of the cylinder wake was further studied by
placing a small control cylinder in the shear layer on one side of the wake.8 When the small cylinder was
placed correctly at Reynolds numbers below 100 the shear layer interactions were inhibited in the wake just
2 of 21
American Institute of Aeronautics and Astronautics
downstream of the main cylinder, and the vortex shedding was eectively eliminated. Similarly, a numerical
study of a constricted channel ow proposed that a wave instability leads to the amplication of the pressure
gradient leading to vortex splitting, and eventually vortex shedding.9
In the past couple of decades, an increasing number of studies have been focused on stability analysis
of the cylinder wake. A low-dimensional dynamical system approach using an incompressible potential ow
model of the cylinder wake10 found that vorticity perturbations introduced anywhere on the symmetry line
in a steady wake (Re < 48) decayed, but vorticity perturbations introduced on the symmetry line outside of
the separation bubble grew and caused the transition to the unsteady vortex street if the Reynolds number
was above 48. A numerical study that looked for the mechanism that sustains the wake oscillation at
Reynolds number above the critical value found that any small, localized disturbance propagated both up
and downstream. When the disturbance reached the cylinder, it caused oscillation in the separation bubble
leading to the global instability.11 The receptivity of the cylinder wake was also examined in detail with
structural stability analysis.12 Stability analyses such as these are useful for determining the mechanism
that dominates the unsteady shedding.
Many research groups have recently explored controlling the shedding o a circular cylinder with active or
passive ow control techniques. The use of synthetic jets13 at Reynolds numbers of 500 and 3900 both showed
a reduction in drag coecient by approximately 12%. Low power electrohydrodynamic actuators were shown
to have a signicant eect on the qualitative structure of the wake at Re = 2500, but at Reynolds numbers
of the order of 50,000 they had a small eect on the time-averaged separation location.14 By attaching
longitudinally oriented o-rings to the cylinder,15 a drag reduction of 9% was realized at Re = 120, 000. This
drag reduction was thought to be due to the elongation of the vortex formation region. The addition of v-cut
microgrooves to the cylinder surface16 created a 7.6% drag reduction at Re = 3600, but a 4.2% drag increase
at Re = 36, 000. Dielectric barrier discharge plasma actuators were used to demonstrate a drag reduction
of 32% at Re = 15, 000, but required 50 times more power than was conserved from drag reduction.17 A
combination of suction and blowing was numerically shown18 to eectively eliminate the oscillatory forces
on the cylinder at Reynolds numbers up to 1000. While several techniques at low Reynolds numbers have
shown adequate control of vortex shedding, the techniques require a signicant amount of power, lose their
eectiveness, or cost too much to implement in most practical applications at Re = O(105 − 109). The goal
of the current research is to obtain a dierent representation of the ow that could lead to the development
of a system that adequately controls the unsteady shedding at a reasonable power requirement for a range
of parameters.
Previous attempts to determine the coherent vortex structures in the wake primarily used Eulerian
techniques, which are based on the instantaneous velocity eld and its gradient.19,20 The term coherent
3 of 21
American Institute of Aeronautics and Astronautics

structures was rst used by Brown and Roshko21 to describe regions in a turbulent mixing layer that exhibited
coherence over a reasonable length of time. In our current work, the vortices shed from a circular cylinder
are the coherent structures present so the terms are used interchangeably. In this paper, the Eulerian Q
criterion22 is compared with the nite-time Lyapunov exponent (FTLE) eld,23 a Lagrangian quantity that
is calculated using integrated particle trajectories, and from which we extract Lagrangian coherent structures
(LCS). An LCS analysis uncovers the transport boundaries where particles separate hyperbolically in the
ow, and the analysis presented here includes a rate-of-strain lter to eliminate regions of high shear from the
LCS identication process.24 Some applications of LCS analysis include the study of unsteady wakes behind
a pitching panel,25 non-axisymmetric vortex rings,26 oceanic eddies,27 cardiovascular ows,28 uid transport
of translating and apping wings,29 and hurricanes.30 An extensive review of LCS was written by Haller.31
Combined with a closed-loop control scheme, inclusion of an LCS analysis in a combustion ow control
application increased mixing in simulated ow around a square cylinder.32 In that work, wall-tangential
velocity sensors were correlated with the characteristics and behavior of the local LCS, and wall-tangential
velocity actuators were driven to increase the LCS interaction in the downstream wake. The current study
is attempting to gain the understanding of a canonical blu body shedding ow that would be necessary to
apply similar strategies to alter the dynamics of shedding.
In general, an LCS analysis yields co-dimension one structures in a ow eld. These structures correspond
to lines and surfaces in two and three-dimensional ows, respectively. By implementing the analyses in
specic ways, both attracting and repelling manifolds are obtained. The work presented in this paper
primarily focuses on the behavior of topological Lagrangian saddle points, identied as intersections of
these attracting and repelling lines in the two-dimensional cylinder wake. The current study analyzes the
dynamics of vortex-bounding Lagrangian saddle points using data from both a numerical simulation and
experiments. While the two data sets are not matched in Reynolds number, the saddle point dynamics
are the same in both cases. Lagrangian saddle point dynamics have also been shown to be present and
important in three-dimensional turbulent ows, and the emergence of saddles was shown to accompany the
birth of secondary hairpin vortices in a turbulent channel DNS.33 LCS saddles have been used to develop
generalized vortex tracking techniques, and vortex wake breakdown has been observed to accompany the
merging of two independent saddles in an LCS analysis of PIV data in the wake of a bio-inspired pitching
panel or airfoil.25,34,35 The work presented here demonstrates the potential for robust methods of tracking
LCS saddle points to identify the formation and shedding of coherent structures in general blu body ows,
as opposed to the standard Eulerian analyses that may suer from the velocity eld noise that is common
with experimentally-acquired data.
4 of 21
American Institute of Aeronautics and Astronautics
II. Method
A. Eulerian Q Criterion
The Eulerian criterion employed in the present study is the Q criterion proposed by Hunt et al.22 Several
other criteria have been used in similar analyses previously (∆,36 λ2,37 Γ1
38), but do not yield distinctly
dissimilar results, and Q is chosen for presentation here for simplicity and for consistency with other similar
studies in the literature. The velocity gradient tensor can be decomposed into the symmetric rate of strain
tensor, S, and the anti-symmetric rate of rotation tensor, Ω:
∇u = S+Ω, (1)
where S = 12 [∇u + (∇u)T ] and Ω = 1
2 [∇u − (∇u)T ]. The Q value is dened as the relative dierence
between the magnitude of the rate of rotation and strain tensors (and is the second invariant of the rate of
deformation tensor):
Q =1
2[||Ω||2 − ||S||2], (2)
where ||Ω|| represents the Euclidean (Frobenius) norm of Ω. Locations in the ow with positive Q values
are dened as vortices using this criterion, as they contain local rotational motion.
While the Q criterion is Galilean invariant, or unaected by translations of the frame of reference, it can
lead to misrepresentation of vortices when there are rotating or accelerating frames of reference. While this
is not the case in the current example, it does aect the broader applicability of any derived identication
and tracking schemes. This criterion can nd vortex cores eectively in non-accelerating frames, but even
then a subjective threshold such as a percentage of the maximum value across all times is often dened as
the boundary of the vortex in practical implementation. This is especially true in noisier experimental data
sets and three-dimensional ows.
B. Lagrangian Coherent Structure Analysis
LCS analysis was initially introduced to the uid mechanics community by Haller,23 which extracted La-
grangian coherent structures from the nite-time Lyapunov exponent (FTLE) eld. The ridges of high
FTLE indicate candidate material lines in the ow where particle trajectories diverge in time. The ridges
have been used eectively to mark the transport boundaries in a given ow eld. This is in contrast to more
recent work that locates elliptic LCS, which can be described as the boundaries of coherent sets of uid that
make up vortices.39 For this work, the analysis code that was originally developed by Green et al.24 was
used to generate the FTLE elds from which the LCS are extracted. In order to calculate an FTLE eld,
5 of 21
American Institute of Aeronautics and Astronautics
particle tracers must be tracked for a nite amount of time, for which velocity data for the spatial domain
and temporal range of interest must be available. At a given instant of time (t0), a ne grid of particle
trajectories is initialized in the domain (x) and are advected forward in time using a fourth-order Runge
Kutta integrator. With x(x0, t0, τ) dened as the uid trajectory locations at time τ that were initialized
at (x0, t0), the FTLE value is dened on x as:
FTLEτ (x0, t0) =1
2τlogστ (x0, t0), (3)
where the coecient of expansion, στ , is the largest eigenvalue of the Cauchy-Green strain tensor dened as:
στ (x0, t0) = λmax
([∂x(t0 + τ,x0, t0)
∂x0
]∗ [∂x(t0 + τ,x0, t0)
∂x0
]). (4)
Here, ∗ indicates the matrix transpose.
At each point in space, FTLE is a scalar measure of the maximum rate of separation over an integration
time τ between two particles that were initially separated by a nitely small distance near that point. If
a group of particles travel together, for example in a uniform ow, the local FTLE value is very small. If
the two particles are on either side of a hyperbolic LCS, their trajectories will hyperbolically repel over
time, causing the local FTLE value to be high. The FTLE scalar eld is calculated on the grid of initial
trajectory points, and the regions of large-magnitude positive FTLE create maximizing ridges. We dene
these maximizing ridges as Lagrangian coherent structures, and they are extracted using a xed threshold
of the FTLE values. It is important to note that changing the threshold value for FTLE ridge extraction
does not change the location or shape of the coherent structures identied, only the thickness of the ridges.
The FTLE calculation initialized at time t0 can also be performed by advecting uid trajectories in
negative time. Regions of large magnitude negative-time FTLE will indicate ridges that are attracting
ow at time t0, as uid trajectories that stretch apart when integrated in negative time are attracted to
a local region when advected in positive time. Therefore, if the values are integrated in both positive and
negative (forward and backward) time, both repelling FTLE ridges (pLCS) and attracting FTLE ridges
(nLCS) at initial time t0 can be extracted using the maximum eigenvalues of the two dierent Cauchy
Green strain tensors. For both positive- and negative-FTLE, the scalar elds are dened at t0, and those
scalar elds indicate the current ow attraction and repulsion, and are therefore representative of the current
ow topology. To calculate the FTLE elds at a later time, for example at the next phase of velocity data
t1, a new grid of trajectories initialized at t1 are calculated. Others have used the composition of trajectory
information,40 have advected LCS ridges,41 and have used both the maximum and minimum eigenvalues of
the CauchyGreen strain tensor42 to enable an increase in the eciency of computing many FTLE elds in
6 of 21
American Institute of Aeronautics and Astronautics

a certain time range. These attracting and repelling ridges in the ow are used to outline the ow structures
by showing the transport boundaries between distinct vortices and the free stream. As the Q criterion only
visualizes the vortex cores, the ability to identify the transport boundaries objectively provides additional
insight into the vortex dynamics, especially when studying the interactions among coherent structures.
The FTLE has been demonstrated to be robust to velocity eld errors that are small in magnitude or
short in duration.43 Having poor spatial or temporal resolution can have a negative eect on the exact LCS
location in some cases, but the mean location of the LCS is not aected.44 In the present study, we apply a
rate-of-strain lter on the FTLE ridges to ensure that only those with hyperbolically attracting or repelling
behavior, as is expected at coherent structure boundaries, are captured and not those that indicate shear
strain.43,45 The lter was applied to each time set of LCS independently and is dened using the inner
product of the rate of strain and the LCS normal vector as:
〈n(t0,x0),S(t0,x0)n(t0,x0)〉 ≷ 0, (5)
where 〈·, ·〉 is the vector inner product and n(t0,x0) is the normal vector to the LCS. LCS are considered
hyperbolically attracting or repelling if this lter is positive for pFTLE ridges or negative for nFTLE ridges.
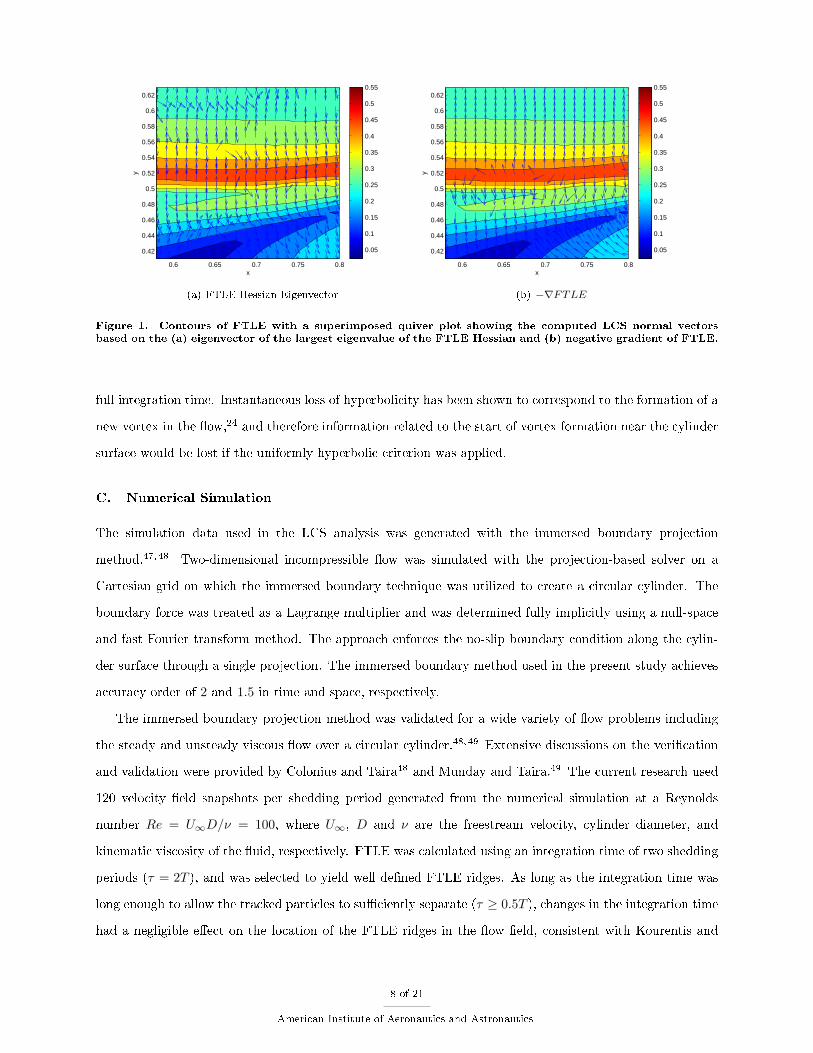
The normal vector was calculated as the eigenvector associated with the maximum eigenvalue of the
Hessian matrix of the scalar FTLE eld. This corresponds to the direction of maximum curvature. Using
the eigenvector of the Hessian is a noisy technique that can result in errors in the rate-of strain calculation.
This is visible in later gures by the speckled appearance along some portions of the LCS after the rate-
of-strain lter is applied. An example of the normal vectors used is shown in gure 1(a), and the negative
gradient of FTLE is shown for reference in gure 1(b). The gradient works well in the majority of the ow,
but fails to nd the normal vector when the points fall very close to the peaks of the FTLE ridge. Since we
are specically interested in the results close to the FTLE ridges, the gradient technique is not used. The
eigenvector of the Hessian better captures the normal vectors in the near-ridge region, but occasionally has
large errors, for example in the region near (x, y) = (0.65, 0.55). It is worth noting that the normal vectors
are not required to be outward normal, as we are evaluating an inner project of n with itself, weighted by S
in equation 5. In general, the eigenvector of the Hessian performs well enough to accentuate the dierence
between a hyperbolic LCS or a shear LCS.
While determining the FTLE eld requires a Lagrangian calculation, each FTLE eld represents the
current topology. Therefore, by applying the rate-of-strain lter to the FTLE ridges at the time they are
valid, it ensures that the FTLE ridges are exhibiting hyperbolic repulsion (along pLCS), or hyperbolic
attraction (along nLCS). This technique was applied instead of the uniformly hyperbolic criterion that has
been applied by Olascoaga and Haller46 that further restricts LCS by requiring they be hyperbolic for the
7 of 21
American Institute of Aeronautics and Astronautics
x
y
0.6 0.65 0.7 0.75 0.8
0.42
0.44
0.46
0.48
0.5
0.52
0.54
0.56
0.58
0.6
0.62
0.05
0.1
0.15
0.2
0.25
0.3
0.35
0.4
0.45
0.5
0.55
(a) FTLE Hessian Eigenvector
x
y
0.6 0.65 0.7 0.75 0.8
0.42
0.44
0.46
0.48
0.5
0.52
0.54
0.56
0.58
0.6
0.62
0.05
0.1
0.15
0.2
0.25
0.3
0.35
0.4
0.45
0.5
0.55
(b) −∇FTLE
Figure 1. Contours of FTLE with a superimposed quiver plot showing the computed LCS normal vectorsbased on the (a) eigenvector of the largest eigenvalue of the FTLE Hessian and (b) negative gradient of FTLE.
full integration time. Instantaneous loss of hyperbolicity has been shown to correspond to the formation of a
new vortex in the ow,24 and therefore information related to the start of vortex formation near the cylinder
surface would be lost if the uniformly hyperbolic criterion was applied.
C. Numerical Simulation
The simulation data used in the LCS analysis was generated with the immersed boundary projection
method.47,48 Two-dimensional incompressible ow was simulated with the projection-based solver on a
Cartesian grid on which the immersed boundary technique was utilized to create a circular cylinder. The
boundary force was treated as a Lagrange multiplier and was determined fully implicitly using a null-space
and fast Fourier transform method. The approach enforces the no-slip boundary condition along the cylin-
der surface through a single projection. The immersed boundary method used in the present study achieves
accuracy order of 2 and 1.5 in time and space, respectively.
The immersed boundary projection method was validated for a wide variety of ow problems including
the steady and unsteady viscous ow over a circular cylinder.48,49 Extensive discussions on the verication
and validation were provided by Colonius and Taira48 and Munday and Taira.49 The current research used
120 velocity eld snapshots per shedding period generated from the numerical simulation at a Reynolds
number Re = U∞D/ν = 100, where U∞, D and ν are the freestream velocity, cylinder diameter, and
kinematic viscosity of the uid, respectively. FTLE was calculated using an integration time of two shedding
periods (τ = 2T ), and was selected to yield well dened FTLE ridges. As long as the integration time was
long enough to allow the tracked particles to suciently separate (τ ≥ 0.5T ), changes in the integration time
had a negligible eect on the location of the FTLE ridges in the ow eld, consistent with Kourentis and
8 of 21
American Institute of Aeronautics and Astronautics
Konstantinidis,50 and Bourgeois et al.51
The computational domain was discretized with multiple levels of grid renement by having ve nested
grids. The overall size of the computational domain was set to (x/D, y/D) ∈ [−31, 33] × [−32, 32]. Along
the far-eld boundary, uniform ow was specied and the spatial setup has been veried to ensure that the
near-eld solution was not aected. For the considered Reynolds number, grid size of ∆x/D = 0.02 was
used in the vicinity of the cylinder. The time step was selected so that the CFL number based on the nest
spatial grid and the maximum velocity throughout the simulation was less than 0.5.
D. Experimental Setup
Particle image velocimetry (PIV) experiments were conducted in a water tunnel with a 0.6 m × 0.6 m × 2.4
m test section. A cylinder diameter of 60 mm was used, at a free stream speed of 150 mm/s, which resulted
in an experimental Reynolds number of 9000. The observed von Kármán vortex shedding frequency was
0.53 Hz, which corresponded to a Strouhal number of 0.21 using the cylinder diameter as the wake width.
Dantec polyamid particles with a diameter of 20 µm were used to seed the ow, and a Gemini Nd-Yag 200-15
laser was used to illuminate the ow in a single spanwise-constant plane. Two 1.3 megapixel HiSense PIV
cameras were used to capture the images at a rate of 4.0 Hz. Each camera had a measurement window
of 1280 × 1024 px with a spatial resolution of 4.8 px/mm, which provided a eld of view of approximately
267× 213 mm. An interrogation window size of 16× 16 px was used with an overlap of 50%. This yielded a
grid spacing of 8 px or 1.7 mm which is about 0.03D. 3000 image pairs were captured by the two cameras
simultaneously, and the resulting instantaneous velocity vector elds were stitched together by bilinearly
interpolating onto a common grid encompassing both domains. The cameras were then moved to a location
further downstream to increase the total eld of view, and the process was repeated. The stitched velocity
elds at each downstream location were phase-averaged into 18 phases per period using the static pressure
signal collected at 70 degrees from the upstream stagnation point to increase the temporal resolution of the
data for the Lagrangian calculations. The phase-averaged results were then stitched together which resulted
in a full eld of view of 590 × 193 mm. The pressure tap location was chosen to ensure the signal was
dominated by the von Kármán vortices, and therefore was located upstream of the separation point.52 The
static pressure was collected using an Omega PX409 wet-dry dierential pressure transducer and a National
Instruments PXIe DAQ system. While the experimental cylinder ow at Re = 9000 is three dimensional,
recent work has shown that planar FTLE calculations are not aected by the three-dimensionality of the
ow when the vortex is nearly perpendicular to the PIV plane.53
Due to limitations in tunnel speed and cylinder diameter, Reynolds number matching between the avail-
able simulation results and the experiments was not possible. The results are qualitatively similar as the
9 of 21
American Institute of Aeronautics and Astronautics

fundamental processes dominating the vortex shedding are not expected to change over this range of Reynolds
numbers.
Figure 2. nLCS (red), pLCS (blue), and Q criterion (grey contours, % of global maximum) for Re = 100.
III. Results
For the purposes of this paper, FTLE and Q criterion were calculated at twelve instants of time that
span one period of fully-developed vortex shedding in the numerical data. Figure 2 is an example of the
full numerical LCS at the rst phase before the rate-of-strain lter is applied. The colorbar displayed is
for the Q criterion, and is the same for all subsequent gures representing the simulation data. All images
display the LCS as FTLE values greater than 67% of the maximum FTLE value. An integration time of two
shedding periods was used for all FTLE calculations with an integration time step of 0.005T in the numerical
calculation and 0.06T in the experimental calculation. The box in gure 2 displays the region that will be
analyzed subsequently in more detail. In each of the gures the nLCS (attracting material lines) are shown
in red, the pLCS (repelling material lines) are shown in blue, and the contours of Q (vortex cores) are shown
in shades of grey, with darker grey indicating higher Q magnitude. All regions with positive Q are included,
and were scaled to clearly display regions with even low magnitude Q values. This allows us to observe the
earliest possible Eulerian vortex formation process behind the cylinder.
As seen in gure 2, the LCS successfully outline the transport boundaries at the edges of the vortices in
the cylinder wake. The Q criterion and the LCS are in agreement on the locations of the shed vortices, with
the LCS clearly wrapping around the vortex cores highlighted by the Q criterion. By using the LCS to more
closely analyze the ow just behind the cylinder, we gain insight into the shedding process.
A. Identication of Vortex Formation via nLCS Inection and Loss of Hyperbolicity
Figure 3 displays the LCS evolution in the near wake without the rate-of-strain lter applied in rows one
and three, and with the rate-of-strain lter applied in rows two and four. The images in gures 34 span
one period of vortex shedding (T ) in steps of T/12. The image frame is centered on the top half of the wake
10 of 21
American Institute of Aeronautics and Astronautics
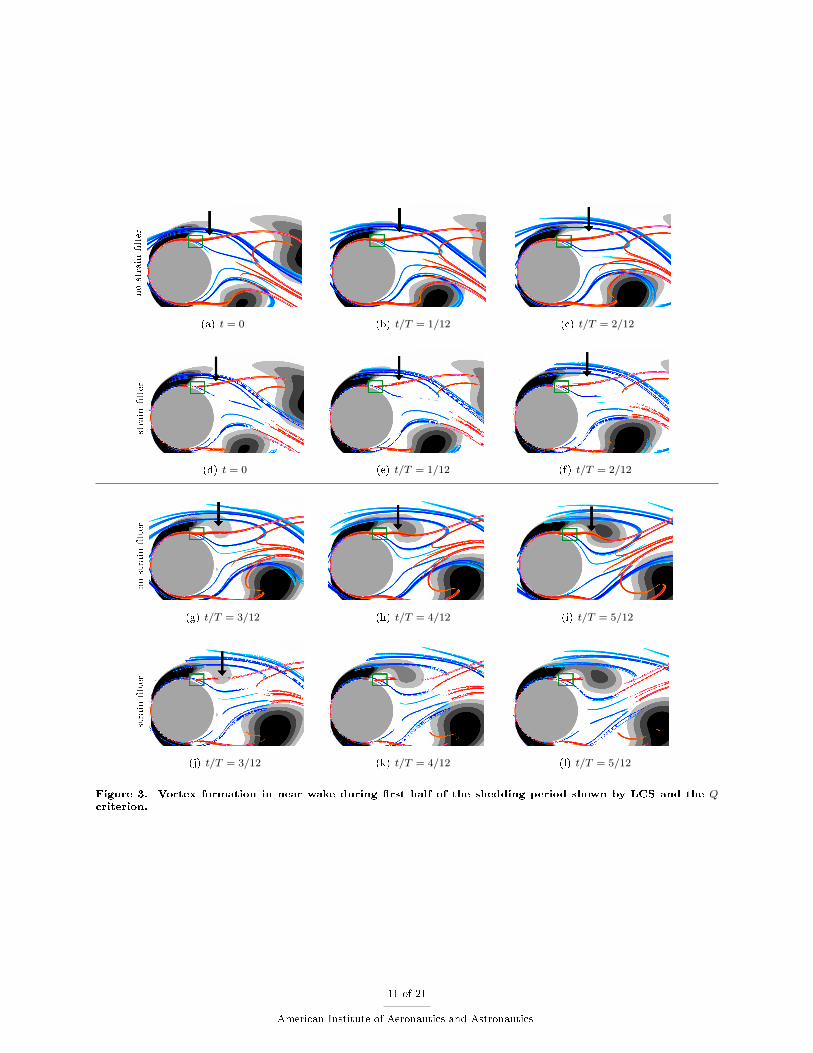
nostrain
lter
(a) t = 0 (b) t/T = 1/12 (c) t/T = 2/12
strain
lter
(d) t = 0 (e) t/T = 1/12 (f) t/T = 2/12
nostrain
lter
(g) t/T = 3/12 (h) t/T = 4/12 (i) t/T = 5/12
strain
lter
(j) t/T = 3/12 (k) t/T = 4/12 (l) t/T = 5/12
Figure 3. Vortex formation in near wake during rst half of the shedding period shown by LCS and the Qcriterion.
11 of 21
American Institute of Aeronautics and Astronautics
nostrain
lter
(a) t/T = 6/12 (b) t/T = 7/12 (c) t/T = 8/12
strain
lter
(d) t/T = 6/12 (e) t/T = 7/12 (f) t/T = 8/12
nostrain
lter
(g) t/T = 9/12 (h) t/T = 10/12 (i) t/T = 11/12
strain
lter
(j) t/T = 9/12 (k) t/T = 10/12 (l) t/T = 11/12
Figure 4. Vortex formation in near wake during second half of the shedding period shown by LCS and the Qcriterion.
12 of 21
American Institute of Aeronautics and Astronautics

to focus on the formation of the single clockwise-rotating (CW) structure from the top side of the cylinder
surface. The dark grey region (high Q) exiting the eld of view downstream of the cylinder in gure 3(a)
is the vortex that was shed from the top of the cylinder in the previous period. The region of high Q at
the bottom center of the gure 3(a) is the counter-clockwise (CCW) vortex that formed at the bottom of
the cylinder in the previous half-period. The cylinder is indicated by the grey circular region in the left half
of each frame, as neither LCS nor Q is detected in this region. The black arrow in gure 3(a) and each
subsequent gure highlights the region along the top of the cylinder where the next CW vortex will form.
One thick and one thin pLCS (blue, repelling ridges) in gure 3(a) separate the near wake region from
the vortex shed in the previous period. In gure 3(b), the thicker pLCS ridge breaks into two structures, and
both begin to travel downstream with the shed vortex while the upstream, thin branch stays closer to the
cylinder and begins to outline the region in which the next CW vortex will begin to form (highlighted by a
black arrow). Meanwhile, an inection point appears along the nLCS (red), begins to pinch up in gure 3(g),
and then breaks apart and wraps around the newly forming vortex starting in gure 4(b) (also highlighted
by the black arrow).
Also shown are the nLCS and pLCS ltered using equation 5. Of particular interest is the nLCS near
the core of the developing vortex, in the time between gures 3(f) and 3(j). At earlier times, the nLCS
extends from the cylinder surface intact. At the time the CW vortex begins to form (gure 3(j)), a clear
break occurs along the nLCS (shown by a black arrow), which coincides with the emergence of positive Q
criterion. This breaking of the nLCS depicts the loss of hyperbolic particle attraction along that segment
of the nLCS ridge, and is even easier to identify than the change of nLCS curvature (inection point). The
gap along the ridge, indicating a loss of hyperbolic attraction, is necessary for the entrainment and rotation
of uid in this region.
In this particular simulation, the formation of the new CW vortex is observable at the same time and
location with FTLE and with the Q criterion; a light grey region extending from the cylinder surface is
clearly seen in the same region as the nLCS inection point in gure 3(g). It is important to note, however,
that in velocity data measured from experiments, an isosurface of 1% Qmax or 10% Qmax is more commonly
used to avoid errors in vortex identication due to noise. The evolution of the pLCS and nLCS makes it
possible to identify vortex formation from the data earlier in the time series than it is observable using Q in
more general applications.
Experimental results at Re = 9000 for a portion of the shedding period are shown in gure 5. The
colorbar displayed in gure 5(b) is for the Q criterion, and is the same for each subgure. All images display
the LCS as FTLE values greater than 67% of the maximum FTLE value. A threshold of 1% Qmax was
used to highlight the vortex cores, while removing some of the erroneous regions caused by noise in the
13 of 21
American Institute of Aeronautics and Astronautics
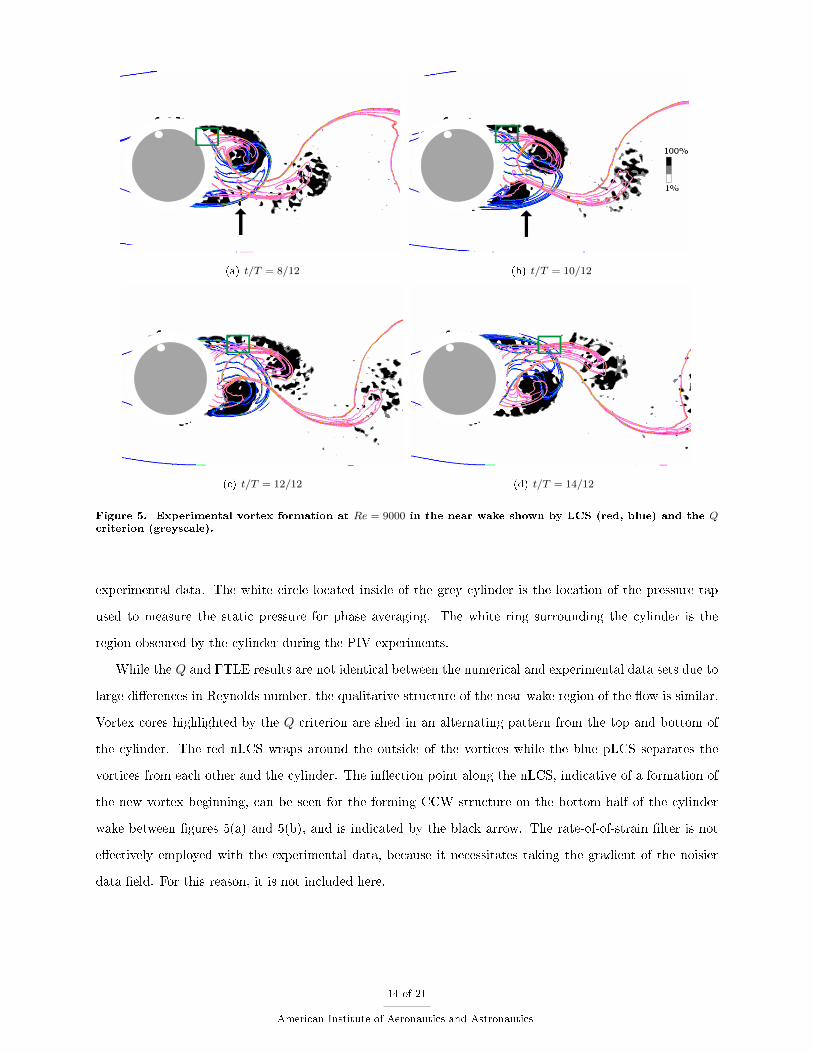
(a) t/T = 8/12 (b) t/T = 10/12
(c) t/T = 12/12 (d) t/T = 14/12
Figure 5. Experimental vortex formation at Re = 9000 in the near wake shown by LCS (red, blue) and the Qcriterion (greyscale).
experimental data. The white circle located inside of the grey cylinder is the location of the pressure tap
used to measure the static pressure for phase averaging. The white ring surrounding the cylinder is the
region obscured by the cylinder during the PIV experiments.
While the Q and FTLE results are not identical between the numerical and experimental data sets due to
large dierences in Reynolds number, the qualitative structure of the near-wake region of the ow is similar.
Vortex cores highlighted by the Q criterion are shed in an alternating pattern from the top and bottom of
the cylinder. The red nLCS wraps around the outside of the vortices while the blue pLCS separates the
vortices from each other and the cylinder. The inection point along the nLCS, indicative of a formation of
the new vortex beginning, can be seen for the forming CCW structure on the bottom half of the cylinder
wake between gures 5(a) and 5(b), and is indicated by the black arrow. The rate-of-of-strain lter is not
eectively employed with the experimental data, because it necessitates taking the gradient of the noisier
data eld. For this reason, it is not included here.
14 of 21
American Institute of Aeronautics and Astronautics
B. Vortex Shedding Identication via Saddle Point Tracking
Since the nLCS and pLCS are attracting and repelling lines in these two-dimensional examples, their in-
tersections can be considered topological saddle points in the ow. Following the saddles associated with
particular vortices has been shown to provide additional information about vortex wake evolution such as
the locations of vortex boundaries and where vortex wake structures break down.24 In the current work
on vortex shedding from a cylinder, each newly forming vortex has an associated saddle point at the lo-
cation where the nLCS we have discussed so far meets the cylinder surface, highlighted with a green box
in gures 34. As time progresses, both the blue pLCS and the saddle point eventually lift o and detach
from the cylinder surface and move with the fully formed CW vortex downstream. Notably, the observed
saddle point dynamics are not aected by the rate-of-strain lter, proving that they are indeed structures in
regions of hyperbolically attracting and repelling trajectories, and are dynamically robust against ow eld
perturbations that disrupt gradient-based methods, such as the Q criterion.
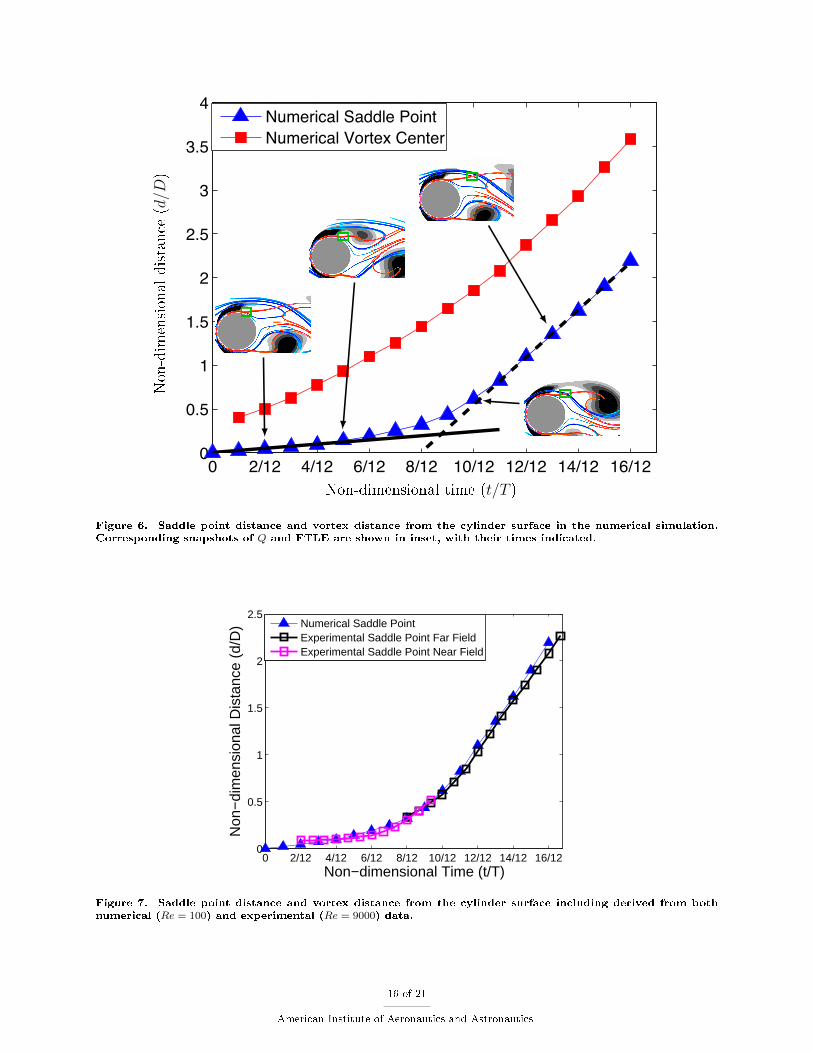
The location of the vortex center and the saddle point are tracked in space as shown in gures 6 and
7. The center of the vortex (red squares) is taken as the location with the maximum value of Q, and the
saddle point location (blue triangles) is the center of the saddle point. The distance (d/D) is measured to
a stationary location on the cylinder surface, which was closest to the initial saddle point location, and is
non-dimensionalized by the cylinder diameter. Figure 6 was generated using the same set of data used in
gures 34.
When considering the saddle point distance traveled from the cylinder surface, it can be inferred that
there are three dierent phases that make up the vortex shedding process. The rst phase is during the vortex
formation that occurs between 0 and approximately 1/2 of a period. In this time frame (corresponding to
gure 3(a) to gure 3(i)) the vortex is forming behind the cylinder and the saddle point moves downstream
only slightly as the vortex grows in size. In this phase of vortex shedding, the saddle point track is nearly
horizontal as indicated by the solid black line in gure 6. The structure then separates from the cylinder
between t/T = 5/12 and t/T = 11/12 (gure 4(a) to gure 4(i)). This is apparent in gure 6 as the saddle
point accelerates away from the cylinder surface until reaching a constant velocity around t/T = 11/12, as
indicated by the dashed line in gure 6. At this point, the vortex is separated completely from the cylinder
surface, and both the vortex and the saddle point move downstream at a nearly constant convection speed
that is roughly 60% of the free stream velocity.
In the track of the vortex core as identied by location of maximum Q value (red squares), there is no
clear change in the core trajectory between the times when the vortex is forming, and when it sheds. There
is a slight increase in downstream velocity (as indicated by increased slope in gure 6), but this change is
gradual, and cannot be used to identify a shedding time.
15 of 21
American Institute of Aeronautics and Astronautics
0 2/12 4/12 6/12 8/12 10/12 12/12 14/12 16/120
0.5
1
1.5
2
2.5
3
3.5
4
Non−dimensional Time (t/T)
Non−d
imen
sion
al D
ista
nce
(d/D
)
Numerical Saddle PointNumerical Vortex Center
Non-dimensional time (t/T )
Non-dim
ensional
distance
(d/D
)
Figure 6. Saddle point distance and vortex distance from the cylinder surface in the numerical simulation.Corresponding snapshots of Q and FTLE are shown in inset, with their times indicated.
0 2/12 4/12 6/12 8/12 10/12 12/12 14/12 16/120
0.5
1
1.5
2
2.5
Non−dimensional Time (t/T)
Non
−di
men
sion
al D
ista
nce
(d/D
)
Numerical Saddle PointExperimental Saddle Point Far FieldExperimental Saddle Point Near Field
Figure 7. Saddle point distance and vortex distance from the cylinder surface including derived from bothnumerical (Re = 100) and experimental (Re = 9000) data.
16 of 21
American Institute of Aeronautics and Astronautics

Figure 7 displays the distance from the saddle point to the cylinder surface for both the numerical and
experimental datasets. The timing of the numerical and experimental data sets were matched by visually
comparing the scaled downstream wake organization. While there may be small errors associated with the
precise timing match between the two data sets, the trajectories of the saddle points, highlighted by the green
box in gure 5, is nearly identical. Any change in the phase would only result in a horizontal shift of the
saddle point trajectory curve along the x-axis, not a change in the shape of the trajectory in time. The black
squares in the gure correspond to the experimental data in gure 5, while the pink squares correspond to
a small dataset that was collected specically to resolve the near cylinder region. The experimental location
of the saddle point is nearly identical to the numerical results when normalized by shedding period and
cylinder diameter. The experimental results also show the same three phases of the vortex shedding process,
and have a similar nal convection speed of the vortex.
IV. Discussion and summary
Dynamics of both nLCS (attracting ridges) and pLCS (repelling ridges) in the region of new vortex core
formation have been shown previously in the literature to provide information on the vortex structure of
wakes. In the case of piston generated vortex rings,54 it was observed that the separation of the pLCS
was a precursor to the formation of another discrete vortex in the ow. In the work studying an isolated
hairpin vortex in a fully three-dimensional turbulence DNS,24 the pinch-up of nLCS is similar to that shown
in the current work. In the hairpin vortex case the breaking of the nLCS shown by the strain lter also
corresponded to the onset of uid entrainment into newly forming vortex structures. Other work has used
Lagrangian saddle points and their relation to vortices in a turbulent channel and behind a pitching panel,33
on a pitching wing,35 in ABC ow, and in the draft tube of a Francis water turbine.55 The results presented
here are novel in that we use saddle point tracking in related numerical and experimental data sets in order
to demonstrate the robustness of the method, and its potential in a wide range of applications involving
vortex formation and shedding due to uid-structure interaction.
In the cylinder near wake, the upstream saddle point for each vortex is located on the cylinder surface
while the structure is still forming. Once the saddle point (highlighted with the green box in gures 34) lifts
o the cylinder surface, the vortex begins to move downstream from the cylinder and sheds around t = 5T/12
(gure 3(i)). These saddle points are important since they are consistently observable components of the
ow topology, robust to velocity eld perturbations and noise inherent in experimental data. In the case
considered here, using the point of maximum Q criterion to track the vortex core shows gradual motion away
from the cylinder. This tracking method, which uses the ow eld gradient, would not be reliable in more
error-prone data sets such as the experimental data presented.
17 of 21
American Institute of Aeronautics and Astronautics

The methods used in the current analysis can be applied to a variety of ows and Reynolds numbers as
long as the vortices induce distinct coherent motions in the ow that would be evident in the particle ow
maps. The LCS would then still nd transport barriers near the boundaries of the vortices, and the results
should qualitatively be similar to the current results. One issue that may arise from a large increase in Re
is an appropriate implementation of the method. Higher Re would create a separation of length- and time-
scales of the coherent motions in the ow eld, and a more careful approach regarding ow map integration
time may be needed. If the vortex shedding can be associated with the dynamics of the large-scale structure,
however, a similar implementation should produce similar results.
The current observations provide new insight to the fundamental understanding of vortex formation
and shedding. The positive-time FTLE ridges indicate where ow will diverge by the integration time τ .
Therefore, regions around upstream saddle points could be candidates for further research in order to map
the connection between the LCS dynamics with the observable quantities on the cylinder surface, such as
pressure and velocity. This framework will have implications for unsteady ow modeling and ow control,
exploring the possibility of dictating the behavior of the total ow eld by focusing on the key topological
points uncovered by the LCS analysis.
By incorporating an LCS analysis with well-established Eulerian vortex identication methods (Q cri-
terion), we are able to establish new identication criteria for vortex roll up and shedding in the wake of
a circular cylinder in cross-ow. The LCS analysis is more computationally intensive to calculate, but its
phenomenological nature might lend it to schemes for identifying these physical events automatically from
data with minimal user input and interpretation.
V. Acknowledgements
The authors would like to thank Phillip Munday for his support with the numerical simulation. This
work was supported by the Air Force Oce of Scientic Research under Award No. FA9550-14-1-0210.
References
1Williamson, C. and Roshko, A., Vortex formation in the wake of an oscillating cylinder, Journal of Fluids and Structures,
Vol. 2, No. 4, 1988, pp. 355 381.
2Baarholm, G., Larsen, C., and Lie, H., On fatigue damage accumulation from in-line and cross-ow vortex-induced
vibrations on risers, Journal of Fluids and Structures, Vol. 22, No. 1, 2006, pp. 109 127.
3Tognarelli, M., Taggart, S., and Campbell, M., Actual VIV fatigue response of full scale drilling risers: with and without
suppression devices, Proceedings of the ASME 27th International Conference on Oshore Mechanics and Arctic Engineering,
2008.
4Grin, O. M., A note on blu body vortex formation, Journal of Fluid Mechanics, Vol. 284, 1 1995, pp. 217224.
18 of 21
American Institute of Aeronautics and Astronautics

5Gerrard, J. H., The mechanics of the formation region of vortices behind blu bodies, Journal of Fluid Mechanics,
Vol. 25, 5 1966, pp. 401413.
6Perry, A. E., Chong, M. S., and Lim, T. T., The vortex-shedding process behind two-dimensional blu bodies, Journal
of Fluid Mechanics, Vol. 116, 2 1982, pp. 7790.
7Triantafyllou, G. S., Triantafyllou, M. S., and Chryssostomidis, C., On the formation of vortex streets behind stationary
cylinders, Journal of Fluid Mechanics, Vol. 170, 8 1986, pp. 461477.
8Strykowski, P. J. and Sreenivasan, K. R., On the formation and suppression of vortex `shedding' at low Reynolds
numbers, Journal of Fluid Mechanics, Vol. 218, 8 1990, pp. 71107.
9Boghosian, M. E. and Cassel, K. W., A pressure-gradient mechanism for vortex shedding in constricted channels,
Physics of Fluids, Vol. 25, No. 12, 2013.
10Tang, S. and Aubry, N., On the symmetry breaking instability leading to vortex shedding, Physics of Fluids, Vol. 9,
No. 9, 1997, pp. 25502561.
11Takemoto, Y. and Mizushima, J., Mechanism of sustained oscillations in a uid owing past a circular cylinder obstacle,
Phys. Rev. E , Vol. 82, Nov 2010, pp. 056316.
12Giannetti, F. and Luchini, P., Structural sensitivity of the rst instability of the cylinder wake, Journal of Fluid
Mechanics, Vol. 581, 6 2007, pp. 167197.
13Catalano, P., Wang, M., Iaccarino, G., Sbalzarini, I. F., and Kuomoutsakos, P., Optimization of cylinder ow control
via actuators with zero net mass ux, Center for Turbulence Research, Proceedings of the Summer Program, 2002.
14Artana, G., Sosa, R., Moreau, E., and Touchard, G., Control of the near-wake ow around a circular cylinder with
electrohydrodynamic actuators, Experiments in Fluids, Vol. 35, 2003, pp. 580588.
15Lim, H.-C. and Lee, S.-J., Flow control of a circular cylinder with O-rings, Fluid Dynamics Research, Vol. 35, No. 2,
2004, pp. 107 122.
16Lee, S.-J., Lim, H.-C., Han, M., and Lee, S. S., Flow control of circular cylinder with a V-grooved micro-riblet lm,
Fluid Dynamics Research, Vol. 37, No. 4, 2005, pp. 246 266.
17Jukes, T. N. and Choi, K.-S., Flow control around a circular cylinder using pulsed dielectric barrier discharge surface
plasma, Physics of Fluids, Vol. 21, No. 8, 2009, pp. 084103.
18Dong, S., Triantafyllou, G. S., and Karniadakis, G. E., Elimination of Vortex Streets in Blu-Body Flows, Phys. Rev.
Lett., Vol. 100, 2008, pp. 204501.
19Perrin, R., Braza, M., Cid, E., Cazin, S., Moradei, F., Barthet, A., Sevrain, A., and Hoarau, Y., Near-Wake Turbulence
Properties in the High Reynolds Number Incompressible Flow Around a Circular Cylinder Measured by Two- and Three-
Component PIV, Flow, Turbulence and Combustion, Vol. 77, 2006, pp. 185204, 10.1007/s10494-006-9043-5.
20Braza, M., Perrin, R., and Hoarau, Y., Turbulence properties in the cylinder wake at high Reynolds numbers, Journal
of Fluids and Structures, Vol. 22, No. 67, 2006, pp. 757 771.
21Brown, G. L. and Roshko, A., On density eects and large structure in turbulent mixing layers, Journal of Fluid
Mechanics, Vol. 64, 4 1974, pp. 775816.
22Hunt, J., Wray, A., and Moin, P., Eddies, streams, and convergence zones in turbulent ows, Center for Turbulence
Research, Proceedings of the Summer Program, 1988.
23Haller, G., Distinguished material surfaces and coherent structures in three-dimensional uid ows, Physica D , Vol. 149,
2001, pp. 248277.
24Green, M., Rowley, C., and Haller, G., Detection of Lagrangian coherent structures in three-dimensional turbulence,
Journal of Fluid Mechanics, Vol. 572, 2007, pp. 111120.
19 of 21
American Institute of Aeronautics and Astronautics

25Green, M., Rowley, C., and Smits, A., The unsteady three-dimensional wake produced by a trapezoidal pitching panel,
Journal of Fluid Mechanics, Vol. 685, 2011, pp. 117145.
26O'Farrell, C. and Dabiri, J. O., Pinch-o of non-axisymmetric vortex rings, Journal of Fluid Mechanics, Vol. 740, 2
2014, pp. 6196.
27Beron-Vera, F., Olascoaga, M., and Goni, G., Oceanic mesoscale eddies as revealed by Lagrangian coherent structures,
Geophysical Research Letters, Vol. 35, 2008.
28Shadden, S. C. and Arzani, A., Lagrangian postprocessing of computational hemodynamics, Annals of biomedical
engineering, Vol. 43, No. 1, 2015, pp. 4158.
29Eldredge, J. and Chong, K., Fluid transport and coherent structures of translating and apping wings, Chaos, Vol. 20,
2010.
30du Toit, P. and Marsden, J., Horseshoes in hurricanes, Journal of Fixed Point Theory and Applications, Vol. 7, 2010,
pp. 351384, 10.1007/s11784-010-0028-6.
31Haller, G., Lagrangian coherent structures, Annual Review of Fluid Mechanics, Vol. 47, 2015, pp. 137162.
32Wang, Y., Haller, G., Banaszuk, A., and Tadmor, G., Closed-loop Lagrangian separation control in a blu body shear
ow model, Physics of Fluids, Vol. 15, No. 8, 2003, pp. 22512266.
33Green, M., Rowley, C., and Smits, A., Using hyperbolic Lagrangian coherent structures to investigate vortices in bioin-
spired uid ows, Chaos, Vol. 20, 2010.
34Huang, Y. and Green, M. A., Eulerian and Lagrangian methods for detecting vortex formation and shedding, AIAA
Science and Technology Forum, 2015.
35Mulleners, K. and Rael, M., The onset of dynamic stall revisited, Experiments in uids, Vol. 52, No. 3, 2012, pp. 779
793.
36Chong, M., Perry, A., and Cantwell, B., A general classication of three-dimensional ow elds, Physics of Fluids,
Vol. 2, 1990, pp. 765777.
37Jeong, J. and Hussein, F., On the identication of a vortex, J. Fluid Mech., Vol. 285, 1995, pp. 6994.
38Graftieaux, L., Michard, M., and Grosjean, N., Combining PIV, POD and vortex identication algorithms for the study
of unsteady turbulent swirling ows, Measurement Science and Technology, Vol. 12, No. 9, 2001, pp. 1422.
39Haller, G. and Beron-Vera, F. J., Geodesic theory of transport barriers in two-dimensional ows, Physica D: Nonlinear
Phenomena, Vol. 241, No. 20, 2012, pp. 1680 1702.
40Brunton, S. L. and Rowley, C. W., Fast computation of nite-time Lyapunov exponent elds for unsteady ows, Chaos:
An Interdisciplinary Journal of Nonlinear Science, Vol. 20, No. 1, 2010, pp. 017503.
41Lipinski, D. and Mohseni, K., A ridge tracking algorithm and error estimate for ecient computation of Lagrangian
coherent structures, Chaos: An Interdisciplinary Journal of Nonlinear Science, Vol. 20, No. 1, 2010.
42Haller, G. and Sapsis, T., Lagrangian coherent structures and the smallest nite-time Lyapunov exponent, Chaos,
Vol. 21, No. 023115, 2011.
43Haller, G., Lagrangian coherent structures from approximate velocity data, Physics of Fluids, Vol. 14, No. 6, 2002,
pp. 1851.
44Olcay, A. B., Pottebaum, T. S., and Krueger, P. S., Sensitivity of Lagrangian coherent structure identication to ow
eld resolution and random errors, Chaos: An Interdisciplinary Journal of Nonlinear Science, Vol. 20, No. 1, 2010, pp. 017506.
45Mathur, M., Haller, G., Peacock, T., Ruppert-Felsot, J. E., and Swinney, H. L., Uncovering the Lagrangian skeleton of
turbulence, Physical Review Letters, Vol. 98, No. 14, 2007, pp. 144502.
20 of 21
American Institute of Aeronautics and Astronautics

46Olascoaga, M. J. and Haller, G., Forecasting sudden changes in environmental pollution patterns, Proceedings of the
National Academy of Sciences, 2012.
47Taira, K. and Colonius, T., The immersed boundary method: A projection approach, Journal of Computational Physics,
Vol. 225, No. 2, 2007, pp. 2118 2137.
48Colonius, T. and Taira, K., A fast immersed boundary method using a nullspace approach and multi-domain far-eld
boundary conditions, Computer Methods in Applied Mechanics and Engineering, Vol. 197, No. 2528, 2008, pp. 2131 2146.
49Munday, P. M. and Taira, K., On the lock-on of vortex shedding to oscillatory actuation around a circular cylinder,
Physics of Fluids (1994-present), Vol. 25, No. 1, 2013.
50Kourentis, L. and Konstantinidis, E., Uncovering large-scale coherent structures in natural and forced turbulent wakes
by combining PIV, POD, and FTLE, Experiments in Fluids, Vol. 52, No. 3, 2011, pp. 749763.
51Bourgeois, J., Sattari, P., and Martinuzzi, R., Coherent vortical and straining structures in the nite wall-mounted square
cylinder wake, International Journal of Heat and Fluid Flow , Vol. 35, 2012, pp. 130 140, 7th Symposium on Turbulence &
Shear Flow Phenomena (TSFP7).
52Perrin, R., Braza, M., Cid, E., Cazin, S., Barthet, A., Sevrain, A., Mockett, C., and Thiele, F., Obtaining phase averaged
turbulence properties in the near wake of a circular cylinder at high Reynolds number using POD, Experiments in Fluids,
Vol. 43, No. 2-3, 2007, pp. 341355.
53Rockwood, M. P., Loiselle, T., and Green, M. A., Practical concerns of implementing an LCS analysis with underresolved
data, Chaos, Submitted.
54O'Farrell, C. and Dabiri, J. O., A Lagrangian approach to identifying vortex pinch-o, Chaos, Vol. 20, No. 017513,
2010.
55Sadlo, F. and Peikert, R., Visualizing Lagrangian coherent structures and comparison to vector eld topology, Topology-
Based Methods in Visualization II , Springer, 2009, pp. 1529.
21 of 21
American Institute of Aeronautics and Astronautics