Initiation of Leading-Edge-Vortex Formation on Finite ... · PDF fileInitiation of...
18
Initiation of Leading-Edge-Vortex Formation on Finite Wings in Unsteady Flow Yoshikazu Hirato, * Minao Shen, North Carolina State University, Raleigh, NC 27695, USA Sachin Aggarwal † Swifter Technology LLC, Denville, NJ 07834, USA Ashok Gopalarathnam, ‡ Jack R. Edwards, § North Carolina State University, Raleigh, NC 27695, USA Abstract This paper proposes a criterion for initiation of leading edge vortex (LEV) formation on a finite wing in unsteady motion. Previous research has shown that a criterion called Leading Edge Suction Parameter (LESP) can predict the time of LEV formation in unsteady 2D airfoil flows. This research aims at extending the criterion to a 3D wing. An approach has been developed to calculate the spanwise variation of LESP using an unsteady vortex lattice method. Higher-order RANS CFD has been used to study a pitch-up motion for a large range of unswept finite-wing geometries to determine the time instant for LEV initiation. Correlation of the results from the UVLM and CFD analyses is used to study the effectiveness of the LESP criterion for predicting the time instant and spanwise location of LEV formation on the wings. It is shown that, for any given airfoil and Reynolds number, the maximum LESP on a finite wing at LEV initiation is largely independent of wing geometry and pitch-pivot location. Thus the LESP concept holds promise as an LEV initiation criterion for finite wings. I. Introduction Unsteady flow phenomena are prevalent in a wide range of problems in nature and engineering, including dynamic stall in rotorcraft and wind turbines, leading edge vortices in delta-wings, micro air vehicle (MAV) design, gust handling, and flow control. These unsteady aerodynamics problems are characterized by rapid changes in circulation of the airfoil/wing, apparent-mass effects, flow separation, and vortices in the flowfield. In particular, the study of the leading edge vortex (LEV) is of great interest because their formation, growth, convection, and detachment affect the forces on the airfoil/wing. It is for this reason, that LEV formation on airfoil and wings have received significant attention researchers studying dynamic stall and insect flight. Of interest in the study of LEV-dominated flows is the time instant of initiation of the LEV formation. In recent work, 1, 2 we introduced a Leading Edge Suction Parameter (LESP), which is a measure of the leading-edge suction peak. We hypothesized that a critical value of LESP is correlated to the onset of LEV formation. We show that the instantaneous value of the LESP for airfoil flows can be determined using a large-angle unsteady thin airfoil theory 3 and is simply the A 0 term of the Fourier series description of the instantaneous chordwise vorticity distribution on the airfoil in unsteady flow. We also showed that, for any given airfoil and Reynolds number, there is a unique critical value of the LESP. The key benefit is that this critical value is independent of the motion kinematics; for a given airfoil and Reynolds number, we can determine the critical LESP from experiment or CFD for one motion and use this for any other motion. Further, in reference 2, we used the LESP idea to develop a switch for turning “on” or “off” discrete vortex shedding at the leading edge to model the formation and growth of LEVs. The motivation in the current work is to extend the LESP concept to three-dimensional finite wings, where initiation * Graduate Student, Department of Mechanical and Aerospace Engineering, and AIAA Student Member † CFD engineer, Swifter technologies LLC ‡ Associate Professor, Department of Mechanical and Aerospace Engineering, and AIAA Associate Fellow § Professor, Department of Mechanical and Aerospace Engineering, and AIAA Associate Fellow 1 of 18 American Institute of Aeronautics and Astronautics
Transcript of Initiation of Leading-Edge-Vortex Formation on Finite ... · PDF fileInitiation of...

Initiation of Leading-Edge-Vortex Formation onFinite Wings in Unsteady Flow
Yoshikazu Hirato,∗ Minao Shen,North Carolina State University, Raleigh, NC 27695, USA
Sachin Aggarwal†
Swifter Technology LLC, Denville, NJ 07834, USAAshok Gopalarathnam,‡ Jack R. Edwards,§
North Carolina State University, Raleigh, NC 27695, USA
Abstract
This paper proposes a criterion for initiation of leading edge vortex (LEV) formation on a finite wing in unsteadymotion. Previous research has shown that a criterion called Leading Edge Suction Parameter (LESP) can predict thetime of LEV formation in unsteady 2D airfoil flows. This research aims at extending the criterion to a 3D wing.An approach has been developed to calculate the spanwise variation of LESP using an unsteady vortex lattice method.Higher-order RANS CFD has been used to study a pitch-up motion for a large range of unswept finite-wing geometriesto determine the time instant for LEV initiation. Correlation of the results from the UVLM and CFD analyses is usedto study the effectiveness of the LESP criterion for predicting the time instant and spanwise location of LEV formationon the wings. It is shown that, for any given airfoil and Reynolds number, the maximum LESP on a finite wing at LEVinitiation is largely independent of wing geometry and pitch-pivot location. Thus the LESP concept holds promise asan LEV initiation criterion for finite wings.
I. Introduction
Unsteady flow phenomena are prevalent in a wide range of problems in nature and engineering, including dynamicstall in rotorcraft and wind turbines, leading edge vortices in delta-wings, micro air vehicle (MAV) design, gusthandling, and flow control. These unsteady aerodynamics problems are characterized by rapid changes in circulationof the airfoil/wing, apparent-mass effects, flow separation, and vortices in the flowfield. In particular, the study ofthe leading edge vortex (LEV) is of great interest because their formation, growth, convection, and detachment affectthe forces on the airfoil/wing. It is for this reason, that LEV formation on airfoil and wings have received significantattention researchers studying dynamic stall and insect flight.
Of interest in the study of LEV-dominated flows is the time instant of initiation of the LEV formation. In recentwork,1, 2 we introduced a Leading Edge Suction Parameter (LESP), which is a measure of the leading-edge suctionpeak. We hypothesized that a critical value of LESP is correlated to the onset of LEV formation. We show that theinstantaneous value of the LESP for airfoil flows can be determined using a large-angle unsteady thin airfoil theory3
and is simply the A0 term of the Fourier series description of the instantaneous chordwise vorticity distribution on theairfoil in unsteady flow. We also showed that, for any given airfoil and Reynolds number, there is a unique criticalvalue of the LESP. The key benefit is that this critical value is independent of the motion kinematics; for a given airfoiland Reynolds number, we can determine the critical LESP from experiment or CFD for one motion and use this forany other motion. Further, in reference 2, we used the LESP idea to develop a switch for turning “on” or “off” discretevortex shedding at the leading edge to model the formation and growth of LEVs.
The motivation in the current work is to extend the LESP concept to three-dimensional finite wings, where initiation
∗Graduate Student, Department of Mechanical and Aerospace Engineering, and AIAA Student Member†CFD engineer, Swifter technologies LLC‡Associate Professor, Department of Mechanical and Aerospace Engineering, and AIAA Associate Fellow§Professor, Department of Mechanical and Aerospace Engineering, and AIAA Associate Fellow
1 of 18
American Institute of Aeronautics and Astronautics
agopalar
Text Box
Gopalarathnam, A., and Edwards, J., "Initiation of Leading-Edge-Vortex Formation on Finite Wings in Unsteady Flow," AIAA Paper 2015-0546 (revised), January 2015. To check for updates to this paper, please visit: http://www.mae.ncsu.edu/apa/publications.html#c052

of LEV formation, which will occur at some spanwise location, will be affected by the induced downwash. Predictionof LEV initiation (both the time instant and the spanwise location) is the first step to modeling intermittent LEVformation and shedding on rounded leading-edge wings using unsteady vortex lattice methods. In the current work,we extend the LESP concept to finite wings by calculating the LESP for various chordwise strips using an unsteadyvortex lattice method (UVLM). By analyzing various wings using both UVLM and a higher-order RANS CFD code,we examine the maximum LESP value along the wing span at the instant corresponding to LEV initiation, as predictedby CFD.
II. Background: Leading Edge Suction Parameter
Leading Edge Suction Parameter (LESP) is a criterion that has been proposed by Ramesh et al.1 to determinethe start conditions for LEV formation and shedding in unsteady motion of airfoils. The LEV formation beginswith leading-edge boundary-layer separation followed by ejection of vorticity into a shear layer that rolls up to formthe LEV. However, the conditions leading to LEV initiation depend on several factors including leading-edge shape,Reynolds number, motion kinematics, and influence of other flow features in the vicinity. The main idea of the LESPconcept is that the initiation of LEV is chiefly determined by the leading-edge suction, which is influenced by theaforementioned factors. The research of Ramesh et al.1, 2 showed that a critical value of this leading-edge suction,parametrized by the value of the LESP , governs the initiation of LEV formation. During any unsteady motion, whenthe instantaneous LESP crosses a critical value, LEV formation is initiated. This critical value is dependent only onairfoil shape and Reynolds number, and is independent of motion kinematics.
Ramesh et al.1, 2 used unsteady thin airfoil theory to analyze the flow over an airfoil undergoing arbitrary motion.The chordwise vorticity distribution for the airfoil, γ(x), is expressed as a Fourier series:
γ(θ, t) = 2U
[A0(t)
1 + cos θ
sin θ+
∞∑n=1
An(t) sin(nθ)
](1)
where θ is a variable of transformation related to the chordwise coordinate x as,
x =c
2(1− cos θ) (2)
in which A0(t), A1(t), ..., An(t) are the time-dependent Fourier coefficients, c is the airfoil chord, and U is thecomponent of the airfoil’s velocity in the negative X direction. It was shown that the instantaneous LESP , which isa measure of the suction at the leading edge, is simply equal to the instantaneous A0 value:
LESP (t) = A0(t) (3)
The result of this relationship is that, when unsteady thin airfoil theory is used to study the inviscid flow over anairfoil undergoing arbitrary motion, the LESP can be tracked to check if reaches a pre-determined critical value todetermine if the condition for LEV shedding is reached at that time step. The current work aims to develop a similarcriterion for finite wing unsteady flows.
III. Methodology
A. Unsteady Vortex Lattice Method
Unsteady Vortex Lattice Method (UVLM) is a time-dependent, low-order method for calculating the potential flowpart finite wings. The current formulation largely follows the time-stepping approach presented by Katz and Plotkin.4
The wing cross-sections are replaced by their mean camberline shapes. The mean-camber surface and the wake arediscretized into lattices. Vortex rings are used to represent the chordwise and spanwise variations of the vortex sheetstrength for both the bound and wake vorticity. The strengths of the vortex rings are determined by satisfying thezero-normal flow boundary condition on all the control points on the wing lattices. Unsteady flow solution is obtainedby time marching the calculation. In a departure from the UVLM formulation presented by Levin and Katz5 and Katzand Plotkin,4 in the current implementation of the UVLM, the tip edge of the wing is assumed to shed a trailing vortexwake. This modification was found to improve predictions of LEV initiation for low aspect ratio wings, in which thetip vortex structure has a strong influence on induced velocities along the leading edge. Figure 1 shows the latticearrangement on the right half of a low aspect-ratio wing.
2 of 18
American Institute of Aeronautics and Astronautics

Figure 1. Distribution of vortex lattices in UVLM. Right half of wing shown.
Of particular interest in the current work is the determination of the spanwise variation of LESP along the wingat every time step. For this calculation, the strengths of the bound-vortex filaments on each chordwise strip areconsidered. The chordwise variation of the strengths of the discrete bound-vortex filaments on each strip is convertedto a smooth variation by interpolation, from which the coefficients of the Fourier series describing the airfoil chordwisebound-vorticity distribution (used in traditional thin airfoil theory) is obtained by a matching process. The A0 term forthe strip is then taken as the LESP for that strip at that time step.
It is important to note that the UVLM, in its current formulation, does not account for any viscous effects orleading-edge vortex formation. Because it is a purely inviscid method, the results are valid only until the initiation ofLEV formation, provided there is no significant trailing-edge stall.
B. CFD
The CFD is based on an ’all speed’ version of NCSU’s REACTMB flow solver, which integrates the compressibleNavier-Stokes equations in time using implicit dual time-stepping methods. The ’all speed’ formulation utilizes time-derivative preconditioning, along with modifications to the upwinding methods,6 to recover an incompressible limitingform as the Mach number approaches zero (or the speed of sound approaches infinity). The code can thus be used tocompute either incompressible or compressible flows. Low-dissipation piecewise parabolic reconstruction methods7
are used to extend the basic first-order upwind methods to fourth-order spatial accuracy in vorticity-dominated regions,and the governing equations are formulated in an arbitrary Lagrangian-Eulerian (ALE) fashion to enable moving-meshflow simulations. Spalart-Allmaras one equation turbulence model is used for turbulent viscosity. Figure 2 shows atypical mesh distribution used for the finite-wing calculations in the current work.
The CFD model was validated by qualitatively comparing the flow solution with the PIV results from the experi-mental study of Yilmaz and Rockwell8 for an aspect-ratio 2 flat plate undergoing a 0–45-degree pitch-up motion. Theflow visualization for four time instants from CFD are shown in figure 3. The comparison with the PIV flow images(figure 6 of reference 8) is excellent.
C. Cases
A total of 15 finite-wing geometries and two 2D cross-sections are considered in this effort. Cases 1–13 are finitewings of different taper ratios, tip-twist angles, aspect ratios, and pivot locations with the SD7003 airfoil cross-sectionfrom reference 9. Case 2D is a two-dimensional flow case for this airfoil. Cases P1 and P2 are finite wings with the
3 of 18
American Institute of Aeronautics and Astronautics

Figure 2. Typical mesh distribution for CFD analysis.
Figure 3. Flow visualization from CFD for qualitative comparison with experimental results of reference 8.
4 of 18
American Institute of Aeronautics and Astronautics

flat plate cross-section, for which the 2D case is labeled P2D. Table 1 lists the details of the 17 cases used in this paper.All wings have unswept leading edges and zero dihedral angle.
Table 1. Test cases.
Case Re Airfoil AR Taper Twist K Pivotratio angle [deg] location
2D 20,000 SD7003 - - - 0.1 cave/41 20,000 SD7003 2 1.0 0 0.1 cave/42 20,000 SD7003 2 1.0 0 0.1 3cave/43 20,000 SD7003 2 0.5 0 0.1 cave/44 20,000 SD7003 2 0.5 0 0.1 3cave/45 20,000 SD7003 2 1.0 10 0.1 cave/46 20,000 SD7003 2 1.0 10 0.1 3cave/47 20,000 SD7003 4 1.0 0 0.1 cave/48 20,000 SD7003 4 1.0 0 0.1 3cave/49 20,000 SD7003 4 0.5 0 0.1 cave/410 20,000 SD7003 4 0.5 0 0.1 3cave/411 20,000 SD7003 4 1.0 10 0.1 cave/412 20,000 SD7003 4 1.0 10 0.1 3cave/413 20,000 SD7003 6 1.0 0 0.1 cave/4P2D 10,000 Flatplate - - - 0.1 cave/4P1 10,000 Flatplate 2 1.0 0 0.1 cave/4P2 10,000 Flatplate 2 1.0 0 0.1 3cave/4
D. Motion parameters
For all geometries in this work, a 0–45-degree pitch motion is considered, with a non-dimensional pitch rate of K =α̇c/(2U) of 0.1 rad/s. Figure 4 shows the time variation of α.
-5
0
5
10
15
20
25
30
35
40
45
50
0 1 2 3 4 5 6
An
gle
of
att
ack, d
eg
Nondimensional time
Figure 4. Pitch up motion used in this study.
5 of 18
American Institute of Aeronautics and Astronautics

E. Determination of LEV initiation and LESPmax from CFD and UVLM
The determination of LEV initiation for finite wings builds on a surface skin-friction signature that we have developedfor LEV initiation in 2D flows. Details are in the Appendix of reference 2. Briefly, we have found that, in the leadingedge region, the time instant at which spikes in the negative-Cf region become one or more positive-Cf regions(embedded with the negative-Cf region) can be reliably taken as the time instant of LEV initiation. This procedurehas been applied to finite wings by looking for this signature in the plot of upper-surface skin-friction lines from CFD.
(a) From CFD frame just prior to LEV onset, t∗ = 2.880, α =21.54 deg.
(b) From CFD frame just after to LEV onset, t∗ = 2.925,α = 22.06 deg.
Figure 5. Upper-surface skin-friction lines for case 1.
To illustrate the methodology used to identify the time instant corresponding to LEV initiation, Figs. 5(a) and 5(b)show the upper-surface skin-friction lines on the wing for case study 1 for the frames just prior to LEV initiation andjust after LEV initiation, respectively. Thus, for this case, it can be said that the t∗ corresponding to LEV initiation isbetween 2.880 and 2.925. It is also seen that the LEV initiation occurs at the wing root for this wing, i.e., at y = 0.
0
0.05
0.1
0.15
0.2
0.25
-1 -0.5 0 0.5 1
LE
SP
dis
trib
utio
n a
nd
ma
xim
um
LE
SP
Spanwise coordinate 2y/b
LESP (Case1, t*=2.925)
LESP (Case1, t*=2.880)
Figure 6. Spanwise variation of LESP and determination of LESPmax for case 1.
Figure 6 shows the spanwise distributions of LESP for case 1 for t∗ = 2.925 (solid curve, for CFD frame just afterLEV initiation) and for t∗ = 2.880 (dashed curve, for CFD frame just prior to LEV initiation). These spanwise LESPdistributions were obtained from the UVLM analysis. The maximum LESP value, corresponding to LEV initiation, forcase 1, therefore, occurs between the maximum values for these two spanwise LESP distributions. Thus the solid blackhorizontal line in figure 6 indicates the LESPmax value, with the black error bar denoting uncertainty, correspondingto initiation of LEV for case 1.
In the remainder of the paper, results for initiation of LEV formation on any wing will be presented using a plotof upper-surface skin-friction lines from a CFD frame corresponding to just after LEV onset. The LESP distribution
6 of 18
American Institute of Aeronautics and Astronautics

from UVLM will also be presented for the t∗ corresponding to this frame. The LESPmax value with error estimatefor the wing will be denoted by a horizontal line with an error bar in the LESP vs. spanwise coordinate plots.
IV. Results and Discussion
The results are presented as six case studies to illustrate the finite-wing effects (case study A), effect of pivotlocation (case study B), effect of wing taper ratio (case study C), effect of wing-tip twist (case study D), effect ofaspect ratio (case study E), and effect of airfoil shape (case study F) on initiation of the LEV. In each case study, case1 is used as the baseline wing for all comparisons.
A. Case Study A: Finite-wing effects
In this case study, the initiation of the LEV for the baseline case (case 1) is compared with that for the SD7003 airfoil(case 2D). The details of the two cases are listed in Table 2.
Table 2. Test cases for case study A.
Case Re Airfoil AR Taper Twist K Pivotratio angle [deg] location
2D 20,000 SD7003 - - - 0.1 cave/41 20,000 SD7003 2 1.0 0 0.1 cave/4
Case 1, 22.06
2D, 17.93
-5
0
5
10
15
20
25
30
35
40
45
50
0 1 2 3 4 5 6
An
gle
of
att
ack, d
eg
Nondimensional time
(a) Motion time history showing LEV initiation.
0
0.05
0.1
0.15
0.2
0.25
-1 -0.5 0 0.5 1
LE
SP
dis
trib
utio
n a
nd
ma
xim
um
LE
SP
Spanwise coordinate 2y/b
LESPcrit (2D)LESP (Case1, t*=2.925)LESP (Case1, t*=2.880)
(b) Comparison of LESPmax for case 1 with LESPcrit for case2D; spanwise variation of LESP at LEV initiation.
Figure 7. Case study A: Comparison of LEV initiation for cases 1 and 2D.
Figure 7(a) shows the motion history and compares the t∗ for LEV initiation for cases 1 and 2D. It is seen that theangle of attack for LEV initiation for case 1 is approximately 4 degrees higher than that for the 2D case. Figure 7(b)shows the spanwise distributions of LESP for case 1 for t∗ = 2.925. The black horizontal line in figure 7(b) indicatesthe LESP value, with the black error bar denoting uncertainty, corresponding to initiation of LEV for case 1. Similarly,the red horizontal line denotes the critical LESP value, with error bar denoting uncertainty, for the SD7003 airfoil (case2D). It is seen that the LESPmax for case 1 is lower than the LESPcrit for the corresponding airfoil (case 2D).
B. Case Study B: Effect of pivot location
In case study B, the initiation of the LEV for the baseline case (case 1, pivot at c/4) is compared with that for samewing with pivot at 3c/4 (case 2). The details of the two cases are listed in Table 3.
7 of 18
American Institute of Aeronautics and Astronautics

Table 3. Test cases for case study B.
Case Re Airfoil AR Taper Twist K Pivotratio angle [deg] location
2D 20,000 SD7003 - - - 0.1 cave/41 20,000 SD7003 2 1.0 0 0.1 cave/42 20,000 SD7003 2 1.0 0 0.1 3cave/4
(a) Upper-surface skin-friction lines for case 2 from CFD, t∗ =3.375, α = 27.22 deg.
Case 1, 22.06
Case 2, 27.22
2D, 17.93
-5
0
5
10
15
20
25
30
35
40
45
50
0 1 2 3 4 5 6
An
gle
of
att
ack, d
eg
Nondimensional time
(b) Motion time histories showing LEV initiation.
0
0.05
0.1
0.15
0.2
0.25
-1 -0.5 0 0.5 1
LE
SP
dis
trib
utio
n a
nd
ma
xim
um
LE
SP
Spanwise coordinate 2y/b
LESPcrit (2D)
LESP (Case1)
LESP (Case2)
(c) Spanwise variation of LESP at LEV initiation comparingLESPmax for cases 1 and 2 with LESPcrit for case 2D.
CL (UVLM, Case 1)
CL (UVLM, Case 2)
CL (CFD, Case 1)
CL (CFD, Case 2)
(LE
V o
nse
t, C
ase
1)
(LE
V o
nse
t, C
ase 2
)
Alpha
-5
0
5
10
15
20
25
30
35
40
45
50
0
0.5
1
1.5
2
2.5
3
3.5
4
0 1 2 3 4 5 6
Angle
of att
ack (
Alp
ha),
deg
Lift coeff
icie
nt (C
L)
Nondimensional time (t*)
(d) CL vs. t∗ from CFD and UVLM.
Figure 8. Case study B: Effect of pivot location. Comparison of cases 1 and 2 at CFD frames just after LEV onset.
8 of 18
American Institute of Aeronautics and Astronautics
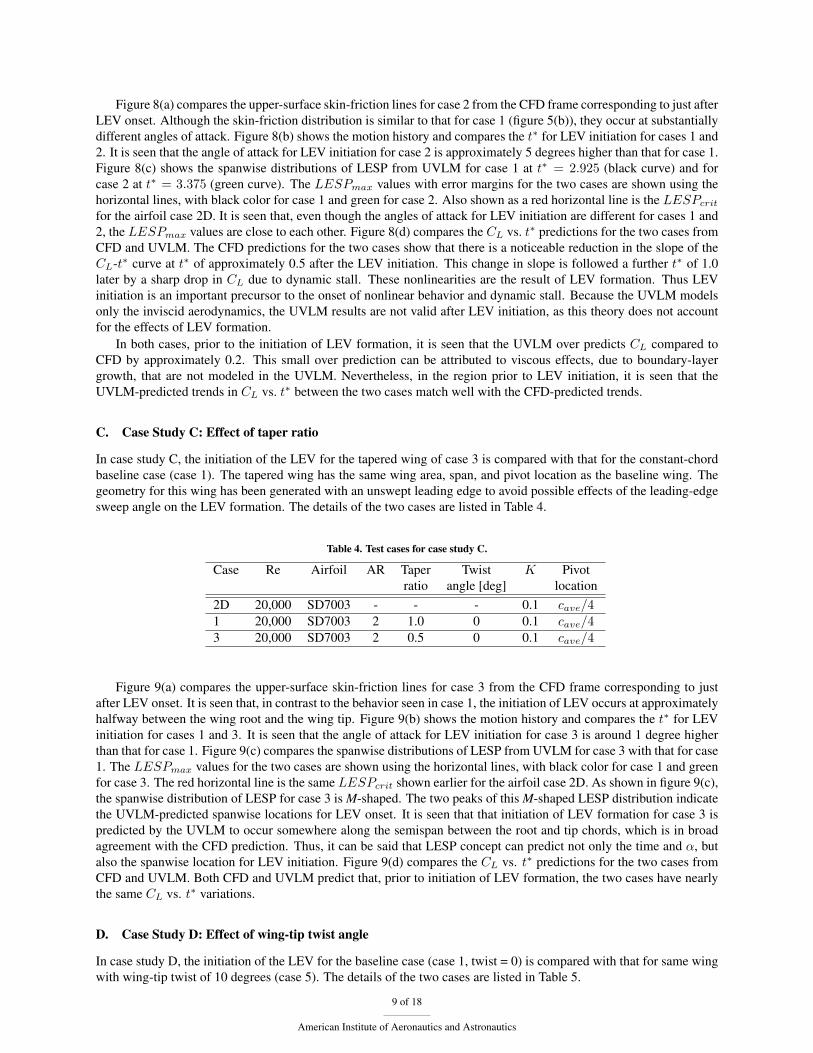
Figure 8(a) compares the upper-surface skin-friction lines for case 2 from the CFD frame corresponding to just afterLEV onset. Although the skin-friction distribution is similar to that for case 1 (figure 5(b)), they occur at substantiallydifferent angles of attack. Figure 8(b) shows the motion history and compares the t∗ for LEV initiation for cases 1 and2. It is seen that the angle of attack for LEV initiation for case 2 is approximately 5 degrees higher than that for case 1.Figure 8(c) shows the spanwise distributions of LESP from UVLM for case 1 at t∗ = 2.925 (black curve) and forcase 2 at t∗ = 3.375 (green curve). The LESPmax values with error margins for the two cases are shown using thehorizontal lines, with black color for case 1 and green for case 2. Also shown as a red horizontal line is the LESPcrit
for the airfoil case 2D. It is seen that, even though the angles of attack for LEV initiation are different for cases 1 and2, the LESPmax values are close to each other. Figure 8(d) compares the CL vs. t∗ predictions for the two cases fromCFD and UVLM. The CFD predictions for the two cases show that there is a noticeable reduction in the slope of theCL-t∗ curve at t∗ of approximately 0.5 after the LEV initiation. This change in slope is followed a further t∗ of 1.0later by a sharp drop in CL due to dynamic stall. These nonlinearities are the result of LEV formation. Thus LEVinitiation is an important precursor to the onset of nonlinear behavior and dynamic stall. Because the UVLM modelsonly the inviscid aerodynamics, the UVLM results are not valid after LEV initiation, as this theory does not accountfor the effects of LEV formation.
In both cases, prior to the initiation of LEV formation, it is seen that the UVLM over predicts CL compared toCFD by approximately 0.2. This small over prediction can be attributed to viscous effects, due to boundary-layergrowth, that are not modeled in the UVLM. Nevertheless, in the region prior to LEV initiation, it is seen that theUVLM-predicted trends in CL vs. t∗ between the two cases match well with the CFD-predicted trends.
C. Case Study C: Effect of taper ratio
In case study C, the initiation of the LEV for the tapered wing of case 3 is compared with that for the constant-chordbaseline case (case 1). The tapered wing has the same wing area, span, and pivot location as the baseline wing. Thegeometry for this wing has been generated with an unswept leading edge to avoid possible effects of the leading-edgesweep angle on the LEV formation. The details of the two cases are listed in Table 4.
Table 4. Test cases for case study C.
Case Re Airfoil AR Taper Twist K Pivotratio angle [deg] location
2D 20,000 SD7003 - - - 0.1 cave/41 20,000 SD7003 2 1.0 0 0.1 cave/43 20,000 SD7003 2 0.5 0 0.1 cave/4
Figure 9(a) compares the upper-surface skin-friction lines for case 3 from the CFD frame corresponding to justafter LEV onset. It is seen that, in contrast to the behavior seen in case 1, the initiation of LEV occurs at approximatelyhalfway between the wing root and the wing tip. Figure 9(b) shows the motion history and compares the t∗ for LEVinitiation for cases 1 and 3. It is seen that the angle of attack for LEV initiation for case 3 is around 1 degree higherthan that for case 1. Figure 9(c) compares the spanwise distributions of LESP from UVLM for case 3 with that for case1. The LESPmax values for the two cases are shown using the horizontal lines, with black color for case 1 and greenfor case 3. The red horizontal line is the same LESPcrit shown earlier for the airfoil case 2D. As shown in figure 9(c),the spanwise distribution of LESP for case 3 is M-shaped. The two peaks of this M-shaped LESP distribution indicatethe UVLM-predicted spanwise locations for LEV onset. It is seen that that initiation of LEV formation for case 3 ispredicted by the UVLM to occur somewhere along the semispan between the root and tip chords, which is in broadagreement with the CFD prediction. Thus, it can be said that LESP concept can predict not only the time and α, butalso the spanwise location for LEV initiation. Figure 9(d) compares the CL vs. t∗ predictions for the two cases fromCFD and UVLM. Both CFD and UVLM predict that, prior to initiation of LEV formation, the two cases have nearlythe same CL vs. t∗ variations.
D. Case Study D: Effect of wing-tip twist angle
In case study D, the initiation of the LEV for the baseline case (case 1, twist = 0) is compared with that for same wingwith wing-tip twist of 10 degrees (case 5). The details of the two cases are listed in Table 5.
9 of 18
American Institute of Aeronautics and Astronautics

(a) Upper-surface skin-friction lines for case 3 from CFD, t∗ =3.015, α = 23.09 deg.
Case 1, 22.06
Case 3, 23.09
2D, 17.93
-5
0
5
10
15
20
25
30
35
40
45
50
0 1 2 3 4 5 6
An
gle
of
att
ack, d
eg
Nondimensional time
(b) Motion time histories showing LEV initiation.
0
0.05
0.1
0.15
0.2
0.25
-1 -0.5 0 0.5 1
LE
SP
dis
trib
utio
n a
nd
ma
xim
um
LE
SP
Spanwise coordinate 2y/b
LESPcrit (2D)
LESP (Case1)
LESP (Case3)
(c) Spanwise variation of LESP at LEV initiation comparingLESPmax for cases 1 and 3 with LESPcrit for case 2D.
CL (UVLM, Case 1)
CL (UVLM, Case 3)
(LE
V o
nse
t, C
ase
1)
(LE
V o
nse
t, C
ase
3)
Alpha
CL (CFD, Case 1)
CL (CFD, Case 3)
-5
0
5
10
15
20
25
30
35
40
45
50
0
0.5
1
1.5
2
2.5
3
3.5
4
0 1 2 3 4 5 6A
ngle
of att
ack (
Alp
ha),
deg
Lift coeff
icie
nt (C
L)
Nondimensional time (t*)
(d) CL vs. t∗ from CFD and UVLM.
Figure 9. Case study C: Effect of taper ratio. Comparison of cases 1 and 3 at CFD frames just after LEV onset.
Table 5. Test cases for case study D.
Case Re Airfoil AR Taper Twist K Pivotratio angle [deg] location
2D 20,000 SD7003 - - - 0.1 cave/41 20,000 SD7003 2 1.0 0 0.1 cave/45 20,000 SD7003 2 1.0 10 0.1 cave/4
10 of 18
American Institute of Aeronautics and Astronautics

(a) Upper-surface skin-friction lines for case 5 from CFD, t∗ =2.565, α = 17.93 deg.
Case 1, 22.06
Case 5, 17.93
2D, 17.93
-5
0
5
10
15
20
25
30
35
40
45
50
0 1 2 3 4 5 6
An
gle
of
att
ack, d
eg
Nondimensional time
(b) Motion time histories showing LEV initiation.
0
0.05
0.1
0.15
0.2
0.25
-1 -0.5 0 0.5 1
LE
SP
dis
trib
utio
n a
nd
ma
xim
um
LE
SP
Spanwise coordinate 2y/b
LESPcrit (2D)
LESP (Case1)
LESP (Case5)
(c) Spanwise variation of LESP at LEV initiation comparingLESPmax for cases 1 and 5 with LESPcrit for case 2D.
CL (UVLM, Case 1)
CL (UVLM, Case 5)
CL (CFD, Case 1)
CL (CFD, Case 5)
(LE
V o
nset,
Case 1
)
(LE
V o
nset,
Case 5
) Alpha
-5
0
5
10
15
20
25
30
35
40
45
50
0
0.5
1
1.5
2
2.5
3
3.5
4
0 1 2 3 4 5 6
Angle
of att
ack (
Alp
ha),
deg
Lift coeff
icie
nt (C
L)
Nondimensional time (t*)
(d) CL vs. t∗ from CFD and UVLM.
Figure 10. Case study D: Effect of wing-tip twist. Comparison of cases 1 and 5 at CFD frames just after LEV onset.
11 of 18
American Institute of Aeronautics and Astronautics

Figure 10(a) shows the upper-surface skin-friction lines for case 5 from the CFD frame corresponding to justafter LEV onset. It is seen that, because of progressively higher incidence angles of the outboard wing sections, theinitiation of LEV occurs at approximately halfway between the wing root and the wing tip. Figure 10(b) shows themotion history and compares the t∗ for LEV initiation for cases 1 and 5. It is seen that the angle of attack for LEVinitiation for case 5 is approximately 4 degrees lower than that for case 1. Figure 10(c) shows the spanwise distributionsof LESP from UVLM for cases 1 and 5, and compares the LESPmax for the two cases with the LESPcrit for theairfoil case 2D. It is seen that, even though the angles of attack for LEV initiation are different for cases 1 and 5,the LESPmax values are close to each other. Also seen is that the LESP (y) curve reaches the maximum valueat y/(b/2) of approximately 0.35, which agrees qualitatively with the CFD-predicted spanwise location of the LEVinitiation. Figure 10(d) compares the CL vs. t∗ predictions for the two cases from CFD and UVLM. As seen in othercase studies, the UVLM-predicted trends between the two cases agrees with the CFD-predicted trends prior to LEVinitiation, and, soon after LEV initiation, nonlinearity sets in the CFD-predicted CL vs. t∗ variation.
E. Case Study E: Effect of aspect ratio
In case study E, the initiation of the LEV for the baseline case (case 1, rectangular wing of AR 2) is compared withthat for rectangular-wing cases 7 and 13 (AR 4 and 6, respectively).The details of the three cases are listed in Table 6.
Table 6. Test cases for case study E.
Case Re Airfoil AR Taper Twist K Pivotratio angle [deg] location
2D 20,000 SD7003 - - - 0.1 cave/41 20,000 SD7003 2 1.0 0 0.1 cave/47 20,000 SD7003 4 1.0 0 0.1 cave/413 20,000 SD7003 6 1.0 0 0.1 cave/4
Figures 11(a) and 11(b) show the upper-surface skin-friction lines for cases 7 and 13 at LEV initiation. Althoughthe aspect ratio is different, the initiation of LEV formation for cases 1, 7, and 13 starts at the wing root for eachwing. Figure 11(c) shows the motion history and compares the t∗ for LEV initiation for cases 1, 7, and 3. It is seenthat the angles of attack for LEV initiation for cases 7 and 13 are approximately 2.5 degrees and 3.5 degrees lower,respectively, than that for case 1. With increasing aspect ratio, it is seen that the points of LEV initiation starts toapproach the point for case 2D.
Figure 11(d) shows the spanwise distributions of LESP from UVLM for case 1 at t∗ = 2.925 (black curve), forcase 7 at t∗ = 2.700 (green curve), and for case 13 at t∗ = 2.610 (blue curve). The LESPmax values for the threecases are shown using the horizontal lines. The red horizontal line is the same LESPcrit for the airfoil case 2D. It isseen that the LESPmax values for the aspect ratio of 4 and 6 are higher than that for case 2 by approximately 0.03.The LESPmax value starts to approach the LESPcrit value of the 2D case with increasing aspect ratio. Figure 11(e)compares the CL vs. t∗ predictions for the three cases from CFD and UVLM. The predictions from both CFD andUVLM show that the slope of CL vs. α increases with increasing aspect ratio, as expected.
F. Case Study F: Effect of airfoil shape
In case study F, the initiation of the LEV for the baseline case (case 1, SD7003 airfoil) is compared with that for samewing with a flat plate airfoil (case P1). For comparison, the initiation of LEV formation on the corresponding 2Dgeometries (case 2D for SD7003 and case P2D for the plate) are shown. The details of the cases are listed in Table 7.
Figure 12(a) compares the upper-surface skin-friction lines for case P1 from the CFD frame corresponding to justafter LEV onset. It is seen that the pattern is similar to that for case 1. Figure 12(b) shows the motion history andcompares the t∗ for LEV initiation for cases 1, 2D, P1, and P2D. Because the flat plate has a much smaller leading-edge radius than the SD7003 airfoil, the initiation of LEV formation occurs at a much smaller α on the plate, both forthe P2D and the P1 cases. Figure 12(c) shows the spanwise distributions of LESP from UVLM for cases 1 and P1, andcompares the LESPmax for these two cases with the LESPcrit for the corresponding 2D geometries, cases 2D andP2D. For each geometry, even though the LEV initiation is widely separated in α and t∗, it is seen that the LESPmax
for the finite-wing case is close to the LESPcrit for the corresponding 2D geometry.
12 of 18
American Institute of Aeronautics and Astronautics

(a) Upper-surface skin-friction lines for case 7 from CFD, t∗ = 2.700,α = 19.48 deg.
(b) Upper-surface skin-friction lines for case 13 from CFD, t∗ = 2.610,α = 18.45 deg.
2D, 17.93
Case 1, 22.06
Case 7, 19.48
Case 13, 18.45
-5
0
5
10
15
20
25
30
35
40
45
50
0 1 2 3 4 5 6
An
gle
of
att
ack, d
eg
Nondimensional time
(c) Motion time histories showing LEV initiation.
0
0.05
0.1
0.15
0.2
0.25
-1 -0.5 0 0.5 1
LE
SP
dis
trib
utio
n a
nd
ma
xim
um
LE
SP
Spanwise coordinate 2y/b
LESPcrit (2D)
LESP (Case1)
LESP (Case7)
LESP (Case13)
(d) Spanwise variation of LESP at LEV initiation comparingLESPmax for cases 1, 7, and 13 with LESPcrit for case 2D.
CL (UVLM, Case 7)
CL (UVLM, Case 1)
CL (CFD, Case 7)
CL (CFD, Case 1)
(LE
V o
nset,
Ca
se 7
)
(LE
V o
nse
t, C
ase
1)
CL (CFD, Case 13)
CL (UVLM, Case 13)
(LE
V o
nset,
Ca
se 1
3)
Alpha
-5
0
5
10
15
20
25
30
35
40
45
50
0
0.5
1
1.5
2
2.5
3
3.5
4
0 1 2 3 4 5 6
Angle
of attack (
Alp
ha),
deg
Lift coeff
icie
nt (C
L)
Nondimensional time (t*)
(e) CL vs. t∗ from CFD and UVLM.
Figure 11. Case study E: Effect of aspect ratio. Comparison of cases 1, 7, and 13 at CFD frames just after LEV onset.
Table 7. Test cases for case study F.
Case Re Airfoil AR Taper Twist K Pivotratio angle [deg] location
2D 20,000 SD7003 - - - 0.1 cave/41 20,000 SD7003 2 1.0 0 0.1 cave/4P2D 10,000 Plate - - - 0.1 cave/4P1 10,000 Plate 2 1.0 0 0.1 cave/4
13 of 18
American Institute of Aeronautics and Astronautics
(a) Upper-surface skin-friction lines for case P1 from CFD, t∗ =2.062, α = 9.71 deg.
2D, 17.93
Case P1, 9.71
Case 1, 22.06
P2D, 8.21
-5
0
5
10
15
20
25
30
35
40
45
50
0 1 2 3 4 5 6
An
gle
of
att
ack, d
eg
Nondimensional time
(b) Motion time histories showing LEV initiation.
0
0.05
0.1
0.15
0.2
0.25
-1 -0.5 0 0.5 1
LE
SP
dis
trib
utio
n a
nd
ma
xim
um
LE
SP
Spanwise coordinate 2y/b
LESPcrit (2D)
LESP (Case1)
LESPcrit (P2D)
LESP (Case P1)
(c) Spanwise variation of LESP at LEV initiation comparingLESPmax for cases 1 and P1 with LESPcrit for cases 2D andP2D.
Figure 12. Case study F: Effect of airfoil shape. Comparison of cases 1 and P1 at CFD frames just after LEV onset.
14 of 18
American Institute of Aeronautics and Astronautics
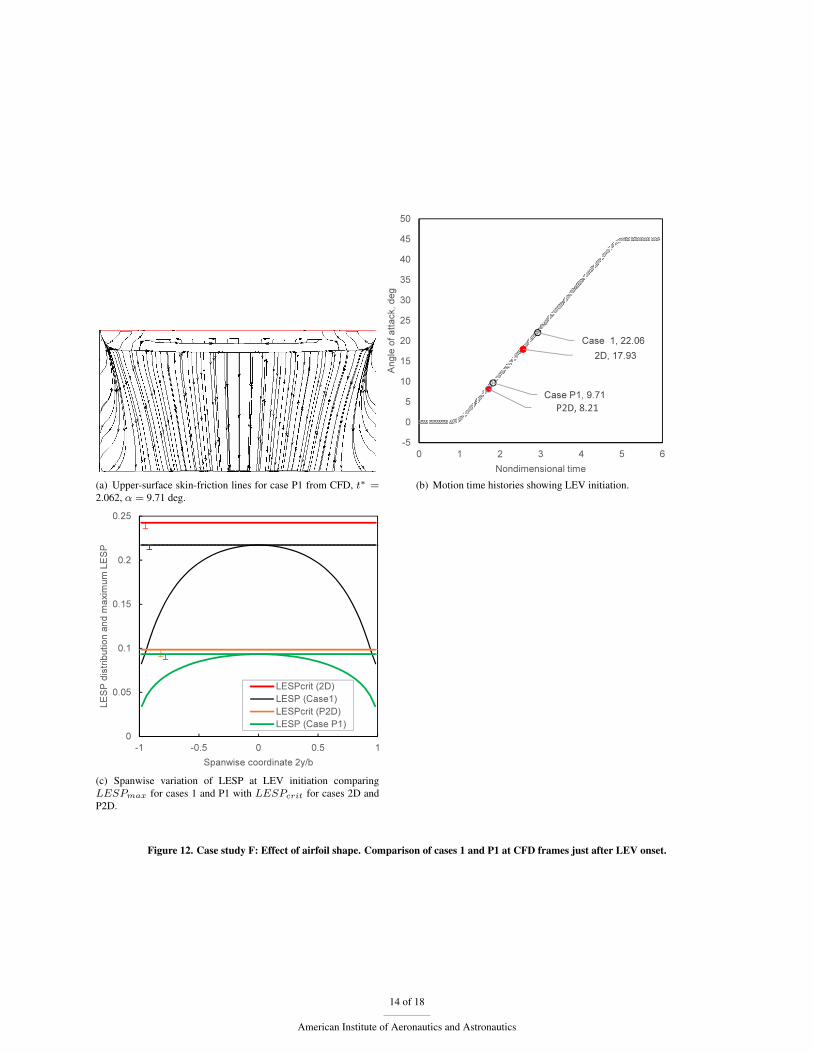
G. Comparison of LEV-initiation results for all cases
Table 8. Summary of LEV-initiation results for all cases.
Name Time [sec] Spanwise αcrit Maximum LESP Predictedlocation [%] [deg] location [%]
2D 2.565 (-0.045) n/a 17.93 (-0.52) 0.2425 (-0.0069) n/aCase 1 2.925 (-0.045) 0.0 (±12.1) 22.06 (-0.52) 0.2172 (-0.0051) 0.0 (±3.3)Case 2 3.375 (-0.045) 0.0 (±2.5) 27.22 (-0.52) 0.2125 (-0.0052) 0.0 (±3.3)Case 3 3.015 (-0.045) 52.8 (±6.6) 23.09 (-0.52) 0.2024 (-0.0044) 32.0 (±3.3)Case 4 3.510 (-0.045) 52.8 (±6.6) 28.76 (-0.52) 0.2027 (-0.0044) 32.0 (±3.3)Case 5 2.565 (-0.045) 65.1 (±13.2) 17.93 (-0.52) 0.2104 (-0.0051) 32.0 (±3.3)Case 6 3.060 (-0.045) 64.4 (±12.5) 23.61 (-0.52) 0.2113 (-0.0052) 32.0 (±3.3)Case 7 2.700 (-0.045) 0.0 (±18.7) 19.48 (-0.52) 0.2364 (-0.0071) 0.0 (±3.3)Case 8 3.195 (-0.045) 0.0 (±15.8) 25.15 (-0.52) 0.2366 (-0.0071) 0.0 (±3.3)Case 9 2.745 (-0.045) 59.8 (±11.1) 20.00 (-0.52) 0.2244 (-0.0066) 42.0 (±3.3)Case 10 3.240 (-0.045) 77.7 (±9.1) 25.67 (-0.52) 0.2247 (-0.0066) 42.0 (±3.3)Case 11 2.295 (-0.045) 65.5 (±8.1) 14.84 (-0.52) 0.2239 (-0.0069) 52.0 (±3.3)Case 12 2.790 (-0.045) 65.5 (±8.4) 20.51 (-0.52) 0.2256 (-0.0068) 52.0 (±3.3)Case 13 2.610 (-0.045) 0.0 (±8.1) 18.45 (-0.52) 0.2379 (-0.0075) 0.0 (±3.3)P2D 1.716 (-0.045) n/a 8.21 (-0.52) 0.0985 (-0.0080) n/aCase P1 2.062 (-0.045) 0.0 (±30.1) 9.71 (-0.52) 0.0934 (-0.0060) 0.0 (±3.3)Case P2 2.579 (-0.045) 0.0 (±28.1) 15.09 (-0.52) 0.0915 (-0.0060) 0.0 (±3.3)
2D, 17.93
Case P1, 9.71
Case 1, 22.06
Case P2, 15.09
Case 2, 27.22
Case 3, 23.09
Case 4, 28.76
Case 5, 17.93
Case 6, 23.61Case 7, 19.48
Case 8, 25.15
Case 9, 20.00
Case 10, 25.67
Case 11, 14.84
Case 12, 20.51
Case 13, 18.45
P2D, 8.21
-5
0
5
10
15
20
25
30
35
40
45
50
0 1 2 3 4 5 6
An
gle
of
att
ack, d
eg
Nondimensional time
Figure 13. Angle of attack at LEV onset for all cases coplotted on the motion-history plot.
The results for LEV initiation for all test cases are tabulated in table 8. The finite-wing cases include 13 caseswith the SD7003 airfoil and 2 cases with the flat-plate geometry. These are compared with LEV initiation on thecorresponding 2D geometries (cases 2D and P2D, for the SD7003 and plate geometries, respectively). Figure 13
15 of 18
American Institute of Aeronautics and Astronautics

coplots the t∗ and α for LEV initiation for the 15 cases and the two 2D cases. It is seen that the spread in α valuefor LEV initiation on the finite wings with the SD7003 airfoil is almost 14 degrees, from 14.84 degrees for case 11to 28.76 degrees for case 4. For the two finite wings with plate geometry, the spread is approximately 5 degrees dueto change in pivot location. These spreads show that α is not a good parameter for developing a general criterion forLEV initiation.
LESPcrit (P2D)
LESPcrit (2D)
LESPmax (Case1)LESPmax (Case2)
LESPmax (Case3)LESPmax (Case4)
LESPmax (Case5)LESPmax (Case6)
LESPmax (Case7)LESPmax (Case8)
LESPmax (Case9)LESPmax (Case10)
LESPmax (Case11)
LESPmax (Case12)
LESPmax (Case13)
LESPmax (Case P1)
LESPmax (Case P2)
0
0.05
0.1
0.15
0.2
0.25
-1.00 -0.50 0.00 0.50 1.00
LE
SP
dis
trib
utio
n a
nd
ma
xim
um
LE
SP
Spanwise coordinate 2y/b
Figure 14. Coplot of spanwise LESP distributions at LEV onset, showing LESPmax for wing cases and LESPcrit for the 2D cases.
Figure 14 shows a coplot of spanwise LESP distributions at LEV onset for all the finite wing cases. Also shownas horizontal lines with error bars are the LESPmax values for the wing cases and the LESPcrit values for the 2Dcases. Considering the plate-geometry cases (cases P2D, P1, and P2) first, it is seen that the LESPmax values forcases P1 and P2 differ by only 0.0018 from an average value of 0.0924, which is quite close to the LESPcrit of0.0985 for case P2D. Considering the SD7003-geometry cases next, it is seen that the spread in LESPmax values isconcentrated in a narrow band around a value of 0.2204, with a spread of 0.0355 from 0.2024 for case 3 to 0.2379 forcase 13. The average value of 0.22 is reasonable close to the LESPcrit value of 0.2067 for case 2D. If this averagevalue of LESPmax = 0.2204 is used as a pre-specified critical value to determine LEV initiation on all the 13 finitewing cases with the SD7003 geometry (cases 1 to 13), the predicted α for LEV initiation agrees with the αcrit valueslisted for cases 1–13 in table 8 with a maximum error of 2.10 degrees. More specifically, the error is within a bandof 3.3 degrees, ranging from 1.20-degree error for case 13 to −2.10-degree error for case 3. This maximum error of2.10 degrees is much smaller than the overall spread of almost 14 degrees in αcrit for the 13 cases. This result showsthat the LESPmax is a much better parameter to use as a universal criterion to predict initiation of LEV formation onfinite wings. It is believed that the spread of 0.0355 in LESPmax can be further decreased with improved modelingof the separated wake vortices from the tips of finite wings. Even with the current model, however, it is seen that thet∗ and spanwise location for initiation of LEV formation on a finite wing are determined by the maximum value of thespanwise variation of LESP reaching a critical value. This critical value depends only on the wing cross-section and
16 of 18
American Institute of Aeronautics and Astronautics

Reynolds number, and does not depend on motion kinematics.
17 of 18
American Institute of Aeronautics and Astronautics

V. Conclusion
In previous research, a criterion, based on a newly-developed Leading-Edge Suction Parameter (LESP), was devel-oped for prediction of initiation of LEV formation in airfoil flows. The aim of the current work was to explore if thisLESP criterion would also successfully predict LEV initiation on finite wings. A two-pronged approach was used forthis study, combining low-order and high-order modeling of pitch-up motions for a large range of wing shapes. For thelow-order modeling effort, an unsteady vortex lattice method (UVLM) was developed. The UVLM was used to cal-culate the spanwise variation of LESP for any wing shape undergoing unsteady motion. For the high-order modeling,a RANS CFD code was used to study LEV formation on pitching wings, with specific attention to the instant of LEVinitiation. By studying 15 wing shapes with variations in planform geometry, pivot location, twist angle, aspect ratio,and cross-section shape, the maximum values of the spanwise LESP variations for the wings at LEV initiation werecompared. It was seen that, for any given airfoil shape and Reynolds number, this maximum LESP value for all thewings was acceptably close to the critical LESP for the 2D airfoil. Deviations in the maximum LESP value fromthe 2D LESPcrit is attributed primarily to insufficient fidelity in modeling the tip vortex structure, which significantlyaffects the leading-edge flows on low-aspect-ratio wings.
While further refinement of the study is needed to better model the tip-vortex flow in the UVLM formulation, thecurrent results do show that initiation of LEV formation on finite wings is governed by a critical value of the LESP.During any motion, when the LESP on any spanwise portion of the wing reaches this critical value, LEV formation ininitiated at that location. This criticality condition could be used to turn “on” or “off” LEV shedding on finite wingswith rounded leading edges. Such a capability would enable more realistic low-order prediction of LEV-dominatedwing flows.
Acknowledgments
The authors wish to gratefully acknowledge the support of the U.S. Air Force Office of Scientific Research throughgrant FA 9550-13-1-0179 and program manager Dr. Douglas Smith.
References1Ramesh, K., Gopalarathnam, A., Ol, M. V., Granlund, K., and Edwards, J. R., “Augmentation of Inviscid Airfoil Theory to Predict and Model
2D Unsteady Vortex Dominated Flows,” AIAA Paper 2011-3578, 41st AIAA Fluid Dynamics Conference and Exhibit, 2011.2Ramesh, K., Gopalarathnam, A., Granlund, K., Ol, M. V., and Edwards, J. R., “Discrete-vortex method with novel shedding criterion for
unsteady airfoil flows with intermittent leading-edge vortex shedding,” Journal of Fluid Mechanics, Vol. 751, 2014, pp. 500–538.3Ramesh, K., Gopalarathnam, A., Edwards, J. R., Ol, M. V., and Granlund, K., “An Unsteady Airfoil Theory Applied to Pitching Motions
Validated Against Experiment and Computation,” Theoretical and Computational Fluid Dynamics, Vol. 27, No. 6, 2013, pp. 843–864.4Katz, J. and Plotkin, A., Low-Speed Aerodynamics, Cambridge university press, 2nd ed., 2001.5Levin, D. and Katz, J., “Vortex-Lattice Method for the Calculation of the nonsteady Separated Flow over Delta Wings,” Journal of Aircraft,
Vol. 18, No. 12, 1980, pp. 1032–1037.6Cassidy, D. A., Edwards, J. R., and Tian, M., “An Investigation of Interface-Sharpening Schemes for Multiphase Mixture Flows,” Journal of
Computational Physics, Vol. 228, No. 16, 2009, pp. 5628–5649.7Edwards, J. R., Boles, J. A., and Baurle, R. A., “Large-Eddy / Reynolds-Averaged Navier-Stokes Simulation of a Supersonic Reacting Wall
Jet,” Combustion & Flame, Vol. 159, No. 3, 2012, pp. 1127–1138.8Yilmaz, T. O. and Rockwell, D., “Flow structure on finite-span wings due to pitch-up motion,” Jounal of Fluid Mechanics, Vol. 691, 2012,
pp. 518–545.9Selig, M. S., Donovan, J. F., and Fraser, D. B., Airfoils at Low Speeds, Soartech 8, SoarTech Publications, Virginia Beach, Virginia, 1989.
18 of 18
American Institute of Aeronautics and Astronautics