Detecting Network Neutrality Violations with Causal Inference
27
Detecting Network Neutrality Violations with Causal Inference Mukarram Bin Tariq, Murtaza Motiwala Nick Feamster, Mostafa Ammar Georgia Tech http://gtnoise.net/nano/
description
Detecting Network Neutrality Violations with Causal Inference. Mukarram Bin Tariq, Murtaza Motiwala Nick Feamster, Mostafa Ammar Georgia Tech http://gtnoise.net/nano/. The Network Neutrality Debate. Users have little choice of access networks. - PowerPoint PPT Presentation
Transcript of Detecting Network Neutrality Violations with Causal Inference
Detecting Network Neutrality Violations with Causal Inference
Mukarram Bin Tariq, Murtaza MotiwalaNick Feamster, Mostafa Ammar
Georgia Tech
http://gtnoise.net/nano/
2
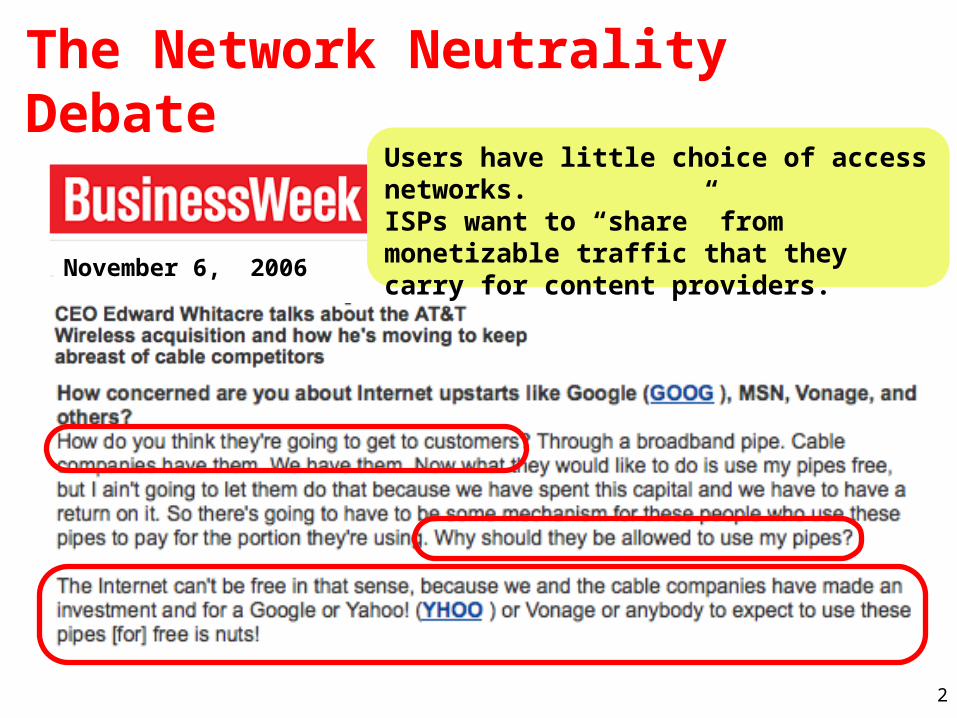
November 6, 2006
The Network Neutrality DebateUsers have little choice of access networks.ISPs want to “share” from monetizable traffic that they carry for content providers.
3
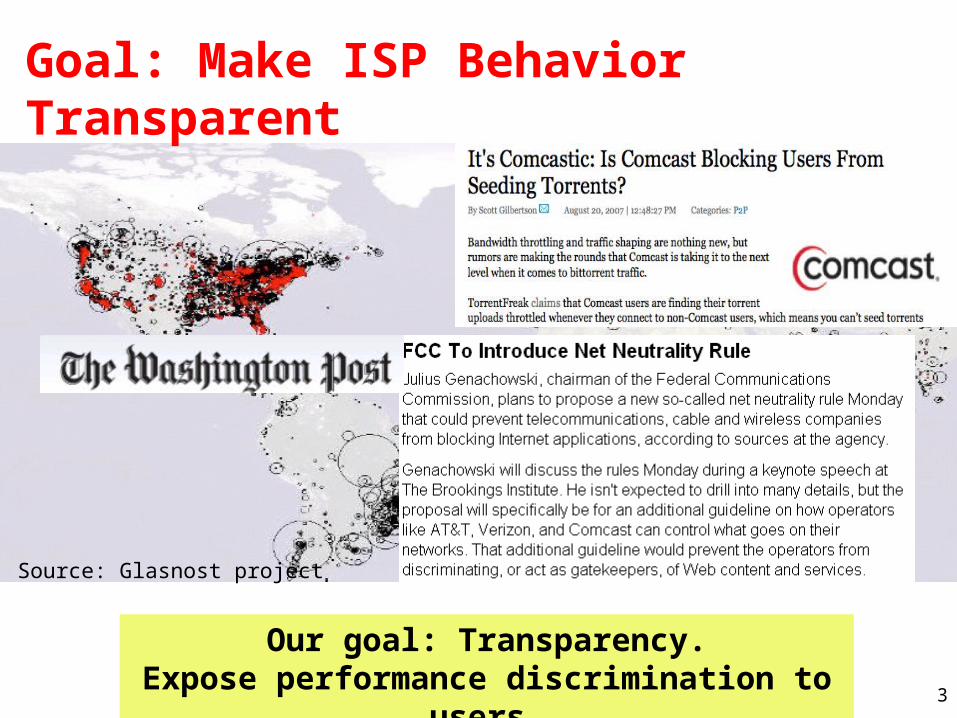
Goal: Make ISP Behavior Transparent
Our goal: Transparency.Expose performance discrimination to users.
Source: Glasnost project
4
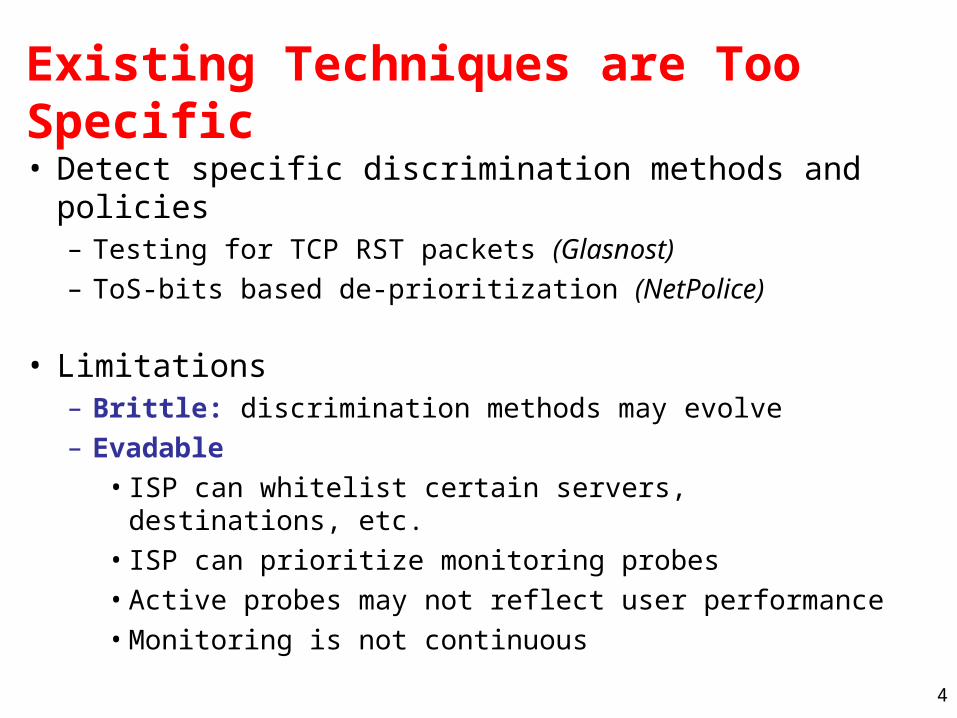
Existing Techniques are Too Specific
• Detect specific discrimination methods and policies– Testing for TCP RST packets (Glasnost) – ToS-bits based de-prioritization (NetPolice)
• Limitations– Brittle: discrimination methods may evolve– Evadable
• ISP can whitelist certain servers, destinations, etc.• ISP can prioritize monitoring probes• Active probes may not reflect user performance• Monitoring is not continuous
5
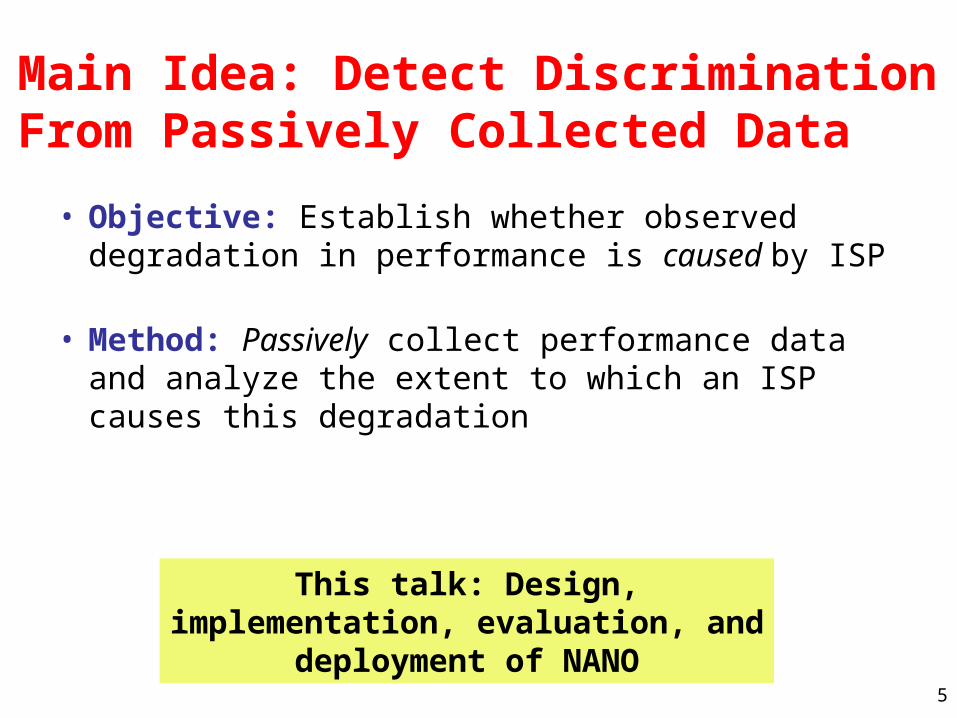
Main Idea: Detect Discrimination From Passively Collected Data
• Objective: Establish whether observed degradation in performance is caused by ISP
• Method: Passively collect performance data and analyze the extent to which an ISP causes this degradation
This talk: Design, implementation, evaluation, and deployment of NANO
6
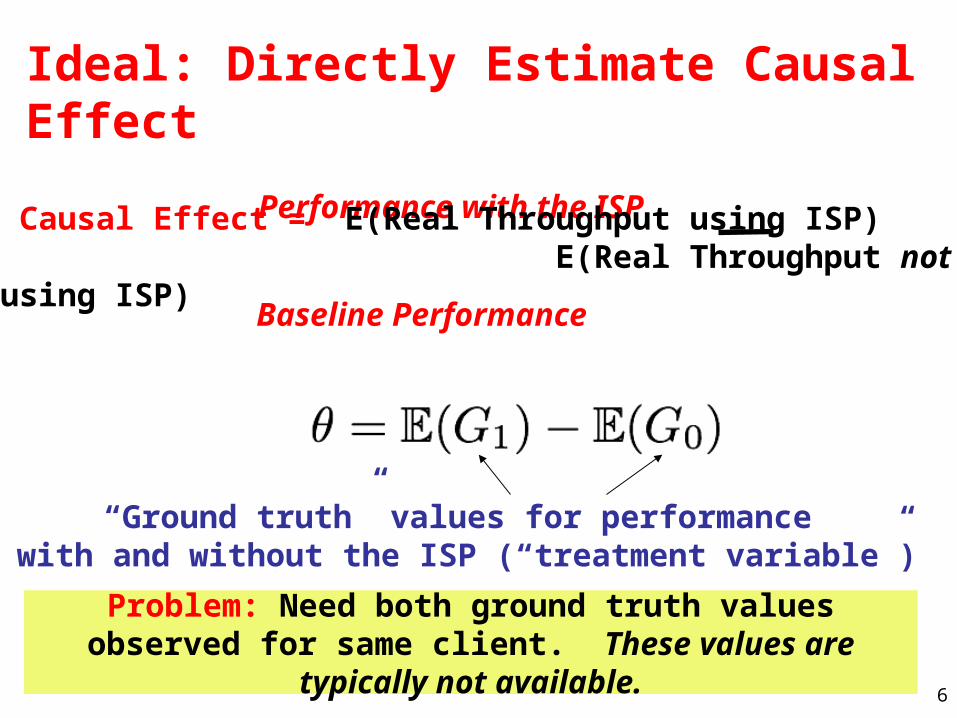
Ideal: Directly Estimate Causal Effect
Baseline Performance
Performance with the ISP Causal Effect = E(Real Throughput using ISP) E(Real Throughput not using ISP)
“Ground truth” values for performance with and without the ISP (“treatment variable”)
Problem: Need both ground truth values observed for same client. These values are typically not available.
7
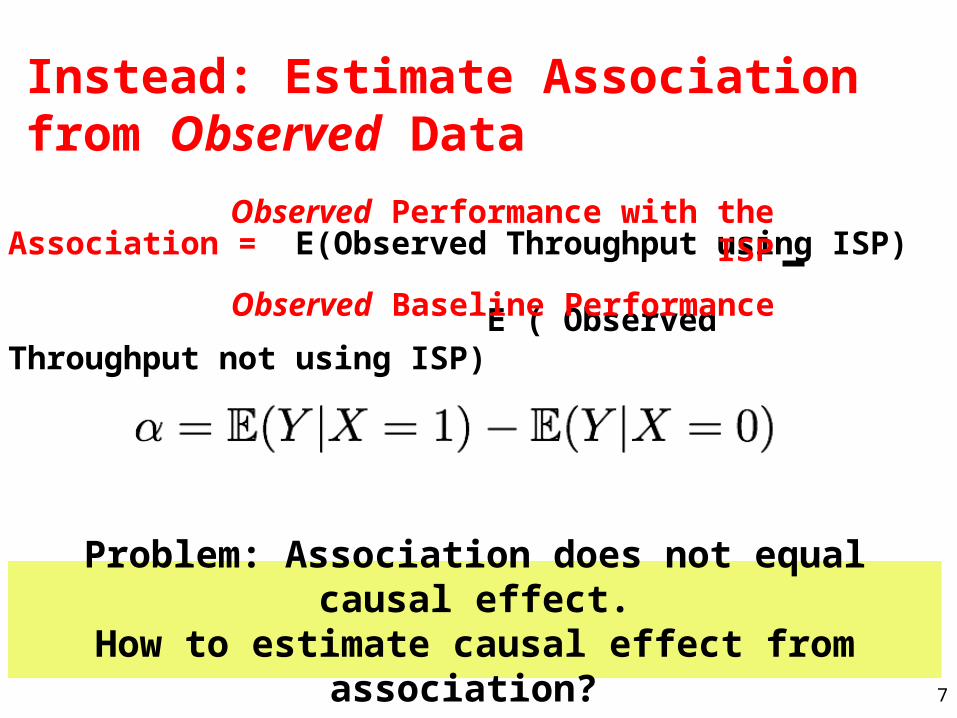
Association = E(Observed Throughput using ISP)
E ( Observed Throughput not using ISP)
Instead: Estimate Association from Observed Data
Observed Baseline Performance
Observed Performance with the ISP
Problem: Association does not equal causal effect.How to estimate causal effect from association?
8
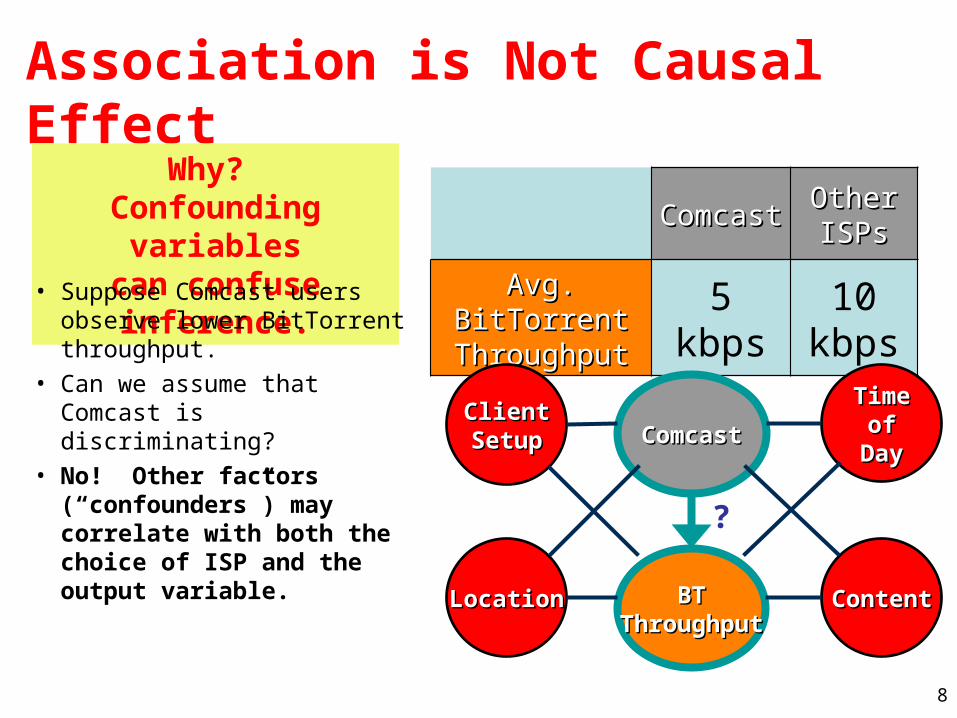
Association is Not Causal Effect
ComcastComcast OtherOtherISPsISPs
Avg. Avg. BitTorrentBitTorrent
ThroughputThroughput
5 kbps
10 kbps
ComcasComcastt
BTBTThroughputThroughput
?
ClientClientSetupSetup
TimeTimeofofDayDay
ContentContentLocationLocation
Why? Confounding variablescan confuse inference.
• Suppose Comcast users observe lower BitTorrent throughput.
• Can we assume that Comcast is discriminating?
• No! Other factors (“confounders”) may correlate with both the choice of ISP and the output variable.

9
Strawman: Random Treatment
• Treat subjects randomly, irrespective of their initial health.
• Measure association with new outcome.
• Association converges to causal effect if the confounding variables do not change during treatment.
= 0.8 - 0.25 = 0.55
Treated
H H H
H S
Untreated
H
S S
S
S
H H
HSS
S S S
α θ
Common approach in epidemiology.
S = “sick”H = “healthy”
10
The Internet Does Not Permit Random Treatment
• Random treatment requires changing ISP.
• Problems– Cumbersome: Nearly impossible to achieve for large
number of users– Does not eliminate all confounding variables (e.g.,
change of equipment at user’s home network)
Alternate approach: Stratification
11
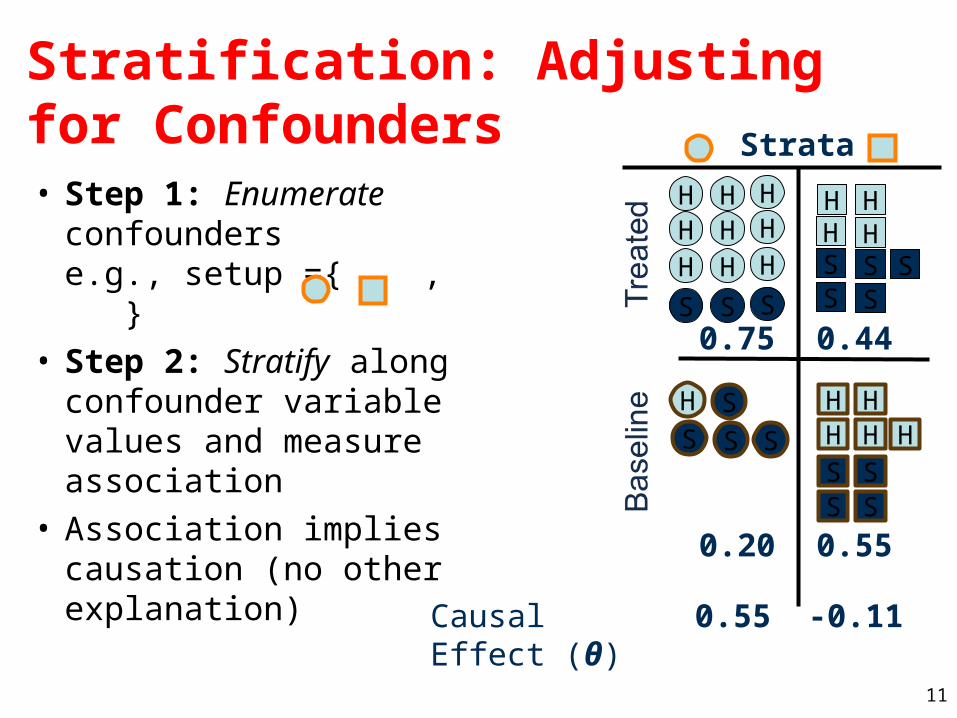
Stratification: Adjusting for Confounders• Step 1: Enumerate
confounderse.g., setup ={ , }
• Step 2: Stratify along confounder variable values and measure association
• Association implies causation (no otherexplanation)
H H HH H H
H H H
S S S
H SS S S
H HH HS SS S
S
H HH H HS SS S
0.75 0.44
0.20 0.55
Strata
0.55 -0.11Causal Effect (θ)
12
Stratification on the Internet: Challenges
• What is baseline performance?
• What are the confounding variables?
• Which data to use, and how to collect it?
• How to infer the discrimination method?
13
What is the baseline performance?
• Baseline: Service performance when ISP not used– Need some ISP for comparison
• Approach: Average performance over other ISPs
• Limitation: Other ISPs may also discriminate
14
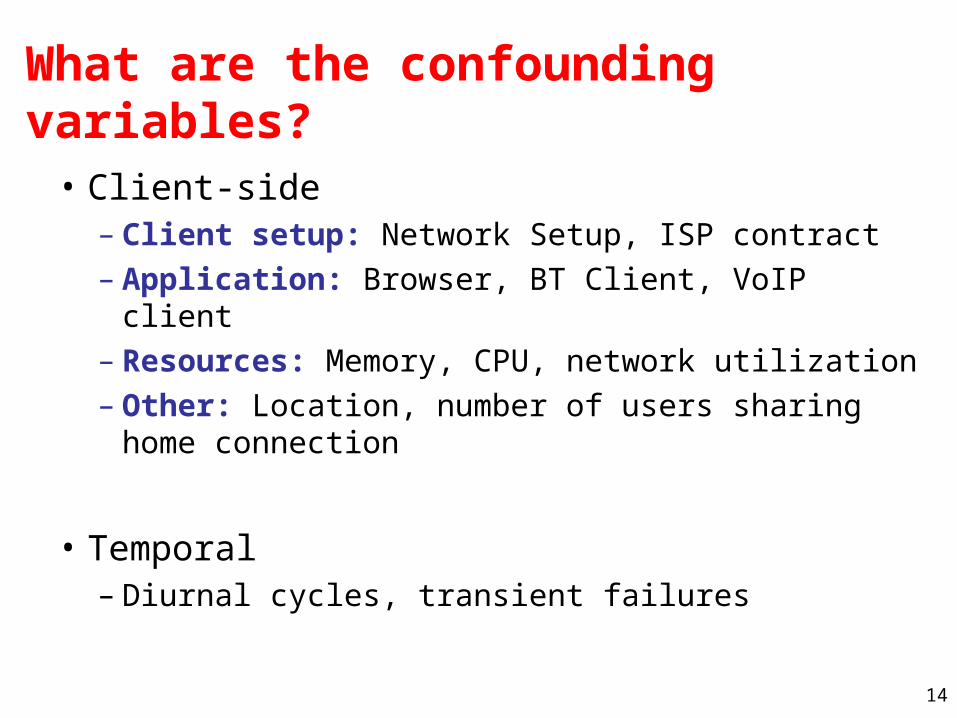
What are the confounding variables?
• Client-side– Client setup: Network Setup, ISP contract– Application: Browser, BT Client, VoIP client– Resources: Memory, CPU, network utilization– Other: Location, number of users sharing home
connection
• Temporal– Diurnal cycles, transient failures
15
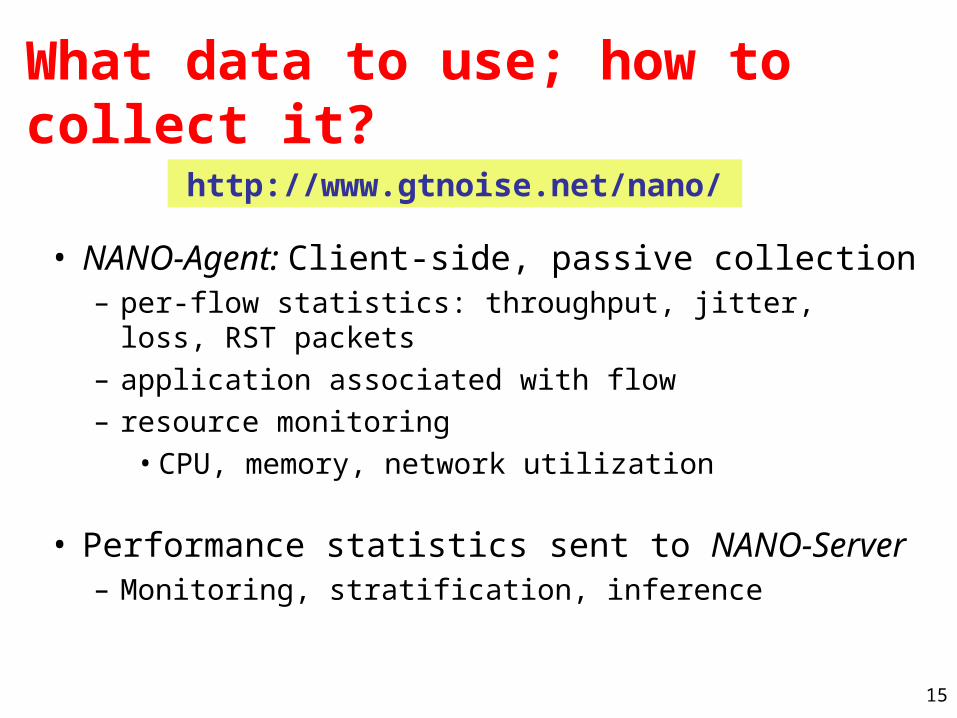
What data to use; how to collect it?
• NANO-Agent: Client-side, passive collection – per-flow statistics: throughput, jitter, loss, RST packets– application associated with flow– resource monitoring
• CPU, memory, network utilization
• Performance statistics sent to NANO-Server– Monitoring, stratification, inference
http://www.gtnoise.net/nano/
16
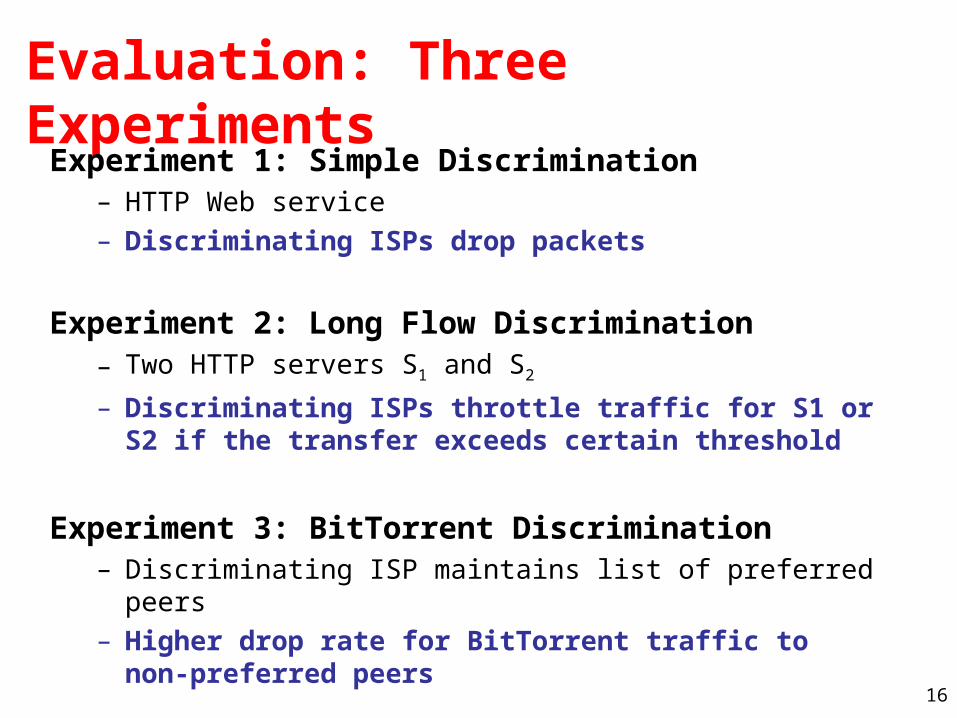
Evaluation: Three ExperimentsExperiment 1: Simple Discrimination
– HTTP Web service– Discriminating ISPs drop packets
Experiment 2: Long Flow Discrimination– Two HTTP servers S1 and S2
– Discriminating ISPs throttle traffic for S1 or S2 if the transfer exceeds certain threshold
Experiment 3: BitTorrent Discrimination– Discriminating ISP maintains list of preferred peers – Higher drop rate for BitTorrent traffic to non-preferred
peers
17
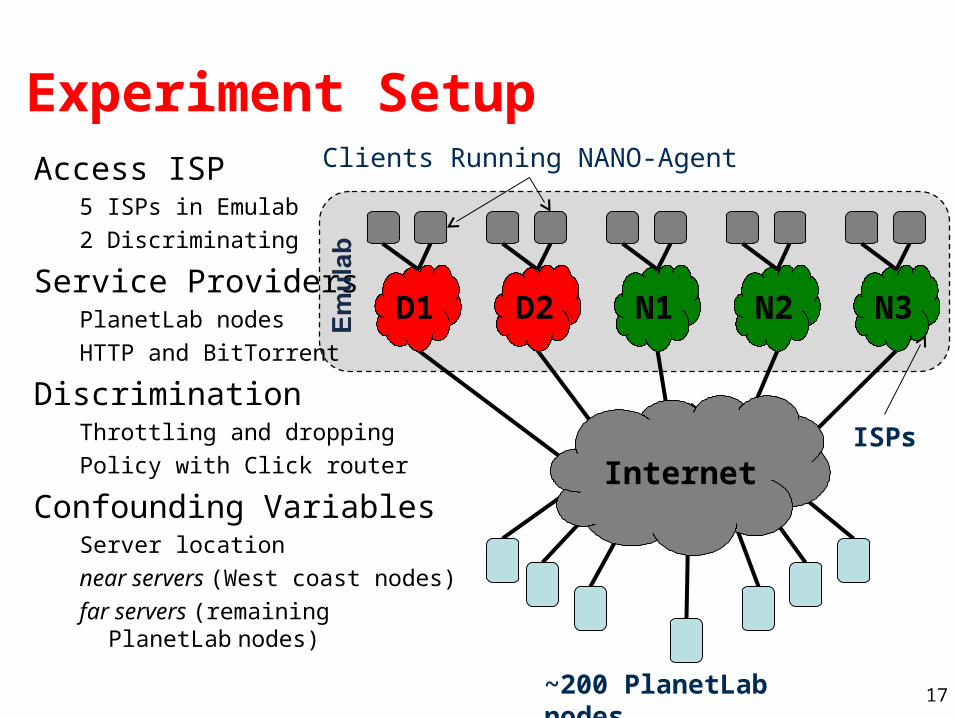
Experiment SetupAccess ISP
5 ISPs in Emulab
2 Discriminating
Service ProvidersPlanetLab nodes
HTTP and BitTorrent
DiscriminationThrottling and dropping
Policy with Click router
Confounding VariablesServer location
near servers (West coast nodes)
far servers (remaining PlanetLab nodes)
Internet
D1 D2 N1 N2 N3
~200 PlanetLab nodes
ISPs
Clients Running NANO-Agent
18
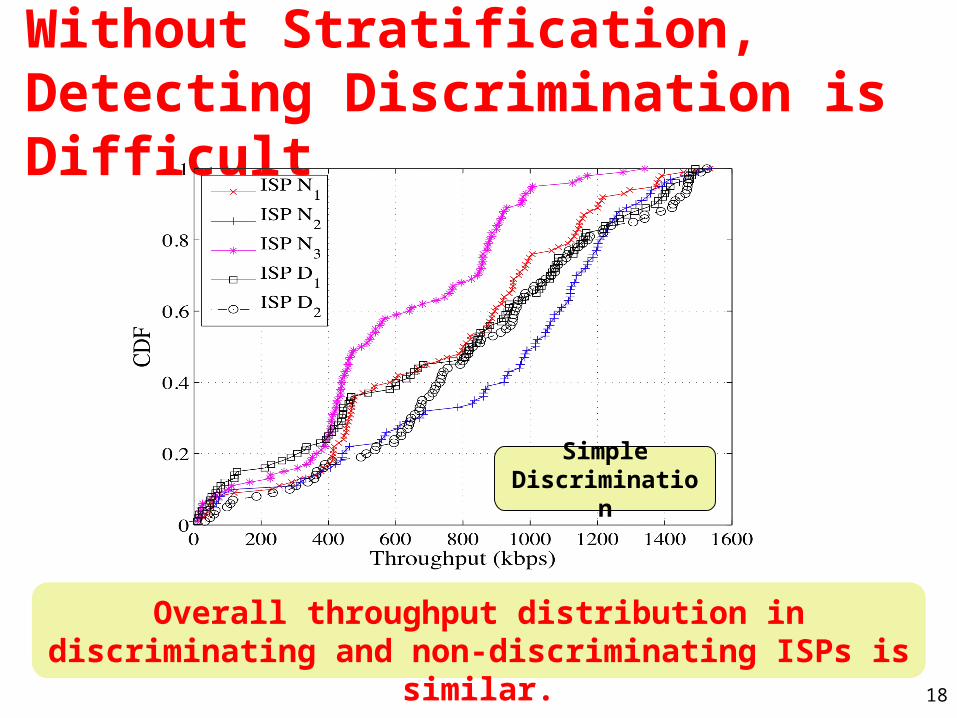
Without Stratification, Detecting Discrimination is Difficult
Overall throughput distribution in discriminating and non-discriminating ISPs is similar.
Simple Discrimination
19
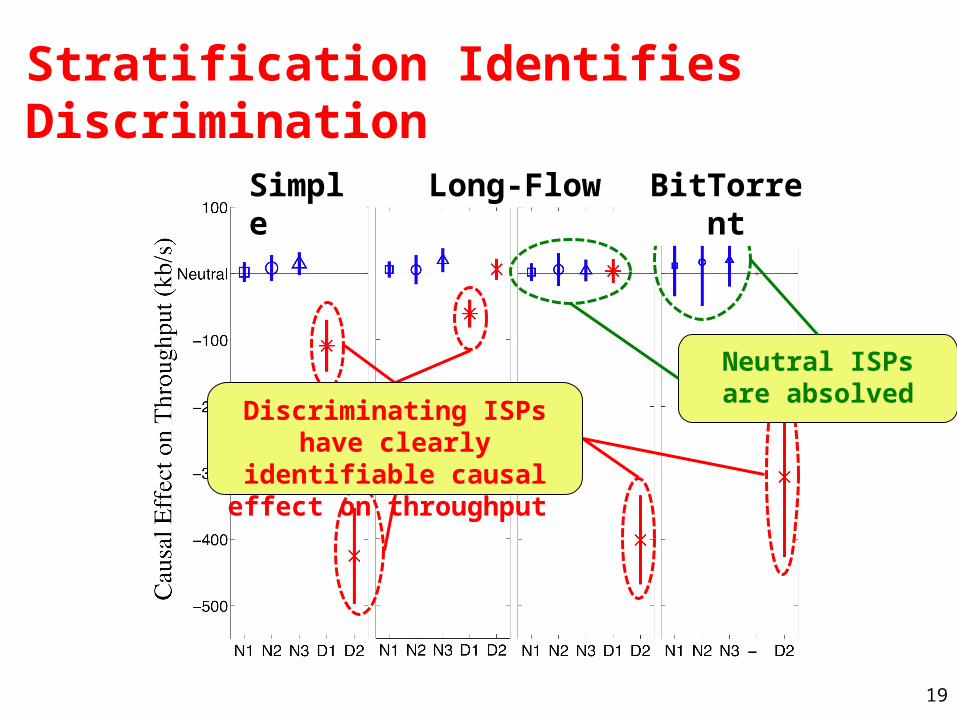
Stratification Identifies Discrimination
Discriminating ISPs have clearly identifiable causal
effect on throughput
Neutral ISPs are absolved
Simple Long-Flow BitTorrent

20
Implementation and Deployment
• Implementation– Linux version available– Windows and MacOS versions in progress
• Now: 27 users– Need thousands for inference
• Performance dashboard may help attract users
Throughput DNSLatency
TrafficBreakdown
PerformanceRelative to Other Users
http://gtnoise.net/nano/

21
Summary and Next Steps
• Internet Service Providers discriminate against classes of users and application traffic today.
• Need passive approach– ISP discrimination techniques can evolve, or may not be
known to users.– Tradeoff: Must be able to enumerate confounders
• NANO: Network Access Neutrality Observatory– Infers discrimination from passively collected data– Detection succeeds in controlled environments– Deployment in progress. Need more users.
http://gtnoise.net/nano/

22
23
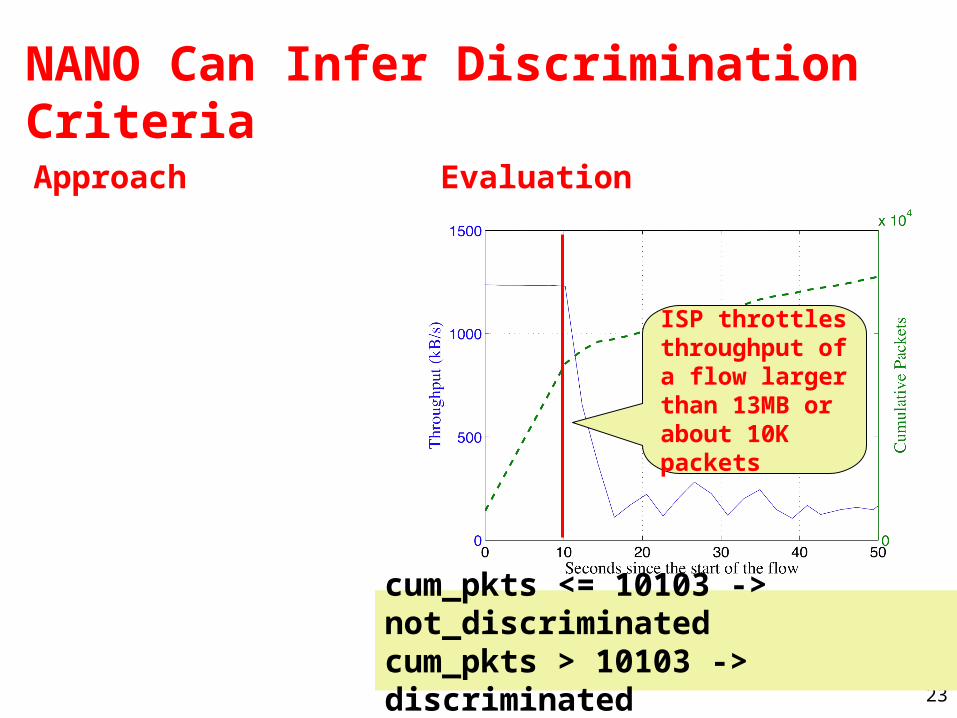
NANO Can Infer Discrimination Criteria
ISP throttles throughput of a flow larger than 13MB or about 10K packets
cum_pkts <= 10103 -> not_discriminatedcum_pkts > 10103 -> discriminated
EvaluationApproach
24
Sufficiency of Confounding Variables
25
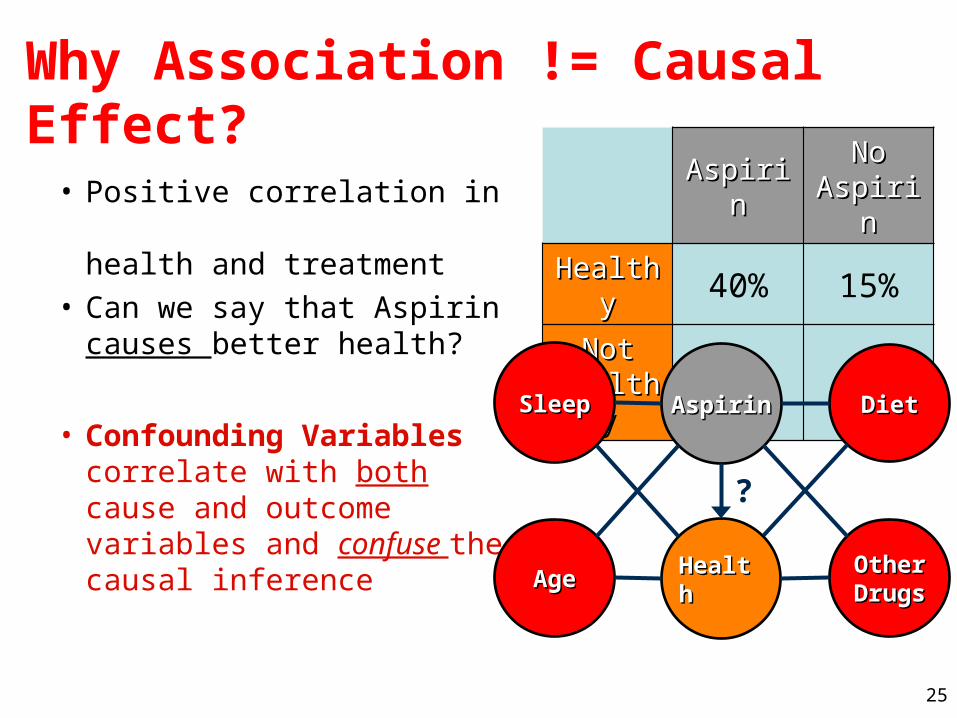
Why Association != Causal Effect?
• Positive correlation in health and treatment
• Can we say that Aspirincauses better health?
• Confounding Variables correlate with both cause and outcome variables and confuse the causal inference
AspirinAspirin No No AspirinAspirin
HealthyHealthy 40% 15%
Not Not HealthyHealthy 10% 35%
AspirinAspirin
HealtHealthh
?
SleepSleep DietDiet
OtherOtherDrugsDrugsAgeAge
29
Causality: An Analogy from Health
• Epidemiology: study causal relationships between risk factors and health outcome
• NANO: infer causal relationship between ISP and service performance degradation
30
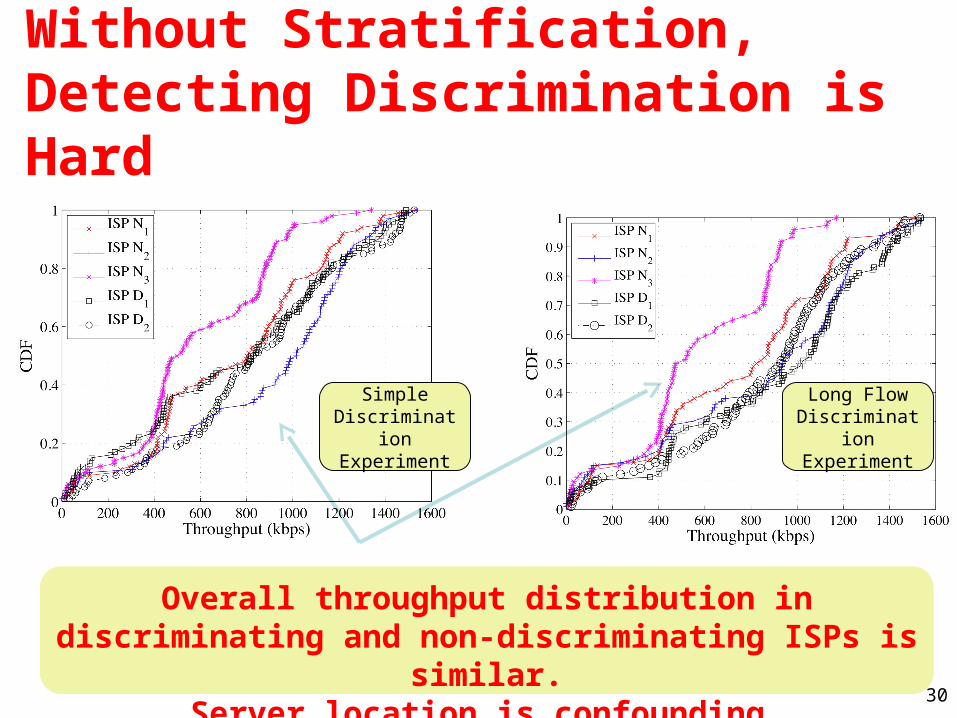
Without Stratification, Detecting Discrimination is Hard
Overall throughput distribution in discriminating and non-discriminating ISPs is similar.
Server location is confounding.
Simple Discrimination
Experiment
Long Flow Discrimination
Experiment