Design of an Electrically Small, Planar Quasi-Isotropic ...
14
applied sciences Article Design of an Electrically Small, Planar Quasi-Isotropic Antenna for Enhancement of Wireless Link Reliability under NLOS Channels Sonapreetha Mohan Radha 1 , Mingyu Jung 2 , Pangun Park 2 and Ick-Jae Yoon 1, * 1 Department of Electrical Engineering, Chungnam National University, Daejeon 34134, Korea; [email protected] 2 Department of Radio and Information Communications Engineering, Chungnam National University, Daejeon 34134, Korea; [email protected] (M.J.); [email protected] (P.P.) * Correspondence: [email protected] Received: 29 July 2020; Accepted: 3 September 2020; Published: 7 September 2020 Abstract: The performance of wireless networks can be greatly influenced by the radiation pattern and polarization of the antennas at the nodes, especially when they are under non-line-of-sight (NLOS) channel environments. In this study, we designed a planar quasi-isotropic antenna based on the combination of a meandered electric dipole and an electrically small loop at a frequency of 2.45 GHz. Its electrical size (ka) is 0.47 and shows a gain deviation of 3.01 dB with radiation efficiency of 82.6% per the simulation. The performance of a wireless link under the line-of-sight and NLOS channels in an indoor environment was measured using the proposed quasi-isotropic antenna as a receiving antenna after validating its radiation and impedance properties experimentally (the measured gain deviation: 5.2 dB, the measured radiation efficiency: 79.2%). This study demonstrates that better properties are achieved using the quasi-isotropic antenna. The quasi-isotropic antenna shows an improved packet delivery ratio (PDR) and received signal strength indicator (RSSI) compared to the results using omni-directional antennas as a transmitting and receiving pair in the NLOS channels. To the best of our knowledge, the experimental validation of the enhancement of wireless link reliability using a quasi-isotropic antenna has not been reported before, and was first carried out in this study. Keywords: isotropic radiation pattern; electrically small antennas; radiation pattern synthesis; mission-critical wireless network 1. Introduction Wireless networks provide a scalable and cost-effective solution for a large number of Internet of Things applications due to the prohibitively high cost and practical difficulty of employing cables in complex control environments [1,2]. They provide considerable benefits such as simple deployment, low installation cost, and high flexibility of operation and monitoring of the control systems. There is a strong push from industrial control systems to apply wireless networks as critical infrastructure for enabling mission-critical control systems such as factory automation and power network protection [1,3]. Mission-critical wireless networks must support the right decision at the right moment, even in the presence of unexpected congestion, network failures, or external manipulations of the environment. Unreliable communication may result in significant performance degradation, and even more severe problems such as critical economic loss, human injury, and/or environmental damage [2,4]. The use of wireless networks for data transmission always introduces non-zero transmission error probability, since it is vulnerable to fading and interference. Several studies have shown the poor reliability in terms of received signal strength indication (RSSI), packet delivery ratio (PDR) degradation, and error burst length in harsh industrial environments [5,6]. One of the major technical Appl. Sci. 2020, 10, 6204; doi:10.3390/app10186204 www.mdpi.com/journal/applsci
Transcript of Design of an Electrically Small, Planar Quasi-Isotropic ...
applied sciences
Article
Design of an Electrically Small, PlanarQuasi-Isotropic Antenna for Enhancement of WirelessLink Reliability under NLOS Channels
Sonapreetha Mohan Radha 1 , Mingyu Jung 2, Pangun Park 2 and Ick-Jae Yoon 1,*1 Department of Electrical Engineering, Chungnam National University, Daejeon 34134, Korea;
[email protected] Department of Radio and Information Communications Engineering, Chungnam National University,
Daejeon 34134, Korea; [email protected] (M.J.); [email protected] (P.P.)* Correspondence: [email protected]
Received: 29 July 2020; Accepted: 3 September 2020; Published: 7 September 2020�����������������
Abstract: The performance of wireless networks can be greatly influenced by the radiation patternand polarization of the antennas at the nodes, especially when they are under non-line-of-sight (NLOS)channel environments. In this study, we designed a planar quasi-isotropic antenna based on thecombination of a meandered electric dipole and an electrically small loop at a frequency of 2.45 GHz.Its electrical size (ka) is 0.47 and shows a gain deviation of 3.01 dB with radiation efficiency of 82.6% perthe simulation. The performance of a wireless link under the line-of-sight and NLOS channels in anindoor environment was measured using the proposed quasi-isotropic antenna as a receiving antennaafter validating its radiation and impedance properties experimentally (the measured gain deviation:5.2 dB, the measured radiation efficiency: 79.2%). This study demonstrates that better propertiesare achieved using the quasi-isotropic antenna. The quasi-isotropic antenna shows an improvedpacket delivery ratio (PDR) and received signal strength indicator (RSSI) compared to the resultsusing omni-directional antennas as a transmitting and receiving pair in the NLOS channels. To thebest of our knowledge, the experimental validation of the enhancement of wireless link reliabilityusing a quasi-isotropic antenna has not been reported before, and was first carried out in this study.
Keywords: isotropic radiation pattern; electrically small antennas; radiation pattern synthesis;mission-critical wireless network
1. Introduction
Wireless networks provide a scalable and cost-effective solution for a large number of Internet ofThings applications due to the prohibitively high cost and practical difficulty of employing cables incomplex control environments [1,2]. They provide considerable benefits such as simple deployment,low installation cost, and high flexibility of operation and monitoring of the control systems. There is astrong push from industrial control systems to apply wireless networks as critical infrastructure forenabling mission-critical control systems such as factory automation and power network protection [1,3].Mission-critical wireless networks must support the right decision at the right moment, even in thepresence of unexpected congestion, network failures, or external manipulations of the environment.Unreliable communication may result in significant performance degradation, and even more severeproblems such as critical economic loss, human injury, and/or environmental damage [2,4].
The use of wireless networks for data transmission always introduces non-zero transmissionerror probability, since it is vulnerable to fading and interference. Several studies have shown thepoor reliability in terms of received signal strength indication (RSSI), packet delivery ratio (PDR)degradation, and error burst length in harsh industrial environments [5,6]. One of the major technical
Appl. Sci. 2020, 10, 6204; doi:10.3390/app10186204 www.mdpi.com/journal/applsci

Appl. Sci. 2020, 10, 6204 2 of 14
challenges faced by industrial control applications is the non-line-of-sight (NLOS) channel in whichthe transmitting (Tx) and receiving (Rx) nodes cannot see each other directly due to time-varyingenvironments of mobile nodes and obstructions [7,8]. Although several different techniques such asspread spectrum, time diversity, and channel diversity represent significant achievements of traditionalnetworks, availability and reliability requirements of mission-critical control systems exceed whatcurrent networks can offer [1,2].
An active array antenna system with a beam-scanning feature could be an effective solution but italso increases complexity and has a larger footprint compared to a simple and compact omni-directionalantenna. Instead, the radiation pattern of the antenna at the node is worth reconsideration and shouldbe tested as an alternative solution. The direction of the incoming signal under NLOS channels cannotbe fixed or specified. Thus, a dipole antenna or a directive antenna, which have a null value at a certainpoint of the radiation pattern, may not be appropriate to use. That is, the antenna orientation and itspolarization should have a significant effect on wireless networks [9,10]. Therefore, an antenna withan isotropic radiation pattern, which is ideally a lossless source that can radiate the same intensityof linearly polarized electric field in all directions and receive electromagnetic energy equally fromevery direction in space, is desirable. This perfect isotropic antenna cannot exist, however, since thetransverse electric field in the far-field region cannot have the same magnitude in all directions ifthe field is linearly polarized everywhere [11,12]. Although a transverse electric field with a single,linearly polarized component cannot be uniform over a sphere in the far-field region, the sum of theelectric fields with two polarizations is uniform [13]. The quasi-isotropic radiation pattern can begenerated by the pattern synthesis of small dipoles such that the null point of one dipole is along themaximum-field direction of the other dipole, consequently minimizing the blind spots of each dipole.Cross-placement, proper wrapping of electric dipoles, or a combination of small electric and magneticdipoles are common approaches [14–20]. The reported antennae designed under this principle showa measured gain deviation from 2.6 to 12.9 dB over the entire space [16–25]. They are either in avolumetric or planar form. Whereas the volumetric antennas may have an advantage in terms ofhigher efficiency and more tunability in general, it is the planar ones that can be relatively thinner [26]or even conformal with a generally easier form factor to handle [27,28].
In this study, we designed a highly efficient and electrically small quasi-isotropic planarantenna at 2.45 GHz and examined its feasibility in improving wireless link reliability underNLOS channels. The proposed antenna design is compact and shows a good quasi-isotropicpattern. The simulated results of the impedance and radiation properties were successfully verifiedexperimentally. Wireless link reliability was evaluated using the proposed antenna under line-of-sight(LOS) and NLOS channels. The comparison group used an omni-directional antennas pair, and thepossible and simple solution of improving PDR and RSSI is discussed here.
2. Antenna Design
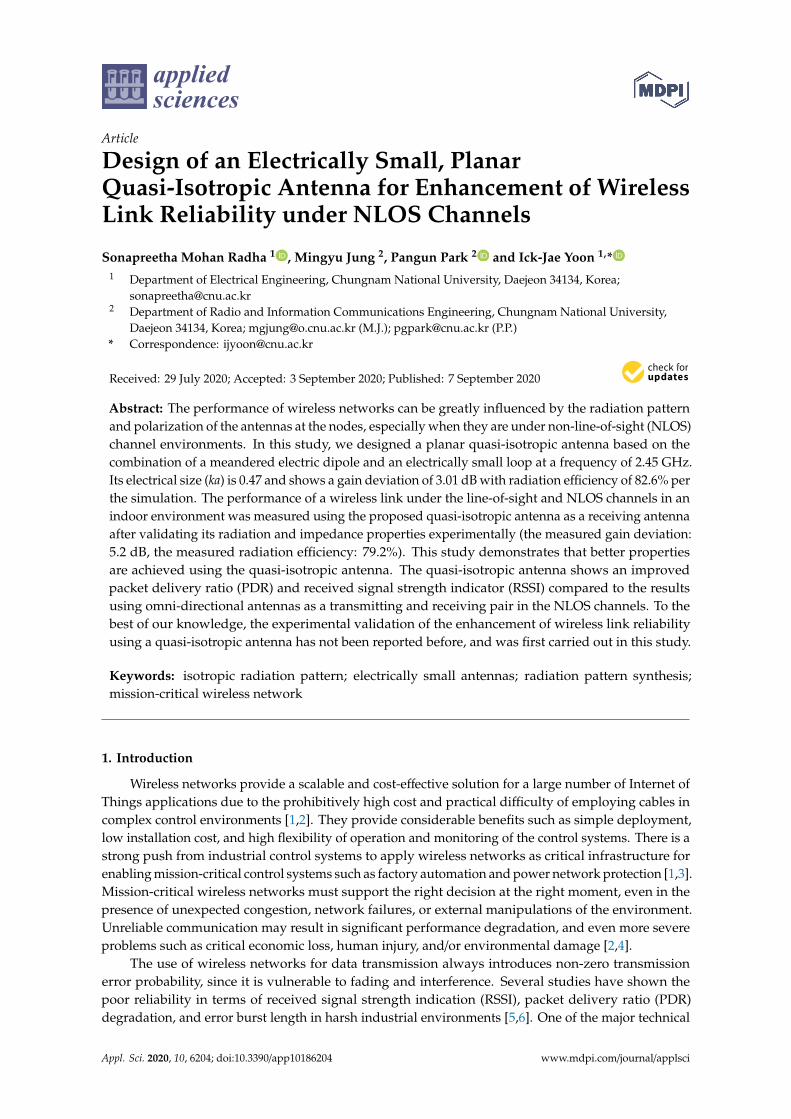
An electrically small planar antenna having a quasi-isotropic radiation pattern was designedas shown in Figure 1a,b. The design parameters are also listed. The antenna is composed of asmall meander dipole and arcs extended from each end of the dipole as in [18]. The arc at the topof the substrate rotates in a counterclockwise direction, while the arc at the bottom rotates in aclockwise direction, and they form a small loop together. Each meander arm is also placed at thetop and bottom of the substrate, and the whole configuration is fed by a coaxial cable at the center.The signal line of the cable is connected at the arm on the top and the outer conductor is connectedat the bottom. The material characteristic of a ferrite bead is characterized and implemented in afull-wave electromagnetic simulation to prevent current flowing over the outer layer of the feedingconductor. This helps to minimize the effect from the feed line such that the radiation patternis not distorted. Ansys HFSS (High Frequency Structure Simulator) was used for the full-waveelectromagnetic simulations.
Appl. Sci. 2020, 10, 6204 3 of 14Appl. Sci. 2020, 10, x FOR PEER REVIEW 3 of 14
(a) (b)
Figure 1. The proposed antenna design with the design parameters: (a) 3D and (b) top views.
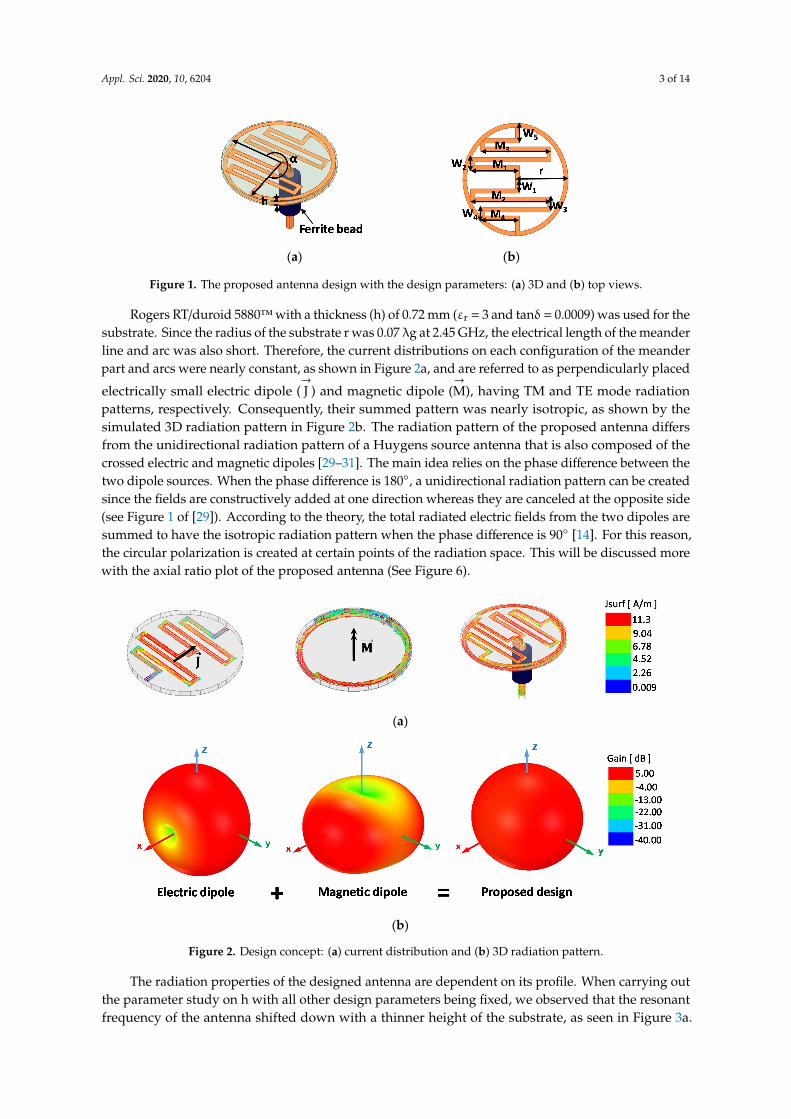
Rogers RT/duroid 5880™ with a thickness (h) of 0.72 mm (εr = 3 and tanδ = 0.0009) was used for the substrate. Since the radius of the substrate r was 0.07 λg at 2.45 GHz, the electrical length of the meander line and arc was also short. Therefore, the current distributions on each configuration of the meander part and arcs were nearly constant, as shown in Figure 2a, and are referred to as perpendicularly placed electrically small electric dipole (J⃗ and magnetic dipole (M⃗ , having TM and TE mode radiation patterns, respectively. Consequently, their summed pattern was nearly isotropic, as shown by the simulated 3D radiation pattern in Figure 2b. The radiation pattern of the proposed antenna differs from the unidirectional radiation pattern of a Huygens source antenna that is also composed of the crossed electric and magnetic dipoles [29–31]. The main idea relies on the phase difference between the two dipole sources. When the phase difference is 180°, a unidirectional radiation pattern can be created since the fields are constructively added at one direction whereas they are canceled at the opposite side (see Figure 1 of [29]). According to the theory, the total radiated electric fields from the two dipoles are summed to have the isotropic radiation pattern when the phase difference is 90° [14]. For this reason, the circular polarization is created at certain points of the radiation space. This will be discussed more with the axial ratio plot of the proposed antenna (See Figure 6).
(a)
(b)
Figure 2. Design concept: (a) current distribution and (b) 3D radiation pattern.
The radiation properties of the designed antenna are dependent on its profile. When carrying out the parameter study on h with all other design parameters being fixed, we observed that the resonant frequency of the antenna shifted down with a thinner height of the substrate, as seen in
Figure 1. The proposed antenna design with the design parameters: (a) 3D and (b) top views.
Rogers RT/duroid 5880™with a thickness (h) of 0.72 mm (εr = 3 and tanδ= 0.0009) was used for thesubstrate. Since the radius of the substrate r was 0.07 λg at 2.45 GHz, the electrical length of the meanderline and arc was also short. Therefore, the current distributions on each configuration of the meanderpart and arcs were nearly constant, as shown in Figure 2a, and are referred to as perpendicularly placed
electrically small electric dipole (→
J ) and magnetic dipole (→
M), having TM and TE mode radiationpatterns, respectively. Consequently, their summed pattern was nearly isotropic, as shown by thesimulated 3D radiation pattern in Figure 2b. The radiation pattern of the proposed antenna differsfrom the unidirectional radiation pattern of a Huygens source antenna that is also composed of thecrossed electric and magnetic dipoles [29–31]. The main idea relies on the phase difference between thetwo dipole sources. When the phase difference is 180◦, a unidirectional radiation pattern can be createdsince the fields are constructively added at one direction whereas they are canceled at the opposite side(see Figure 1 of [29]). According to the theory, the total radiated electric fields from the two dipoles aresummed to have the isotropic radiation pattern when the phase difference is 90◦ [14]. For this reason,the circular polarization is created at certain points of the radiation space. This will be discussed morewith the axial ratio plot of the proposed antenna (See Figure 6).
Appl. Sci. 2020, 10, x FOR PEER REVIEW 3 of 14
(a) (b)
Figure 1. The proposed antenna design with the design parameters: (a) 3D and (b) top views.
Rogers RT/duroid 5880™ with a thickness (h) of 0.72 mm (εr = 3 and tanδ = 0.0009) was used for the substrate. Since the radius of the substrate r was 0.07 λg at 2.45 GHz, the electrical length of the meander line and arc was also short. Therefore, the current distributions on each configuration of the meander part and arcs were nearly constant, as shown in Figure 2a, and are referred to as perpendicularly placed electrically small electric dipole (J⃗ and magnetic dipole (M⃗ , having TM and TE mode radiation patterns, respectively. Consequently, their summed pattern was nearly isotropic, as shown by the simulated 3D radiation pattern in Figure 2b. The radiation pattern of the proposed antenna differs from the unidirectional radiation pattern of a Huygens source antenna that is also composed of the crossed electric and magnetic dipoles [29–31]. The main idea relies on the phase difference between the two dipole sources. When the phase difference is 180°, a unidirectional radiation pattern can be created since the fields are constructively added at one direction whereas they are canceled at the opposite side (see Figure 1 of [29]). According to the theory, the total radiated electric fields from the two dipoles are summed to have the isotropic radiation pattern when the phase difference is 90° [14]. For this reason, the circular polarization is created at certain points of the radiation space. This will be discussed more with the axial ratio plot of the proposed antenna (See Figure 6).
(a)
(b)
Figure 2. Design concept: (a) current distribution and (b) 3D radiation pattern.
The radiation properties of the designed antenna are dependent on its profile. When carrying out the parameter study on h with all other design parameters being fixed, we observed that the resonant frequency of the antenna shifted down with a thinner height of the substrate, as seen in
Figure 2. Design concept: (a) current distribution and (b) 3D radiation pattern.
The radiation properties of the designed antenna are dependent on its profile. When carrying outthe parameter study on h with all other design parameters being fixed, we observed that the resonantfrequency of the antenna shifted down with a thinner height of the substrate, as seen in Figure 3a.

Appl. Sci. 2020, 10, 6204 4 of 14
This occurred because the capacitance of the structure increased as the metallic parts at the top andbottom of the substrate grew closer. Such phenomena can also be seen from the input reactance plottedin Figure 3b, where it decreased to negative values when h was smaller. The parameter study resultis summarized in Table 1. The gain deviation worsened slightly when the height of the substrate hwas thicker. This was due to the increased vertical current flowing through the substrate, which wasnot shielded by the ferrite bead. The table also shows that the radiation efficiency increased as theelectrical size of the antenna increased with a thicker h.
Appl. Sci. 2020, 10, x FOR PEER REVIEW 4 of 14
Figure 3a. This occurred because the capacitance of the structure increased as the metallic parts at the
top and bottom of the substrate grew closer. Such phenomena can also be seen from the input
reactance plotted in Figure 3b, where it decreased to negative values when h was smaller. The
parameter study result is summarized in Table 1. The gain deviation worsened slightly when the
height of the substrate h was thicker. This was due to the increased vertical current flowing through
the substrate, which was not shielded by the ferrite bead. The table also shows that the radiation
efficiency increased as the electrical size of the antenna increased with a thicker h.
Table 1. Parameter study results on h.
Parameter (mm) h = 0.32 h = 0.72 h = 1.12
Frequency (GHz) 2.30 2.45 2.51
Gain deviation (dB) 2.66 3.01 3.09
Radiation Efficiency (%) 81.3 82.6 88.6
(a) (b)
Figure 3. Parameter study results on h: (a) Reflection coefficient. (b) Input impedance.
The final design parameters are presented in Table 2. The antenna resonated at 2.45 GHz with
an impedance bandwidth of 1.2% with a −10 dB criterion, as shown in Figure 4. It was electrically
small with its electrical size (ka) of 0.47 at the resonant frequency (k, free-space wave propagation
constant; a, radius of the imaginary sphere enclosing the antenna). The simulated radiation pattern
at the elevation and azimuth planes will be shown in a later section with the measurement results.
The designed antenna showed a quasi-isotropic radiation pattern with a maximum gain deviation of
3.01 dB as shown in Figure 5.
Table 2. Final design parameters of the proposed quasi-isotropic antenna design.
Parameter Value Parameter Value
M1 8.4 W3 2.4
M2 13.8 W4 2
M3 12.1 W5 3.15
M4 6.7 r 9.25
W1 2.2 h 0.72
W2 2 α 271.06º
Note that all the units are in millimeters except α, which is in degrees.
Figure 3. Parameter study results on h: (a) Reflection coefficient. (b) Input impedance.
Table 1. Parameter study results on h.
Parameter (mm) h = 0.32 h = 0.72 h = 1.12
Frequency (GHz) 2.30 2.45 2.51
Gain deviation (dB) 2.66 3.01 3.09
Radiation Efficiency (%) 81.3 82.6 88.6
The final design parameters are presented in Table 2. The antenna resonated at 2.45 GHz withan impedance bandwidth of 1.2% with a −10 dB criterion, as shown in Figure 4. It was electricallysmall with its electrical size (ka) of 0.47 at the resonant frequency (k, free-space wave propagationconstant; a, radius of the imaginary sphere enclosing the antenna). The simulated radiation patternat the elevation and azimuth planes will be shown in a later section with the measurement results.The designed antenna showed a quasi-isotropic radiation pattern with a maximum gain deviation of3.01 dB as shown in Figure 5.
Table 2. Final design parameters of the proposed quasi-isotropic antenna design.
Parameter Value Parameter Value
M1 8.4 W3 2.4
M2 13.8 W4 2
M3 12.1 W5 3.15
M4 6.7 r 9.25
W1 2.2 h 0.72
W2 2 α 271.06º
Note that all the units are in millimeters except α, which is in degrees.

Appl. Sci. 2020, 10, 6204 5 of 14
Appl. Sci. 2020, 10, x FOR PEER REVIEW 5 of 14
Figure 4. Simulation and measurement results of the reflection coefficients of the proposed antenna.
Figure 5. Simulation result of a gain deviation over the entire space at the resonant frequency.
Figure 6. Simulation results of the axial ratio over the entire space.
Lastly, the axial ratio (AR) of the antenna at the resonant frequency was calculated in a spherical
space and is plotted in Figure 6 to show the spatial polarization dependency. We found that a circular
polarization with AR < 3 dB was created at certain points but overall linear polarization was formed.
This can be explained by the antenna configuration with the electric dipole and magnetic dipole being
along the x-axis and the z-axis, respectively. The antenna was linearly polarized when the field
-180 -120 -60 0 60 120 1800
60
120
180Total gain [ dBi ]
Thet
a [
deg
]
Phi [ deg ]
-1.98-1.60-1.23-0.85-0.48-0.100.280.651.03
-180 -120 -60 0 60 120 1800
30
60
90
120
150
180Axial ratio [ dB ]
Thet
a [
deg
]
Phi [ deg ]
0.05001.743.435.126.818.4910.211.913.615.3
Figure 4. Simulation and measurement results of the reflection coefficients of the proposed antenna.
Appl. Sci. 2020, 10, x FOR PEER REVIEW 5 of 14
Figure 4. Simulation and measurement results of the reflection coefficients of the proposed antenna.
Figure 5. Simulation result of a gain deviation over the entire space at the resonant frequency.
Figure 6. Simulation results of the axial ratio over the entire space.
Lastly, the axial ratio (AR) of the antenna at the resonant frequency was calculated in a spherical space and is plotted in Figure 6 to show the spatial polarization dependency. We found that a circular polarization with AR < 3 dB was created at certain points but overall linear polarization was formed. This can be explained by the antenna configuration with the electric dipole and magnetic dipole being along the x-axis and the z-axis, respectively. The antenna was linearly polarized when the field
2.3 2.4 2.5 2.6Frequency [ GHz ]
-30
-20
-10
0
SimulationMeasurement
-180 -120 -60 0 60 120 1800
60
120
180Total gain [ dBi ]
Thet
a [ d
eg ]
Phi [ deg ]
-1.98-1.60-1.23-0.85-0.48-0.100.280.651.03
-180 -120 -60 0 60 120 1800
30
60
90
120
150
180Axial ratio [ dB ]
Thet
a [ d
eg ]
Phi [ deg ]
0.051.743.435.126.818.4910.211.913.615.3
Figure 5. Simulation result of a gain deviation over the entire space at the resonant frequency.
Appl. Sci. 2020, 10, x FOR PEER REVIEW 5 of 14
Figure 4. Simulation and measurement results of the reflection coefficients of the proposed antenna.
Figure 5. Simulation result of a gain deviation over the entire space at the resonant frequency.
Figure 6. Simulation results of the axial ratio over the entire space.
Lastly, the axial ratio (AR) of the antenna at the resonant frequency was calculated in a spherical space and is plotted in Figure 6 to show the spatial polarization dependency. We found that a circular polarization with AR < 3 dB was created at certain points but overall linear polarization was formed. This can be explained by the antenna configuration with the electric dipole and magnetic dipole being along the x-axis and the z-axis, respectively. The antenna was linearly polarized when the field
2.3 2.4 2.5 2.6Frequency [ GHz ]
-30
-20
-10
0
SimulationMeasurement
-180 -120 -60 0 60 120 1800
60
120
180Total gain [ dBi ]
Thet
a [ d
eg ]
Phi [ deg ]
-1.98-1.60-1.23-0.85-0.48-0.100.280.651.03
-180 -120 -60 0 60 120 1800
30
60
90
120
150
180Axial ratio [ dB ]
Thet
a [ d
eg ]
Phi [ deg ]
0.051.743.435.126.818.4910.211.913.615.3
Figure 6. Simulation results of the axial ratio over the entire space.
Lastly, the axial ratio (AR) of the antenna at the resonant frequency was calculated in a sphericalspace and is plotted in Figure 6 to show the spatial polarization dependency. We found that a circularpolarization with AR < 3 dB was created at certain points but overall linear polarization was formed.This can be explained by the antenna configuration with the electric dipole and magnetic dipolebeing along the x-axis and the z-axis, respectively. The antenna was linearly polarized when the fieldcomponents of the two dipoles were in the same magnitude and phase in the xy-plane (i.e., θ = 90◦) and

Appl. Sci. 2020, 10, 6204 6 of 14
the yz-plane (i.e., ϕ = 90◦). This showed a circular polarization at the points in the xz-plane, such aswhen θ is 45◦ and 135◦ and ϕ is 0◦ and 180◦. These occurred where the electric field components of theelectric dipole Eθ and magnetic dipole Eϕ met with same magnitude and 90◦ phase shift. This showedthat the proposed antenna can generate the quasi-isotropic radiation pattern from the sum of twodifferent polarizations from the two different dipole configurations. This also can be verified from thepattern measurement (See Figure 9c). Thus, the proposed antenna shows a quasi-isotropic radiationpattern not only in terms of its magnitude but also in terms of polarization.
3. Fabrication and Measurements
The proposed antenna was fabricated by etching both sides of the same Rogers substrate used inthe simulation and shown in Figure 7a. A U.S. quarter was placed for size comparison. The impedanceresonance characteristic was measured using an Anritsu MS46522B vector network analyzer. As shownby the dashed line in Figure 4, it resonated at 2.47 GHz, showing very good agreement with thecomputed expectation with only negligible deviation. The gain, radiation efficiency, and patterns weremeasured in an anechoic chamber. The two-dimensional electric field radiation pattern measurementwas carried out in the far-field measurement chamber as shown in Figure 7b. It had dimensions of 14× 7× 6.7 m and was available for the frequency range from 200 MHz to 20 GHz with an E5071C ENA seriesnetwork analyzer (Agilent Technologies). The three-dimensional gain and efficiency measurementswere carried out in the mobile antenna measurement chamber shown in Figure 7c. Its dimensionswere 8 × 4 × 4 m and it covered the frequency range from 200 MHz to 6 GHz with an E8362B PNAnetwork analyzer from Agilent Technologies. The proposed antenna was used as a receiver andthe standard horn antenna was used as a source antenna. The radiation pattern of each plane wasmeasured for both horizontal and vertical polarization by rotating the orientation of the source antenna.The simulated and measured peak gains and efficiencies are plotted in Figure 8. The figure shows thatthe measured maximum peak gain and efficiency are 0.8 dBi and 79.2%, respectively, which showssimilar performance to the simulation results.
The normalized simulated and measured radiation patterns along the xy, yz, and xz planes areshown in Figure 9. The figure shows that the radiation patterns in the xy- and yz-planes are nearlyuniform. The pattern in the xz-plane contains two orthogonal omni-directional Eθ and Eφ patternsgenerated by the x-oriented electric dipole and the z-oriented magnetic dipole, respectively (Figure 2a),and the total radiated field shows a quasi-isotropic radiation pattern. The measured result is generallyin good agreement with the simulation results. Finally, the measured gain deviation of the builtantenna is shown in Figure 10. The maximum gain deviation is 5.2 dB with the highest and lowestgains of 0.8 and −4.4 dB, respectively. It differs by 2.2 dB from the computed expectation but is stillacceptable and shows a similar distribution as compared to Figure 5. The non-perfect shielding of themeasurement cable in an anechoic chamber that is perpendicular to the antenna could have caused thedeviation. Note that the vertical current component has a non-negligible effect on the gain deviation.
There is considerable research on the planar quasi-isotropic antenna focusing the frequenciesaround 900 MHz and 2.4 GHz. In Table 3, the performance of the proposed design is compared with thepreviously published measured results around the 2.4 GHz frequency. Table 3 shows that the proposeddesign is electrically smaller and lower-profile. Even though the antenna size is small, it still showscomparable performance in comparison with electrically larger quasi-isotropic antennas. This proposedcompact and planar quasi-isotropic antenna could be an effective design for miniature devices.

Appl. Sci. 2020, 10, 6204 7 of 14Appl. Sci. 2020, 10, x FOR PEER REVIEW 7 of 14
(a)
(b) (c)
Figure 7. Photos of the built antenna and the radiation performance measurement setup. (a) The built prototype of the proposed antenna. (b) The anechoic chamber for the radiation pattern measurement. (c) The anechoic chamber for the three-dimensional gain and efficiency measurement.
Figure 8. Simulation and measurement results of the peak gain and radiation efficiency.
2.46 2.47 2.48 2.49 2.5Frequency [ GHz ]
-1.5
-1
-0.5
0
0.5
1
1.5
20
40
60
80
100
Peak Gain [ Sim. ]Efficiency [ Sim. ]Peak Gain [ Meas.]Efficiency [ Meas. ]
Figure 7. Photos of the built antenna and the radiation performance measurement setup. (a) The builtprototype of the proposed antenna. (b) The anechoic chamber for the radiation pattern measurement.(c) The anechoic chamber for the three-dimensional gain and efficiency measurement.
Appl. Sci. 2020, 10, x FOR PEER REVIEW 7 of 14
(a)
(b) (c)
Figure 7. Photos of the built antenna and the radiation performance measurement setup. (a) The built
prototype of the proposed antenna. (b) The anechoic chamber for the radiation pattern measurement.
(c) The anechoic chamber for the three-dimensional gain and efficiency measurement.
Figure 8. Simulation and measurement results of the peak gain and radiation efficiency.
Ferrite bead
Coaxial cable
Antenna Under Test
Source Horn Antenna
Figure 8. Simulation and measurement results of the peak gain and radiation efficiency.

Appl. Sci. 2020, 10, 6204 8 of 14Appl. Sci. 2020, 10, x FOR PEER REVIEW 8 of 14
(a) (b)
(c)
Figure 9. Simulation and measurement radiation pattern of the proposed antenna: (a) xy, (b) yz, and
(c) xz planes.
Figure 10. Measurement result of the gain deviation over the entire space.
-40-30-20-10
0
-150
-120
-90
-60
-300
30
60
90
120
150180
-40-30-20-10
0
-40-30-20-10
0
-150
-120
-90
-60
-300
30
60
90
120
150180
-40-30-20-10
0
-40-30-20-10
0
-150
-120
-90
-60
-300
30
60
90
120
150180
-40-30-20-10
0
ETotal [Sim.]
E𝜙 [Sim.]
Eϴ [Sim.]
E𝜙 [Meas.]
Eϴ [Meas.]
0 60 120 180 240 300 3600
60
120
180Total gain [ dBi ]
Thet
a [ d
eg ]
Phi [ deg ]
-4.40-3.75-3.10-2.45-1.80-1.15-0.500.150.80
Figure 9. Simulation and measurement radiation pattern of the proposed antenna: (a) xy, (b) yz, and(c) xz planes.
Appl. Sci. 2020, 10, x FOR PEER REVIEW 8 of 14
(a) (b)
(c)
Figure 9. Simulation and measurement radiation pattern of the proposed antenna: (a) xy, (b) yz, and
(c) xz planes.
Figure 10. Measurement result of the gain deviation over the entire space.
-40-30-20-10
0
-150
-120
-90
-60
-300
30
60
90
120
150180
-40-30-20-10
0
-40-30-20-10
0
-150
-120
-90
-60
-300
30
60
90
120
150180
-40-30-20-10
0
-40-30-20-10
0
-150
-120
-90
-60
-300
30
60
90
120
150180
-40-30-20-10
0
ETotal [Sim.]
E𝜙 [Sim.]
Eϴ [Sim.]
E𝜙 [Meas.]
Eϴ [Meas.]
0 60 120 180 240 300 3600
60
120
180Total gain [ dBi ]
Thet
a [ d
eg ]
Phi [ deg ]
-4.40-3.75-3.10-2.45-1.80-1.15-0.500.150.80
Figure 10. Measurement result of the gain deviation over the entire space.

Appl. Sci. 2020, 10, 6204 9 of 14
Table 3. Antenna performance comparison of proposed design with the previously published design.
Reference Frequency(GHz)
Height(λg) ka Gain Deviation
(dB)
[14] 2.465 0.116 1.05 5.6
[20] 2.45 0.0063 0.73 3.14
[21] 2.465 0.0065 1.63 5.75
[22] 2.45 0.008 1.16 6.67
[23] 2.01 0.024 2.73 12.9
[24] 2.4 0.11 5.37 7.6
[25] 2.4 0.016 1.28 2.6
This work 2.47 0.006 0.47 5.2
4. Link Reliability Evaluation
The PDR and RSSI are the main metrics used to characterize the reliability of wireless links inthe indoor environment. In this section, we demonstrate whether PDR and RSSI could be improvedusing the quasi-isotropic antenna compared to the Tx and Rx pair of antennas with omni-directionalpatterns. The performance evaluation setup based on IEEE 802.15.4 is as follows: The RE-Mote fromZolertia [32] was used as an evaluation board together with Contiki-NG software [33]. The transmitpower was 5 dBm and the receiver sensitivity was −95 dBm. The inter-packet transmission intervalwas 50 ms and each experimental point ran for 10 min. That is, there were 12,000 packet transmissions.The comparison group used the commercial antenna with an omni-directional radiation pattern forboth the transmitter and the receiver as a reference. We replaced the receiver with the built prototypeof the quasi-isotropic antenna to evaluate the PDR and RSSI performance. The photos of the antennaare shown in Figure 11. The PDR and RSSI values are all measured at 2.47 GHz.
Appl. Sci. 2020, 10, x FOR PEER REVIEW 9 of 14
Table 3. Antenna performance comparison of proposed design with the previously published design.
Reference Frequency
(GHz) Height
(λg) ka Gain deviation
(dB) [14] 2.465 0.116 1.05 5.6 [20] 2.45 0.0063 0.73 3.14 [21] 2.465 0.0065 1.63 5.75 [22] 2.45 0.008 1.16 6.67 [23] 2.01 0.024 2.73 12.9 [24] 2.4 0.11 5.37 7.6 [25] 2.4 0.016 1.28 2.6
This work 2.47 0.006 0.47 5.2
4. Link Reliability Evaluation
The PDR and RSSI are the main metrics used to characterize the reliability of wireless links in the indoor environment. In this section, we demonstrate whether PDR and RSSI could be improved using the quasi-isotropic antenna compared to the Tx and Rx pair of antennas with omni-directional patterns. The performance evaluation setup based on IEEE 802.15.4 is as follows: The RE-Mote from Zolertia [32] was used as an evaluation board together with Contiki-NG software [33]. The transmit power was 5 dBm and the receiver sensitivity was −95 dBm. The inter-packet transmission interval was 50 ms and each experimental point ran for 10 min. That is, there were 12,000 packet transmissions. The comparison group used the commercial antenna with an omni-directional radiation pattern for both the transmitter and the receiver as a reference. We replaced the receiver with the built prototype of the quasi-isotropic antenna to evaluate the PDR and RSSI performance. The photos of the antenna are shown in Figure 11. The PDR and RSSI values are all measured at 2.47 GHz.
(a) (b)
Figure 11. Antennas for the performance evaluation setup: (a) Zolertia board with default omni-
directional antenna and (b) Zolertia board with quasi-isotropic antenna.
The measurement under the LOS environment was carried out in a typical corridor with a concrete wall and glass windows as shown in Figure 12a. The distance (d) between the transmitter and receiver was varied from 3.6 to 36 m, with a step size of 5.4 m. For the NLOS environment, the transmitter and receiver were blocked by a thick concrete wall and metal door, as shown in Figure
Figure 11. Antennas for the performance evaluation setup: (a) Zolertia board with defaultomni-directional antenna and (b) Zolertia board with quasi-isotropic antenna.
The measurement under the LOS environment was carried out in a typical corridor with a concretewall and glass windows as shown in Figure 12a. The distance (d) between the transmitter and receiverwas varied from 3.6 to 36 m, with a step size of 5.4 m. For the NLOS environment, the transmitter andreceiver were blocked by a thick concrete wall and metal door, as shown in Figure 12c. Its associated

Appl. Sci. 2020, 10, 6204 10 of 14
photo is shown in Figure 12b. We also evaluated the link reliability when the transmitter and receiverwere located at different floor levels of the building.
Appl. Sci. 2020, 10, x FOR PEER REVIEW 10 of 14
12c. Its associated photo is shown in Figure 12b. We also evaluated the link reliability when the transmitter and receiver were located at different floor levels of the building.
(a) (b)
(c)
Figure 12. Measurement setup. (a) Photo for the LOS environment. (b) Photo for the NLOS
environment. (c) Floor map for the NLOS environment.
The measured PDR and RSSI values are given in Figure 13. In Figure 13a, where the PDR across the distance under LOS is plotted, there is comparable performance between the different pairs of the antennae. Next, RSSI across the distance was measured under LOS, and is plotted in Figure 13b. There still did not appear to be a big difference between the two pairs, but the one with a quasi-isotropic antenna at the receiver generally performed better. This is because there were still scattered fields from the ground and walls despite the transmitter and receiver directly seeing each other. The measured values under NLOS are shown in Figure 13c,d. The position of the receiver was moved from position 1 to 6 in Figure 12c. Note that LOS was still achieved when the receiver is at position 1. In Figure 13c, PDR degradation is observed when the omni-directional antenna is at position 4 due
Figure 12. Measurement setup. (a) Photo for the LOS environment. (b) Photo for the NLOS environment.(c) Floor map for the NLOS environment.
The measured PDR and RSSI values are given in Figure 13. In Figure 13a, where the PDR acrossthe distance under LOS is plotted, there is comparable performance between the different pairs ofthe antennae. Next, RSSI across the distance was measured under LOS, and is plotted in Figure 13b.There still did not appear to be a big difference between the two pairs, but the one with a quasi-isotropicantenna at the receiver generally performed better. This is because there were still scattered fields fromthe ground and walls despite the transmitter and receiver directly seeing each other. The measuredvalues under NLOS are shown in Figure 13c,d. The position of the receiver was moved from position 1to 6 in Figure 12c. Note that LOS was still achieved when the receiver is at position 1. In Figure 13c,PDR degradation is observed when the omni-directional antenna is at position 4 due to the metalobstacle and weak multipath signal. Note that the PDR was better at position 4 when the designedquasi-isotropic antenna was used. It generally provided robust performance for various NLOS

Appl. Sci. 2020, 10, 6204 11 of 14
positions. The same situation can be observed in the case of measuring the RSSI again in Figure 13d.The RSSI was again degraded for the omni-directional antenna at position 4, which was due to themetal obstacle and weak multi-path signal, whereas the antenna pair with the quasi-isotropic antennagenerally provided robust performance for different NLOS positions. Consequently, we demonstratethat the quasi-isotropic radiation pattern would be useful in improving communication performanceunder NLOS.
Appl. Sci. 2020, 10, x FOR PEER REVIEW 11 of 14
to the metal obstacle and weak multipath signal. Note that the PDR was better at position 4 when the
designed quasi-isotropic antenna was used. It generally provided robust performance for various
NLOS positions. The same situation can be observed in the case of measuring the RSSI again in Figure
13d. The RSSI was again degraded for the omni-directional antenna at position 4, which was due to
the metal obstacle and weak multi-path signal, whereas the antenna pair with the quasi-isotropic
antenna generally provided robust performance for different NLOS positions. Consequently, we
demonstrate that the quasi-isotropic radiation pattern would be useful in improving communication
performance under NLOS.
(a)
(b)
(c)
(d)
Figure 13. Measured PDR and RSSI. (a) PDR under LOS, (b) RSSI under LOS, (c) PDR under NLOS,
and (d) RSSI under NLOS.
We also evaluated the link reliability when the transmitter and the receiver were deployed at
the different floors of the building. The transmitter was at the lower level of the floor. The vertical
distance between the two nodes was around 3.7 m. Figure 14 shows the average PDR and RSSI
0.6 0.8 1 1.2 1.4 1.6
log10 [ d ]
75
80
85
90
95
100
Omnidirectional - OmnidirectionalOmnidirectional - Isotropic
0.6 0.8 1 1.2 1.4 1.6
log10 [ d ]
-90
-80
-70
-60
-50
Omnidirectional - OmnidirectionalOmnidirectional-Isotropic
1 2 3 4 5 6
Position from 1[ LOS ] to 6 [ NLOS ]
80
85
90
95
100
Omnidirectional - Omnidirectional
Omnidirectional - Isotropic
Ave
rage
RSS
I [ d
Bm
]
Figure 13. Measured PDR and RSSI. (a) PDR under LOS, (b) RSSI under LOS, (c) PDR under NLOS,and (d) RSSI under NLOS.

Appl. Sci. 2020, 10, 6204 12 of 14
We also evaluated the link reliability when the transmitter and the receiver were deployed at thedifferent floors of the building. The transmitter was at the lower level of the floor. The vertical distancebetween the two nodes was around 3.7 m. Figure 14 shows the average PDR and RSSI measurementas a function of various transmit powers between −13 and 7 dBm. A significant improvement wasobserved when the developed quasi-isotropic antenna was used. One interesting observation is thatthe proposed antenna provides around 3 dB gain of average RSSI with respect to those using theomni-directional antenna pair when the transmit power is greater than −9 dBm. It also provides PDRgreater than 70 for transmit power between −11 and −9 dBm while the omni-directional antenna pairhas low PDR of less than 35%.
Appl. Sci. 2020, 10, x FOR PEER REVIEW 12 of 14
measurement as a function of various transmit powers between −13 and 7 dBm. A significant
improvement was observed when the developed quasi-isotropic antenna was used. One interesting
observation is that the proposed antenna provides around 3 dB gain of average RSSI with respect to
those using the omni-directional antenna pair when the transmit power is greater than −9 dBm. It
also provides PDR greater than 70 for transmit power between −11 and −9 dBm while the omni-
directional antenna pair has low PDR of less than 35%.
(a)
(b)
Figure 14. Measured (a) PDR and (b) RSSI under NLOS at different floor levels of the building.
5. Conclusions
In this paper, we proposed an electrically small and planar quasi-isotropic antenna and
demonstrated its feasibility of improving the wireless link reliability under NLOS channel
environments. The antenna had an electrical size ka less than 0.5 and showed a measured gain
deviation around 5 dB, which is good enough to be considered as a quasi-isotropic antenna. Its
performance in terms of the electrical size and gain deviation was compared with other planar quasi-
isotropic antennas in the literature. Furthermore, from the wireless link reliability test in indoor
NLOS channels, we demonstrated that PDR and RSSI can be enhanced by the simple use of the
proposed antenna, in comparison to the use of omni-directional antennas. To the best of our
knowledge, the usefulness of the quasi-isotropic antenna in real communication measurement was
first demonstrated by this work. The exact analysis of the link reliability evaluation according to the
different gain deviation values and the polarization dependency of the quasi-isotropic antennas
remains a possibility for future work.
Author Contributions: Conceptualization, S.M.R. and I.-J.Y.; methodology, S.M.R., M.J., P.P., and I.-J.Y.;
software, S.M.R., M.J., P.P., and I.-J.Y.; validation, S.M.R., M.J., P.P., and I.-J.Y.; formal analysis, S.M.R., M.J., P.P.,
and I.-J.Y.; investigation, S.M.R., M.J., P.P., and I.-J.Y.; resources, S.M.R., M.J., P.P., and I.-J.Y.; data curation,
S.M.R., M.J., P.P., and I.-J.Y.; writing—Original draft preparation, S.M.R.; writing—Review and editing, P.P and
Figure 14. Measured (a) PDR and (b) RSSI under NLOS at different floor levels of the building.
5. Conclusions
In this paper, we proposed an electrically small and planar quasi-isotropic antenna anddemonstrated its feasibility of improving the wireless link reliability under NLOS channel environments.The antenna had an electrical size ka less than 0.5 and showed a measured gain deviation around5 dB, which is good enough to be considered as a quasi-isotropic antenna. Its performance in termsof the electrical size and gain deviation was compared with other planar quasi-isotropic antennasin the literature. Furthermore, from the wireless link reliability test in indoor NLOS channels,we demonstrated that PDR and RSSI can be enhanced by the simple use of the proposed antenna,in comparison to the use of omni-directional antennas. To the best of our knowledge, the usefulness ofthe quasi-isotropic antenna in real communication measurement was first demonstrated by this work.The exact analysis of the link reliability evaluation according to the different gain deviation values andthe polarization dependency of the quasi-isotropic antennas remains a possibility for future work.

Appl. Sci. 2020, 10, 6204 13 of 14
Author Contributions: Conceptualization, S.M.R. and I.-J.Y.; methodology, S.M.R., M.J., P.P., and I.-J.Y.; software,S.M.R., M.J., P.P., and I.-J.Y.; validation, S.M.R., M.J., P.P., and I.-J.Y.; formal analysis, S.M.R., M.J., P.P., and I.-J.Y.;investigation, S.M.R., M.J., P.P., and I.-J.Y.; resources, S.M.R., M.J., P.P., and I.-J.Y.; data curation, S.M.R., M.J., P.P.,and I.-J.Y.; writing—Original draft preparation, S.M.R.; writing—Review and editing, P.P and I.-J.Y.; visualization,S.M.R.; supervision, I.-J.Y. All authors have read and agreed to the published version of the manuscript.
Funding: This work was supported in part by the Basic Research Laboratory of the National Research Foundationfunded by the Korean government under Grant NRF-2017R1A4A1015744, and in part by Institute of Information& communications Technology Planning & Evaluation (IITP) grant funded by the Korea government (MSIT)(No. 2017-0-00659).
Conflicts of Interest: The authors declare no conflict of interest.
References
1. Park, P.; Ergen, S.C.; Fischione, C.; Lu, C.; Johansson, K.H. Wireless Network Design for Control Systems:A Survey. IEEE Commun. Surv. Tutor. 2018, 20, 978–1013. [CrossRef]
2. Ma, Z.; Xiao, M.; Xiao, Y.; Pang, Z.; Poor, H.V.; Vucetic, B. High-Reliability and Low-Latency WirelessCommunication for Internet of Things: Challenges, Fundamentals, and Enabling Technologies. IEEE InternetThings J. 2019, 6, 7946–7970. [CrossRef]
3. Luvisotto, M.; Pang, Z.; Dzung, D. High-Performance Wireless Networks for Industrial Control Applications:New Targets and Feasibility. Proc. IEEE 2019, 107, 1074–1093. [CrossRef]
4. Park, P. Markov chain model of fault-tolerant wireless networked control systems. Wirel. Netw. 2019,25, 2291–2303. [CrossRef]
5. Tang, L.; Wang, K.; Huang, Y.; Gu, F. Channel Characterization and Link Quality Assessment of IEEE802.15.4-Compliant Radio for Factory Environments. IEEE Trans. Ind. Inform. 2007, 3, 99–110. [CrossRef]
6. Zhang, Q.; Zhang, Q.; Zhang, W.; Shen, F.; Loh, T.H.; Qin, F. Understanding the Temporal Fading in WirelessIndustrial Networks: Measurements and Analyses. In Proceedings of the 2018 10th International Conferenceon Wireless Communications and Signal Processing (WCSP), Hangzhou, China, 18–20 October 2018; pp. 1–6.
7. Alexandra, E.; Novotny, D.R.; Candell, R.; Koepke, G.H.; Papazian, P.B.; Remley, C.A. Fading due to staticand dynamic features in a factory environment on wireless channels, NIST. IEEE Veh. Technol. Manag.2018. Available online: https://pdfs.semanticscholar.org/6f5a/3f075837771342fa72e1ec977fdb24799247.pdf(accessed on 28 July 2020).
8. Bombino, A.; Grimaldi, S.; Mahmood, A.; Gidlund, M. Machine Learning-Aided Classification Of LoS/NLoSRadio Links In Industrial IoT. In Proceedings of the 2020 16th IEEE International Conference on FactoryCommunication Systems (WFCS), Porto, Portugal, 27–29 April 2020; pp. 1–8.
9. Liu, Z.-Y.; Guo, L.-X.; Li, C.-L. Effects of antenna polarization on power and RMS delay spread in LOS/OOSindoor radio channel. In Proceedings of the 2014 XXXIth URSI General Assembly and Scientific Symposium(URSI GASS), Beijing, China, 16–23 August 2014; pp. 1–4.
10. Bou-El-Harmel, A.; Benbassou, A.; Belkadid, J.; Mechatte, N. Effect of Quasi-Isotropic Antenna Orientationon Indoor Multipath Propagation Characteristics in RSN Applications. Int. J. Antennas Propag. 2017, 2017,2686123. [CrossRef]
11. Brouwer, L.E.J. On Continuous Vector Distribution on Surfaces; 3rd communication; in KNAW, Proceedings, 13 I,1910, Amsterdam; KNAW: Trippenhuis, Amsterdam, The Netherlands, 1910; pp. 171–186.
12. Mathis, H.F. A short proof that an isotropic antenna is impossible. Proc. IRE 1951, 8, 970.13. Matzner, H.; Milgrom, M.; Shtrikman, S. A study of finite size power isotropic radiators. In Proceedings of
the Eighteenth Convention of Electrical and Electronics Engineers in Israel, Tel Aviv, Israel, 7–8 March 1995;pp. 1.4.1/1–1.4.1/5.
14. Pan, Y.; Leung, K.W.; Lu, K. Compact Quasi-Isotropic Dielectric Resonator Antenna With Small GroundPlane. IEEE Trans. Antennas Propag. 2014, 62, 577–585. [CrossRef]
15. Zhang, Z.; Gao, X.; Chen, W.; Feng, Z.; Iskander, M.F. Study of Conformal Switchable Antenna System onCylindrical Surface for Isotropic Coverage. IEEE Trans. Antennas Propag. 2011, 59, 776–783. [CrossRef]
16. Long, S. A combination of linear and slot antennas for quasi-isotropic coverage. IEEE Trans. Antennas Propag.1975, 23, 572–576. [CrossRef]
17. Kim, J.; Nam, S. A Compact Quasi-Isotropic Antenna Based on Folded Split-Ring Resonators. IEEE AntennasWirel. Propag. Lett. 2017, 16, 294–297. [CrossRef]

Appl. Sci. 2020, 10, 6204 14 of 14
18. Radha, S.M.; Shin, G.; Park, P.; Yoon, I.-J. Realization of Electrically Small, Low-Profile Quasi-IsotropicAntenna Using 3D Printing Technology. IEEE Access 2020, 8, 27067–27073. [CrossRef]
19. Su, Z.; Klionovski, K.; Bilal, R.M.; Shamim, A. A Dual Band Additively Manufactured 3-D Antenna onPackage With Near-Isotropic Radiation Pattern. IEEE Trans. Antennas Propag. 2018, 66, 3295–3305. [CrossRef]
20. Ouyang, J.; Pan, Y.M.; Zheng, S.Y.; Hu, P.F. An Electrically Small Planar Quasi-Isotropic Antenna.IEEE Antennas Wirel. Propag. Lett. 2018, 17, 303–306. [CrossRef]
21. Deng, C.; Li, Y.; Zhang, Z.; Feng, Z. A Wideband Isotropic Radiated Planar Antenna Using Sequential RotatedL-Shaped Monopoles. IEEE Trans. Antennas Propag. 2014, 62, 1461–1464. [CrossRef]
22. Pan, G.; Li, Y.; Zhang, Z.; Feng, Z. Isotropic Radiation From a Compact Planar Antenna Using Two CrossedDipoles. IEEE Antennas Wirel. Propag. Lett. 2012, 11, 1338–1341.
23. Imran Hussain Shah, S.; Tentzeris, M.M.; Lim, S. Planar quasi-isotropic antenna for drone communication.Microw. Opt. Technol. Lett. 2018, 60, 1290–1295. [CrossRef]
24. Kim, J.; Park, J.; Omar, A.A.; Hong, W. A Symmetrically-Stacked Planar Antenna Concept ExhibitingQuasi-Isotropic Radiation Coverage. IEEE Antennas Wirel. Propag. Lett. 2020, 19, 1390–1394. [CrossRef]
25. Luo, J.W.; Pan, Y.M.; Zheng, S.Y.; Wang, S.H. A Planar Angled-Dipole Antenna With Quasi-Isotropic RadiationPattern. IEEE Trans. Antennas Propag. 2020, 68, 5646–5651. [CrossRef]
26. Wang, Y.; Tang, M.; Chen, S.; Li, L.; Li, D.; Hu, K.; Li, M. Design of Low-Cost, Flexible, Uniplanar, ElectricallySmall, Quasi-Isotropic Antenna. IEEE Antennas Wirel. Propag. Lett. 2019, 18, 1646–1650. [CrossRef]
27. Ko, D.-O.; Woo, J.-M. Design of a Small Radio Frequency Identification Tag Antenna Using a CorrugatedMeander Line Applicable to a Drug Runout Sensor System. J. Electromagn Eng. Sci. 2018, 18, 7–12. [CrossRef]
28. Kedze, K.E.; Wang, H.; Park, I. Effects of Split Position on the Performance of a Compact Broadband PrintedDipole Antenna with Split-Ring Resonators. J. Electromagn Eng. Sci. 2019, 19, 115–121. [CrossRef]
29. Lee, S.; Shin, G.; Radha, S.M.; Choi, J.; Yoon, I.-J. Low-Profile, Electrically Small Planar Huygens SourceAntenna With an Endfire Radiation Characteristic. IEEE Antennas Wirel. Propag. Lett. 2019, 18, 412–416.[CrossRef]
30. Ta, S.X.; Park, I.; Ziolkowski, R.W. Crossed Dipole Antennas: A review. IEEE Antennas Propag. Mag. 2015,57, 107–122. [CrossRef]
31. Tang, M.; Wang, H.; Ziolkowski, R.W. Design and Testing of Simple, Electrically Small, Low-Profile, HuygensSource Antennas With Broadside Radiation Performance. IEEE Trans. Antennas Propag. 2016, 64, 4607–4617.[CrossRef]
32. Zolertia RE-Mote Revision B Internet of Things Hardware Development Platform, for 2.4-GHz and863-950MHz IEEE 802.15.4, 6LoWPAN and ZigBee Applications. Zolertia. Available online: https://github.com/Zolertia/Resources/wiki/Zolertia-Technical-documentation (accessed on 28 July 2020).
33. Dunkels, A.; Gronvall, B.; Voigt, T. Contiki-a lightweight and flexible operating system for tiny networkedsensors. In Proceedings of the 29th Annual IEEE International Conference on Local Computer Networks,Tampa, FL, USA, 16–18 November 2004; pp. 455–462.
© 2020 by the authors. Licensee MDPI, Basel, Switzerland. This article is an open accessarticle distributed under the terms and conditions of the Creative Commons Attribution(CC BY) license (http://creativecommons.org/licenses/by/4.0/).