Design, Development, and Testing of a Miniature Fixture ...
108
University of Central Florida University of Central Florida STARS STARS Electronic Theses and Dissertations 2019 Design, Development, and Testing of a Miniature Fixture for Design, Development, and Testing of a Miniature Fixture for Uniaxial Compression of Ceramics Coupled with In-Situ Raman Uniaxial Compression of Ceramics Coupled with In-Situ Raman Spectrometer Spectrometer Ryan Jordan University of Central Florida Part of the Electro-Mechanical Systems Commons Find similar works at: https://stars.library.ucf.edu/etd University of Central Florida Libraries http://library.ucf.edu This Masters Thesis (Open Access) is brought to you for free and open access by STARS. It has been accepted for inclusion in Electronic Theses and Dissertations by an authorized administrator of STARS. For more information, please contact [email protected]. STARS Citation STARS Citation Jordan, Ryan, "Design, Development, and Testing of a Miniature Fixture for Uniaxial Compression of Ceramics Coupled with In-Situ Raman Spectrometer" (2019). Electronic Theses and Dissertations. 6749. https://stars.library.ucf.edu/etd/6749
Transcript of Design, Development, and Testing of a Miniature Fixture ...
University of Central Florida University of Central Florida
STARS STARS
Electronic Theses and Dissertations
2019
Design, Development, and Testing of a Miniature Fixture for Design, Development, and Testing of a Miniature Fixture for
Uniaxial Compression of Ceramics Coupled with In-Situ Raman Uniaxial Compression of Ceramics Coupled with In-Situ Raman
Spectrometer Spectrometer
Ryan Jordan University of Central Florida
Part of the Electro-Mechanical Systems Commons
Find similar works at: https://stars.library.ucf.edu/etd
University of Central Florida Libraries http://library.ucf.edu
This Masters Thesis (Open Access) is brought to you for free and open access by STARS. It has been accepted for
inclusion in Electronic Theses and Dissertations by an authorized administrator of STARS. For more information,
please contact [email protected].
STARS Citation STARS Citation Jordan, Ryan, "Design, Development, and Testing of a Miniature Fixture for Uniaxial Compression of Ceramics Coupled with In-Situ Raman Spectrometer" (2019). Electronic Theses and Dissertations. 6749. https://stars.library.ucf.edu/etd/6749
DESIGN, DEVELOPMENT, AND TESTING OF A MINIATURE FIXTURE
FOR UNIAXIAL COMPRESSION OF CERAMICS COUPLED WITH IN-SITU
RAMAN SPECTROMETER
by
RYAN T. JORDAN
B.S. University of Central Florida, 2018
A thesis submitted in partial fulfillment of the requirements
for the degree of Master of Science
in the Department of Mechanical and Aerospace Engineering
in the College of Engineering and Computer Science
at the University of Central Florida
Orlando, Florida
Fall Term
2019

ii
© 2019 Ryan T. Jordan

iii
ABSTRACT
This thesis is about the design, development and integration of an in-situ compression stage which
interfaces through the Leica optical microscope coupled with a Renishaw InVia micro-Raman
spectrometer. This combined compression stage and Raman system will enable structural
characterization of ceramics and ceramic composites. The in-situ compression stage incorporates
a 440C stainless steel structural components, 6061 aluminum frame, a NEMA 23 stepper motor.
Two load screws that allow to apply compressive loads up to 14,137 N, with negligible off axis
loading, achieving target stresses of 500 MPa for samples of up to 6.00 mm in diameter. The
system will be used in the future to study the structural changes in ceramics and ceramic
composites, as well as to study thermal residual stress redistribution under applied compressive
loads. A broad variety of Raman active ceramics, including the traditional structural ceramics
3mol%Y2O3-ZrO2, B4C, SiC, Si3N4, as well as exotic materials such as LaCoO3 and other
perovskites will be studied using this system. Calibration of the systems load cell was performed
in the configured state using MTS universal testing machines. To ensure residual stresses from
mounting the load cell did not invalidate the original calibration, the in-situ compression stage was
tested once attached to the Renishaw Raman spectrometer using LaCoO3 ceramic samples. The
Raman shift of certain peaks in LaCoO3 was detected indicative of the effect of the applied
compressive stress on the ceramics understudy.

iv
ACKNOWLEDGEMENTS
I would like to thank my advisor Professor Dr. Nina Orlovskaya of University of Central Florida,
for her guidance and support, for her time and effort to help me learn and succeed. Performing
research in design, mechanical testing, and structural characterization had allowed me to gain
significant knowledge and invaluable skills. Dr. Nina has provided me with the opportunities and
guidance which has allowed me to take this journey. Also, thank you to Dr. Kawai Kwok and Dr.
Ranajay Ghosh for serving as my committee members.
A special thanks to my friends and colleagues, Corrina Yorke, Ruslan Kuliev, Mahmoud Omer,
Dr. Anthony C. Terracciano, Tim Lindner, Clarence Bess, and everyone who shared their
knowledge and expertise. The knowledge and discussion helped me better understand mechanical
testing, structural characterization, design, and manufacturing, thus allowing me to succeed with
my work as a researcher. Most importantly, I would like to thank my family for their love and
support.
Thesis was supported in part by NSF MRI project 133758 Development of Multi-Scale Thermal
Mechanical-Spectroscopic System for in-situ materials characterization, research and training.

v
TABLE OF CONTENTS
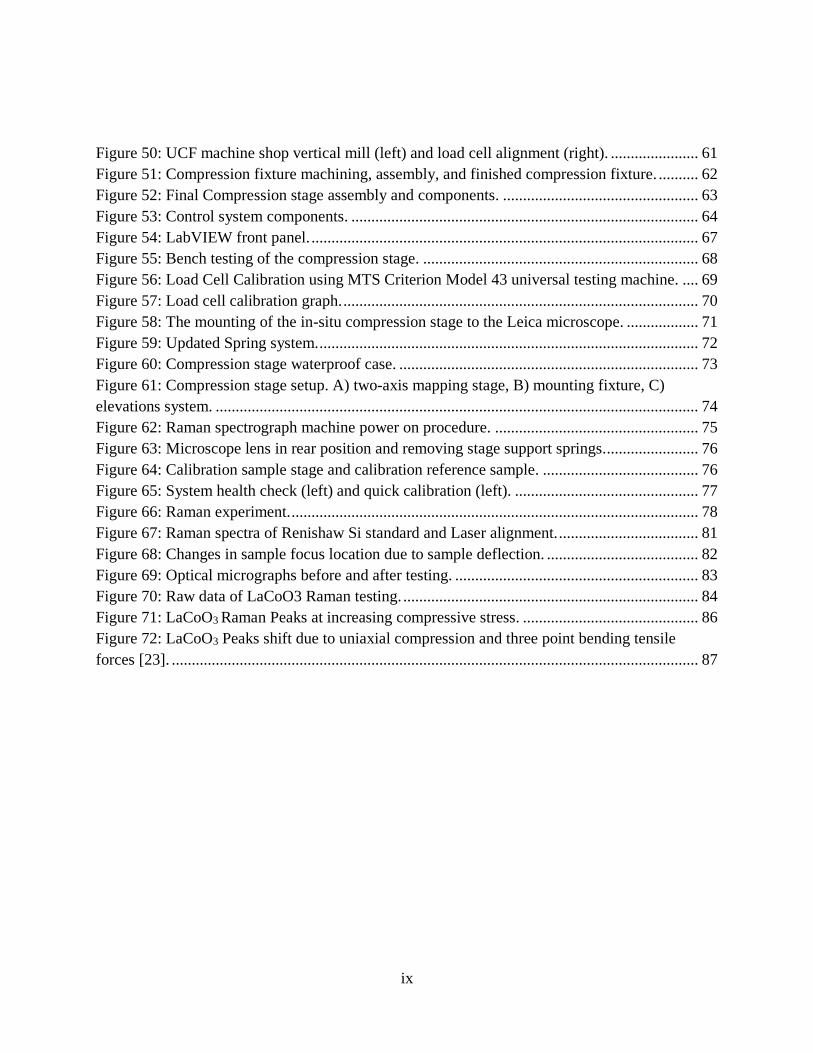
LIST OF FIGURES ...................................................................................................................... vii
LIST OF TABLES .......................................................................................................................... x
EQUATIONS ................................................................................................................................. xi
CHAPTER 1: INTRODUCTION ................................................................................................... 1
Efforts .......................................................................................................................................... 2
Goals............................................................................................................................................ 3
CHAPTER 2: LITERATURE REVIEW ........................................................................................ 6
Raman Spectroscopy Overview .................................................................................................. 6
Ceramics Material Overview ...................................................................................................... 9
In-situ Mechanical Testing and Structural Characterization ..................................................... 14
Micro Mechanical Testing Devises ........................................................................................... 28
Senior Design Compression Stages........................................................................................... 31
CHAPTER 3: DESIGN................................................................................................................. 34
Design criteria ........................................................................................................................... 34
Calculations ............................................................................................................................... 37
Sample loading ...................................................................................................................... 38
Ball Screws ............................................................................................................................ 39
Torque .................................................................................................................................... 41
Gear Reduction ...................................................................................................................... 41
Gear Spacing .......................................................................................................................... 43
Load Rate ............................................................................................................................... 45
CAD Design .............................................................................................................................. 46
Finite Element Analysis ............................................................................................................ 55
Load Crosshead ..................................................................................................................... 55
Support Crosshead ................................................................................................................. 58
Results ................................................................................................................................... 59

vi
Manufacturing and Assembly ................................................................................................... 61
CHAPTER 4: CONTROL SYSTEM ........................................................................................... 64
Stepper Motor Control .............................................................................................................. 65
Load Cell Sensor measurements ............................................................................................... 65
User Interface ............................................................................................................................ 66
CHAPTER 5: TESTING AND INTEGRATION ......................................................................... 68
Compression Fixture Bench Testing ......................................................................................... 68
Load Cell Calibration ................................................................................................................ 69
Compression Fixture and Optical Microscope Integration ....................................................... 70
CHAPTER 6: PROCEDURES ..................................................................................................... 73
Compression Fixture Setup ....................................................................................................... 74
Raman Spectrometer Operations ............................................................................................... 75
Raman Spectrometer Calibration .............................................................................................. 75
Experimental Procedure ............................................................................................................ 78
CHAPTER 7: RESULTS AND DISCUSSION ............................................................................ 80
Raman Spectrometer Calibration Results ................................................................................. 81
Changes in Focus Location ....................................................................................................... 81
Raman Spectroscopy Analysis of LaCoO3................................................................................ 82
CHAPTER 8: CONCLUSIONS ................................................................................................... 88
CHAPTER 9: FUTURE WORK .................................................................................................. 89
LIST OF REFERENCES .............................................................................................................. 90
vii
LIST OF FIGURES
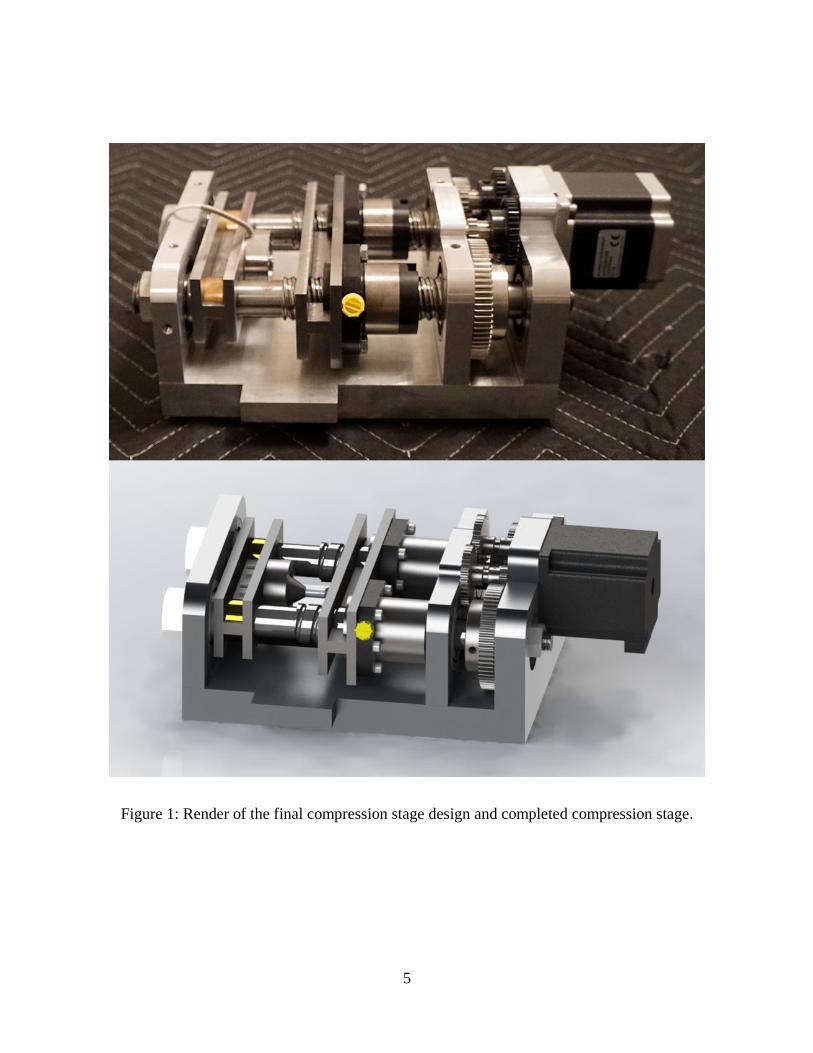
Figure 1: Render of the final compression stage design and completed compression stage. ......... 5
Figure 2: Fundamental photon-material interactions [1]. ............................................................... 6
Figure 3: Vibrational spectra of cubic and rhombohedral (β) Sc0.1Ce0.01ZrO2 ceramics; ............... 7
Figure 4: (A) Raman InVia spectrometer and (B) schematic of spectrometer [3].......................... 9
Figure 5: Raman scattering of LaCoO3 perovskite at different laser intensities [7]. .................... 10
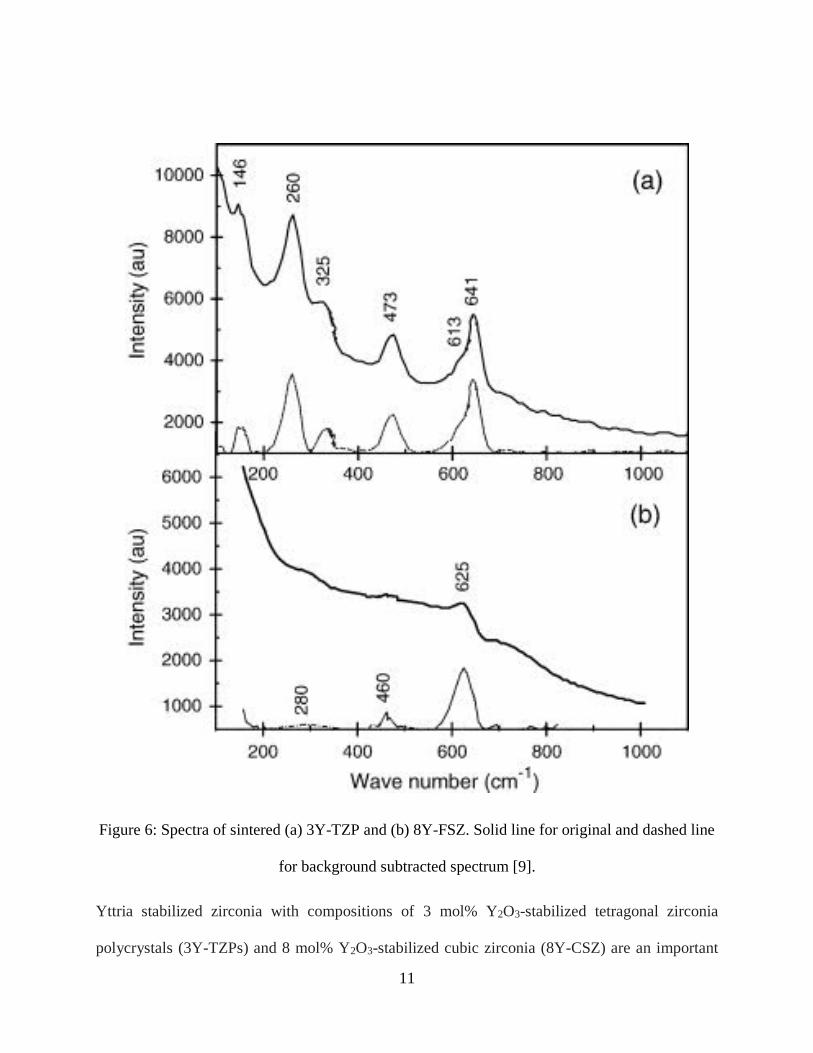
Figure 6: Spectra of sintered (a) 3Y-TZP and (b) 8Y-FSZ. Solid line for original and dashed line
for background subtracted spectrum [9]. ...................................................................................... 11
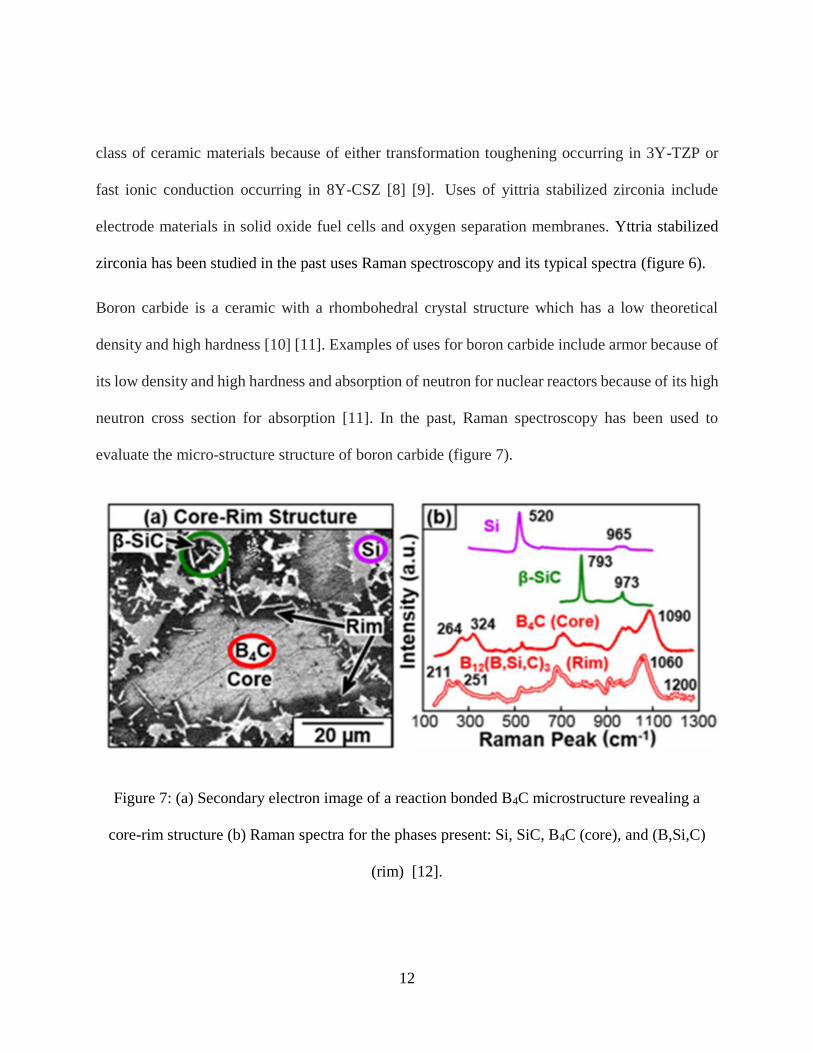
Figure 7: (a) Secondary electron image of a reaction bonded B4C microstructure revealing a
core-rim structure (b) Raman spectra for the phases present: Si, SiC, B4C (core), and (B,Si,C)
(rim) [12]. ..................................................................................................................................... 12
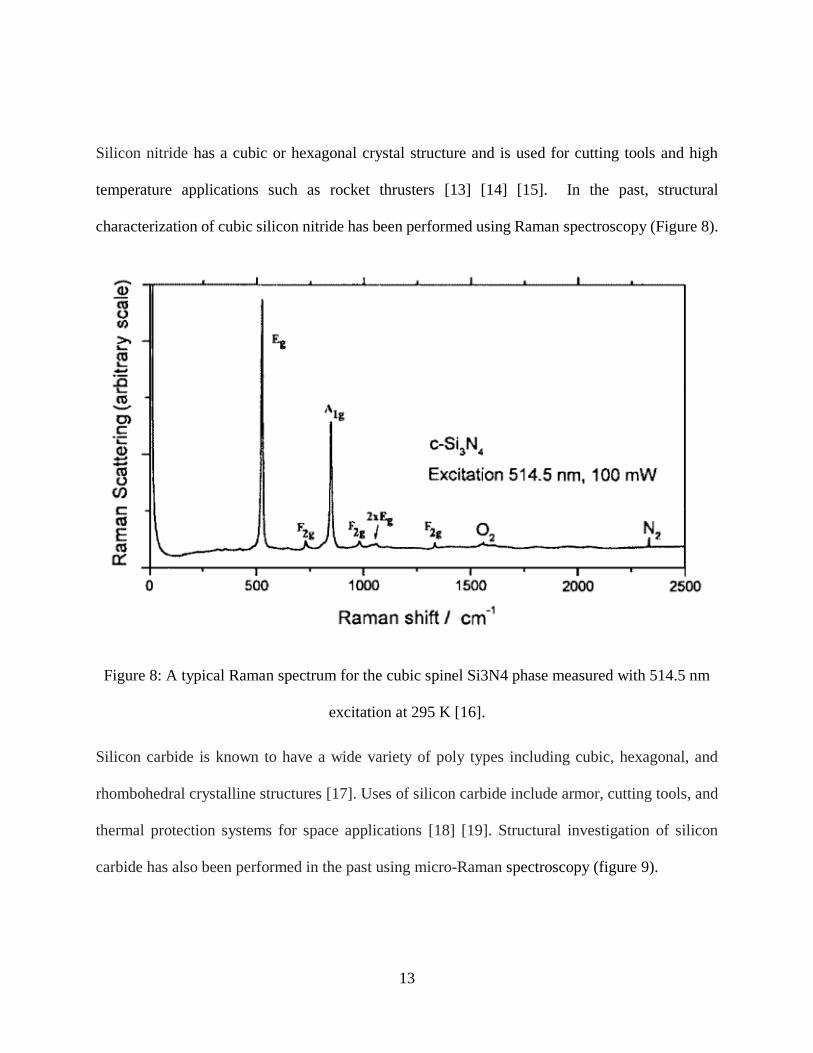
Figure 8: A typical Raman spectrum for the cubic spinel Si3N4 phase measured with 514.5 nm
excitation at 295 K [16]. ............................................................................................................... 13
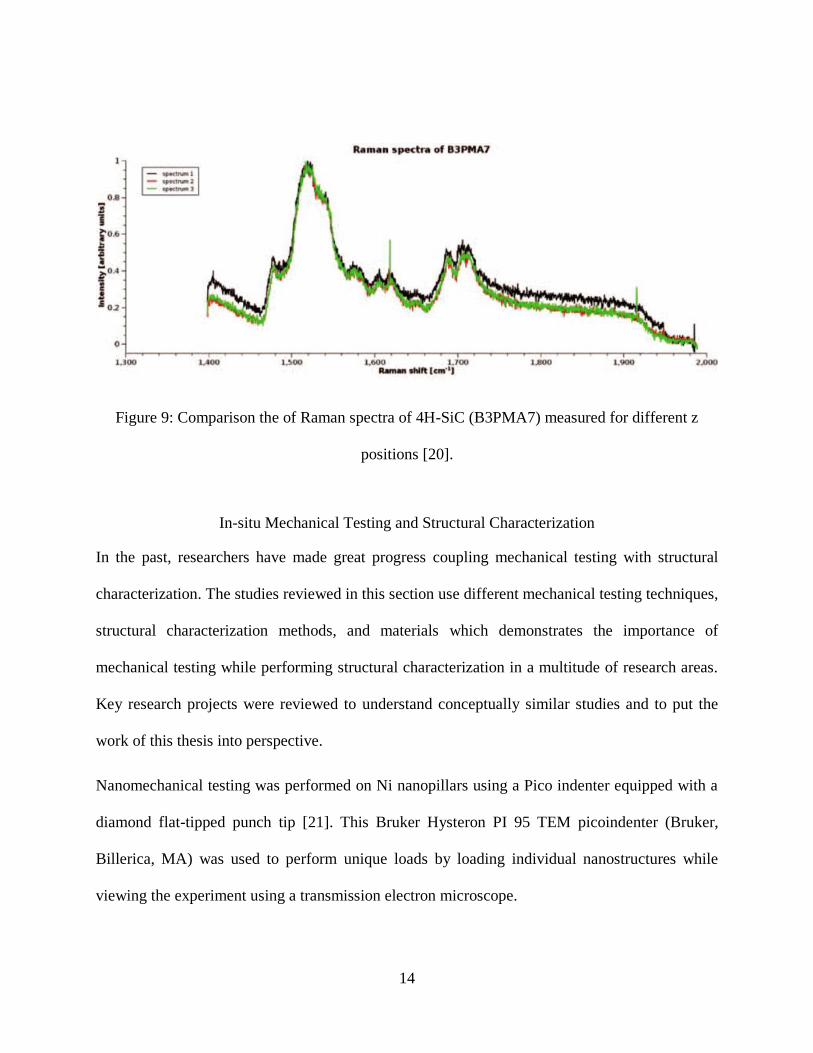
Figure 9: Comparison the of Raman spectra of 4H-SiC (B3PMA7) measured for different z
positions [20]. ............................................................................................................................... 14
Figure 10: Hysteron PI 95 TEM Pico indenter with close of loading tip [22]. ............................. 15
Figure 11: (A) Dark-field TEM image of Ni nanopillar before compression, (B) and after
compression [21]. .......................................................................................................................... 15
Figure 12: (a) schematic of loading ceramic bar in three point bending for collection of in situ
scattered light, (b) photograph of in situ loading device and (c) loading device coupled with
Leica optical microscope connected to InVia microRaman spectrometer [23]. ........................... 17
Figure 13: Force applied versus voltage output for calibration of load cell and stress-strain
deformation curves obtained by loading samples in the in situ loading device [23]. ................... 18
Figure 14: (A) Optical micrograph of ZrB2+10wt%SiC ceramic composite. (B) Raman
spectrograph of 6H-SiC phase in ZrB2-10 wt-%SiC ceramic composites: peaks numbered 1, 2
and 3 are modes of 6H-SiC and peak 4 is LO mode of 6H-SiC. (C) applied stress dependence of
peak position of transverse optical and LO modes of 6H-SiC ceramics [23]. .............................. 19
Figure 15: (A) Optical image of ZrB2–SiC ceramic , (B)Spectrometer map, (C) SEM
backscattered image of ZrB2-10 wt-%SiC, inset shows laser spot size taken using 6100 objective
lens, (D) typical Raman spectra for SiC phase spot 1 of Spectrometer Map, and (E) typical
Raman spectra for ZrB2 phase spot 2 of Spectrometer map [3]. .................................................. 20
Figure 16: Schematic diagram (a) and a photographic image (b) of the in situ [24]. ................... 22
Figure 17: SEM image of the used diamond flat punch indenter (a) accompanied by an AFM
image (b) characterizing the rms roughness of the plateau [24]. .................................................. 23
viii
Figure 18: Schematic illustration of the in-situ compression system. The chondral block was
compressed against a light-transmissible platen by a piezo-actuator. The vertical displacement
was monitored by a displacement transducer [25]. ....................................................................... 25
Figure 19: Articular cartilage tissue and chondron mesh models [25]. ........................................ 26
Figure 20: Changes in cell morphology in the intact ECM or near tissue lesions during the tissue
compression phase and the recovery phase [25]. .......................................................................... 27
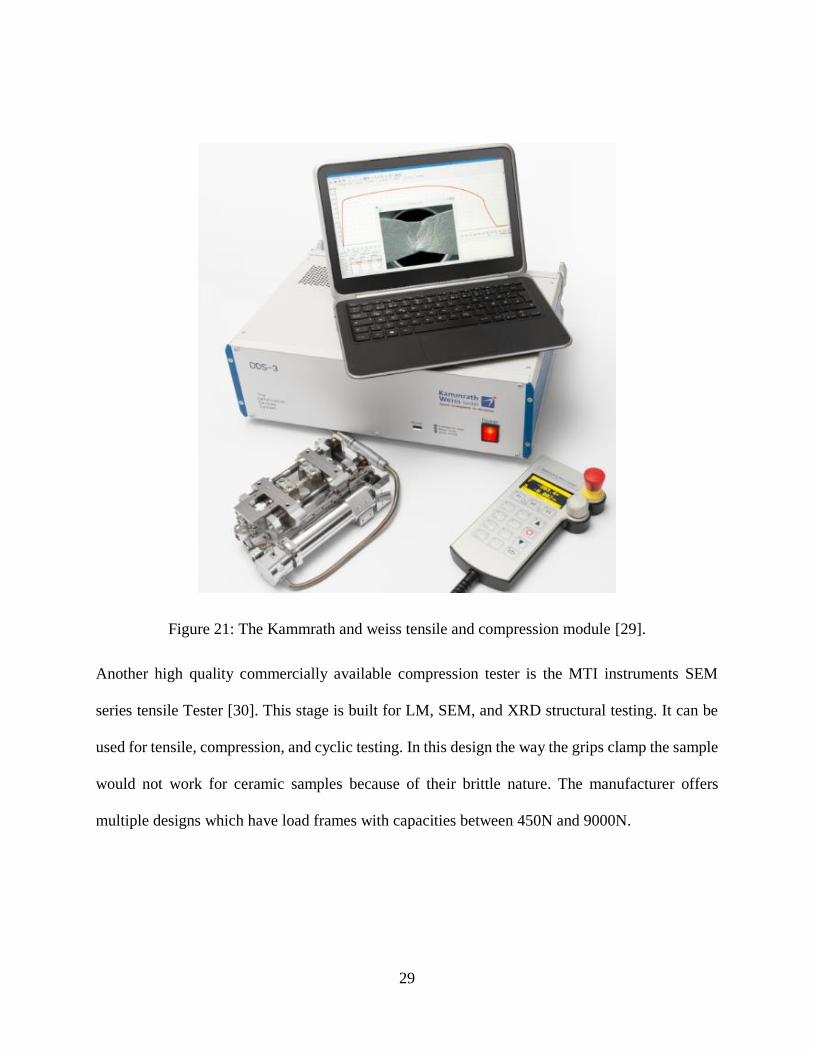
Figure 21: The Kammrath and weiss tensile and compression module [29]. ............................... 29
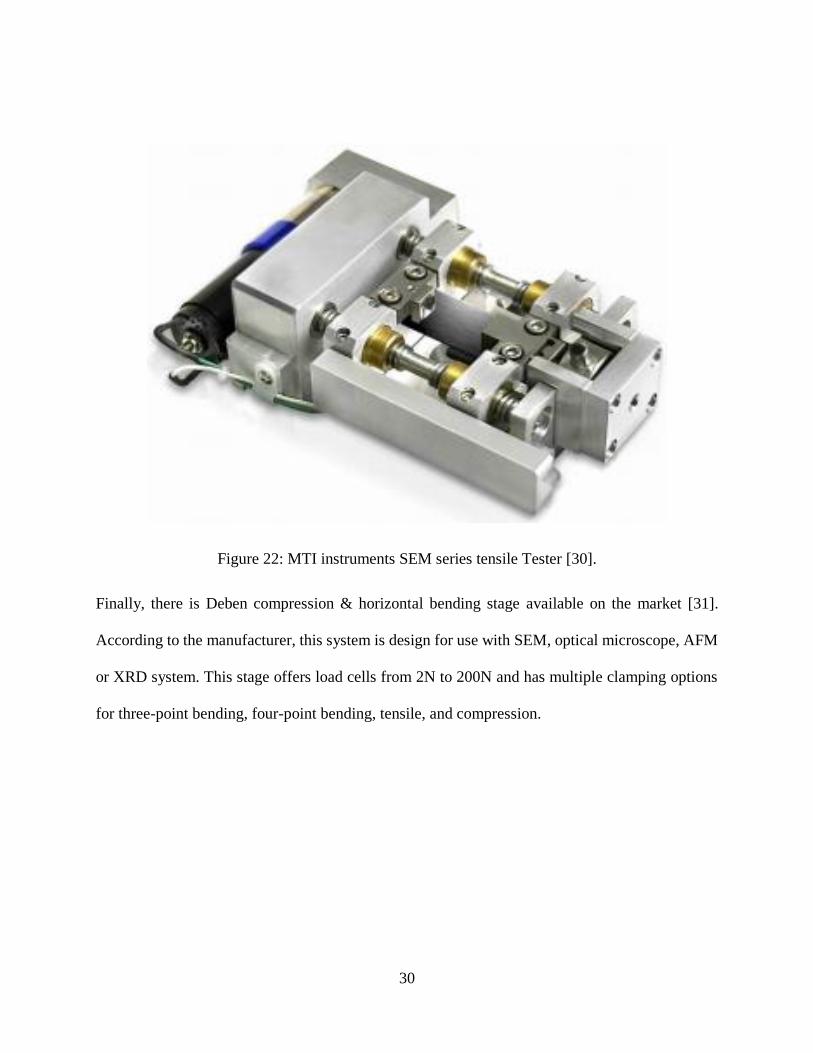
Figure 22: MTI instruments SEM series tensile Tester [30]......................................................... 30
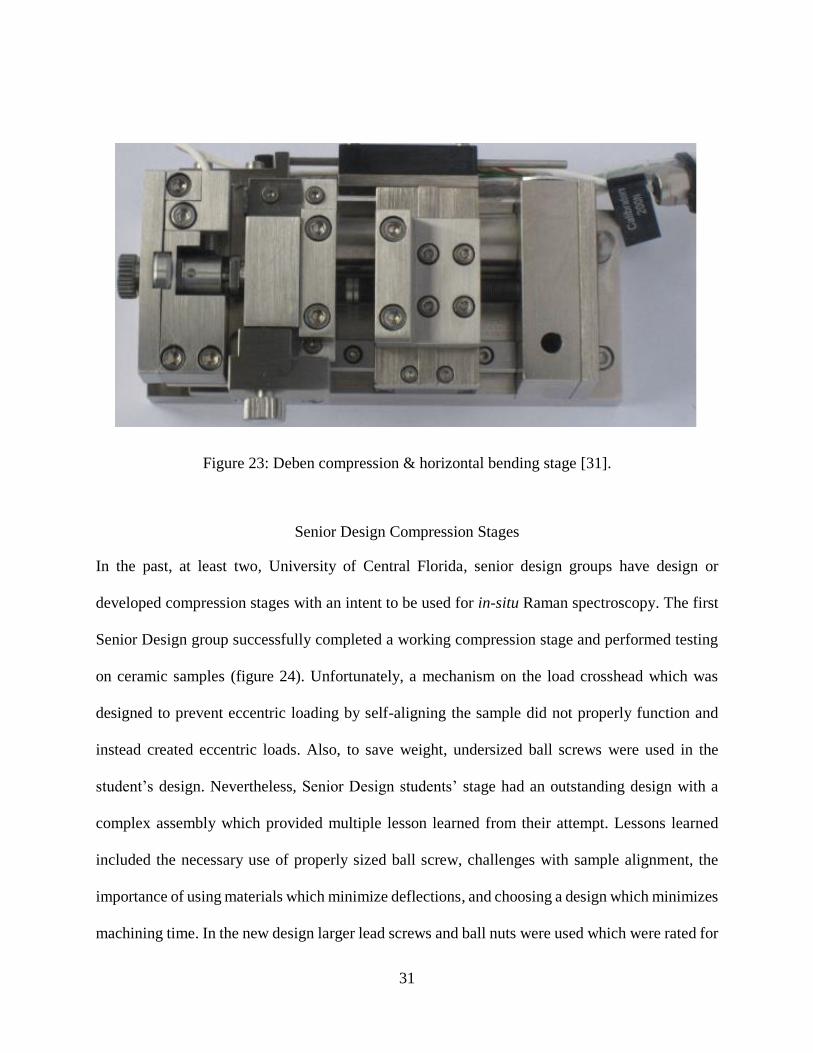
Figure 23: Deben compression & horizontal bending stage [31]. ................................................ 31
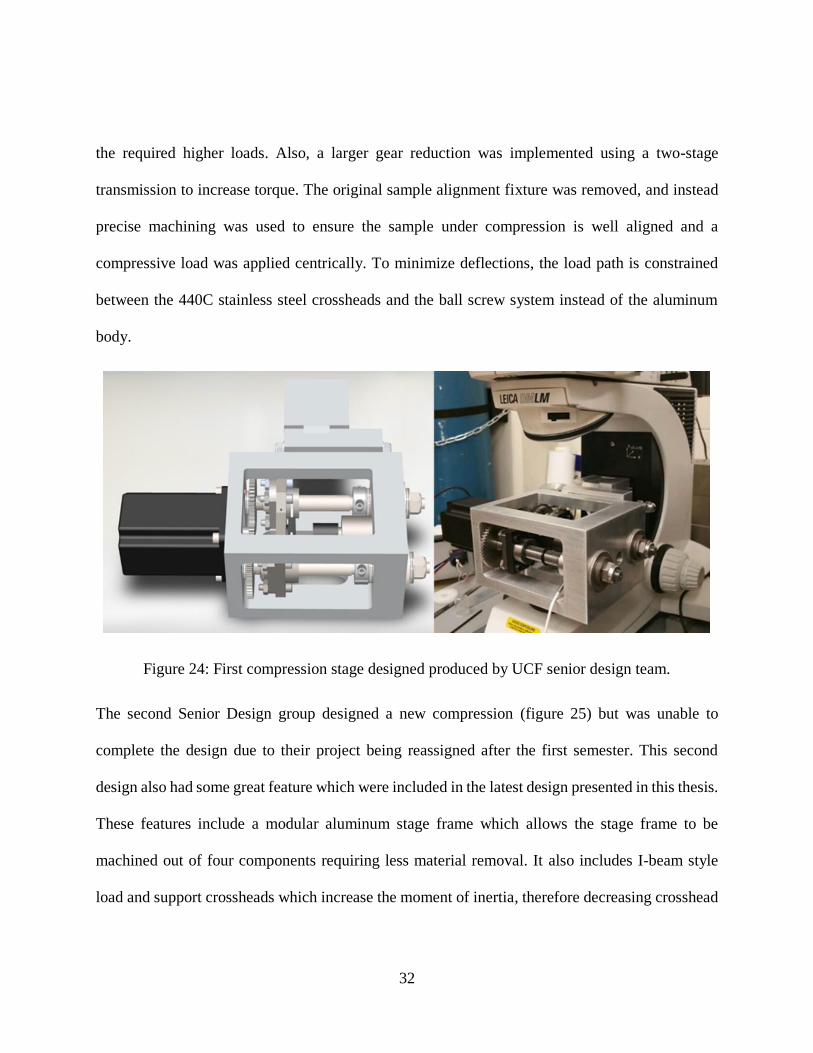
Figure 24: First compression stage designed produced by UCF senior design team. .................. 32
Figure 25: Second design of the compression stage which will be a basis of the redesign. ......... 33
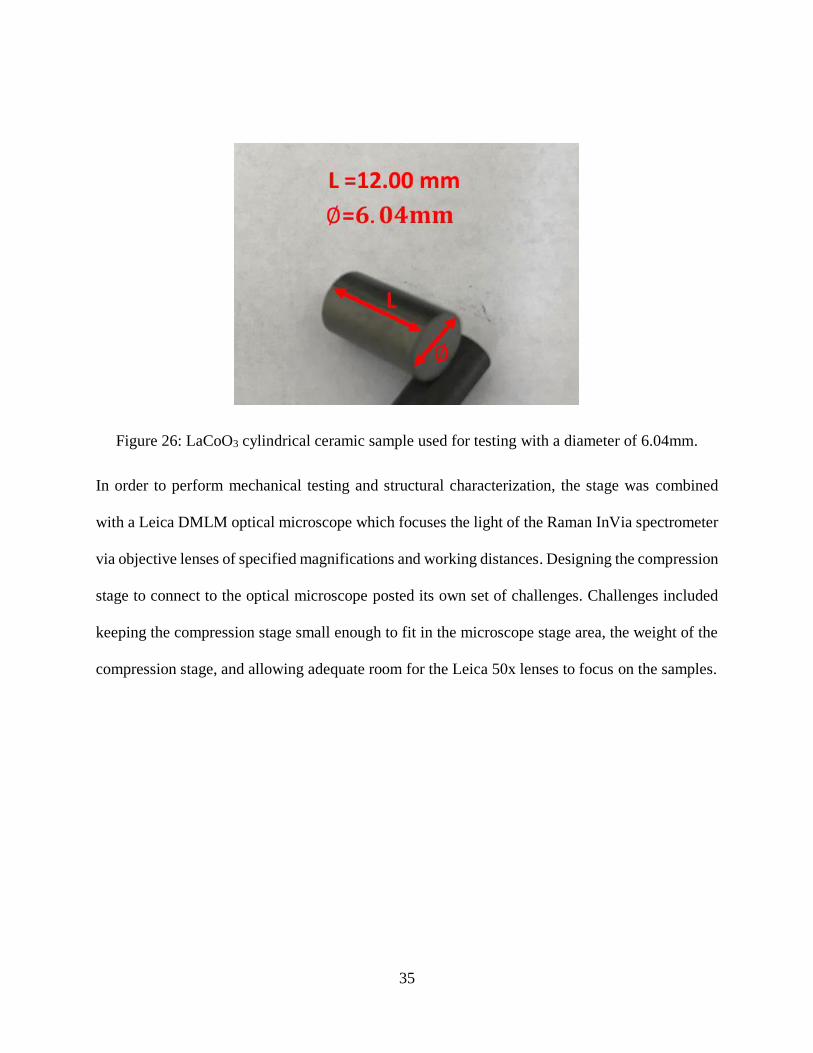
Figure 26: LaCoO3 cylindrical ceramic sample used for testing with a diameter of 6.04mm. ..... 35
Figure 27: Leica DMLM microscope with compression fixture attached and CAD model of
microscope. ................................................................................................................................... 36
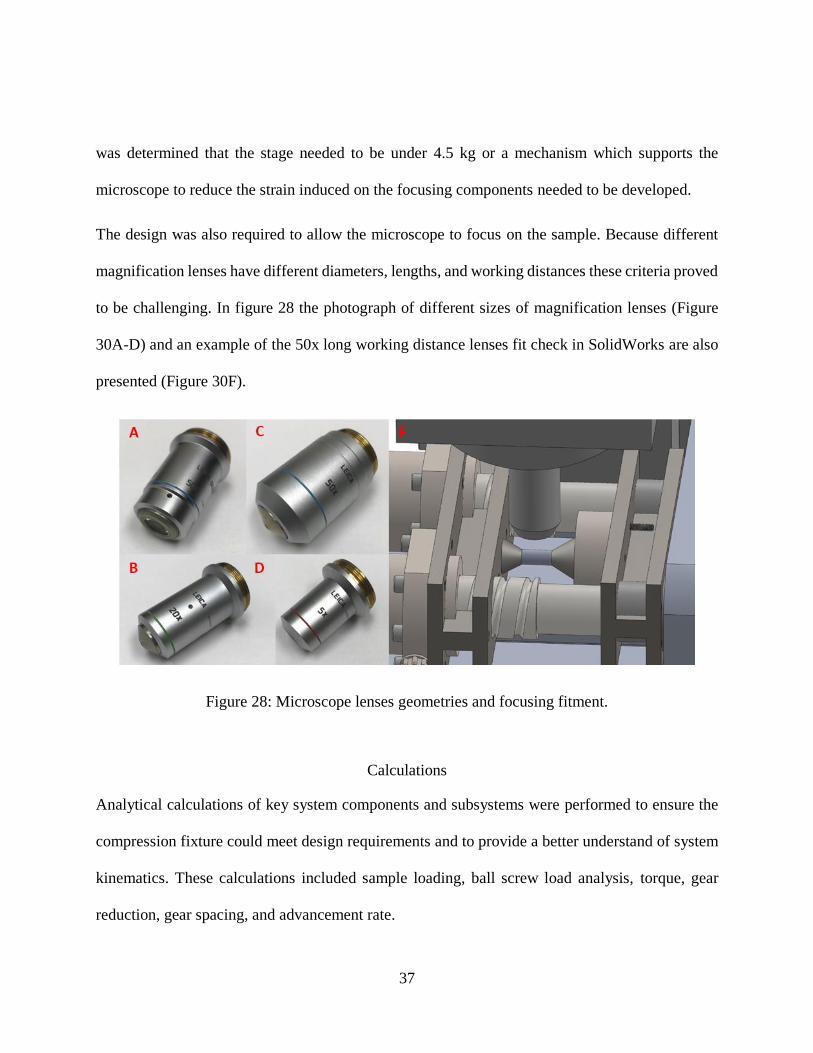
Figure 28: Microscope lenses geometries and focusing fitment. .................................................. 37
Figure 29: Sample load setup. ....................................................................................................... 39
Figure 30: End fixity factor Cs [33]. ............................................................................................. 40
Figure 31: A schematic presentation of a ball screw with a tangential ball return system [34]. .. 42
Figure 32: Drawing of Center to Center Distance of spur gears [35]. .......................................... 44
Figure 33: Initial compression stage design (left) and final compression stage design (right). ... 48
Figure 34: Components of the compression stage fixture. ........................................................... 49
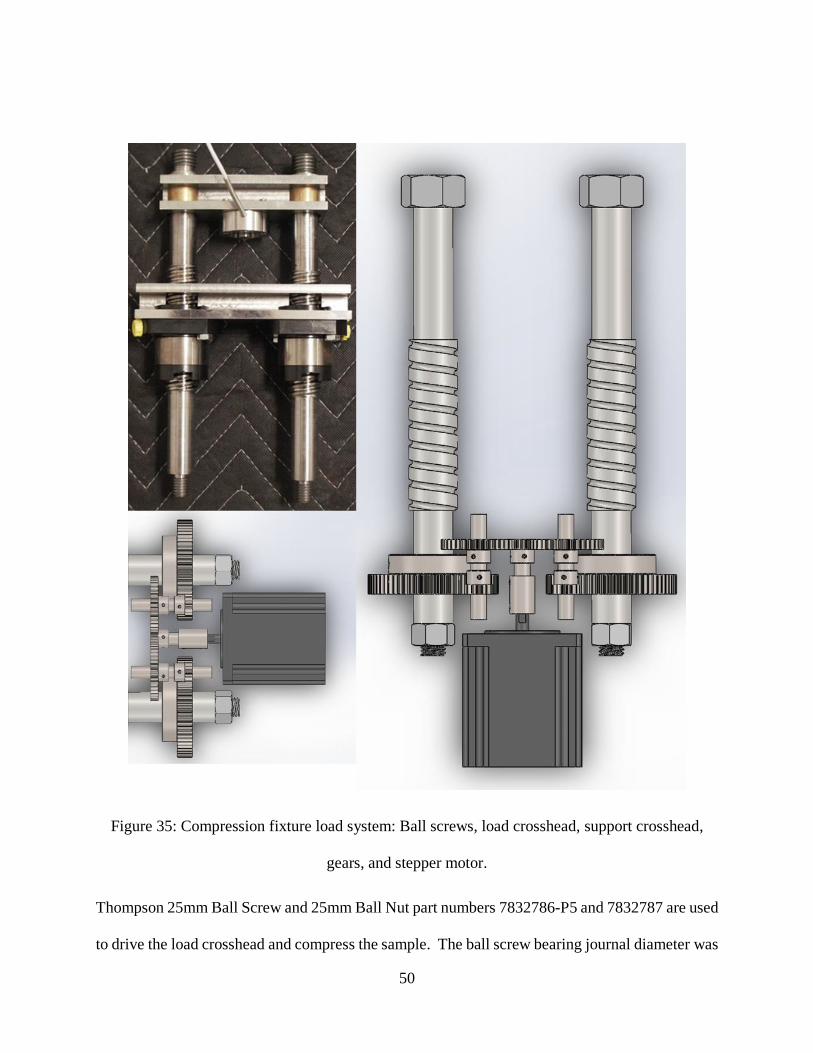
Figure 35: Compression fixture load system: Ball screws, load crosshead, support crosshead,
gears, and stepper motor. .............................................................................................................. 50
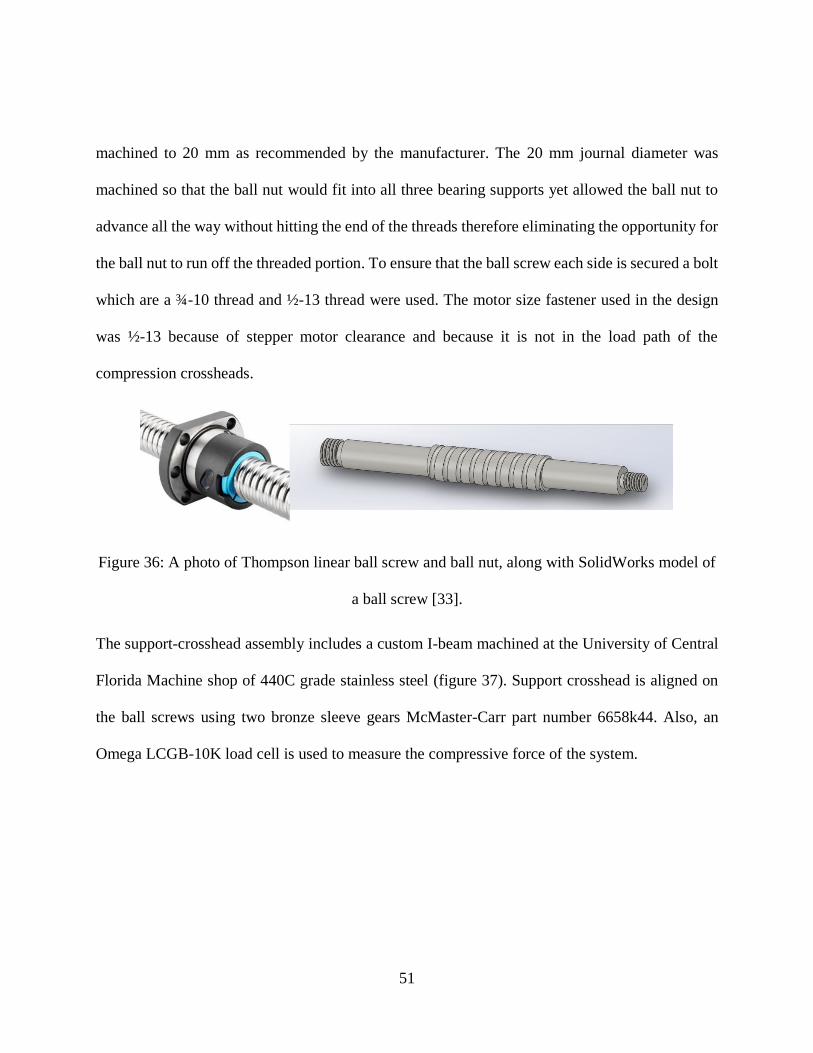
Figure 36: A photo of Thompson linear ball screw and ball nut, along with SolidWorks model of
a ball screw [33]. ........................................................................................................................... 51
Figure 37: Support crosshead subassembly. ................................................................................. 52
Figure 38: Load crosshead subassembly....................................................................................... 52
Figure 39: Compression stage CAD model and machined Assembly. ......................................... 53
Figure 40: Transmission gears design and machined components. .............................................. 54
Figure 41: Compression stage mounting fixture. .......................................................................... 54
Figure 42: Finite element model of Load-crosshead and load platen. .......................................... 56
Figure 43: Compression stage load I-beam FEA deflection results. ............................................ 56
Figure 44: Compression stage load I-beam FEA stress results..................................................... 57
Figure 45: Compression stage load I-beam FEA surface-to-surface contact stress...................... 57
Figure 46: Finite element model of compression stage support crosshead. ................................. 58
Figure 47: Compression stage support I-beam FEA deflection results. ....................................... 58
Figure 48: Compression stage support I-beam FEA stress. .......................................................... 59
Figure 49: Finite element analysis max stress locations. .............................................................. 60
ix
Figure 50: UCF machine shop vertical mill (left) and load cell alignment (right). ...................... 61
Figure 51: Compression fixture machining, assembly, and finished compression fixture. .......... 62
Figure 52: Final Compression stage assembly and components. ................................................. 63
Figure 53: Control system components. ....................................................................................... 64
Figure 54: LabVIEW front panel. ................................................................................................. 67
Figure 55: Bench testing of the compression stage. ..................................................................... 68
Figure 56: Load Cell Calibration using MTS Criterion Model 43 universal testing machine. .... 69
Figure 57: Load cell calibration graph. ......................................................................................... 70
Figure 58: The mounting of the in-situ compression stage to the Leica microscope. .................. 71
Figure 59: Updated Spring system. ............................................................................................... 72
Figure 60: Compression stage waterproof case. ........................................................................... 73
Figure 61: Compression stage setup. A) two-axis mapping stage, B) mounting fixture, C)
elevations system. ......................................................................................................................... 74
Figure 62: Raman spectrograph machine power on procedure. ................................................... 75
Figure 63: Microscope lens in rear position and removing stage support springs. ....................... 76
Figure 64: Calibration sample stage and calibration reference sample. ....................................... 76
Figure 65: System health check (left) and quick calibration (left). .............................................. 77
Figure 66: Raman experiment. ...................................................................................................... 78
Figure 67: Raman spectra of Renishaw Si standard and Laser alignment. ................................... 81
Figure 68: Changes in sample focus location due to sample deflection. ...................................... 82
Figure 69: Optical micrographs before and after testing. ............................................................. 83
Figure 70: Raw data of LaCoO3 Raman testing. .......................................................................... 84
Figure 71: LaCoO3 Raman Peaks at increasing compressive stress. ............................................ 86
Figure 72: LaCoO3 Peaks shift due to uniaxial compression and three point bending tensile
forces [23]. .................................................................................................................................... 87

x
LIST OF TABLES
Table 1: Load due to compressing the ceramic sample to the desired stress of 500 MPa. ........... 38
Table 2: Gear reduction of compression stage transmission. ....................................................... 43
Table 3: Load and support I-beams margins of safety. ................................................................. 60
Table 4: Change in stain vs. change is stress. ............................................................................... 82
xi
EQUATIONS
Equation 1: Load force normal to sample. .................................................................................... 24
Equation 2: Sample deformation. ................................................................................................. 24
Equation 3: Required system force. .............................................................................................. 38
Equation 4: Critical buckling force. .............................................................................................. 40
Equation 5: Safe compression force. ............................................................................................ 40
Equation 6: Required torque. ........................................................................................................ 41
Equation 7: Gear ratio. .................................................................................................................. 42
Equation 8: Center-to-center distance. .......................................................................................... 44
Equation 9: Crosshead speed. ....................................................................................................... 45
Equation 10: Margin of safety yield. ............................................................................................ 59
Equation 11: Margin of safety ultimate. ....................................................................................... 59
1
CHAPTER 1: INTRODUCTION
As engineers we strive to potentially find new research findings which can advance human kind.
That is why this research focuses on developing means of capturing previously non-accessible
aspects of material behavior under realistic operational conditions. Ceramic materials are used for
a variety of energy applications including solid oxide fuel cells, turbomachinery, oxygen
separation, thermal protection, armor, and cutting tools. The ceramics used in these applications
sometimes operate in harsh conditions and are require to endure a multitude of mechanical stresses.
Advancements in mechanical testing have provided numerous testing techniques to classify
mechanical properties of current and new ceramic compositions. These tests provide
characterization of instantaneous and time dependent mechanical properties of advanced ceramic
and ceramic composites. Measurements of mechanical properties, such as uniaxial and biaxial
strength, stress-strain deformation behavior, fracture toughness, hardness, Young’s modulus, and
Poisson’s ratio, are important for the future design of materials and devices based on them.
Although these properties are important for proper design of components and mechanisms, and
allow engineers to estimate the reliability, durability and lifetime of ceramic structures, few testing
techniques allow simultaneous in-situ structural characterization of materials while simultaneously
performing uniaxial compression testing at the same time. Therefore, the miniature compression
testing device proposed in this research is of a high importance to advance the field of in-situ
testing techniques. The miniature compression fixture will initially be used to compress cylindrical
ceramics such as lanthanum cobaltite LaCoO3, yttria stabilized zirconia ZrO3+Y2O3 (ZrO2 +
8mol% Y2O3 And ZrO2 + 3mol% Y2O3), boron carbide B4C, silicon nitride Si3N4, and silicon

2
carbide SiC along with many other new and unusual ceramics and ceramic composites. This thesis
will aim to couple mechanical compression with structural characterization using an in-situ
compression stage and Raman spectroscopy.
Efforts
A compression fixture was designed as a part of the proposed testing effort and will allow for
structural characterization while performing mechanical testing. This compression fixture was
developed to be mounted to a Renishaw InVia Raman spectrometer for simultaneous in-situ
mechanical and structural characterization of Raman active ceramics. The compressive stage was
designed to use an electromechanical system for compression, like the systems of many modern
universal testing machines. As with many other electromechanical universal testing systems, the
stage has a fixed support crosshead and a moving load crosshead. A load is applied using two
rotating lead screw and the applied force is measured using a load cell.
The primary reason for an in house-built compression stage is to allow the stage to be adapted to
the geometry of the existing Raman spectroscopy microscope. The compression stage was
designed in such a way that the microscope stage remains functionable allowing the sample being
studied to still be in focus during compressive loading. In addition, microscope lenses of different
magnification, and therefore size, needed to be able to reach within the required working distance
of the samples surface during testing. While multiple miniature tension-compression stages are
available by well know scientific companies and appear to be extremely well built with control
systems which perform many of the necessary functions, these stages would not be designed
specifically for integration with the existing inVia Raman spectrometer system. There have been

3
at least two previous attempts to design such an in-situ compression stage by Senior Design groups
of undergraduate students. The first group tried to design and develop a very sophisticated in-situ
compression stage that even included a self-alignment feature which would guarantee proper
alignment and centric loading during uniaxial compression experiments. Unfortunately, after
assembly and testing of the first stage, it was realized that the self-alignment feature caused a
significant degree of eccentricity which was always present upon loading and it was not possible
to apply a centric load. The lessons learned by this senior design group was well documented
allowing a second Senior Design group to design a new and improved version of the compression
stage. This second group only produced a preliminary improved design of a new stage before they
were moved to another project; therefore, this thesis work is a last and a successful attempt to build
a uniaxial compression stage.
Goals
The goal of this thesis is to develop a high-performance in-situ compression stage coupled with an
InVia Raman spectrometer for simultaneous testing of mechanical behavior of ceramics and
collection of Raman spectra of ceramics while under compression. To achieve the goal and execute
the development and design of a new stage, research was broken down into the objectives as
follows.
The first objective includes becoming familiar with the stages designed by past senior design
students. The previous designs were thoroughly considered, and the previously designed stages’
building techniques understood. The idea of the new and improved design was entertained, which
includes:

4
1. Creating an improved and updated new design in SolidWorks.
2. Ensuring component tolerances are appropriate for the in-situ compression stage.
The second objective involved modelling and calculating stress at critical section of the
compression fixture to verify the design was adequate. The system was verified to ensure stresses
are within the allowable range for the chosen for materials and large deformations—which could
cause errors in testing results—would not occur. Calculations and finite element analysis were
performed in critical locations. These model and calculations included:
1. The load and support crossheads
2. The ball screws
3. The motor and transmission components
The third objective involved machining and assembling of the miniature compression stage
including:
1. Manufacturing of the parts of the compression stage at the UCF machine shop.
2. Assembling all components into a functioning device.
Last, but not the least, the system was integrated with the Raman spectrometer and preliminary
testing was performed to test the real-world functionality of the test fixture which will include:
1. Programing the load cell and stepper motor.
2. Attaching the compression stage to the microscope.
3. Verification and evaluation of the developed stage.
5
Figure 1: Render of the final compression stage design and completed compression stage.
6
CHAPTER 2: LITERATURE REVIEW
In order to contribute to advancing the field of ceramics forward it is important to understand the
past work of other researchers. This section put the research performed by others and the research
performed during this thesis into perspective. By reviewing other similar research, key concepts
are defined and knowledge which helped shape the research efforts presented in subsequent
chapters.
Raman Spectroscopy Overview
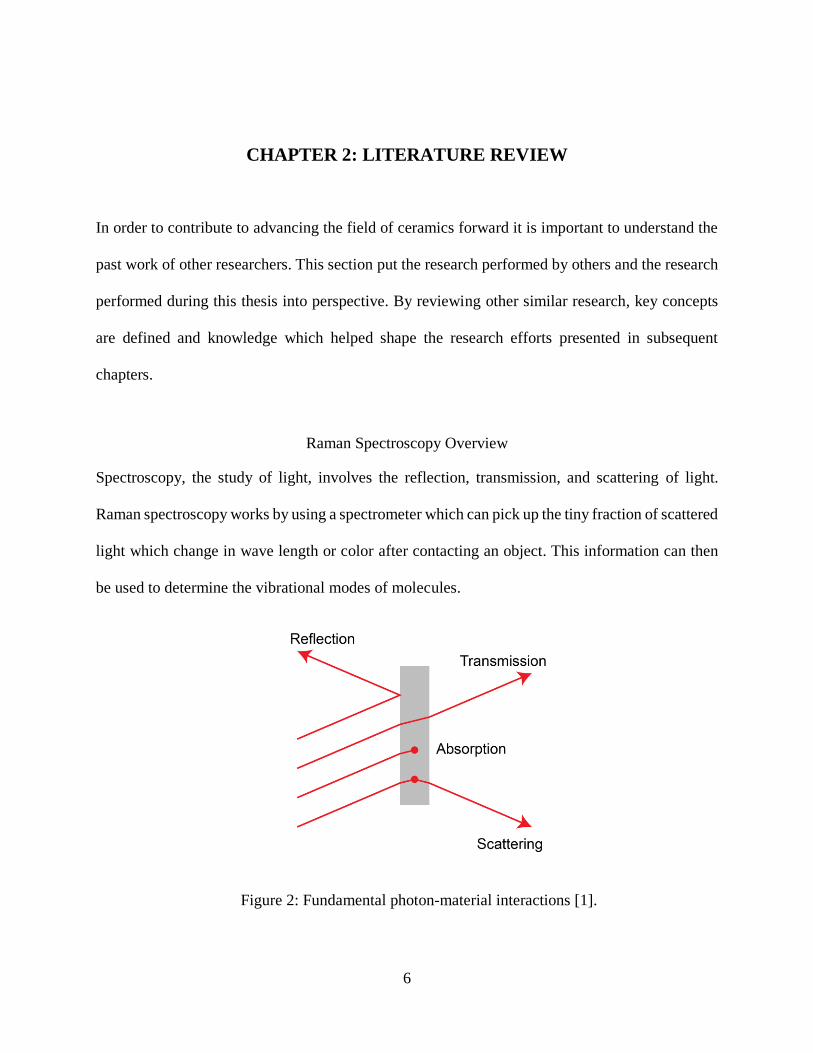
Spectroscopy, the study of light, involves the reflection, transmission, and scattering of light.
Raman spectroscopy works by using a spectrometer which can pick up the tiny fraction of scattered
light which change in wave length or color after contacting an object. This information can then
be used to determine the vibrational modes of molecules.
Figure 2: Fundamental photon-material interactions [1].
7
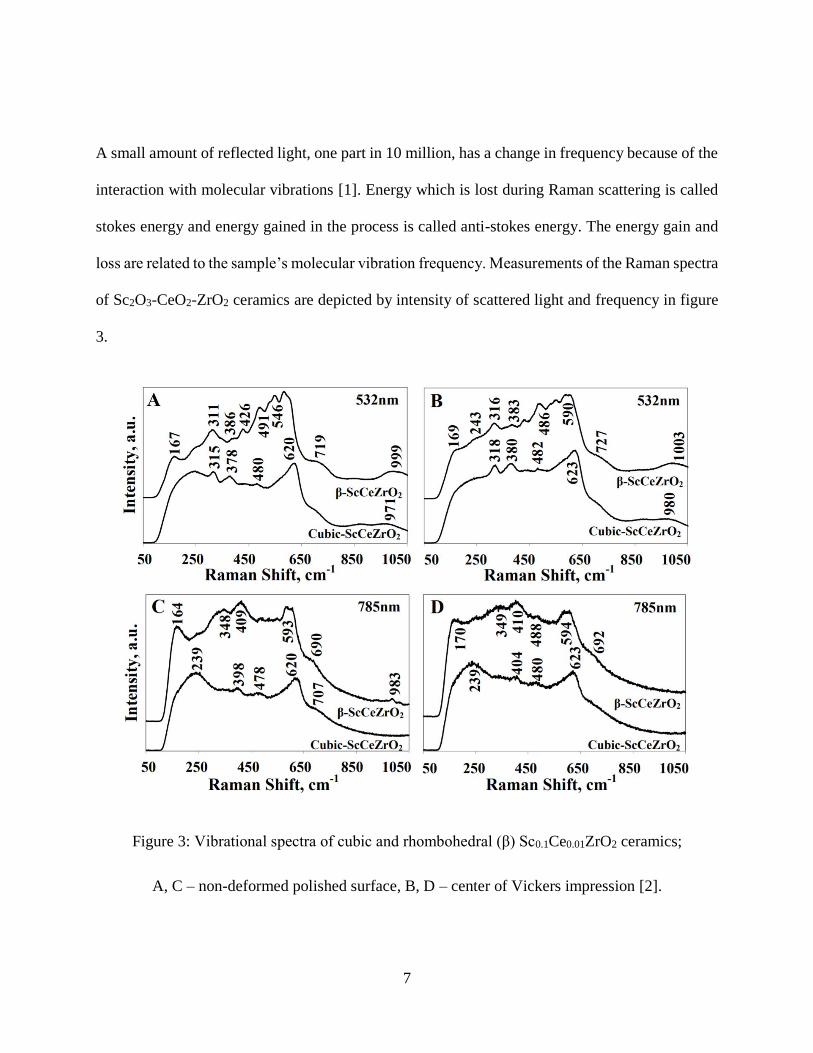
A small amount of reflected light, one part in 10 million, has a change in frequency because of the
interaction with molecular vibrations [1]. Energy which is lost during Raman scattering is called
stokes energy and energy gained in the process is called anti-stokes energy. The energy gain and
loss are related to the sample’s molecular vibration frequency. Measurements of the Raman spectra
of Sc2O3-CeO2-ZrO2 ceramics are depicted by intensity of scattered light and frequency in figure
3.
Figure 3: Vibrational spectra of cubic and rhombohedral (β) Sc0.1Ce0.01ZrO2 ceramics;
A, C – non-deformed polished surface, B, D – center of Vickers impression [2].

8
Raman spectrometer systems consist of colored light sources, sometimes referred to as lasers,
lenses which focus light on the sample and collect the subsequent scattered light, filters which
purify the reflected and scattered light, diffraction grating or prism to split light into its constituent
colors, and a detector which analysis the results. Raman spectroscopy can be used to analyze the
scattered light by solid materials, such as ceramics, and characterize the materials structure. There
are many advantages to Raman spectroscopy. First, structural characterization of the molecular
motion of materials including ceramics can be performed without damaging the specimen. Also,
many Raman spectroscopy tests have relatively easy setup procedures and short acquisition times
which allows materials and components to be tested in a fast and efficient manner. The data
collected during tests can then be used to provide chemical and structural information in an
efficient manner [1]. It is possible other important material characteristics including residual
stresses, impurities, and defects can also be uncovered. Likewise, Raman spectroscopy produces
multiple challenges. One such challenge is photoluminescence, which can mask Raman
information. Additional challenges include chemical glassware masking Raman signals and
identifying the optimal laser power which generates significant Raman scattering without
producing structural or chemical modifications to the material.
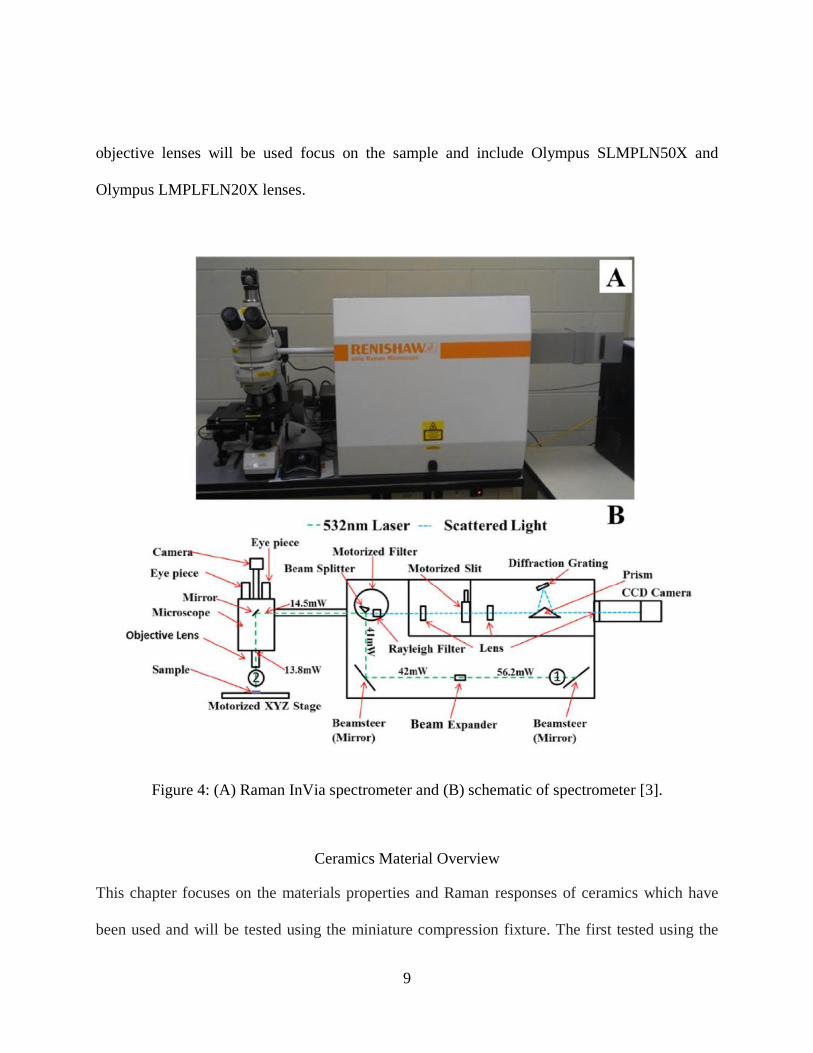
The specific Raman spectroscopy system, which is used to be coupled with the proposed
compression stage is the Renishaw InVia Raman spectroscope (Wotton-under-Edge, United
Kingdom). The Leica DMLM optical microscope is to be used as a base for the compression stage
attached to it. It will also allow focusing of the ceramic sample by adjusting the compression
fixture in the Z-direction. While performing Raman spectral acquisitions, a 532nm silicon laser
with a maximum power of 100mW is used to excite the ceramic samples. Long working distance
9
objective lenses will be used focus on the sample and include Olympus SLMPLN50X and
Olympus LMPLFLN20X lenses.
Figure 4: (A) Raman InVia spectrometer and (B) schematic of spectrometer [3].
Ceramics Material Overview
This chapter focuses on the materials properties and Raman responses of ceramics which have
been used and will be tested using the miniature compression fixture. The first tested using the
10
compression fixture was lanthanum cobaltite (LaCoO3). Other materials, such as yttria stabilized
zirconia (ZrO3+Y2O3), boron carbide (B4C), Silicon Nitride (Si3N4), and Silicon Carbide (SiC),
will be tested using the developed stage in the future research work.
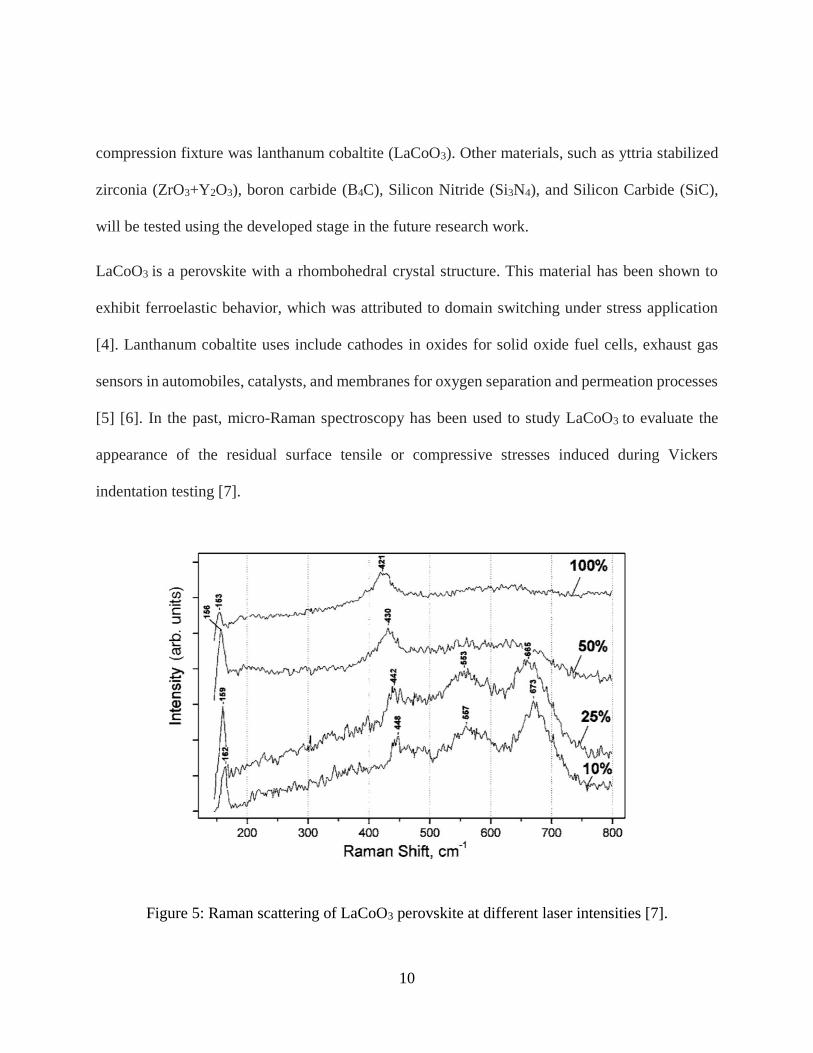
LaCoO3 is a perovskite with a rhombohedral crystal structure. This material has been shown to
exhibit ferroelastic behavior, which was attributed to domain switching under stress application
[4]. Lanthanum cobaltite uses include cathodes in oxides for solid oxide fuel cells, exhaust gas
sensors in automobiles, catalysts, and membranes for oxygen separation and permeation processes
[5] [6]. In the past, micro-Raman spectroscopy has been used to study LaCoO3 to evaluate the
appearance of the residual surface tensile or compressive stresses induced during Vickers
indentation testing [7].
Figure 5: Raman scattering of LaCoO3 perovskite at different laser intensities [7].
11
Figure 6: Spectra of sintered (a) 3Y-TZP and (b) 8Y-FSZ. Solid line for original and dashed line
for background subtracted spectrum [9].
Yttria stabilized zirconia with compositions of 3 mol% Y2O3-stabilized tetragonal zirconia
polycrystals (3Y-TZPs) and 8 mol% Y2O3-stabilized cubic zirconia (8Y-CSZ) are an important
12
class of ceramic materials because of either transformation toughening occurring in 3Y-TZP or
fast ionic conduction occurring in 8Y-CSZ [8] [9]. Uses of yittria stabilized zirconia include
electrode materials in solid oxide fuel cells and oxygen separation membranes. Yttria stabilized
zirconia has been studied in the past uses Raman spectroscopy and its typical spectra (figure 6).
Boron carbide is a ceramic with a rhombohedral crystal structure which has a low theoretical
density and high hardness [10] [11]. Examples of uses for boron carbide include armor because of
its low density and high hardness and absorption of neutron for nuclear reactors because of its high
neutron cross section for absorption [11]. In the past, Raman spectroscopy has been used to
evaluate the micro-structure structure of boron carbide (figure 7).
Figure 7: (a) Secondary electron image of a reaction bonded B4C microstructure revealing a
core-rim structure (b) Raman spectra for the phases present: Si, SiC, B4C (core), and (B,Si,C)
(rim) [12].
13
Silicon nitride has a cubic or hexagonal crystal structure and is used for cutting tools and high
temperature applications such as rocket thrusters [13] [14] [15]. In the past, structural
characterization of cubic silicon nitride has been performed using Raman spectroscopy (Figure 8).
Figure 8: A typical Raman spectrum for the cubic spinel Si3N4 phase measured with 514.5 nm
excitation at 295 K [16].
Silicon carbide is known to have a wide variety of poly types including cubic, hexagonal, and
rhombohedral crystalline structures [17]. Uses of silicon carbide include armor, cutting tools, and
thermal protection systems for space applications [18] [19]. Structural investigation of silicon
carbide has also been performed in the past using micro-Raman spectroscopy (figure 9).
14
Figure 9: Comparison the of Raman spectra of 4H-SiC (B3PMA7) measured for different z
positions [20].
In-situ Mechanical Testing and Structural Characterization
In the past, researchers have made great progress coupling mechanical testing with structural
characterization. The studies reviewed in this section use different mechanical testing techniques,
structural characterization methods, and materials which demonstrates the importance of
mechanical testing while performing structural characterization in a multitude of research areas.
Key research projects were reviewed to understand conceptually similar studies and to put the
work of this thesis into perspective.
Nanomechanical testing was performed on Ni nanopillars using a Pico indenter equipped with a
diamond flat-tipped punch tip [21]. This Bruker Hysteron PI 95 TEM picoindenter (Bruker,
Billerica, MA) was used to perform unique loads by loading individual nanostructures while
viewing the experiment using a transmission electron microscope.
15
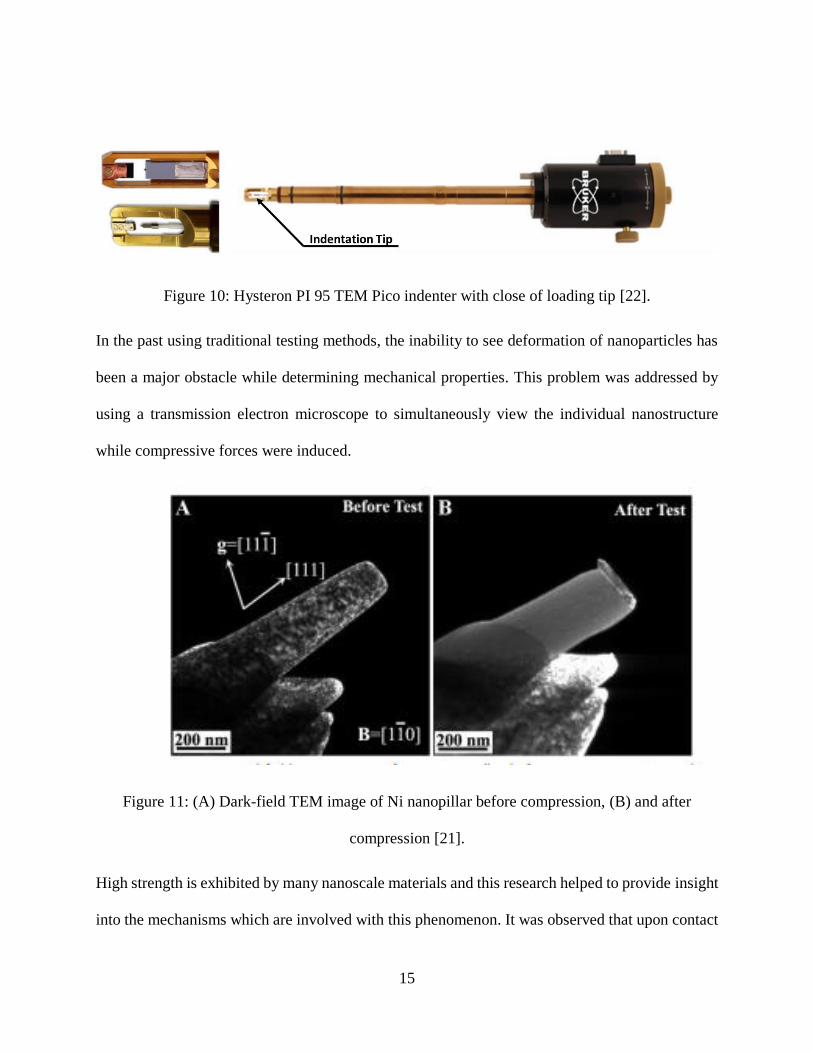
Figure 10: Hysteron PI 95 TEM Pico indenter with close of loading tip [22].
In the past using traditional testing methods, the inability to see deformation of nanoparticles has
been a major obstacle while determining mechanical properties. This problem was addressed by
using a transmission electron microscope to simultaneously view the individual nanostructure
while compressive forces were induced.
Figure 11: (A) Dark-field TEM image of Ni nanopillar before compression, (B) and after
compression [21].
High strength is exhibited by many nanoscale materials and this research helped to provide insight
into the mechanisms which are involved with this phenomenon. It was observed that upon contact
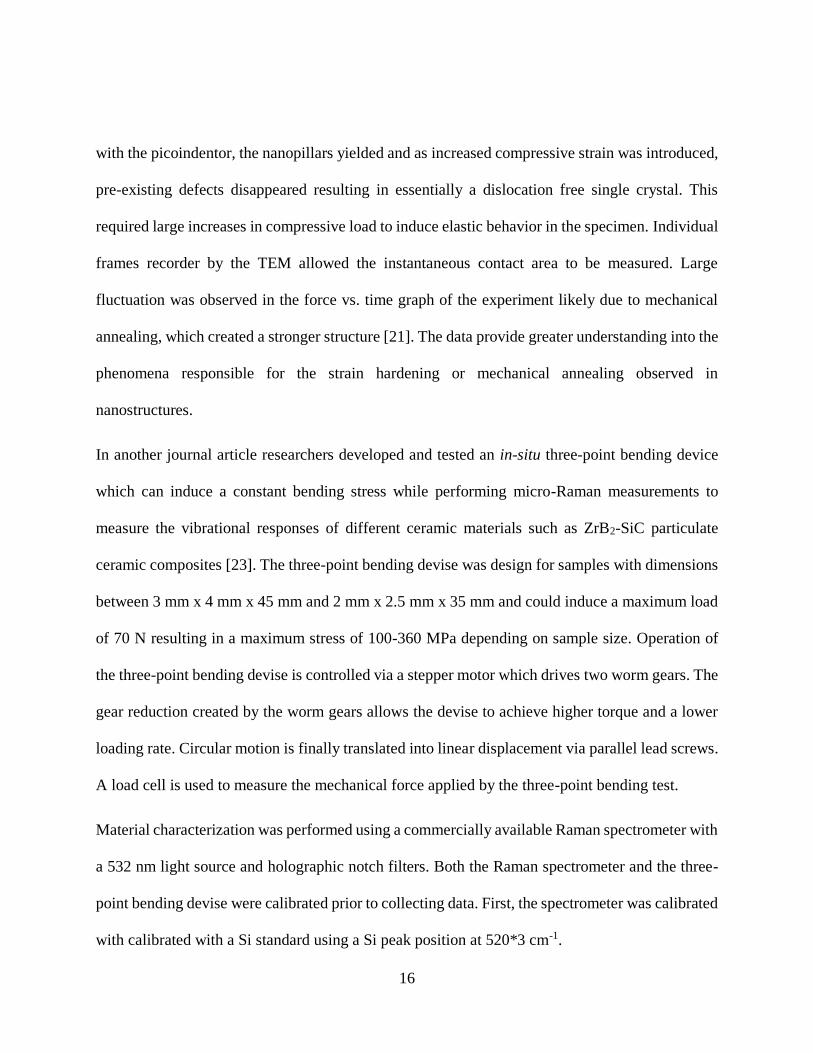
16
with the picoindentor, the nanopillars yielded and as increased compressive strain was introduced,
pre-existing defects disappeared resulting in essentially a dislocation free single crystal. This
required large increases in compressive load to induce elastic behavior in the specimen. Individual
frames recorder by the TEM allowed the instantaneous contact area to be measured. Large
fluctuation was observed in the force vs. time graph of the experiment likely due to mechanical
annealing, which created a stronger structure [21]. The data provide greater understanding into the
phenomena responsible for the strain hardening or mechanical annealing observed in
nanostructures.
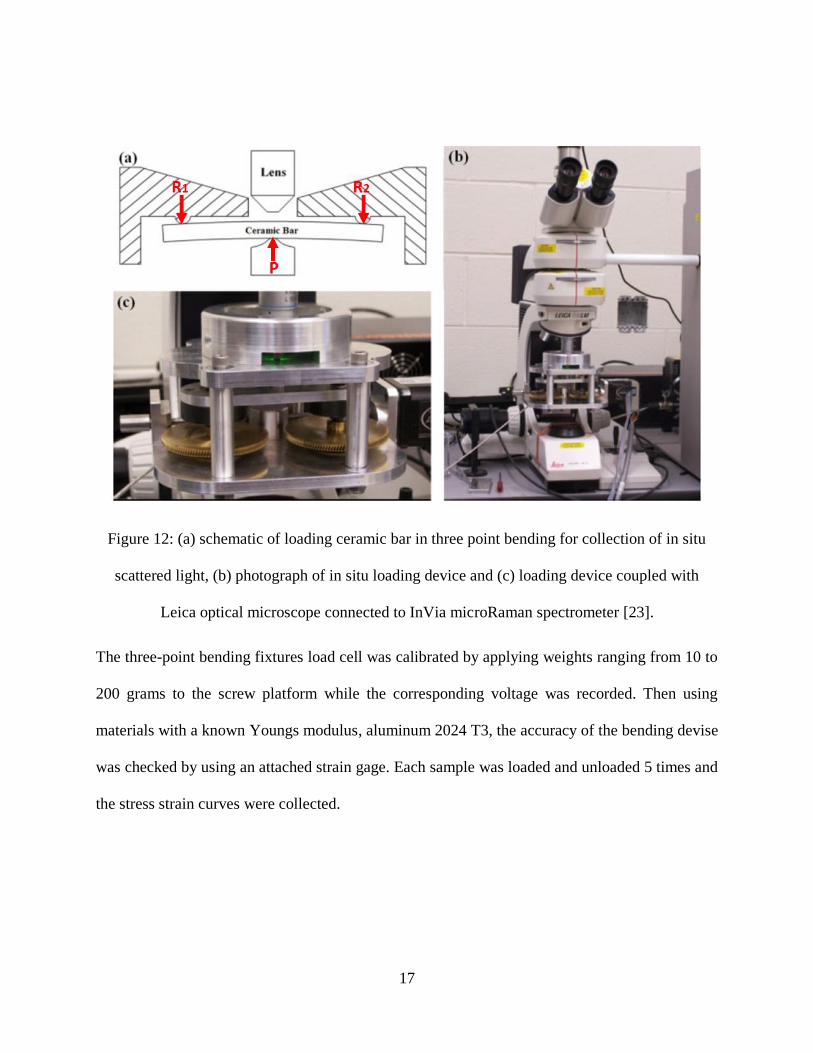
In another journal article researchers developed and tested an in-situ three-point bending device
which can induce a constant bending stress while performing micro-Raman measurements to
measure the vibrational responses of different ceramic materials such as ZrB2-SiC particulate
ceramic composites [23]. The three-point bending devise was design for samples with dimensions
between 3 mm x 4 mm x 45 mm and 2 mm x 2.5 mm x 35 mm and could induce a maximum load
of 70 N resulting in a maximum stress of 100-360 MPa depending on sample size. Operation of
the three-point bending devise is controlled via a stepper motor which drives two worm gears. The
gear reduction created by the worm gears allows the devise to achieve higher torque and a lower
loading rate. Circular motion is finally translated into linear displacement via parallel lead screws.
A load cell is used to measure the mechanical force applied by the three-point bending test.
Material characterization was performed using a commercially available Raman spectrometer with
a 532 nm light source and holographic notch filters. Both the Raman spectrometer and the three-
point bending devise were calibrated prior to collecting data. First, the spectrometer was calibrated
with calibrated with a Si standard using a Si peak position at 520*3 cm-1.
17
Figure 12: (a) schematic of loading ceramic bar in three point bending for collection of in situ
scattered light, (b) photograph of in situ loading device and (c) loading device coupled with
Leica optical microscope connected to InVia microRaman spectrometer [23].
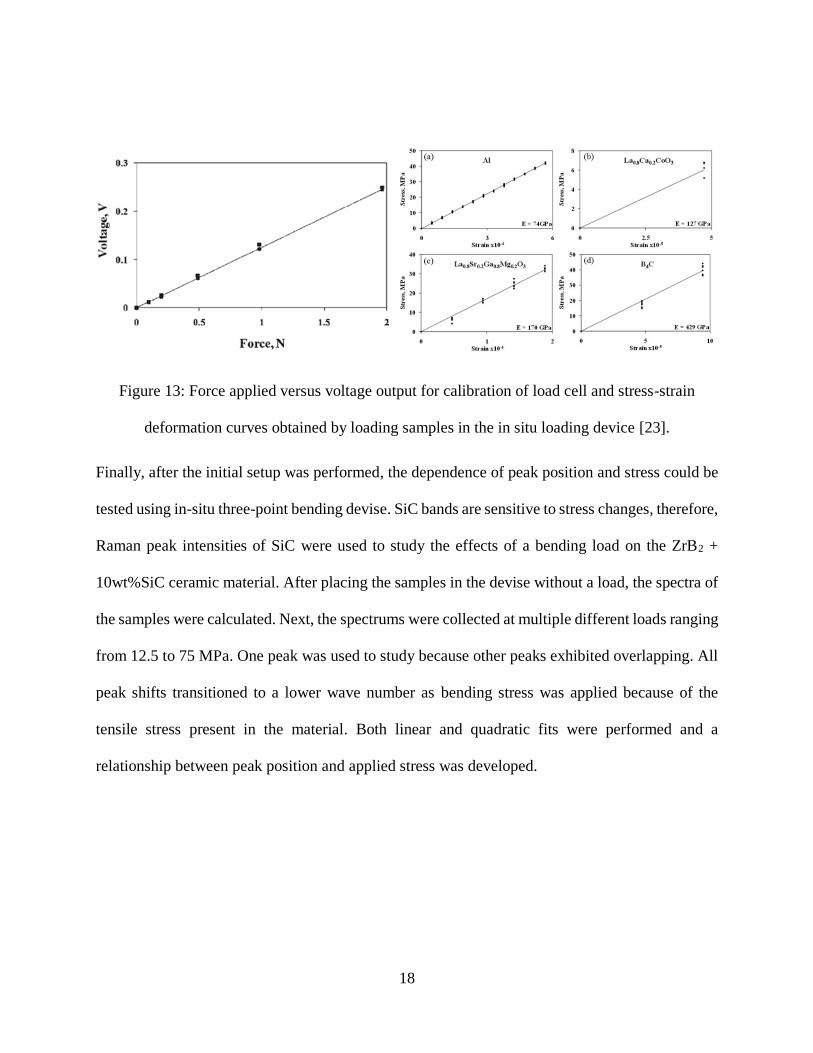
The three-point bending fixtures load cell was calibrated by applying weights ranging from 10 to
200 grams to the screw platform while the corresponding voltage was recorded. Then using
materials with a known Youngs modulus, aluminum 2024 T3, the accuracy of the bending devise
was checked by using an attached strain gage. Each sample was loaded and unloaded 5 times and
the stress strain curves were collected.
18
Figure 13: Force applied versus voltage output for calibration of load cell and stress-strain
deformation curves obtained by loading samples in the in situ loading device [23].
Finally, after the initial setup was performed, the dependence of peak position and stress could be
tested using in-situ three-point bending devise. SiC bands are sensitive to stress changes, therefore,
Raman peak intensities of SiC were used to study the effects of a bending load on the ZrB2 +
10wt%SiC ceramic material. After placing the samples in the devise without a load, the spectra of
the samples were calculated. Next, the spectrums were collected at multiple different loads ranging
from 12.5 to 75 MPa. One peak was used to study because other peaks exhibited overlapping. All
peak shifts transitioned to a lower wave number as bending stress was applied because of the
tensile stress present in the material. Both linear and quadratic fits were performed and a
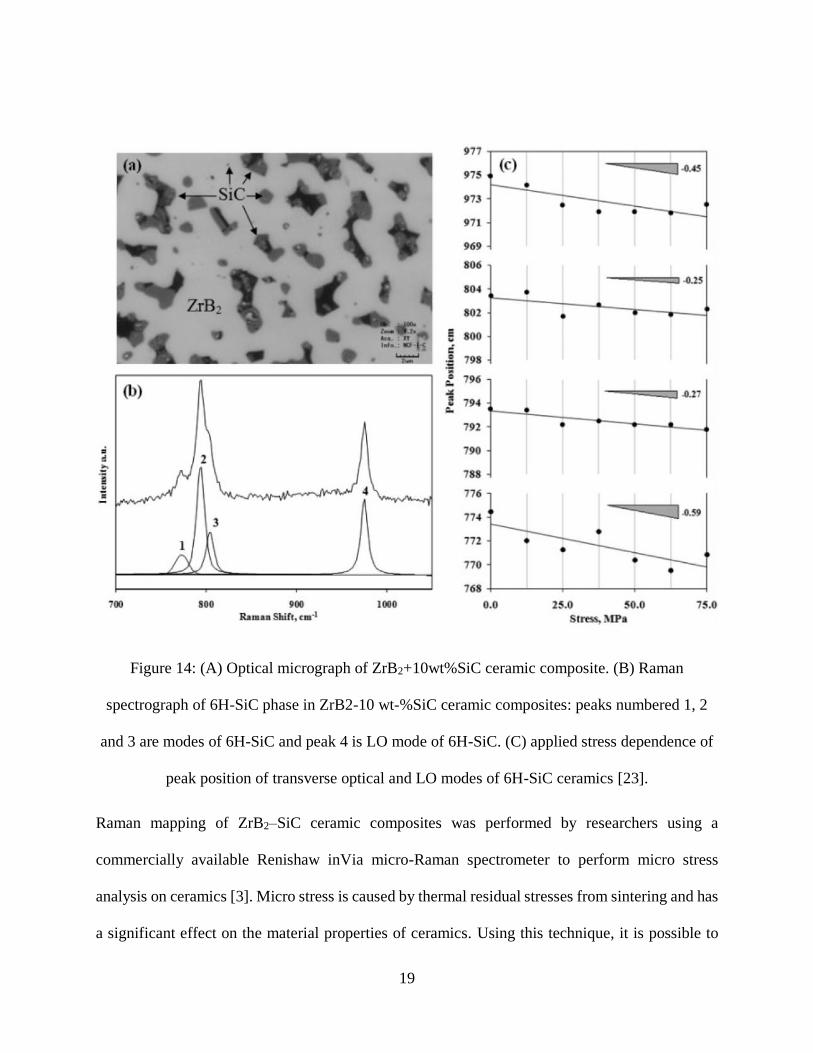
relationship between peak position and applied stress was developed.
19
Figure 14: (A) Optical micrograph of ZrB2+10wt%SiC ceramic composite. (B) Raman
spectrograph of 6H-SiC phase in ZrB2-10 wt-%SiC ceramic composites: peaks numbered 1, 2
and 3 are modes of 6H-SiC and peak 4 is LO mode of 6H-SiC. (C) applied stress dependence of
peak position of transverse optical and LO modes of 6H-SiC ceramics [23].
Raman mapping of ZrB2–SiC ceramic composites was performed by researchers using a
commercially available Renishaw inVia micro-Raman spectrometer to perform micro stress
analysis on ceramics [3]. Micro stress is caused by thermal residual stresses from sintering and has
a significant effect on the material properties of ceramics. Using this technique, it is possible to
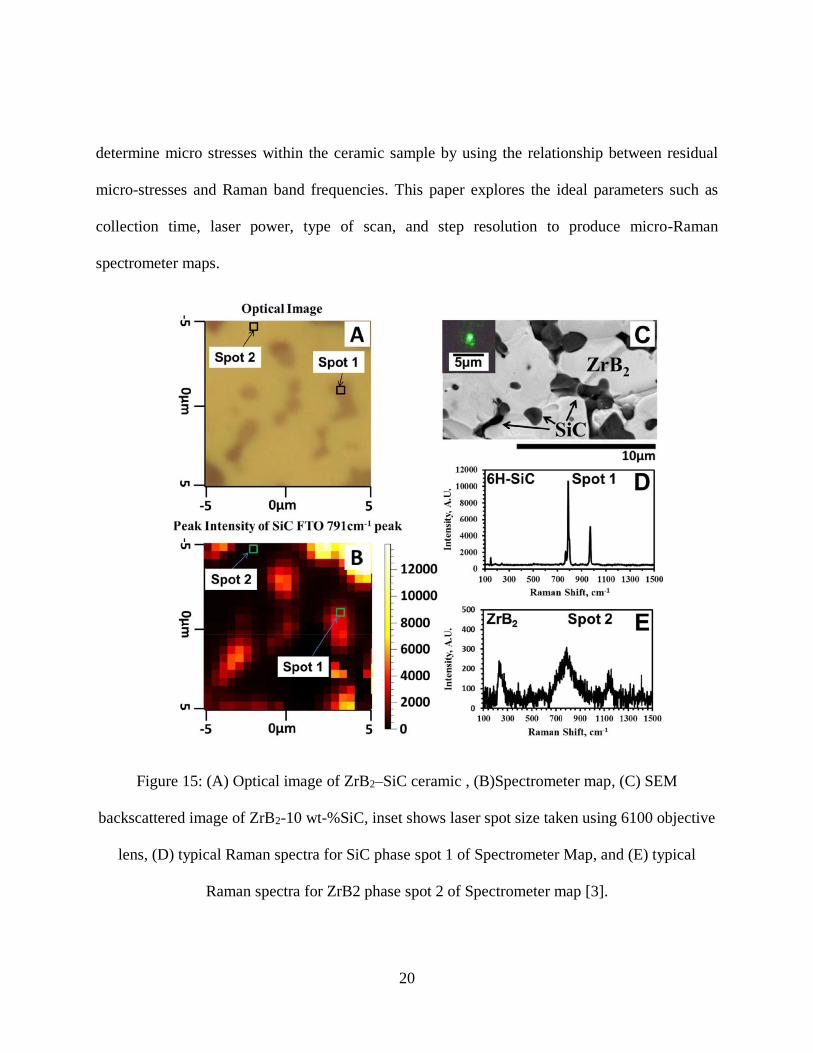
20
determine micro stresses within the ceramic sample by using the relationship between residual
micro-stresses and Raman band frequencies. This paper explores the ideal parameters such as
collection time, laser power, type of scan, and step resolution to produce micro-Raman
spectrometer maps.
Figure 15: (A) Optical image of ZrB2–SiC ceramic , (B)Spectrometer map, (C) SEM
backscattered image of ZrB2-10 wt-%SiC, inset shows laser spot size taken using 6100 objective
lens, (D) typical Raman spectra for SiC phase spot 1 of Spectrometer Map, and (E) typical
Raman spectra for ZrB2 phase spot 2 of Spectrometer map [3].
21
The best set points for exposure time and scan type were determined for ZrB2-10wt-%SiC. It was
determined by the researchers that an exposure time of 30 seconds and a static or scan with a
resolution of 0.5 um produced the highest quality results.
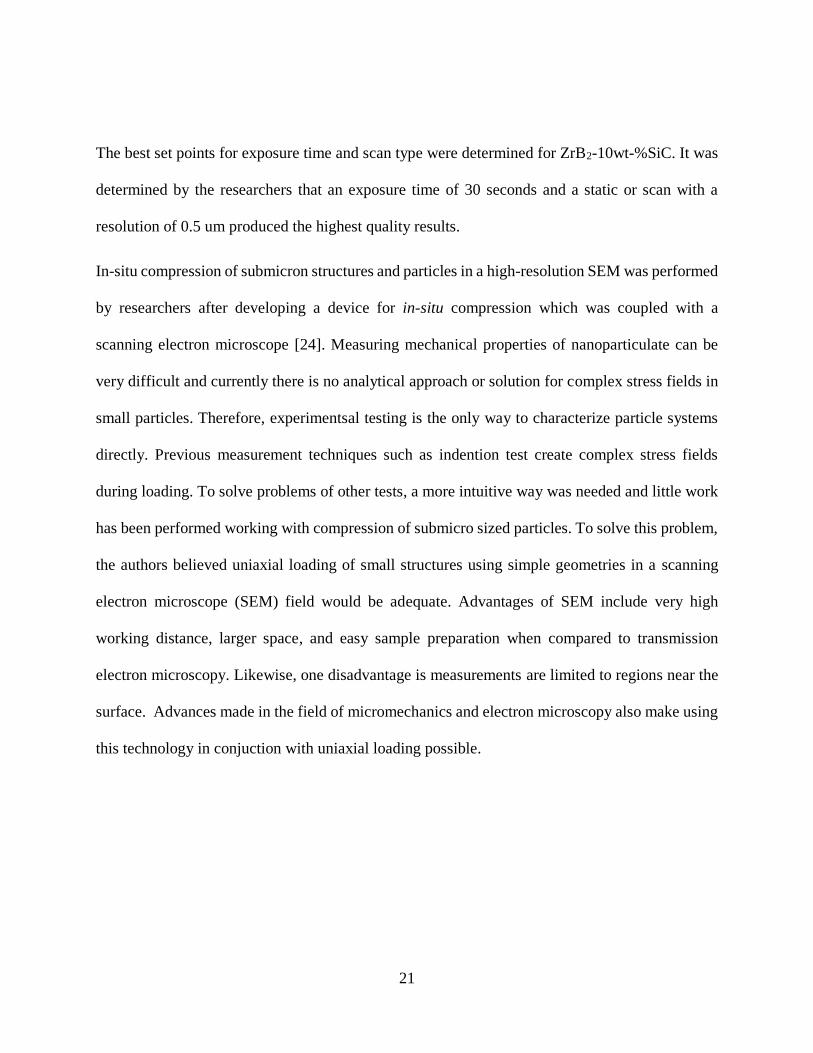
In-situ compression of submicron structures and particles in a high-resolution SEM was performed
by researchers after developing a device for in-situ compression which was coupled with a
scanning electron microscope [24]. Measuring mechanical properties of nanoparticulate can be
very difficult and currently there is no analytical approach or solution for complex stress fields in
small particles. Therefore, experimentsal testing is the only way to characterize particle systems
directly. Previous measurement techniques such as indention test create complex stress fields
during loading. To solve problems of other tests, a more intuitive way was needed and little work
has been performed working with compression of submicro sized particles. To solve this problem,
the authors believed uniaxial loading of small structures using simple geometries in a scanning
electron microscope (SEM) field would be adequate. Advantages of SEM include very high
working distance, larger space, and easy sample preparation when compared to transmission
electron microscopy. Likewise, one disadvantage is measurements are limited to regions near the
surface. Advances made in the field of micromechanics and electron microscopy also make using
this technology in conjuction with uniaxial loading possible.
22
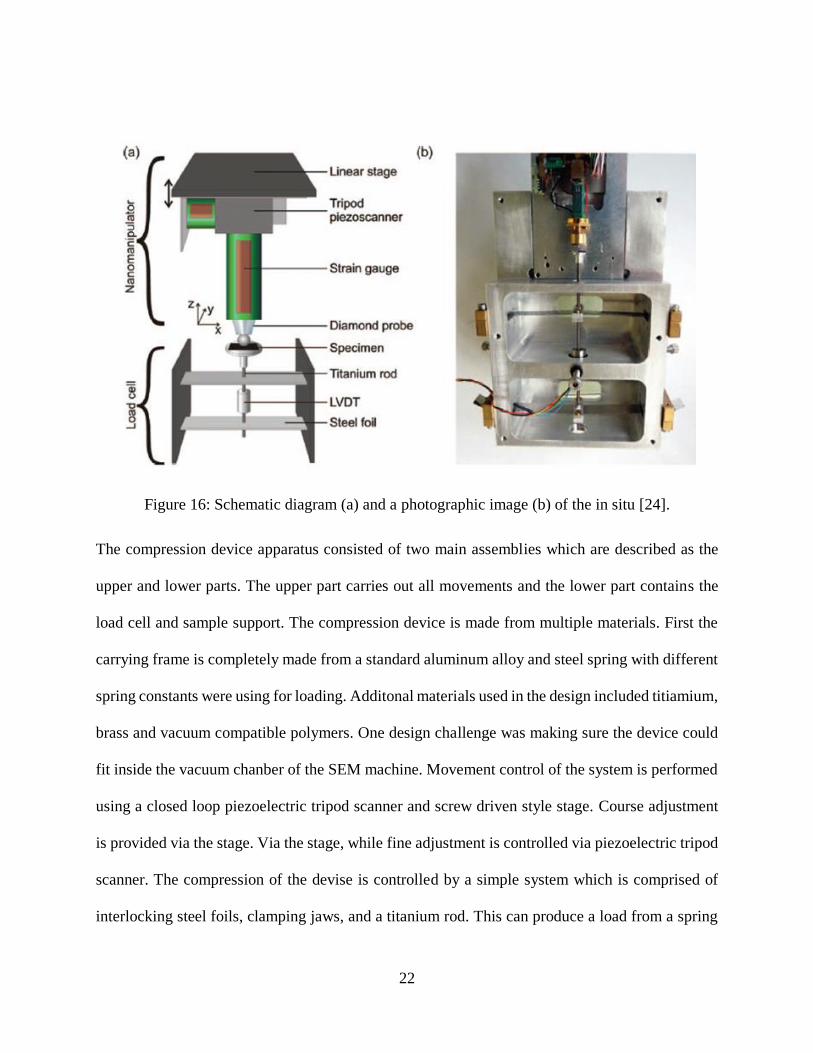
Figure 16: Schematic diagram (a) and a photographic image (b) of the in situ [24].
The compression device apparatus consisted of two main assemblies which are described as the
upper and lower parts. The upper part carries out all movements and the lower part contains the
load cell and sample support. The compression device is made from multiple materials. First the
carrying frame is completely made from a standard aluminum alloy and steel spring with different
spring constants were using for loading. Additonal materials used in the design included titiamium,
brass and vacuum compatible polymers. One design challenge was making sure the device could
fit inside the vacuum chanber of the SEM machine. Movement control of the system is performed
using a closed loop piezoelectric tripod scanner and screw driven style stage. Course adjustment
is provided via the stage. Via the stage, while fine adjustment is controlled via piezoelectric tripod
scanner. The compression of the devise is controlled by a simple system which is comprised of
interlocking steel foils, clamping jaws, and a titanium rod. This can produce a load from a spring
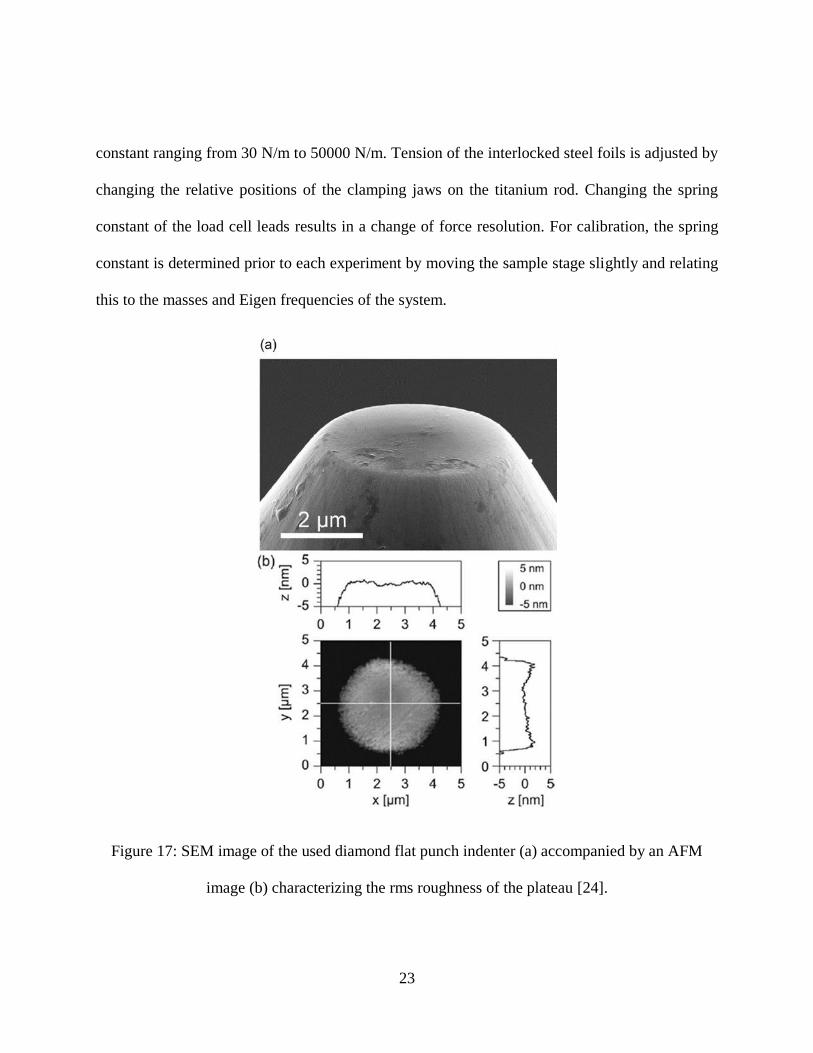
23
constant ranging from 30 N/m to 50000 N/m. Tension of the interlocked steel foils is adjusted by
changing the relative positions of the clamping jaws on the titanium rod. Changing the spring
constant of the load cell leads results in a change of force resolution. For calibration, the spring
constant is determined prior to each experiment by moving the sample stage slightly and relating
this to the masses and Eigen frequencies of the system.
Figure 17: SEM image of the used diamond flat punch indenter (a) accompanied by an AFM
image (b) characterizing the rms roughness of the plateau [24].

24
A unique set of equations are used to processes the data which is recorded by the researchers.
Force and deformation data are determined from the probe’s movement normal to the samples
surface which is measured via a stain gage. The loading force normal to the samples is
determined using the spring deflection related with the LVDT output voltage and the spring
constant which is calculated using the equation 1.
Equation 1: Load force normal to sample.
F = D∆Um
σ (1)
The sample deformation is also calculated using equation 2.
Equation 2: Sample deformation.
δt = (∆Zm − ζ) −∆Um
σ (2)
The mechanical behavior of in-situ chondrocytes under compression was studied using an in-situ
compression system in conjunction with a laser scanning microscope to investigate the effects of
cartilage tissue lesions [25].
25
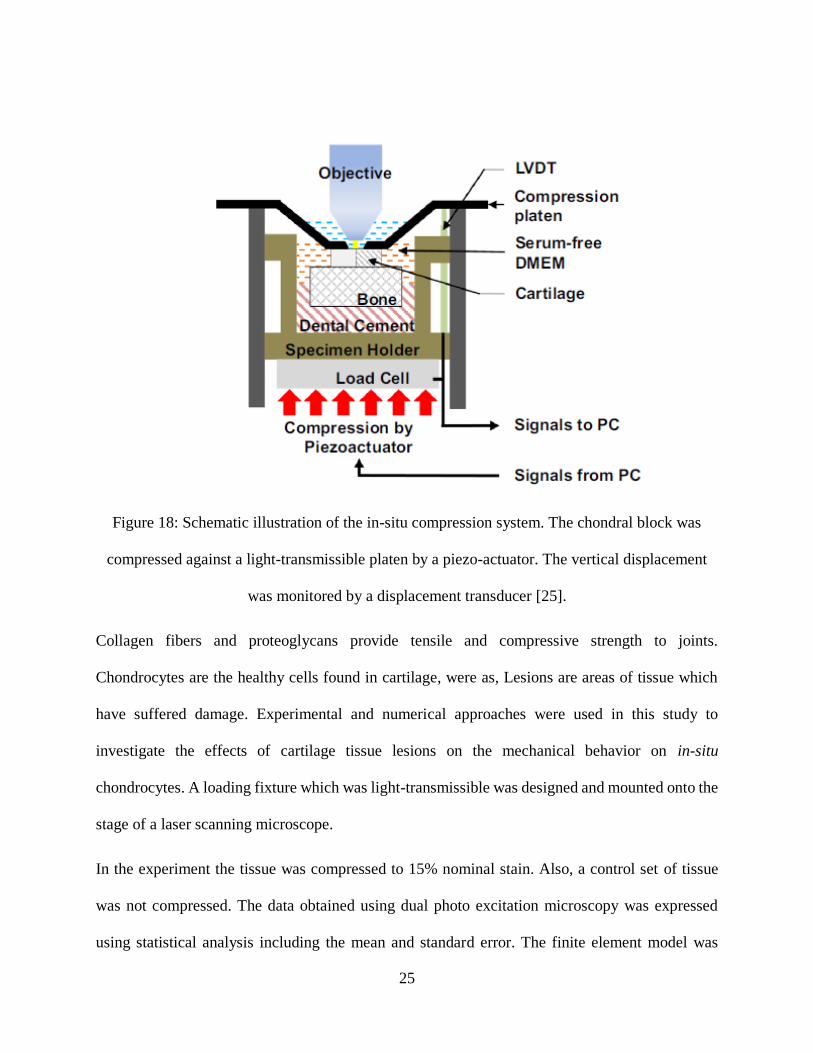
Figure 18: Schematic illustration of the in-situ compression system. The chondral block was
compressed against a light-transmissible platen by a piezo-actuator. The vertical displacement
was monitored by a displacement transducer [25].
Collagen fibers and proteoglycans provide tensile and compressive strength to joints.
Chondrocytes are the healthy cells found in cartilage, were as, Lesions are areas of tissue which
have suffered damage. Experimental and numerical approaches were used in this study to
investigate the effects of cartilage tissue lesions on the mechanical behavior on in-situ
chondrocytes. A loading fixture which was light-transmissible was designed and mounted onto the
stage of a laser scanning microscope.
In the experiment the tissue was compressed to 15% nominal stain. Also, a control set of tissue
was not compressed. The data obtained using dual photo excitation microscopy was expressed
using statistical analysis including the mean and standard error. The finite element model was
26
based off a pre-established two-scale model which had previously been used to study in-situ
mechanical behavior of chondrocytes.
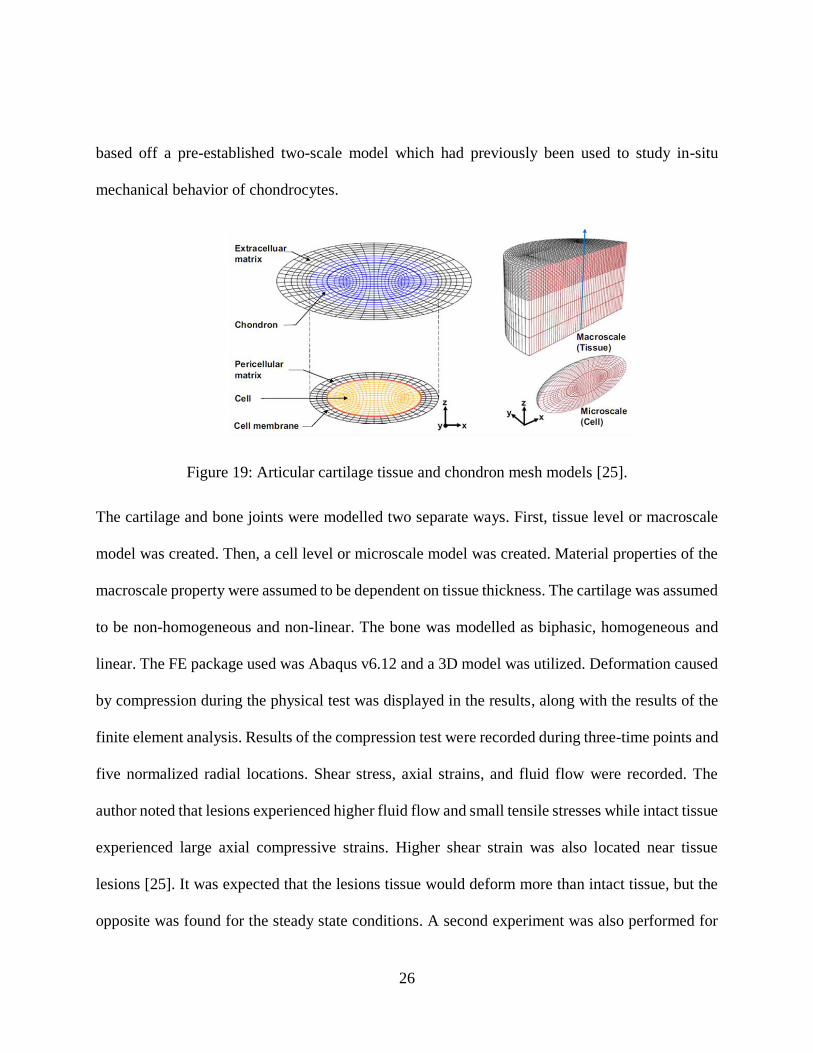
Figure 19: Articular cartilage tissue and chondron mesh models [25].
The cartilage and bone joints were modelled two separate ways. First, tissue level or macroscale
model was created. Then, a cell level or microscale model was created. Material properties of the
macroscale property were assumed to be dependent on tissue thickness. The cartilage was assumed
to be non-homogeneous and non-linear. The bone was modelled as biphasic, homogeneous and
linear. The FE package used was Abaqus v6.12 and a 3D model was utilized. Deformation caused
by compression during the physical test was displayed in the results, along with the results of the
finite element analysis. Results of the compression test were recorded during three-time points and
five normalized radial locations. Shear stress, axial strains, and fluid flow were recorded. The
author noted that lesions experienced higher fluid flow and small tensile stresses while intact tissue
experienced large axial compressive strains. Higher shear strain was also located near tissue
lesions [25]. It was expected that the lesions tissue would deform more than intact tissue, but the
opposite was found for the steady state conditions. A second experiment was also performed for
27
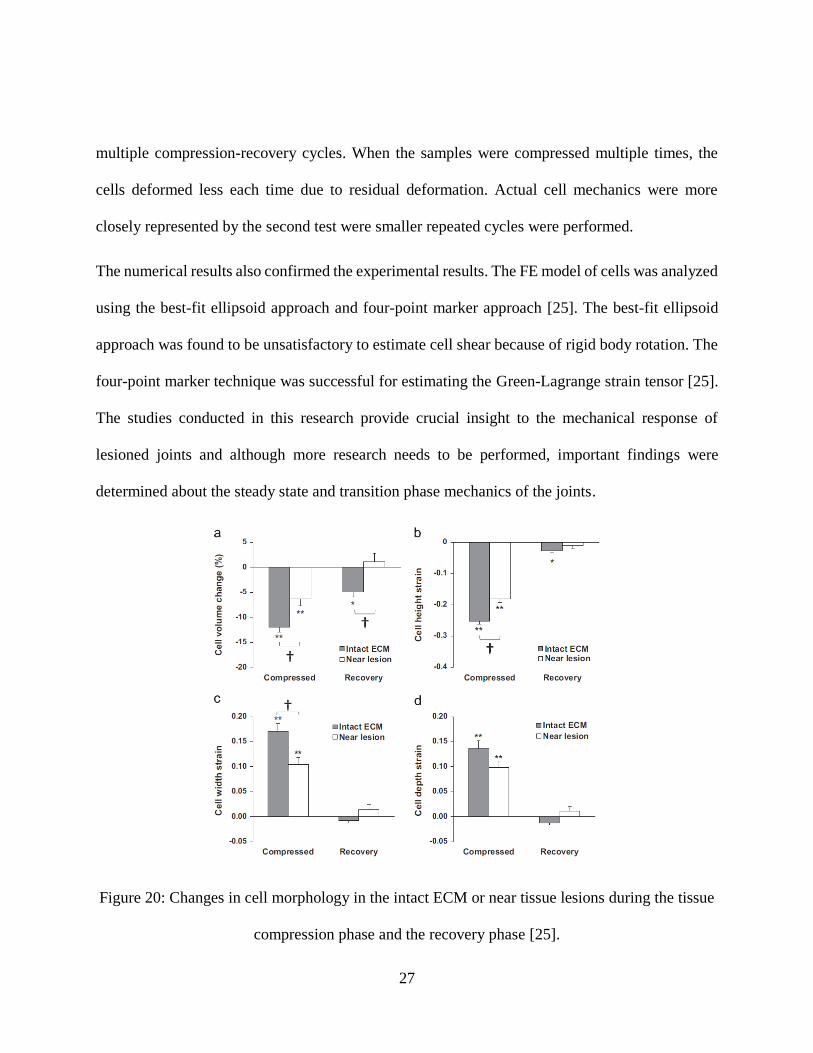
multiple compression-recovery cycles. When the samples were compressed multiple times, the
cells deformed less each time due to residual deformation. Actual cell mechanics were more
closely represented by the second test were smaller repeated cycles were performed.
The numerical results also confirmed the experimental results. The FE model of cells was analyzed
using the best-fit ellipsoid approach and four-point marker approach [25]. The best-fit ellipsoid
approach was found to be unsatisfactory to estimate cell shear because of rigid body rotation. The
four-point marker technique was successful for estimating the Green-Lagrange strain tensor [25].
The studies conducted in this research provide crucial insight to the mechanical response of
lesioned joints and although more research needs to be performed, important findings were
determined about the steady state and transition phase mechanics of the joints.
Figure 20: Changes in cell morphology in the intact ECM or near tissue lesions during the tissue
compression phase and the recovery phase [25].

28
Other devices for in-situ testing of the mechanical properties of materials were developed and the
results of their testing are presented in [26] [27] [28].
Micro Mechanical Testing Devises
In addition to the home made in-situ stages, commercially available micromechanical testing
devices are also available [29] [30] [31]. A brief overview is presented below and are based off
the manufacturer website, specification sheets, and documentation. Also, journal articles or reports
which use these devices are mentioned.
The Kammrath and weiss tensile and compression module (figure 21) [29]. This micro tensile and
compression test device is design for dynamic and static testing for use with scanning electron
microscopes (SEM). This devise can perform cyclic testing and has a load range of 10uN to 5000N.
This in-situ compression devise was used while performing EBSD analyses in Bunker application
note #EBSD-02 [32].
29
Figure 21: The Kammrath and weiss tensile and compression module [29].
Another high quality commercially available compression tester is the MTI instruments SEM
series tensile Tester [30]. This stage is built for LM, SEM, and XRD structural testing. It can be
used for tensile, compression, and cyclic testing. In this design the way the grips clamp the sample
would not work for ceramic samples because of their brittle nature. The manufacturer offers
multiple designs which have load frames with capacities between 450N and 9000N.
30
Figure 22: MTI instruments SEM series tensile Tester [30].
Finally, there is Deben compression & horizontal bending stage available on the market [31].
According to the manufacturer, this system is design for use with SEM, optical microscope, AFM
or XRD system. This stage offers load cells from 2N to 200N and has multiple clamping options
for three-point bending, four-point bending, tensile, and compression.
31
Figure 23: Deben compression & horizontal bending stage [31].
Senior Design Compression Stages
In the past, at least two, University of Central Florida, senior design groups have design or
developed compression stages with an intent to be used for in-situ Raman spectroscopy. The first
Senior Design group successfully completed a working compression stage and performed testing
on ceramic samples (figure 24). Unfortunately, a mechanism on the load crosshead which was
designed to prevent eccentric loading by self-aligning the sample did not properly function and
instead created eccentric loads. Also, to save weight, undersized ball screws were used in the
student’s design. Nevertheless, Senior Design students’ stage had an outstanding design with a
complex assembly which provided multiple lesson learned from their attempt. Lessons learned
included the necessary use of properly sized ball screw, challenges with sample alignment, the
importance of using materials which minimize deflections, and choosing a design which minimizes
machining time. In the new design larger lead screws and ball nuts were used which were rated for
32
the required higher loads. Also, a larger gear reduction was implemented using a two-stage
transmission to increase torque. The original sample alignment fixture was removed, and instead
precise machining was used to ensure the sample under compression is well aligned and a
compressive load was applied centrically. To minimize deflections, the load path is constrained
between the 440C stainless steel crossheads and the ball screw system instead of the aluminum
body.
Figure 24: First compression stage designed produced by UCF senior design team.
The second Senior Design group designed a new compression (figure 25) but was unable to
complete the design due to their project being reassigned after the first semester. This second
design also had some great feature which were included in the latest design presented in this thesis.
These features include a modular aluminum stage frame which allows the stage frame to be
machined out of four components requiring less material removal. It also includes I-beam style
load and support crossheads which increase the moment of inertia, therefore decreasing crosshead
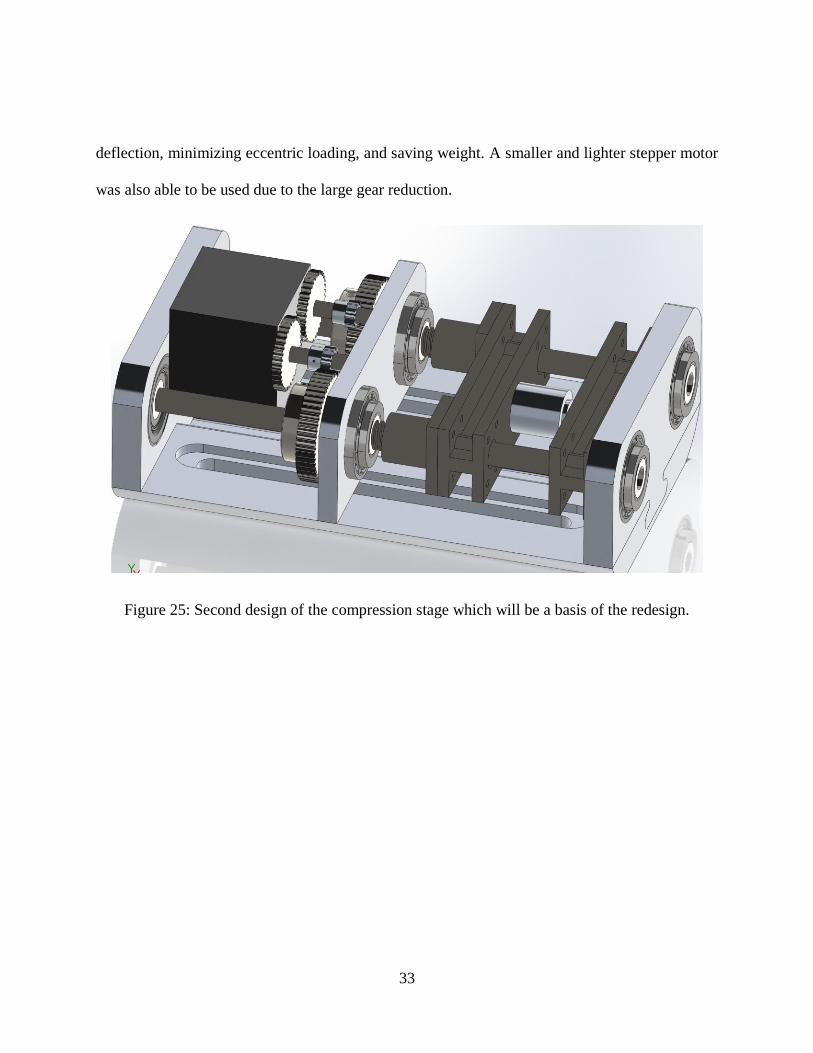
33
deflection, minimizing eccentric loading, and saving weight. A smaller and lighter stepper motor
was also able to be used due to the large gear reduction.
Figure 25: Second design of the compression stage which will be a basis of the redesign.
34
CHAPTER 3: DESIGN
A miniature in-situ compression fixture was designed to be mounted on a Leica optical microscope
and to be used to perform in-situ structural-mechanical testing in conjunction with an InVia micro-
Raman spectrometer. The design and calculations of the compression fixture are displayed in this
section and include: the design criteria, important system analytical calculations, the design in
CAD, finite element analysis, and design of the control system.
Design criteria
The micro compression fixture was designed with the ability to compress cylindrical ceramic
specimen up to 12 mm in length and with a diameter up to 6 mm. The electrical mechanical loading
system was designed to produce a load up to 14137 N in compression. The desired maximum
compressive stress samples with a diameter of 6.00 mm of 500 MPa. It is also important that the
load fixture is rigid, and the load and support platens which contact the specimen being tested must
remain parallel to prevent eccentric loading. In the future, the simple design of the loading fixture
could allow for samples of other geometries such as rectangular samples to be tested. Although
the compression fixture was initially designed for cylindrical samples of 2.00 mm in diameter x
4.00 mm in height and 6.00 mm in diameter x 12.00 mm height, the fixture was designed with the
intent that samples with similar geometries could be tested with minor modification. The use of
samples with different dimensions would require platens that accommodate the cross-sectional
area and they would need to fit within the load and the support fixture.
35
Figure 26: LaCoO3 cylindrical ceramic sample used for testing with a diameter of 6.04mm.
In order to perform mechanical testing and structural characterization, the stage was combined
with a Leica DMLM optical microscope which focuses the light of the Raman InVia spectrometer
via objective lenses of specified magnifications and working distances. Designing the compression
stage to connect to the optical microscope posted its own set of challenges. Challenges included
keeping the compression stage small enough to fit in the microscope stage area, the weight of the
compression stage, and allowing adequate room for the Leica 50x lenses to focus on the samples.

36
Figure 27: Leica DMLM microscope with compression fixture attached and CAD model of
microscope.
In order to use the microscopes stage alignment mounting points, it was necessary to ensure the
weight of the compression stage was minimized to mitigate significant misalignment or damage
to the microscope’s components. Although Leica was unable to provide an exact weight
requirement of their microscope, a representative of the company suggested keeping the load the
microscope encountered under 4.5Kg to avoid damage. Therefore, early in the design process it
37
was determined that the stage needed to be under 4.5 kg or a mechanism which supports the
microscope to reduce the strain induced on the focusing components needed to be developed.
The design was also required to allow the microscope to focus on the sample. Because different
magnification lenses have different diameters, lengths, and working distances these criteria proved
to be challenging. In figure 28 the photograph of different sizes of magnification lenses (Figure
30A-D) and an example of the 50x long working distance lenses fit check in SolidWorks are also
presented (Figure 30F).
Figure 28: Microscope lenses geometries and focusing fitment.
Calculations
Analytical calculations of key system components and subsystems were performed to ensure the
compression fixture could meet design requirements and to provide a better understand of system
kinematics. These calculations included sample loading, ball screw load analysis, torque, gear
reduction, gear spacing, and advancement rate.
38
Sample loading
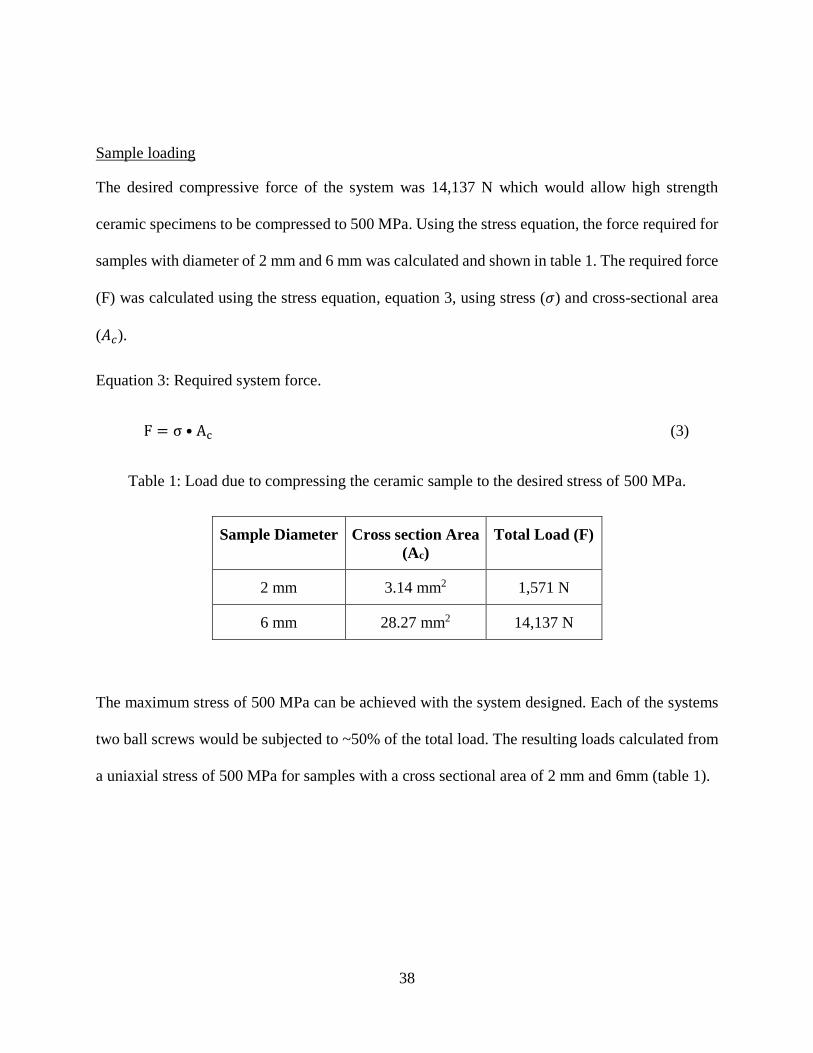
The desired compressive force of the system was 14,137 N which would allow high strength
ceramic specimens to be compressed to 500 MPa. Using the stress equation, the force required for
samples with diameter of 2 mm and 6 mm was calculated and shown in table 1. The required force
(F) was calculated using the stress equation, equation 3, using stress (𝜎) and cross-sectional area
(𝐴𝑐).
Equation 3: Required system force.
F = σ • Ac (3)
Table 1: Load due to compressing the ceramic sample to the desired stress of 500 MPa.
Sample Diameter Cross section Area
(Ac)
Total Load (F)
2 mm 3.14 mm2 1,571 N
6 mm 28.27 mm2 14,137 N
The maximum stress of 500 MPa can be achieved with the system designed. Each of the systems
two ball screws would be subjected to ~50% of the total load. The resulting loads calculated from
a uniaxial stress of 500 MPa for samples with a cross sectional area of 2 mm and 6mm (table 1).
39
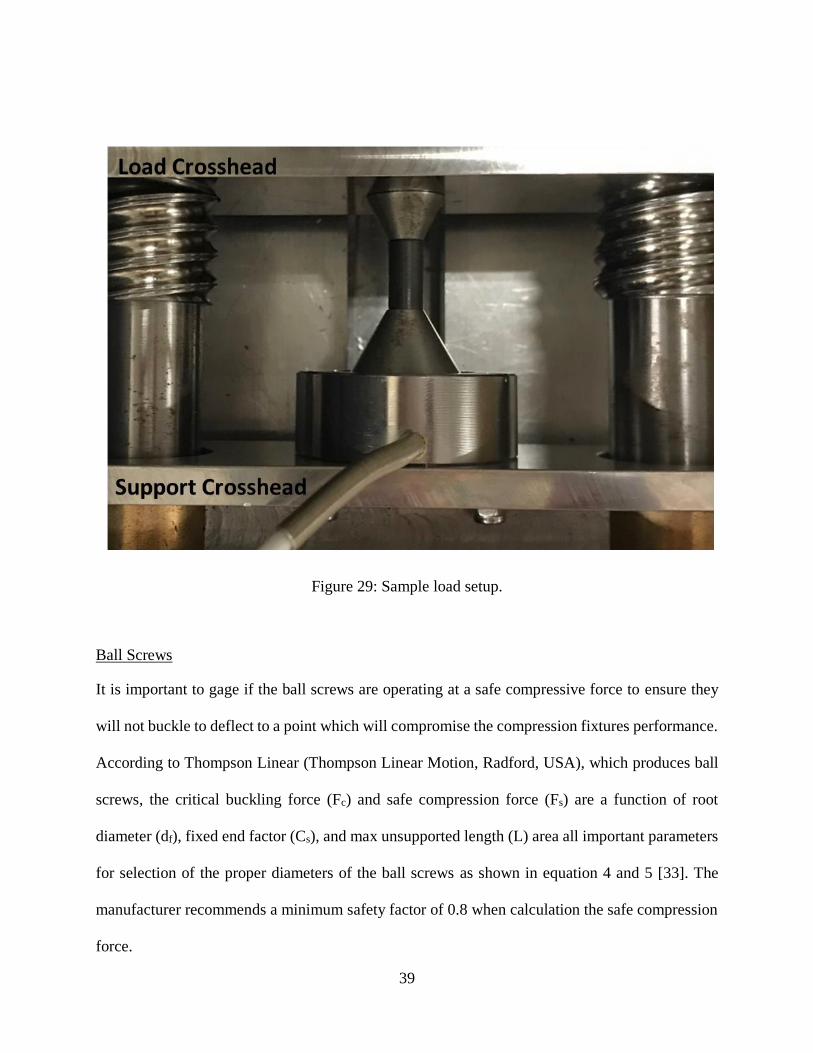
Figure 29: Sample load setup.
Ball Screws
It is important to gage if the ball screws are operating at a safe compressive force to ensure they
will not buckle to deflect to a point which will compromise the compression fixtures performance.
According to Thompson Linear (Thompson Linear Motion, Radford, USA), which produces ball
screws, the critical buckling force (Fc) and safe compression force (Fs) are a function of root
diameter (df), fixed end factor (Cs), and max unsupported length (L) area all important parameters
for selection of the proper diameters of the ball screws as shown in equation 4 and 5 [33]. The
manufacturer recommends a minimum safety factor of 0.8 when calculation the safe compression
force.
40
Equation 4: Critical buckling force.
FC =CS•9.687•10
4•df4
L2 (4)
Equation 5: Safe compression force.
FS = FC • 0.8 (5)
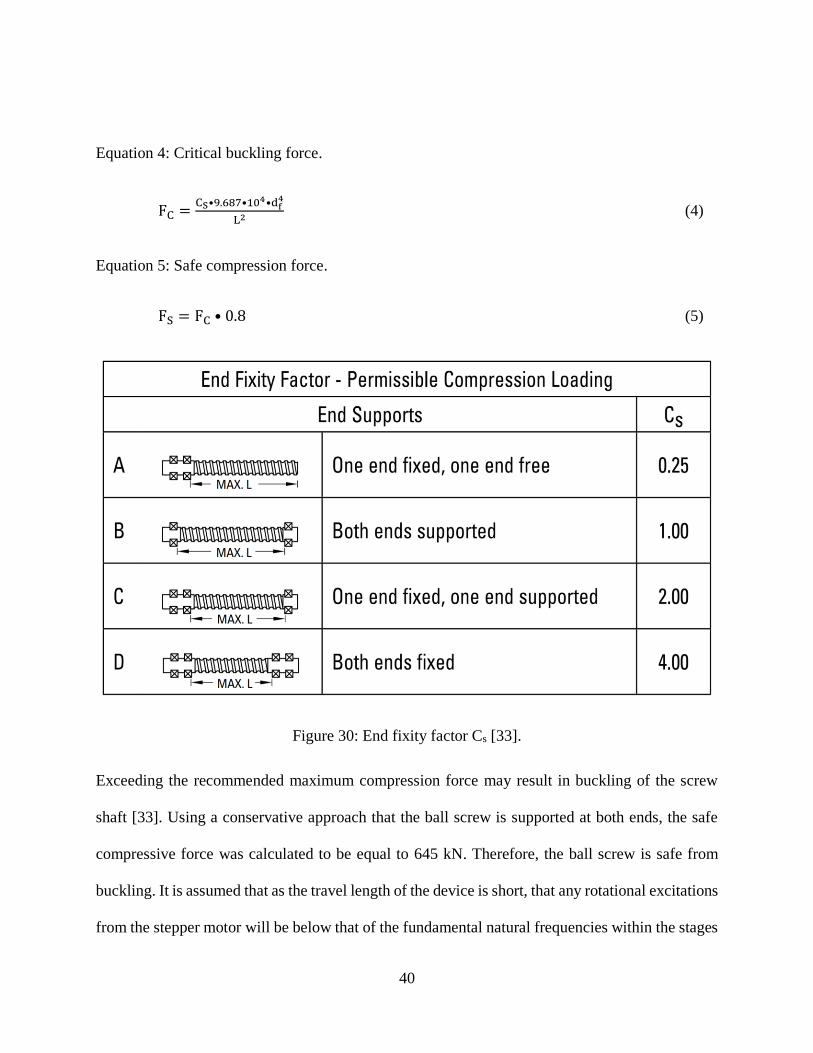
Figure 30: End fixity factor Cs [33].
Exceeding the recommended maximum compression force may result in buckling of the screw
shaft [33]. Using a conservative approach that the ball screw is supported at both ends, the safe
compressive force was calculated to be equal to 645 kN. Therefore, the ball screw is safe from
buckling. It is assumed that as the travel length of the device is short, that any rotational excitations
from the stepper motor will be below that of the fundamental natural frequencies within the stages
41
frame geometry. The critical speed of the ball screw was not taken into consideration. Vibrations
were taken into consideration at all speeds and no large increases in vibration which would elude
to natural frequencies occurring were witnessed.
Torque
The required torque of the stepper motor was calculated to produce a maximum clamping force of
14,137 N. The torque, equation 6, required to produce the required clamping force was calculated
using a simplified equation. The torque is a function of required force (F), lead (P), gear reduction
(R), and efficiency (%eff).
Equation 6: Required torque.
T = .177F • P (6)
The required stepper motor torque was determined to be 2.5 N-m for each lead screw. A single
Stepper motor drives both ball-screws the requiring an input without a gear reduction of
approximately 5 N-m. The Anaheim automation stepper motor model number 24Y304S-LW8
which is used in the system has a maximum bipolar torque output is 2.06 N-m. Therefore, a power
transmission needed to be designed to reduce the required torque of the stepper motor.
Gear Reduction
To correctly size the stepper motor and gear box, the required torque of the gear box was
calculated. The calculation is then used to determine the necessary gear reduction and stepper
motor torque. First the terminology of lead screws and ball nuts must be understood. The lead of
a lead screw or ball screw refers to the linear distance the ball nut will travel per rotation of the
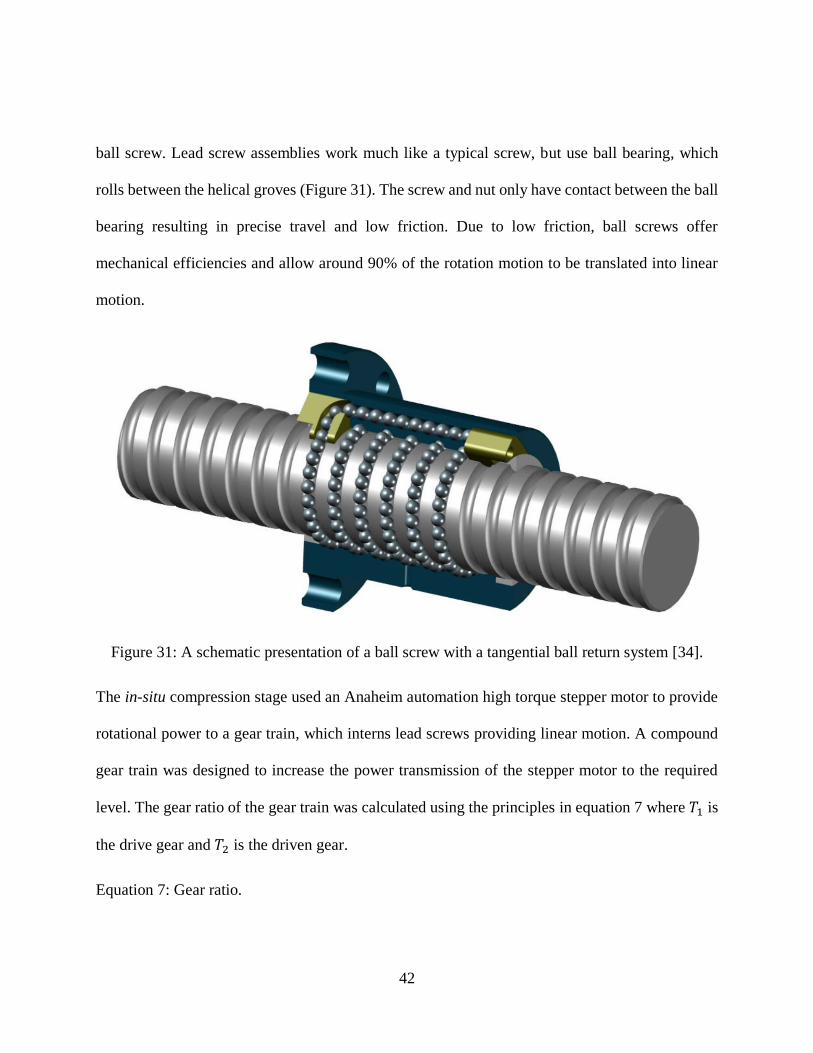
42
ball screw. Lead screw assemblies work much like a typical screw, but use ball bearing, which
rolls between the helical groves (Figure 31). The screw and nut only have contact between the ball
bearing resulting in precise travel and low friction. Due to low friction, ball screws offer
mechanical efficiencies and allow around 90% of the rotation motion to be translated into linear
motion.
Figure 31: A schematic presentation of a ball screw with a tangential ball return system [34].
The in-situ compression stage used an Anaheim automation high torque stepper motor to provide
rotational power to a gear train, which interns lead screws providing linear motion. A compound
gear train was designed to increase the power transmission of the stepper motor to the required
level. The gear ratio of the gear train was calculated using the principles in equation 7 where 𝑇1 is
the drive gear and 𝑇2 is the driven gear.
Equation 7: Gear ratio.
43
𝑅𝑖𝑗 =Tj
Ti (7)
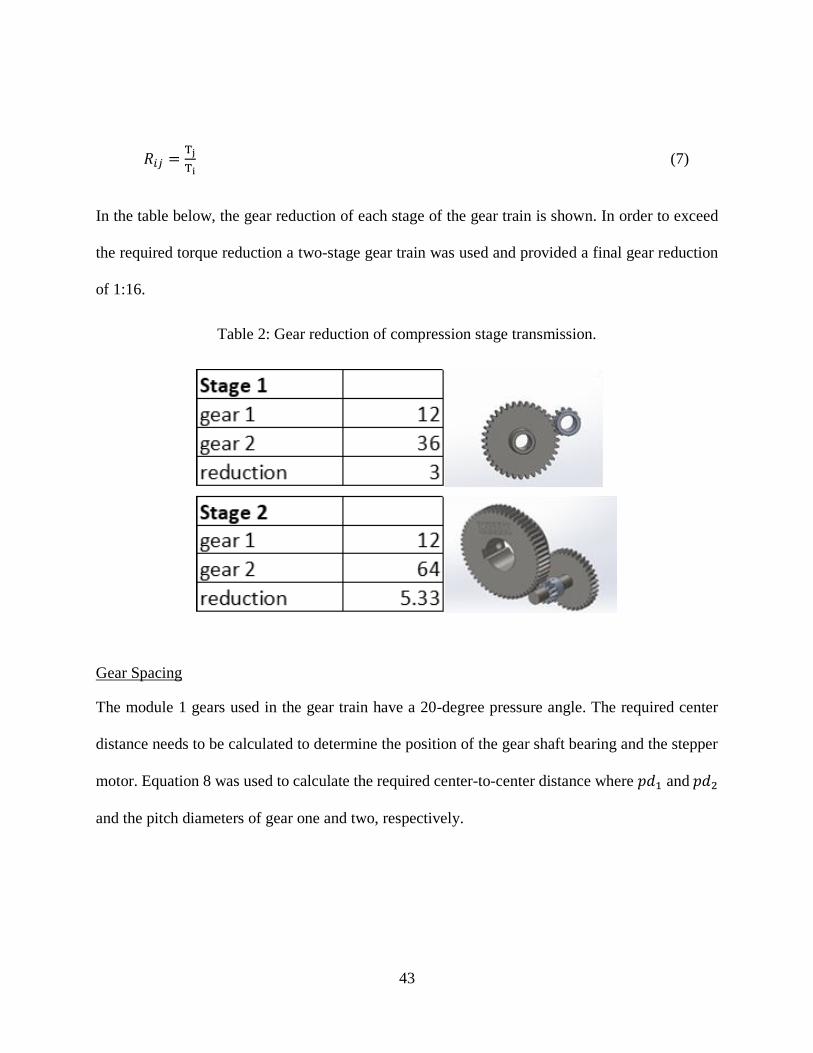
In the table below, the gear reduction of each stage of the gear train is shown. In order to exceed
the required torque reduction a two-stage gear train was used and provided a final gear reduction
of 1:16.
Table 2: Gear reduction of compression stage transmission.
Gear Spacing
The module 1 gears used in the gear train have a 20-degree pressure angle. The required center
distance needs to be calculated to determine the position of the gear shaft bearing and the stepper
motor. Equation 8 was used to calculate the required center-to-center distance where 𝑝𝑑1 and 𝑝𝑑2
and the pitch diameters of gear one and two, respectively.
44
Equation 8: Center-to-center distance.
a =pd1+pd2
2 (8)
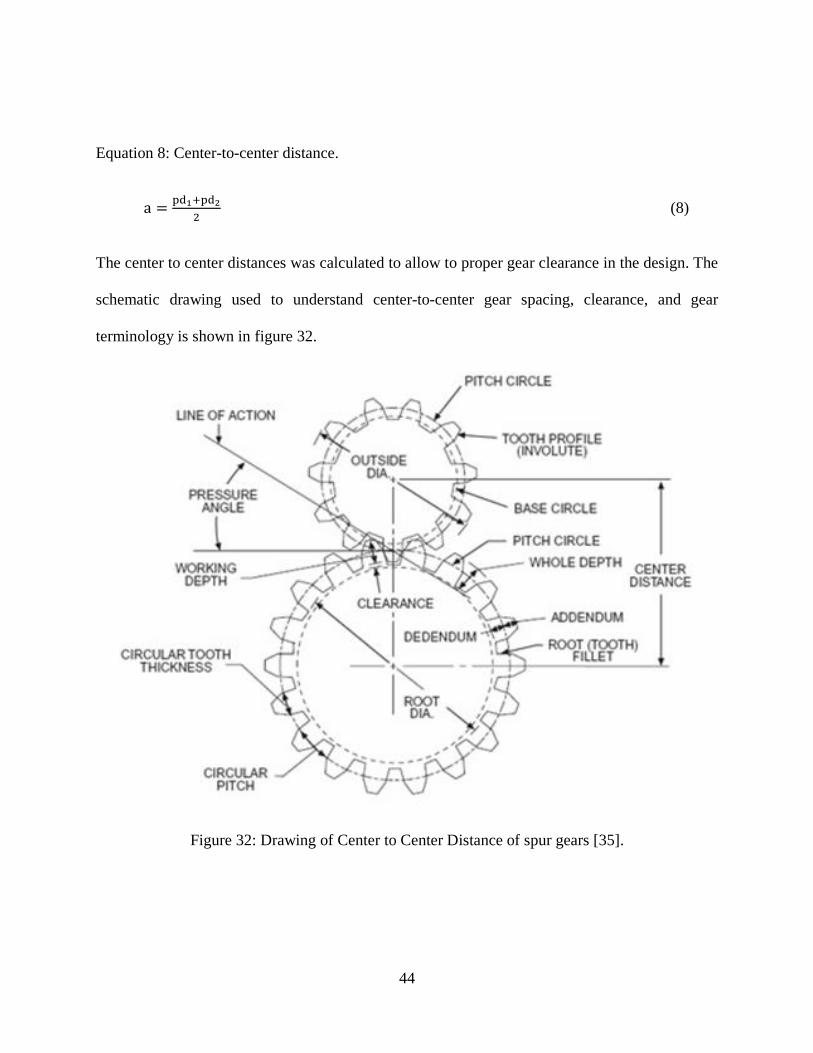
The center to center distances was calculated to allow to proper gear clearance in the design. The
schematic drawing used to understand center-to-center gear spacing, clearance, and gear
terminology is shown in figure 32.
Figure 32: Drawing of Center to Center Distance of spur gears [35].
45
The required center distance between gears one and two is 24 mm. Likewise, the required center
to center distance between gears three and four is 33.5mm. The calculations were performed using
the manufacturer’s specified pitch diameter.
Load Rate
Understanding the advancement rate of the load crosshead versus the rotation of stepper motor is
important to determine the correct rotation rate of stepper motor to achieve a desired load rate
during testing. The ball screws used, have a lead (p) of 10mm. Therefore, for every rotation of the
ball screw, the ball nut and crosshead attached advance 10mm. Due to the 16:1 gear reduction (R),
the ball screws advance 0.625mm per rotation of the stepper motor. This advancement rate can be
controlled by adjusting the frequency of the step clock input (f) which will be explained in greater
detail in the system control section. For most loading conditions, a micro-step resolution of 50,000
steps per revolution will be selected. Therefore, for every 50,000 step clock inputs, the motor will
complete one revolution. The crosshead speed or load rate (�̇�), mm per minute, for different step
clock inputs can be calculated using equation 9.
Equation 9: Crosshead speed.
�̇� = 0.00075 • 𝑓 (9)
Using the crosshead speed, the strain rate of an experiment can be calculated by dividing the
crosshead speed by the gauge length of the specimen. This information could be critical if it is
desired to test samples at a specified load or strain rate.
46
CAD Design
An initial complete redesign of the compression stage was performed in SolidWorks. An in-depth
design process was started by studying “Lesson learned” from past designs. This included
misalignment issues, deflection of the components and their selection. This knowledge was
leveraged when designing components such as the aluminum stage, crossheads, transmission, and
ball screws in SolidWorks. Commercially available components were also modeled whenever the
CAD files were unavailable. This allowed the complete compression stage to be designed and
modeled insuring component fitment during assembly.
One challenging aspect of the design was incorporating components which had already been
purchased by the second senior design team even though their design was not finalized. Items
which were already purchased included the ball screw material stock, ball nuts, the stepper motor,
transmission gears, and transmission shaft material. To add to this challenge, several of the
components available were improperly labelled in the material order documentation, were the
incorrect size, or not used in the CAD model. For example, the gears purchased for the
compression stage had a journal diameter of 25 mm and the recommended ball screw machined
diameter was 20 mm. This lack of design documentation and insight made improving the original
design almost as hard as starting from a fresh slate.
A design review was performed including other engineering students and machinists at the UCF
machine shop. This collaboration with experienced machinists helped streamline the design and
manufacturing process. Also, reduced machine time and cost were additional benefits of directly
working with the machinist at the UCF CECS machine shop.
47
The following major changes were performed.
1. Constraining the lead screws using ¾-10 and ½-13 fasteners.
2. Adding fasteners to required locations.
3. Developing a way to constrain the stepper motor.
4. Eliminating the curves on the stage plates to allow a standard key cutter to be using during
machining.
5. Including platen which would compress the sample.
6. Changing thickness of the stage plates to match bearing thicknesses.
7. Eliminating the complex curves on the sample support stage.
8. Adding bushings for the transmission shafts and load crosshead to reduce wear and friction.
9. Reconfiguring the gear system to reduce the footprint.
10. Changing the geometry of the load crosshead to allow for the ballnuts to be mounted.
11. Commercially available parts without models were re-drawn to improve model quality.
The differences between the initial senior design and the final design which was produced are
clearly displayed in figure 33. As listed above, fasteners were added to constrain the components
and parts of the compression stage. The stepper motor was moved to allow it to be bolted to the
aluminum plate instead of floating unconstrained. The motor plate and midplate were also
redesigned including an upper area for the transmission shafts and associated bushing to be
mounted. Ball screw journal diameters were adjusted to the appropriate manufacture
recommended journal diameter and spherical ball bearing were used. The stage was simplified to
allow ease of manufacturing and reduce machining time. Also, components such as the load cell
and platens were added to allow the microscope lenses to reach the required working distance.
48
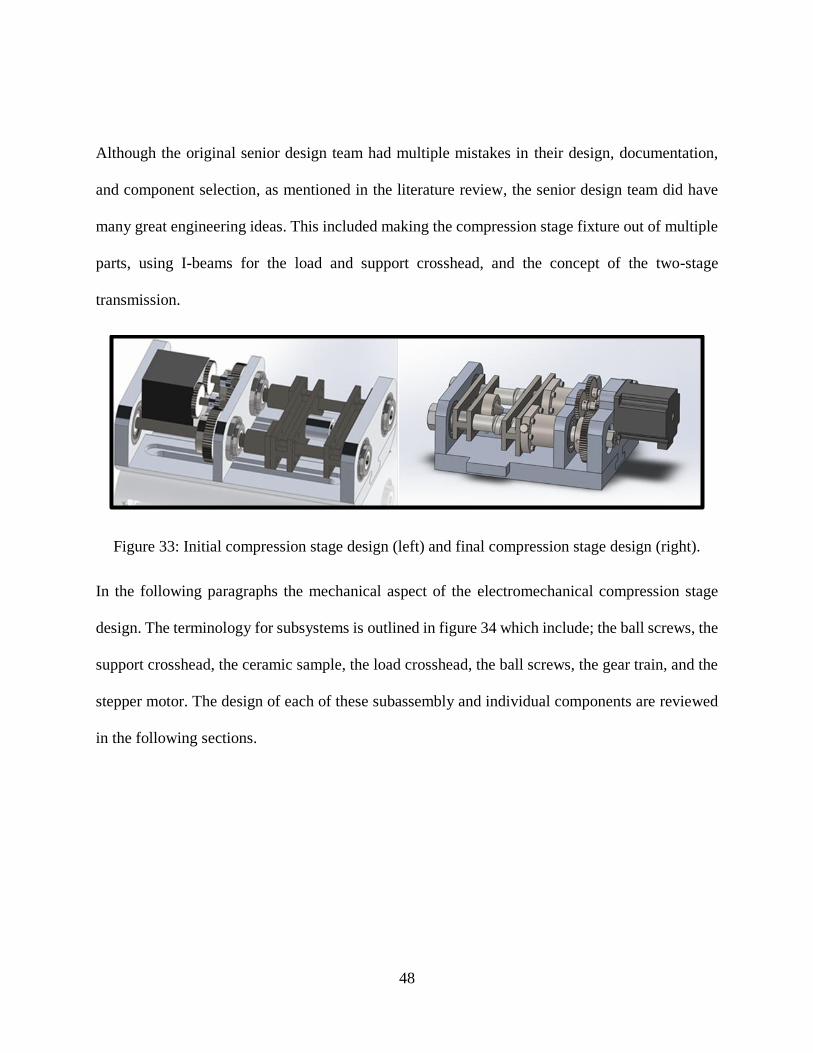
Although the original senior design team had multiple mistakes in their design, documentation,
and component selection, as mentioned in the literature review, the senior design team did have
many great engineering ideas. This included making the compression stage fixture out of multiple
parts, using I-beams for the load and support crosshead, and the concept of the two-stage
transmission.
Figure 33: Initial compression stage design (left) and final compression stage design (right).
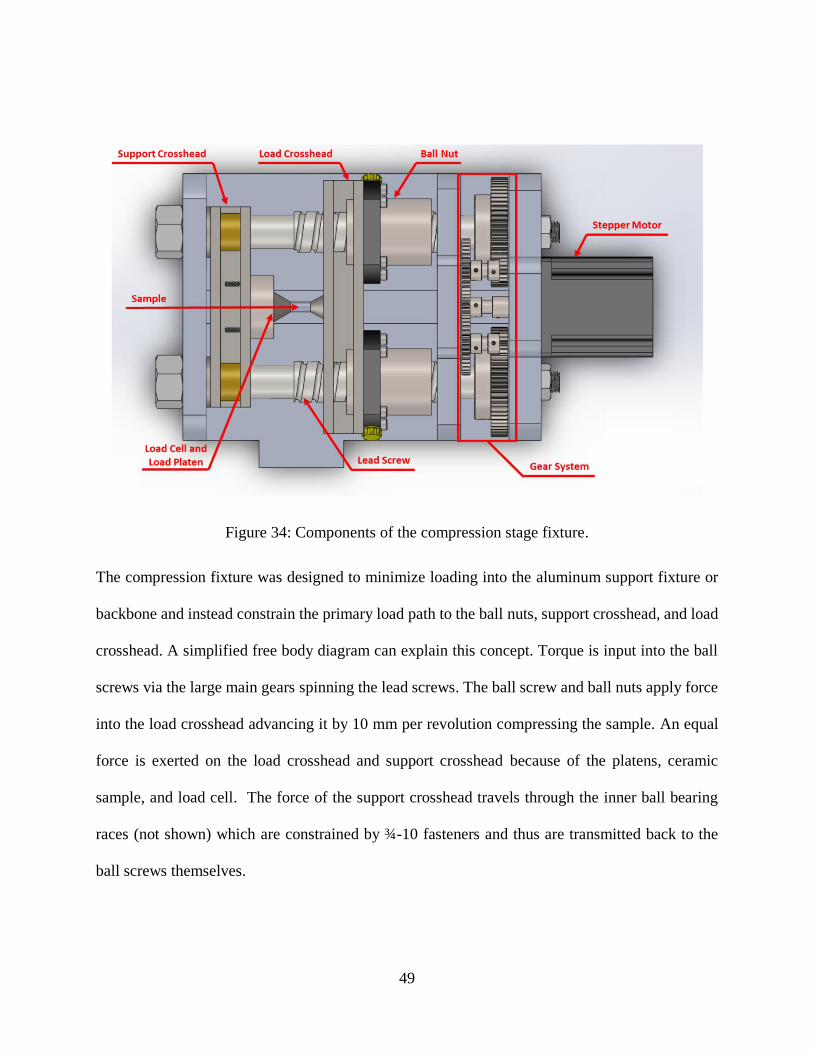
In the following paragraphs the mechanical aspect of the electromechanical compression stage
design. The terminology for subsystems is outlined in figure 34 which include; the ball screws, the
support crosshead, the ceramic sample, the load crosshead, the ball screws, the gear train, and the
stepper motor. The design of each of these subassembly and individual components are reviewed
in the following sections.
49
Figure 34: Components of the compression stage fixture.
The compression fixture was designed to minimize loading into the aluminum support fixture or
backbone and instead constrain the primary load path to the ball nuts, support crosshead, and load
crosshead. A simplified free body diagram can explain this concept. Torque is input into the ball
screws via the large main gears spinning the lead screws. The ball screw and ball nuts apply force
into the load crosshead advancing it by 10 mm per revolution compressing the sample. An equal
force is exerted on the load crosshead and support crosshead because of the platens, ceramic
sample, and load cell. The force of the support crosshead travels through the inner ball bearing
races (not shown) which are constrained by ¾-10 fasteners and thus are transmitted back to the
ball screws themselves.
50
Figure 35: Compression fixture load system: Ball screws, load crosshead, support crosshead,
gears, and stepper motor.
Thompson 25mm Ball Screw and 25mm Ball Nut part numbers 7832786-P5 and 7832787 are used
to drive the load crosshead and compress the sample. The ball screw bearing journal diameter was
51
machined to 20 mm as recommended by the manufacturer. The 20 mm journal diameter was
machined so that the ball nut would fit into all three bearing supports yet allowed the ball nut to
advance all the way without hitting the end of the threads therefore eliminating the opportunity for
the ball nut to run off the threaded portion. To ensure that the ball screw each side is secured a bolt
which are a ¾-10 thread and ½-13 thread were used. The motor size fastener used in the design
was ½-13 because of stepper motor clearance and because it is not in the load path of the
compression crossheads.
Figure 36: A photo of Thompson linear ball screw and ball nut, along with SolidWorks model of
a ball screw [33].
The support-crosshead assembly includes a custom I-beam machined at the University of Central
Florida Machine shop of 440C grade stainless steel (figure 37). Support crosshead is aligned on
the ball screws using two bronze sleeve gears McMaster-Carr part number 6658k44. Also, an
Omega LCGB-10K load cell is used to measure the compressive force of the system.
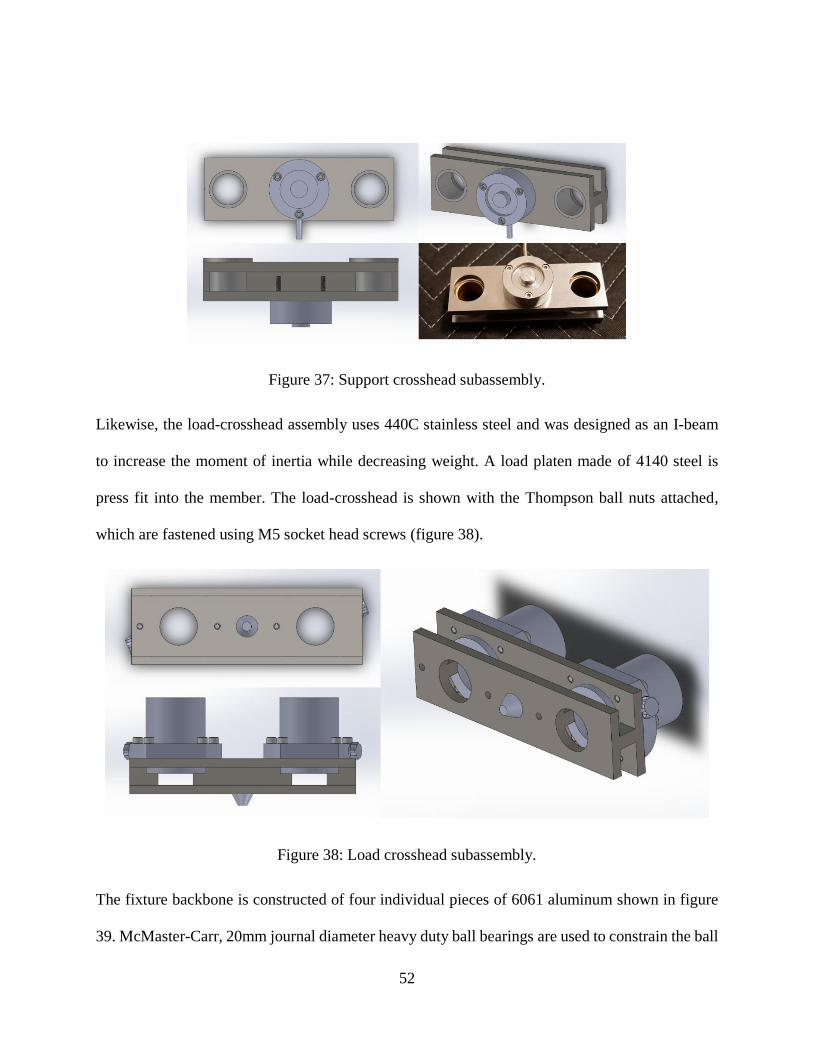
52
Figure 37: Support crosshead subassembly.
Likewise, the load-crosshead assembly uses 440C stainless steel and was designed as an I-beam
to increase the moment of inertia while decreasing weight. A load platen made of 4140 steel is
press fit into the member. The load-crosshead is shown with the Thompson ball nuts attached,
which are fastened using M5 socket head screws (figure 38).
Figure 38: Load crosshead subassembly.
The fixture backbone is constructed of four individual pieces of 6061 aluminum shown in figure
39. McMaster-Carr, 20mm journal diameter heavy duty ball bearings are used to constrain the ball
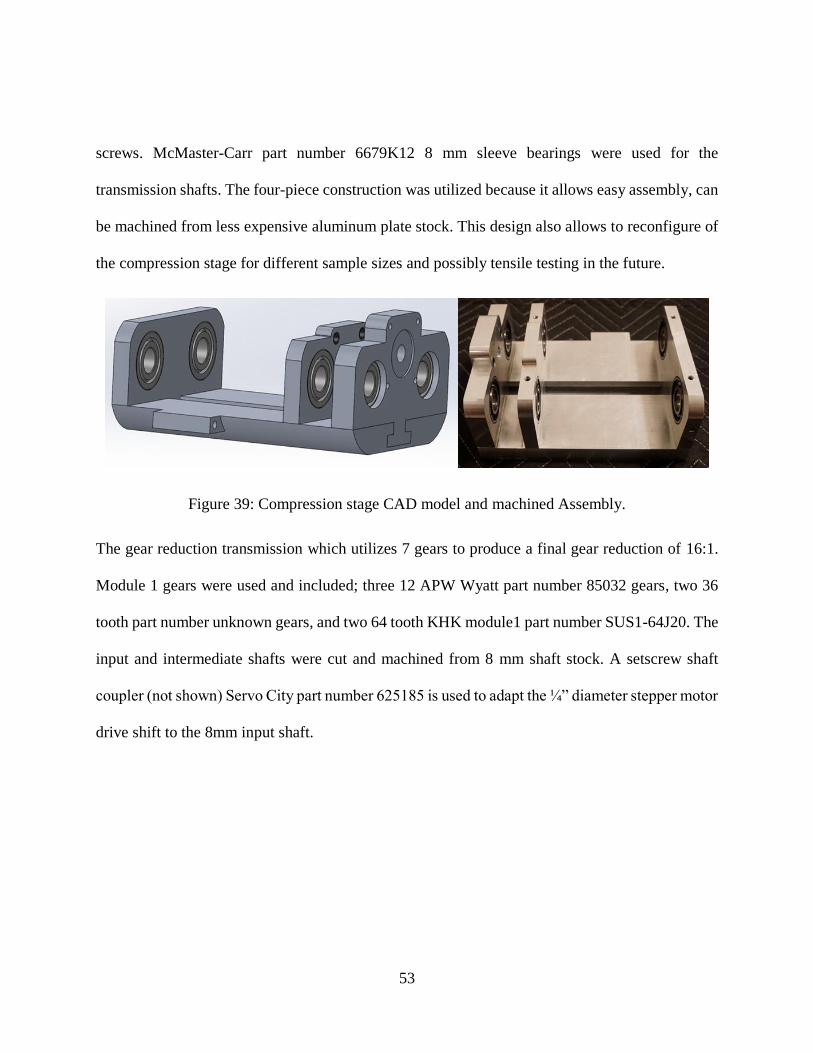
53
screws. McMaster-Carr part number 6679K12 8 mm sleeve bearings were used for the
transmission shafts. The four-piece construction was utilized because it allows easy assembly, can
be machined from less expensive aluminum plate stock. This design also allows to reconfigure of
the compression stage for different sample sizes and possibly tensile testing in the future.
Figure 39: Compression stage CAD model and machined Assembly.
The gear reduction transmission which utilizes 7 gears to produce a final gear reduction of 16:1.
Module 1 gears were used and included; three 12 APW Wyatt part number 85032 gears, two 36
tooth part number unknown gears, and two 64 tooth KHK module1 part number SUS1-64J20. The
input and intermediate shafts were cut and machined from 8 mm shaft stock. A setscrew shaft
coupler (not shown) Servo City part number 625185 is used to adapt the ¼” diameter stepper motor
drive shift to the 8mm input shaft.
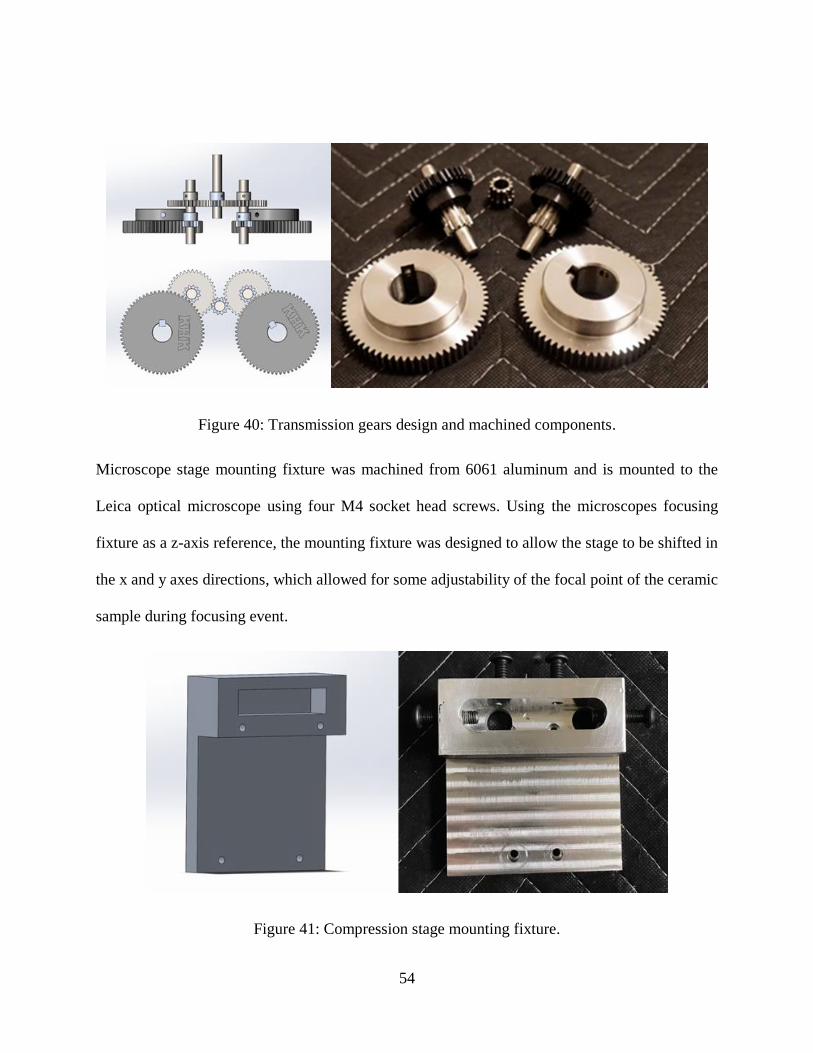
54
Figure 40: Transmission gears design and machined components.
Microscope stage mounting fixture was machined from 6061 aluminum and is mounted to the
Leica optical microscope using four M4 socket head screws. Using the microscopes focusing
fixture as a z-axis reference, the mounting fixture was designed to allow the stage to be shifted in
the x and y axes directions, which allowed for some adjustability of the focal point of the ceramic
sample during focusing event.
Figure 41: Compression stage mounting fixture.
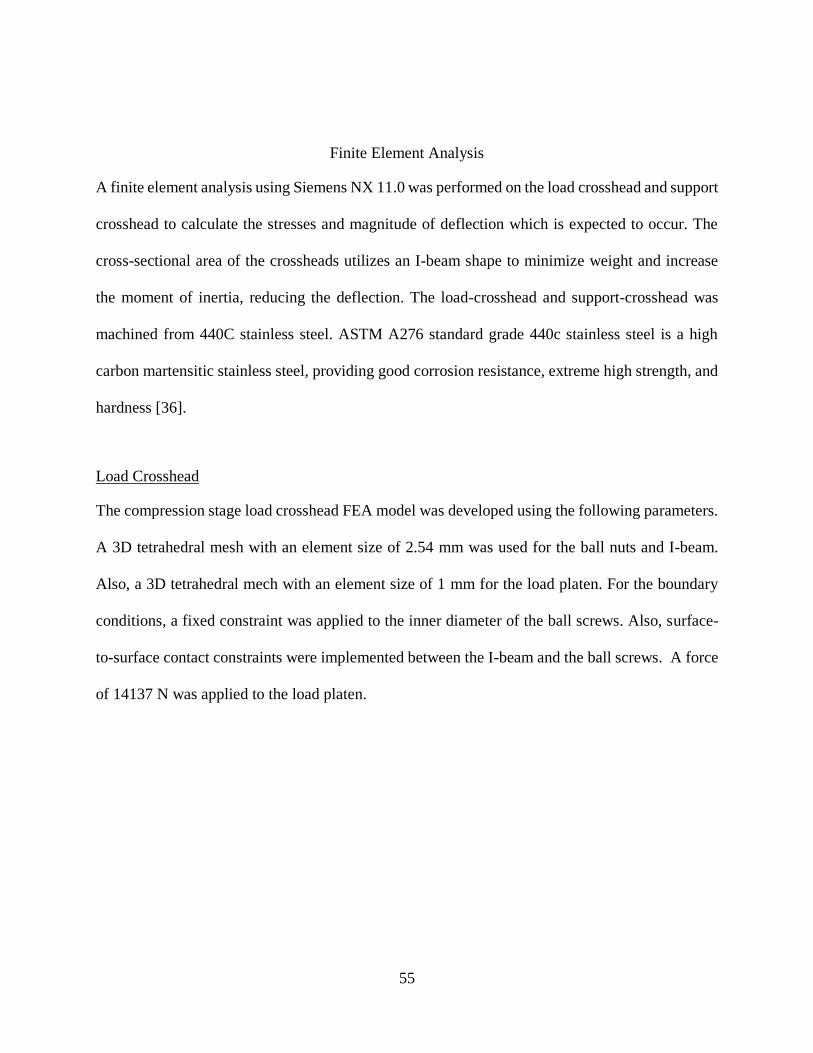
55
Finite Element Analysis
A finite element analysis using Siemens NX 11.0 was performed on the load crosshead and support
crosshead to calculate the stresses and magnitude of deflection which is expected to occur. The
cross-sectional area of the crossheads utilizes an I-beam shape to minimize weight and increase
the moment of inertia, reducing the deflection. The load-crosshead and support-crosshead was
machined from 440C stainless steel. ASTM A276 standard grade 440c stainless steel is a high
carbon martensitic stainless steel, providing good corrosion resistance, extreme high strength, and
hardness [36].
Load Crosshead
The compression stage load crosshead FEA model was developed using the following parameters.
A 3D tetrahedral mesh with an element size of 2.54 mm was used for the ball nuts and I-beam.
Also, a 3D tetrahedral mech with an element size of 1 mm for the load platen. For the boundary
conditions, a fixed constraint was applied to the inner diameter of the ball screws. Also, surface-
to-surface contact constraints were implemented between the I-beam and the ball screws. A force
of 14137 N was applied to the load platen.
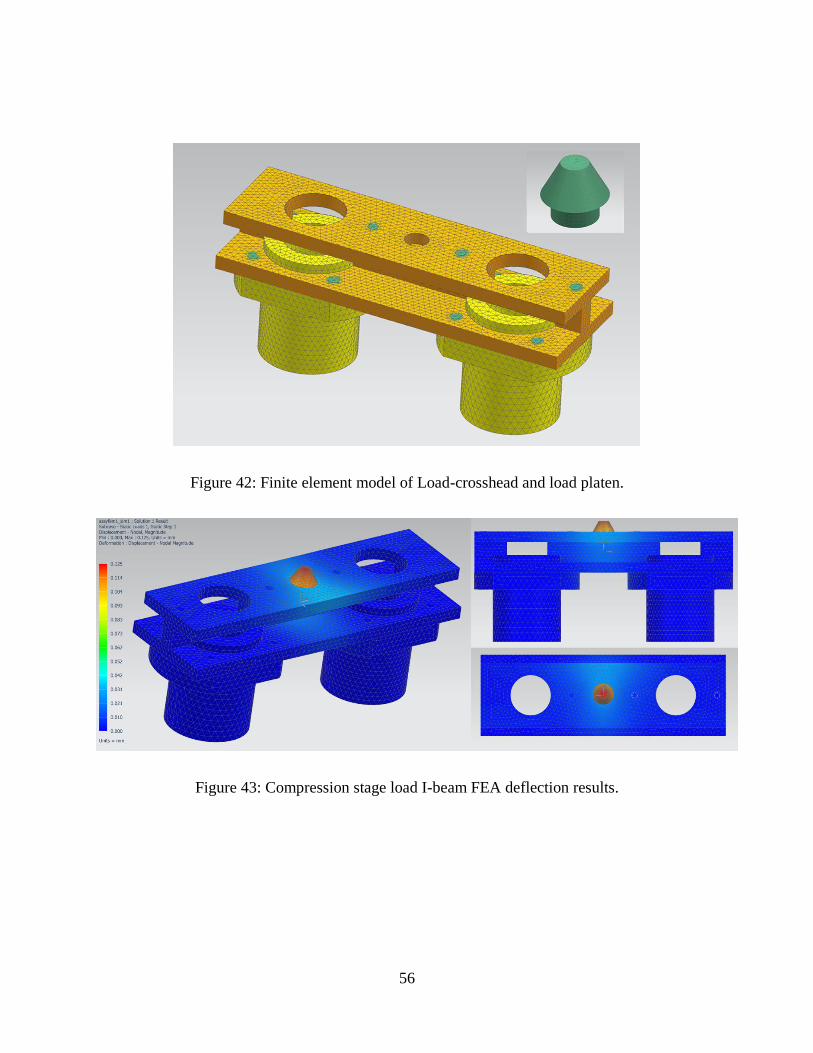
56
Figure 42: Finite element model of Load-crosshead and load platen.
Figure 43: Compression stage load I-beam FEA deflection results.
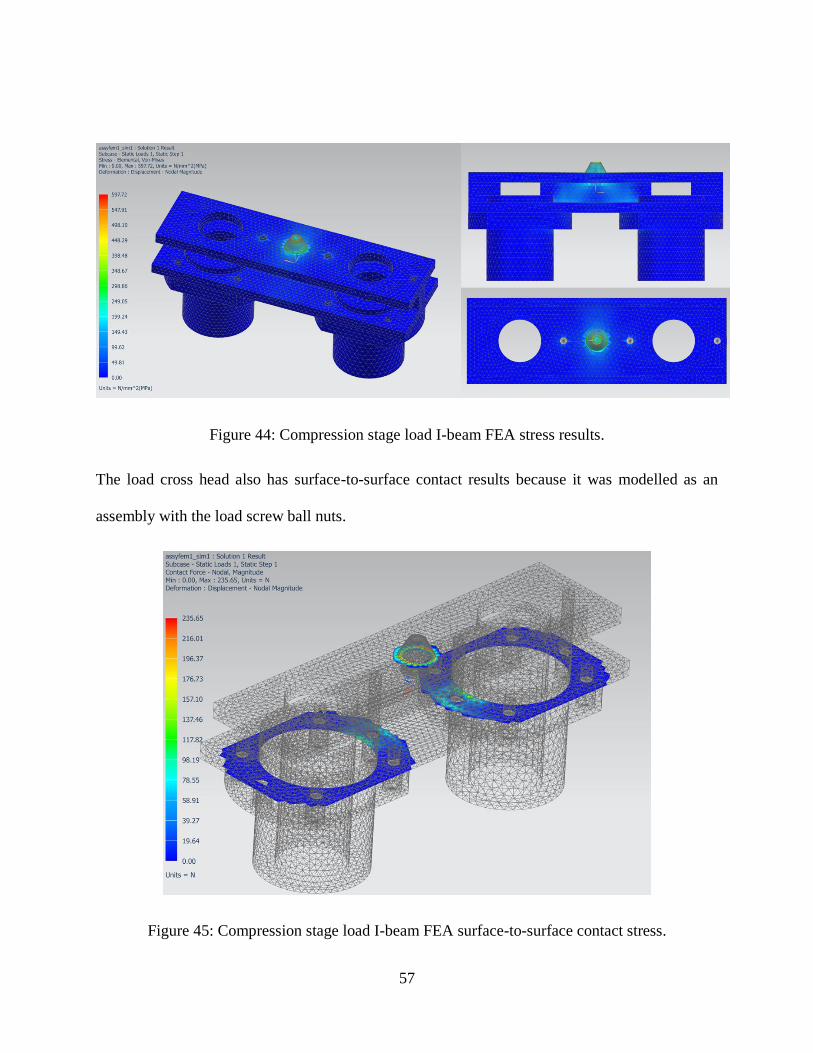
57
Figure 44: Compression stage load I-beam FEA stress results.
The load cross head also has surface-to-surface contact results because it was modelled as an
assembly with the load screw ball nuts.
Figure 45: Compression stage load I-beam FEA surface-to-surface contact stress.
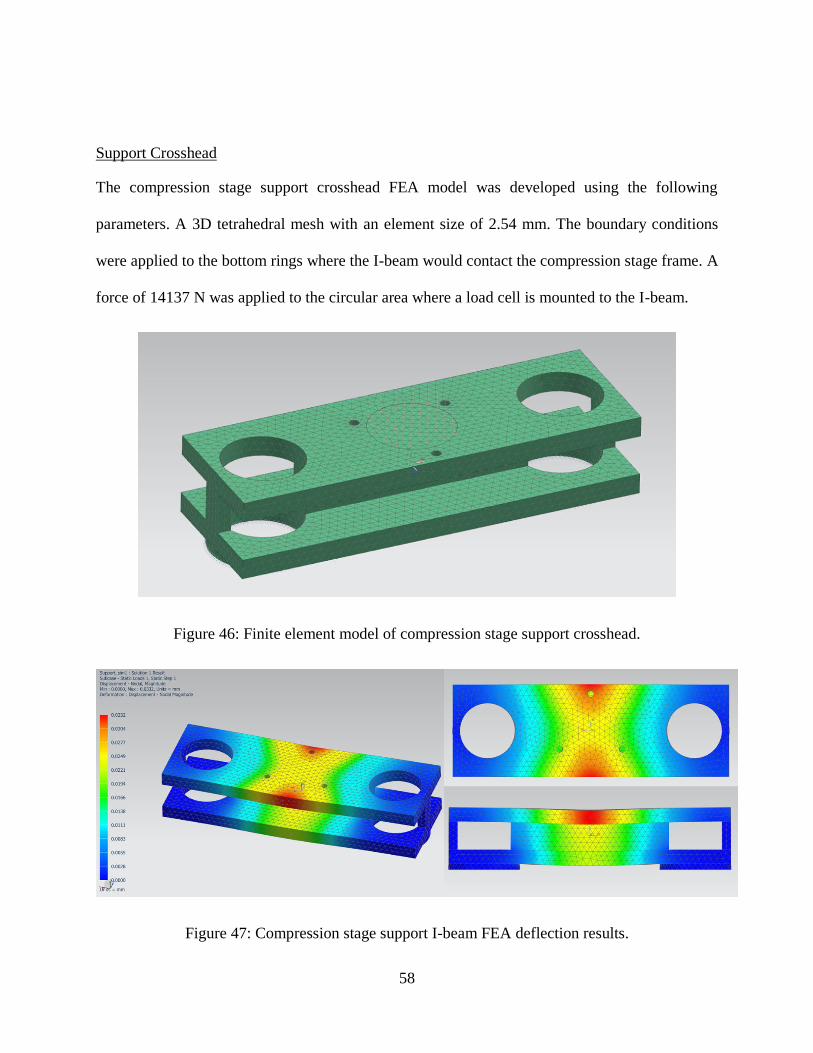
58
Support Crosshead
The compression stage support crosshead FEA model was developed using the following
parameters. A 3D tetrahedral mesh with an element size of 2.54 mm. The boundary conditions
were applied to the bottom rings where the I-beam would contact the compression stage frame. A
force of 14137 N was applied to the circular area where a load cell is mounted to the I-beam.
Figure 46: Finite element model of compression stage support crosshead.
Figure 47: Compression stage support I-beam FEA deflection results.
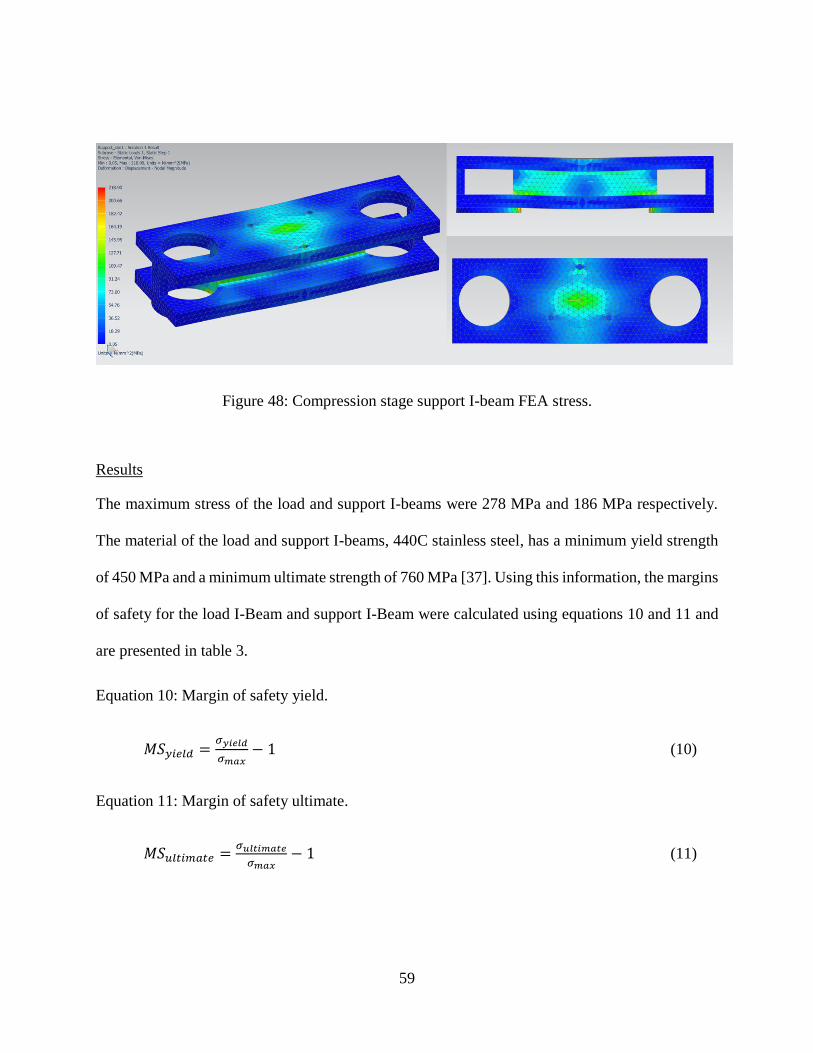
59
Figure 48: Compression stage support I-beam FEA stress.
Results
The maximum stress of the load and support I-beams were 278 MPa and 186 MPa respectively.
The material of the load and support I-beams, 440C stainless steel, has a minimum yield strength
of 450 MPa and a minimum ultimate strength of 760 MPa [37]. Using this information, the margins
of safety for the load I-Beam and support I-Beam were calculated using equations 10 and 11 and
are presented in table 3.
Equation 10: Margin of safety yield.
𝑀𝑆𝑦𝑖𝑒𝑙𝑑 =𝜎𝑦𝑖𝑒𝑙𝑑
𝜎𝑚𝑎𝑥− 1 (10)
Equation 11: Margin of safety ultimate.
𝑀𝑆𝑢𝑙𝑡𝑖𝑚𝑎𝑡𝑒 =𝜎𝑢𝑙𝑡𝑖𝑚𝑎𝑡𝑒
𝜎𝑚𝑎𝑥− 1 (11)
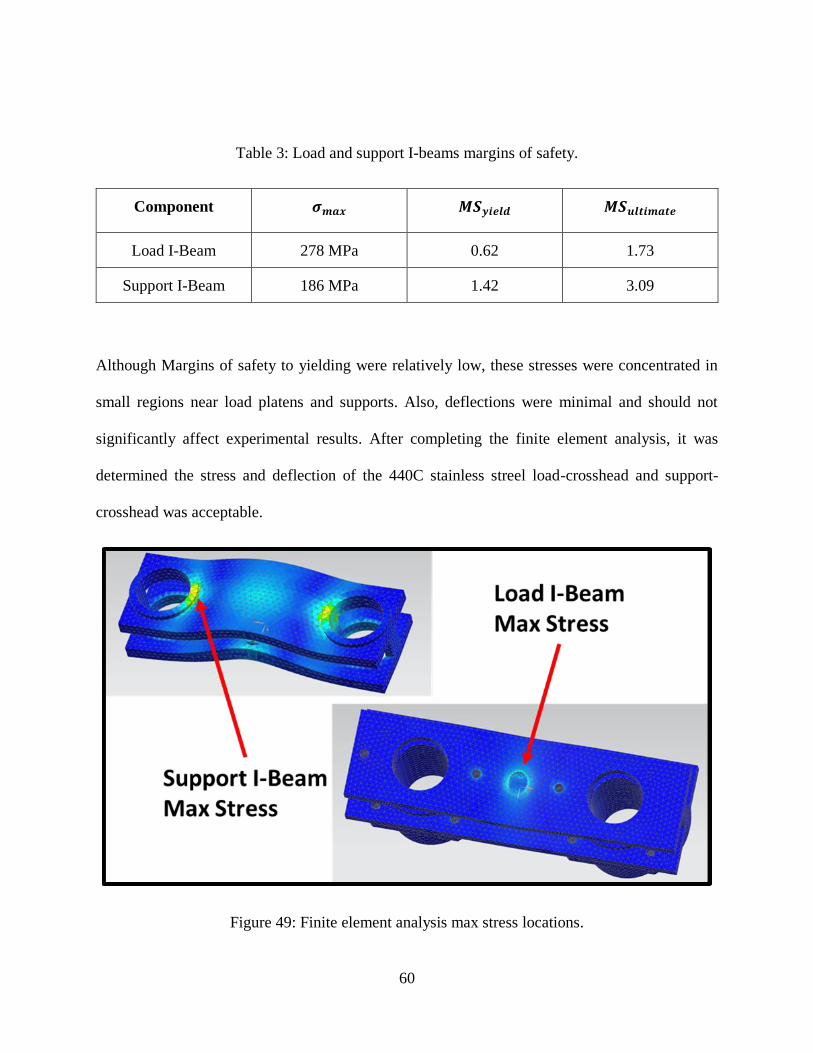
60
Table 3: Load and support I-beams margins of safety.
Component 𝝈𝒎𝒂𝒙 𝑴𝑺𝒚𝒊𝒆𝒍𝒅 𝑴𝑺𝒖𝒍𝒕𝒊𝒎𝒂𝒕𝒆
Load I-Beam 278 MPa 0.62 1.73
Support I-Beam 186 MPa 1.42 3.09
Although Margins of safety to yielding were relatively low, these stresses were concentrated in
small regions near load platens and supports. Also, deflections were minimal and should not
significantly affect experimental results. After completing the finite element analysis, it was
determined the stress and deflection of the 440C stainless streel load-crosshead and support-
crosshead was acceptable.
Figure 49: Finite element analysis max stress locations.
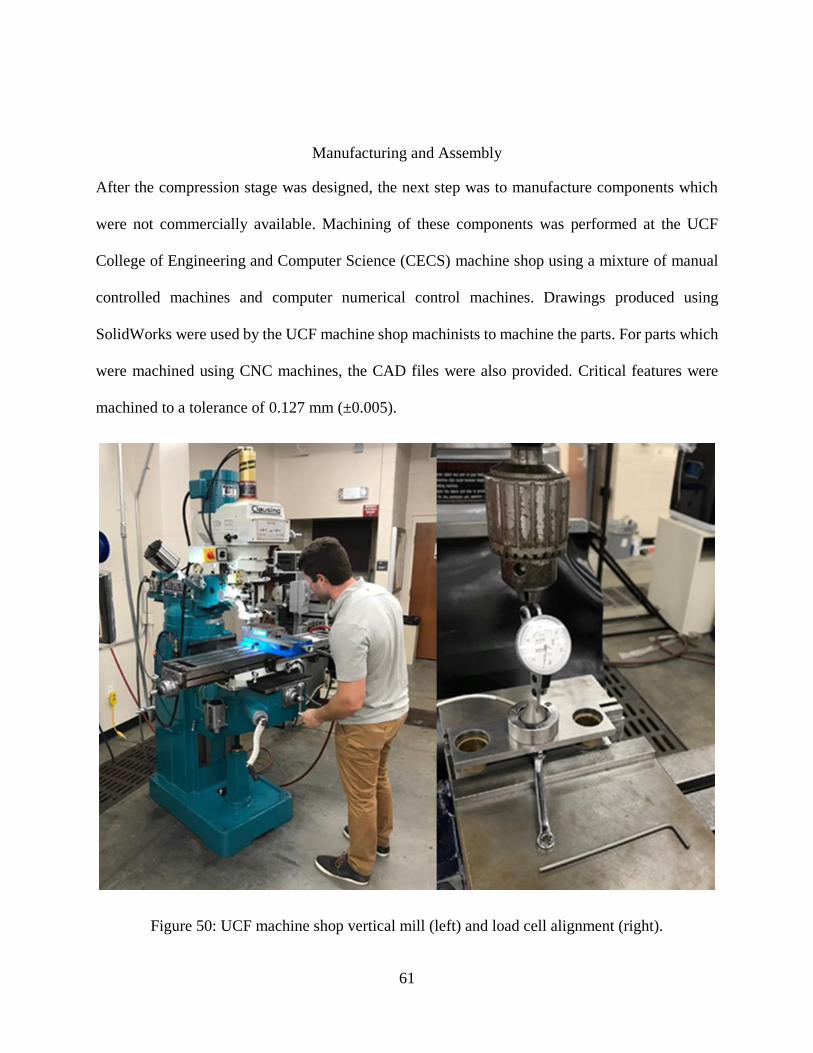
61
Manufacturing and Assembly
After the compression stage was designed, the next step was to manufacture components which
were not commercially available. Machining of these components was performed at the UCF
College of Engineering and Computer Science (CECS) machine shop using a mixture of manual
controlled machines and computer numerical control machines. Drawings produced using
SolidWorks were used by the UCF machine shop machinists to machine the parts. For parts which
were machined using CNC machines, the CAD files were also provided. Critical features were
machined to a tolerance of 0.127 mm (±0.005).
Figure 50: UCF machine shop vertical mill (left) and load cell alignment (right).
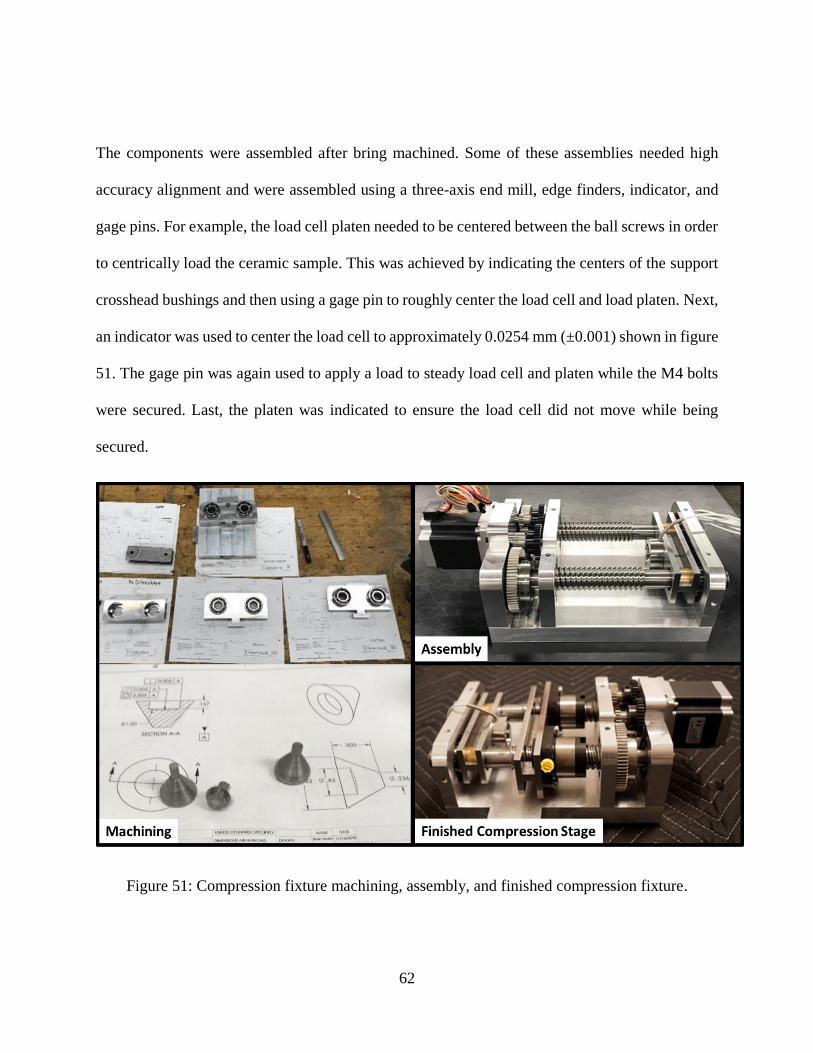
62
The components were assembled after bring machined. Some of these assemblies needed high
accuracy alignment and were assembled using a three-axis end mill, edge finders, indicator, and
gage pins. For example, the load cell platen needed to be centered between the ball screws in order
to centrically load the ceramic sample. This was achieved by indicating the centers of the support
crosshead bushings and then using a gage pin to roughly center the load cell and load platen. Next,
an indicator was used to center the load cell to approximately 0.0254 mm (±0.001) shown in figure
51. The gage pin was again used to apply a load to steady load cell and platen while the M4 bolts
were secured. Last, the platen was indicated to ensure the load cell did not move while being
secured.
Figure 51: Compression fixture machining, assembly, and finished compression fixture.
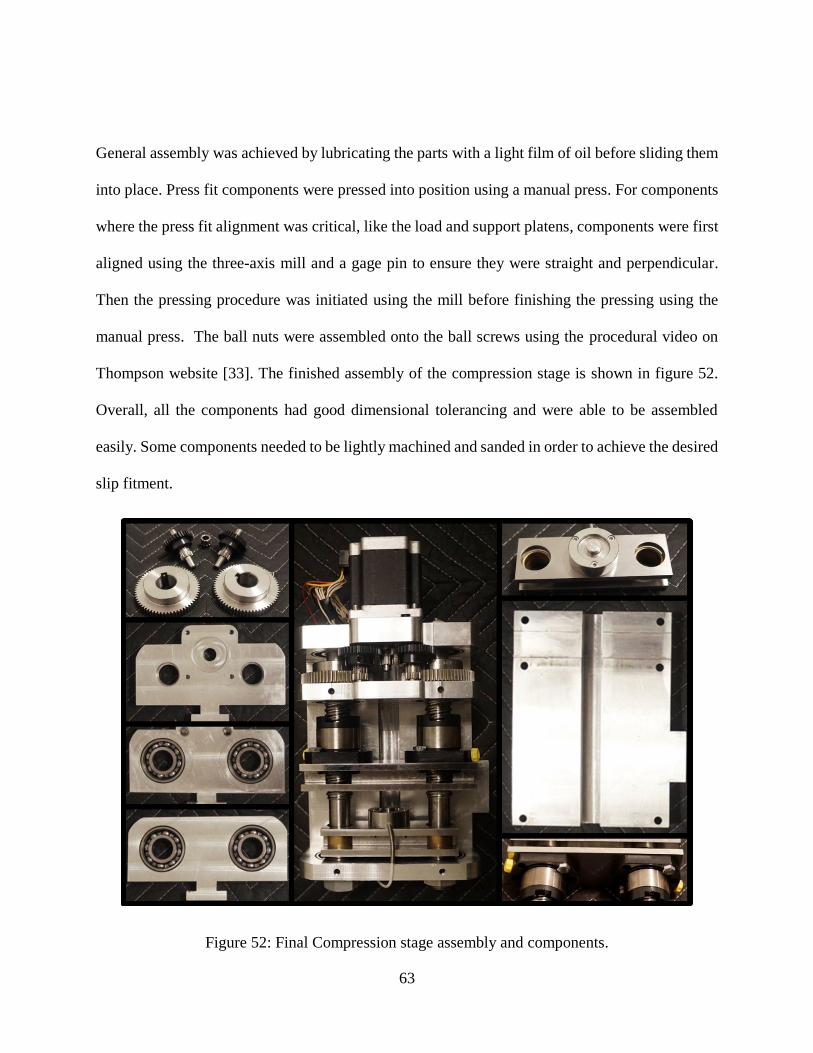
63
General assembly was achieved by lubricating the parts with a light film of oil before sliding them
into place. Press fit components were pressed into position using a manual press. For components
where the press fit alignment was critical, like the load and support platens, components were first
aligned using the three-axis mill and a gage pin to ensure they were straight and perpendicular.
Then the pressing procedure was initiated using the mill before finishing the pressing using the
manual press. The ball nuts were assembled onto the ball screws using the procedural video on
Thompson website [33]. The finished assembly of the compression stage is shown in figure 52.
Overall, all the components had good dimensional tolerancing and were able to be assembled
easily. Some components needed to be lightly machined and sanded in order to achieve the desired
slip fitment.
Figure 52: Final Compression stage assembly and components.
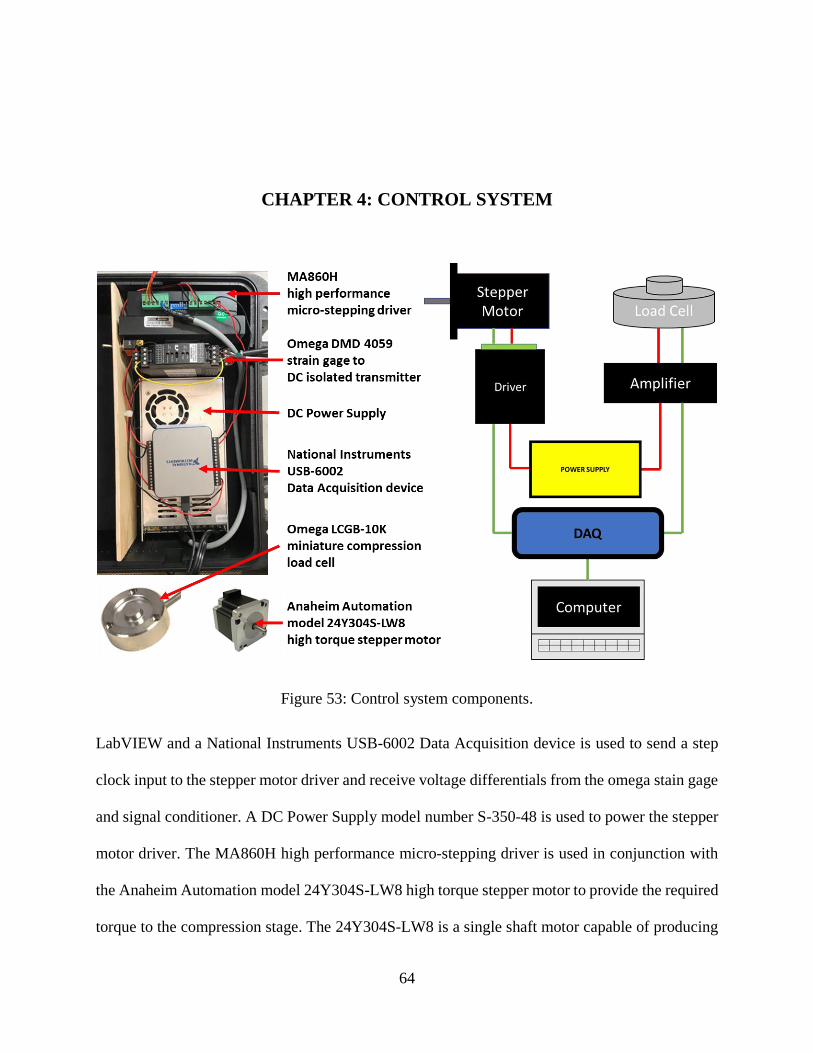
64
CHAPTER 4: CONTROL SYSTEM
Figure 53: Control system components.
LabVIEW and a National Instruments USB-6002 Data Acquisition device is used to send a step
clock input to the stepper motor driver and receive voltage differentials from the omega stain gage
and signal conditioner. A DC Power Supply model number S-350-48 is used to power the stepper
motor driver. The MA860H high performance micro-stepping driver is used in conjunction with
the Anaheim Automation model 24Y304S-LW8 high torque stepper motor to provide the required
torque to the compression stage. The 24Y304S-LW8 is a single shaft motor capable of producing

65
2.06 N-m while only weighing 0.51 Kg. Force data is recorded using an Omega DMD4059 strain
gage signal conditioner and an Omega LCGB-10K miniature compression load cell.
Stepper Motor Control
The stepper motor driver and the stepper motor are turned on and off by applying 5V to the ENA
input of the stepper motor driver. This connection is attached to the DAQs 5V power output and
ground. Therefore, the stepper motor is engaged when it is plugged into the computer. The analog
output function of the DAQ is used to send a pulse width modulation (PWM) signal to provide the
required step clock input to stepper motor driver. Likewise, the direction of the stepper motor is
controlled using a simple switch. When the switch is on the motor revolves in one direction and it
reverses when the switch is turned off. The driver uses an 8-bit DIP switch to set micro step
resolution and for most loading applications this will be set to 50,000 steps per revolution.
Therefore, the PWM pulse signal must signal 50,000 times for 1 revolution of the motor. The
frequencies of the PWM signal is controlled in LabView, which will communicate into the user
interface section.
Load Cell Sensor measurements
The Omega LCGB-10K miniature industrial compression load cell was used because of its small
thickness and ability to provide long-term stable measurements in harsh conditions and is used to
convert the force applied into an electrical signal. An Omega DMD 4059 strain gage to DC isolated
transmitter is used to excite the load cell and amplify the signal. Important load cell specifications
include an excitation voltage of 10 Vdc which applied using the Omega DMD4059 which has an
adjustable excitation power supply. The output or expected difference voltage at full load of the

66
load cell is 2 mV/V, and thus, the expected full load voltage would be 20mV, therefore, the Omega
DMD4059 amplifiers boost the signal level to a level which the DAQ can measure. This also
increases measurement resolution and improves signal-to-noise ratios. In the case of the load cell
sensor measurement subsystem the DAQ is used to digitize the incoming analog signal so that
computer software’s in this case LabView can interpret the data.
User Interface
The system design platform LabVIEW 2017 from National Instruments was used to control the
stepper motor and perform data acquisition for the load cell. A block diagram of the system was
created in the visual programming language. The finished product is then operated using the
interface called the front panel. Two separate front panels were developed for the load cell and
stepper motor. This is so the load cell could be continuously monitored even when the stepper
motor is not in use. This is especially important in early testing because it allowed the load to be
monitored while spectral acquisitions were being collected using the Raman spectrometer. The
load rate of the compression stage was controlled by changing the frequency of the PWM pulse
signal. The calculated load and stress could also be monitored during load application
simultaneously. In the future, a program which allows the system to load the sample to a specified
load without human interaction will be developed.
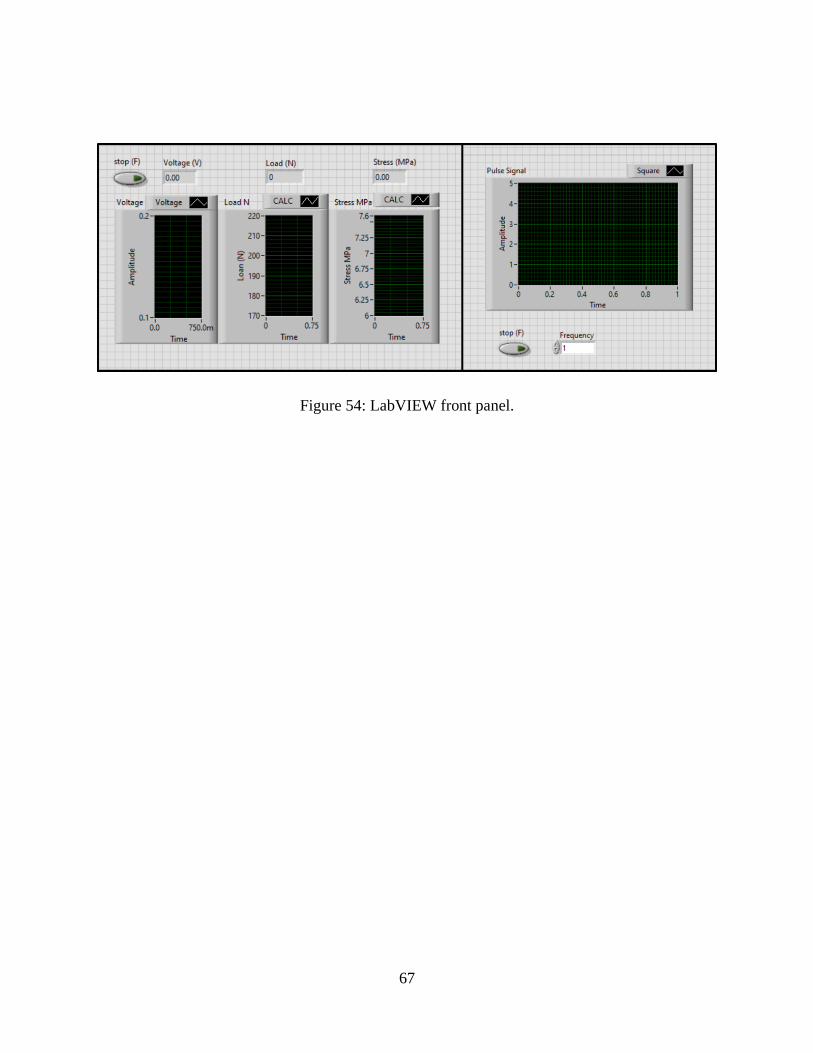
67
Figure 54: LabVIEW front panel.
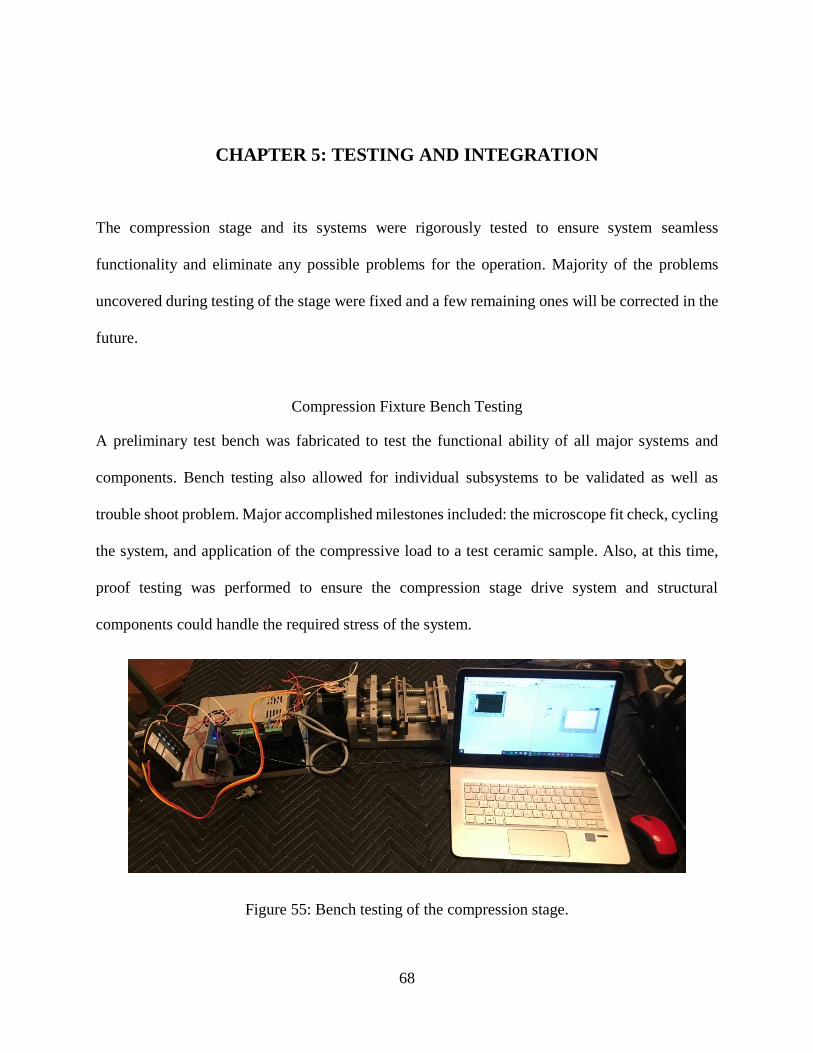
68
CHAPTER 5: TESTING AND INTEGRATION
The compression stage and its systems were rigorously tested to ensure system seamless
functionality and eliminate any possible problems for the operation. Majority of the problems
uncovered during testing of the stage were fixed and a few remaining ones will be corrected in the
future.
Compression Fixture Bench Testing
A preliminary test bench was fabricated to test the functional ability of all major systems and
components. Bench testing also allowed for individual subsystems to be validated as well as
trouble shoot problem. Major accomplished milestones included: the microscope fit check, cycling
the system, and application of the compressive load to a test ceramic sample. Also, at this time,
proof testing was performed to ensure the compression stage drive system and structural
components could handle the required stress of the system.
Figure 55: Bench testing of the compression stage.
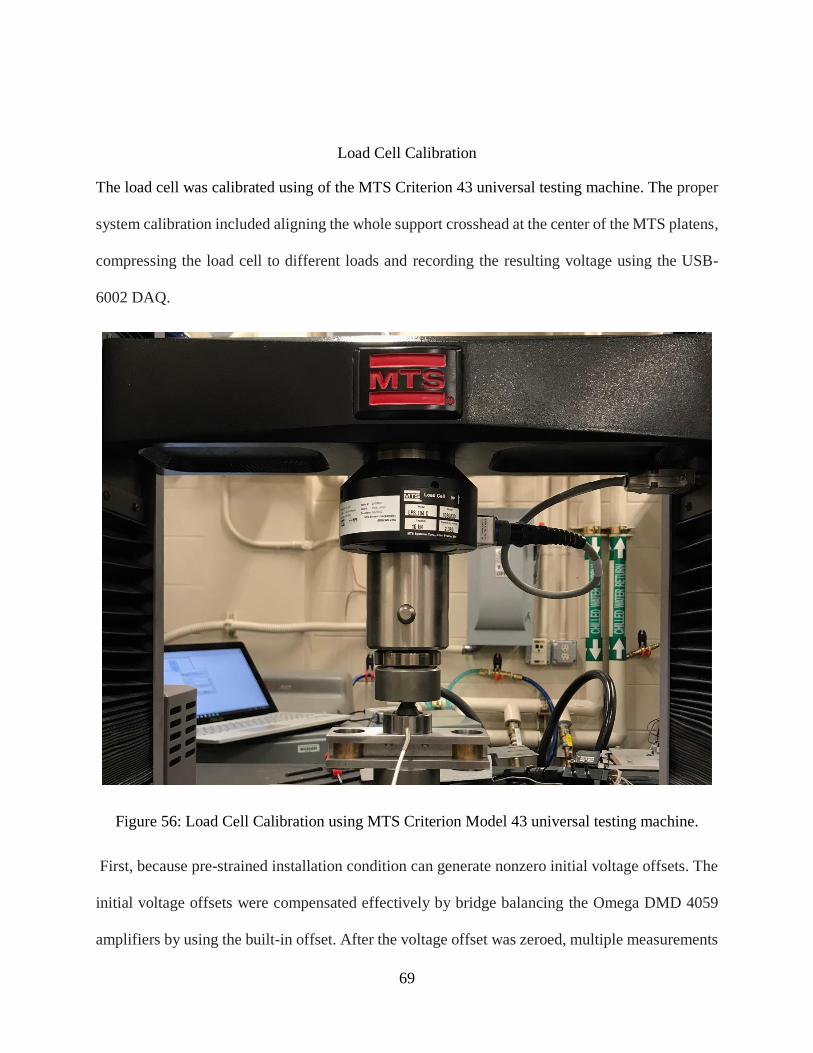
69
Load Cell Calibration
The load cell was calibrated using of the MTS Criterion 43 universal testing machine. The proper
system calibration included aligning the whole support crosshead at the center of the MTS platens,
compressing the load cell to different loads and recording the resulting voltage using the USB-
6002 DAQ.
Figure 56: Load Cell Calibration using MTS Criterion Model 43 universal testing machine.
First, because pre-strained installation condition can generate nonzero initial voltage offsets. The
initial voltage offsets were compensated effectively by bridge balancing the Omega DMD 4059
amplifiers by using the built-in offset. After the voltage offset was zeroed, multiple measurements
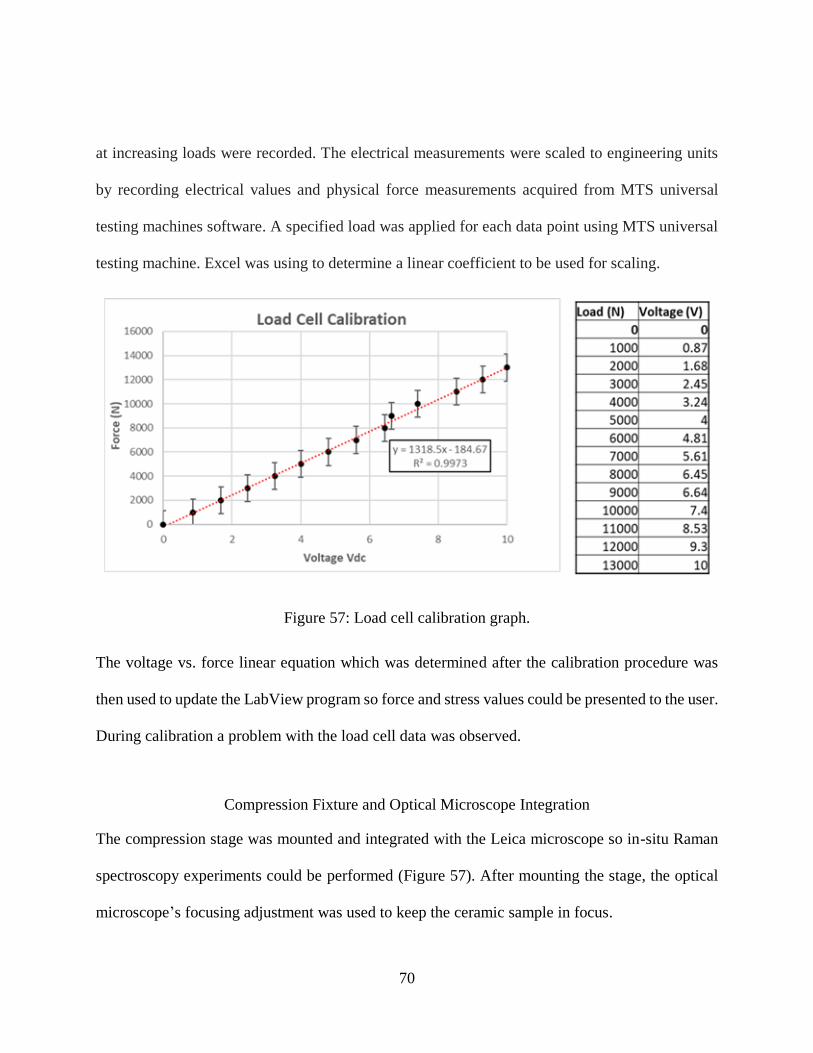
70
at increasing loads were recorded. The electrical measurements were scaled to engineering units
by recording electrical values and physical force measurements acquired from MTS universal
testing machines software. A specified load was applied for each data point using MTS universal
testing machine. Excel was using to determine a linear coefficient to be used for scaling.
Figure 57: Load cell calibration graph.
The voltage vs. force linear equation which was determined after the calibration procedure was
then used to update the LabView program so force and stress values could be presented to the user.
During calibration a problem with the load cell data was observed.
Compression Fixture and Optical Microscope Integration
The compression stage was mounted and integrated with the Leica microscope so in-situ Raman
spectroscopy experiments could be performed (Figure 57). After mounting the stage, the optical
microscope’s focusing adjustment was used to keep the ceramic sample in focus.
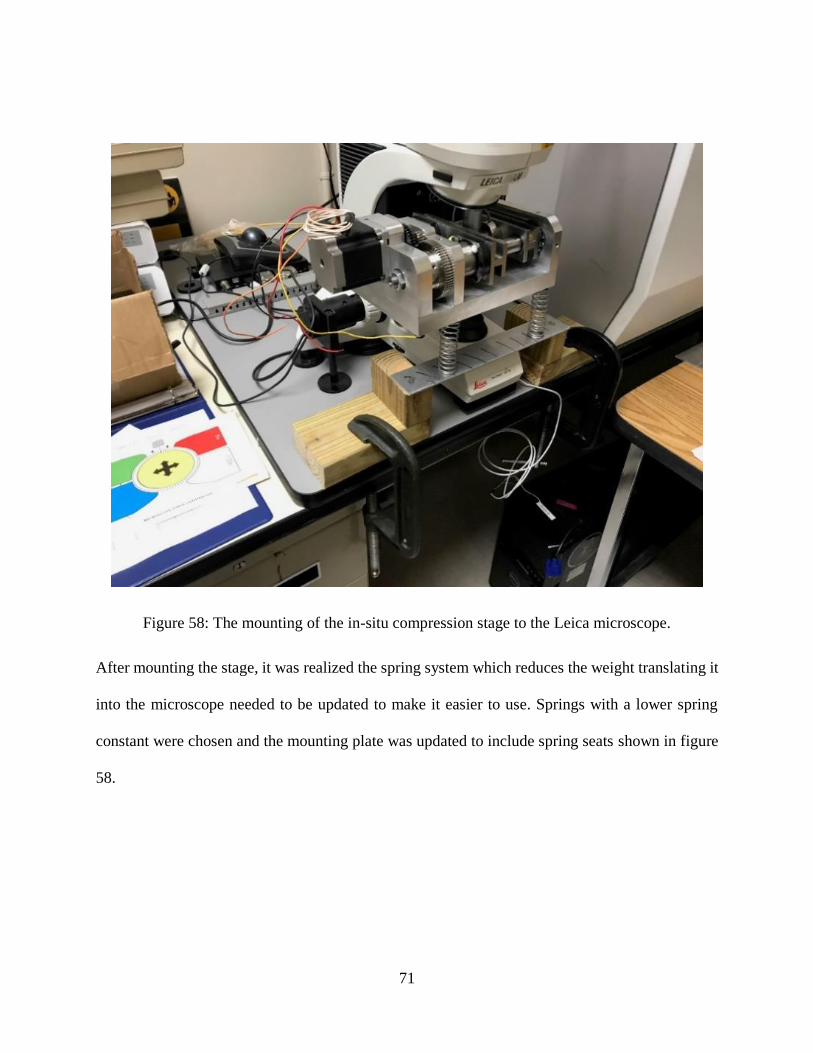
71
Figure 58: The mounting of the in-situ compression stage to the Leica microscope.
After mounting the stage, it was realized the spring system which reduces the weight translating it
into the microscope needed to be updated to make it easier to use. Springs with a lower spring
constant were chosen and the mounting plate was updated to include spring seats shown in figure
58.
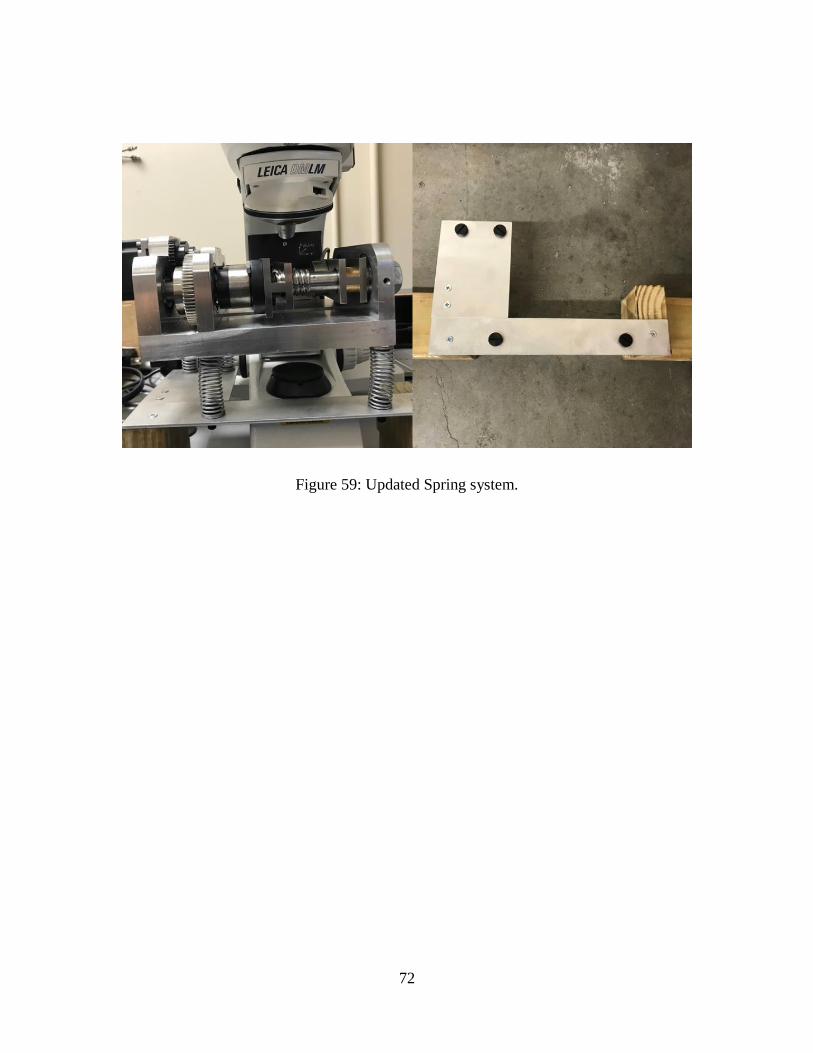
72
Figure 59: Updated Spring system.
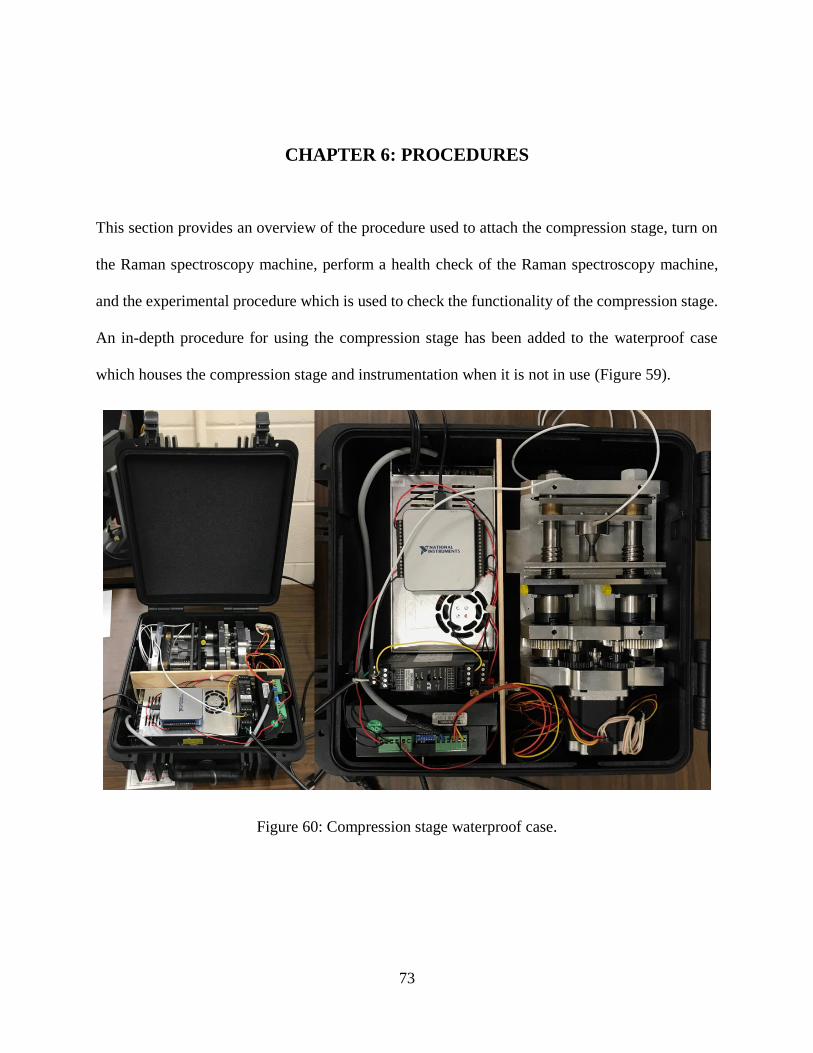
73
CHAPTER 6: PROCEDURES
This section provides an overview of the procedure used to attach the compression stage, turn on
the Raman spectroscopy machine, perform a health check of the Raman spectroscopy machine,
and the experimental procedure which is used to check the functionality of the compression stage.
An in-depth procedure for using the compression stage has been added to the waterproof case
which houses the compression stage and instrumentation when it is not in use (Figure 59).
Figure 60: Compression stage waterproof case.
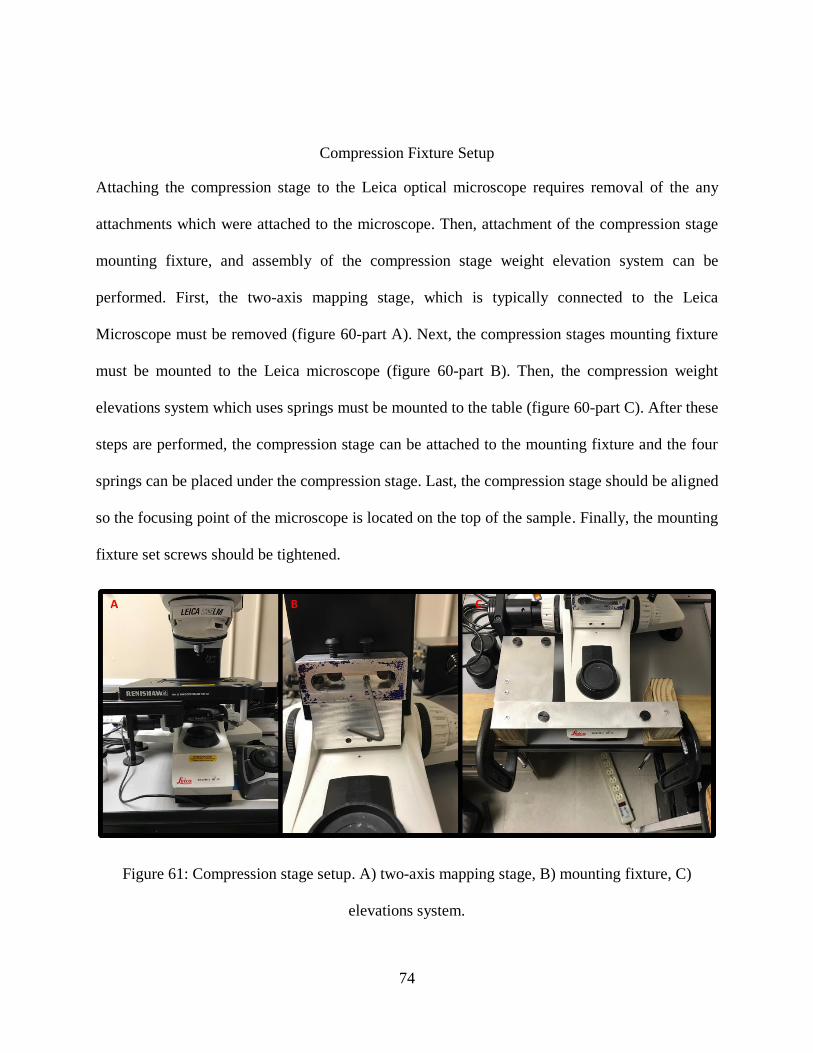
74
Compression Fixture Setup
Attaching the compression stage to the Leica optical microscope requires removal of the any
attachments which were attached to the microscope. Then, attachment of the compression stage
mounting fixture, and assembly of the compression stage weight elevation system can be
performed. First, the two-axis mapping stage, which is typically connected to the Leica
Microscope must be removed (figure 60-part A). Next, the compression stages mounting fixture
must be mounted to the Leica microscope (figure 60-part B). Then, the compression weight
elevations system which uses springs must be mounted to the table (figure 60-part C). After these
steps are performed, the compression stage can be attached to the mounting fixture and the four
springs can be placed under the compression stage. Last, the compression stage should be aligned
so the focusing point of the microscope is located on the top of the sample. Finally, the mounting
fixture set screws should be tightened.
Figure 61: Compression stage setup. A) two-axis mapping stage, B) mounting fixture, C)
elevations system.
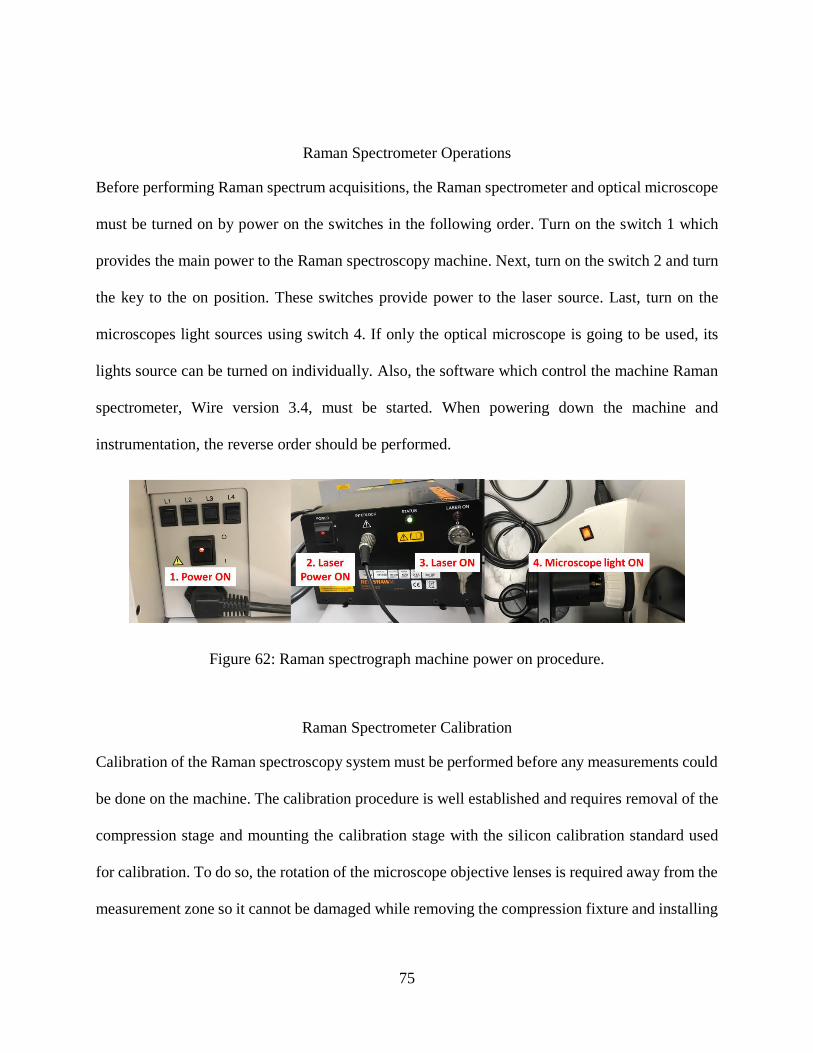
75
Raman Spectrometer Operations
Before performing Raman spectrum acquisitions, the Raman spectrometer and optical microscope
must be turned on by power on the switches in the following order. Turn on the switch 1 which
provides the main power to the Raman spectroscopy machine. Next, turn on the switch 2 and turn
the key to the on position. These switches provide power to the laser source. Last, turn on the
microscopes light sources using switch 4. If only the optical microscope is going to be used, its
lights source can be turned on individually. Also, the software which control the machine Raman
spectrometer, Wire version 3.4, must be started. When powering down the machine and
instrumentation, the reverse order should be performed.
Figure 62: Raman spectrograph machine power on procedure.
Raman Spectrometer Calibration
Calibration of the Raman spectroscopy system must be performed before any measurements could
be done on the machine. The calibration procedure is well established and requires removal of the
compression stage and mounting the calibration stage with the silicon calibration standard used
for calibration. To do so, the rotation of the microscope objective lenses is required away from the
measurement zone so it cannot be damaged while removing the compression fixture and installing
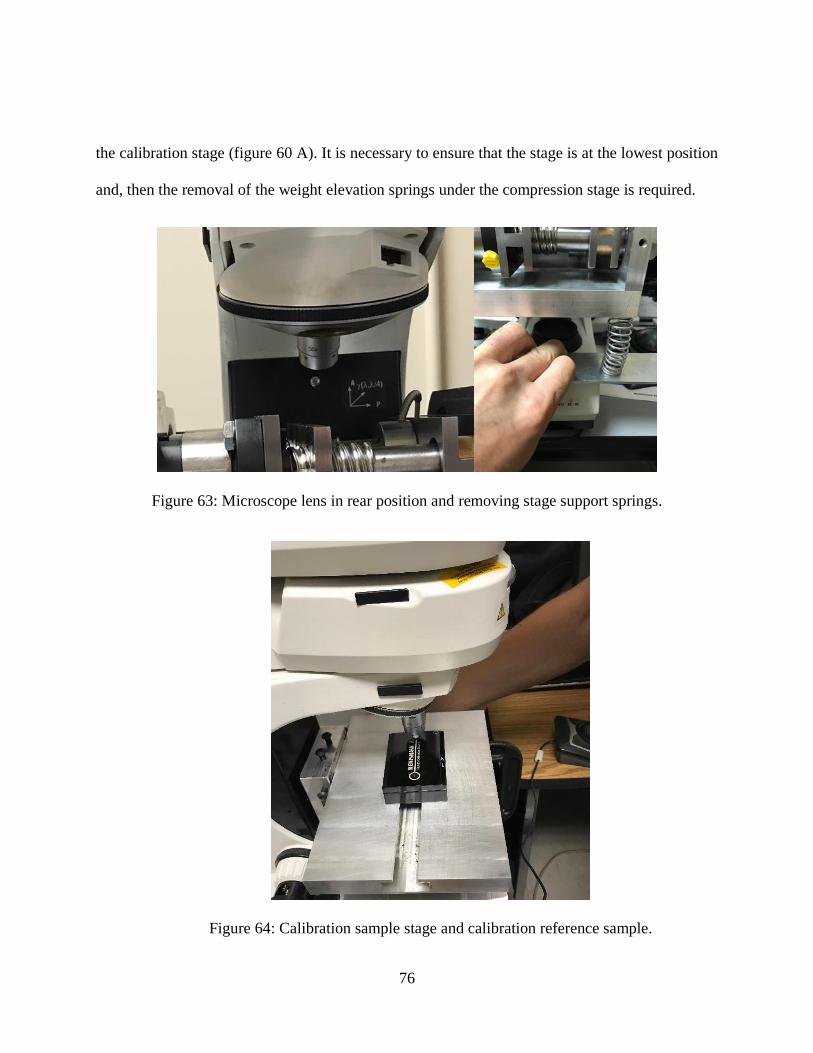
76
the calibration stage (figure 60 A). It is necessary to ensure that the stage is at the lowest position
and, then the removal of the weight elevation springs under the compression stage is required.
Figure 63: Microscope lens in rear position and removing stage support springs.
Figure 64: Calibration sample stage and calibration reference sample.
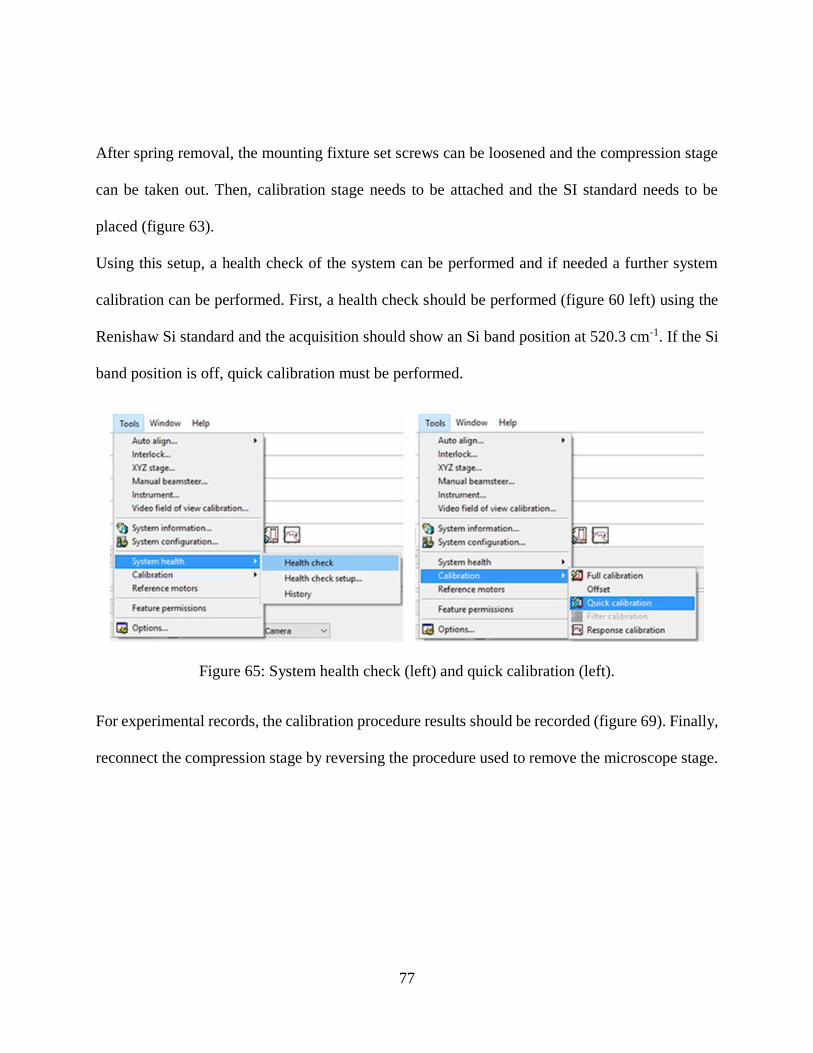
77
After spring removal, the mounting fixture set screws can be loosened and the compression stage
can be taken out. Then, calibration stage needs to be attached and the SI standard needs to be
placed (figure 63).
Using this setup, a health check of the system can be performed and if needed a further system
calibration can be performed. First, a health check should be performed (figure 60 left) using the
Renishaw Si standard and the acquisition should show an Si band position at 520.3 cm-1. If the Si
band position is off, quick calibration must be performed.
Figure 65: System health check (left) and quick calibration (left).
For experimental records, the calibration procedure results should be recorded (figure 69). Finally,
reconnect the compression stage by reversing the procedure used to remove the microscope stage.
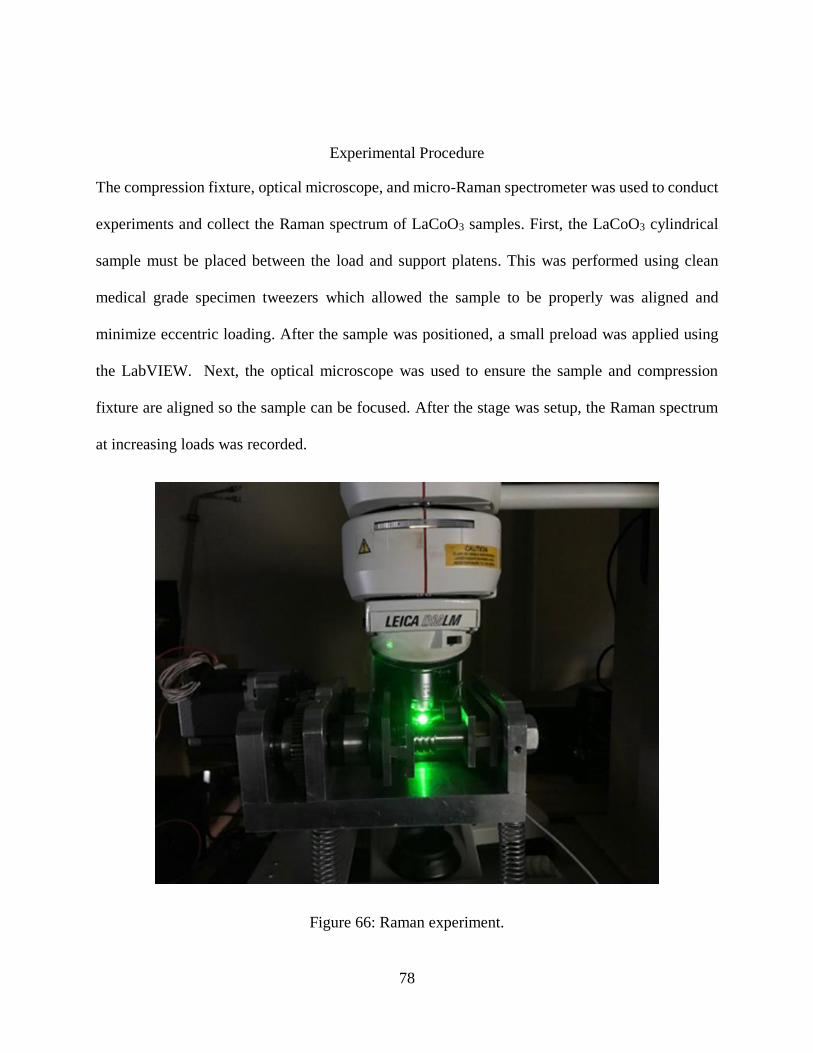
78
Experimental Procedure
The compression fixture, optical microscope, and micro-Raman spectrometer was used to conduct
experiments and collect the Raman spectrum of LaCoO3 samples. First, the LaCoO3 cylindrical
sample must be placed between the load and support platens. This was performed using clean
medical grade specimen tweezers which allowed the sample to be properly was aligned and
minimize eccentric loading. After the sample was positioned, a small preload was applied using
the LabVIEW. Next, the optical microscope was used to ensure the sample and compression
fixture are aligned so the sample can be focused. After the stage was setup, the Raman spectrum
at increasing loads was recorded.
Figure 66: Raman experiment.
79
For each acquisition, the following steps were conducted prior to the acquisition. First, the average
load cell voltage, load, and calculated stress were recorded from the front panel of the LabVIEW
program. Next, the Leica optical microscope was focused, and an optical micrograph was recorded
using the Renishaw CCD Camera. Then, the spectrum acquisition parameters were entered
including the spectral acquisition range, exposure time, and data recording location on the
computer. This was achieved by selecting “take a new spectral acquisition” and filing out the
appropriate tabs in the dialog box. The spectral range of the acquisition was from 50-1000 Raman
shift/cm-1 and an exposure time of 300 seconds was selected. The other parameter was set to the
default settings for all acquisitions. The last step included switching the microscope from the
optical setting to the spectrograph and focusing the laser. Prior to taking the spectral acquisition
all lights were turned off in the room and the computer screens were set to the lowest setting to
avoid altering the experimental data. Finally, to run the experiment, the run command on the wire
3.4 interface was initialed. After the spectral acquisition was complete the data recorded was saved
as a .txt file in the appropriate location so it could be analyzed using Excel after testing.
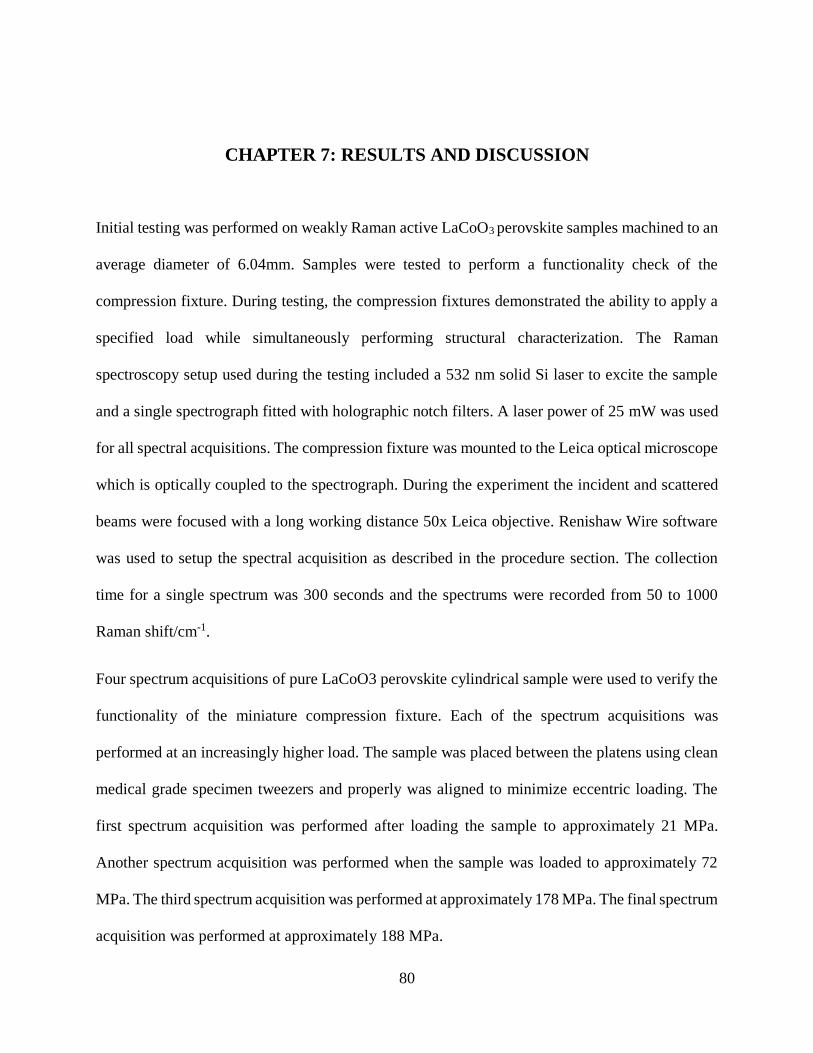
80
CHAPTER 7: RESULTS AND DISCUSSION
Initial testing was performed on weakly Raman active LaCoO3 perovskite samples machined to an
average diameter of 6.04mm. Samples were tested to perform a functionality check of the
compression fixture. During testing, the compression fixtures demonstrated the ability to apply a
specified load while simultaneously performing structural characterization. The Raman
spectroscopy setup used during the testing included a 532 nm solid Si laser to excite the sample
and a single spectrograph fitted with holographic notch filters. A laser power of 25 mW was used
for all spectral acquisitions. The compression fixture was mounted to the Leica optical microscope
which is optically coupled to the spectrograph. During the experiment the incident and scattered
beams were focused with a long working distance 50x Leica objective. Renishaw Wire software
was used to setup the spectral acquisition as described in the procedure section. The collection
time for a single spectrum was 300 seconds and the spectrums were recorded from 50 to 1000
Raman shift/cm-1.
Four spectrum acquisitions of pure LaCoO3 perovskite cylindrical sample were used to verify the
functionality of the miniature compression fixture. Each of the spectrum acquisitions was
performed at an increasingly higher load. The sample was placed between the platens using clean
medical grade specimen tweezers and properly was aligned to minimize eccentric loading. The
first spectrum acquisition was performed after loading the sample to approximately 21 MPa.
Another spectrum acquisition was performed when the sample was loaded to approximately 72
MPa. The third spectrum acquisition was performed at approximately 178 MPa. The final spectrum
acquisition was performed at approximately 188 MPa.
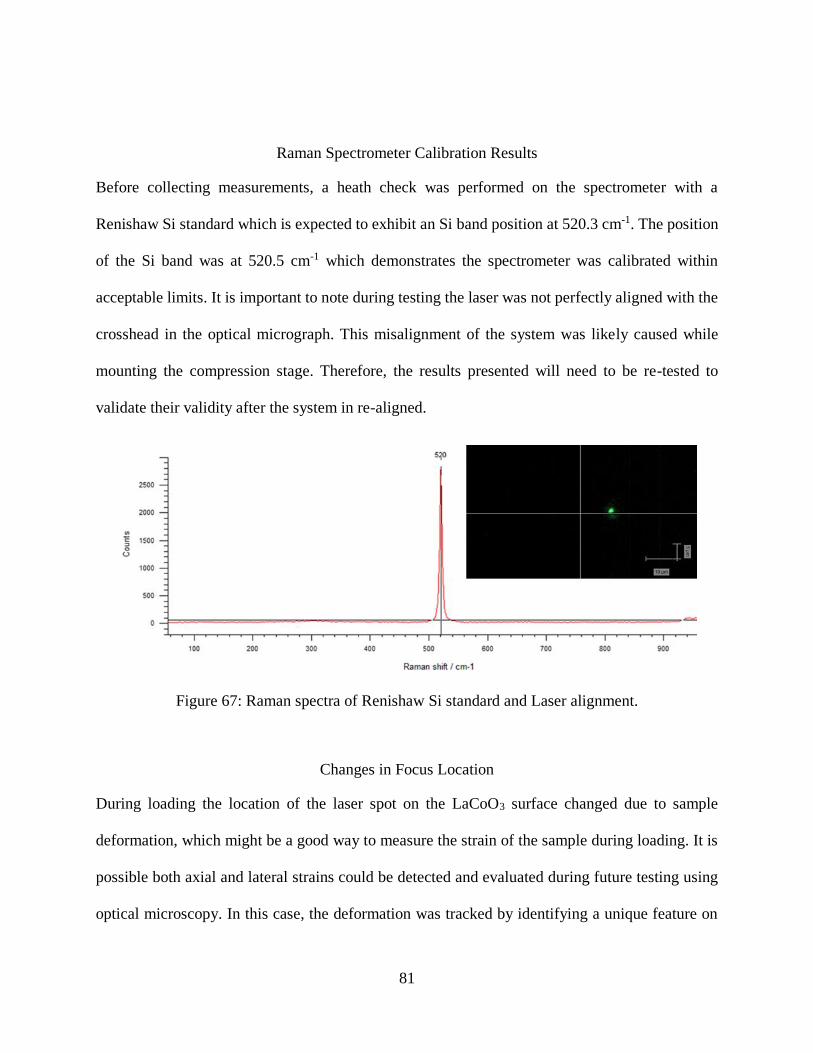
81
Raman Spectrometer Calibration Results
Before collecting measurements, a heath check was performed on the spectrometer with a
Renishaw Si standard which is expected to exhibit an Si band position at 520.3 cm-1. The position
of the Si band was at 520.5 cm-1 which demonstrates the spectrometer was calibrated within
acceptable limits. It is important to note during testing the laser was not perfectly aligned with the
crosshead in the optical micrograph. This misalignment of the system was likely caused while
mounting the compression stage. Therefore, the results presented will need to be re-tested to
validate their validity after the system in re-aligned.
Figure 67: Raman spectra of Renishaw Si standard and Laser alignment.
Changes in Focus Location
During loading the location of the laser spot on the LaCoO3 surface changed due to sample
deformation, which might be a good way to measure the strain of the sample during loading. It is
possible both axial and lateral strains could be detected and evaluated during future testing using
optical microscopy. In this case, the deformation was tracked by identifying a unique feature on
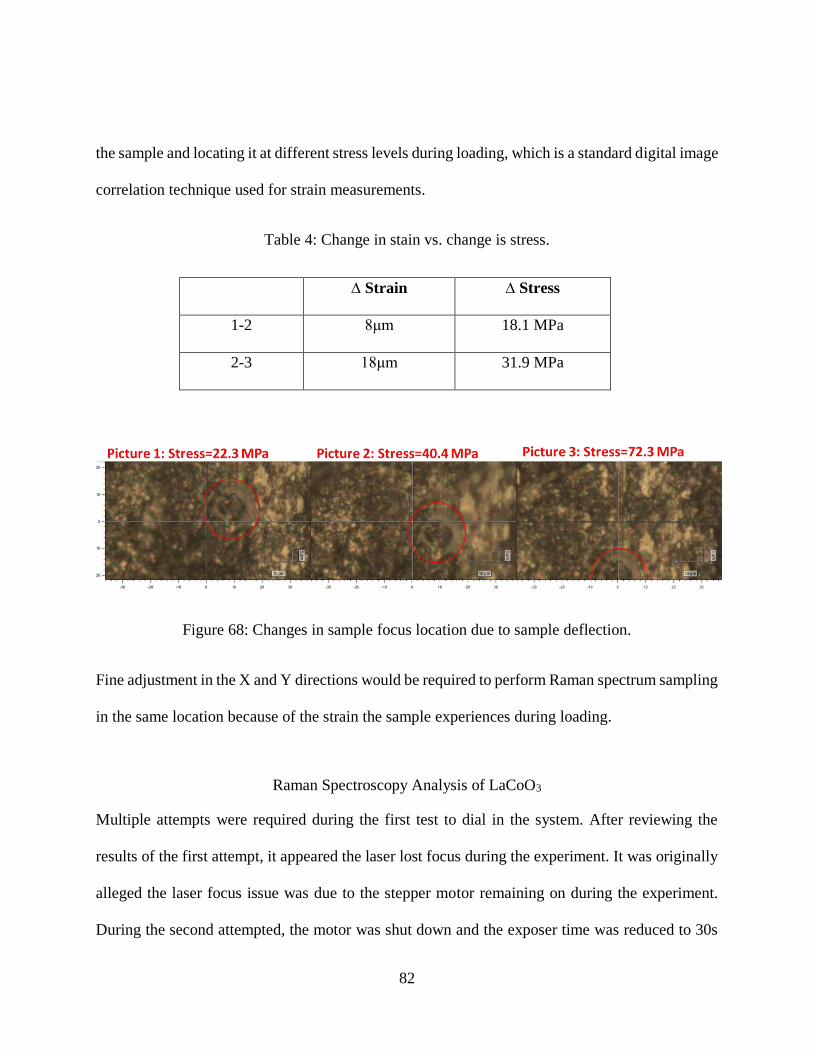
82
the sample and locating it at different stress levels during loading, which is a standard digital image
correlation technique used for strain measurements.
Table 4: Change in stain vs. change is stress.
∆ Strain ∆ Stress
1-2 8μm 18.1 MPa
2-3 18μm 31.9 MPa
Figure 68: Changes in sample focus location due to sample deflection.
Fine adjustment in the X and Y directions would be required to perform Raman spectrum sampling
in the same location because of the strain the sample experiences during loading.
Raman Spectroscopy Analysis of LaCoO3
Multiple attempts were required during the first test to dial in the system. After reviewing the
results of the first attempt, it appeared the laser lost focus during the experiment. It was originally
alleged the laser focus issue was due to the stepper motor remaining on during the experiment.
During the second attempted, the motor was shut down and the exposer time was reduced to 30s
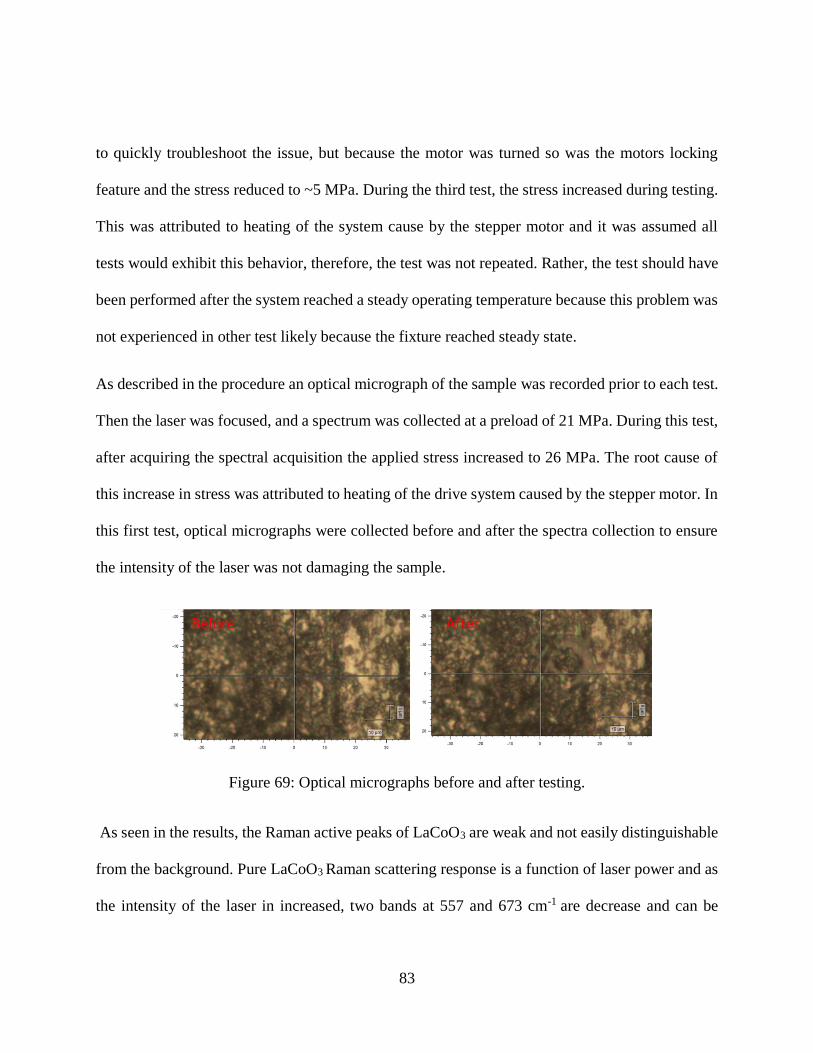
83
to quickly troubleshoot the issue, but because the motor was turned so was the motors locking
feature and the stress reduced to ~5 MPa. During the third test, the stress increased during testing.
This was attributed to heating of the system cause by the stepper motor and it was assumed all
tests would exhibit this behavior, therefore, the test was not repeated. Rather, the test should have
been performed after the system reached a steady operating temperature because this problem was
not experienced in other test likely because the fixture reached steady state.
As described in the procedure an optical micrograph of the sample was recorded prior to each test.
Then the laser was focused, and a spectrum was collected at a preload of 21 MPa. During this test,
after acquiring the spectral acquisition the applied stress increased to 26 MPa. The root cause of
this increase in stress was attributed to heating of the drive system caused by the stepper motor. In
this first test, optical micrographs were collected before and after the spectra collection to ensure
the intensity of the laser was not damaging the sample.
Figure 69: Optical micrographs before and after testing.
As seen in the results, the Raman active peaks of LaCoO3 are weak and not easily distinguishable
from the background. Pure LaCoO3 Raman scattering response is a function of laser power and as
the intensity of the laser in increased, two bands at 557 and 673 cm-1 are decrease and can be
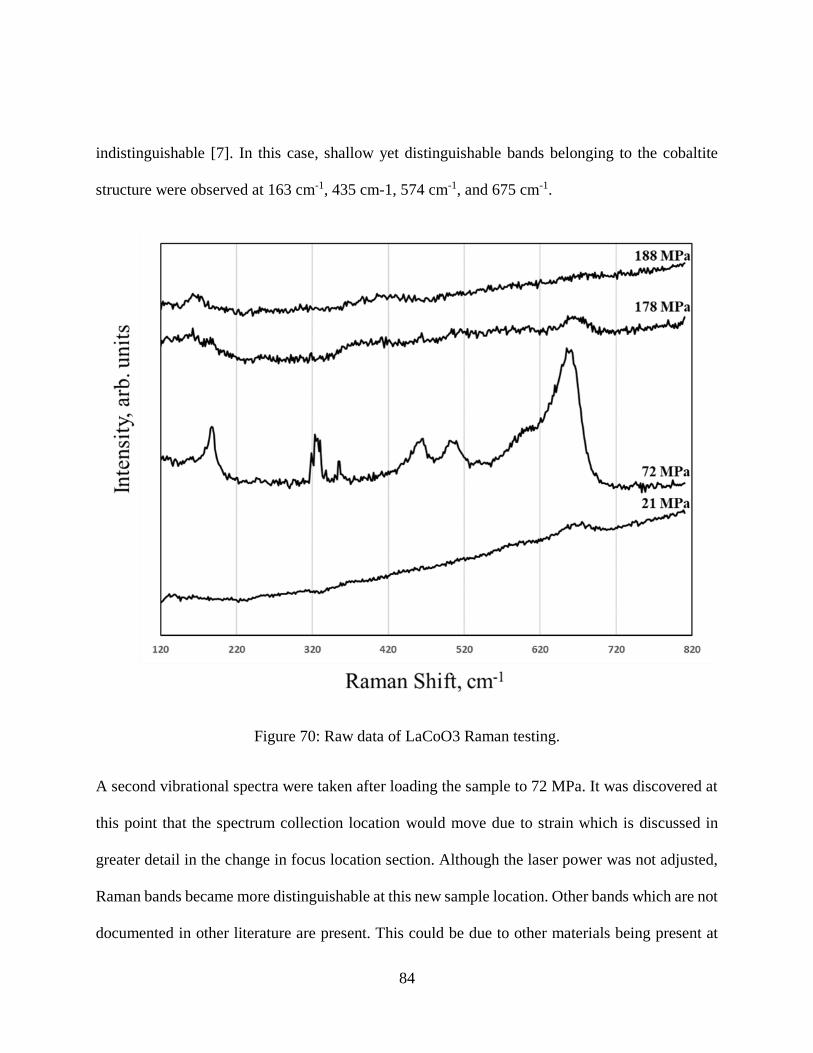
84
indistinguishable [7]. In this case, shallow yet distinguishable bands belonging to the cobaltite
structure were observed at 163 cm-1, 435 cm-1, 574 cm-1, and 675 cm-1.
Figure 70: Raw data of LaCoO3 Raman testing.
A second vibrational spectra were taken after loading the sample to 72 MPa. It was discovered at
this point that the spectrum collection location would move due to strain which is discussed in
greater detail in the change in focus location section. Although the laser power was not adjusted,
Raman bands became more distinguishable at this new sample location. Other bands which are not
documented in other literature are present. This could be due to other materials being present at

85
this location and more testing will need to be performed to determine the validity of these bands.
Four bands belonging to the Raman structure were observed at 163 cm-1, 463 cm-1, 597 cm-1, and
662 cm-1. Also, two bands at 325 cm-1 and 377 cm-1 are observed which will needs to be studied in
more detail. A third Raman spectrum was collected to determine the Raman scattering response at
178 MPa. The intensity of cobaltite bands acquired during this test were minimal which is expected
as compression strain increased and alters the crystalline structure of the materials. Bands
belonging to the cobaltite structure at 463 cm-1, 597 cm-1, and 662 cm-1 are slightly visible. Also,
an additional peak at 187 cm-1 was observed. The fourth Raman spectrum was performed at a
calculated stress of 188 MPa. The intensity of Raman band at higher wave numbers reduce to
insignificant levels yet the lowest band belonging to the cobaltite structure is visible at 162 cm-1
and 471 cm-1.
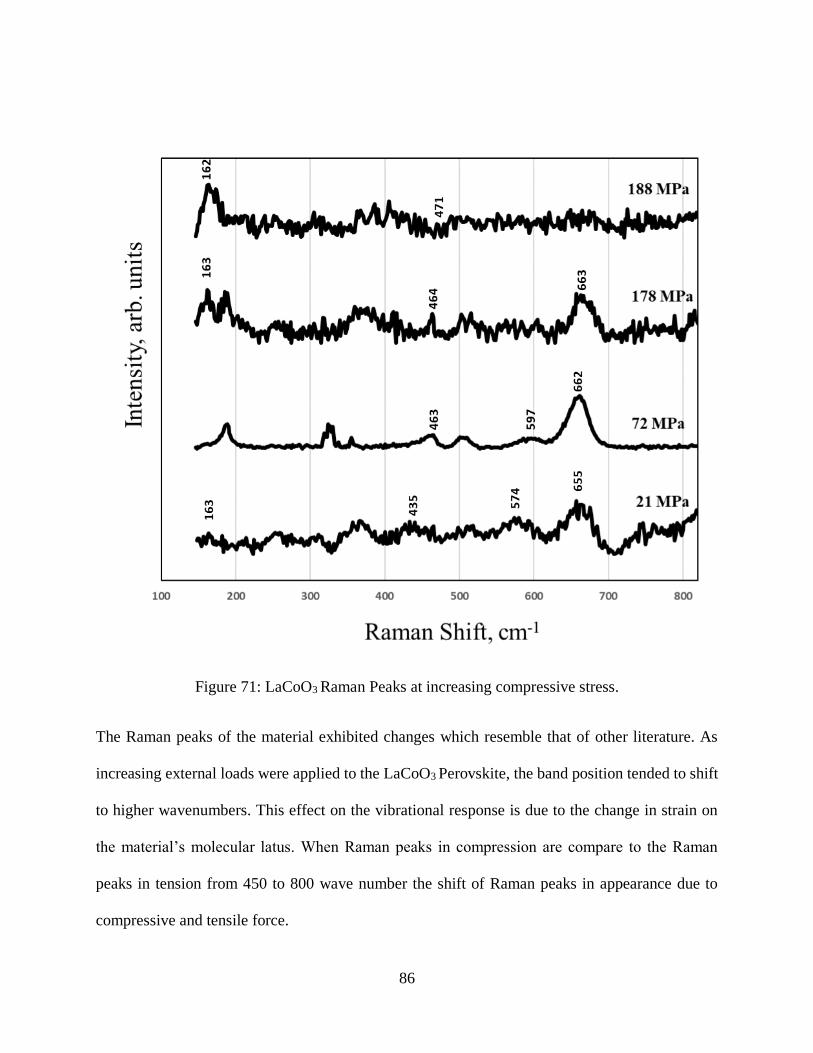
86
Figure 71: LaCoO3 Raman Peaks at increasing compressive stress.
The Raman peaks of the material exhibited changes which resemble that of other literature. As
increasing external loads were applied to the LaCoO3 Perovskite, the band position tended to shift
to higher wavenumbers. This effect on the vibrational response is due to the change in strain on
the material’s molecular latus. When Raman peaks in compression are compare to the Raman
peaks in tension from 450 to 800 wave number the shift of Raman peaks in appearance due to
compressive and tensile force.
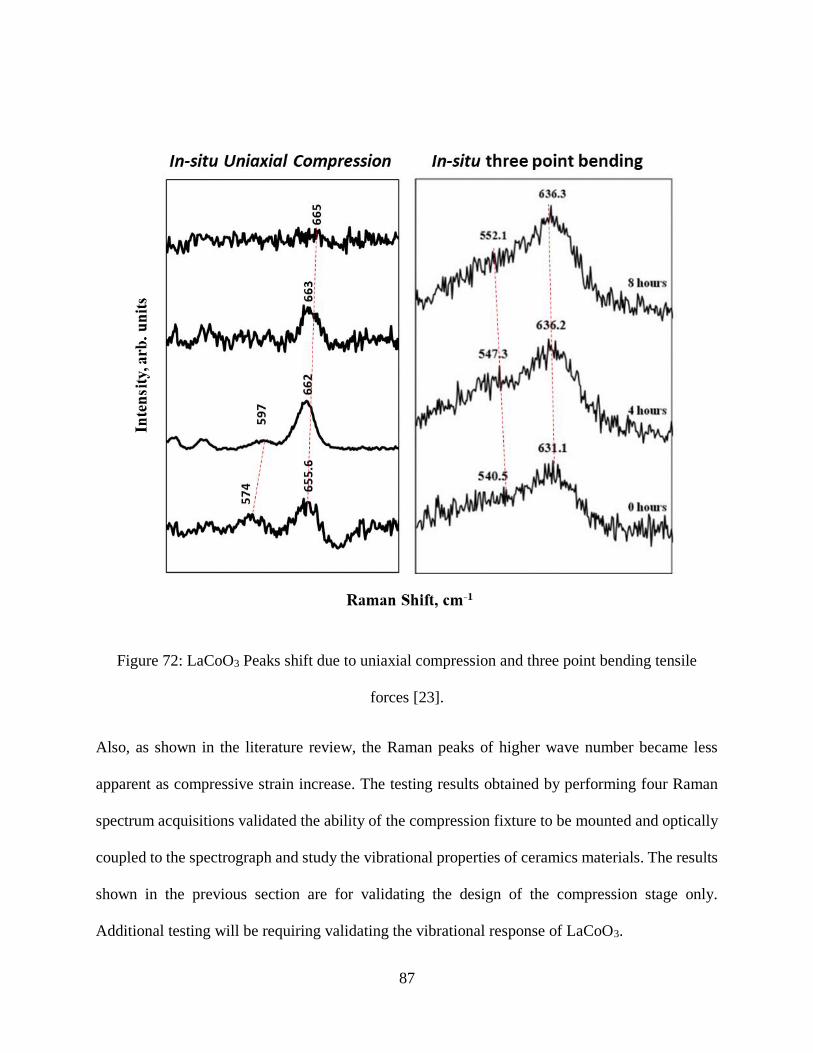
87
Figure 72: LaCoO3 Peaks shift due to uniaxial compression and three point bending tensile
forces [23].
Also, as shown in the literature review, the Raman peaks of higher wave number became less
apparent as compressive strain increase. The testing results obtained by performing four Raman
spectrum acquisitions validated the ability of the compression fixture to be mounted and optically
coupled to the spectrograph and study the vibrational properties of ceramics materials. The results
shown in the previous section are for validating the design of the compression stage only.
Additional testing will be requiring validating the vibrational response of LaCoO3.

88
CHAPTER 8: CONCLUSIONS
A miniature compression fixture was design and assembled which allows the vibrational properties
of ceramics to be tested while applying uniaxial compressive loads. The compression fixture was
redesigned, and critical calculations were performed to insure design criteria would be satisfied.
Also, finite element analysis was performed on the load and support crosshead to ensure margins
of safety were maintained. While working with experienced machinist at the UCF machine shop,
the stage was fabricated and assembled. Testing and integration demonstrated the compression
fixtures ability to load ceramic samples and meet the required design criteria. Actual experiments
were performed by attaching the fixture to the optical microscope and successful Raman scattering
responses were recorded at four loads. These experiments showed a pattern between peak position
and the external compressive force applied. Few testing techniques allow for non-destructive
characterization of ceramics. The research performed in this thesis could be used in the future to
determine residual stresses in ceramic materials and provide a basis for designing NDI techniques
which could determine the health and status of ceramic component.

89
CHAPTER 9: FUTURE WORK
The future work associated with this thesis can be separated into two sections. First, future
compression stage improvement and second, future testing and experiments. Future work on the
compression stage will be performed to improve its performance and accuracy. The ability to
change the focus location by moving the stage in the X and Y directions could be designed to allow
Raman spectral acquisitions to be performed in the same location. The load cell noise issue will
need to be resolved to increase the accuracy of load cell measurements and allow future system
logic to be possible. A closed loop PID controller will be designed using LabVIEW which will
simplify testing and reduce the chances of human error. Also, future testing and experiments will
be performed to determine the Raman scattering response as a function of external load. This will
include adjusting Raman spectrum parameters to achieve the best possible results. Also, the same
types of testing will be performed on multiple other ceramics and ceramic compositions to be
understand the structural response caused by mechanical loading.
90
LIST OF REFERENCES
[1] Renishaw, "A basic overview of Raman spectroscopy," 2019. [Online]. Available:
https://www.renishaw.com/en/a-basic-overview-of-raman-spectroscopy--25805.
[Accessed 2019 10 2].
[2] H. Kishimoto, N. Sakai, T. Horita, K. Yamaji, Y. P. Xiong, M. E. Brito and H. Yokokawa,
"Rapid Phase Transformation of Zirconia, in the Ni-SeS Z Current Anode under
Reducing Conditions," Solid State Ionics, no. 179, pp. 2037-2041, 2008.
[3] R. Stadelmann, B. Hughes and N. Orlovskaya, "Guideline of mapping parameters for
Raman mapping of ZrB2-SiC ceramic composites.," Advances in Applied
Ceramics: Structural, Functional & Bioceramics, vol. 115, no. 1, p. 21–28, 2016.
[4] K. Kleveland, N. Orlovskaya, T. Grande, A. M. Mardal Moe and M.-A. Einarsrud,
"Ferroelastic Behavior of LaCoO3-Based Ceramics," Journal of the American
Ceramic Society, vol. 84, no. 9, pp. 2029-2033, 2001.
[5] N. Russo, S. Furfori, D. Fino, G. Saracco and V. Specchia, "Lanthanum cobaltite catalysts
for diesel soot combustion," Applied Catalysis B: Environmental, vol. 83, no. 1-2,
pp. 85-95, 2008.
91
[6] A. Petric, P. Huang and F. Tietz, "Evaluation of La–Sr–Co–Fe–O perovskites for solid
oxide fuel cells and gas separation membranes," Solid State Ionics, vol. 135, no. 1-
4, pp. 719-725, 2000.
[7] N. Orlovskaya, D. Steinmetz, S. Yarmolenko, D. Pai, J. Sankar and J. Goodenough,
"Detection of Temperature- and Stress-Induced Modifications of LaCoO3 by
Micro-Raman Spectroscopy," Physical Review B, vol. 72, no. 1, pp. 2-7, 2005.
[8] K. Matsui, H. Yoshida and Y. Ikuhara, "Grain-boundary structure and microstructure
development mechanism in 2–8 mol% yttria-stabilized zirconia polycrystals," Acta
Materialia, vol. 56, no. 6, pp. 1315-1325, 2008.
[9] A. Ghosh, A. K. Suri, M. Pandey, S. Thomas, T. R. Rama Mohan and B. T. Rao,
"Nanocrystalline zirconia-yttria system–a Raman study," Materials Letters, vol. 60,
no. 9-10, pp. 1170-1173, 2006.
[10] F. Thévenot, "Boron carbide—A comprehensive review," Journal of the European
Ceramic Society, vol. 6, no. 4, pp. 205-225, 1990.
[11] W. K. Barney, G. A. Sehmel and W. E. Seymour, "The Use of Boron Carbide for Reactor
Control," Nuclear Science and Engineering, vol. 4, no. 3, pp. 439-448, 1958.
[12] P. Jannotti, G. Subhash, J. Q. Zheng, V. Halls, P. G. Karandikar, S. Salamone and M. K.
Aghajanian, "Raman spectroscopic characterization of the core-rim structure in
92
reaction bonded boron carbide ceramics," Applied Physics Letters, vol. 106, no. 4,
2015.
[13] W. Chong-Min, P. Xiaoqing, F. L. Riley and M. Mitomo, "Silicon nitride crystal structure
and observations of lattice defects," Journal of Material Science, vol. 31, no. 20,
pp. 5281-5298, 1996.
[14] "Silicon Nitride (Si3N4) Properties and Applications," AZO Materials, 6 February 2001.
[Online]. Available: https://www.azom.com/article.aspx?ArticleID=53. [Accessed 5
August 2019].
[15] A. J. Eckel, "Silicon nitride rocket thrusters test fired successfully.," in NASA Glenn
Research Centre press release, 2000.
[16] J. Z. Jiang, K. St˚ahl, R. W. Berg, D. J. Frost and T. J. Zhou, "Structural characterization of
cubic silicon nitride," Europhysics Letters, vol. 51, no. 1, p. 62067, 2000.
[17] V. A. Izhevskyi, L. A. Genova, J. C. Bressiani and A. H. Bressiani, "Review article:
Silicon Carbide. Structure, Properties and Processing," Cerâmica, vol. 46, no. 297,
2000.
[18] L. Vargas-Gonzalez and R. F. Speyer, "Flexural Strength, Fracture Toughness, and
Hardness of Silicon Carbide and Boron Carbide Armor Ceramics," Applied
Ceramic Technology, vol. 7, no. 6, pp. 643-651, 2010.
93
[19] M. Albano, R. B. Morles and M. Marchetti, "Coating effects on thermal properties of
carbon carbon and carbon silicon carbide composites for space thermal protection
systems," Acta Astronautica, vol. 99, pp. 276-282, 2014.
[20] P. Borowicz, T. Gutt and T. Malachowski, "Structural investigation of silicon carbide with
micro-Raman spectroscopy," in Mixed Design of Integrated Circuits and Systems
(MIXDES), Bydgoszcz, 2009.
[21] J. Nowak and Z. Shan, "In-Situ Compression of Nanopillars," Hysitron, 2017.
[22] "Hysitron PI 95," Bruker, 2019. [Online]. Available:
https://www.bruker.com/products/surface-and-dimensional-
analysis/nanomechanical-test-instruments/nanomechanical-test-instruments-for-
microscopes/pi-95-tem-picoindenter/overview.html. [Accessed 2 October 2019].
[23] N. Fist, J. Dinan, R. Stadelmann and N. Orlovskaya, "In situ three point bending device for
measurements of vibrational response of ceramics under stress by microRaman
spectroscopy," Advances in Applied Ceramics: Structural, Functional and
Bioceramics, vol. 111, no. 7, pp. 433-439, 2012.
[24] S. Romeis, J. Paul, M. Ziener and W. Peukert, "A novel apparatus for in situ compression
of submicron structures and particles in a high resolution SEM," Review of
Scientific Instruments, vol. 83, no. 9, 2012.
94
[25] E. K. Moo, S. K. Han, S. Federico, S. C. Sibole, A. Jinha, N. A. A. Osman, B. Pingguan-
Murphy and W. Herzog, "Extracellular matrix integrity affects the mechanical
behaviour of in-situ chondrocytes under compression," Journal of Biomechanics,
vol. 47, no. 5, pp. 1004-1013, 2014.
[26] G. D. Dutel, P. Langlois, D. Tingaud and G. Dirras, "Room-temperature deformation
micro-mechanisms of polycrystalline nickel processed by spark plasma sintering,"
Material Characterization, vol. 79, pp. 76-83, 2013.
[27] I. Hanhan, E. Durnberg, g. Freihofer, P. Akin and S. Raghavan, "Portable
Piezospectroscopy system: non-contact in-situ stress sensing through high
resolution photo-luminescent mapping," Journal of Instrumentation, vol. 9, 2014.
[28] G. Freihofer, L. Poliah, K. Walker, A. Medina and S. Raghavan, "Optical stress probe: in-
situ stress mapping with Raman and Photo-stimulated luminescence spectroscopy,"
Journal of Instrumentation, vol. 5, 2010.
[29] "Tensile Testing up to 10kN," Kammrath Weiss Gmbh, 2015. [Online]. Available:
https://www.kammrath-weiss.com/en/products/materials/tensile-compression.html.
[Accessed 21 May 2019].

95
[30] "MTII/ Fullam SEM Tester Series," MTI Instruments, 2017. [Online]. Available:
https://www.mtiinstruments.com/wp-content/uploads/2017/08/Tensile-Stage.pdf.
[Accessed 17 2019 July].
[31] "200N compression & horizontal bending stage," Deben, 2018. [Online]. Available:
https://deben.co.uk/tensile-testing/xrd/mini-tensile-tester-200n-compression-
horizontal-bending-stage/. [Accessed 15 June 2019].
[32] D. Goran, "Orientation contrast imaging and EBSD," Bruker Nano GmbH, Berlin, 2015.
[33] "Thomson Linear Motion Systems," Thomson, 2019. [Online]. Available:
www.thompsonlinear.com/linear/motion. [Accessed 6 October 2019].
[34] "How a Ball Screw Works," Barnes Industries, Inc., 2018. [Online]. Available:
http://www.barnesballscrew.com/how-a-ball-screw-works/. [Accessed 15 October
2019].
[35] "Spur Gear Tooth Component Identification," Engineers Edge, 2019. [Online]. Available:
https://www.engineersedge.com/gears/gear_tooth_parts.htm. [Accessed 15 October
2019].
[36] "Standard Specification for Stainless Steel Bars and Shapes," ASTM, Vols. A276/A276M-
17, 2017.

96
[37] "Stainless Steel – Grade 440C (UNS S44004)," AZO Materials, 2019. [Online]. Available:
https://www.azom.com/article.aspx?ArticleID=6846. [Accessed 28 June 2019].
[38] S. Online, "User’s Manual for MA860H High Performance Microstepping Driver".