Design and standardization of PCR primers and protocols for …€¦ · · 2015-03-10LEADING...
61
LEADING ARTICLE Design and standardization of PCR primers and protocols for detection of clonal immunoglobulin and T-cell receptor gene recombinations in suspect lymphoproliferations: Report of the BIOMED-2 Concerted Action BMH4-CT98-3936 JJM van Dongen 1 , AW Langerak 1 , M Bru ¨ggemann 2 , PAS Evans 3 , M Hummel 4 , FL Lavender 5 , E Delabesse 6 , F Davi 7 , E Schuuring 8,9 , R Garcı ´a-Sanz 10 , JHJM van Krieken 11 , J Droese 2 , D Gonza ´lez 10 , C Bastard 12 , HE White 5 , M Spaargaren 13 , M Gonza ´lez 10 , A Parreira 14 , JL Smith 5 , GJ Morgan 3 , M Kneba 2 and EA Macintyre 6 1 Department of Immunology, Erasmus MC, University Medical Center Rotterdam, Rotterdam, The Netherlands; 2 II Medizinische Klinik des Universita ¨tsklinikums Schleswig-Holstein, Campus Kiel, Kiel, Germany; 3 Academic Unit of Haematology and Oncology, University of Leeds, Leeds, UK; 4 lnstitute of Pathology, Free University Berlin, Berlin, Germany; 5 Wessex Immunology Service, Molecular Pathology Unit, Southampton University Hospitals NHS Trust, Southampton, UK; 6 Laboratoire d’Hematologie and INSERM EMI 210, Ho ˆ pital Necker-Enfants Malades, Paris, France; 7 Department of Hematology, Ho ˆpital Pitie ´-Salpe ´triere, Paris, France; 8 Department of Pathology, Leiden University Medical Center, Leiden, The Netherlands; 9 Department of Pathology and Laboratory Medicine, University Medical Center Groningen, Groningen, The Netherlands; 10 Servicio de Hematologia, Hospital Universitario de Salamanca, Salamanca, Spain; 11 Department of Pathology, University Medical Center Nijmegen, Nijmegen, The Netherlands; 12 Laboratoire de Genetique Oncologique, Centre Henri Becquerel, Rouen, France; 13 Department of Pathology, Academic Medical Center, Amsterdam, The Netherlands; and 14 Department of Hematology, Instituto Portugue ´s de Oncologia, Lisboa, Portugal In a European BIOMED-2 collaborative study, multiplex PCR assays have successfully been developed and standardized for the detection of clonally rearranged immunoglobulin (Ig) and T- cell receptor (TCR) genes and the chromosome aberrations t(11;14) and t(14;18). This has resulted in 107 different primers in only 18 multiplex PCR tubes: three VH–JH, two DH–JH, two Ig kappa (IGK), one Ig lambda (IGL), three TCR beta (TCRB), two TCR gamma (TCRG), one TCR delta (TCRD), three BCL1-Ig heavy chain (IGH), and one BCL2-IGH. The PCR products of Ig/ TCR genes can be analyzed for clonality assessment by heteroduplex analysis or GeneScanning. The detection rate of clonal rearrangements using the BIOMED-2 primer sets is unprecedentedly high. This is mainly based on the comple- mentarity of the various BIOMED-2 tubes. In particular, combined application of IGH (VH–JH and DH–JH) and IGK tubes can detect virtually all clonal B-cell proliferations, even in B-cell malignancies with high levels of somatic mutations. The contribution of IGL gene rearrangements seems limited. Combined usage of the TCRB and TCRG tubes detects virtually all clonal T-cell populations, whereas the TCRD tube has added value in case of TCRcd þ T-cell proliferations. The BIOMED-2 multiplex tubes can now be used for diagnostic clonality studies as well as for the identification of PCR targets suitable for the detection of minimal residual disease. Leukemia (2003) 17, 2257–2317. doi:10.1038/sj.leu.2403202 Keywords: PCR; clonality; immunoglobulin genes; T-cell receptor genes; lymphoproliferative disorders; IGH; IGK; IGL; TCRB; TCRG; TCRD; t(14;18); t(11;14); BCL1; BCL2; GeneScanning; heteroduplex; multiplex PCR; BIOMED-2 Preface In most patients with suspect lymphoproliferative disorders, histomorphology or cytomorphology supplemented with im- munohistology or flow cytometric immunophenotyping can discriminate between malignant and reactive lymphoprolifera- tions. However, in 5–10% of cases, making the diagnosis is more complicated. The diagnosis of lymphoid malignancies can be supported by clonality assessment based on the fact that, in principle, all cells of a malignancy have a common clonal origin. The majority of lymphoid malignancies belong to the B-cell lineage (90–95%) with only a minority being T-cell (5–7%) or NK-cell lineage (o2%). Acute lymphoblastic leukemias (ALLs) are of T-cell origin in 15–20% of cases, but in the group of mature lymphoid leukemias and in non-Hodgkin lymphomas (NHLs) T-cell malignancies are relatively rare, except for specific subgroups such as cutaneous lymphomas (Table 1). The vast majority of lymphoid malignancies (498%) contains identically (clonally) rearranged immunoglobulin (Ig) and/or T- cell receptor (TCR) genes, and in 25–30% of cases well-defined chromosome aberrations are found, all of which can serve as markers for clonality. 1,2 Ig and TCR gene rearrangements The Ig and TCR gene loci contain many different variable (V), diversity (D), and joining (J) gene segments, which are subject to rearrangement processes during early lymphoid differentia- tion. 3,4 The V–D–J rearrangements are mediated via a recombi- nase enzyme complex in which the RAG1 and RAG2 proteins play a key role by recognizing and cutting the DNA at the recombination signal sequences (RSS), which are located downstream of the V gene segments, at both sides of the D gene segments, and upstream of the J gene segments (Figure 1). Inappropriate (mutated or crippled) RSS reduce or even completely prevent rearrangement. The rearrangement process generally starts with a D to J rearrangement followed by a V to D–J rearrangement in case of Ig heavy chain (IGH), TCR beta (TCRB), and TCR delta (TCRD) genes (Figure 1) or concerns direct V to J rearrangements in case of Ig kappa (IGK), Ig lambda (IGL), TCR alpha (TCRA), and TCR gamma (TCRG) genes. The sequences between rearranging gene segments are generally deleted in the form of a circular excision product, also called TCR excision circle (TREC) or B-cell receptor excision circle (Figure 1). The Ig and TCR gene rearrangements during early lymphoid differentiation generally follow a hierarchical order. During B- cell differentiation, first the IGH genes rearrange, then IGK, potentially resulting in IgH/k expression or followed by IGK Received 10 July 2003; accepted 10 October 2003 Correspondence: Professor JJM van Dongen, Department of Immunol- ogy, Erasmus MC, University Medical Center Rotterdam, Dr Molewa- terplein 50, 3015 GE Rotterdam, The Netherlands; Fax: þ 31 10 40 89456; E-mail: [email protected] Leukemia (2003) 17, 2257–2317 & 2003 Nature Publishing Group All rights reserved 0887-6924/03 $25.00 www.nature.com/leu
-
Upload
truongkhanh -
Category
Documents
-
view
221 -
download
2
Transcript of Design and standardization of PCR primers and protocols for …€¦ · · 2015-03-10LEADING...
LEADING ARTICLE
Design and standardization of PCR primers and protocols for detection of clonalimmunoglobulin and T-cell receptor gene recombinations in suspectlymphoproliferations: Report of the BIOMED-2 Concerted Action BMH4-CT98-3936
JJM van Dongen1, AW Langerak1, M Bruggemann2, PAS Evans3, M Hummel4, FL Lavender5, E Delabesse6, F Davi7,E Schuuring8,9, R Garcıa-Sanz10, JHJM van Krieken11, J Droese2, D Gonzalez10, C Bastard12, HE White5, M Spaargaren13,M Gonzalez10, A Parreira14, JL Smith5, GJ Morgan3, M Kneba2 and EA Macintyre6
1Department of Immunology, Erasmus MC, University Medical Center Rotterdam, Rotterdam, The Netherlands; 2II MedizinischeKlinik des Universitatsklinikums Schleswig-Holstein, Campus Kiel, Kiel, Germany; 3Academic Unit of Haematology andOncology, University of Leeds, Leeds, UK; 4lnstitute of Pathology, Free University Berlin, Berlin, Germany; 5Wessex ImmunologyService, Molecular Pathology Unit, Southampton University Hospitals NHS Trust, Southampton, UK; 6Laboratoire d’Hematologieand INSERM EMI 210, Hopital Necker-Enfants Malades, Paris, France; 7Department of Hematology, Hopital Pitie-Salpetriere,Paris, France; 8Department of Pathology, Leiden University Medical Center, Leiden, The Netherlands; 9Department of Pathologyand Laboratory Medicine, University Medical Center Groningen, Groningen, The Netherlands; 10Servicio de Hematologia,Hospital Universitario de Salamanca, Salamanca, Spain; 11Department of Pathology, University Medical Center Nijmegen,Nijmegen, The Netherlands; 12Laboratoire de Genetique Oncologique, Centre Henri Becquerel, Rouen, France; 13Department ofPathology, Academic Medical Center, Amsterdam, The Netherlands; and 14Department of Hematology, Instituto Portugues deOncologia, Lisboa, Portugal
In a European BIOMED-2 collaborative study, multiplex PCRassays have successfully been developed and standardized forthe detection of clonally rearranged immunoglobulin (Ig) and T-cell receptor (TCR) genes and the chromosome aberrationst(11;14) and t(14;18). This has resulted in 107 different primersin only 18 multiplex PCR tubes: three VH–JH, two DH–JH, two Igkappa (IGK), one Ig lambda (IGL), three TCR beta (TCRB), twoTCR gamma (TCRG), one TCR delta (TCRD), three BCL1-Igheavy chain (IGH), and one BCL2-IGH. The PCR products of Ig/TCR genes can be analyzed for clonality assessment byheteroduplex analysis or GeneScanning. The detection rate ofclonal rearrangements using the BIOMED-2 primer sets isunprecedentedly high. This is mainly based on the comple-mentarity of the various BIOMED-2 tubes. In particular,combined application of IGH (VH–JH and DH–JH) and IGKtubes can detect virtually all clonal B-cell proliferations, even inB-cell malignancies with high levels of somatic mutations. Thecontribution of IGL gene rearrangements seems limited.Combined usage of the TCRB and TCRG tubes detects virtuallyall clonal T-cell populations, whereas the TCRD tube has addedvalue in case of TCRcdþ T-cell proliferations. The BIOMED-2multiplex tubes can now be used for diagnostic clonalitystudies as well as for the identification of PCR targets suitablefor the detection of minimal residual disease.Leukemia (2003) 17, 2257–2317. doi:10.1038/sj.leu.2403202Keywords: PCR; clonality; immunoglobulin genes; T-cell receptorgenes; lymphoproliferative disorders; IGH; IGK; IGL; TCRB; TCRG;TCRD; t(14;18); t(11;14); BCL1; BCL2; GeneScanning; heteroduplex;multiplex PCR; BIOMED-2
Preface
In most patients with suspect lymphoproliferative disorders,histomorphology or cytomorphology supplemented with im-munohistology or flow cytometric immunophenotyping candiscriminate between malignant and reactive lymphoprolifera-tions. However, in 5–10% of cases, making the diagnosis ismore complicated. The diagnosis of lymphoid malignancies canbe supported by clonality assessment based on the fact that, in
principle, all cells of a malignancy have a common clonalorigin.
The majority of lymphoid malignancies belong to the B-celllineage (90–95%) with only a minority being T-cell (5–7%) orNK-cell lineage (o2%). Acute lymphoblastic leukemias (ALLs)are of T-cell origin in 15–20% of cases, but in the group ofmature lymphoid leukemias and in non-Hodgkin lymphomas(NHLs) T-cell malignancies are relatively rare, except forspecific subgroups such as cutaneous lymphomas (Table 1).The vast majority of lymphoid malignancies (498%) containsidentically (clonally) rearranged immunoglobulin (Ig) and/or T-cell receptor (TCR) genes, and in 25–30% of cases well-definedchromosome aberrations are found, all of which can serve asmarkers for clonality.1,2
Ig and TCR gene rearrangements
The Ig and TCR gene loci contain many different variable (V),diversity (D), and joining (J) gene segments, which are subject torearrangement processes during early lymphoid differentia-tion.3,4 The V–D–J rearrangements are mediated via a recombi-nase enzyme complex in which the RAG1 and RAG2 proteinsplay a key role by recognizing and cutting the DNA at therecombination signal sequences (RSS), which are locateddownstream of the V gene segments, at both sides of the Dgene segments, and upstream of the J gene segments (Figure 1).Inappropriate (mutated or crippled) RSS reduce or evencompletely prevent rearrangement.
The rearrangement process generally starts with a D to Jrearrangement followed by a V to D–J rearrangement in case ofIg heavy chain (IGH), TCR beta (TCRB), and TCR delta (TCRD)genes (Figure 1) or concerns direct V to J rearrangements in caseof Ig kappa (IGK), Ig lambda (IGL), TCR alpha (TCRA), and TCRgamma (TCRG) genes. The sequences between rearranging genesegments are generally deleted in the form of a circular excisionproduct, also called TCR excision circle (TREC) or B-cellreceptor excision circle (Figure 1).
The Ig and TCR gene rearrangements during early lymphoiddifferentiation generally follow a hierarchical order. During B-cell differentiation, first the IGH genes rearrange, then IGK,potentially resulting in IgH/k expression or followed by IGKReceived 10 July 2003; accepted 10 October 2003
Correspondence: Professor JJM van Dongen, Department of Immunol-ogy, Erasmus MC, University Medical Center Rotterdam, Dr Molewa-terplein 50, 3015 GE Rotterdam, The Netherlands; Fax: þ 31 10 4089456; E-mail: [email protected]
Leukemia (2003) 17, 2257–2317& 2003 Nature Publishing Group All rights reserved 0887-6924/03 $25.00
www.nature.com/leu

deletion and IGL rearrangement, potentially followed by IgH/lexpression.5 This implies that virtually all Iglþ B cells havemonoallelic or biallelic IGK gene deletions. During T-celldifferentiation, first the TCRD genes rearrange, then TCRG,potentially resulting in TCRgd expression or followed by furtherTCRB rearrangement and TCRD deletion with subsequent TCRArearrangement, potentially followed by TCRab expression. TheIg and TCR gene rearrangement patterns in lymphoid malig-nancies generally fit with the above-described hierarchicalorder, although unusual rearrangement patterns can be found aswell, particularly in ALL.6
Ig and TCR repertoire
The many different combinations of V, D, and J gene segmentsrepresent the so-called combinatorial repertoire (Table 2), whichis estimated to be B2� 106 for Ig molecules, B3� 106 forTCRab molecules, and B5� 103 for TCRgd molecules. At thejunction sites of the V, D, and J gene segments, deletion andrandom insertion of nucleotides occurs during the rearrange-ment process, resulting in highly diverse junctional regions,which significantly contribute to the total repertoire of Ig andTCR molecules, estimated to be 41012.5
Mature B-lymphocytes further extend their Ig repertoire uponantigen recognition in germinal centers via somatic hypermuta-tion, a process leading to affinity maturation of the Ig molecules.The somatic hypermutation process focuses on the V(D)J exon ofIGH and Ig light-chain genes and concerns single-nucleotide
mutations and occasional insertions or deletions of nucleotides.Somatically mutated Ig genes are therefore found in mature B-cellmalignancies of germinal center or postgerminal center origin.7
Monotypic Ig and TCR molecules as indirect evidenceof clonality
Functionally rearranged Ig and TCR genes result in surfacemembrane expression of Ig, TCRab, or TCRgd molecules. Basedon the concept that only a single type of Ig or TCR molecule isexpressed by a lymphocyte or lymphoid clone, the clonallyrearranged genes of mature lymphoid malignancies might bedetectable at the protein level. The detection of single Ig light-chain expression (Igk or Igl) has for a long time been used todiscriminate between reactive (polyclonal) B-lymphocytes(normal Igk/Igl ratio: 0.7–2.8) vs aberrant (clonal) B-lympho-cytes with Igk/Igl ratios of 44.0 or o0.5.8–10 In the vastmajority (490%) of mature B-cell malignancies, single Ig light-chain expression can support the clonal origin of the malig-nancy. In tissue sections, however, reliable detection of Ig light-chain expression is often difficult to assess due to soluble Igmolecules overlaying the cellular Ig expression.
The development of many different antibodies againstvariable domains of the various TCR chains also allows thedetection of monotypic Vb, Vg and Vd domains, whencompared with appropriate reference values.11–16 In theinterpretation of monotypic Vb results using 20–25 antibodiesagainst different Vb families (Table 2), one should realize that
Table 1 B, T, and NK lineage of lymphoid malignanciesa
Lineage ALL Chronic lymphocyticleukemias (%)
NHL Multiple myeloma(%)
Childhood (%) Adult (%) Nodal (%) Extranodal (%) Skin (%)
B 82–86 75–80 95–97 95–97 90–95 30–40 100T 14–18 20–25 3–5 3–5 5–10 60–70 0NK o1 o1 1–2 o2 o2 o2 0
aSee van Dongen et al,1 Jaffe et al,2 and van Dongen et al.5
Figure 1 Schematic diagram of sequential rearrangement steps, transcription, and translation of the TCRB gene. In this example, first a Db2 toJb2.3 rearrangement occurs, followed by Vb4 to Db2–Jb2.3 rearrangement, resulting in the formation of a Vb4–Db2–Jb2.3 coding joint. Therearranged TCRB gene is transcribed into precursor mRNA, spliced into mature mRNA, and finally translated into a TCRb protein chain. The twoextrachromosomal TRECs that are formed during this recombination process are indicated as well; they contain the D–J signal joint and V–D signaljoint, respectively.
PCR-based clonality studies in lymphoproliferationsJJM van Dongen et al
2258
Leukemia

clinically benign clonal TCRabþ T-cell expansions (frequentlyCD8þ ) are regularly found in peripheral blood (PB) of olderindividuals.13,17 These clonal T-cell expansions in PB are,however, relatively small in size: o40% of PB T-lymphocytesand o0.5� 106/ml PB.13 It is not yet clear to what extent suchclinically benign T-cell clones can also be found in lymphoidtissues.
The results of monotypic Vg and Vd domain expression shouldbe interpreted with caution, because in healthy individuals alarge fraction of normal polyclonal TCRgdþ T-lymphocytes hasbeen selected for Vg9–Jg1.2 and Vd2–Jd1 usage.18,19 Conse-quently, high frequencies of Vg9þ /Vd2þ T-lymphocytes in PBshould be regarded as a normal finding, unless the absolutecounts are over 1–2� 106/ml PB. It should be noted that mostTCRgdþ T-cell malignancies express Vd1 or another non-Vd2gene segment in combination with a single Vg domain(generally not Vg9).15,20
The detection of Igk- or Igl-restricted expression or mono-typic Vb, Vg or Vd expression is relatively easy in flowcytometric studies of PB and bone marrow (BM) samples ofpatients with mature B- or T-cell leukemias. However, it appearsto be more difficult in tissue samples with suspect lymphopro-liferative disorders that are intermixed with normal (reactive)lymphocytes.
In contrast to the antibody-based techniques, moleculartechniques are broadly applicable for the detection of clonallyrearranged Ig/TCR genes and certain chromosome aberrations.This previously concerned Southern blot analysis, which hasgradually been replaced by PCR techniques.
Molecular clonality diagnostics in hemato-oncology
Difficulties in making a final diagnosis of lymphoid malignancyoccur in a proportion of cases (5–10%) despite extensiveimmunophenotyping. Therefore, additional (molecular clonal-ity) diagnostics are needed to generate or to confirm the finaldiagnosis, such as in case of:
� any suspect B-cell proliferation when morphology andimmunophenotyping are not conclusive;
� all suspect T-cell proliferations (caution: T-cell-rich B-NHL);� lymphoproliferations in immunodeficient patients, including
post-transplant patients;
� evaluation of the clonal relationship between two lymphoidmalignancies in one patient or discrimination between arelapse and a second malignancy;
� further classification of a malignancy, for example, via Ig/TCRgene rearrangement patterns or particular chromosomeaberrations;
� occasionally, staging of lymphomas.
Southern blot analysis and PCR techniques for clonalitystudies
Southern blot analysis: For a long time, Southern blotanalysis has been the gold standard technique for molecularclonality studies. Southern blotting is based on the detection ofnon-germline (‘rearranged’) DNA fragments, obtained afterdigestion with restriction enzymes. Well-chosen restrictionenzymes (resulting in fragments of 2–15 kb) and well-positionedDNA probes (particularly downstream J segment probes) allowthe detection of virtually all Ig and TCR gene rearrangementsas well as chromosome aberrations involving J gene seg-ments.21–28 It should be noted that Southern blot analysisfocuses on the rearrangement diversity of Ig/TCR gene segmentsand therefore takes advantage of the combinatorial repertoire.
Optimal Southern blot results for clonality assessment canparticularly be obtained with the IGH, IGK, and TCRB genes,because these genes have an extensive combinatorial repertoireas well as a relatively simple gene structure that can beevaluated with only one or two DNA probes.22,24,28 The IGLand TCRA genes are more complex and require multiple probesets.25,26,29 Finally, the TCRG and TCRD genes have a limitedcombinatorial repertoire, which is less optimal for discrimina-tion between monoclonality and polyclonality via Southern blotanalysis.20,21
Despite the high reliability of Southern blot analysis, it isincreasingly replaced by PCR techniques, because of severalinherent disadvantages: Southern blot analysis is time-consum-ing, technically demanding, requires 10–20 mg of high-qualityDNA, and has a limited sensitivity of 5–10%.21
PCR analysis: The detection of rearranged Ig/TCR genes andchromosome aberrations by PCR techniques requires preciseknowledge of the rearranged gene segments in order to design
Table 2 Estimated number of nonpolymorphic human V, D, and J gene segments that can potentially be involved in Ig or TCR generearrangementsa
Gene segment IGH IGK IGL TCRA TCRB TCRG TCRD
V segmentsFunctional (family) 44 (7) 43 (7) 38 (10) 46 (32) 47 (23) 6 (4) 8Rearrangeable (family) 66 (7)b 76 (7) 56 (11) 54 (32) 67 (30) 9 (4) 8
D segmentsRearrangeable (family) 27 (7) F F F 2 F 3
J segmentsFunctional 6c 5d 4 53 13 5 4Rearrangeable 6c 5d 5e 61 13 5 4
aOnly nonpolymorphic gene segments with a suitable RSS are included in this table.62,63
bThis estimation does not include the recently discovered (generally truncated) VH pseudogenes, which are clustered in three clans.cThe six JH gene segments are highly homologous over a stretch of B20 nucleotides, which is sufficient for the design of a consensus primer.dThe Jk segments have a high homology, which allows the design of two to three Jk consensus primers.eFive of the seven Jl gene segments have a suitable RSS.
PCR-based clonality studies in lymphoproliferationsJJM van Dongen et al
2259
Leukemia

appropriate primers at opposite sides of the junctional regionsand breakpoint fusion regions, respectively.
In routine PCR-based clonality studies, the distance betweenthe primers should be less than 1 kb, preferably less than 500 bp,and in formalin-fixed tissues preferably less than 300 bp (seealso Section 10). This is particularly important for discriminationbetween PCR products from monoclonal vs polyclonal Ig/TCRgene rearrangements, which is based on the diversity of thejunctional regions (diversity in size and composition). To date,IGH and TCRG gene rearrangements have most commonly beenused for PCR-based clonality studies, because of the limitednumber of primers needed to detect VH–JH and Vg–Jgrearrangements.
The main advantages of PCR techniques are their speed, thelow amounts of DNA required, the possibility to use DNA oflower quality, and the relatively good sensitivity of 1–5%, forsome types of rearrangements even o1%. Consequently, PCRtechniques allow the use of small biopsies (eg fine-needleaspiration biopsies), or the use of formaldehyde-fixed paraffin-embedded samples, which generally results in DNA of lowerquality, that is, partly degraded into smaller fragments. Thereforearchival material may also be used, if needed.
Limitations and pitfalls of molecular clonality studies
Molecular clonality studies can be highly informative, butseveral limitations and pitfalls might hamper the interpretationof the results:
1. Limited sensitivity, related to normal polyclonal back-ground: The detection limit varies between 1 and 10% (or even15%), dependent on the applied technique (Southern blotanalysis or PCR techniques) and on the relative size of the‘background’ of normal (polyclonal) B- and T-lymphocytes. Alimited sensitivity might hamper the detection of small clonalcell populations with less than 5–10% clonal lymphoid cells.
2. Clonality is not equivalent to malignancy: The detection ofclonality does not always imply the presence of a malignancy.Some clinically benign proliferations have a clonal origin, suchas many cases of CD8þ (or sometimes CD4þ ) T-lymphocytosis,benign monoclonal gammopathies, initial phases of EBVþ
lymphoproliferations (frequently being oligoclonal) in immuno-deficient patients, and benign cutaneous T-cell proliferations,such as lymphomatoid papulosis, etc. This implies that results ofmolecular clonality studies should always be interpreted in thecontext of the clinical, morphological, and immunophenotypicdiagnosis, that is, in close collaboration with hematologists,cytomorphologists, pathologists, and immunologists.
3. Ig and TCR gene rearrangements are not markers forlineage: In contrast to the initial assumption, it has now beenclear for more than a decade that Ig and TCR gene rearrange-ments are not necessarily restricted to B- and T-cell lineages,respectively. Crosslineage TCR gene rearrangements occurrelatively frequently in immature B-cell malignancies, particu-larly in precursor B-ALL (490% of cases),30 but also acutemyeloid leukemias (AMLs) and mature B-cell malignanciesmight contain TCR gene rearrangements.31–33 Crosslineage Iggene rearrangements, mainly involving the IGH locus, alsooccur in T-cell malignancies and AML, albeit at a lowerfrequency.33,34
Virtually all (498%) TCRabþ T-cell malignancies have TCRGgene rearrangements (generally biallelic) and many TCRgdþ T-cell malignancies have TCRB gene rearrangements, implyingthat the detection of TCRB or TCRG rearrangements is not
indicative of T cells of the ab or gd T-cell lineage, respectively,either.15,27,28
In addition to these crosslineage rearrangements, it has beenestablished that several lymphoid malignancies have unusual Ig/TCR gene rearrangement patterns. This information is availablein detail for precursor B-ALL and T-ALL, but not yet for mostother lymphoid malignancies.6
4. Pseudoclonality and oligoclonality: The erroneous detec-tion of a seemingly clonal or seemingly oligoclonal lymphoidcell population (pseudoclonality) is rare by Southern blotanalysis, unless genes with a limited combinatorial repertoire,such as TCRG or TCRD, are used. This might result in faintrearranged bands, for example, representing Vg9–Jg1.2 or Vd2–Jd1 rearrangements derived from antigen-selected TCRgdþ T-lymphocytes. This is, however, a well-known pitfall of Southernblot analysis and will not result in rearranged bands of highdensity.
Pseudoclonality in PCR-based clonality studies is moredifficult to recognize. The high sensitivity of PCR can causethe amplification of the few Ig or TCR gene rearrangementsderived from a limited number of B or T-cells in the tissuesample analyzed. In particular, the few reactive (polyclonal) Tcells in a small-needle biopsy or in a B-NHL sample with hightumor load might result in (oligo)clonal PCR products.Frequently, the amount of such PCR products is limited. Thisis particularly seen when TCRG genes are used as PCR targets.Duplicate or triplicate PCR analyses followed by mixing of theobtained PCR products should help to clarify whether theseemingly clonal PCR products are in fact derived from differentlymphocytes.
Finally, reactive lymph nodes can show reduced diversity ofthe Ig/TCR repertoire, caused by predominance of severalantigen-selected subclones (oligoclonality). In particular, lymphnodes or blood samples of patients with an active EBV or CMVinfection can show a restricted TCR repertoire or TCR geneoligoclonality. Also clinical pictures of immunosuppression arefrequently associated with restricted TCR repertoires, forexample, in transplant patients or patients with hairy cellleukemia.35 Recovery from transplantation and hematologicalremission are followed by restoration of the polyclonal TCRrepertoire.36,37
5. False-positive results: False-positive results are rare bySouthern blot analysis and can generally be prevented bychecking for underdigestion and by excluding polymorphicrestriction sites.21
False-positive PCR results have shown to be a seriousproblem, if no adequate analysis of the obtained PCR productsis performed to discriminate between monoclonal, oligoclonal,or polyclonal PCR products. Such discrimination can beachieved via single-strand conformation polymorphism analy-sis,38 denaturing gradient gel electrophoresis,39 heteroduplexanalysis,40,41 or GeneScanning.42,43 These techniques exploitthe junctional region diversity for discrimination betweenmonoclonal cells with identical junctional regions and poly-clonal cells with highly diverse junctional regions.
6. False-negative results: False-negative results are rare inSouthern blot analysis if appropriate J gene segment probes areused. Nevertheless, some uncommon rearrangements (generallynonfunctional rearrangements) might be missed, such as V–Drearrangements or deletions of the J regions.
PCR analysis of Ig and TCR genes might be hampered byfalse-negative results because of improper annealing of theapplied PCR primers to the rearranged gene segments. Thisimproper primer annealing can be caused by two differentphenomena. Firstly, precise detection of all different V, D, and J
PCR-based clonality studies in lymphoproliferationsJJM van Dongen et al
2260
Leukemia
gene segments would require many different primers (Table 2),which is not feasible in practice. Consequently, family primersare designed, which specifically recognize most or all membersof a particular V, D, or J family. Alternatively, consensus primersare used, which are assumed to recognize virtually all V and Jgene segments of the locus under study. Family primers andparticularly consensus primers are generally optimal for a part ofthe relevant gene segments, but show a lower homology (70–80%) to other gene segments. This may eventually lead tofalse-negative results, particularly in Ig/TCR genes with manydifferent gene segments. In TCRG and TCRD genes this problemis minimal, because of the limited number of different genesegments.
The second phenomenon is the occurrence of somatichypermutations in rearranged Ig genes of germinal center andpostgerminal center B-cell malignancies, particularly B-cellmalignancies with class-switched IGH genes.
Sufficient knowledge and experience can prevent the first fourpitfalls, because they mainly concern interpretation problems.The last two pitfalls concern technical problems, which can besolved by choosing reliable techniques for PCR product analysisand by the design of better primer sets.
Can Southern blot analysis be replaced by PCRtechnology?
Optimization of Southern blot analysis of Ig/TCR genes duringthe past 10 years has resulted in the selection of reliablecombinations of restriction enzymes (fragments between 2 and15 kb, avoiding polymorphic restriction sites) and probes(mainly downstream of J gene segments). Although Southernblot analysis is a solid ‘gold standard’ technique, manylaboratories have gradually replaced Southern blot analysis by
PCR technology, because PCR is fast, requires minimal amountsof medium-quality DNA, and has overall good sensitivity.
Despite the obvious advantages, replacement of Southern blotanalysis by PCR techniques for reliable Ig/TCR studies ishampered by two main technical problems:
� false-negative results due to improper primer annealing; and� difficulties in discrimination between monoclonal and poly-
clonal Ig/TCR gene rearrangements.
Several individual diagnostic laboratories tried to solve theproblems of the PCR-based clonality studies, but no reliablystandardized PCR protocols were obtained. In contrast, manydifferent primer sets are being used, which all differ in theirsensitivity and applicability. We therefore initiated theBIOMED-2 Concerted Action BMH4-CT98-3936, entitled‘PCR-based clonality studies for early diagnosis of lymphopro-liferative disorders’ with the aim to develop standardized PCRprotocols and PCR primer sets for clonality diagnostics.
Introduction
In order to introduce reliable and easy PCR technology forroutine clonality diagnostics in suspect lymphoproliferations,the BIOMED-2 Concerted Action BMH4-CT98-3936 hadtwo main objectives, addressed in two separate WorkPackages:
Work Package 1: Development and standardization of PCRprotocols and PCR primer sets for the detection of Ig andTCR gene rearrangements and well-defined chromosomeaberrations as targets for clonality assessment. This includedthe development of guidelines for interpretation of the resultsobtained.
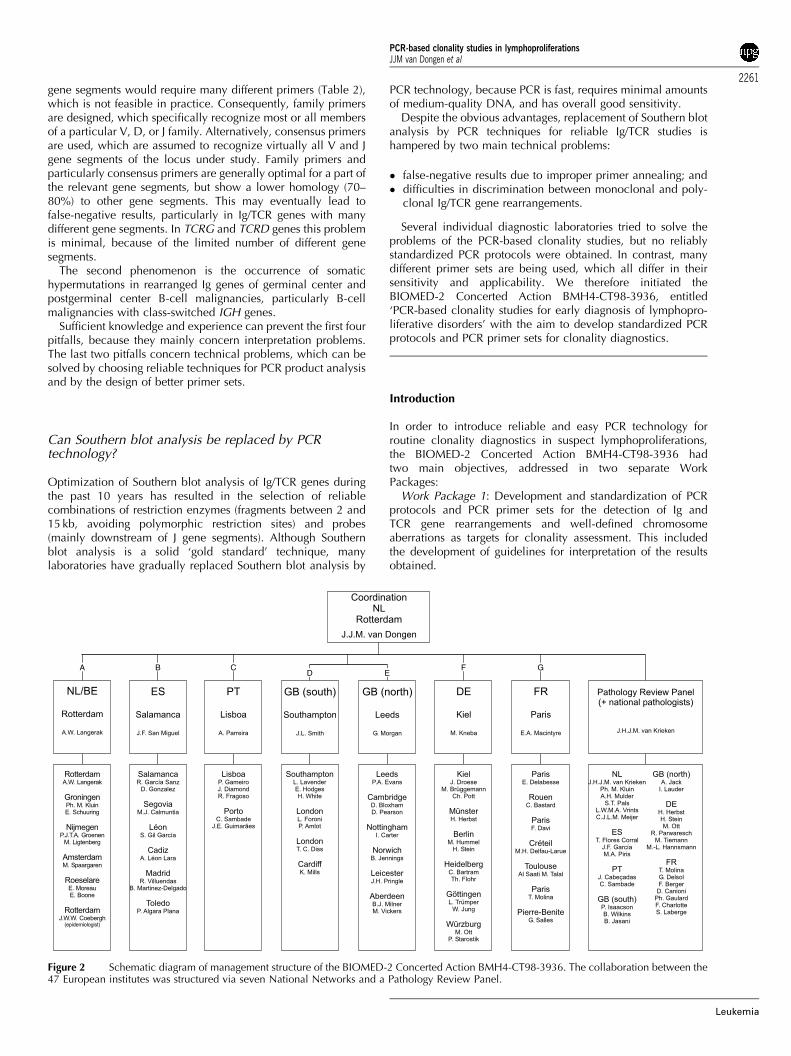
Figure 2 Schematic diagram of management structure of the BIOMED-2 Concerted Action BMH4-CT98-3936. The collaboration between the47 European institutes was structured via seven National Networks and a Pathology Review Panel.
PCR-based clonality studies in lymphoproliferationsJJM van Dongen et al
2261
Leukemia
Work Package 2: Evaluation of the applicability of thestandardized PCR protocols and PCR primer sets for clonalitystudies in the various categories of WHO-defined lymphoidmalignancies.
A total of 47 institutes from seven European countries(Netherlands, Belgium, Spain, Portugal, UK, Germany, andFrance) participated in the BIOMED-2 Concerted Action withone to four participants per institute (B90 active participants intotal). This included laboratory specialists in the field ofmolecular biology, immunology, hematology, and pathology.To facilitate the organization and management of this complexand large-scale European collaboration, the Concerted Actionactivities were organized via seven National Networks (eachcoordinated by a National Network Leader) and an internationalPathology Review Panel (Figure 2). The National Networksplayed a central role in the collection of tissue samples andcorresponding DNA samples for use in Work Packages 1 and 2.The national pathologists were responsible for reviewing allnationally collected samples. All difficult cases and a 10%randomly selected set of additional cases were reviewed by theinternational Pathology Review Panel (coordinator: JHJM vanKrieken).
Work Package 1 and most of Work Package 2 were performedin the period June 1998–November 2002, evaluated andcoordinated via a total of 12 international meetings (Table 3).This report describes the organization, experimentation, andresults of Work Package 1.
Materials and methods
Organization and experimentation of Work Package 1
Work Package 1 focused on the development of standardizedPCR protocols and PCR primer sets for the detection of clonallyrearranged Ig/TCR gene rearrangements and well-definedchromosome aberrations. This included the selection of thePCR targets, the development of PCR primer sets to be used inmultiplex tubes, and the selection of techniques for the analysisof PCR products.
Selection of PCR targets: aiming for complementarity
It was decided to aim for the availability of at least one PCR-detectable clonality target in each lymphoid malignancy.In mature B-cell malignancies this aim might be hamperedby the occurrence of somatic hypermutations in Ig genes,which are particularly found in germinal center and postgerm-inal center-derived B-cell malignancies. Therefore, it wasdecided to include PCR targets that have some degree ofcomplementarity.
Several rationales were used for target selection:
� IGH genes: not only complete VH–JH rearrangements butalso incomplete DH–JH rearrangements were included asPCR targets, because DH–JH rearrangements are probablynot affected by somatic hypermutation;
� IGK and IGL genes: both Ig light-chain genes were includedas PCR targets, because this increases the chance of finding aPCR-detectable Ig gene rearrangement in each mature B-cellmalignancy;
� IGK genes: not only Vk–Jk rearrangements were included, butalso rearrangements of the kappa deleting element (Kde),because they occur on one or both alleles in (virtually) allIglþ B-cell malignancies and in one-third of Igkþ B-cellmalignancies, and because Kde rearrangements are probablynot affected by somatic hypermutation;
� TCRB genes: both complete Vb–Jb and incomplete Db–Jbrearrangements, because complete and incomplete TCRBgene rearrangements occur in all mature TCRabþ T-cellmalignancies and also in many TCRgdþ T-cell malignancies;
� TCRG genes: this classical PCR clonality target is useful in allT-cell malignancies of the TCRgd and the TCRab lineage.
� TCRD genes: this is a potentially useful target in immature T-cell malignancies as well as in TCRgdþ T-cell malignancies;
� TCRA genes: this gene was not included as PCR target,because of its high degree of complexity with 54 V and 61 Jgene segments. Furthermore, all T-cell malignancies withTCRA gene rearrangements contain TCRB gene rearrange-ments and generally also have TCRG gene rearrangements;
Table 3 Meetings of the BIOMED-2 Concerted Action BMH4-CT98-3936
Date Town Type of meetinga Topicsa
June 1998 Rotterdam, Netherlands Network leaders (national) Organization/planning/financesOct 1998 Rotterdam, Netherlands General Presentation of participants/task divisions
primer design+testingJan 1999 Rotterdam, Netherlands Primer design Computerized primer design for WP1Nov 1999 Rotterdam, Netherlands Primer design Initial primer evaluation/Southern blot
evaluationJan 2000 Berlin, Germany General Primer evaluation/pathology reviewApril 2000 Dordrecht, Netherlands Network leaders (national/target) Primer evaluationJune 2000 Birmingham, UK Network leaders (national/target) Primer evaluation/plannings and organization
of WP2Nov 2000 Salamanca, Spain General General primer testing evaluation/pathology
reviewApril 2001 Paris, France Network leaders (national/target) Final primer approval/start testing WP2Sep 2001 Rotterdam, Netherlands Network leaders (national/target/disease) Initial WP2 evaluation/pathology reviewNov 2001 Rotterdam, Netherlands General Final WP2 evaluation/pathology reviewMay 2002 Siena, Italy EAHPb satellite symposium International presentation of WP1 and WP2
results for international audience
aThe Network Leaders meetings included: National Network leaders meeting for management and organization of the Work Packages; TargetNetwork leaders meetings for organization and evaluation of Work Package 1 (WP1); Disease Category Network leaders meeting for organizationand evaluation of Work Package 2 (WP2).bEAHP, European Association for Hematopathology.
PCR-based clonality studies in lymphoproliferationsJJM van Dongen et al
2262
Leukemia
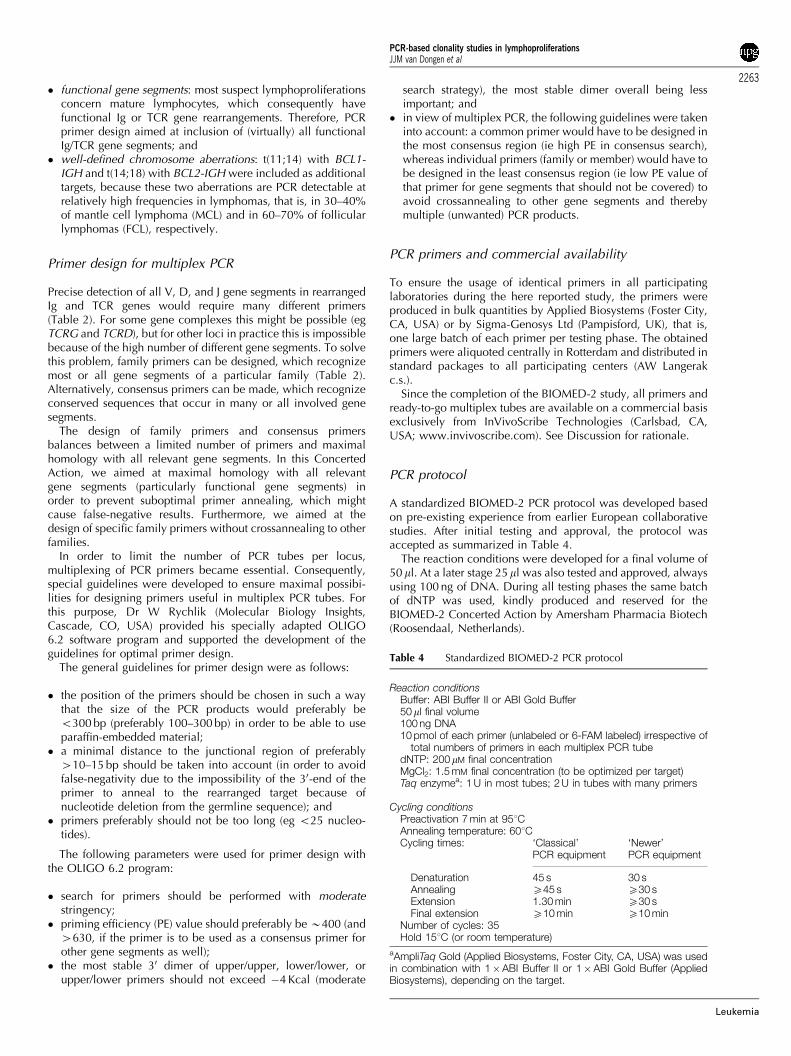
� functional gene segments: most suspect lymphoproliferationsconcern mature lymphocytes, which consequently havefunctional Ig or TCR gene rearrangements. Therefore, PCRprimer design aimed at inclusion of (virtually) all functionalIg/TCR gene segments; and
� well-defined chromosome aberrations: t(11;14) with BCL1-IGH and t(14;18) with BCL2-IGH were included as additionaltargets, because these two aberrations are PCR detectable atrelatively high frequencies in lymphomas, that is, in 30–40%of mantle cell lymphoma (MCL) and in 60–70% of follicularlymphomas (FCL), respectively.
Primer design for multiplex PCR
Precise detection of all V, D, and J gene segments in rearrangedIg and TCR genes would require many different primers(Table 2). For some gene complexes this might be possible (egTCRG and TCRD), but for other loci in practice this is impossiblebecause of the high number of different gene segments. To solvethis problem, family primers can be designed, which recognizemost or all gene segments of a particular family (Table 2).Alternatively, consensus primers can be made, which recognizeconserved sequences that occur in many or all involved genesegments.
The design of family primers and consensus primersbalances between a limited number of primers and maximalhomology with all relevant gene segments. In this ConcertedAction, we aimed at maximal homology with all relevantgene segments (particularly functional gene segments) inorder to prevent suboptimal primer annealing, which mightcause false-negative results. Furthermore, we aimed at thedesign of specific family primers without crossannealing to otherfamilies.
In order to limit the number of PCR tubes per locus,multiplexing of PCR primers became essential. Consequently,special guidelines were developed to ensure maximal possibi-lities for designing primers useful in multiplex PCR tubes. Forthis purpose, Dr W Rychlik (Molecular Biology Insights,Cascade, CO, USA) provided his specially adapted OLIGO6.2 software program and supported the development of theguidelines for optimal primer design.
The general guidelines for primer design were as follows:
� the position of the primers should be chosen in such a waythat the size of the PCR products would preferably beo300 bp (preferably 100–300 bp) in order to be able to useparaffin-embedded material;
� a minimal distance to the junctional region of preferably410–15 bp should be taken into account (in order to avoidfalse-negativity due to the impossibility of the 30-end of theprimer to anneal to the rearranged target because ofnucleotide deletion from the germline sequence); and
� primers preferably should not be too long (eg o25 nucleo-tides).
The following parameters were used for primer design withthe OLIGO 6.2 program:
� search for primers should be performed with moderatestringency;
� priming efficiency (PE) value should preferably be B400 (and4630, if the primer is to be used as a consensus primer forother gene segments as well);
� the most stable 30 dimer of upper/upper, lower/lower, orupper/lower primers should not exceed �4 Kcal (moderate
search strategy), the most stable dimer overall being lessimportant; and
� in view of multiplex PCR, the following guidelines were takeninto account: a common primer would have to be designed inthe most consensus region (ie high PE in consensus search),whereas individual primers (family or member) would have tobe designed in the least consensus region (ie low PE value ofthat primer for gene segments that should not be covered) toavoid crossannealing to other gene segments and therebymultiple (unwanted) PCR products.
PCR primers and commercial availability
To ensure the usage of identical primers in all participatinglaboratories during the here reported study, the primers wereproduced in bulk quantities by Applied Biosystems (Foster City,CA, USA) or by Sigma-Genosys Ltd (Pampisford, UK), that is,one large batch of each primer per testing phase. The obtainedprimers were aliquoted centrally in Rotterdam and distributed instandard packages to all participating centers (AW Langerakc.s.).
Since the completion of the BIOMED-2 study, all primers andready-to-go multiplex tubes are available on a commercial basisexclusively from InVivoScribe Technologies (Carlsbad, CA,USA; www.invivoscribe.com). See Discussion for rationale.
PCR protocol
A standardized BIOMED-2 PCR protocol was developed basedon pre-existing experience from earlier European collaborativestudies. After initial testing and approval, the protocol wasaccepted as summarized in Table 4.
The reaction conditions were developed for a final volume of50 ml. At a later stage 25ml was also tested and approved, alwaysusing 100 ng of DNA. During all testing phases the same batchof dNTP was used, kindly produced and reserved for theBIOMED-2 Concerted Action by Amersham Pharmacia Biotech(Roosendaal, Netherlands).
Table 4 Standardized BIOMED-2 PCR protocol
Reaction conditionsBuffer: ABI Buffer II or ABI Gold Buffer50ml final volume100 ng DNA10 pmol of each primer (unlabeled or 6-FAM labeled) irrespective of
total numbers of primers in each multiplex PCR tubedNTP: 200mM final concentrationMgCl2: 1.5 mM final concentration (to be optimized per target)Taq enzymea: 1 U in most tubes; 2 U in tubes with many primers
Cycling conditionsPreactivation 7 min at 951CAnnealing temperature: 601CCycling times: ‘Classical’ ‘Newer’
PCR equipment PCR equipment
Denaturation 45 s 30 sAnnealing X45 s X30 sExtension 1.30 min X30 sFinal extension X10 min X10 min
Number of cycles: 35Hold 151C (or room temperature)
aAmpliTaq Gold (Applied Biosystems, Foster City, CA, USA) was usedin combination with 1�ABI Buffer II or 1�ABI Gold Buffer (AppliedBiosystems), depending on the target.
PCR-based clonality studies in lymphoproliferationsJJM van Dongen et al
2263
Leukemia

MgCl2 was used at 1.5 mM final concentration, but neededoptimization for some multiplex PCR tubes (see later). In mosttubes 1 U of AmpliTaq Gold (Applied Biosystems) was used, butin tubes with many primers (415), 2 U of AmpliTaq Gold wereused.
The cycling conditions started with preactivation of theAmpliTaq Gold for 7 min at 951C. The cycling times of thesubsequent 35 amplification cycles were dependent on the PCRequipment (classical equipment vs newer and faster equipment).See Table 4 for details.
Techniques for the analysis of PCR products obtainedfrom Ig/TCR gene rearrangements
The PCR products obtained from Ig and TCR gene rearrange-ments have to be analyzed for discrimination between mono-clonal lymphoid cells with identical junctional regions andpolyclonal lymphoid cells with highly diverse junctionalregions.
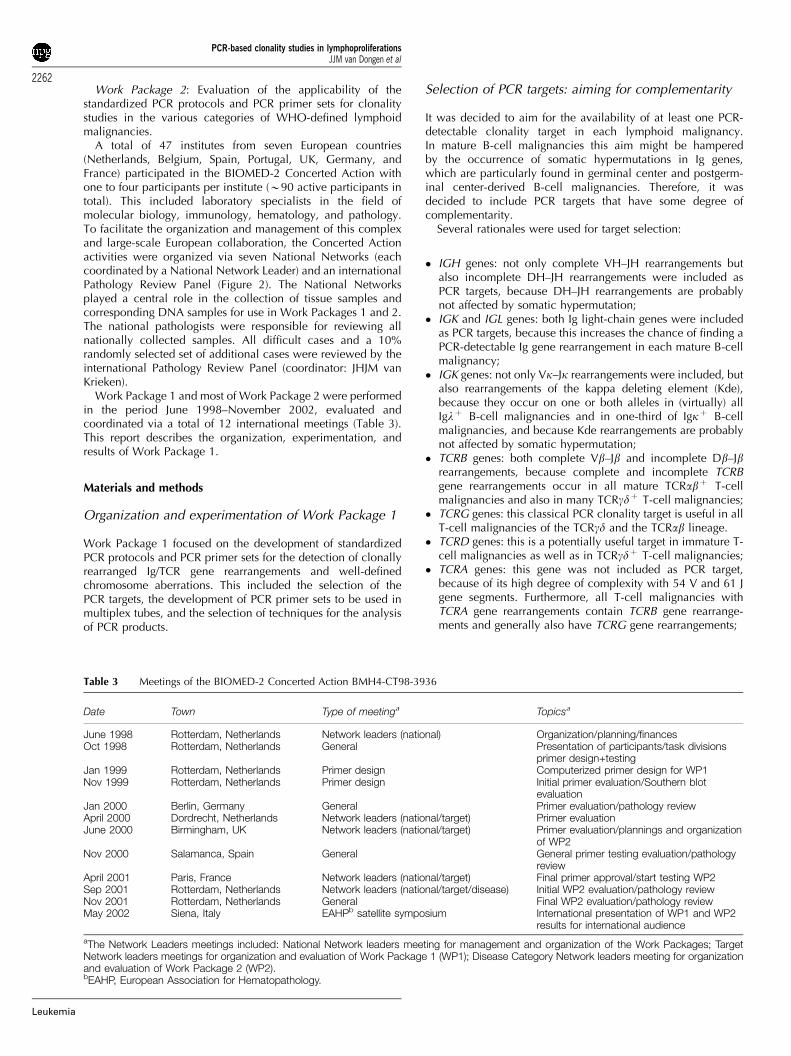
Based on the combined experience of the participatinglaboratories, two techniques were selected: heteroduplexanalysis and GeneScanning. Heteroduplex analysis uses dou-ble-stranded PCR products and takes advantage of the lengthand composition of the junctional regions, whereas in Gene-Scanning single-stranded PCR products are separated in a high-resolution gel or polymer according to their length only(Figure 3).
Heteroduplex analysis of PCR products: PCR productsobtained with unlabeled primers are denatured at hightemperature (B951C for 5 min), followed by rapid randomrenaturation at low temperature (preferably at 41C for 1 h). Thisenforced duplex formation results in many different hetero-duplexes with different migration speed in case of polyclonallymphoproliferations, but results in homoduplexes with iden-tical rapid migration in case of monoclonal lymphoprolifera-tions. Electrophoresis of the homoduplexes in a 6%polyacrylamide gel results in a single band within a predictablesize range, whereas the heteroduplexes form a smear at a higherposition (Figure 3).
The heteroduplex technique is rapid, simple, and cheap(Table 5), and has a detection limit of B5%.40,41 The detectionlimit is influenced by the frequency of polyclonal lymphocytes,because the formation of many heteroduplexes will alsoconsume a part of the monoclonal PCR products.41 Sinceheteroduplex analysis separates PCR products on the basis ofjunctional diversity in addition to PCR product size, it isparticularly useful in the analysis of loci with restrictedjunctional diversity.
GeneScanning of PCR products: The PCR primers forGeneScanning need to be labeled with a fluorochrome to allowdetection of the PCR products with automated sequencingequipment (Figure 3).
The fluorochrome-labeled single-strand (denatured) PCRproducts are size separated in a denaturing polyacrylamide
a
b
c
Figure 3 Schematic diagram of heteroduplex analysis and GeneScanning of PCR products, obtained from rearranged Ig and TCR genes. (a)Rearranged Ig and TCR genes (IGH in the example) show heterogeneous junctional regions with respect to size and nucleotide composition.Germline nucleotides of V, D, and J gene segments are given in large capitals and randomly inserted nucleotides in small capitals. The junctionalregion heterogeneity is employed in heteroduplex analysis (size and composition) and GeneScanning (size only) to discriminate between productsderived from monoclonal and polyclonal lymphoid cell populations. (b) In heteroduplex analysis, PCR products are heat denatured (5 min, 941C)and subsequently rapidly cooled (1 h, 41C) to induce duplex (homo- or heteroduplex) formation. In cell samples consisting of clonal lymphoidcells, the PCR products of rearranged IGH genes give rise to homoduplexes after denaturation and renaturation, whereas in samples that containpolyclonal lymphoid cell populations the single-strand PCR fragments will mainly form heteroduplexes, which result in a background smear ofslowly migrating fragments upon electrophoresis. (c) In GeneScanning fluorochrome-labeled PCR products of rearranged IGH genes are denaturedprior to high-resolution fragment analysis of the resulting single-stranded fragments. Monoclonal cell samples will give rise to PCR products ofidentical size (single peak), whereas in polyclonal samples many different IGH PCR products will be formed, which show a characteristic Gaussiansize distribution.
PCR-based clonality studies in lymphoproliferationsJJM van Dongen et al
2264
Leukemia

sequencing gel or capillary sequencing polymer and detectedvia automated scanning with a laser (see Table 6 for technicaldetails). This results in a Gaussian distribution of multiple peaks,representing many different PCR products in case of polyclonallymphoproliferations, but gives a single peak consisting of onetype of PCR product in case of a fully monoclonal lymphopro-liferation (Figure 3).
GeneScanning is rapid and relatively simple, but needsexpensive equipment. GeneScanning is generally more sensitivethan heteroduplex analysis and can reach sensitivities of 0.5–1%of clonal lymphoid cells. In addition, the precise determinationof the size of the PCR product can potentially be used for globalmonitoring of the clonal proliferation during follow-up of thepatient.
Development and testing of new primers and multiplextubes in two phases
Phase 1: Development and initial testing of primers: AllPCR primers for the detection of Ig and TCR rearrangements aswell as for BCL1 and BCL2 rearrangements were newlydesigned. This concerned a total of 108 primers for the nineselected PCR targets: IGH VH–JH, IGH DH–JH, IGK, IGL, TCRB,TCRG, TCRD, BCL1-IGH, and BCL2-IGH.
Initial testing was performed in nine small Target Networks(one network per target) of three to five experienced labora-tories. The new primers were tested in parallel to in-house PCRprimer sets, using in-house positive controls (cell lines andpatient material) with well-defined rearrangements. The 108initial primers were tested in single PCR analyses, implying thatapproximately 425 PCR primer combinations had to beevaluated.
Whenever needed, the primers were redesigned (11% of theprimers) and tested again. Finally, the primers were combinedinto 18–21 multiplex tubes, which appeared to give reprodu-cible results within the small networks. Finally, 107 primers in18 multiplex tubes were approved.
Phase 2: General testing on 90 Southern-blot definedDNA samples: After approval of the new PCR primers andmultiplex tubes, a total of 30 PCR laboratories were involved inthe general testing of the multiplex tubes: five to 20 laboratorieswere performing the general testing of each PCR target. Alllaboratories used the same DNA samples, extracted from 90freshly collected or frozen malignant or reactive samples,derived from the seven national networks.
All 90 samples were evaluated for their cytomorphology orhistomorphology and for their immunophenotype by the local ornational hematologists or pathologists. Difficult cases were alsoevaluated by the Pathology Review Panel (Figure 2). The 90selected cases could be clustered as follows:
� eight prefollicular B-cell malignancies: one precursor-B-ALLand seven MCL;
� 16 cases of B-cell chronic lymphocytic leukemia (B-CLL);� 25 (post)follicular B-cell malignancies, including 11 cases of
FCL and 11 cases with diffuse large B-cell lymphoma(DLBCL);
� 18 T-cell malignancies, including several T-ALL and periph-eral T-NHL;
� 15 reactive lesions, particularly reactive lymph nodes andtonsils; and
� eight cases of miscellaneous origin, for example, three casesof T-cell-rich B-NHL.
The DNA samples of the General Testing phase were carefullyanalyzed for their clonality status by Southern blotting ofthe IGH, IGK, IGL, TCRB, TCRG, and TCRD genes, using theIGHJ6, IGKJ5, IGKDE, IGKC, IGLC1D, IGLJ2, TCRBJ1, TCRBJ2,TCRBC, TCRGJ13, TCRGJ21, and TCRDJ1 probes in EcoRI,HindIII, BglII, BamHI, and PstI digests.22–28 The probe/enzymecombinations and the preferred successive hybridizations aresummarized in Table 7. The Southern blot analyseswere performed by eight laboratories and coordinated inRotterdam by AW Langerak c.s. The results are summarizedin Table 8.
In practice, the 90 DNA samples represented a typical broadspectrum of pathology samples with sufficient diversity for theGeneral Testing of the PCR primers and multiplex tubes in the30 PCR laboratories.
Control genes and paraffin-embedded tissues
In several European countries, fresh tissue material is not easilyavailable for molecular diagnostics such as PCR-based clonalitystudies. Therefore, one of the aims of the BIOMED-2 ConcertedAction was to develop a strategy for PCR-based clonality studiesin paraffin-embedded tissues.
To control for the quality and amplifiability of DNA fromparaffin-embedded material, a special multiplex control genePCR was developed, resulting in a ladder of five fragments (100,200, 300, 400, and 600 bp).
From 45 of the aforementioned 90 cases sufficient paraffin-embedded tissue was available for DNA extraction. These DNAsamples were tested in parallel to the freshly obtained DNAsamples, using the Control Gene multiplex tube as well as the Ig/
Table 5 Standardized protocol for heteroduplex analysis of PCRproducts
PCR product preparationTube with 10–20ml of PCR productDenaturation of PCR product: 5 min at 951CReannealing of PCR product: 60 min at 41C
Electrophoresis conditions (noncommercial polyacrylamide gels)Gel: 6% nondenaturing polyacrylamide (acrylamide: bisacrylamide
ratio of 29:1)Buffer: ratio of 0.5� TBELoading buffer: 5 ml ice-cold nondenaturing bromophenol blue loading
bufferElectrophoresis: typically 2–3 h at 110 V or overnight at 40–50 V a
Electrophoresis conditions (commercial polyacrylamide gels)Gel: nondenaturing polyacrylamide (eg BioRad PreCast Gel System or
Amersham Pharmacia Biotech Gene Gel Excel Kit)Buffer: 1� TBELoading buffer: ice-cold nondenaturing bromophenol blue loading
bufferElectrophoresis: 1.5 h at 100 V
VisualizationStaining: 5–10 min in 0.5mg/ml EtBr in H2ODestaining/washing: 2� 5–10 min in H2OVisualization: UV illuminationAlternative: silver staining using Amersham Pharmacia Biotech DNA
Silver stain kit
aVoltage and electrophoresis time depend on PCR amplicon sizes,thickness of polyacrylamide gel, and type of PCR equipment, andshould be adapted accordingly.
PCR-based clonality studies in lymphoproliferationsJJM van Dongen et al
2265
Leukemia

TCR/BCL1/BCL2 multiplex tubes for clonality diagnostics (seeSection 10).
Presentation of the results per PCR target
The coordination of the Initial Testing and General Testing of thePCR primers for each PCR target was coordinated by thefollowing Target Network Leaders: IGH (V–J), M Hummel(Berlin, Germany) and R Garcia Sanz (Salamanca, Spain); IGH(D–J), AW Langerak (Rotterdam, Netherlands); IGK, AWLangerak; IGL, F Davi (Paris, France); TCRB, M Bruggemann(Kiel, Germany); TCRG, EA Macintyre (Paris, France); TCRD, FLLavender (Southampton, UK); BCL1-IGH, E Schuuring (Gronin-gen, Netherlands); BCL2-IGH, PAS Evans (Leeds, UK); andcontrol genes, HE White (Southampton, UK).
The results of these 10 Target Networks are described in 10sections, followed by a General Discussion.
SECTION 1. Complete IGH gene rearrangements: VH–JH
M Hummel1, R Garcıa-Sanz2, D Gonzalez2, A Balanzategui2,PAS Evans3, F Davi4, E Delabesse5, E Schuuring6,7, MSpaargaren8, GI Carter9, M Bruggemann10, P Algara11, A Jack12,L Trumper13 and TJ Molina14
1lnstitute of Pathology, Free University Berlin, Germany;2Servicio de Hematologia, Hospital Universitario de Salamanca,Spain; 3Academic Unit of Haematology and Oncology, Uni-versity of Leeds, Leeds, UK; 4Department of Hematology,Hopital Pitie-Salpetriere, Paris, France; 5Laboratoire d’Hemato-logie and INSERM EMI 210, Hopital Necker-Enfants Malades,Paris, France; 6Department of Pathology, Leiden UniversityMedical Center, The Netherlands; 7Department of Pathologyand Laboratory Medicine, University Medical Center Gronin-gen, The Netherlands; 8Department of Pathology, AcademicMedical Center, Amsterdam, The Netherlands; 9Department of
Table 6 Standardized protocol for GeneScanning of PCR products
A. Gel-based sequencersPCR product preparation1. PCR product dilution: initially 1:10 in formamide or H2O (can be altered if fluorescent signal is outside optimal range; see electrophoresisconditions)2. Sample volume: 2ml diluted PCR product3. Loading buffer volume: 0.5 ml blue dextran loading buffer+0.5ml TAMRA internal standard+2ml deionized formamide4. Denaturation of PCR product: 2 min at 951C or higher temperature5. Cooling of PCR product at 41C
Electrophoresis conditions6. Gel: 5% denaturing polyacrylamide7. Buffer: 1�TBE8. Electrophoresis: 2–3.5 ha (see Table 25)9. Optimal fluorescent signal intensity:
600–4000 fluorescent units (373 platforms)400–7000 fluorescent units (377 platforms)
B. Capillary sequencers (to be optimized per sequencer)PCR product preparation1. 1 ml PCR product (volume of PCR product or sampling times can be altered if fluorescent signal is outside optimal range; see electrophoresisconditions)2. Sample volume: 1ml PCR product+9.5ml (Hi-Di) formamide+0.5ml ROX-400 heteroduplex analysis internal standard3. Denaturation of PCR product: 2 min at 951C or higher temperature4. Cooling of PCR product at 41C for an hour
Electrophoresis conditions5. Polymer: e.g. 3100 POP4 polymer6. Buffer: e.g. 1�3100 buffer with EDTA7. Electrophoresis: 45 minb
8. Optimal fluorescent signal intensity:Up to 10 000 fluorescent units
aElectrophoresis time depends on amplicon sizes and on employed platform.bFor 36 cm capillary; time taken depends on the capillary used.
Table 7 Southern blot hybridization scheme for consecutive Ig/TCR probe hybridizations per digesta
Restriction enzyme 1sthybridization
2nd
hybridization3rdhybridization
4thhybridization
5thhybridization
Additional hybridizationround (optional)
EcoRI TCRBJ2 TCRBJ1 TCRGJ13 TCRDJ1 (TCRBC)HindIII TCRBJ2 TCRBJ1 TCRDJ1 IGLC1DBglII IGHJ6 IGKJ5 IGKDE IGLC1D IGLJ2 (IGKC)BamHI/HindIII IGHJ6 IGKJ5 IGKDEPstI TCRGJ21
aSee Beishuizen et al,22,24 Breit et al,23 Tumkaya et al,25,26 Moreau et al,27 and Langerak et al28 for detailed information about preferred restrictionenzyme digest and position of probe per locus.
PCR-based clonality studies in lymphoproliferationsJJM van Dongen et al
2266
Leukemia
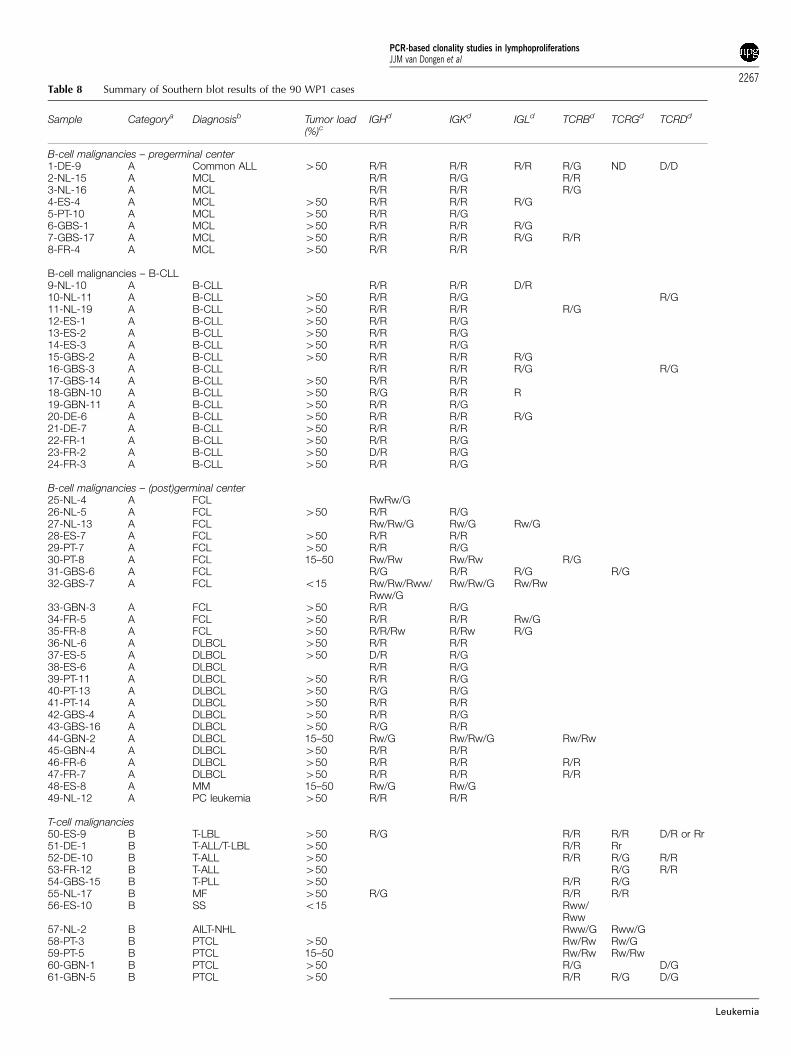
Table 8 Summary of Southern blot results of the 90 WP1 cases
Sample Categorya Diagnosisb Tumor load(%)c
IGHd IGKd IGLd TCRBd TCRGd TCRDd
B-cell malignancies – pregerminal center1-DE-9 A Common ALL 450 R/R R/R R/R R/G ND D/D2-NL-15 A MCL R/R R/G R/R3-NL-16 A MCL R/R R/R R/G4-ES-4 A MCL 450 R/R R/R R/G5-PT-10 A MCL 450 R/R R/G6-GBS-1 A MCL 450 R/R R/R R/G7-GBS-17 A MCL 450 R/R R/R R/G R/R8-FR-4 A MCL 450 R/R R/R
B-cell malignancies – B-CLL9-NL-10 A B-CLL R/R R/R D/R10-NL-11 A B-CLL 450 R/R R/G R/G11-NL-19 A B-CLL 450 R/R R/R R/G12-ES-1 A B-CLL 450 R/R R/G13-ES-2 A B-CLL 450 R/R R/G14-ES-3 A B-CLL 450 R/R R/G15-GBS-2 A B-CLL 450 R/R R/R R/G16-GBS-3 A B-CLL R/R R/R R/G R/G17-GBS-14 A B-CLL 450 R/R R/R18-GBN-10 A B-CLL 450 R/G R/R R19-GBN-11 A B-CLL 450 R/R R/G20-DE-6 A B-CLL 450 R/R R/R R/G21-DE-7 A B-CLL 450 R/R R/R22-FR-1 A B-CLL 450 R/R R/G23-FR-2 A B-CLL 450 D/R R/G24-FR-3 A B-CLL 450 R/R R/G
B-cell malignancies – (post)germinal center25-NL-4 A FCL RwRw/G26-NL-5 A FCL 450 R/R R/G27-NL-13 A FCL Rw/Rw/G Rw/G Rw/G28-ES-7 A FCL 450 R/R R/R29-PT-7 A FCL 450 R/R R/G30-PT-8 A FCL 15–50 Rw/Rw Rw/Rw R/G31-GBS-6 A FCL R/G R/R R/G R/G32-GBS-7 A FCL o15 Rw/Rw/Rww/
Rww/GRw/Rw/G Rw/Rw
33-GBN-3 A FCL 450 R/R R/G34-FR-5 A FCL 450 R/R R/R Rw/G35-FR-8 A FCL 450 R/R/Rw R/Rw R/G36-NL-6 A DLBCL 450 R/R R/R37-ES-5 A DLBCL 450 D/R R/G38-ES-6 A DLBCL R/R R/G39-PT-11 A DLBCL 450 R/R R/G40-PT-13 A DLBCL 450 R/G R/G41-PT-14 A DLBCL 450 R/R R/R42-GBS-4 A DLBCL 450 R/R R/G43-GBS-16 A DLBCL 450 R/G R/R44-GBN-2 A DLBCL 15–50 Rw/G Rw/Rw/G Rw/Rw45-GBN-4 A DLBCL 450 R/R R/R46-FR-6 A DLBCL 450 R/R R/R R/R47-FR-7 A DLBCL 450 R/R R/R R/R48-ES-8 A MM 15–50 Rw/G Rw/G49-NL-12 A PC leukemia 450 R/R R/R
T-cell malignancies50-ES-9 B T-LBL 450 R/G R/R R/R D/R or Rr51-DE-1 B T-ALL/T-LBL 450 R/R Rr52-DE-10 B T-ALL 450 R/R R/G R/R53-FR-12 B T-ALL 450 R/G R/R54-GBS-15 B T-PLL 450 R/R R/G55-NL-17 B MF 450 R/G R/R R/R56-ES-10 B SS o15 Rww/
Rww57-NL-2 B AILT-NHL Rww/G Rww/G58-PT-3 B PTCL 450 Rw/Rw Rw/G59-PT-5 B PTCL 15–50 Rw/Rw Rw/Rw60-GBN-1 B PTCL 450 R/G D/G61-GBN-5 B PTCL 450 R/R R/G D/G
PCR-based clonality studies in lymphoproliferationsJJM van Dongen et al
2267
Leukemia

Molecular Diagnostics and Histopathology, Nottingham CityHospital, UK; 10II Medizinische Klinik des UniversitatsklinikumsSchleswig-Holstein, Campus Kiel, Germany; 11Unidad deGenetica, Hospital Virgen de la Salud, Toledo, Spain; 12Depart-ment of Molecular Haematology, Leeds General Hospital,Leeds, UK; 13Department of Internal Medicine, Georg AugustUniversitat, Gottingen, Germany; and 14Deptartment of Pathol-ogy, Hotel-Dieu de Paris, France
Background
The functional rearrangement of the IGH gene, first DH to JHand subsequently V to DH–JH, is followed by antibodyexpression, the hallmark of mature B cells. The IGH gene islocated on chromosome 14q32.3 in an area covering approxi-
mately 1250 kb. In all, 46–52 functional VH segments (depend-ing on the individual haplotype) have been identified, whichcan be grouped according to their homology in six or seven VHsubgroups. In addition, approximately 30 nonfunctional VHsegments have been described. Furthermore, 27 functional DHsegments and six functional JH segments have been consistentlyfound (Table 2 and Figure 4a).44 The most frequently used VHgene segments in normal and malignant B cells belong to theVH3 family (30–50%), VH4 family (20–30%), and VH1 family(10–20%), together covering 75–95% of VH usage (Table 9).45–47
However, in precursor B-ALL also VH6 gene segments are usedrelatively frequent.48
The VH segments contain three framework (FR) and twocomplementarity-determining regions (CDRs) (Figure 4b). TheFRs are characterized by their similarity among the various VHsegments, whereas the CDRs are highly different even within the
62-FR-9 B PTCL 15–50 Rww/G Rww/G63-FR-10 B PTCL 450 R/R R/R D/D64-NL-18 B PTCL 15–50 Rw/G Rw/G65-PT-4 B EATL o15 Rw/G Rw/G66-NL-3 B ALCL 450 R/R R/G67-NL-1 B T-LGL o15 Rww/
RwwRww/Rww
Reactive lesions68-ES-14 C Normal PB NA69-PT-2 C Normal PB NA70-FR-14 C Normal PB NA71-NL-7 C Reactive tonsil NA72-NL-8 C Reactive tonsil NA73-NL-14 C Reactive tonsil NA74-ES-11 C Reactive tonsil NA75-ES-13 C Reactive tonsil NA76-GBS-11 C Reactive tonsil NA77-GBS-12 C Reactive tonsil NA78-GBS-13 C Reactive tonsil NA79-PT-1 C Reactive LN NA80-GBN-7 C Reactive LN NA81-GBN-9 C Reactive LN NA82-DE-5 C Reactive LN NA
Miscellaneous83-PT-9 D MZL (splenic) 450 Rw/G Rw/G84-PT-12 D DLBCL 450 Rw/Rw/G85-PT-6 D T-cell-rich B-NHL 15–50 Oligo Oligo Rw/Rw86-DE-2 D T-cell-rich B-NHL o587-GBS-9 D T-cell-rich B-NHL o588-GBS-10 D T-LBL ? 450 R/G R/R R/G89-GBN-8 D Hypocellular-
regenerating BM450 R/R R/R R/G
90-ES-12 D Hodgkin’s diseaseand few B cells
NA
aFour categories of WP1 cases were identified: A, clonal B-cell malignancies (pregerminal center, B-CLL, germinal center/postgerminal center); B,clonal T-cell malignancies; C, reactive lesions without clonal Ig/TCR gene rearrangements; D, miscellaneous, that is, cases that were difficult toclassify in any of the other categories and/or showing unexpected Ig/TCR gene results.bDiagnosis: ALL, acute lymphoblastic leukemia; MCL, mantle cell lymphoma; B-CLL, B-cell chronic lymphocytic leukemia; FCL, follicular center celllymphoma; DLBCL, diffuse large B-cell lymphoma; MM, multiple myeloma; PC leukemia, plasma cell leukemia; T-LBL, T-cell lymphoblasticlymphoma; T-ALL, T-cell acute lymphoblastic leukemia; T-PLL, T-cell prolymphocytic leukemia; MF, mycosis fungoides; SS, Sezary syndrome; AIT-NHL, angioimmunoblastic T-cell lymphoma; PTCL, peripheral T-cell lymphoma; EATL, entropathy type T-cell lymphoma; ALCL, anaplastic large-celllymphoma; T-LGL, T-cell large granular lymphocyte leukemia; MZL, marginal zone lymphoma.cTumor load: In most cases at least 50% tumor cells were present; in some cases 15 to 50%, and in six cases o15%. Finally, in nine cases thetumor load could not be estimated.dRearrangement patterns of IGH, IGK, IGL, TCRB, TCRG and TCRD genes: R, rearranged allele; D, deleted allele; G, germline allele; ND, notdetermined; Rw, weak rearranged band; Rww, very weak rearranged band; Rr, two comigrating rearranged bands.NA¼ not applicable.
Table 8 Continued
Sample Categorya Diagnosisb Tumor load(%)c
IGHd IGKd IGLd TCRBd TCRGd TCRDd
PCR-based clonality studies in lymphoproliferationsJJM van Dongen et al
2268
Leukemia

same VH family. Furthermore, the CDRs represent the preferredtarget sequences for somatic hypermutations in the course of thegerminal center reaction, which increase the variability withinthose regions. Although the FRs are usually less affected by somaticmutations, nucleotide substitutions may also occur within theseregions, especially in B cells under a heavy mutational process.
The highly variable V–D–JH regions can be amplified by PCRto detect clonal B-cell populations indicative of the presence ofa malignant B-cell disorder. Clonal B cells can be discriminatedfrom polyclonal B cells (ie normal or reactive lymphoid tissues)based on the identical size and composition of the clonal PCRproducts as compared to the many different polyclonal PCRproducts with a size range of approximately 60 bp, arranged in aGaussian distribution. PCR-based strategies for the detection ofclonal B-cell populations in histological sections and cellsuspensions have already been established in the early 1990s.However, the initial PCR protocols used single VH consensusprimers, which were able to bind to one of the three FR regions,mainly FR3. Such consensus primers were not suitable toamplify all VH segments with the same efficiency leading tonondetectability of a significant number of clonal rearrange-ments. In addition, somatic mutations introduced in the courseof the germinal center reaction are not restricted to the CDRs,but can also occur in FRs, thereby preventing primer annealingand consequently leading to the absence of clonal PCR productsdespite the presence of a neoplastic B-cell population. This isespecially true for FCLs, diffuse large B-cell lymphomas, andmultiple myelomas, which usually contain high numbers ofsomatic mutations.
To further increase the detection rate of the IGH PCR, severalattempts have been made to design family-specific primers toovercome the limitations of consensus primers. However, thesefamily-specific primers are largely based on the sequences of theprevious consensus primers. Although these PCR strategies havehelped to improve the detection rate, there is still a need ofprimer systems, which are less sensitive to somatic hypermuta-tions, thus allowing the amplification of (virtually) all possibleV–D–JH rearrangements.
Primer design
According to the BIOMED-2 guidelines, three sets of VH primerswere designed with the help of the OLIGO 6.2 programcorresponding to the three VH FR regions (FR1, FR2, and FR3)(Figure 4b). Each set of primers consisted of six or sevenoligonucleotides capable of annealing to their correspondingVH segments (VH1–VH7) with no mismatches for most VHsegments and one or at most two mismatches for some rare VHsegments. The design was such that mismatches would belocated at the very 50-end of the primer. These VH primer setswere used in conjunction with a single JH consensus primer,designed to anneal to the most homologous 30-end of the six JHsegments, approximately 35 bp downstream of the JH RSS. Thisensures that all JH segments are detectable with the samebinding efficiency and that the primer binding will not easily beaffected by extensive nucleotide deletion in the course of therearrangement process. In addition, there was no crossannealingbetween the VH primers and the JH primer as evaluated by theOLIGO 6.2 program.
The JH primer was also designed to be used for theamplification of other PCR targets, such as incomplete DH–JHrearrangements as well as t(11;14) (BCL1-IGH) and t(14;18)(BCL2-IGH). This allows the detection of different PCR productsby GeneScanning employing the same labeled JH primer.
Results of initial testing phase
The initial testing of the newly designed VH–JH PCR was carriedout by separate application of each VHprimer together with theJH primer in an individual PCR. For this purpose, DNA extractedfrom B-cell lines and well-defined clonal patient samples wereused. Furthermore, clonal rearrangements were tested forsensitivity by serial dilution in DNA extracted from reactivetonsils. Clonal control samples were not available for eachpossible IGH rearrangement, but all major VH segments andseveral rarely rearranged VH segments have been included inthe initial testing phase.
All primer pairs worked with high efficiency and sensitivity.The expected clonal VH rearrangements were detectable andthe sensitivity was at least 1% (10�2). There was no backgroundwithin the expected size range and the amplification of ton-sillar DNA gave the expected Gaussian distribution curve(Figure 4c–e).
Based on these results, we started the next phase of the initialprimer testing by combining the VH primers into three sets, eachspecific for one of the three FR regions, which were usedtogether with the common JH primer (Figure 4b). The resultswere the same as those obtained with single primer pairs, butwith a slightly lower sensitivity. In addition, no nonspecificproducts were amplified within the expected size range, withthe exception of a 340 bp PCR product, which appeared in theFR1 multiplex PCR. This PCR product was generated irrespec-tive of the source of the DNA (lymphoid and nonlymphoid) usedfor PCR, whereas no PCR product was obtained when no DNAtemplate was applied. Furthermore, this amplicon was onlydetectable in heteroduplex analysis, not in GeneScanning. Thisindicates that the fluorescent-labeled JH primer was notinvolved in the generation of this PCR product. Sequenceanalysis of this PCR product disclosed a VH4 fragment amplifiedby the FR1 VH4 primer in conjunction with the FR1 VH2primer, which apparently acted as a downstream primer bybinding to the intronic VH4 sequence. This problem was solvedby designing a new FR1 VH2 primer that was located 25 bpupstream to the previous primer binding site.
Results of general testing phase
The approved IGH PCR was applied to the 90 Southern blot-defined DNA samples, which were derived from well-char-acterized cases. Six of the 11 laboratories involved in thegeneral testing phase performed GeneScanning of the PCRproducts and five performed heteroduplex analysis. In addition,several polyclonal as well as monoclonal samples (cell lineDNA) were included as controls; 45 of these cases displayeddominant PCR products after GeneScanning and 40 cases afterheteroduplex analysis, indicating the presence of a monoclonalB-cell population. The clonal rearrangements were detectablewith all three FR primer sets in 33 of the 45 clonal cases(GeneScanning), and in the remaining 12 with one or two of thethree FR primer sets. It was concluded that most negative resultswere caused by somatic hypermutations in the primer bindingsite, preventing primer annealing and thus amplification.
The comparison of the VH–JH PCR results with the Southernblot results revealed a high degree of concordance: 85% (46 outof 55) and 76% (42 out of 55) of the samples with rearranged JHgenes by Southern blot analysis showed a dominant amplifica-tion product by GeneScanning and heteroduplex analysis,respectively. In contrast, all but two samples harboring germline
PCR-based clonality studies in lymphoproliferationsJJM van Dongen et al
2269
Leukemia

a
b
Figure 4 PCR analysis of IGH (VH–JH) rearrangements. (a) Schematic diagram of IGH gene complex on chromosome band 14q32.3 (adaptedfrom ImMunoGeneTics database).62,63 Only rearrangeable nonpolymorphic VH gene segments are included in blue (functional VH) or in gray(rearrangeable pseudogenes). Recently discovered (generally truncated) VH pseudogenes are not indicated. (b) Schematic diagram of IGH VH–JHrearrangement with three sets of VH primers and one JH consensus primer, combined in three multiplex tubes. The relative position of the VH andJH primers is given according to their most 50 nucleotide upstream (�) or downstream (þ ) of the involved RSS. The VH gene segment used as arepresentative VH family member for primer design is indicated in parentheses. (c, d, and e) Heteroduplex analysis and GeneScanning of the samepolyclonal and monoclonal cell populations, showing the typical heteroduplex smears and homoduplex bands (left panels) and the typicalpolyclonal Gaussian curves and monoclonal peaks (right panels). The approximate distribution of the polyclonal Gaussian curves is indicated in nt.
PCR-based clonality studies in lymphoproliferationsJJM van Dongen et al
2270
Leukemia
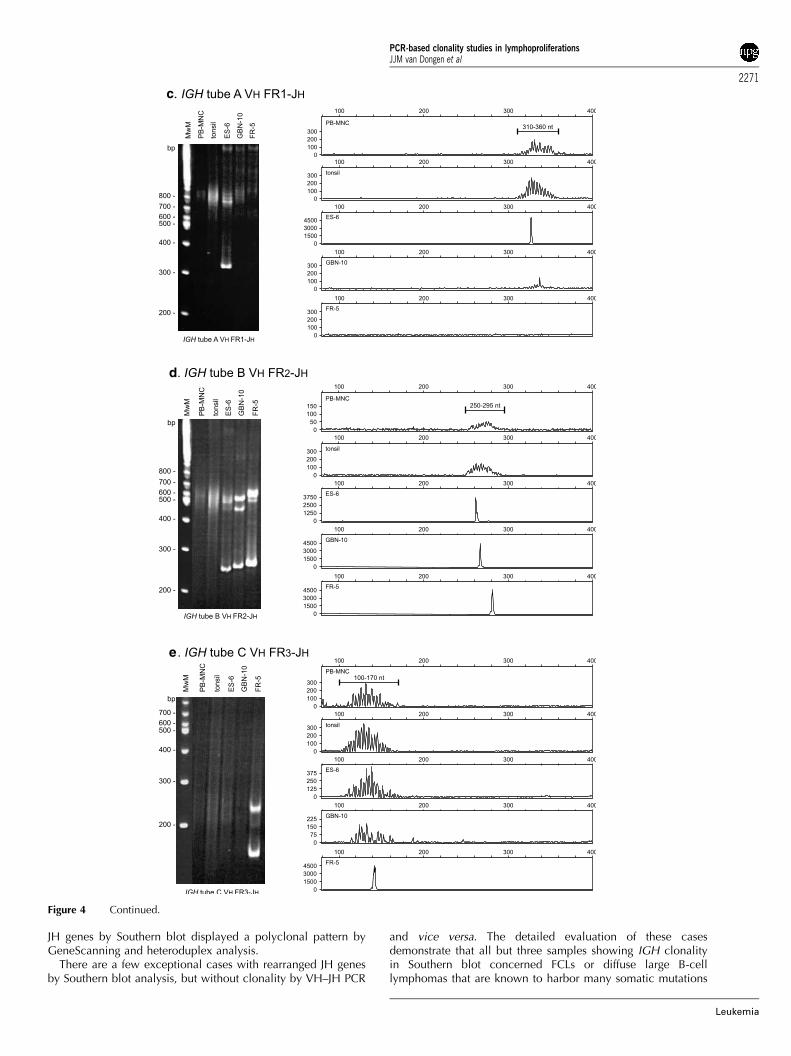
JH genes by Southern blot displayed a polyclonal pattern byGeneScanning and heteroduplex analysis.
There are a few exceptional cases with rearranged JH genesby Southern blot analysis, but without clonality by VH–JH PCR
and vice versa. The detailed evaluation of these casesdemonstrate that all but three samples showing IGH clonalityin Southern blot concerned FCLs or diffuse large B-celllymphomas that are known to harbor many somatic mutations
c
d
e
Figure 4 Continued.
PCR-based clonality studies in lymphoproliferationsJJM van Dongen et al
2271
Leukemia
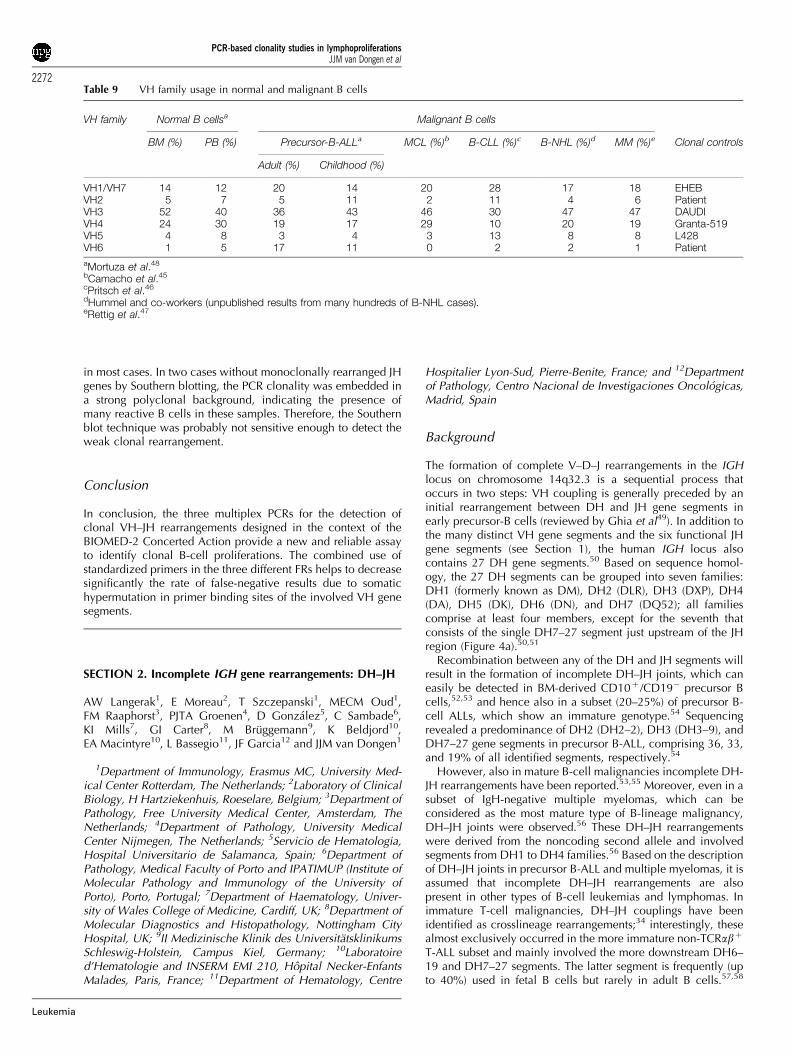
in most cases. In two cases without monoclonally rearranged JHgenes by Southern blotting, the PCR clonality was embedded ina strong polyclonal background, indicating the presence ofmany reactive B cells in these samples. Therefore, the Southernblot technique was probably not sensitive enough to detect theweak clonal rearrangement.
Conclusion
In conclusion, the three multiplex PCRs for the detection ofclonal VH–JH rearrangements designed in the context of theBIOMED-2 Concerted Action provide a new and reliable assayto identify clonal B-cell proliferations. The combined use ofstandardized primers in the three different FRs helps to decreasesignificantly the rate of false-negative results due to somatichypermutation in primer binding sites of the involved VH genesegments.
SECTION 2. Incomplete IGH gene rearrangements: DH–JH
AW Langerak1, E Moreau2, T Szczepanski1, MECM Oud1,FM Raaphorst3, PJTA Groenen4, D Gonzalez5, C Sambade6,KI Mills7, GI Carter8, M Bruggemann9, K Beldjord10,EA Macintyre10, L Bassegio11, JF Garcia12 and JJM van Dongen1
1Department of Immunology, Erasmus MC, University Med-ical Center Rotterdam, The Netherlands; 2Laboratory of ClinicalBiology, H Hartziekenhuis, Roeselare, Belgium; 3Department ofPathology, Free University Medical Center, Amsterdam, TheNetherlands; 4Department of Pathology, University MedicalCenter Nijmegen, The Netherlands; 5Servicio de Hematologia,Hospital Universitario de Salamanca, Spain; 6Department ofPathology, Medical Faculty of Porto and IPATIMUP (Institute ofMolecular Pathology and Immunology of the University ofPorto), Porto, Portugal; 7Department of Haematology, Univer-sity of Wales College of Medicine, Cardiff, UK; 8Department ofMolecular Diagnostics and Histopathology, Nottingham CityHospital, UK; 9II Medizinische Klinik des UniversitatsklinikumsSchleswig-Holstein, Campus Kiel, Germany; 10Laboratoired’Hematologie and INSERM EMI 210, Hopital Necker-EnfantsMalades, Paris, France; 11Department of Hematology, Centre
Hospitalier Lyon-Sud, Pierre-Benite, France; and 12Departmentof Pathology, Centro Nacional de Investigaciones Oncologicas,Madrid, Spain
Background
The formation of complete V–D–J rearrangements in the IGHlocus on chromosome 14q32.3 is a sequential process thatoccurs in two steps: VH coupling is generally preceded by aninitial rearrangement between DH and JH gene segments inearly precursor-B cells (reviewed by Ghia et al49). In addition tothe many distinct VH gene segments and the six functional JHgene segments (see Section 1), the human IGH locus alsocontains 27 DH gene segments.50 Based on sequence homol-ogy, the 27 DH segments can be grouped into seven families:DH1 (formerly known as DM), DH2 (DLR), DH3 (DXP), DH4(DA), DH5 (DK), DH6 (DN), and DH7 (DQ52); all familiescomprise at least four members, except for the seventh thatconsists of the single DH7–27 segment just upstream of the JHregion (Figure 4a).50,51
Recombination between any of the DH and JH segments willresult in the formation of incomplete DH–JH joints, which caneasily be detected in BM-derived CD10þ /CD19� precursor Bcells,52,53 and hence also in a subset (20–25%) of precursor B-cell ALLs, which show an immature genotype.54 Sequencingrevealed a predominance of DH2 (DH2–2), DH3 (DH3–9), andDH7–27 gene segments in precursor B-ALL, comprising 36, 33,and 19% of all identified segments, respectively.54
However, also in mature B-cell malignancies incomplete DH-JH rearrangements have been reported.53,55 Moreover, even in asubset of IgH-negative multiple myelomas, which can beconsidered as the most mature type of B-lineage malignancy,DH–JH joints were observed.56 These DH–JH rearrangementswere derived from the noncoding second allele and involvedsegments from DH1 to DH4 families.56 Based on the descriptionof DH–JH joints in precursor B-ALL and multiple myelomas, it isassumed that incomplete DH–JH rearrangements are alsopresent in other types of B-cell leukemias and lymphomas. Inimmature T-cell malignancies, DH–JH couplings have beenidentified as crosslineage rearrangements;34 interestingly, thesealmost exclusively occurred in the more immature non-TCRabþ
T-ALL subset and mainly involved the more downstream DH6–19 and DH7–27 segments. The latter segment is frequently (upto 40%) used in fetal B cells but rarely in adult B cells.57,58
Table 9 VH family usage in normal and malignant B cells
VH family Normal B cellsa Malignant B cells
BM (%) PB (%) Precursor-B-ALLa MCL (%)b B-CLL (%)c B-NHL (%)d MM (%)e Clonal controls
Adult (%) Childhood (%)
VH1/VH7 14 12 20 14 20 28 17 18 EHEBVH2 5 7 5 11 2 11 4 6 PatientVH3 52 40 36 43 46 30 47 47 DAUDIVH4 24 30 19 17 29 10 20 19 Granta-519VH5 4 8 3 4 3 13 8 8 L428VH6 1 5 17 11 0 2 2 1 Patient
aMortuza et al.48
bCamacho et al.45
cPritsch et al.46
dHummel and co-workers (unpublished results from many hundreds of B-NHL cases).eRettig et al.47
PCR-based clonality studies in lymphoproliferationsJJM van Dongen et al
2272
Leukemia

Human adult precursor and mature B cells mainly seem to useDH2 and DH3 family segments, as evidenced from sequences ofcomplete VH–DH–JH rearrangements.58
Although the exact frequencies of incomplete DH–JHcouplings in different types of mature B-cell malignancies arelargely unknown, it is clear that they will at least be lower thanthose of VH–JH joinings. Nevertheless, DH–JH rearrangementsmight still represent an important complementary target for PCR-based clonality assessment. This presumed contribution of DH–JH rearrangements as PCR target is based on the assumption thatincomplete rearrangements in the IGH locus will not containsomatic hypermutations, because transcription starting from thepromoters in the V gene segments does not occur, which isregarded as an essential prerequisite for somatic hypermutationto take place.59,60 Especially in those types of B-lineageproliferations in which somatic hypermutations are frequent,PCR analysis of a possible DH–JH recombination product mighttherefore be relevant, and sometimes even the only possibility todetect the B-cell clone.
Primer design
Based on the high degree of homology within each DH family,seven family-specific DH primers were designed (Figure 5a) incombination with the consensus JH primer that is also used forthe detection of VH–JH rearrangements (see Section 1) andt(11;14) (BCL1-IGH) and t(14;18) (BCL2-IGH) (Sections 8 and 9).Primers were designed such that crossannealing to other DHfamily segments would be minimal or preferably absent, resultingin distinct positions for the various family primers relative to theRSS elements (Figure 5a). The expected PCR product sizes of DH–JH joints range from 100–130 bp (for DH7–JH joinings) to 390–420 bp (for DH3–JH rearrangements) (see Table 10 for expectedsize ranges). Of note, due to the position of the DH7–27 segmentclose to the segments in the JH region, PCR products of 211 bp(and also 419, 1031, 1404, 1804, and 2420 bp in case of primerannealing to downstream JH gene segments) will be amplifiedfrom nonrearranged alleles and will be detected as a ladder ofgermline bands in virtually every sample.
Results of initial testing phase
For initial testing of the individual DH primers, high tumor loadprecursor B-ALL or T-ALL samples with well-defined clonal DH–JH rearrangements were used. Under standard PCR conditionsusing 1.5 mM MgCl2 and ABI Gold Buffer, all seven primercombinations appeared to detect the clonal DH–JH targets withproduct lengths within the expected size ranges. Crossannealingof the DH primers to rearranged gene segments from other DHfamilies was only very weak or not observed at all. Furthermore,also in healthy control tonsillar or MNC DNA PCR products ofthe correct size ranges were observed. Nonspecific annealing ofthe primers was not observed for virtually all primers sets, usingnontemplate-specific control DNA; only in case of the DH2/JHprimer set, a (sometimes faint) 340–350 bp product wasobserved in HeLa DNA. Further sequencing revealed that thisnonspecific product was due to false priming of the DH2 primerto a DNA sequence upstream of the JH4 segment. However, asthe size of this nonspecific product was so different from thesizes of any of the true DH–JH PCR products, it was decided notto design a new DH2 primer. In fact, the nonspecific 350 bpband can be employed as an internal marker for successful DNAamplification and hence the quality of the template DNA, being
hardly or only faintly visible when enough clonal or polyclonalDH–JH template is available (eg in tonsillar DNA or DNA fromparticular leukemic samples), but being especially strong insamples containing low numbers of lymphoid cells with DH–JHrearrangements.
Serial dilutions of DNA from the clonal reference samples intotonsillar DNA generally resulted in sensitivities of 5% or lower(0.5–1% in case of the DH6–JH rearrangement) using hetero-duplex analysis; sensitivities in GeneScanning were generally 1–2 dilution steps better, that is, 1% or lower. The clonal DH7–JHtarget could only be detected with a sensitivity of B10%, whichis most probably caused by primer consumption in PCRamplicons involving the nonrearranged germline DH7 and JHgene segments.
Although the initial multiplex strategy, as suggested from theOLIGO 6.2-assisted primer design, was to divide the various DHprimers over two tubes, it was decided after testing variousmultiplex approaches to combine all primers into one multiplextube (tube D of IGH clonality assay), except for the DH7 primer,which was included in a separate tube (tube E of IGH clonalityassay). The reason to exclude the DH7 primer was thecomplicated germline pattern, due to easy amplification ofalleles with nonrearranged DH7 segments. Using this two-tubemultiplex approach, all clonal reference samples were stilldetectable. Under multiplex conditions, the detection limits forthese various clonal targets were logically less optimal ascompared to the single assays, ranging from B5% (DH3, DH4,and DH6) to B10% (DH2, and DH5). For the DH1 clonalreference sample that was available, a sensitivity of B20% wasobserved; at a later stage, the DH1–JH rearrangement of cell lineKCA was found to be detectable down to 10% in the multiplexassay. As tube E only contains the DH7 primer, the 10%sensitivity for this tube was the same as mentioned before. Thesame multiplex analysis performed with 500 ng instead of100 ng DNA of the serial dilutions, resulted in slightly bettersensitivities. The use of serial dilutions in MNC DNA instead oftonsillar DNA did not clearly affect detection limits of the assaysfor DH–JH recombinations.
Results of general testing phase
Following initial testing in the three laboratories involved inprimer design (Rotterdam, Roeselare, Amsterdam-VUMC), thedeveloped IGH DH–JH multiplex PCR assay was furtherevaluated using the 90 Southern blot-defined samples (Figure5b and c). Every sample was analyzed in parallel in fourlaboratories by heteroduplex analysis and in five laboratories byGeneScanning; in another two laboratories all samples wereanalyzed by both techniques. All together a total of sixheteroduplex analysis and seven GeneScanning results wereobtained per sample per tube. Despite concordant results(480% of laboratories with identical results) in the vast majorityof samples, nine showed interlaboratory discordances in tube D.Further analysis revealed that these could be explained by eitherthe presence of a small clone with weak clonal products or tolarge size products (B390 and larger). In a few cases, theproducts were so large that only after sequencing it becameclear that they concerned true but extended DH–JH rearrange-ments, either from upstream DH (eg DH6–25–DH1–26–JH inNL-12) or from downstream JH gene segments (eg DH6–25–JH4–JH5 in PT-14). In all three cases (NL-17, mycosis fungoides;FR-1, B-CLL; FR-5, FCL) in which clonal products were foundusing tube E, the results were completely concordant betweenlaboratories.
PCR-based clonality studies in lymphoproliferationsJJM van Dongen et al
2273
Leukemia

a
b
c
Figure 5 PCR analysis of IGH (DH–JH) rearrangements. (a) Schematic diagram of IGH (DH–JH) rearrangement with seven DH family primersand one JH consensus primer, divided over two tubes (IGH tubes D and E). The DH7 (7–27) primer was separated from the other six DH primers,because the DH7 and JH consensus primer will give a germline PCR product of 211 nt. The relative position of the DH and JH primers is givenaccording to their most 50 nucleotide upstream (�) or downstream (þ ) of the involved RSS. The DH gene segment used as a representative DHfamily member for primer design is indicated in parentheses. (b and c) Heteroduplex analysis (left panels) and GeneScanning (right panels) of thesame polyclonal and monoclonal cell populations. The approximate distribution of the polyclonal and monoclonal peaks is indicated. Thepotential background band/peak in tube D is indicated with an asterisk and is located outside the expected range of DH–JH rearrangements. Thegermline DH–JH band of tube E is also indicated with an asterisk.
PCR-based clonality studies in lymphoproliferationsJJM van Dongen et al
2274
Leukemia

When evaluating results from heteroduplex analysis andGeneScanning, it appeared that these were comparable,although in general the number of laboratories showingidentical results was slightly higher upon heteroduplex analysisas compared to GeneScanning.
Direct comparison of DH–JH multiplex PCR results withSouthern blot data are virtually impossible, as hybridization witha single probe (IGHJ6) in the JH region does not allowdiscrimination between VH–JH and DH–JH rearrangements. Inthree samples, it was clear that the detection of clonal productsof the combined VH–JH and DH–JH assays did not fit with theconfiguration of the IGH locus in Southern blot analysis.Remarkably, no clonal DH–JH PCR products were observed inthe prefollicular B-cell malignancies. In contrast, 11/16 B-CLLsamples and 12/25 (post)follicular B-cell malignancy samplesdid contain clonally rearranged DH–JH PCR products. In threeof the 18 T-cell malignancy cases (Table 8) clonal DH–JHrearrangements were seen; these concerned T-LBL (ES-9) andmycosis fungoides (NL-17) cases with Southern blot-detectedIGH rearrangements, and a case of T-NHL/EATL (PT-4) withoutSouthern blot-detected IGH rearrangements, probably becauseof the low tumor load of o15% (Table 8). All 15 reactive cases(Table 8) only showed polyclonal DH–JH PCR products, inaccordance with Southern blot results. In category D withdifficult diagnoses, three samples (PT-12, GBS-10, and GBN-8)showed clonal IGH DH–JH PCR products, which was in linewith Southern blot data as well as IGK PCR data in two of threecases; in another two samples (PT-6 and GBS-9), both T-cell-richB-NHL cases, clonal DH–JH products were found in addition toclonal IGK and/or IGL products, but without evidence forclonality from Southern blot analysis, which might best beexplained by the small size of the B-cell clone in these samples(Table 8).
In order to determine the additional value of DH–JH PCRanalysis, the results were compared to those of VH–JH PCRanalysis. In five (NL-4, PT-14, GBN-2, FR-7, and NL-12) B-cellmalignancies clonal DH–JH PCR products were found, whereasonly polyclonal VH–JH PCR products were observed.
Conclusion
In conclusion, based on the initial and general testing phases,DH–JH PCR analysis appears to be of added value for clonalityassessment. Although heteroduplex analysis results might beinterpreted slightly more easily, there is no clear preference foreither heteroduplex analysis or GeneScanning, as they are bothsuitable for analyzing amplified PCR products. A potentialdifficulty in DH–JH PCR analysis is the relatively large size rangeof expected PCR products, due to scattered primer positions andto extended amplifications from upstream DH or downstream JHgene segments, implying that long runs are recommended for
GeneScanning. Finally, the remarkable position of the DH7–27gene segment in the IGH locus causes a ladder of germlineamplification products in tube E, with clonal products beingeasily recognizable as much smaller bands/peaks.
SECTION 3. IGK gene rearrangements: Vj–Jj, Vj–Kde/intronRSS–Kde
AW Langerak1, L Santos2, P Gameiro2, M Hummel3, F Davi4, EJvan Gastel-Mol1, ILM Wolvers-Tettero1, E Moreau5, R Garcıa-Sanz6, TC Diss7, PAS Evans8, T Flohr9, C Bastard10, M-H Delfau-Larue11, JM Cabecadas12, A Parreira2 and JJM van Dongen1
1Department of Immunology, Erasmus MC, University Med-ical Center Rotterdam, The Netherlands; 2Department. ofHemato-Oncology, Instituto Portugues de Oncologia, Lisboa,Portugal; 3lnstitute of Pathology, Free University Berlin,Germany; 4Department of Hematology, Hopital Pitie-Salpe-triere, Paris, France; 5Laboratory of Clinical Biology, HHartziekenhuis, Roeselare, Belgium; 6Servicio de Hematologia,Hospital Universitario de Salamanca, Spain; 7Department ofHistopathology, Royal Free and UCL Medical School, London,UK; 8Academic Unit of Haematology and Oncology, Universityof Leeds, Leeds, UK; 9Institute of Human Genetics, University ofHeidelberg, Germany; 10Laboratoire de Genetique Oncologi-que, Centre Henri Becquerel, Rouen, France; 11Serviced’lmmunologie Biologique, Hopital Henri Mondor, Creteil,France; and 12Department of Pathology, Instituto Portugues deOncologia, Lisboa, Portugal
Background
The human IGK light-chain locus (on chromosome 2p11.2)contains many distinct Vk gene segments, grouped into sevenVk gene families as well as five Jk gene segments upstream ofthe Ck region. Originally, the Vk gene segments weredesignated according to the nomenclature as described byZachau et al.61 An alternative nomenclature groups the Vk genesegments in seven families and is used in the ImMunoGeneTicsdatabase.62,63 Here we follow the latter nomenclature. The Vk1,Vk2, and Vk3 families are multimember families including bothfunctional and pseudo gene segments, whereas the otherfamilies only contain a single (Vk4, Vk5, Vk7) or a fewsegments (Vk6).64 Remarkably, all Vk gene segments aredispersed over two large duplicated clusters, one immediatelyupstream and in the same orientation as the Jk segments, and theother more distal and in an inverted orientation (Figure 6a).65
The latter implies that the so-called inversion rearrangementsare required to form Vk–Jk joints involving Vk genes of the distalcluster. In addition to the Vk and Jk segments, there are otherelements in the IGK locus that can be involved in recombina-tion. The Kde, approximately 24 kb downstream of the Jk–Ckregion, can rearrange to Vk gene segments (Vk–Kde), but also toan isolated RSS in the Jk–Ck intron (intronRSS–Kde)(Figure 6a).24,66 Both types of rearrangements lead to functionalinactivation of the IGK allele, through the deletion of either theCk exon (intronRSS–Kde rearrangement) or the entire Jk–Ck area(Vk–Kde rearrangement).
As human IGK recombination starts in precursor B-cells in theBM, IGK rearrangements can also be detected in precursor B-ALL (40–60% of cases, depending on age) (Table 11).24,67
Although Vk–-Jk joinings are present, the IGK rearrangements in
Table 10 Size ranges of DH–JH BIOMED-2 PCR products
Primer set Estimated size rangea Positive clonal control
DH1/JH 260–290 nt KCA (271 nt)DH2/JH 230–260 nt PatientDH3/JH 390–420 nt ROS-15 (383 nt)DH4/JH 175–205 nt PatientDH5/JH 225–255 nt PatientDH6/JH 110–150 nt ROS-5 (148 nt)DH7/JH 100–130 nt Patient
aEstimation of size ranges is based on average deletion and insertion inDH–JH gene rearrangements.
PCR-based clonality studies in lymphoproliferationsJJM van Dongen et al
2275
Leukemia

a
b
Figure 6 PCR analysis of IGK gene rearrangements. (a) Schematic diagram of the IGK gene complex on chromosome band 2p11.2 (adapted
from ImMunoGeneTics database).62,63 Only rearrangeable nonpolymorphic Vk gene segments are indicated in blue (functional Vk) or in gray(nonfunctional Vk). The cluster of inverted Vk gene segments (coded with the letter D) is located B800 kb upstream of the noninverted Vk genesegments. These upstream Vk gene segments are presented as a mirrored image to their corresponding noninverted counterparts. (b) Schematicdiagrams of Vk–Jk rearrangement and the two types of Kde rearrangements (Vk–Kde and intronRSS–Kde). The relative position of the Vk, Jk, Kde,and intronRSS (INTR) primers is given according to their most 50 nucleotide upstream (�) or downstream (þ ) of the involved RSS. The Vk genesegment used as a representative member of the Vk1, Vk2, and Vk3 families are indicated in parentheses. Vk4, Vk5, and Vk7 are single-memberVk families. The primers are divided over two tubes: tube A with Vk and Jk primers and tube B with Vk, intronRSS, and Kde primers. (c and d)Heteroduplex analysis and GeneScanning of the same polyclonal and monoclonal cell populations, showing the typical heteroduplex smears andhomoduplex bands (left panels) and the typical Gaussian curves and monoclonal peaks (right panels). The approximate distribution of thepolyclonal Gaussian curves is indicated in nt.
PCR-based clonality studies in lymphoproliferationsJJM van Dongen et al
2276
Leukemia
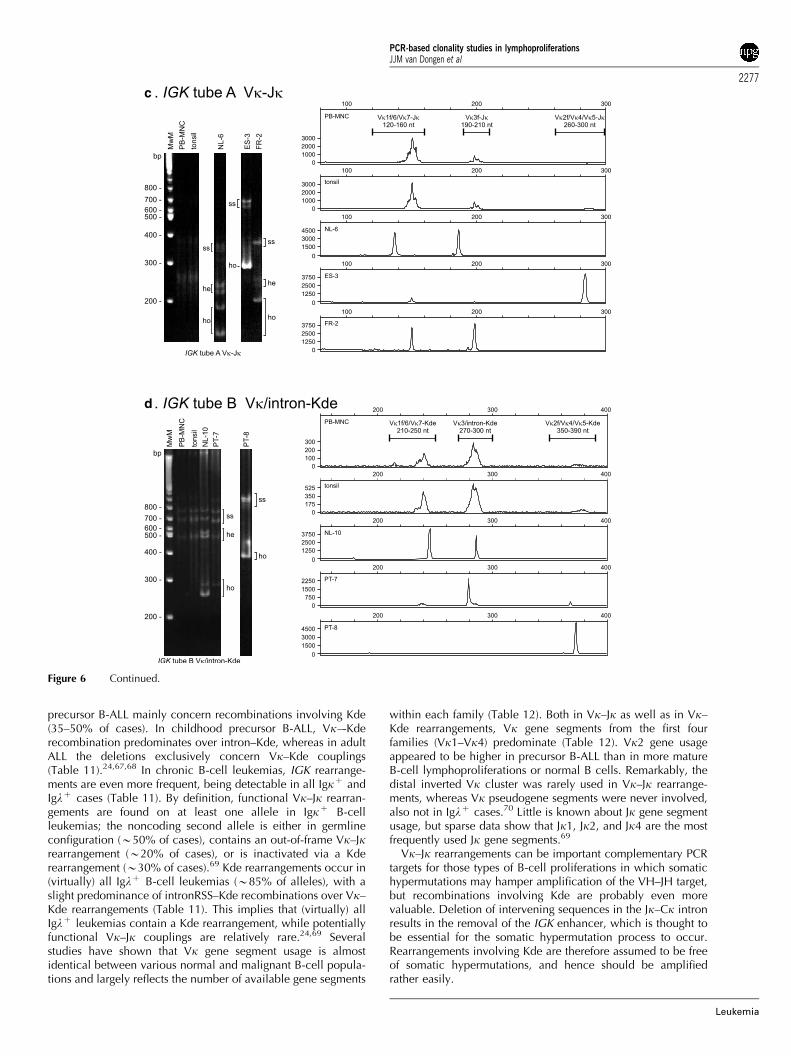
precursor B-ALL mainly concern recombinations involving Kde(35–50% of cases). In childhood precursor B-ALL, Vk–-Kderecombination predominates over intron–Kde, whereas in adultALL the deletions exclusively concern Vk–Kde couplings(Table 11).24,67,68 In chronic B-cell leukemias, IGK rearrange-ments are even more frequent, being detectable in all Igkþ andIglþ cases (Table 11). By definition, functional Vk–Jk rearran-gements are found on at least one allele in Igkþ B-cellleukemias; the noncoding second allele is either in germlineconfiguration (B50% of cases), contains an out-of-frame Vk–Jkrearrangement (B20% of cases), or is inactivated via a Kderearrangement (B30% of cases).69 Kde rearrangements occur in(virtually) all Iglþ B-cell leukemias (B85% of alleles), with aslight predominance of intronRSS–Kde recombinations over Vk–Kde rearrangements (Table 11). This implies that (virtually) allIglþ leukemias contain a Kde rearrangement, while potentiallyfunctional Vk–Jk couplings are relatively rare.24,69 Severalstudies have shown that Vk gene segment usage is almostidentical between various normal and malignant B-cell popula-tions and largely reflects the number of available gene segments
within each family (Table 12). Both in Vk–Jk as well as in Vk–Kde rearrangements, Vk gene segments from the first fourfamilies (Vk1–Vk4) predominate (Table 12). Vk2 gene usageappeared to be higher in precursor B-ALL than in more matureB-cell lymphoproliferations or normal B cells. Remarkably, thedistal inverted Vk cluster was rarely used in Vk–Jk rearrange-ments, whereas Vk pseudogene segments were never involved,also not in Iglþ cases.70 Little is known about Jk gene segmentusage, but sparse data show that Jk1, Jk2, and Jk4 are the mostfrequently used Jk gene segments.69
Vk–Jk rearrangements can be important complementary PCRtargets for those types of B-cell proliferations in which somatichypermutations may hamper amplification of the VH–JH target,but recombinations involving Kde are probably even morevaluable. Deletion of intervening sequences in the Jk–Ck intronresults in the removal of the IGK enhancer, which is thought tobe essential for the somatic hypermutation process to occur.Rearrangements involving Kde are therefore assumed to be freeof somatic hypermutations, and hence should be amplifiedrather easily.
c
d
Figure 6 Continued.
PCR-based clonality studies in lymphoproliferationsJJM van Dongen et al
2277
Leukemia
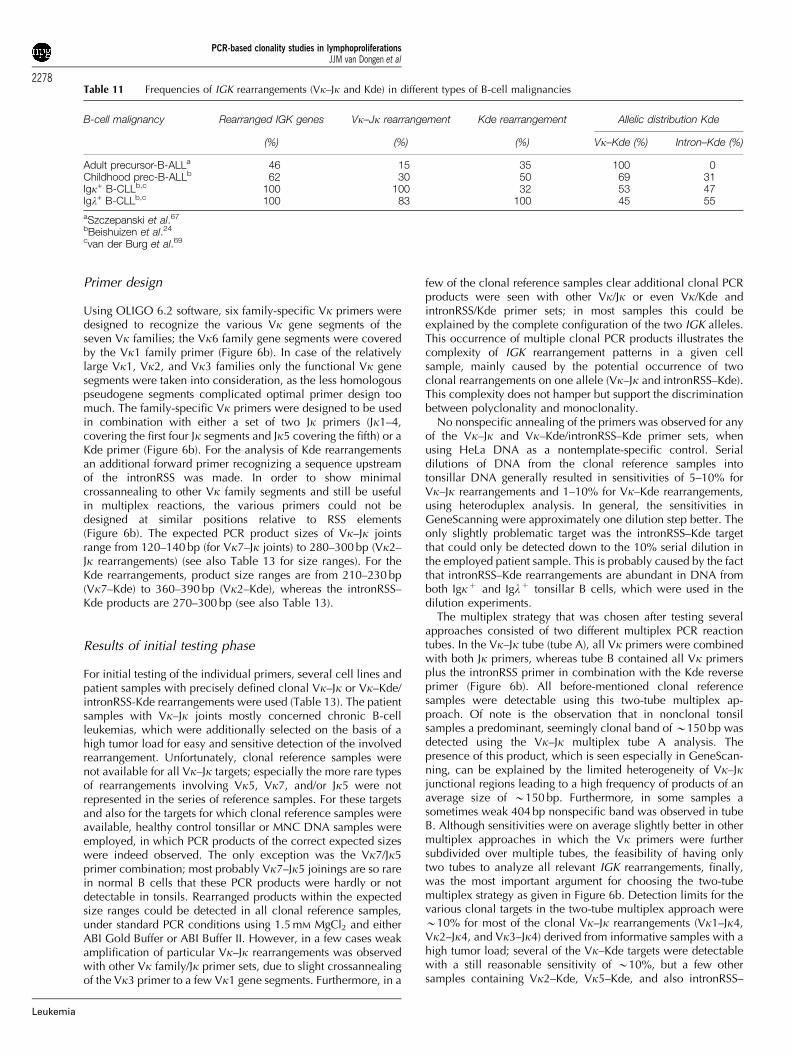
Primer design
Using OLIGO 6.2 software, six family-specific Vk primers weredesigned to recognize the various Vk gene segments of theseven Vk families; the Vk6 family gene segments were coveredby the Vk1 family primer (Figure 6b). In case of the relativelylarge Vk1, Vk2, and Vk3 families only the functional Vk genesegments were taken into consideration, as the less homologouspseudogene segments complicated optimal primer design toomuch. The family-specific Vk primers were designed to be usedin combination with either a set of two Jk primers (Jk1–4,covering the first four Jk segments and Jk5 covering the fifth) or aKde primer (Figure 6b). For the analysis of Kde rearrangementsan additional forward primer recognizing a sequence upstreamof the intronRSS was made. In order to show minimalcrossannealing to other Vk family segments and still be usefulin multiplex reactions, the various primers could not bedesigned at similar positions relative to RSS elements(Figure 6b). The expected PCR product sizes of Vk–Jk jointsrange from 120–140 bp (for Vk7–Jk joints) to 280–300 bp (Vk2–Jk rearrangements) (see also Table 13 for size ranges). For theKde rearrangements, product size ranges are from 210–230 bp(Vk7–Kde) to 360–390 bp (Vk2–Kde), whereas the intronRSS–Kde products are 270–300 bp (see also Table 13).
Results of initial testing phase
For initial testing of the individual primers, several cell lines andpatient samples with precisely defined clonal Vk–Jk or Vk–Kde/intronRSS-Kde rearrangements were used (Table 13). The patientsamples with Vk–Jk joints mostly concerned chronic B-cellleukemias, which were additionally selected on the basis of ahigh tumor load for easy and sensitive detection of the involvedrearrangement. Unfortunately, clonal reference samples werenot available for all Vk–Jk targets; especially the more rare typesof rearrangements involving Vk5, Vk7, and/or Jk5 were notrepresented in the series of reference samples. For these targetsand also for the targets for which clonal reference samples wereavailable, healthy control tonsillar or MNC DNA samples wereemployed, in which PCR products of the correct expected sizeswere indeed observed. The only exception was the Vk7/Jk5primer combination; most probably Vk7–Jk5 joinings are so rarein normal B cells that these PCR products were hardly or notdetectable in tonsils. Rearranged products within the expectedsize ranges could be detected in all clonal reference samples,under standard PCR conditions using 1.5 mM MgCl2 and eitherABI Gold Buffer or ABI Buffer II. However, in a few cases weakamplification of particular Vk–Jk rearrangements was observedwith other Vk family/Jk primer sets, due to slight crossannealingof the Vk3 primer to a few Vk1 gene segments. Furthermore, in a
few of the clonal reference samples clear additional clonal PCRproducts were seen with other Vk/Jk or even Vk/Kde andintronRSS/Kde primer sets; in most samples this could beexplained by the complete configuration of the two IGK alleles.This occurrence of multiple clonal PCR products illustrates thecomplexity of IGK rearrangement patterns in a given cellsample, mainly caused by the potential occurrence of twoclonal rearrangements on one allele (Vk–Jk and intronRSS–Kde).This complexity does not hamper but support the discriminationbetween polyclonality and monoclonality.
No nonspecific annealing of the primers was observed for anyof the Vk–Jk and Vk–Kde/intronRSS–Kde primer sets, whenusing HeLa DNA as a nontemplate-specific control. Serialdilutions of DNA from the clonal reference samples intotonsillar DNA generally resulted in sensitivities of 5–10% forVk–Jk rearrangements and 1–10% for Vk–Kde rearrangements,using heteroduplex analysis. In general, the sensitivities inGeneScanning were approximately one dilution step better. Theonly slightly problematic target was the intronRSS–Kde targetthat could only be detected down to the 10% serial dilution inthe employed patient sample. This is probably caused by the factthat intronRSS–Kde rearrangements are abundant in DNA fromboth Igkþ and Iglþ tonsillar B cells, which were used in thedilution experiments.
The multiplex strategy that was chosen after testing severalapproaches consisted of two different multiplex PCR reactiontubes. In the Vk–Jk tube (tube A), all Vk primers were combinedwith both Jk primers, whereas tube B contained all Vk primersplus the intronRSS primer in combination with the Kde reverseprimer (Figure 6b). All before-mentioned clonal referencesamples were detectable using this two-tube multiplex ap-proach. Of note is the observation that in nonclonal tonsilsamples a predominant, seemingly clonal band of B150 bp wasdetected using the Vk–Jk multiplex tube A analysis. Thepresence of this product, which is seen especially in GeneScan-ning, can be explained by the limited heterogeneity of Vk–Jkjunctional regions leading to a high frequency of products of anaverage size of B150 bp. Furthermore, in some samples asometimes weak 404 bp nonspecific band was observed in tubeB. Although sensitivities were on average slightly better in othermultiplex approaches in which the Vk primers were furthersubdivided over multiple tubes, the feasibility of having onlytwo tubes to analyze all relevant IGK rearrangements, finally,was the most important argument for choosing the two-tubemultiplex strategy as given in Figure 6b. Detection limits for thevarious clonal targets in the two-tube multiplex approach wereB10% for most of the clonal Vk–Jk rearrangements (Vk1–Jk4,Vk2–Jk4, and Vk3–Jk4) derived from informative samples with ahigh tumor load; several of the Vk–Kde targets were detectablewith a still reasonable sensitivity of B10%, but a few othersamples containing Vk2–Kde, Vk5–Kde, and also intronRSS–
Table 11 Frequencies of IGK rearrangements (Vk–Jk and Kde) in different types of B-cell malignancies
B-cell malignancy Rearranged IGK genes Vk–Jk rearrangement Kde rearrangement Allelic distribution Kde
(%) (%) (%) Vk–Kde (%) Intron–Kde (%)
Adult precursor-B-ALLa 46 15 35 100 0Childhood prec-B-ALLb 62 30 50 69 31Igk+ B-CLLb,c 100 100 32 53 47Igl+ B-CLLb,c 100 83 100 45 55
aSzczepanski et al.67
bBeishuizen et al.24
cvan der Burg et al.69
PCR-based clonality studies in lymphoproliferationsJJM van Dongen et al
2278
Leukemia

Kde targets showed detection limits above 10%. Even the use of500 ng serially diluted DNA instead of 100 ng hardly resulted inbetter sensitivities, whereas serial dilutions in MNC DNA didnot affect the detection limits either. Nevertheless, detectionlimits of serial dilutions of reference DNA in water were all inthe order of 0.5–1%, which shows that the chosen multiplex IGKPCR assay as such is good. It is important to note that potentialclonal cell populations in lymph nodes or PB in practice willhave to be detected within a background of polyclonal cells,which can hamper sensitive clonality detection, especially insamples with a relatively high background of polyclonal B cells.
Results of general testing phase
Following initial testing in the four laboratories involved inprimer design (Rotterdam, Lisbon, Berlin, and Paris-Salpetriere),the developed IGK multiplex PCR assay was further evaluatedusing 90 Southern blot-defined samples (Figure 6c and d). Everysample was analyzed in parallel via heteroduplex analysis (five
laboratories) and GeneScanning (two laboratories); in anotherfour laboratories all samples were analyzed by both techniques.Taken together, eight heteroduplex analysis and five GeneScan-ning results were available per sample per tube. In the vastmajority of samples 480% of laboratories produced identicalresults, that is, either clonal bands/peaks or polyclonal smears/curves in one or both tubes. However, in nine (B10%) samplesdiscordances were found between laboratories, which remainedafter repetitive analysis of these samples. More detailed analysisrevealed that in at least six cases the approximately 150 and200 bp sizes of the clonal products in tube A could not easily bediscriminated from polyclonal products of roughly the samesize. This is an inherent difficulty in especially Vk–Jk analysis,which is caused by the relatively limited junctional hetero-geneity of these rearrangements. In two samples, the results fromtube B were however so clear in all laboratories with bothtechniques that in fact no discrepancy prevailed. In one sample(ES-8), a large product of around 500 bp appeared to be thereason for discrepant interlaboratory results; further sequencingrevealed that amplification starting from the downstream Jksegment caused the production of an extended Vk1–Jk3–Jk4PCR product.
When evaluating results from heteroduplex analysis andGeneScanning, it appeared that these were rather comparable,although in general the number of laboratories showingidentical results was slightly higher upon heteroduplex analysisas compared to GeneScanning (Figure 6c and d). Remarkably, inone sample (GBS-4) heteroduplex analysis revealed a clearproduct in both tubes, whereas GeneScanning only showedpolyclonality. Cloning of the heteroduplex analysis productshowed a peculiar Vk3–Vk5 PCR product, which was notobserved in any other sample; the Vk–Vk configuration of thisproduct explained why it was not detected with labeled Jkprimers in GeneScanning.
Comparison of PCR results with Southern blot data revealedno Southern blotting vs PCR discrepancies in the pregerminalcenter B-cell malignancies and B-CLL samples; in line with thepresence of rearranged IGK bands in Southern blot analysis, allsamples contained clonal IGK PCR products. In contrast, in the25 (post)follicular B-cell malignancy samples clonal IGK PCRproducts were missed in four DLBCL cases (ES-5, PT-13, PT-14,and FR-7) and one PC leukemia (NL-19) with both techniquesand in another DLBCL case (GBS-4, see above) with GeneScan-ning analysis only. In all cases this was most probably caused by
Table 12 Allelic frequencies of Vk family gene usage in Vk–Jk and Vk–Kde rearrangements in different malignant and normal B-cellpopulations
Vk family Vk–Jk rearrangements Vk–Kde rearrangements
Precursor-B-ALLa
(n¼6)(%)
B-CLLa
(n¼23)(%)
B-NHLa
(n¼ 23)(%)
MMa
(n¼ 3)(%)
Normal B cells(%)d
Precursor-B-ALLe
(n¼66)(%)
Chronic B-cellleukemiae
(n¼38) (%)
Vk1 50 57 57 67 50–56 35 50Vk2 33 13 13 0 6–10 29 13Vk3 0 13 17 0 25–30 26 21Vk4 17 17 13 33 4–19 3 10Vk5 ND ND ND ND ND 0 0Vk6 ND ND ND ND ND 0 3Vk7 ND ND ND ND ND 7 3
ND, not determined.aData derived from Cannell et al.70
bData derived from Wagner et al.205
cData derived from Wagner et al.206
dData derived from Solomon et al.207 and Cuisinier et al.208
eData derived from Beishuizen et al.194
Table 13 BIOMED-2 PCR product size ranges and control samplesof different Vk–Jk, Vk–Kde/intronRSS–Kde rearrangements
Primer set Estimatedsize rangea
Control reference sample(s)
Vk1f/6/Jk 140–160 nt Patient (Jk1–4)/tonsil (Jk5)Vk2f/Jk 280–300 nt KCA (Jk1–4; 290 nt)/ROS-15
(Jk5; 288 nt)Vk3f/Jk 190–210 nt Patient (Jk1–4)/tonsil (Jk5)Vk4/Jk 275–295 nt Patient (Jk1–4)/tonsil (Jk5)Vk5/Jk 260–280 nt Tonsil (Jk1–4)/tonsil (Jk5)Vk7/Jk 120–140 nt Tonsil (Jk1–4)/noneVk1f/6/Kde 225–245 nt ROS-15 (241 nt)/380b
Vk2f/Kde 360–390 nt 380 (372nt)Vk3f/Kde 270–300 nt NALM-1Vk4/Kde 355–385 nt ROS-5 (371 nt)Vk5/Kde 350–380 nt PatientVk7/Kde 210–230 nt PatientIntronRSS/Kde 270–300 nt NALM-1
aEstimation of size ranges is based on average deletion and insertion inVk–Jk and Vk–Kde/intronRSS–Kde gene rearrangements.bCell line 380 shows a larger Vk1–Kde PCR product, due to an atypicalrearrangement configuration.
PCR-based clonality studies in lymphoproliferationsJJM van Dongen et al
2279
Leukemia

somatic hypermutation. Interestingly, in one FCL case (NL-4), aclonal PCR product was found, whereas Southern blot analysisrevealed a germline band in case of the IGK genes and weakclonal bands upon IGH analysis. In all 18 T-cell malignancycases and all 15 reactive cases polyclonal IGK PCR productswere found in accordance with Southern blot results, except forone peripheral T-NHL case (FR-10). Next to the clonal TCR andIGK products this sample also showed clonal IGH and IGL PCRproducts, but no clonal Ig rearrangements in Southern blotanalysis, probably reflecting the presence of a small additionalB-cell clone in this sample. Finally, in the category with difficultdiagnoses (D), two samples (GBS-10 and GBN-8) showed clonalIGK PCR products, in line with Southern blot data; however, inanother two samples (PT-6 and GBS-9), both T-cell-rich B-NHLcases, clonal IGK PCR products were found as well as clonalIGH and/or IGL products, but without the evidence for clonalityfrom Southern blot analysis. Also this discrepancy can probablybe explained by the small size of the B-cell clone in these twopatient samples.
To determine the additional value of analyzing the IGK locus,we compared the results of IGK PCR analysis to those of IGHPCR analysis. In five (ES-2, NL-4, PT-8, GBN-2, and ES-8) of thenine samples in which no clonal VH–JH PCR products werefound, clonal products were readily observed in IGK analysis.When taking into account both VH–JH and DH–JH analysis,IGK PCR analysis was still complementary to IGH PCR analysisin three of these cases in detecting clonal Ig PCR products.
Conclusion
In conclusion, based on the initial and general testing phases aswell as preliminary evidence from use of these multiplex assaysin pathologically well-defined series of lymphoproliferations(Work Package 2 of the BIOMED-2 project), PCR analysis of theIGK locus has clear (additional) value for clonality detection.Nevertheless, care should be taken with interpretation ofseemingly clonal bands especially in tube A, due to the inherentrestricted IGK junctional heterogeneity. As this problem isespecially apparent in GeneScanning, heteroduplex analysis isslightly preferred over GeneScanning, although it should bemarked that in some cases GeneScanning may facilitate properinterpretation of results. Another potential pitfall is the relativelylarge size range of expected rearranged IGK products, due toscattered primer positions, and to extended amplifications fromdownstream Jk gene segments. This implies that long runs arerecommended for GeneScanning. Finally, the inherent com-plexity of multiple rearrangements in the IGK locus (Vk–Jk andKde rearrangements on the same allele), together with a lowlevel of crossannealing of Vk primers, may occasionally result inpatterns with multiple bands or peaks, resembling oligoclon-ality. However, with these considerations in mind, the two-tubeIGK multiplex PCR system can be valuable in PCR-basedclonality diagnostics.
SECTION 4. IGL gene rearrangements
F Davi1, C Sambade2, R Garcıa-Sanz3, C Colin1, H Hercher1,D Gonzalez3, E Moreau4, TC Diss5, PAS Evans6, T Flohr7 andTJ Molina8
1Department of Hematology, Hopital Pitie-Salpetriere, Paris,France; 2Department of Pathology, Medical Faculty of Porto and
IPATIMUP (Institute of Molecular Pathology and Immunology ofthe University of Porto), Porto, Portugal; 3Servicio de Hemato-logia, Hospital Universitario de Salamanca, Spain; 4Laboratoryof Clinical Biology, H Hartziekenhuis, Roeselare, Belgium;5Department of Histopathology, Royal Free and UCL MedicalSchool, London, UK; 6Academic Unit of Haematology andOncology, University of Leeds, Leeds, UK; 7Institute of HumanGenetics, University of Heidelberg, Germany; and 8Departmentof Pathology, Hotel-Dieu de Paris, France
Background
IGL gene rearrangements are present in 5–10% of Igkþ B-cellmalignancies and in all Iglþ B-cell malignancies.69 Therefore,Vl–Jl rearrangements potentially represent an attractive extraPCR target for clonality studies to compensate for false-negativeIGH VH–JH PCR results, mainly caused by somatic mutations.The IGL locus spans 1 Mb on chromosome 22q11.2.71–73 Thereare 73–74 Vl genes spread over 900 kb, among which 30–33are functional (Figure 7a). Based upon sequence homology, theVl genes can be grouped into 11 families (10 containingfunctional Vl gene segments) and three clans. Members of thesame family tend to be clustered on the chromosome (Figure 7a).The Jl and Cl genes are organized in tandem with a Jl segmentpreceding a Cl gene. Typically, there are seven J–Cl genesegments, of which J–Cl1, J–Cl2, J–Cl3, and J–Cl7 arefunctional and encode the four Igl isotypes (Figure 7a).74,75
There is however a polymorphic variation in the number of J–Clgene segments, since some individual may carry up to 11 ofthem one allele, due to an amplification of the Cl2–Cl3region.76,77
Several studies have shown that the IGL gene repertoire ofboth normal and malignant B cells is biased.78–81 Thus, over90% of Vl genes used by normal B cells belong to the Vl1, Vl2,and Vl3 families, which comprise 60% of the functional genes(Table 14). Moreover, three genes (2–14, 1–40, and 2–8)account for about half of the expressed repertoire. Whilenormal B cells use J–Cl1, J–Cl2, and J–Cl3 gene segmentsin roughly equivalent proportions, neoplastic B cells tendto use predominantly J–Cl2 and J–Cl3 gene segments(Table 15).81 In both normal and malignant B cells, the J–Cl7is used very rarely (1%). This latter finding was, however,challenged by a single-cell study of normal cells which foundthat more than half of the rearrangements employed the J–Cl7gene segments.82 This unexpectedly high usage of Cl7 hasnever been confirmed and might have been caused by atechnical pitfall.81
In contrast to the mouse, there is some junctional diversitydue to exonuclease activity and N nucleotide addition in humanIGL gene rearrangements.79,80,82,83 It is however much lessextensive than that of the IGH locus, and a number ofrearrangements result from the directly coupling of germlineVl and Jl gene segments. Nevertheless, the IGL locus mightrepresent an alternative complementary locus to IGH for B-cellclonality studies.
Primer design
Considering the biased Vl repertoire, we chose to amplify onlyrearrangements that used the Vl1, Vl2, and Vl3 gene segments.A single consensus primer recognizing both Vl1 and Vl2 genesegments, as well as a Vl3 primer, were designed in regions ofhigh homology between members of the same family (Figure 7b).
PCR-based clonality studies in lymphoproliferationsJJM van Dongen et al
2280
Leukemia
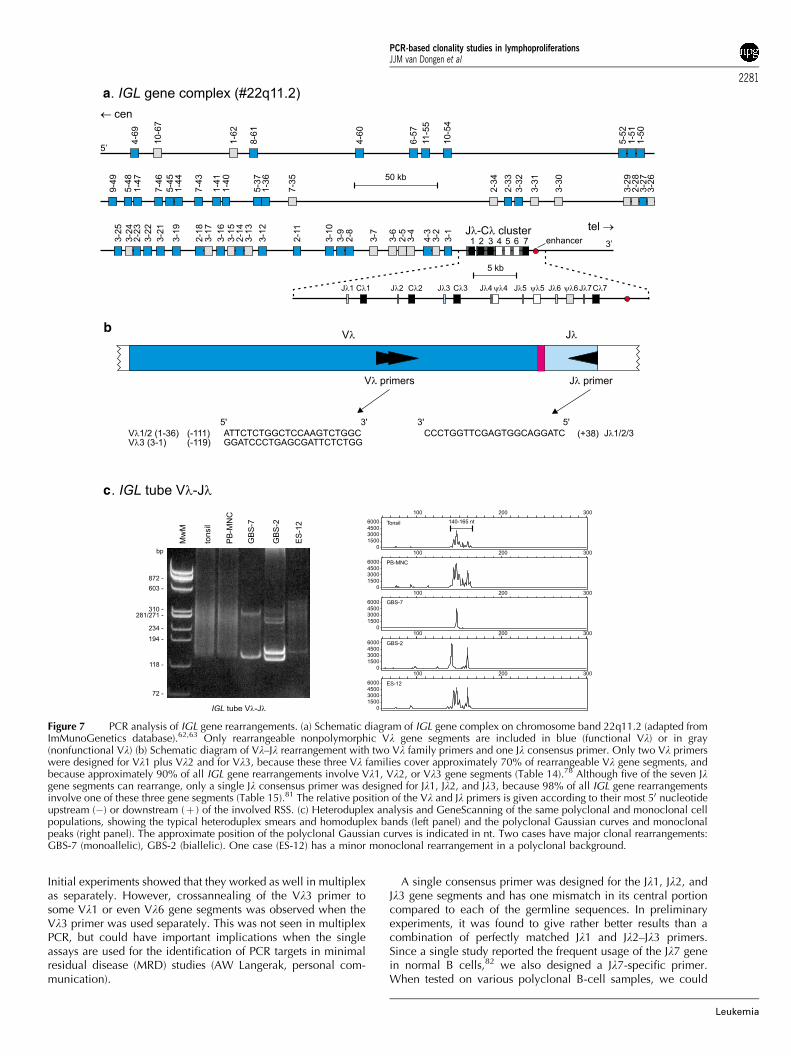
Initial experiments showed that they worked as well in multiplexas separately. However, crossannealing of the Vl3 primer tosome Vl1 or even Vl6 gene segments was observed when theVl3 primer was used separately. This was not seen in multiplexPCR, but could have important implications when the singleassays are used for the identification of PCR targets in minimalresidual disease (MRD) studies (AW Langerak, personal com-munication).
A single consensus primer was designed for the Jl1, Jl2, andJl3 gene segments and has one mismatch in its central portioncompared to each of the germline sequences. In preliminaryexperiments, it was found to give rather better results than acombination of perfectly matched Jl1 and Jl2–Jl3 primers.Since a single study reported the frequent usage of the Jl7 genein normal B cells,82 we also designed a Jl7-specific primer.When tested on various polyclonal B-cell samples, we could
a
b
c
Figure 7 PCR analysis of IGL gene rearrangements. (a) Schematic diagram of IGL gene complex on chromosome band 22q11.2 (adapted fromImMunoGenetics database).62,63 Only rearrangeable nonpolymorphic Vl gene segments are included in blue (functional Vl) or in gray(nonfunctional Vl) (b) Schematic diagram of Vl–Jl rearrangement with two Vl family primers and one Jl consensus primer. Only two Vl primerswere designed for Vl1 plus Vl2 and for Vl3, because these three Vl families cover approximately 70% of rearrangeable Vl gene segments, andbecause approximately 90% of all IGL gene rearrangements involve Vl1, Vl2, or Vl3 gene segments (Table 14).78 Although five of the seven Jlgene segments can rearrange, only a single Jl consensus primer was designed for Jl1, Jl2, and Jl3, because 98% of all IGL gene rearrangementsinvolve one of these three gene segments (Table 15).81 The relative position of the Vl and Jl primers is given according to their most 50 nucleotideupstream (�) or downstream (þ ) of the involved RSS. (c) Heteroduplex analysis and GeneScanning of the same polyclonal and monoclonal cellpopulations, showing the typical heteroduplex smears and homoduplex bands (left panel) and the polyclonal Gaussian curves and monoclonalpeaks (right panel). The approximate position of the polyclonal Gaussian curves is indicated in nt. Two cases have major clonal rearrangements:GBS-7 (monoallelic), GBS-2 (biallelic). One case (ES-12) has a minor monoclonal rearrangement in a polyclonal background.
PCR-based clonality studies in lymphoproliferationsJJM van Dongen et al
2281
Leukemia
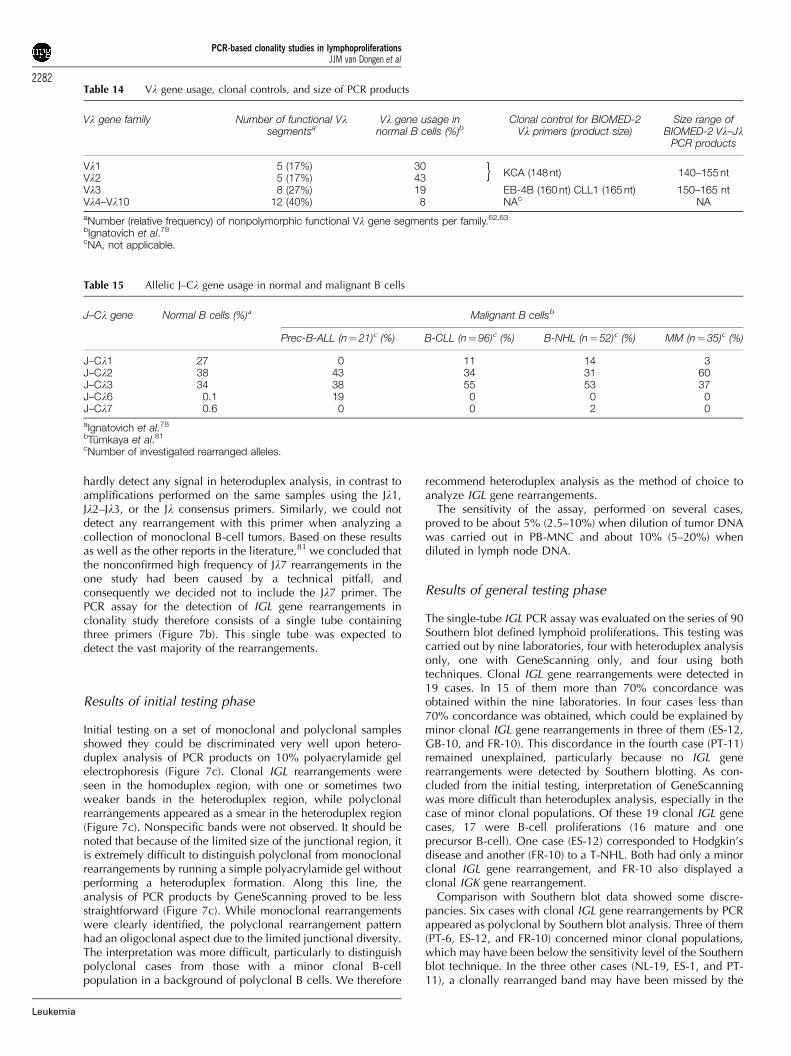
hardly detect any signal in heteroduplex analysis, in contrast toamplifications performed on the same samples using the Jl1,Jl2–Jl3, or the Jl consensus primers. Similarly, we could notdetect any rearrangement with this primer when analyzing acollection of monoclonal B-cell tumors. Based on these resultsas well as the other reports in the literature,81 we concluded thatthe nonconfirmed high frequency of Jl7 rearrangements in theone study had been caused by a technical pitfall, andconsequently we decided not to include the Jl7 primer. ThePCR assay for the detection of IGL gene rearrangements inclonality study therefore consists of a single tube containingthree primers (Figure 7b). This single tube was expected todetect the vast majority of the rearrangements.
Results of initial testing phase
Initial testing on a set of monoclonal and polyclonal samplesshowed they could be discriminated very well upon hetero-duplex analysis of PCR products on 10% polyacrylamide gelelectrophoresis (Figure 7c). Clonal IGL rearrangements wereseen in the homoduplex region, with one or sometimes twoweaker bands in the heteroduplex region, while polyclonalrearrangements appeared as a smear in the heteroduplex region(Figure 7c). Nonspecific bands were not observed. It should benoted that because of the limited size of the junctional region, itis extremely difficult to distinguish polyclonal from monoclonalrearrangements by running a simple polyacrylamide gel withoutperforming a heteroduplex formation. Along this line, theanalysis of PCR products by GeneScanning proved to be lessstraightforward (Figure 7c). While monoclonal rearrangementswere clearly identified, the polyclonal rearrangement patternhad an oligoclonal aspect due to the limited junctional diversity.The interpretation was more difficult, particularly to distinguishpolyclonal cases from those with a minor clonal B-cellpopulation in a background of polyclonal B cells. We therefore
recommend heteroduplex analysis as the method of choice toanalyze IGL gene rearrangements.
The sensitivity of the assay, performed on several cases,proved to be about 5% (2.5–10%) when dilution of tumor DNAwas carried out in PB-MNC and about 10% (5–20%) whendiluted in lymph node DNA.
Results of general testing phase
The single-tube IGL PCR assay was evaluated on the series of 90Southern blot defined lymphoid proliferations. This testing wascarried out by nine laboratories, four with heteroduplex analysisonly, one with GeneScanning only, and four using bothtechniques. Clonal IGL gene rearrangements were detected in19 cases. In 15 of them more than 70% concordance wasobtained within the nine laboratories. In four cases less than70% concordance was obtained, which could be explained byminor clonal IGL gene rearrangements in three of them (ES-12,GB-10, and FR-10). This discordance in the fourth case (PT-11)remained unexplained, particularly because no IGL generearrangements were detected by Southern blotting. As con-cluded from the initial testing, interpretation of GeneScanningwas more difficult than heteroduplex analysis, especially in thecase of minor clonal populations. Of these 19 clonal IGL genecases, 17 were B-cell proliferations (16 mature and oneprecursor B-cell). One case (ES-12) corresponded to Hodgkin’sdisease and another (FR-10) to a T-NHL. Both had only a minorclonal IGL gene rearrangement, and FR-10 also displayed aclonal IGK gene rearrangement.
Comparison with Southern blot data showed some discre-pancies. Six cases with clonal IGL gene rearrangements by PCRappeared as polyclonal by Southern blot analysis. Three of them(PT-6, ES-12, and FR-10) concerned minor clonal populations,which may have been below the sensitivity level of the Southernblot technique. In the three other cases (NL-19, ES-1, and PT-11), a clonally rearranged band may have been missed by the
Table 14 Vl gene usage, clonal controls, and size of PCR products
Vl gene family Number of functional Vlsegmentsa
Vl gene usage innormal B cells (%)b
Clonal control for BIOMED-2Vl primers (product size)
Size range ofBIOMED-2 Vl–Jl
PCR products
Vl1 5 (17%) 30KCA (148 nt) 140–155 ntVl2 5 (17%) 43
Vl3 8 (27%) 19 EB-4B (160 nt) CLL1 (165 nt) 150–165 ntVl4–Vl10 12 (40%) 8 NAc NA
aNumber (relative frequency) of nonpolymorphic functional Vl gene segments per family.62,63
bIgnatovich et al.78
cNA, not applicable.
}
Table 15 Allelic J–Cl gene usage in normal and malignant B cells
J–Cl gene Normal B cells (%)a Malignant B cellsb
Prec-B-ALL (n¼21)c (%) B-CLL (n¼96)c (%) B-NHL (n¼ 52)c (%) MM (n¼ 35)c (%)
J–Cl1 27 0 11 14 3J–Cl2 38 43 34 31 60J–Cl3 34 38 55 53 37J–Cl6 0.1 19 0 0 0J–Cl7 0.6 0 0 2 0
aIgnatovich et al.78
bTumkaya et al.81
cNumber of investigated rearranged alleles.
PCR-based clonality studies in lymphoproliferationsJJM van Dongen et al
2282
Leukemia
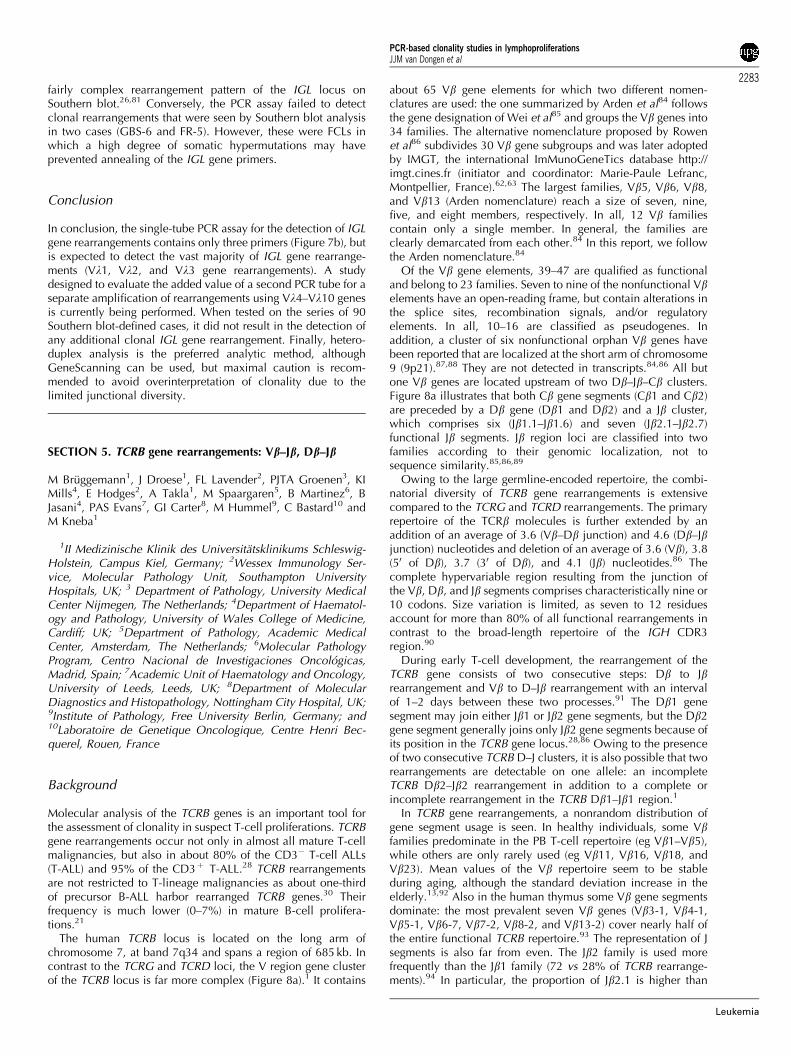
fairly complex rearrangement pattern of the IGL locus onSouthern blot.26,81 Conversely, the PCR assay failed to detectclonal rearrangements that were seen by Southern blot analysisin two cases (GBS-6 and FR-5). However, these were FCLs inwhich a high degree of somatic hypermutations may haveprevented annealing of the IGL gene primers.
Conclusion
In conclusion, the single-tube PCR assay for the detection of IGLgene rearrangements contains only three primers (Figure 7b), butis expected to detect the vast majority of IGL gene rearrange-ments (Vl1, Vl2, and Vl3 gene rearrangements). A studydesigned to evaluate the added value of a second PCR tube for aseparate amplification of rearrangements using Vl4–Vl10 genesis currently being performed. When tested on the series of 90Southern blot-defined cases, it did not result in the detection ofany additional clonal IGL gene rearrangement. Finally, hetero-duplex analysis is the preferred analytic method, althoughGeneScanning can be used, but maximal caution is recom-mended to avoid overinterpretation of clonality due to thelimited junctional diversity.
SECTION 5. TCRB gene rearrangements: Vb–Jb, Db–Jb
M Bruggemann1, J Droese1, FL Lavender2, PJTA Groenen3, KIMills4, E Hodges2, A Takla1, M Spaargaren5, B Martinez6, BJasani4, PAS Evans7, GI Carter8, M Hummel9, C Bastard10 andM Kneba1
1II Medizinische Klinik des Universitatsklinikums Schleswig-Holstein, Campus Kiel, Germany; 2Wessex Immunology Ser-vice, Molecular Pathology Unit, Southampton UniversityHospitals, UK; 3 Department of Pathology, University MedicalCenter Nijmegen, The Netherlands; 4Department of Haematol-ogy and Pathology, University of Wales College of Medicine,Cardiff; UK; 5Department of Pathology, Academic MedicalCenter, Amsterdam, The Netherlands; 6Molecular PathologyProgram, Centro Nacional de Investigaciones Oncologicas,Madrid, Spain; 7Academic Unit of Haematology and Oncology,University of Leeds, Leeds, UK; 8Department of MolecularDiagnostics and Histopathology, Nottingham City Hospital, UK;9Institute of Pathology, Free University Berlin, Germany; and10Laboratoire de Genetique Oncologique, Centre Henri Bec-querel, Rouen, France
Background
Molecular analysis of the TCRB genes is an important tool forthe assessment of clonality in suspect T-cell proliferations. TCRBgene rearrangements occur not only in almost all mature T-cellmalignancies, but also in about 80% of the CD3� T-cell ALLs(T-ALL) and 95% of the CD3þ T-ALL.28 TCRB rearrangementsare not restricted to T-lineage malignancies as about one-thirdof precursor B-ALL harbor rearranged TCRB genes.30 Theirfrequency is much lower (0–7%) in mature B-cell prolifera-tions.21
The human TCRB locus is located on the long arm ofchromosome 7, at band 7q34 and spans a region of 685 kb. Incontrast to the TCRG and TCRD loci, the V region gene clusterof the TCRB locus is far more complex (Figure 8a).1 It contains
about 65 Vb gene elements for which two different nomen-clatures are used: the one summarized by Arden et al84 followsthe gene designation of Wei et al85 and groups the Vb genes into34 families. The alternative nomenclature proposed by Rowenet al86 subdivides 30 Vb gene subgroups and was later adoptedby IMGT, the international ImMunoGeneTics database http://imgt.cines.fr (initiator and coordinator: Marie-Paule Lefranc,Montpellier, France).62,63 The largest families, Vb5, Vb6, Vb8,and Vb13 (Arden nomenclature) reach a size of seven, nine,five, and eight members, respectively. In all, 12 Vb familiescontain only a single member. In general, the families areclearly demarcated from each other.84 In this report, we followthe Arden nomenclature.84
Of the Vb gene elements, 39–47 are qualified as functionaland belong to 23 families. Seven to nine of the nonfunctional Vbelements have an open-reading frame, but contain alterations inthe splice sites, recombination signals, and/or regulatoryelements. In all, 10–16 are classified as pseudogenes. Inaddition, a cluster of six nonfunctional orphan Vb genes havebeen reported that are localized at the short arm of chromosome9 (9p21).87,88 They are not detected in transcripts.84,86 All butone Vb genes are located upstream of two Db–Jb–Cb clusters.Figure 8a illustrates that both Cb gene segments (Cb1 and Cb2)are preceded by a Db gene (Db1 and Db2) and a Jb cluster,which comprises six (Jb1.1–Jb1.6) and seven (Jb2.1–Jb2.7)functional Jb segments. Jb region loci are classified into twofamilies according to their genomic localization, not tosequence similarity.85,86,89
Owing to the large germline-encoded repertoire, the combi-natorial diversity of TCRB gene rearrangements is extensivecompared to the TCRG and TCRD rearrangements. The primaryrepertoire of the TCRb molecules is further extended by anaddition of an average of 3.6 (Vb–Db junction) and 4.6 (Db–Jbjunction) nucleotides and deletion of an average of 3.6 (Vb), 3.8(50 of Db), 3.7 (30 of Db), and 4.1 (Jb) nucleotides.86 Thecomplete hypervariable region resulting from the junction ofthe Vb, Db, and Jb segments comprises characteristically nine or10 codons. Size variation is limited, as seven to 12 residuesaccount for more than 80% of all functional rearrangements incontrast to the broad-length repertoire of the IGH CDR3region.90
During early T-cell development, the rearrangement of theTCRB gene consists of two consecutive steps: Db to Jbrearrangement and Vb to D–Jb rearrangement with an intervalof 1–2 days between these two processes.91 The Db1 genesegment may join either Jb1 or Jb2 gene segments, but the Db2gene segment generally joins only Jb2 gene segments because ofits position in the TCRB gene locus.28,86 Owing to the presenceof two consecutive TCRB D–J clusters, it is also possible that tworearrangements are detectable on one allele: an incompleteTCRB Db2–Jb2 rearrangement in addition to a complete orincomplete rearrangement in the TCRB Db1–Jb1 region.1
In TCRB gene rearrangements, a nonrandom distribution ofgene segment usage is seen. In healthy individuals, some Vbfamilies predominate in the PB T-cell repertoire (eg Vb1–Vb5),while others are only rarely used (eg Vb11, Vb16, Vb18, andVb23). Mean values of the Vb repertoire seem to be stableduring aging, although the standard deviation increase in theelderly.13,92 Also in the human thymus some Vb gene segmentsdominate: the most prevalent seven Vb genes (Vb3-1, Vb4-1,Vb5-1, Vb6-7, Vb7-2, Vb8-2, and Vb13-2) cover nearly half ofthe entire functional TCRB repertoire.93 The representation of Jsegments is also far from even. The Jb2 family is used morefrequently than the Jb1 family (72 vs 28% of TCRB rearrange-ments).94 In particular, the proportion of Jb2.1 is higher than
PCR-based clonality studies in lymphoproliferationsJJM van Dongen et al
2283
Leukemia

a
b
Figure 8 PCR analysis of TCRB gene rearrangements. (a) Schematic diagram of the human TCRB locus. The gene segment designation isaccording to Arden et al84 with the designation according to Rowen et al86 and Lefranc et al62,63 in parentheses. The figure is adapted from theinternational ImMunoGeneTics database.62,63 Rearrangeable pseudogenes are depicted in gray, potential pseudogenes in half blue/half grey, andthe remaining Vb gene segments in blue. (b) Schematic diagram of Vb–Jb and Db–Jb rearrangements. The 23 Vb primers, 13 Jb primers, and twoDb primers are combined in three tubes: tube A with 23 Vb primers and nine Jb primers, tube B with 23 Vb primers and four Jb primers, and tube Cwith two Db primers and 13 Jb primers. The 23 Vb primers and the 13 Jb primers are aligned in order to obtain comparably sized PCR products (seec and d). The Vb primers cover approximately 90% of all Vb gene segments. The relative position of the Vb, Db, and Jb primers is given accordingto their most 50 nucleotide upstream (�) or downstream (þ ) of the involved RSS. (c, d, and e) Heteroduplex analysis and GeneScanning of thesame polyclonal and monoclonal cell populations, showing the typical heteroduplex smears and homoduplex bands (left panels) and the typicalpolyclonal Gaussian curves and monoclonal peaks (right panels). The approximate distribution of the polyclonal Gaussian curves is indicated in nt.
PCR-based clonality studies in lymphoproliferationsJJM van Dongen et al
2284
Leukemia
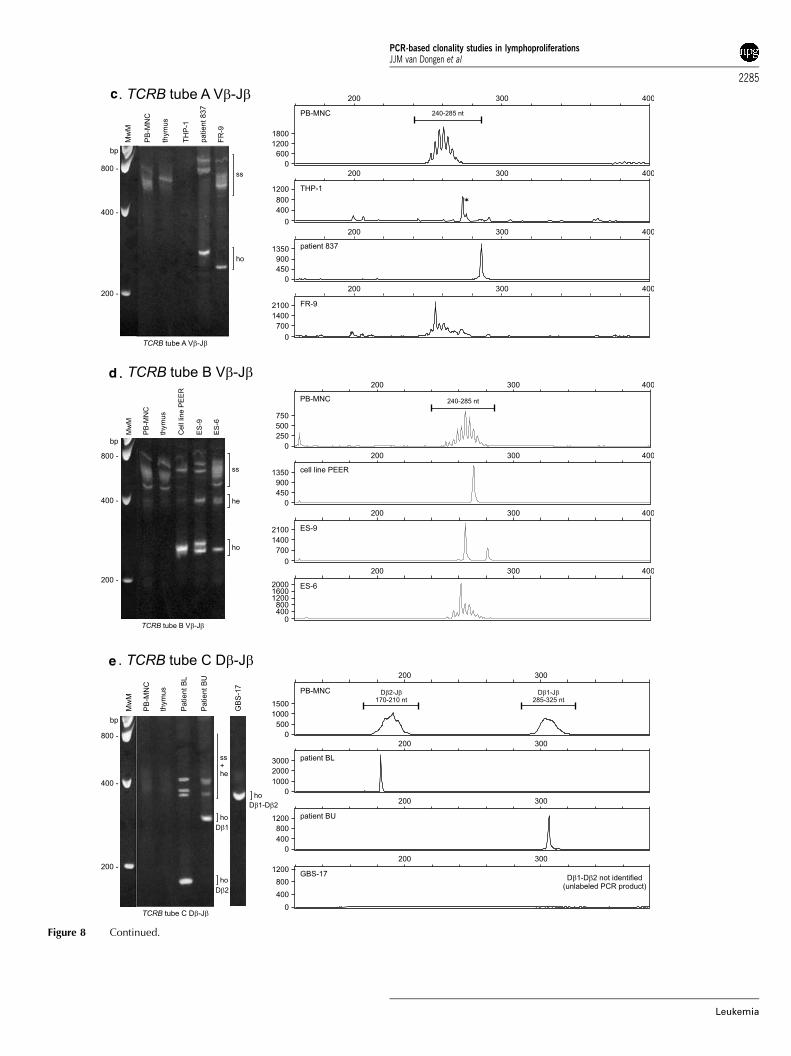
c
d
e
Figure 8 Continued.
PCR-based clonality studies in lymphoproliferationsJJM van Dongen et al
2285
Leukemia

expected (24%) followed by Jb2.2 (11%) and Jb2.3 and Jb2.5(10% each).93
TCRB gene rearrangement patterns differ between categoriesof T-cell malignancies. Complete TCRB Vb–Jb1 rearrangementsand incompletely rearranged alleles in the TCRB Db–Jb2 clusterare seen more frequently in TCRabþ T-ALL as compared toCD3� T-ALL and TCRgdþ T-ALL.28 In the total group of T-ALL,the TCRB Db–Jb1 region is relatively frequently involved inrearrangements in contrast to crosslineage TCRB gene rearran-gements in precursor-B-ALL, which exclusively involve theTCRB Db–Jb2 region.30,67
The development of monoclonal antibodies against most Vbdomains has helped to identify Vb family expansions.13
However, TCR gene rearrangement analysis is essential forclonality assessment in T-cell lymphoproliferative disorders.As the restricted germline-encoded repertoire of the TCRGand TCRD loci facilitates DNA-based PCR approaches,various PCR methods have been established for the detectionof TCRG and TCRD gene rearrangements.95–97 Nevertheless,the limited junctional diversity of TCRG rearrangementsleads to a high background amplification of similar rearrange-ments in normal T cells (Section 6). The TCRD gene on theother hand is deleted in most mature T-cell malignancies.1
Therefore, DNA-based TCRB PCR techniques are needed forclonality assessment. In addition, TCRB rearrangements are ofgreat interest for follow-up studies of lymphoproliferativedisorders, because the extensive combinatorial repertoire ofTCRB rearrangements and the large hypervariable regionenables a highly specific detection of clinically occult residualtumor cells. However, the extensive germline-encoded reper-toire renders PCR assays more difficult. Some published PCRapproaches use the time-consuming procedure of multipletube approaches with a panel of family- or subfamily-specificprimers.94,98 Usage of highly degenerated consensus primerslimits the number of detectable rearrangements that aretheoretically covered by the primers because there is nosingle common sequence of sufficient identity to allow areliable amplification of all possible rearrangements.42,99,100
Some published assays use a nested PCR requiring anadditional PCR reaction.42,100 Other assays focus on theanalysis of the TCRB Vb–Db–Jb–Cb transcripts to limit thenumber of primers needed.16,98,101 However, a major drawbackof these mRNA-based approaches is the need for fresh or frozenmaterial and a reverse transcription step before the PCRamplification.
We tried to overcome these limitations by creating acompletely new and convenient DNA-based TCRB PCR. Wedesigned multiple Vb and Jb primers, theoretically covering allfunctional Vb and Jb gene segments and being suitable forcombination in multiplex PCR reactions. In addition, the assayshould be applicable for heteroduplex analysis and GeneScan-ning and should also detect the incomplete TCRB Db–Jbrearrangements with the same set of Jb primers. In order toavoid problems due to crosspriming, we decided to design allVb and Jb primers at the same conserved region of each genesegment.
Primer design
Initially, a total of 23 Vb, two Db (Db1 and Db2) and 13 Jb(Jb1.1–1.6 and Jb2.1–2.7) primers were designed with all the Vband Jb primers positioned in the same conserved region ofeach Vb and Jb gene segment so that the effects of cross-annealing in a multiplex reaction could be neglected. In
addition, rare polyclonal TCRB Vb–Jb rearrangements wouldnot be mistaken for a clonal rearrangement even if they do notproduce a fully polyclonal Gaussian peak pattern, because PCRproducts of all possible rearrangements are situated in the samesize range.
For primer design, the rearrangeable pseudogenes or open-reading frame genes with alterations in splicing sites, recombi-nation signals, and/or regulatory elements or changes ofconserved amino acids were taken into consideration wheneverpossible. However, the main objective was to cover allfunctional Vb genes. The PE of each Vb primer was checkedfor every Vb gene using OLIGO 6.2 software. This led to primersthat were not strictly Vb family specific. Consequently, some ofthe primers covered Vb gene segments of more than one family(Table 16). Primer dimerization made it necessary to split the Jbprimers into two tubes. Initially, it was planned to use theprimers in four sets of multiplex reactions as follows: all 23 Vbprimers in combination with the six Jb1 family primers (240–285 bp), all 23 Vb primers with the seven Jb2 family primers(240–285 bp), Db1 (280–320 bp) with the six Jb1 primers, andDb1 (285–325 bp) plus Db2 (170–210 bp) with the seven Jb2family primers.
Results of initial testing phase
Initial monoplex testing of each possible primer combinationwas carried out using samples with known monoclonal TCRBrearrangements and polyclonal controls. PCR products of theexpected size range were generated with differences in productintensity and signal profile for polyclonal samples depending onthe frequency of usage of distinct Vb and Jb gene segments.However, when the primers were combined in a multiplexreaction, some Jb2 rearrangements in particular were missedand nonspecific products in the tubes B and D were observed. Inaddition, cross-priming between the Jb1 and Jb2 primersresulted in interpretation problems. As a consequence, the Jb2primers had to be redesigned and the primer combinations inthe different tubes had to be rearranged: Jb primers Jb2.2, 2.6,and 2.7 were slightly modified and added to tube A. Thelocalization of the primers Jb2.1, 2.3, 2.4, and 2.5 was shifted by4 bp downstream to avoid primer dimerization and crossprimingwith the remaining Jb primers. Only nonspecific bands withvarying intensity outside the expected size range persisted intube B (bands: 150 bp, 221 bp) and tube C (128 bp, 337 bp)using specific template DNA. As these nonspecific amplificationproducts were outside the size ranges of the TCRB-specificproducts, they did not affect interpretation and wereconsidered not to be a problem. However, using nonspecifictemplate controls one additional 273 bp nonspecific peak intube A was inconsistently visible by GeneScanning. Thisproduct is completely suppressed when the DNA containsenough clonal or polyclonal TCRB rearrangements, butcan appear in samples comprising low numbers of lymphoidcells. In the initial testing phase, relatively faint Vb–Db–Jb PCRproducts were generated. Thus, we optimized PCR conditionsfor complete Vb–Db–Jb rearrangements by increasing MgCl2concentration and the amount of Taq polymerase. Also usageof highly purified primers and application of ABI Buffer IIinstead of ABI Gold Buffer turned out to be extremely important.For the detection of the incomplete Db–Jb rearrangements,it was finally possible to mix all Jb primers into one tubewithout the loss of sensitivity or informativity. Consequently,the total number of multiplex reactions needed was reduced tothree tubes.
PCR-based clonality studies in lymphoproliferationsJJM van Dongen et al
2286
Leukemia
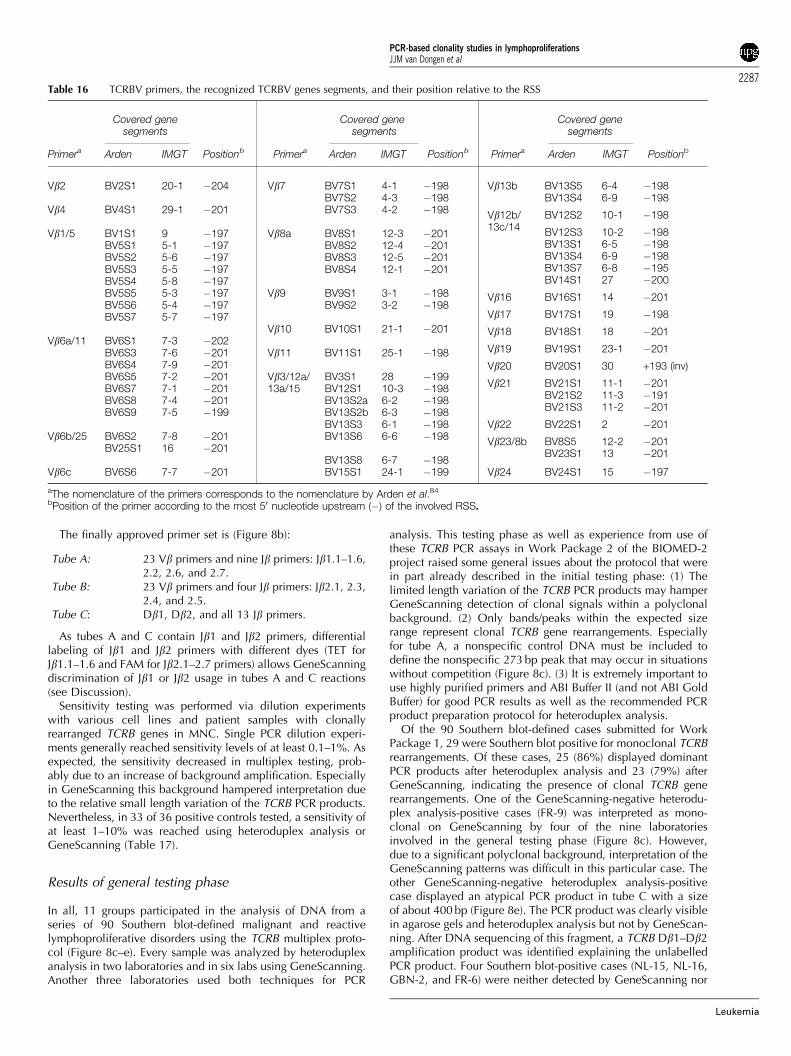
The finally approved primer set is (Figure 8b):
Tube A: 23 Vb primers and nine Jb primers: Jb1.1–1.6,2.2, 2.6, and 2.7.
Tube B: 23 Vb primers and four Jb primers: Jb2.1, 2.3,2.4, and 2.5.
Tube C: Db1, Db2, and all 13 Jb primers.
As tubes A and C contain Jb1 and Jb2 primers, differentiallabeling of Jb1 and Jb2 primers with different dyes (TET forJb1.1–1.6 and FAM for Jb2.1–2.7 primers) allows GeneScanningdiscrimination of Jb1 or Jb2 usage in tubes A and C reactions(see Discussion).
Sensitivity testing was performed via dilution experimentswith various cell lines and patient samples with clonallyrearranged TCRB genes in MNC. Single PCR dilution experi-ments generally reached sensitivity levels of at least 0.1–1%. Asexpected, the sensitivity decreased in multiplex testing, prob-ably due to an increase of background amplification. Especiallyin GeneScanning this background hampered interpretation dueto the relative small length variation of the TCRB PCR products.Nevertheless, in 33 of 36 positive controls tested, a sensitivity ofat least 1–10% was reached using heteroduplex analysis orGeneScanning (Table 17).
Results of general testing phase
In all, 11 groups participated in the analysis of DNA from aseries of 90 Southern blot-defined malignant and reactivelymphoproliferative disorders using the TCRB multiplex proto-col (Figure 8c–e). Every sample was analyzed by heteroduplexanalysis in two laboratories and in six labs using GeneScanning.Another three laboratories used both techniques for PCR
analysis. This testing phase as well as experience from use ofthese TCRB PCR assays in Work Package 2 of the BIOMED-2project raised some general issues about the protocol that werein part already described in the initial testing phase: (1) Thelimited length variation of the TCRB PCR products may hamperGeneScanning detection of clonal signals within a polyclonalbackground. (2) Only bands/peaks within the expected sizerange represent clonal TCRB gene rearrangements. Especiallyfor tube A, a nonspecific control DNA must be included todefine the nonspecific 273 bp peak that may occur in situationswithout competition (Figure 8c). (3) It is extremely important touse highly purified primers and ABI Buffer II (and not ABI GoldBuffer) for good PCR results as well as the recommended PCRproduct preparation protocol for heteroduplex analysis.
Of the 90 Southern blot-defined cases submitted for WorkPackage 1, 29 were Southern blot positive for monoclonal TCRBrearrangements. Of these cases, 25 (86%) displayed dominantPCR products after heteroduplex analysis and 23 (79%) afterGeneScanning, indicating the presence of clonal TCRB generearrangements. One of the GeneScanning-negative heterodu-plex analysis-positive cases (FR-9) was interpreted as mono-clonal on GeneScanning by four of the nine laboratoriesinvolved in the general testing phase (Figure 8c). However,due to a significant polyclonal background, interpretation of theGeneScanning patterns was difficult in this particular case. Theother GeneScanning-negative heteroduplex analysis-positivecase displayed an atypical PCR product in tube C with a sizeof about 400 bp (Figure 8e). The PCR product was clearly visiblein agarose gels and heteroduplex analysis but not by GeneScan-ning. After DNA sequencing of this fragment, a TCRB Db1–Db2amplification product was identified explaining the unlabelledPCR product. Four Southern blot-positive cases (NL-15, NL-16,GBN-2, and FR-6) were neither detected by GeneScanning nor
Table 16 TCRBV primers, the recognized TCRBV genes segments, and their position relative to the RSS
Covered genesegments
Covered genesegments
Covered genesegments
Primera Arden IMGT Positionb Primera Arden IMGT Positionb Primera Arden IMGT Positionb
Vb2 BV2S1 20-1 �204
Vb4 BV4S1 29-1 �201
Vb1/5 BV1S1 9 �197BV5S1 5-1 �197BV5S2 5-6 �197BV5S3 5-5 �197BV5S4 5-8 �197BV5S5 5-3 �197BV5S6 5-4 �197BV5S7 5-7 �197
Vb6a/11 BV6S1 7-3 �202BV6S3 7-6 �201BV6S4 7-9 �201BV6S5 7-2 �201BV6S7 7-1 �201BV6S8 7-4 �201BV6S9 7-5 �199
Vb6b/25 BV6S2 7-8 �201BV25S1 16 �201
Vb6c BV6S6 7-7 �201
Vb7 BV7S1 4-1 �198BV7S2 4-3 �198BV7S3 4-2 �198
Vb8a BV8S1 12-3 �201BV8S2 12-4 �201BV8S3 12-5 �201BV8S4 12-1 �201
Vb9 BV9S1 3-1 �198BV9S2 3-2 �198
Vb10 BV10S1 21-1 �201
Vb11 BV11S1 25-1 �198
Vb3/12a/13a/15
BV3S1 28 �199BV12S1 10-3 �198BV13S2a 6-2 �198BV13S2b 6-3 �198BV13S3 6-1 �198BV13S6 6-6 �198
BV13S8 6-7 �198BV15S1 24-1 �199
Vb13b BV13S5 6-4 �198BV13S4 6-9 �198
Vb12b/13c/14
BV12S2 10-1 �198
BV12S3 10-2 �198BV13S1 6-5 �198BV13S4 6-9 �198BV13S7 6-8 �195BV14S1 27 �200
Vb16 BV16S1 14 �201
Vb17 BV17S1 19 �198
Vb18 BV18S1 18 �201
Vb19 BV19S1 23-1 �201
Vb20 BV20S1 30 +193 (inv)
Vb21 BV21S1 11-1 �201BV21S2 11-3 �191BV21S3 11-2 �201
Vb22 BV22S1 2 �201
Vb23/8b BV8S5 12-2 �201BV23S1 13 �201
Vb24 BV24S1 15 �197
aThe nomenclature of the primers corresponds to the nomenclature by Arden et al.84
bPosition of the primer according to the most 50 nucleotide upstream (�) of the involved RSS.
PCR-based clonality studies in lymphoproliferationsJJM van Dongen et al
2287
Leukemia
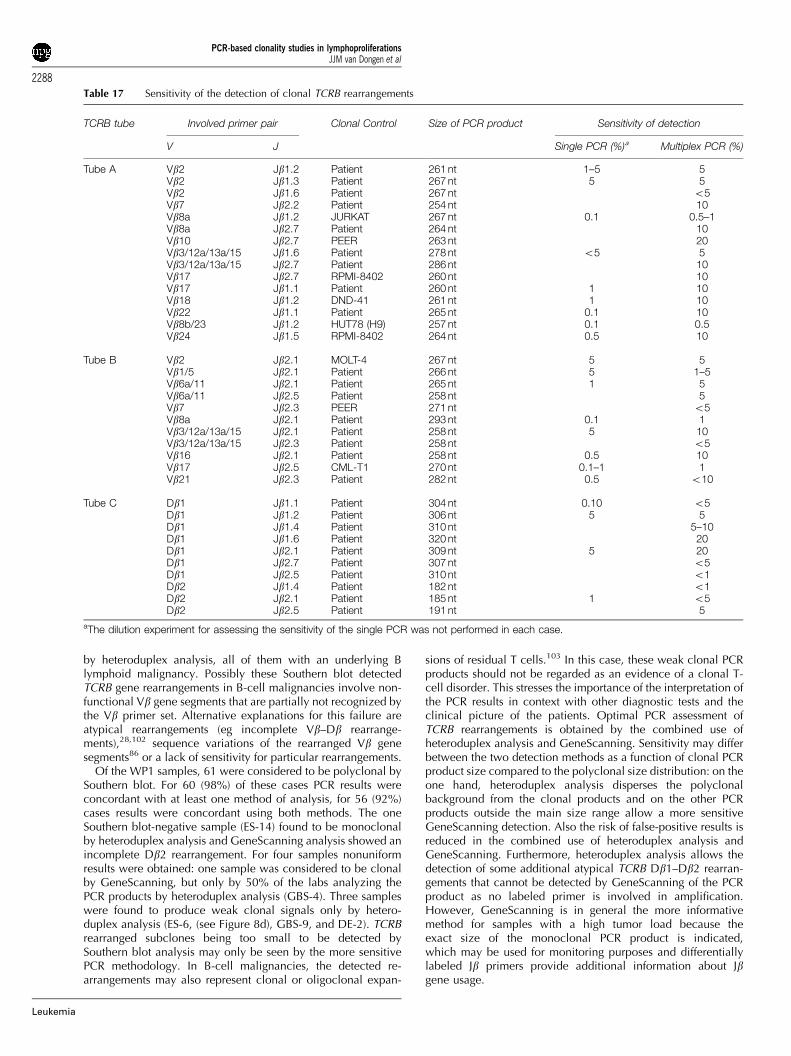
by heteroduplex analysis, all of them with an underlying Blymphoid malignancy. Possibly these Southern blot detectedTCRB gene rearrangements in B-cell malignancies involve non-functional Vb gene segments that are partially not recognized bythe Vb primer set. Alternative explanations for this failure areatypical rearrangements (eg incomplete Vb–Db rearrange-ments),28,102 sequence variations of the rearranged Vb genesegments86 or a lack of sensitivity for particular rearrangements.
Of the WP1 samples, 61 were considered to be polyclonal bySouthern blot. For 60 (98%) of these cases PCR results wereconcordant with at least one method of analysis, for 56 (92%)cases results were concordant using both methods. The oneSouthern blot-negative sample (ES-14) found to be monoclonalby heteroduplex analysis and GeneScanning analysis showed anincomplete Db2 rearrangement. For four samples nonuniformresults were obtained: one sample was considered to be clonalby GeneScanning, but only by 50% of the labs analyzing thePCR products by heteroduplex analysis (GBS-4). Three sampleswere found to produce weak clonal signals only by hetero-duplex analysis (ES-6, (see Figure 8d), GBS-9, and DE-2). TCRBrearranged subclones being too small to be detected bySouthern blot analysis may only be seen by the more sensitivePCR methodology. In B-cell malignancies, the detected re-arrangements may also represent clonal or oligoclonal expan-
sions of residual T cells.103 In this case, these weak clonal PCRproducts should not be regarded as an evidence of a clonal T-cell disorder. This stresses the importance of the interpretation ofthe PCR results in context with other diagnostic tests and theclinical picture of the patients. Optimal PCR assessment ofTCRB rearrangements is obtained by the combined use ofheteroduplex analysis and GeneScanning. Sensitivity may differbetween the two detection methods as a function of clonal PCRproduct size compared to the polyclonal size distribution: on theone hand, heteroduplex analysis disperses the polyclonalbackground from the clonal products and on the other PCRproducts outside the main size range allow a more sensitiveGeneScanning detection. Also the risk of false-positive results isreduced in the combined use of heteroduplex analysis andGeneScanning. Furthermore, heteroduplex analysis allows thedetection of some additional atypical TCRB Db1–Db2 rearran-gements that cannot be detected by GeneScanning of the PCRproduct as no labeled primer is involved in amplification.However, GeneScanning is in general the more informativemethod for samples with a high tumor load because theexact size of the monoclonal PCR product is indicated,which may be used for monitoring purposes and differentiallylabeled Jb primers provide additional information about Jbgene usage.
Table 17 Sensitivity of the detection of clonal TCRB rearrangements
TCRB tube Involved primer pair Clonal Control Size of PCR product Sensitivity of detection
V J Single PCR (%)a Multiplex PCR (%)
Tube A Vb2 Jb1.2 Patient 261 nt 1–5 5Vb2 Jb1.3 Patient 267 nt 5 5Vb2 Jb1.6 Patient 267 nt o5Vb7 Jb2.2 Patient 254 nt 10Vb8a Jb1.2 JURKAT 267 nt 0.1 0.5–1Vb8a Jb2.7 Patient 264 nt 10Vb10 Jb2.7 PEER 263 nt 20Vb3/12a/13a/15 Jb1.6 Patient 278 nt o5 5Vb3/12a/13a/15 Jb2.7 Patient 286 nt 10Vb17 Jb2.7 RPMI-8402 260 nt 10Vb17 Jb1.1 Patient 260 nt 1 10Vb18 Jb1.2 DND-41 261 nt 1 10Vb22 Jb1.1 Patient 265 nt 0.1 10Vb8b/23 Jb1.2 HUT78 (H9) 257 nt 0.1 0.5Vb24 Jb1.5 RPMI-8402 264 nt 0.5 10
Tube B Vb2 Jb2.1 MOLT-4 267 nt 5 5Vb1/5 Jb2.1 Patient 266 nt 5 1–5Vb6a/11 Jb2.1 Patient 265 nt 1 5Vb6a/11 Jb2.5 Patient 258 nt 5Vb7 Jb2.3 PEER 271 nt o5Vb8a Jb2.1 Patient 293 nt 0.1 1Vb3/12a/13a/15 Jb2.1 Patient 258 nt 5 10Vb3/12a/13a/15 Jb2.3 Patient 258 nt o5Vb16 Jb2.1 Patient 258 nt 0.5 10Vb17 Jb2.5 CML-T1 270 nt 0.1–1 1Vb21 Jb2.3 Patient 282 nt 0.5 o10
Tube C Db1 Jb1.1 Patient 304 nt 0.10 o5Db1 Jb1.2 Patient 306 nt 5 5Db1 Jb1.4 Patient 310 nt 5–10Db1 Jb1.6 Patient 320 nt 20Db1 Jb2.1 Patient 309 nt 5 20Db1 Jb2.7 Patient 307 nt o5Db1 Jb2.5 Patient 310 nt o1Db2 Jb1.4 Patient 182 nt o1Db2 Jb2.1 Patient 185 nt 1 o5Db2 Jb2.5 Patient 191 nt 5
aThe dilution experiment for assessing the sensitivity of the single PCR was not performed in each case.
PCR-based clonality studies in lymphoproliferationsJJM van Dongen et al
2288
Leukemia

Conclusion
In conclusion, the three-tube TCRB multiplex PCR systemprovides a new and convenient assay for clonality assessment insuspect T-cell proliferations with an unprecedentedly highclonality detection rate.
SECTION 6. TCRG gene rearrangements
K Beldjord1, E Delabesse1, J Droese2, PAS Evans3, R GarcıaSanz4, AW Langerak5, R Villuendas6, FL Lavender7, L Foroni8,BJ Milner9, D Bloxham10, M Hummel11, L Trumper12, M-HDelfau-Larue13 and EA Macintyre1
1Laboratoire d’Hematologie and INSERM EMI 210, HopitalNecker-Enfants Malades, Paris, France; 2II Medizinische Klinikder Universitat, Kiel, Germany; 3Academic Unit of Haematol-ogy and Oncology, University of Leeds, UK; 4Servicio deHematologia, Hospital Universitario de Salamanca, Spain;5Department of Immunology, Erasmus MC, Rotterdam, TheNetherlands; 6Molecular Pathology Program, Centro Nacionalde Investigaciones Oncologicas, Madrid, Spain; 7WessexImmunology Service, Molecular Pathology Unit, SouthamptonUniversity Hospitals, UK; 8Department of Haematology, RoyalFree Hospital, London, UK; 9Department of Medicine andTherapeutics, University of Aberdeen, UK; 10Department ofClinical Haematology, Addenbrooke’s NHS Trust Hospital,Cambridge, UK; 11Institute of Pathology, Free University Berlin,Germany; 12Department of Internal Medicine, Georg AugustUniversitat, Gottingen, Germany; and 13Service d’lmmunologieBiologique, Hopital Henri Mondor, Creteil, France
Background
TCRG gene rearrangements have long been used for DNA PCRdetection of lymphoid clonality and represent the ‘prototype’ ofrestricted repertoire targets. It is a preferential target for clonalityanalyses since it is rearranged at an early stage of T lymphoiddevelopment, probably just after TCRD,104 in both TCRab andTCRgd lineage precursors. It is rearranged in greater than 90%of T-ALL, T-large granular lymphocyte (LGL), and T-PLL, in50–75% of peripheral T-NHL and mycosis fungoıdes butnot in true NK cell proliferations. It is also rearranged in amajor part of B-lineage ALLs, but much less so in B-NHL.1,30,67
Unlike several other Ig/TCR loci, the complete genomicstructure has been known for many years. It contains alimited number of Vg and Jg segments. The amplification of allmajor Vg–Jg combinations is possible with four Vg and threeJg primers.
The human TCRG locus on chromosome 7p14 contains 14 Vgsegments, only 10 of which have been shown to undergorearrangement (Figure 9a). The expressed Vg repertoire includesonly six Vg genes (Vg2, Vg3, Vg4, Vg5, Vg8, and Vg9), butrearrangement also occurs with the cVg7, cVg10, and cVg11segments.105,106 Rearrangement of cVgB (also known ascVg12)105 is so exceptional that it is rarely used in diagnosticPCR strategies. Rearranging Vg segments can be subdivided intothose belonging to the VgI family (VgfI: Vg2, Vg3, Vg4, Vg5,cVg7, and Vg8; overall homology 490% and highest betweenVg2 and Vg4 and between Vg3 and Vg5) and the single memberVg9, cVg10, and cVg11 families. The TCRG locus contains fiveJg segments: Jg1.1 (JgP1), Jg1.2 (JgP), Jg1.3 (Jg1), Jg2.1 (JgP2), and
Jg2.3 (Jg2), of which Jg1.3 and Jg2.3 are highly homologous, asare Jg1.1 and Jg2.1.107,108
While the restricted TCRG germline repertoire facilitates PCRamplification, the limited junctional diversity of TCRG rearran-gements complicates distinction between clonal and polyclonalPCR products. The TCRG locus does not contain D segmentsand demonstrates relatively limited nucleotide additions. TCRGV–J junctional length therefore varies by 20–30 bp, compared toapproximately 60 bp for IGH and TCRD. The capacity todistinguish clonal from polyclonal TCRG rearrangementsdepends on the complexity of the polyclonal repertoire. Ingeneral, minor clonal populations using frequent Vg–Jg rearran-gements such as VgfI–Jg1.3/2.3 are at risk of being lost amidstthe polyclonal repertoire, whereas rare combinations will bedetected with greater sensitivity. However, occasional poly-clonal T-lymphocytes demonstrating rare Vg–Jg rearrangementsmay be mistaken for a clonal rearrangement, due to the absenceof a polyclonal background for that type of rearrangement. Afurther possible source of minor clonal populations results fromthe presence of TCRgd-expressing T-lymphocytes demonstrating‘canonical’ TCRG rearrangements, which do not demonstrate Nnucleotide additions. The most commonly recognized humancanonical TCRG rearrangement involves the Vg9–Jg1.2 seg-ments and occurs in approximately 1% of blood T-lympho-cytes.109,110 It is therefore extremely important to analyzeTCRG PCR products using high-resolution electrophoretictechniques or to separate PCR products on criteria other thanpurely on size, in order to reduce the risk of false-positiveresults. It is also important to be aware of the profile of canonicalrearrangements and the situations in which they most com-monly occur. Canonical Vg9–Jg1.2 rearrangements, for exam-ple, are found predominantly in PB and increase in frequencywith age, since they result from accumulation of TCRgdþ
T-lymphocytes.19
Unlike TCRD, TCRG is not deleted in TCRab lineage cells.Since TCRG rearrangements occur in both TCRab and TCRgdlineage precursors, their identification cannot be used for thedetermination of the type of T-cell lineage. Similarly, TCRGrearrangements occur in 60% of B-lineage ALLs,30 implying thatthey cannot be used for the assessment of B- vs T-cell lineage inimmature proliferations. However, they occur much lessfrequently in mature B lymphoproliferative disorders, includingthe majority of B-NHL,1 and might therefore be used, incombination with clinical and immunophenotypic data, todetermine lineage involvement in mature lymphoproliferativedisorders.
The limited germline repertoire allows determination of Vgand Jg segment utilization, either by Southern blot or PCRanalysis. Approximate relative use of the different Vg and Jgsegments in precursor B-ALL, T-ALL, and T-NHL is shown inTable 18.1,30,111,112 The identification of Vg and Jg usage is notof purely academic interest, since specific amplification isrequired for MRD analysis.113
We undertook to develop a minimal number of multiplexTCRG strategies that would maintain optimal sensitivity andinformativity, minimize the risk of false-positive results, andallow simple Vg and Jg identification, including by heteroduplexanalysis or monofluorescent GeneScanning strategies. We choseto include Vg primers detecting all rearranging segments otherthan cVgB (cVg12), given its rarity. In order to reduce the risk offalsely identifying canonical rearrangements as clonal products,we excluded the Jg1.2 primer, since it is rarely involved inlymphoid neoplasms (Table 18) and is usually, although notalways, associated with a TCRG rearrangement on the otherallele.111
PCR-based clonality studies in lymphoproliferationsJJM van Dongen et al
2289
Leukemia
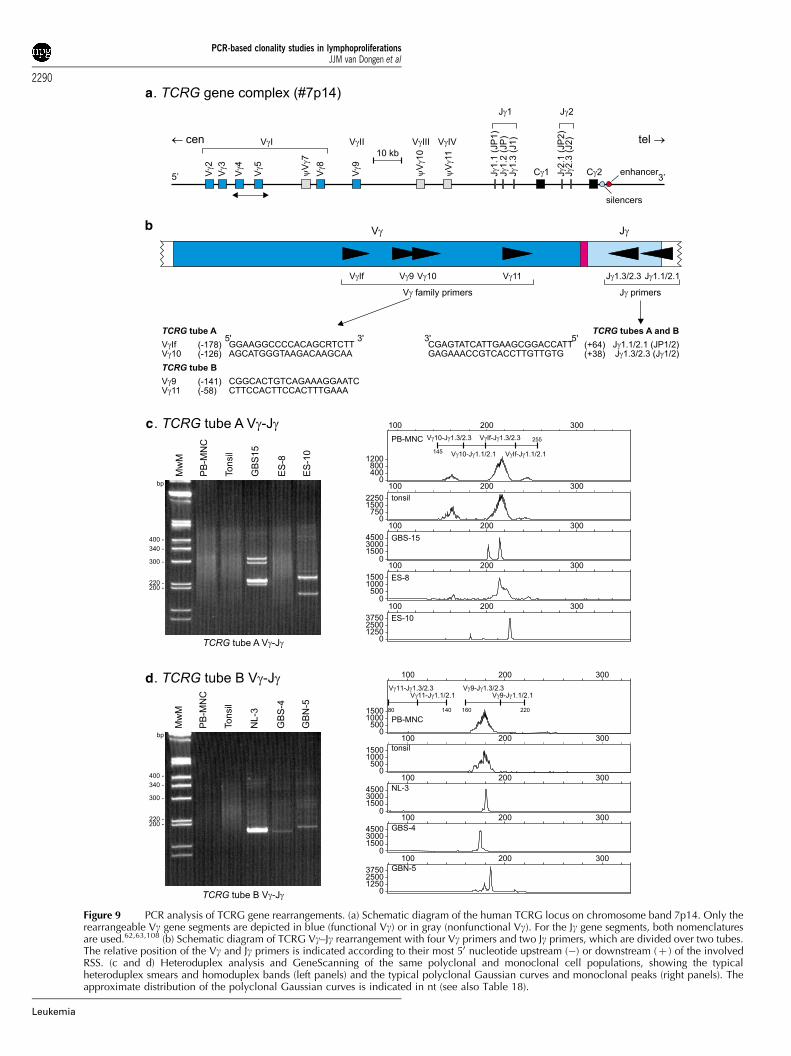
a
b
c
d
Figure 9 PCR analysis of TCRG gene rearrangements. (a) Schematic diagram of the human TCRG locus on chromosome band 7p14. Only therearrangeable Vg gene segments are depicted in blue (functional Vg) or in gray (nonfunctional Vg). For the Jg gene segments, both nomenclaturesare used.62,63,108 (b) Schematic diagram of TCRG Vg–Jg rearrangement with four Vg primers and two Jg primers, which are divided over two tubes.The relative position of the Vg and Jg primers is indicated according to their most 50 nucleotide upstream (�) or downstream (þ ) of the involvedRSS. (c and d) Heteroduplex analysis and GeneScanning of the same polyclonal and monoclonal cell populations, showing the typicalheteroduplex smears and homoduplex bands (left panels) and the typical polyclonal Gaussian curves and monoclonal peaks (right panels). Theapproximate distribution of the polyclonal Gaussian curves is indicated in nt (see also Table 18).
PCR-based clonality studies in lymphoproliferationsJJM van Dongen et al
2290
Leukemia
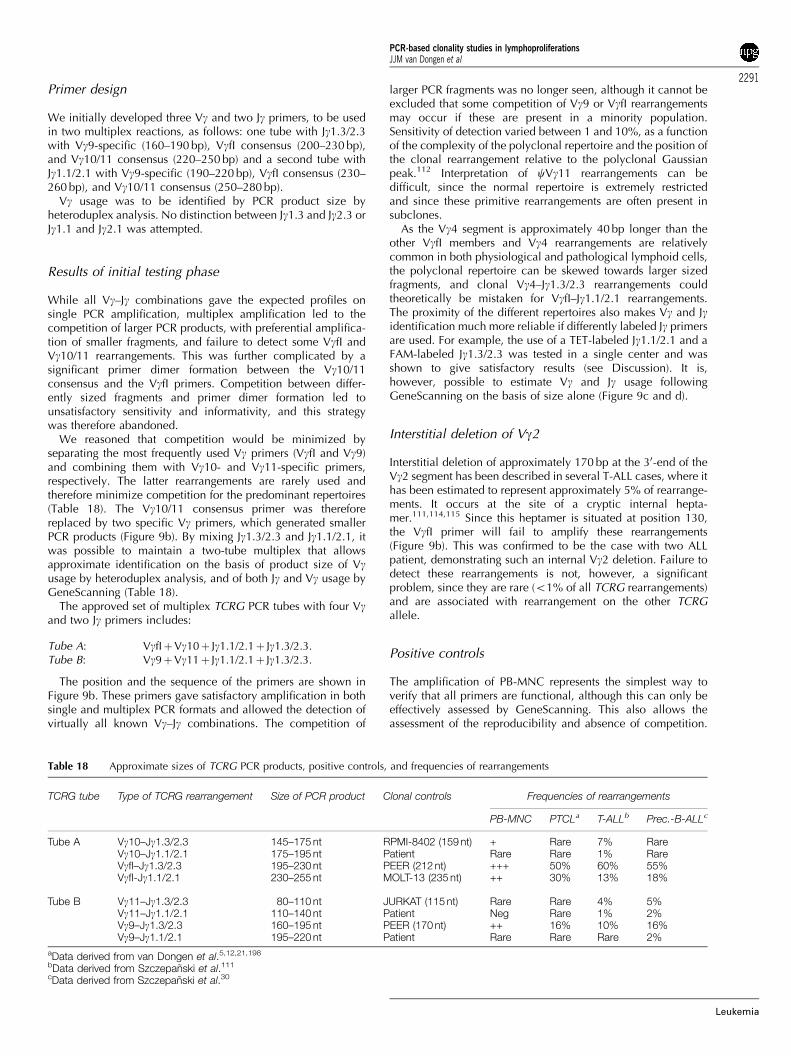
Primer design
We initially developed three Vg and two Jg primers, to be usedin two multiplex reactions, as follows: one tube with Jg1.3/2.3with Vg9-specific (160–190 bp), VgfI consensus (200–230 bp),and Vg10/11 consensus (220–250 bp) and a second tube withJg1.1/2.1 with Vg9-specific (190–220 bp), VgfI consensus (230–260 bp), and Vg10/11 consensus (250–280 bp).
Vg usage was to be identified by PCR product size byheteroduplex analysis. No distinction between Jg1.3 and Jg2.3 orJg1.1 and Jg2.1 was attempted.
Results of initial testing phase
While all Vg–Jg combinations gave the expected profiles onsingle PCR amplification, multiplex amplification led to thecompetition of larger PCR products, with preferential amplifica-tion of smaller fragments, and failure to detect some VgfI andVg10/11 rearrangements. This was further complicated by asignificant primer dimer formation between the Vg10/11consensus and the VgfI primers. Competition between differ-ently sized fragments and primer dimer formation led tounsatisfactory sensitivity and informativity, and this strategywas therefore abandoned.
We reasoned that competition would be minimized byseparating the most frequently used Vg primers (VgfI and Vg9)and combining them with Vg10- and Vg11-specific primers,respectively. The latter rearrangements are rarely used andtherefore minimize competition for the predominant repertoires(Table 18). The Vg10/11 consensus primer was thereforereplaced by two specific Vg primers, which generated smallerPCR products (Figure 9b). By mixing Jg1.3/2.3 and Jg1.1/2.1, itwas possible to maintain a two-tube multiplex that allowsapproximate identification on the basis of product size of Vgusage by heteroduplex analysis, and of both Jg and Vg usage byGeneScanning (Table 18).
The approved set of multiplex TCRG PCR tubes with four Vgand two Jg primers includes:
Tube A: VgfIþVg10þ Jg1.1/2.1þ Jg1.3/2.3.Tube B: Vg9þVg11þ Jg1.1/2.1þ Jg1.3/2.3.
The position and the sequence of the primers are shown inFigure 9b. These primers gave satisfactory amplification in bothsingle and multiplex PCR formats and allowed the detection ofvirtually all known Vg–Jg combinations. The competition of
larger PCR fragments was no longer seen, although it cannot beexcluded that some competition of Vg9 or VgfI rearrangementsmay occur if these are present in a minority population.Sensitivity of detection varied between 1 and 10%, as a functionof the complexity of the polyclonal repertoire and the position ofthe clonal rearrangement relative to the polyclonal Gaussianpeak.112 Interpretation of cVg11 rearrangements can bedifficult, since the normal repertoire is extremely restrictedand since these primitive rearrangements are often present insubclones.
As the Vg4 segment is approximately 40 bp longer than theother VgfI members and Vg4 rearrangements are relativelycommon in both physiological and pathological lymphoid cells,the polyclonal repertoire can be skewed towards larger sizedfragments, and clonal Vg4–Jg1.3/2.3 rearrangements couldtheoretically be mistaken for VgfI–Jg1.1/2.1 rearrangements.The proximity of the different repertoires also makes Vg and Jgidentification much more reliable if differently labeled Jg primersare used. For example, the use of a TET-labeled Jg1.1/2.1 and aFAM-labeled Jg1.3/2.3 was tested in a single center and wasshown to give satisfactory results (see Discussion). It is,however, possible to estimate Vg and Jg usage followingGeneScanning on the basis of size alone (Figure 9c and d).
Interstitial deletion of Vg2
Interstitial deletion of approximately 170 bp at the 30-end of theVg2 segment has been described in several T-ALL cases, where ithas been estimated to represent approximately 5% of rearrange-ments. It occurs at the site of a cryptic internal hepta-mer.111,114,115 Since this heptamer is situated at position 130,the VgfI primer will fail to amplify these rearrangements(Figure 9b). This was confirmed to be the case with two ALLpatient, demonstrating such an internal Vg2 deletion. Failure todetect these rearrangements is not, however, a significantproblem, since they are rare (o1% of all TCRG rearrangements)and are associated with rearrangement on the other TCRGallele.
Positive controls
The amplification of PB-MNC represents the simplest way toverify that all primers are functional, although this can only beeffectively assessed by GeneScanning. This also allows theassessment of the reproducibility and absence of competition.
Table 18 Approximate sizes of TCRG PCR products, positive controls, and frequencies of rearrangements
TCRG tube Type of TCRG rearrangement Size of PCR product Clonal controls Frequencies of rearrangements
PB-MNC PTCLa T-ALLb Prec.-B-ALLc
Tube A Vg10–Jg1.3/2.3 145–175 nt RPMI-8402 (159 nt) + Rare 7% RareVg10–Jg1.1/2.1 175–195 nt Patient Rare Rare 1% RareVgfI–Jg1.3/2.3 195–230 nt PEER (212 nt) +++ 50% 60% 55%VgfI-Jg1.1/2.1 230–255 nt MOLT-13 (235 nt) ++ 30% 13% 18%
Tube B Vg11–Jg1.3/2.3 80–110 nt JURKAT (115 nt) Rare Rare 4% 5%Vg11–Jg1.1/2.1 110–140 nt Patient Neg Rare 1% 2%Vg9–Jg1.3/2.3 160–195 nt PEER (170 nt) ++ 16% 10% 16%Vg9–Jg1.1/2.1 195–220 nt Patient Rare Rare Rare 2%
aData derived from van Dongen et al.5,12,21,198
bData derived from Szczepanski et al.111
cData derived from Szczepanski et al.30
PCR-based clonality studies in lymphoproliferationsJJM van Dongen et al
2291
Leukemia
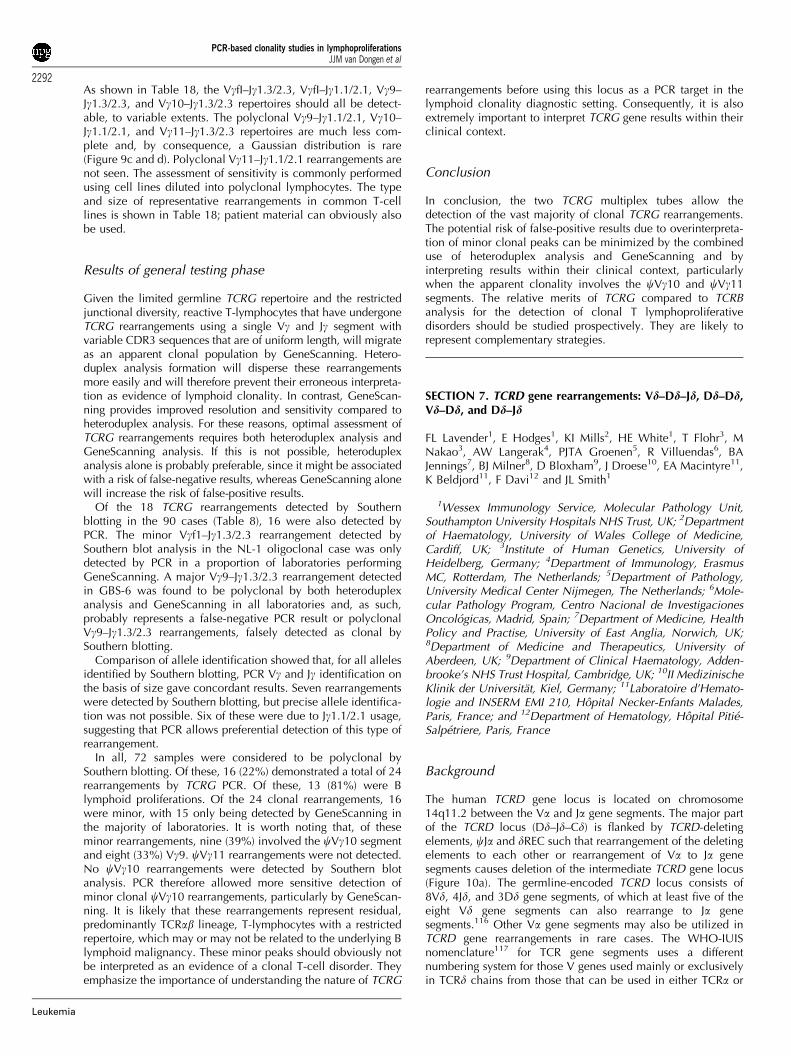
As shown in Table 18, the VgfI–Jg1.3/2.3, VgfI–Jg1.1/2.1, Vg9–Jg1.3/2.3, and Vg10–Jg1.3/2.3 repertoires should all be detect-able, to variable extents. The polyclonal Vg9–Jg1.1/2.1, Vg10–Jg1.1/2.1, and Vg11–Jg1.3/2.3 repertoires are much less com-plete and, by consequence, a Gaussian distribution is rare(Figure 9c and d). Polyclonal Vg11–Jg1.1/2.1 rearrangements arenot seen. The assessment of sensitivity is commonly performedusing cell lines diluted into polyclonal lymphocytes. The typeand size of representative rearrangements in common T-celllines is shown in Table 18; patient material can obviously alsobe used.
Results of general testing phase
Given the limited germline TCRG repertoire and the restrictedjunctional diversity, reactive T-lymphocytes that have undergoneTCRG rearrangements using a single Vg and Jg segment withvariable CDR3 sequences that are of uniform length, will migrateas an apparent clonal population by GeneScanning. Hetero-duplex analysis formation will disperse these rearrangementsmore easily and will therefore prevent their erroneous interpreta-tion as evidence of lymphoid clonality. In contrast, GeneScan-ning provides improved resolution and sensitivity compared toheteroduplex analysis. For these reasons, optimal assessment ofTCRG rearrangements requires both heteroduplex analysis andGeneScanning analysis. If this is not possible, heteroduplexanalysis alone is probably preferable, since it might be associatedwith a risk of false-negative results, whereas GeneScanning alonewill increase the risk of false-positive results.
Of the 18 TCRG rearrangements detected by Southernblotting in the 90 cases (Table 8), 16 were also detected byPCR. The minor Vgf1–Jg1.3/2.3 rearrangement detected bySouthern blot analysis in the NL-1 oligoclonal case was onlydetected by PCR in a proportion of laboratories performingGeneScanning. A major Vg9–Jg1.3/2.3 rearrangement detectedin GBS-6 was found to be polyclonal by both heteroduplexanalysis and GeneScanning in all laboratories and, as such,probably represents a false-negative PCR result or polyclonalVg9–Jg1.3/2.3 rearrangements, falsely detected as clonal bySouthern blotting.
Comparison of allele identification showed that, for all allelesidentified by Southern blotting, PCR Vg and Jg identification onthe basis of size gave concordant results. Seven rearrangementswere detected by Southern blotting, but precise allele identifica-tion was not possible. Six of these were due to Jg1.1/2.1 usage,suggesting that PCR allows preferential detection of this type ofrearrangement.
In all, 72 samples were considered to be polyclonal bySouthern blotting. Of these, 16 (22%) demonstrated a total of 24rearrangements by TCRG PCR. Of these, 13 (81%) were Blymphoid proliferations. Of the 24 clonal rearrangements, 16were minor, with 15 only being detected by GeneScanning inthe majority of laboratories. It is worth noting that, of theseminor rearrangements, nine (39%) involved the cVg10 segmentand eight (33%) Vg9. cVg11 rearrangements were not detected.No cVg10 rearrangements were detected by Southern blotanalysis. PCR therefore allowed more sensitive detection ofminor clonal cVg10 rearrangements, particularly by GeneScan-ning. It is likely that these rearrangements represent residual,predominantly TCRab lineage, T-lymphocytes with a restrictedrepertoire, which may or may not be related to the underlying Blymphoid malignancy. These minor peaks should obviously notbe interpreted as an evidence of a clonal T-cell disorder. Theyemphasize the importance of understanding the nature of TCRG
rearrangements before using this locus as a PCR target in thelymphoid clonality diagnostic setting. Consequently, it is alsoextremely important to interpret TCRG gene results within theirclinical context.
Conclusion
In conclusion, the two TCRG multiplex tubes allow thedetection of the vast majority of clonal TCRG rearrangements.The potential risk of false-positive results due to overinterpreta-tion of minor clonal peaks can be minimized by the combineduse of heteroduplex analysis and GeneScanning and byinterpreting results within their clinical context, particularlywhen the apparent clonality involves the cVg10 and cVg11segments. The relative merits of TCRG compared to TCRBanalysis for the detection of clonal T lymphoproliferativedisorders should be studied prospectively. They are likely torepresent complementary strategies.
SECTION 7. TCRD gene rearrangements: Vd–Dd–Jd, Dd–Dd,Vd–Dd, and Dd–Jd
FL Lavender1, E Hodges1, KI Mills2, HE White1, T Flohr3, MNakao3, AW Langerak4, PJTA Groenen5, R Villuendas6, BAJennings7, BJ Milner8, D Bloxham9, J Droese10, EA Macintyre11,K Beldjord11, F Davi12 and JL Smith1
1Wessex Immunology Service, Molecular Pathology Unit,Southampton University Hospitals NHS Trust, UK; 2Departmentof Haematology, University of Wales College of Medicine,Cardiff, UK; 3Institute of Human Genetics, University ofHeidelberg, Germany; 4Department of Immunology, ErasmusMC, Rotterdam, The Netherlands; 5Department of Pathology,University Medical Center Nijmegen, The Netherlands; 6Mole-cular Pathology Program, Centro Nacional de InvestigacionesOncologicas, Madrid, Spain; 7Department of Medicine, HealthPolicy and Practise, University of East Anglia, Norwich, UK;8Department of Medicine and Therapeutics, University ofAberdeen, UK; 9Department of Clinical Haematology, Adden-brooke’s NHS Trust Hospital, Cambridge, UK; 10II MedizinischeKlinik der Universitat, Kiel, Germany; 11Laboratoire d’Hemato-logie and INSERM EMI 210, Hopital Necker-Enfants Malades,Paris, France; and 12Department of Hematology, Hopital Pitie-Salpetriere, Paris, France
Background
The human TCRD gene locus is located on chromosome14q11.2 between the Va and Ja gene segments. The major partof the TCRD locus (Dd–Jd–Cd) is flanked by TCRD-deletingelements, cJa and dREC such that rearrangement of the deletingelements to each other or rearrangement of Va to Ja genesegments causes deletion of the intermediate TCRD gene locus(Figure 10a). The germline-encoded TCRD locus consists of8Vd, 4Jd, and 3Dd gene segments, of which at least five of theeight Vd gene segments can also rearrange to Ja genesegments.116 Other Va gene segments may also be utilized inTCRD gene rearrangements in rare cases. The WHO-IUISnomenclature117 for TCR gene segments uses a differentnumbering system for those V genes used mainly or exclusivelyin TCRd chains from those that can be used in either TCRa or
PCR-based clonality studies in lymphoproliferationsJJM van Dongen et al
2292
Leukemia
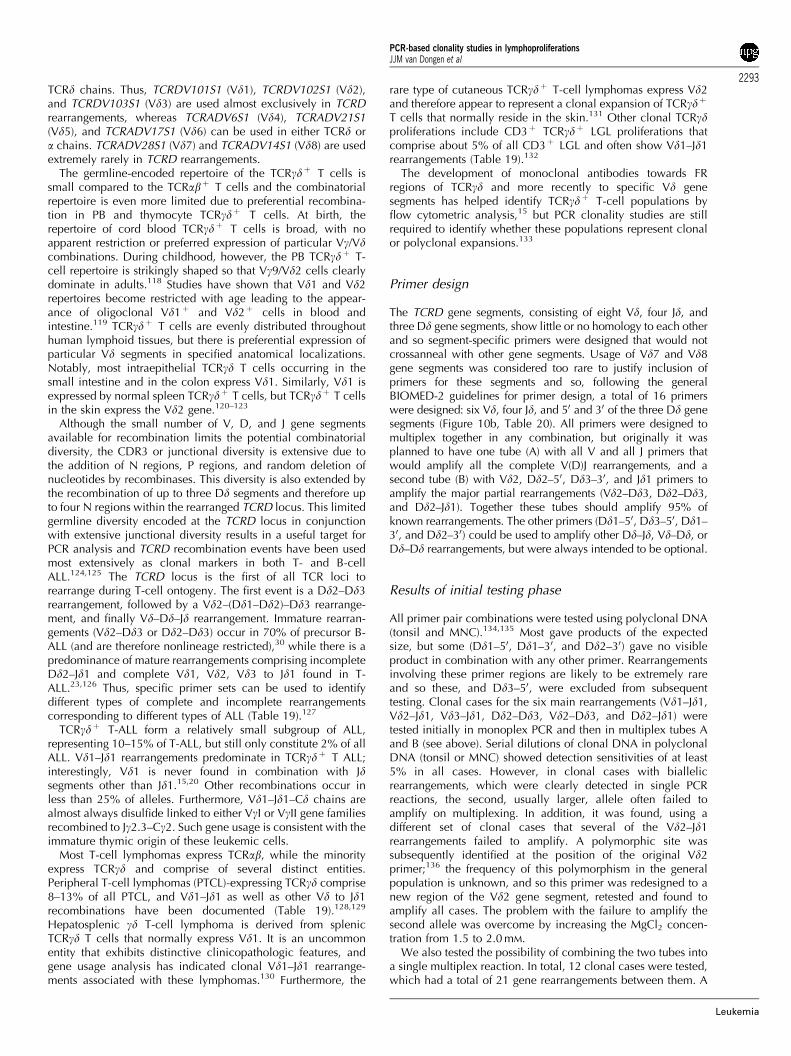
TCRd chains. Thus, TCRDV101S1 (Vd1), TCRDV102S1 (Vd2),and TCRDV103S1 (Vd3) are used almost exclusively in TCRDrearrangements, whereas TCRADV6S1 (Vd4), TCRADV21S1(Vd5), and TCRADV17S1 (Vd6) can be used in either TCRd ora chains. TCRADV28S1 (Vd7) and TCRADV14S1 (Vd8) are usedextremely rarely in TCRD rearrangements.
The germline-encoded repertoire of the TCRgdþ T cells issmall compared to the TCRabþ T cells and the combinatorialrepertoire is even more limited due to preferential recombina-tion in PB and thymocyte TCRgdþ T cells. At birth, therepertoire of cord blood TCRgdþ T cells is broad, with noapparent restriction or preferred expression of particular Vg/Vdcombinations. During childhood, however, the PB TCRgdþ T-cell repertoire is strikingly shaped so that Vg9/Vd2 cells clearlydominate in adults.118 Studies have shown that Vd1 and Vd2repertoires become restricted with age leading to the appear-ance of oligoclonal Vd1þ and Vd2þ cells in blood andintestine.119 TCRgdþ T cells are evenly distributed throughouthuman lymphoid tissues, but there is preferential expression ofparticular Vd segments in specified anatomical localizations.Notably, most intraepithelial TCRgd T cells occurring in thesmall intestine and in the colon express Vd1. Similarly, Vd1 isexpressed by normal spleen TCRgdþ T cells, but TCRgdþ T cellsin the skin express the Vd2 gene.120–123
Although the small number of V, D, and J gene segmentsavailable for recombination limits the potential combinatorialdiversity, the CDR3 or junctional diversity is extensive due tothe addition of N regions, P regions, and random deletion ofnucleotides by recombinases. This diversity is also extended bythe recombination of up to three Dd segments and therefore upto four N regions within the rearranged TCRD locus. This limitedgermline diversity encoded at the TCRD locus in conjunctionwith extensive junctional diversity results in a useful target forPCR analysis and TCRD recombination events have been usedmost extensively as clonal markers in both T- and B-cellALL.124,125 The TCRD locus is the first of all TCR loci torearrange during T-cell ontogeny. The first event is a Dd2–Dd3rearrangement, followed by a Vd2–(Dd1–Dd2)–Dd3 rearrange-ment, and finally Vd–Dd–Jd rearrangement. Immature rearran-gements (Vd2–Dd3 or Dd2–Dd3) occur in 70% of precursor B-ALL (and are therefore nonlineage restricted),30 while there is apredominance of mature rearrangements comprising incompleteDd2–Jd1 and complete Vd1, Vd2, Vd3 to Jd1 found in T-ALL.23,126 Thus, specific primer sets can be used to identifydifferent types of complete and incomplete rearrangementscorresponding to different types of ALL (Table 19).127
TCRgdþ T-ALL form a relatively small subgroup of ALL,representing 10–15% of T-ALL, but still only constitute 2% of allALL. Vd1–Jd1 rearrangements predominate in TCRgdþ T ALL;interestingly, Vd1 is never found in combination with Jdsegments other than Jd1.15,20 Other recombinations occur inless than 25% of alleles. Furthermore, Vd1–Jd1–Cd chains arealmost always disulfide linked to either VgI or VgII gene familiesrecombined to Jg2.3–Cg2. Such gene usage is consistent with theimmature thymic origin of these leukemic cells.
Most T-cell lymphomas express TCRab, while the minorityexpress TCRgd and comprise of several distinct entities.Peripheral T-cell lymphomas (PTCL)-expressing TCRgd comprise8–13% of all PTCL, and Vd1–Jd1 as well as other Vd to Jd1recombinations have been documented (Table 19).128,129
Hepatosplenic gd T-cell lymphoma is derived from splenicTCRgd T cells that normally express Vd1. It is an uncommonentity that exhibits distinctive clinicopathologic features, andgene usage analysis has indicated clonal Vd1–Jd1 rearrange-ments associated with these lymphomas.130 Furthermore, the
rare type of cutaneous TCRgdþ T-cell lymphomas express Vd2and therefore appear to represent a clonal expansion of TCRgdþ
T cells that normally reside in the skin.131 Other clonal TCRgdproliferations include CD3þ TCRgdþ LGL proliferations thatcomprise about 5% of all CD3þ LGL and often show Vd1–Jd1rearrangements (Table 19).132
The development of monoclonal antibodies towards FRregions of TCRgd and more recently to specific Vd genesegments has helped identify TCRgdþ T-cell populations byflow cytometric analysis,15 but PCR clonality studies are stillrequired to identify whether these populations represent clonalor polyclonal expansions.133
Primer design
The TCRD gene segments, consisting of eight Vd, four Jd, andthree Dd gene segments, show little or no homology to each otherand so segment-specific primers were designed that would notcrossanneal with other gene segments. Usage of Vd7 and Vd8gene segments was considered too rare to justify inclusion ofprimers for these segments and so, following the generalBIOMED-2 guidelines for primer design, a total of 16 primerswere designed: six Vd, four Jd, and 50 and 30 of the three Dd genesegments (Figure 10b, Table 20). All primers were designed tomultiplex together in any combination, but originally it wasplanned to have one tube (A) with all V and all J primers thatwould amplify all the complete V(D)J rearrangements, and asecond tube (B) with Vd2, Dd2–50, Dd3–30, and Jd1 primers toamplify the major partial rearrangements (Vd2–Dd3, Dd2–Dd3,and Dd2–Jd1). Together these tubes should amplify 95% ofknown rearrangements. The other primers (Dd1–50, Dd3–50, Dd1–30, and Dd2–30) could be used to amplify other Dd–Jd, Vd–Dd, orDd–Dd rearrangements, but were always intended to be optional.
Results of initial testing phase
All primer pair combinations were tested using polyclonal DNA(tonsil and MNC).134,135 Most gave products of the expectedsize, but some (Dd1–50, Dd1–30, and Dd2–30) gave no visibleproduct in combination with any other primer. Rearrangementsinvolving these primer regions are likely to be extremely rareand so these, and Dd3–50, were excluded from subsequenttesting. Clonal cases for the six main rearrangements (Vd1–Jd1,Vd2–Jd1, Vd3–Jd1, Dd2–Dd3, Vd2–Dd3, and Dd2–Jd1) weretested initially in monoplex PCR and then in multiplex tubes Aand B (see above). Serial dilutions of clonal DNA in polyclonalDNA (tonsil or MNC) showed detection sensitivities of at least5% in all cases. However, in clonal cases with biallelicrearrangements, which were clearly detected in single PCRreactions, the second, usually larger, allele often failed toamplify on multiplexing. In addition, it was found, using adifferent set of clonal cases that several of the Vd2–Jd1rearrangements failed to amplify. A polymorphic site wassubsequently identified at the position of the original Vd2primer;136 the frequency of this polymorphism in the generalpopulation is unknown, and so this primer was redesigned to anew region of the Vd2 gene segment, retested and found toamplify all cases. The problem with the failure to amplify thesecond allele was overcome by increasing the MgCl2 concen-tration from 1.5 to 2.0 mM.
We also tested the possibility of combining the two tubes intoa single multiplex reaction. In total, 12 clonal cases were tested,which had a total of 21 gene rearrangements between them. A
PCR-based clonality studies in lymphoproliferationsJJM van Dongen et al
2293
Leukemia
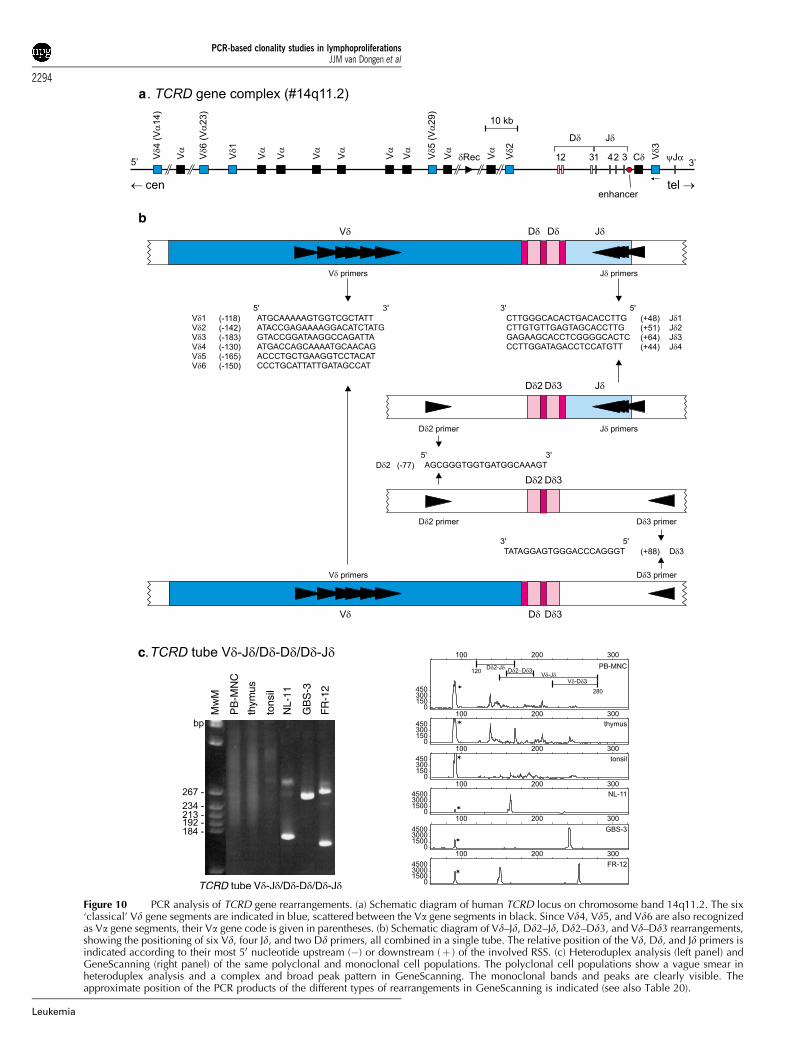
a
b
c
Figure 10 PCR analysis of TCRD gene rearrangements. (a) Schematic diagram of human TCRD locus on chromosome band 14q11.2. The six‘classical’ Vd gene segments are indicated in blue, scattered between the Va gene segments in black. Since Vd4, Vd5, and Vd6 are also recognizedas Va gene segments, their Va gene code is given in parentheses. (b) Schematic diagram of Vd–Jd, Dd2–Jd, Dd2–Dd3, and Vd–Dd3 rearrangements,showing the positioning of six Vd, four Jd, and two Dd primers, all combined in a single tube. The relative position of the Vd, Dd, and Jd primers isindicated according to their most 50 nucleotide upstream (�) or downstream (þ ) of the involved RSS. (c) Heteroduplex analysis (left panel) andGeneScanning (right panel) of the same polyclonal and monoclonal cell populations. The polyclonal cell populations show a vague smear inheteroduplex analysis and a complex and broad peak pattern in GeneScanning. The monoclonal bands and peaks are clearly visible. Theapproximate position of the PCR products of the different types of rearrangements in GeneScanning is indicated (see also Table 20).
PCR-based clonality studies in lymphoproliferationsJJM van Dongen et al
2294
Leukemia

single multiplex tube containing 12 primers (six Vd, four Jd,Dd2–50, and Dd3–30) was used with ABI Gold Buffer and2.0 mM MgCl2 to amplify all the cases. All gene rearrangementswere indeed detected with a sensitivity of 0.5–10% byheteroduplex analysis when diluted in polyclonal MNC DNA(Table 21). The only problem with combining all TCRD primersin a single tube was the appearance of a nonspecific band atabout 90 bp in all amplifications, which was not present whenthe two separate multiplex tubes were used. Since the band wasoutside the size range of the TCRD products and did notinterfere with interpretation, it was not considered to be aproblem.
Results of general testing phase
The testing of the 90 Southern blot-defined samples for WorkPackage 1 in 10 laboratories raised some general issues aboutthe TCRD protocol:
(i) Interpretation of some GeneScanning results was difficult.Owing to the large size range of products for the TCRDlocus, there is no classical Gaussian distribution forpolyclonal samples (see Figure 10c), and this coupled withthe low usage of TCRD in many samples meant that in somecases it was hard to determine whether a sample waspolyclonal or clonal. The same problem did not arise withheteroduplex analysis and so the recommendation is thatGeneScanning should only be used for TCRD with extremecare and awareness of the potential problems.
(ii) The 90 bp nonspecific band was quite intense in somelaboratories, but less so in others. It appeared to be weakerwhen using Buffer II rather than Gold Buffer (confirmed bysubsequent testing) and is also sensitive to MgCl2 concen-tration, becoming more intense as MgCl2 concentrationincreases. This product has now been sequenced and
found to be an unrelated gene utilizing the Dd2 and Jd3primers.
The results of the general testing of the 90 Southern blot-defined samples showed that the overall concordance of all thePCR groups doing the testing was very high (95%). Of the 90cases, six were Southern blot positive for TCRD clonalrearrangements, five of which were found to be clonal byPCR. The remaining case (DE-10, a T-ALL with high tumor load)was found to be polyclonal by all labs. Of the 84 Southern blot-negative cases, 75 were found to be polyclonal by PCR, fourwere found to be clonal, and the remaining five cases showeddiscordance between the GeneScanning and heteroduplexanalysis results. Of the clonal cases, two (DE-2 and GBS-9)were T-rich B-NHLs with presumably low tumor load and so theresults may reflect the increased sensitivity of PCR over Southernblotting. The other two clonal cases (GBS-15 and ES-7) had hightumor load. Of the five cases, which showed discrepancybetween the GeneScanning and heteroduplex analysis results,one (NL-1) was a difficult oligoclonal case, which causedproblems for several other loci. The remaining four were foundto be polyclonal by heteroduplex analysis and clonal byGeneScanning. In three of the cases (NL-13, NL-15, and NL-18) this may reflect the greater sensitivity of GeneScanning overheteroduplex analysis, but the remaining case (PT-1, a reactivelymph node) may be attributed to ‘pseudoclonality’ onGeneScanning because of the limited repertoire of TCRD usagein some samples.
Conclusion
In conclusion, the recommended protocol for the detection ofTCRD gene rearrangements (as indicated in Table 4) is a single-tube assay containing 12 primers for the detection of all majorVd(D)Jd, Vd–Dd, Dd–Dd, and Dd–Jd rearrangements using Buffer
Table 19 TCRD gene rearrangements in T-cell malignancies
T-cell malignancy Biallelic TCRD deletions (%) At least one TCRD allele rearranged (%) Dominant types of rearrangements
Thymic derivedCD3� T-ALL (T-LBL) 10 80 Vd–Jd1/Dd2–Jd1
Vd2–Dd3/Dd2–Dd3TCRgd+ T-ALL (T-LBL) 0 100 Vd–Jd1/Dd2–Jd1TCRab+ T-ALL (T-LBL) 65 35 Various
Post-thymicATLL, CTLL, T-PLL 75–90 10–25 VariousTCRab+ T-LGL 475 o25 VariousTCRgd+ T-LGL 0 100 Vd1–Jd1/Dd2–Jd1T-NHL 475 o25 Various
Table 20 Approximate sizes of PCR products with TCRD primers
Jd1 Jd2 Jd3 Jd4 Dd3–30
Vd1 170–210 nt 170–210 nt 180–220 nt 160–200 nt B220 ntVd2 200–240 nt 200–240 nt 200–240 nt 190–230 nt B240 ntVd3 230–270 nt 230–270 nt 240–280 nt 220–260 nt B280 ntVd4 180–220 nt 180–220 nt 190–230 nt 170–210 nt B230 ntVd5 220–260 nt 220–260 nt 230–270 nt 210–250 nt B270 ntVd6 200–240 nt 200–240 nt 210–250 nt 190–230 nt B250 ntDd2-50 B130 nt B140 nt B150 nt B130 nt B190 nt
PCR-based clonality studies in lymphoproliferationsJJM van Dongen et al
2295
Leukemia
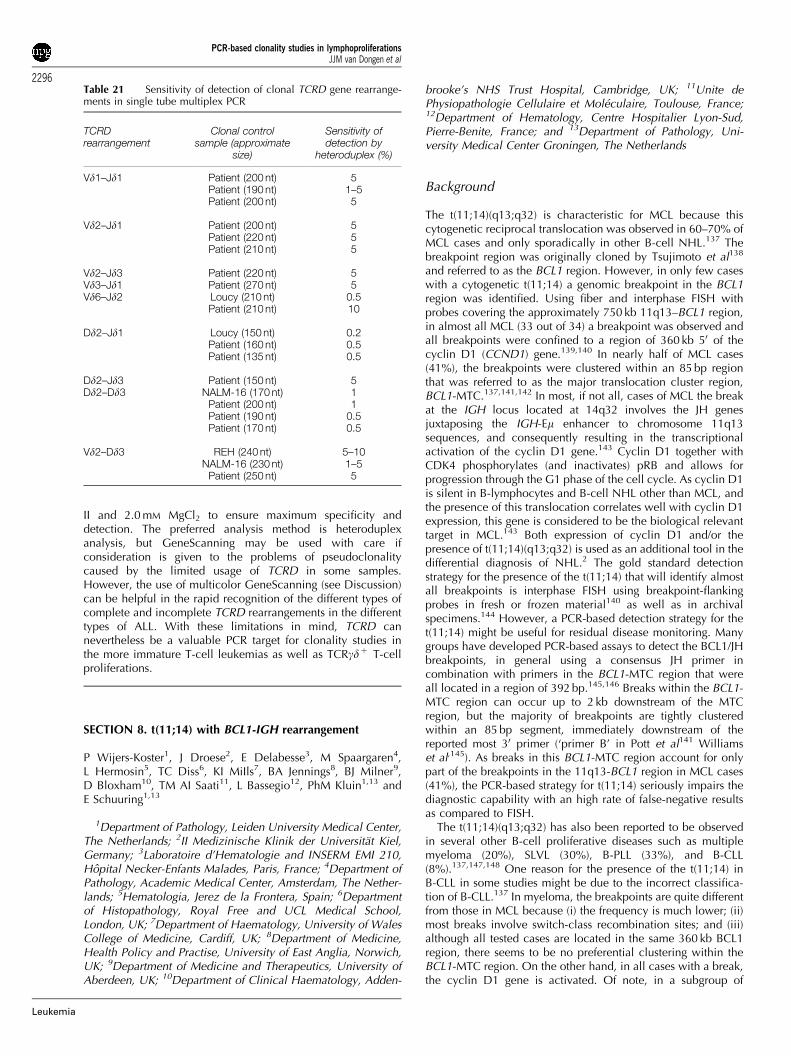
II and 2.0 mM MgCl2 to ensure maximum specificity anddetection. The preferred analysis method is heteroduplexanalysis, but GeneScanning may be used with care ifconsideration is given to the problems of pseudoclonalitycaused by the limited usage of TCRD in some samples.However, the use of multicolor GeneScanning (see Discussion)can be helpful in the rapid recognition of the different types ofcomplete and incomplete TCRD rearrangements in the differenttypes of ALL. With these limitations in mind, TCRD cannevertheless be a valuable PCR target for clonality studies inthe more immature T-cell leukemias as well as TCRgdþ T-cellproliferations.
SECTION 8. t(11;14) with BCL1-IGH rearrangement
P Wijers-Koster1, J Droese2, E Delabesse3, M Spaargaren4,L Hermosin5, TC Diss6, KI MiIls7, BA Jennings8, BJ Milner9,D Bloxham10, TM AI Saati11, L Bassegio12, PhM Kluin1,13 andE Schuuring1,13
1Department of Pathology, Leiden University Medical Center,The Netherlands; 2II Medizinische Klinik der Universitat Kiel,Germany; 3Laboratoire d’Hematologie and INSERM EMI 210,Hopital Necker-Enfants Malades, Paris, France; 4Department ofPathology, Academic Medical Center, Amsterdam, The Nether-lands; 5Hematologia, Jerez de la Frontera, Spain; 6Departmentof Histopathology, Royal Free and UCL Medical School,London, UK; 7Department of Haematology, University of WalesCollege of Medicine, Cardiff, UK; 8Department of Medicine,Health Policy and Practise, University of East Anglia, Norwich,UK; 9Department of Medicine and Therapeutics, University ofAberdeen, UK; 10Department of Clinical Haematology, Adden-
brooke’s NHS Trust Hospital, Cambridge, UK; 11Unite dePhysiopathologie Cellulaire et Moleculaire, Toulouse, France;12Department of Hematology, Centre Hospitalier Lyon-Sud,Pierre-Benite, France; and 13Department of Pathology, Uni-versity Medical Center Groningen, The Netherlands
Background
The t(11;14)(q13;q32) is characteristic for MCL because thiscytogenetic reciprocal translocation was observed in 60–70% ofMCL cases and only sporadically in other B-cell NHL.137 Thebreakpoint region was originally cloned by Tsujimoto et al138
and referred to as the BCL1 region. However, in only few caseswith a cytogenetic t(11;14) a genomic breakpoint in the BCL1region was identified. Using fiber and interphase FISH withprobes covering the approximately 750 kb 11q13–BCL1 region,in almost all MCL (33 out of 34) a breakpoint was observed andall breakpoints were confined to a region of 360 kb 50 of thecyclin D1 (CCND1) gene.139,140 In nearly half of MCL cases(41%), the breakpoints were clustered within an 85 bp regionthat was referred to as the major translocation cluster region,BCL1-MTC.137,141,142 In most, if not all, cases of MCL the breakat the IGH locus located at 14q32 involves the JH genesjuxtaposing the IGH-Em enhancer to chromosome 11q13sequences, and consequently resulting in the transcriptionalactivation of the cyclin D1 gene.143 Cyclin D1 together withCDK4 phosphorylates (and inactivates) pRB and allows forprogression through the G1 phase of the cell cycle. As cyclin D1is silent in B-lymphocytes and B-cell NHL other than MCL, andthe presence of this translocation correlates well with cyclin D1expression, this gene is considered to be the biological relevanttarget in MCL.143 Both expression of cyclin D1 and/or thepresence of t(11;14)(q13;q32) is used as an additional tool in thedifferential diagnosis of NHL.2 The gold standard detectionstrategy for the presence of the t(11;14) that will identify almostall breakpoints is interphase FISH using breakpoint-flankingprobes in fresh or frozen material140 as well as in archivalspecimens.144 However, a PCR-based detection strategy for thet(11;14) might be useful for residual disease monitoring. Manygroups have developed PCR-based assays to detect the BCL1/JHbreakpoints, in general using a consensus JH primer incombination with primers in the BCL1-MTC region that wereall located in a region of 392 bp.145,146 Breaks within the BCL1-MTC region can occur up to 2 kb downstream of the MTCregion, but the majority of breakpoints are tightly clusteredwithin an 85 bp segment, immediately downstream of thereported most 30 primer (‘primer B’ in Pott et al141 Williamset al,145). As breaks in this BCL1-MTC region account for onlypart of the breakpoints in the 11q13-BCL1 region in MCL cases(41%), the PCR-based strategy for t(11;14) seriously impairs thediagnostic capability with an high rate of false-negative resultsas compared to FISH.
The t(11;14)(q13;q32) has also been reported to be observedin several other B-cell proliferative diseases such as multiplemyeloma (20%), SLVL (30%), B-PLL (33%), and B-CLL(8%).137,147,148 One reason for the presence of the t(11;14) inB-CLL in some studies might be due to the incorrect classifica-tion of B-CLL.137 In myeloma, the breakpoints are quite differentfrom those in MCL because (i) the frequency is much lower; (ii)most breaks involve switch-class recombination sites; and (iii)although all tested cases are located in the same 360 kb BCL1region, there seems to be no preferential clustering within theBCL1-MTC region. On the other hand, in all cases with a break,the cyclin D1 gene is activated. Of note, in a subgroup of
Table 21 Sensitivity of detection of clonal TCRD gene rearrange-ments in single tube multiplex PCR
TCRDrearrangement
Clonal controlsample (approximate
size)
Sensitivity ofdetection by
heteroduplex (%)
Vd1–Jd1 Patient (200 nt) 5Patient (190 nt) 1–5Patient (200 nt) 5
Vd2–Jd1 Patient (200 nt) 5Patient (220 nt) 5Patient (210 nt) 5
Vd2–Jd3 Patient (220 nt) 5Vd3–Jd1 Patient (270 nt) 5Vd6–Jd2 Loucy (210 nt) 0.5
Patient (210 nt) 10
Dd2–Jd1 Loucy (150 nt) 0.2Patient (160 nt) 0.5Patient (135 nt) 0.5
Dd2–Jd3 Patient (150 nt) 5Dd2–Dd3 NALM-16 (170 nt) 1
Patient (200 nt) 1Patient (190 nt) 0.5Patient (170 nt) 0.5
Vd2–Dd3 REH (240 nt) 5–10NALM-16 (230 nt) 1–5
Patient (250 nt) 5
PCR-based clonality studies in lymphoproliferationsJJM van Dongen et al
2296
Leukemia
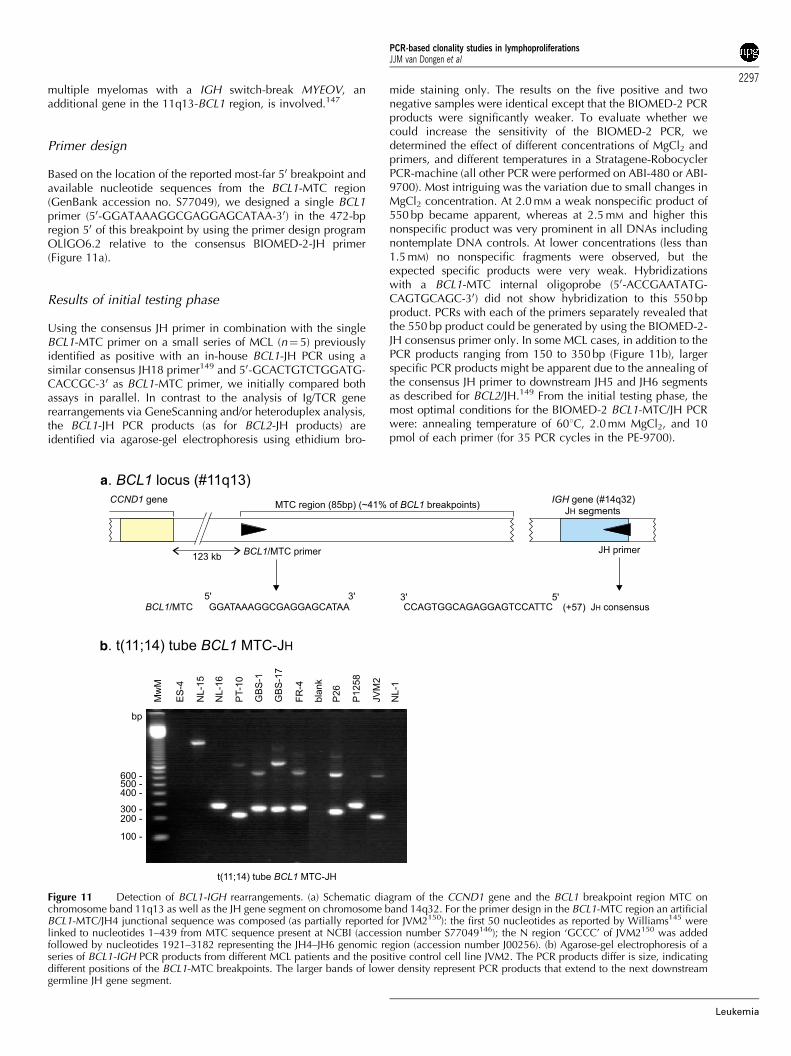
multiple myelomas with a IGH switch-break MYEOV, anadditional gene in the 11q13-BCL1 region, is involved.147
Primer design
Based on the location of the reported most-far 50 breakpoint andavailable nucleotide sequences from the BCL1-MTC region(GenBank accession no. S77049), we designed a single BCL1primer (50-GGATAAAGGCGAGGAGCATAA-30) in the 472-bpregion 50 of this breakpoint by using the primer design programOLlGO6.2 relative to the consensus BIOMED-2-JH primer(Figure 11a).
Results of initial testing phase
Using the consensus JH primer in combination with the singleBCL1-MTC primer on a small series of MCL (n¼ 5) previouslyidentified as positive with an in-house BCL1-JH PCR using asimilar consensus JH18 primer149 and 50-GCACTGTCTGGATG-CACCGC-30 as BCL1-MTC primer, we initially compared bothassays in parallel. In contrast to the analysis of Ig/TCR generearrangements via GeneScanning and/or heteroduplex analysis,the BCL1-JH PCR products (as for BCL2-JH products) areidentified via agarose-gel electrophoresis using ethidium bro-
mide staining only. The results on the five positive and twonegative samples were identical except that the BIOMED-2 PCRproducts were significantly weaker. To evaluate whether wecould increase the sensitivity of the BIOMED-2 PCR, wedetermined the effect of different concentrations of MgCl2 andprimers, and different temperatures in a Stratagene-RobocyclerPCR-machine (all other PCR were performed on ABI-480 or ABI-9700). Most intriguing was the variation due to small changes inMgCl2 concentration. At 2.0 mM a weak nonspecific product of550 bp became apparent, whereas at 2.5 mM and higher thisnonspecific product was very prominent in all DNAs includingnontemplate DNA controls. At lower concentrations (less than1.5 mM) no nonspecific fragments were observed, but theexpected specific products were very weak. Hybridizationswith a BCL1-MTC internal oligoprobe (50-ACCGAATATG-CAGTGCAGC-30) did not show hybridization to this 550 bpproduct. PCRs with each of the primers separately revealed thatthe 550 bp product could be generated by using the BIOMED-2-JH consensus primer only. In some MCL cases, in addition to thePCR products ranging from 150 to 350 bp (Figure 11b), largerspecific PCR products might be apparent due to the annealing ofthe consensus JH primer to downstream JH5 and JH6 segmentsas described for BCL2/JH.149 From the initial testing phase, themost optimal conditions for the BIOMED-2 BCL1-MTC/JH PCRwere: annealing temperature of 601C, 2.0 mM MgCl2, and 10pmol of each primer (for 35 PCR cycles in the PE-9700).
a
b
Figure 11 Detection of BCL1-IGH rearrangements. (a) Schematic diagram of the CCND1 gene and the BCL1 breakpoint region MTC onchromosome band 11q13 as well as the JH gene segment on chromosome band 14q32. For the primer design in the BCL1-MTC region an artificialBCL1-MTC/JH4 junctional sequence was composed (as partially reported for JVM2150): the first 50 nucleotides as reported by Williams145 werelinked to nucleotides 1–439 from MTC sequence present at NCBI (accession number S77049146); the N region ‘GCCC’ of JVM2150 was addedfollowed by nucleotides 1921–3182 representing the JH4–JH6 genomic region (accession number J00256). (b) Agarose-gel electrophoresis of aseries of BCL1-IGH PCR products from different MCL patients and the positive control cell line JVM2. The PCR products differ is size, indicatingdifferent positions of the BCL1-MTC breakpoints. The larger bands of lower density represent PCR products that extend to the next downstreamgermline JH gene segment.
PCR-based clonality studies in lymphoproliferationsJJM van Dongen et al
2297
Leukemia

To evaluate the specificity of the BIOMED-2 PCR on a largerseries of cases, the BCL1-MTC/JH PCR was performed in threelaboratories on DNA from a total of 25 cases MCL that were allpreviously identified as positive with in-house BCL1/JH PCR,and from 18 negative controls. None of the negative casesrevealed a PCR product, whereas 22 of 25 positive casesshowed products of the expected size. In the three cases that didnot reveal a product on agarose gel, a product was detected withGeneScanning suggesting that the sensitivity is lower whencompared to in-house PCR (see next paragraph).
The sensitivity of the PCR was evaluated by amplifying DNAdilutions of an MCL in normal tonsillar DNA. Sensitivitybetween 10�3 and 10�4 was observed on agarose gel usingthe developed PCR primers. An in-house PCR performed inparallel on the same samples was at least � 10 more sensitive.Hybridizations with the in-house BCL1-MTC-oligoprobe re-vealed a � 10–100 higher sensitivity of both PCRs. Dilutionswith DNA of an established cell line JVM2 (available throughDSMZ; http://www.dsmz.de) with a BCL1-MTC/JH4 break-point150 is used as our standard positive control. As a negativecontrol normal tonsillar tissue or PB cells might be used, butalmost any non-MCL B-cell NHL should be suitable because ofthe very low frequency of this aberration.137
Results of general testing phase
To evaluate interlaboratory variations for the detection ofbreakpoints at the BCL1-MTC region, 10 groups participated inthe analysis of DNA from a series of 90 histologically definedmalignant and reactive lymphoproliferations (see Table 8) usingthe BCL1-MTC/JH PCR protocol. All cases were defined for theirstatus at the Ig and TCR loci using Southern hybridizationtechniques. Of the 90 cases, seven were histologically character-ized as MCL. All seven MCL cases were shown to have a clonalIGH rearrangement by Southern hybridization. The assessment ofrearrangements within the BCL1-MTC region at chromosome11q13 by either Southern hybridization or FISH was notperformed in all cases. In six of the seven MCL cases, the PCRproduct was identified in all 10 laboratories. In MCL case NL-15in six of the laboratories the expected 1.8 kb PCR product wasidentified. This particular case carries an exceptional breakpointwith an uncommon large PCR product (normally ranging from150 to 350 bp) and represents the 30-most-far detectable BCL1-MTC breakpoint to our knowledge. In two of six labs, the PCRproduct was observed but initially considered as nonspecificbecause of its uncommon size. In ES-4, characterized histologi-cally as MCL in none of the 10 labs, a PCR product could bedetected, suggesting that this case carries a breakpoint outside theBCL1-MTC. It should be stressed that the MCL cases submitted tothis series for the general testing phase were selected and thus areexpected to carry breaks at the BCL1-MTC region at a higherincidence than normal. Importantly, except for one single case(FR-1), in all 83 other non-MCL cases including 16 cases thatwere histologically characterized as B-CLL, no BCL1/JH PCRproduct was detected in any laboratory. In case FR-1 histologi-cally characterized as B-CLL, in three of the 10 labs a product wasidentified indicating that the number of cells with this break islow. The IGH status determined by Southern blot analysisrevealed that this sample was composed of 90% clonal B cellsin good agreement with the histological examination (seeTable 8). PCR-based B-cell clonality analyses for IGH and IGK(sensitivity of approximately 1%) revealed a single clone andSouthern blot analysis for IGK showed a single major IGKrearrangement only (see Table 8). In addition, Northern blot
analysis for expression of cyclin D1 did not show overexpression.All these data suggested that the very small number (less than 1%)of t(11;14)-positive cells represent either (i) a subclone derivedfrom the B-CLL, (ii) an independent second B malignancy, or (iii)normal B-cells as described for t(14;18)-positive B-cells in normalindividuals.149 However, with the available data of this patient atpresent, we cannot discriminate between these three alternatives.In summary, the analysis by the 10 laboratories illustrates the highspecificity of the BCL1/JH PCR strategy.
To evaluate the presence of possible false-negative cases dueto the relative low sensitivity of the BIOMED-2 PCR, in onelaboratory (LUMC, Leiden), the previously described in-housePCR (with about 10-fold higher sensitivity) was performed onDNA of all 90 cases and the PCR products of both assays werealso hybridized with an internal-BCL1-MTC oligoprobe thatincreases the sensitivity another 10 to 100-fold. This analysisrevealed no PCR products in other cases.
Conclusion
We conclude that the sensitivity of the BIOMED-2 BCL1/JH-PCR(between 10�3 and 10�4) is sufficiently high for the detection ofthe BCL1/JH breakpoint in diagnostic material. The results of thisapproach are very encouraging and suggest that the definition ofcommon approaches and reaction conditions can minimizeerroneous results. However, it should be remembered thatmaximally 40–50% of the t(11;14) breakpoints in MCL will bedetected by PCR only and that for diagnosis additional detectiontools are necessary.
SECTION 9. t(14;18) with BCL2-IGH rearrangement
PAS Evans1, C Bastard2, E Delabesse3, EA Macintyre3, P Wijers-Koster4, E Schuuring4,5, E Moreau6, D Gonzalez7, KI Mills8, BAJennings9, BJ Milner10, D Bloxham11, P Starostik12, M-H Delfau-Larue13, M Ott14, G Salles15 and GJ Morgan1
1Academic Unit of Haematology and Oncology, University ofLeeds, Leeds, UK; 2Laboratoire de Genetique Oncologique,Centre Henri Becquerel, Rouen, France; 3Laboratoire d’Hema-tologie and INSERM EMI 210, Hopital Necker-Enfants Malades,Paris, France; 4Department of Pathology, Leiden UniversityMedical Center, The Netherlands; 5Department of Pathology,University Medical Center Groningen, The Netherlands; 6La-boratory of Clinical Biology, H Hartziekenhuis, Roeselare,Belgium; 7Servicio de Hematologia, Hospital Universitario deSalamanca, Spain; 8Department of Haematology, University ofWales College of Medicine, Cardiff, UK; 9Department ofMedicine, Health Policy and Practise, University of East Anglia,Norwich, UK; 10Department of Medicine and Therapeutics,University of Aberdeen, UK; 11Department of Clinical Haema-tology, Addenbrooke’s NHS Trust Hospital, Cambridge, UK;12Institute of Pathology, University of Wurzburg, DE; 13Serviced’lmmunologie Biologique, Hopital Henri Mondor, Creteil,France; 14Institute of Pathology, Luitpoldkrankenhaus, Wurz-burg, Germany; and 15Department of Hematology, CentreHospitalier Lyon-Sud, Pierre-Benite, France
Background
The t(14;18) is one of the best characterized recurrentcytogenetic abnormalities in peripheral B-cell lymphoprolifera-tive disease.151 It is detectable in up to 90% of FCLs and 20% of
PCR-based clonality studies in lymphoproliferationsJJM van Dongen et al
2298
Leukemia
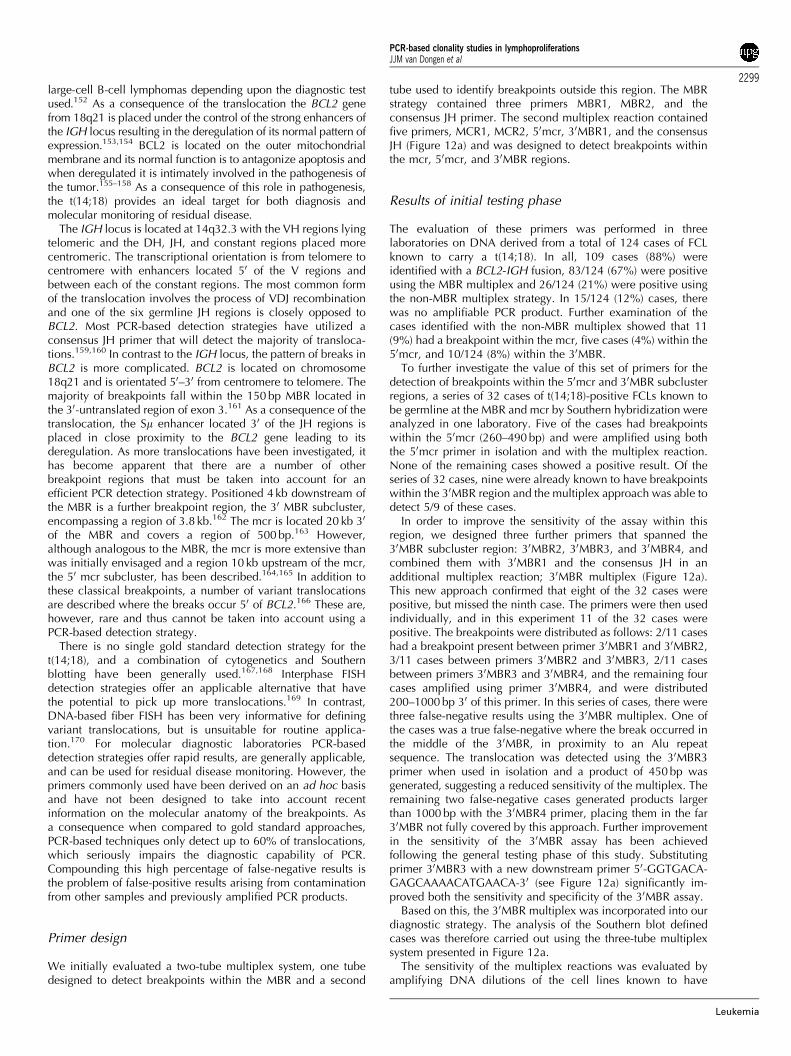
large-cell B-cell lymphomas depending upon the diagnostic testused.152 As a consequence of the translocation the BCL2 genefrom 18q21 is placed under the control of the strong enhancers ofthe IGH locus resulting in the deregulation of its normal pattern ofexpression.153,154 BCL2 is located on the outer mitochondrialmembrane and its normal function is to antagonize apoptosis andwhen deregulated it is intimately involved in the pathogenesis ofthe tumor.155–158 As a consequence of this role in pathogenesis,the t(14;18) provides an ideal target for both diagnosis andmolecular monitoring of residual disease.
The IGH locus is located at 14q32.3 with the VH regions lyingtelomeric and the DH, JH, and constant regions placed morecentromeric. The transcriptional orientation is from telomere tocentromere with enhancers located 50 of the V regions andbetween each of the constant regions. The most common formof the translocation involves the process of VDJ recombinationand one of the six germline JH regions is closely opposed toBCL2. Most PCR-based detection strategies have utilized aconsensus JH primer that will detect the majority of transloca-tions.159,160 In contrast to the IGH locus, the pattern of breaks inBCL2 is more complicated. BCL2 is located on chromosome18q21 and is orientated 50–30 from centromere to telomere. Themajority of breakpoints fall within the 150 bp MBR located inthe 30-untranslated region of exon 3.161 As a consequence of thetranslocation, the Sm enhancer located 30 of the JH regions isplaced in close proximity to the BCL2 gene leading to itsderegulation. As more translocations have been investigated, ithas become apparent that there are a number of otherbreakpoint regions that must be taken into account for anefficient PCR detection strategy. Positioned 4 kb downstream ofthe MBR is a further breakpoint region, the 30 MBR subcluster,encompassing a region of 3.8 kb.162 The mcr is located 20 kb 30
of the MBR and covers a region of 500 bp.163 However,although analogous to the MBR, the mcr is more extensive thanwas initially envisaged and a region 10 kb upstream of the mcr,the 50 mcr subcluster, has been described.164,165 In addition tothese classical breakpoints, a number of variant translocationsare described where the breaks occur 50 of BCL2.166 These are,however, rare and thus cannot be taken into account using aPCR-based detection strategy.
There is no single gold standard detection strategy for thet(14;18), and a combination of cytogenetics and Southernblotting have been generally used.167,168 Interphase FISHdetection strategies offer an applicable alternative that havethe potential to pick up more translocations.169 In contrast,DNA-based fiber FISH has been very informative for definingvariant translocations, but is unsuitable for routine applica-tion.170 For molecular diagnostic laboratories PCR-baseddetection strategies offer rapid results, are generally applicable,and can be used for residual disease monitoring. However, theprimers commonly used have been derived on an ad hoc basisand have not been designed to take into account recentinformation on the molecular anatomy of the breakpoints. Asa consequence when compared to gold standard approaches,PCR-based techniques only detect up to 60% of translocations,which seriously impairs the diagnostic capability of PCR.Compounding this high percentage of false-negative results isthe problem of false-positive results arising from contaminationfrom other samples and previously amplified PCR products.
Primer design
We initially evaluated a two-tube multiplex system, one tubedesigned to detect breakpoints within the MBR and a second
tube used to identify breakpoints outside this region. The MBRstrategy contained three primers MBR1, MBR2, and theconsensus JH primer. The second multiplex reaction containedfive primers, MCR1, MCR2, 50mcr, 30MBR1, and the consensusJH (Figure 12a) and was designed to detect breakpoints withinthe mcr, 50mcr, and 30MBR regions.
Results of initial testing phase
The evaluation of these primers was performed in threelaboratories on DNA derived from a total of 124 cases of FCLknown to carry a t(14;18). In all, 109 cases (88%) wereidentified with a BCL2-IGH fusion, 83/124 (67%) were positiveusing the MBR multiplex and 26/124 (21%) were positive usingthe non-MBR multiplex strategy. In 15/124 (12%) cases, therewas no amplifiable PCR product. Further examination of thecases identified with the non-MBR multiplex showed that 11(9%) had a breakpoint within the mcr, five cases (4%) within the50mcr, and 10/124 (8%) within the 30MBR.
To further investigate the value of this set of primers for thedetection of breakpoints within the 50mcr and 30MBR subclusterregions, a series of 32 cases of t(14;18)-positive FCLs known tobe germline at the MBR and mcr by Southern hybridization wereanalyzed in one laboratory. Five of the cases had breakpointswithin the 50mcr (260–490 bp) and were amplified using boththe 50mcr primer in isolation and with the multiplex reaction.None of the remaining cases showed a positive result. Of theseries of 32 cases, nine were already known to have breakpointswithin the 30MBR region and the multiplex approach was able todetect 5/9 of these cases.
In order to improve the sensitivity of the assay within thisregion, we designed three further primers that spanned the30MBR subcluster region: 30MBR2, 30MBR3, and 30MBR4, andcombined them with 30MBR1 and the consensus JH in anadditional multiplex reaction; 30MBR multiplex (Figure 12a).This new approach confirmed that eight of the 32 cases werepositive, but missed the ninth case. The primers were then usedindividually, and in this experiment 11 of the 32 cases werepositive. The breakpoints were distributed as follows: 2/11 caseshad a breakpoint present between primer 30MBR1 and 30MBR2,3/11 cases between primers 30MBR2 and 30MBR3, 2/11 casesbetween primers 30MBR3 and 30MBR4, and the remaining fourcases amplified using primer 30MBR4, and were distributed200–1000 bp 30 of this primer. In this series of cases, there werethree false-negative results using the 30MBR multiplex. One ofthe cases was a true false-negative where the break occurred inthe middle of the 30MBR, in proximity to an Alu repeatsequence. The translocation was detected using the 30MBR3primer when used in isolation and a product of 450 bp wasgenerated, suggesting a reduced sensitivity of the multiplex. Theremaining two false-negative cases generated products largerthan 1000 bp with the 30MBR4 primer, placing them in the far30MBR not fully covered by this approach. Further improvementin the sensitivity of the 30MBR assay has been achievedfollowing the general testing phase of this study. Substitutingprimer 30MBR3 with a new downstream primer 50-GGTGACA-GAGCAAAACATGAACA-30 (see Figure 12a) significantly im-proved both the sensitivity and specificity of the 30MBR assay.
Based on this, the 30MBR multiplex was incorporated into ourdiagnostic strategy. The analysis of the Southern blot definedcases was therefore carried out using the three-tube multiplexsystem presented in Figure 12a.
The sensitivity of the multiplex reactions was evaluated byamplifying DNA dilutions of the cell lines known to have
PCR-based clonality studies in lymphoproliferationsJJM van Dongen et al
2299
Leukemia
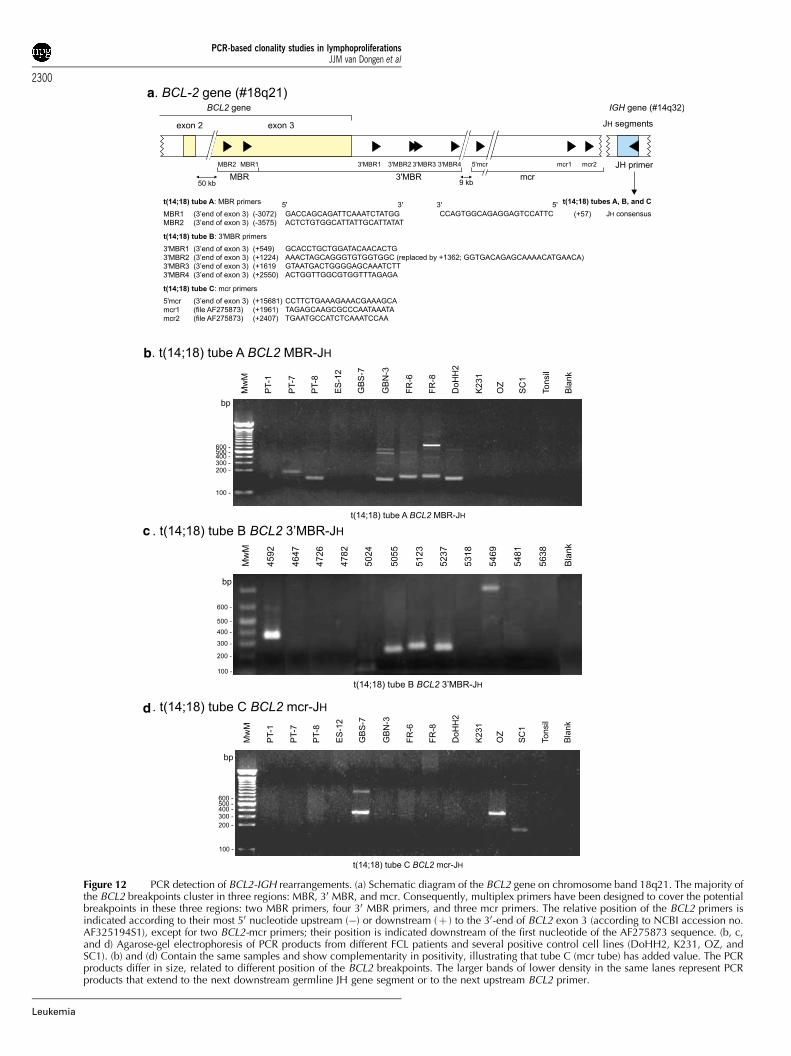
a
b
c
d
Figure 12 PCR detection of BCL2-IGH rearrangements. (a) Schematic diagram of the BCL2 gene on chromosome band 18q21. The majority ofthe BCL2 breakpoints cluster in three regions: MBR, 30 MBR, and mcr. Consequently, multiplex primers have been designed to cover the potentialbreakpoints in these three regions: two MBR primers, four 30 MBR primers, and three mcr primers. The relative position of the BCL2 primers isindicated according to their most 50 nucleotide upstream (�) or downstream (þ ) to the 30-end of BCL2 exon 3 (according to NCBI accession no.AF325194S1), except for two BCL2-mcr primers; their position is indicated downstream of the first nucleotide of the AF275873 sequence. (b, c,and d) Agarose-gel electrophoresis of PCR products from different FCL patients and several positive control cell lines (DoHH2, K231, OZ, andSC1). (b) and (d) Contain the same samples and show complementarity in positivity, illustrating that tube C (mcr tube) has added value. The PCRproducts differ in size, related to different position of the BCL2 breakpoints. The larger bands of lower density in the same lanes represent PCRproducts that extend to the next downstream germline JH gene segment or to the next upstream BCL2 primer.
PCR-based clonality studies in lymphoproliferationsJJM van Dongen et al
2300
Leukemia

breakpoints within the four subcluster regions: DoHH2, SC1,Oz, and K231 in normal tonsil DNA.165 A sensitivity of between3.3� 10�2 and 10�3 was consistently achievable using the MBRand 50mcr/mcr multiplex reactions. Sensitivity of the 30MBRmultiplex was assessed with the K231 cell line, and wasdetermined as 10�2. This is lower than would be expected forthe primers used in pairs, but this is more than adequate fordiagnostic material.
Results of general testing phase
Interlaboratory variations feature significantly in diagnostic PCRstrategies. To evaluate this, 11 groups participated in anextensive external quality control exercise. DNA was extractedfrom a series of 90 histologically defined malignant and reactivelymphoproliferations were analyzed using the t(14;18) multiplexprotocol (Figure 12b–d). All cases were defined for their status atthe Ig and TCR loci using Southern hybridization techniques.Karyotypic confirmation of the t(14;18) was not available on thisseries. We therefore adopted an approach requiring greater than70% concordance between members of the network foracceptance of the t(14;18). Of the 90 cases, 11 werecharacterized histologically as FCL. All 11 cases were shownto have a clonal IGH rearrangement by Southern hybridization.The assessment of rearrangements within the BCL2 gene wasalso performed by Southern hybridization using specific probesto the MBR, mcr and 30MBR in 10/11 cases. In all, 4/10 casesshowed a rearrangement within the MBR that was concordantwith the PCR result. A single case, GBS-7, shown to be mcrmultiplex PCR positive, gave an inconclusive Southern blotresult with the mcr probe. Immunophenotypically this casedemonstrated two distinct clonal populations, representingapproximately 5 and 15% of the original diagnostic material.The discrepancy between the two techniques in this caseprobably represents the reduced sensitivity of Southern blotcompared with PCR. There was no evidence of a 30MBRrearrangement in any of the remaining cases by Southern blot.
Of the six Southern blot-negative FCL cases, a single case, ES-7, showed a t(14;18) using the MBR multiplex. In all, 5/11 FCLcases showed no evidence of a t(14;18) by either Southern blotor PCR. A t(14;18) was detected in two further cases by PCR; FR-6, a case of DLBCL showed an MBR breakpoint and wasidentified by all 11 laboratories, this finding is compatible withprevious studies that have detected a t(14;18) in 20–40% ofDLBCL cases.171,172 Using the 30MBR multiplex, 10/11 labora-tories reported a positive result for sample ES-12, this was a caseof Hodgkin’s disease that contained very few B cells. It isdifficult to explain this result in the absence of an IGHrearrangement by Southern blotting. Contamination or incorrectlabeling of the sample at source is the most likely explanation.
Overall there was excellent concordance throughout thenetwork, although small numbers of both false-positive andfalse-negative results were encountered. Overall 12 false-positive results were identified, representing less than 0.4%(12/3036) of the total number of analyses. These were reportedby five laboratories and involved six of the samples. Themajority of the false positives (9/12) were found in three cases.Five false-negative results, representing a 6% (5/88) failure rate,were reported by three laboratories, ES-7 was not detected bytwo laboratories, three further groups within the networkcommented that this case had shown weak amplification signalswith the MBR multiplex. The remaining three false-negativecases were reported in isolation by individual laboratories. Theresults of diagnoses using this approach are very encouraging
and suggest that the definition of common approaches andreaction conditions can minimize erroneous results.
Conclusion
In conclusion, we have designed and evaluated a robust three-tube multiplex PCR in order to maximize the detection of thet(14;18). This strategy is capable of amplifying across thebreakpoint region in the majority of cases of FCL with acytogenetically defined translocation. Although the sensitivity ofthis strategy is lower than conventional single-round or nestedPCR approaches, it is still perfectly acceptable for diagnosticprocedures. The widespread adoption of standardized reagentsand methodologies has helped to minimize inaccurate resultswithin this large multicenter network. However, it is worthnoting from the general testing phase (and subsequent examina-tion of 109 Work Package 2 FCL cases) of this study that it isimpossible to detect a t(14;18) in all cases. This is certainlyinfluenced by additional molecular mechanisms capable ofderegulating the BCL2 gene.173,174
SECTION 10. Use of BIOMED-2 protocols with DNAextracted from paraffin-embedded tissue biopsies anddevelopment of control gene primer set
HE White1, FL Lavender1, E Delabesse2, EA Macintyre2, SHarris1, E Hodges1, DB Jones1 and JL Smith1
1Wessex Immunology Service, Molecular Pathology Unit,Southampton University Hospitals NHS Trust, Southampton,UK; and 2Laboratoire d’Hematologie and INSERM EMI 210,Hopital Necker-Enfants Malades, Paris, France
Background
Fresh/frozen tissue is considered to be the ideal sample type forthe extraction of DNA for use in PCR-based clonality analysis.However, fresh/frozen material is not always available todiagnostic laboratories and in many laboratories throughoutEurope, paraffin-embedded tissue samples constitute the major-ity of diagnostic biopsies submitted for analysis. DNA extractedfrom paraffin-embedded material is often of poor quality and soPCR protocols need to be evaluated for use with these sampletypes before they can be widely used in diagnostic laboratories.
The integrity of DNA extracted from paraffin-embeddedsamples and its amplification by PCR are affected by a numberof factors such as thickness of tissue, fixative type, fixative time,length of storage before analysis, DNA extraction procedures,and the coextraction of PCR inhibitors.175–182 Neutral-bufferedformalin (10% NBF) is the most commonly used fixative,although laboratories within the BIOMED-2 program also use anumber of other fixatives, including unbuffered formalin andBouins. The use of 10% NBF permits the amplification of DNAfragments of a wide range of sizes, whereas Bouins appears tobe the least amenable for use in PCR analysis.177,178,181,183 Theintegrity of DNA fragments extracted from paraffin-embeddedsamples also depends on the length of time the blocks have beenstored with the best results usually obtained from blocks lessthan 2 years old, while blocks over 15 years old tend to yieldvery degraded fragments.184
PCR-based clonality studies in lymphoproliferationsJJM van Dongen et al
2301
Leukemia

The aim of this study was to evaluate the use of the BIOMED-2 primer sets with DNA isolated from paraffin-embedded tissuebiopsies matched to the fresh/frozen tissue samples tested inWork Package 1. The design of a set of control gene PCRprimers to assess the quality and amplifiability of DNA samplesis also described for assessing the quality of the DNA isolatedfrom the paraffin-embedded samples.
Primer design
Initially, five pairs of control gene PCR primers were designed toamplify products of exactly 100, 200, 400, 600, and 1000 bp inorder to assess the quality of DNA submitted for analysis in theBIOMED-2 program. The target genes were selected on the basisof having large exons with open-reading frames to reduce therisk of selecting polymorphic regions and the primers weredesigned for multiplex usage in the standardized BIOMED-2protocols. The following target genes were selected: humanthromboxane synthase gene (TBXAS1, exon 9; GenBankaccession no. D34621), human recombination activating gene(RAG1, exon 2; GenBank accession no. M29474), humanpromyelocytic leukemia zinc-finger gene (PLZF, exon 1;GenBank accession no. AF060568), and human AF4 gene(exon 3; GenBank accession no. Z83679, and exon 11;GenBank accession no. Z83687).
Results of initial testing phase
The primer pairs were tested in separate reactions andsubsequently in multiplex reactions using high molecular weightDNA. Owing to the large size range of the products (100–1000 bp), it was necessary to vary the ratio of primerconcentrations to obtain bands of equal intensities in themultiplex reactions. However, it proved extremely difficult tobe able to amplify all the bands reproducibly and it was decidedthat the 1000 bp product was probably unnecessary, since allthe BIOMED-2 PCR protocols give products of less than 600 bp.It was therefore decided to exclude the 1000 bp product in orderto improve the reproducibility of the assay. By increasing theMgCl2 concentration to 2 mM and adding the primers in a1:1:1:2 ratio, it was possible to reproducibly amplify four bands(100, 200, 400, and 600 bp) of equal intensity from highmolecular weight DNA samples. However, for DNA extractedfrom paraffin blocks, it was thought that an extra size marker at300 bp would be extremely informative and that the 600 bpmarker might not be necessary. Using the gene sequence for the1000 bp marker (PLZF), primers were redesigned to generate a300 bp product. These were tested successfully both inmonoplex reactions and in multiplex reactions combining the100, 200, 300, 400, and 600 bp primers (see Figure 13a).
Thus, two primer sets are available for assessing the quality ofDNA for amplification:
1. The 100, 200, 300, and 400 bp primers used at 2.5 pmoleach can be used for assessing DNA from paraffin-embeddedtissues.
2. The addition of the 600 bp primers at 5 pmol allows this set tobe used to check the quality of any DNA sample for use withthe BIOMED-2 primers and protocols.
Both primer sets are used with ABI Buffer II and 2.0 mM MgCl2under standardized BIOMED-2 amplification conditions (seeTable 4). Products can be analyzed on 6% PAGE or 2% agarose(see Figure 13b).
Results of general testing phase
In all, 45 paraffin-embedded biopsies were collected corre-sponding to 30 of the B-cell malignancies, eight of the T-cellmalignancies, and seven of the reactive lymphoproliferationssubmitted as fresh/frozen tissue samples for Work Package 1(DE-1, 2, and 5; ES-4, 5, 6, and 7; FR-4, 5, 6, 7, 8, and 9; PT-1, 4,5, 6, 7, 9, and 10; NL-2, 3, 4, 5, 6, 11, 12, 14, 15, and 16; GBS-1, 2, 3, 4, 8, 11, and 12; GBN-1, 2, 3, 4, 5, 7, and 9). The age ofthe paraffin blocks as well as the methods of fixation andembedding of the samples varied between National Networks.The ES samples were submitted as precut sections, NL-14, 15,and 16 were submitted as DNA samples and the remainingbiopsies were submitted as paraffin blocks. Five sections (10mmeach) were cut from the paraffin blocks and DNA was extractedusing the QIAamp DNA Mini Kit (QIAGEN) following themanufacturer’s protocol for isolation of genomic DNA fromparaffin-embedded tissue. This method of DNA extraction waschosen since the kit can be used to rapidly extract good qualityDNA from blood, fresh/frozen tissue, and paraffin-embeddedtissue, and thus enables the parallel processing of a variety ofsample types with assured quality control. Numerous protocolsfor the extraction of DNA from paraffin-embedded tissue forPCR analysis have been published.181,182,185–187 Many of theseaim to reduce DNA degradation and the coextraction of PCRinhibitors, but many of these methods require prolongedextraction procedures and can be unsuitable for use in theroutine diagnostic laboratory.176,177,188,189
DNA sample concentration and integrity were estimated byspectrophotometry and by comparison of sample DNA withknown standards on agarose-gel electrophoresis. DNA samples(100 ng) were then analyzed for integrity and amplifiability usingthe control gene PCR primers (100–400 bp) and assessed forclonality at all target loci using the BIOMED-2 PCR protocols.
In the control gene PCR reaction of 24/45 cases, the amplifiedproducts were at least 300 bp, whereas in the remaining 21samples the amplified products were 200 bp or less. No clearcorrelation between the quality of the DNA and the age of theblock or fixation method could be demonstrated. Therefore, it islikely that a combination of factors is responsible for the DNAquality in these samples.
The DNA samples were evaluated for clonality using the 18BIOMED-2 multiplex PCR reactions and were analyzed by bothheteroduplex analysis and GeneScanning in the Southamptonlaboratory. The number of paraffin samples showing clonalityand translocations at the nine target loci were compared withthe corresponding fresh/frozen sample data (Table 22). Insamples with control gene PCR products of up to 200 bp,the overall detection of clonality at the nine target lociwas 9/55 (16%). Of the 46 missed rearrangements, 45 couldbe explained by the fact that the expected clonal PCR productshad a molecular weight higher than the maximum size amplifiedby the sample in the control gene PCR. The remaining sample(PT-9) amplified to 100 bp in the control gene PCR, but theexpected 81 bp TCRG clonal product was not detected. Insamples with control gene PCR products of at least 300 bp, theoverall detection of clonality at the nine target loci was 42/55(76%). Of the 13 missed rearrangements, five could again beexplained by the fact that the expected clonal PCR productswere larger than the maximum size amplified by the sample inthe control gene PCR. The remaining eight missed rearrange-ments could not be explained directly by the quality of theDNA. One false-positive clonal result (GBN-9; IGL) wasdetected in a reactive lymph node that may representpseudoclonality.
PCR-based clonality studies in lymphoproliferationsJJM van Dongen et al
2302
Leukemia
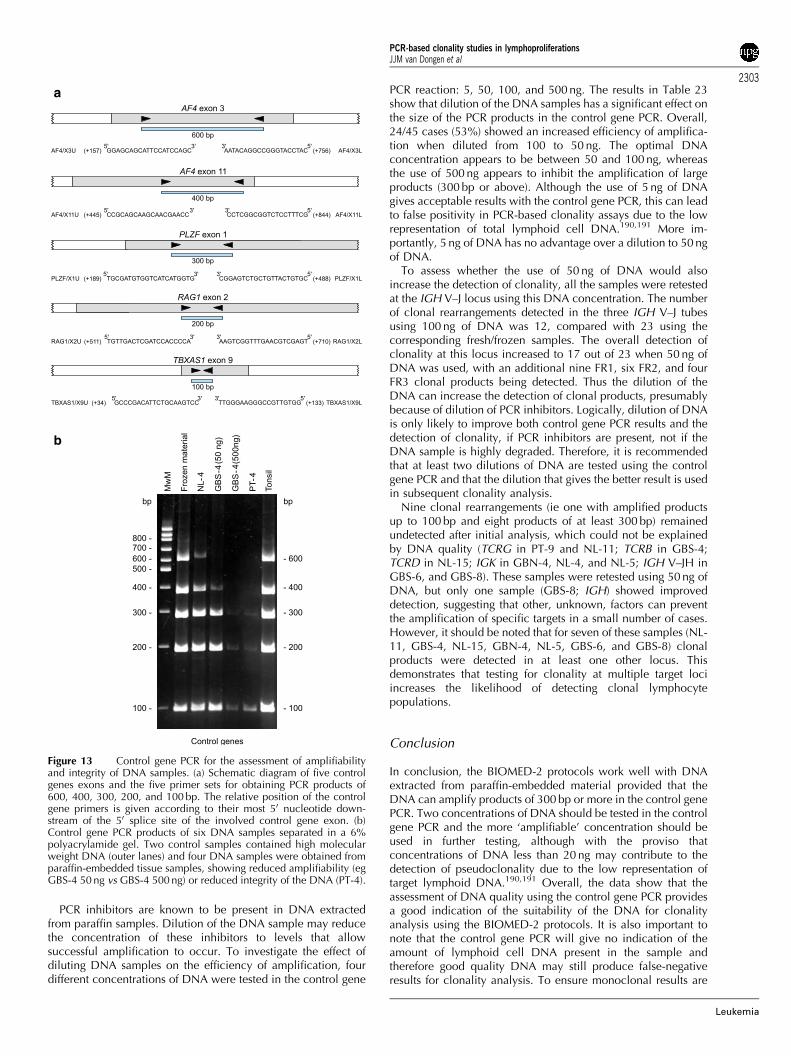
PCR inhibitors are known to be present in DNA extractedfrom paraffin samples. Dilution of the DNA sample may reducethe concentration of these inhibitors to levels that allowsuccessful amplification to occur. To investigate the effect ofdiluting DNA samples on the efficiency of amplification, fourdifferent concentrations of DNA were tested in the control gene
PCR reaction: 5, 50, 100, and 500 ng. The results in Table 23show that dilution of the DNA samples has a significant effect onthe size of the PCR products in the control gene PCR. Overall,24/45 cases (53%) showed an increased efficiency of amplifica-tion when diluted from 100 to 50 ng. The optimal DNAconcentration appears to be between 50 and 100 ng, whereasthe use of 500 ng appears to inhibit the amplification of largeproducts (300 bp or above). Although the use of 5 ng of DNAgives acceptable results with the control gene PCR, this can leadto false positivity in PCR-based clonality assays due to the lowrepresentation of total lymphoid cell DNA.190,191 More im-portantly, 5 ng of DNA has no advantage over a dilution to 50 ngof DNA.
To assess whether the use of 50 ng of DNA would alsoincrease the detection of clonality, all the samples were retestedat the IGH V–J locus using this DNA concentration. The numberof clonal rearrangements detected in the three IGH V–J tubesusing 100 ng of DNA was 12, compared with 23 using thecorresponding fresh/frozen samples. The overall detection ofclonality at this locus increased to 17 out of 23 when 50 ng ofDNA was used, with an additional nine FR1, six FR2, and fourFR3 clonal products being detected. Thus the dilution of theDNA can increase the detection of clonal products, presumablybecause of dilution of PCR inhibitors. Logically, dilution of DNAis only likely to improve both control gene PCR results and thedetection of clonality, if PCR inhibitors are present, not if theDNA sample is highly degraded. Therefore, it is recommendedthat at least two dilutions of DNA are tested using the controlgene PCR and that the dilution that gives the better result is usedin subsequent clonality analysis.
Nine clonal rearrangements (ie one with amplified productsup to 100 bp and eight products of at least 300 bp) remainedundetected after initial analysis, which could not be explainedby DNA quality (TCRG in PT-9 and NL-11; TCRB in GBS-4;TCRD in NL-15; IGK in GBN-4, NL-4, and NL-5; IGH V–JH inGBS-6, and GBS-8). These samples were retested using 50 ng ofDNA, but only one sample (GBS-8; IGH) showed improveddetection, suggesting that other, unknown, factors can preventthe amplification of specific targets in a small number of cases.However, it should be noted that for seven of these samples (NL-11, GBS-4, NL-15, GBN-4, NL-5, GBS-6, and GBS-8) clonalproducts were detected in at least one other locus. Thisdemonstrates that testing for clonality at multiple target lociincreases the likelihood of detecting clonal lymphocytepopulations.
Conclusion
In conclusion, the BIOMED-2 protocols work well with DNAextracted from paraffin-embedded material provided that theDNA can amplify products of 300 bp or more in the control genePCR. Two concentrations of DNA should be tested in the controlgene PCR and the more ‘amplifiable’ concentration should beused in further testing, although with the proviso thatconcentrations of DNA less than 20 ng may contribute to thedetection of pseudoclonality due to the low representation oftarget lymphoid DNA.190,191 Overall, the data show that theassessment of DNA quality using the control gene PCR providesa good indication of the suitability of the DNA for clonalityanalysis using the BIOMED-2 protocols. It is also important tonote that the control gene PCR will give no indication of theamount of lymphoid cell DNA present in the sample andtherefore good quality DNA may still produce false-negativeresults for clonality analysis. To ensure monoclonal results are
a
b
Figure 13 Control gene PCR for the assessment of amplifiabilityand integrity of DNA samples. (a) Schematic diagram of five controlgenes exons and the five primer sets for obtaining PCR products of600, 400, 300, 200, and 100 bp. The relative position of the controlgene primers is given according to their most 50 nucleotide down-stream of the 50 splice site of the involved control gene exon. (b)Control gene PCR products of six DNA samples separated in a 6%polyacrylamide gel. Two control samples contained high molecularweight DNA (outer lanes) and four DNA samples were obtained fromparaffin-embedded tissue samples, showing reduced amplifiability (egGBS-4 50 ng vs GBS-4 500 ng) or reduced integrity of the DNA (PT-4).
PCR-based clonality studies in lymphoproliferationsJJM van Dongen et al
2303
Leukemia
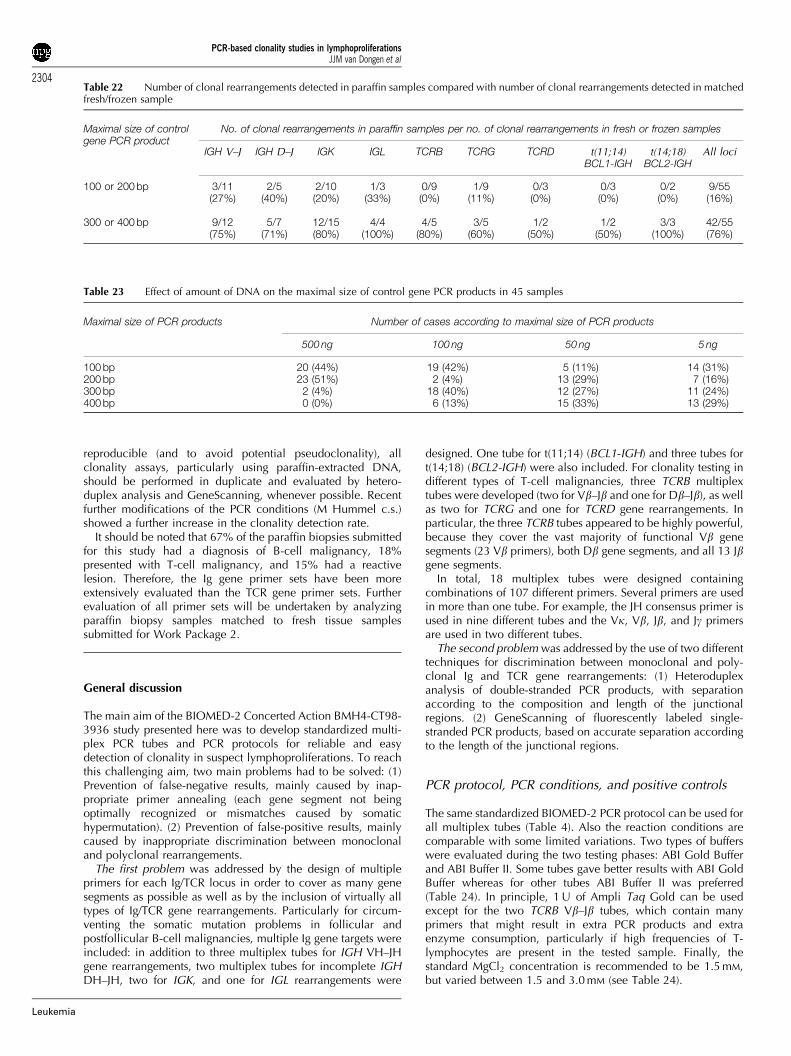
reproducible (and to avoid potential pseudoclonality), allclonality assays, particularly using paraffin-extracted DNA,should be performed in duplicate and evaluated by hetero-duplex analysis and GeneScanning, whenever possible. Recentfurther modifications of the PCR conditions (M Hummel c.s.)showed a further increase in the clonality detection rate.
It should be noted that 67% of the paraffin biopsies submittedfor this study had a diagnosis of B-cell malignancy, 18%presented with T-cell malignancy, and 15% had a reactivelesion. Therefore, the Ig gene primer sets have been moreextensively evaluated than the TCR gene primer sets. Furtherevaluation of all primer sets will be undertaken by analyzingparaffin biopsy samples matched to fresh tissue samplessubmitted for Work Package 2.
General discussion
The main aim of the BIOMED-2 Concerted Action BMH4-CT98-3936 study presented here was to develop standardized multi-plex PCR tubes and PCR protocols for reliable and easydetection of clonality in suspect lymphoproliferations. To reachthis challenging aim, two main problems had to be solved: (1)Prevention of false-negative results, mainly caused by inap-propriate primer annealing (each gene segment not beingoptimally recognized or mismatches caused by somatichypermutation). (2) Prevention of false-positive results, mainlycaused by inappropriate discrimination between monoclonaland polyclonal rearrangements.
The first problem was addressed by the design of multipleprimers for each Ig/TCR locus in order to cover as many genesegments as possible as well as by the inclusion of virtually alltypes of Ig/TCR gene rearrangements. Particularly for circum-venting the somatic mutation problems in follicular andpostfollicular B-cell malignancies, multiple Ig gene targets wereincluded: in addition to three multiplex tubes for IGH VH–JHgene rearrangements, two multiplex tubes for incomplete IGHDH–JH, two for IGK, and one for IGL rearrangements were
designed. One tube for t(11;14) (BCL1-IGH) and three tubes fort(14;18) (BCL2-IGH) were also included. For clonality testing indifferent types of T-cell malignancies, three TCRB multiplextubes were developed (two for Vb–Jb and one for Db–Jb), as wellas two for TCRG and one for TCRD gene rearrangements. Inparticular, the three TCRB tubes appeared to be highly powerful,because they cover the vast majority of functional Vb genesegments (23 Vb primers), both Db gene segments, and all 13 Jbgene segments.
In total, 18 multiplex tubes were designed containingcombinations of 107 different primers. Several primers are usedin more than one tube. For example, the JH consensus primer isused in nine different tubes and the Vk, Vb, Jb, and Jg primersare used in two different tubes.
The second problem was addressed by the use of two differenttechniques for discrimination between monoclonal and poly-clonal Ig and TCR gene rearrangements: (1) Heteroduplexanalysis of double-stranded PCR products, with separationaccording to the composition and length of the junctionalregions. (2) GeneScanning of fluorescently labeled single-stranded PCR products, based on accurate separation accordingto the length of the junctional regions.
PCR protocol, PCR conditions, and positive controls
The same standardized BIOMED-2 PCR protocol can be used forall multiplex tubes (Table 4). Also the reaction conditions arecomparable with some limited variations. Two types of bufferswere evaluated during the two testing phases: ABI Gold Bufferand ABI Buffer II. Some tubes gave better results with ABI GoldBuffer whereas for other tubes ABI Buffer II was preferred(Table 24). In principle, 1 U of Ampli Taq Gold can be usedexcept for the two TCRB Vb–Jb tubes, which contain manyprimers that might result in extra PCR products and extraenzyme consumption, particularly if high frequencies of T-lymphocytes are present in the tested sample. Finally, thestandard MgCl2 concentration is recommended to be 1.5 mM,but varied between 1.5 and 3.0 mM (see Table 24).
Table 22 Number of clonal rearrangements detected in paraffin samples compared with number of clonal rearrangements detected in matchedfresh/frozen sample
Maximal size of controlgene PCR product
No. of clonal rearrangements in paraffin samples per no. of clonal rearrangements in fresh or frozen samples
IGH V–J IGH D–J IGK IGL TCRB TCRG TCRD t(11;14)BCL1-IGH
t(14;18)BCL2-IGH
All loci
100 or 200 bp 3/11 2/5 2/10 1/3 0/9 1/9 0/3 0/3 0/2 9/55(27%) (40%) (20%) (33%) (0%) (11%) (0%) (0%) (0%) (16%)
300 or 400 bp 9/12 5/7 12/15 4/4 4/5 3/5 1/2 1/2 3/3 42/55(75%) (71%) (80%) (100%) (80%) (60%) (50%) (50%) (100%) (76%)
Table 23 Effect of amount of DNA on the maximal size of control gene PCR products in 45 samples
Maximal size of PCR products Number of cases according to maximal size of PCR products
500 ng 100 ng 50 ng 5 ng
100 bp 20 (44%) 19 (42%) 5 (11%) 14 (31%)200 bp 23 (51%) 2 (4%) 13 (29%) 7 (16%)300 bp 2 (4%) 18 (40%) 12 (27%) 11 (24%)400 bp 0 (0%) 6 (13%) 15 (33%) 13 (29%)
PCR-based clonality studies in lymphoproliferationsJJM van Dongen et al
2304
Leukemia
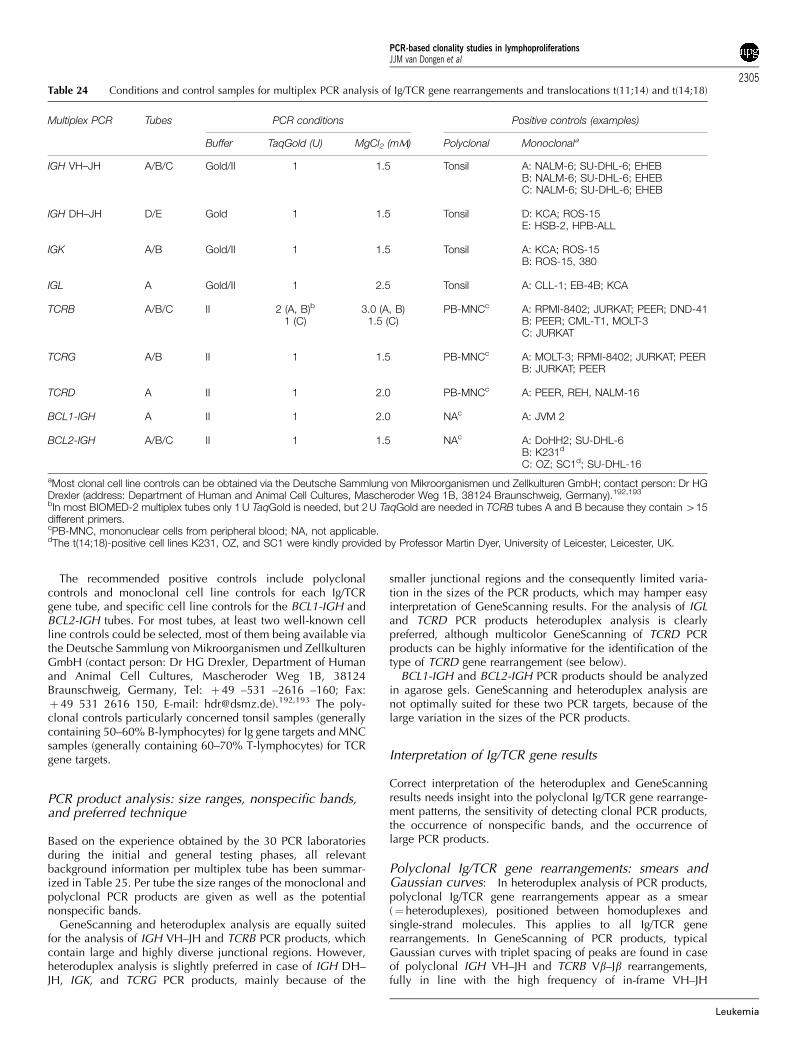
The recommended positive controls include polyclonalcontrols and monoclonal cell line controls for each Ig/TCRgene tube, and specific cell line controls for the BCL1-IGH andBCL2-IGH tubes. For most tubes, at least two well-known cellline controls could be selected, most of them being available viathe Deutsche Sammlung von Mikroorganismen und ZellkulturenGmbH (contact person: Dr HG Drexler, Department of Humanand Animal Cell Cultures, Mascheroder Weg 1B, 38124Braunschweig, Germany, Tel: þ 49 –531 –2616 –160; Fax:þ 49 531 2616 150, E-mail: [email protected]).192,193 The poly-clonal controls particularly concerned tonsil samples (generallycontaining 50–60% B-lymphocytes) for Ig gene targets and MNCsamples (generally containing 60–70% T-lymphocytes) for TCRgene targets.
PCR product analysis: size ranges, nonspecific bands,and preferred technique
Based on the experience obtained by the 30 PCR laboratoriesduring the initial and general testing phases, all relevantbackground information per multiplex tube has been summar-ized in Table 25. Per tube the size ranges of the monoclonal andpolyclonal PCR products are given as well as the potentialnonspecific bands.
GeneScanning and heteroduplex analysis are equally suitedfor the analysis of IGH VH–JH and TCRB PCR products, whichcontain large and highly diverse junctional regions. However,heteroduplex analysis is slightly preferred in case of IGH DH–JH, IGK, and TCRG PCR products, mainly because of the
smaller junctional regions and the consequently limited varia-tion in the sizes of the PCR products, which may hamper easyinterpretation of GeneScanning results. For the analysis of IGLand TCRD PCR products heteroduplex analysis is clearlypreferred, although multicolor GeneScanning of TCRD PCRproducts can be highly informative for the identification of thetype of TCRD gene rearrangement (see below).
BCL1-IGH and BCL2-IGH PCR products should be analyzedin agarose gels. GeneScanning and heteroduplex analysis arenot optimally suited for these two PCR targets, because of thelarge variation in the sizes of the PCR products.
Interpretation of Ig/TCR gene results
Correct interpretation of the heteroduplex and GeneScanningresults needs insight into the polyclonal Ig/TCR gene rearrange-ment patterns, the sensitivity of detecting clonal PCR products,the occurrence of nonspecific bands, and the occurrence oflarge PCR products.
Polyclonal Ig/TCR gene rearrangements: smears andGaussian curves: In heteroduplex analysis of PCR products,polyclonal Ig/TCR gene rearrangements appear as a smear(¼ heteroduplexes), positioned between homoduplexes andsingle-strand molecules. This applies to all Ig/TCR generearrangements. In GeneScanning of PCR products, typicalGaussian curves with triplet spacing of peaks are found in caseof polyclonal IGH VH–JH and TCRB Vb–Jb rearrangements,fully in line with the high frequency of in-frame VH–JH
Table 24 Conditions and control samples for multiplex PCR analysis of Ig/TCR gene rearrangements and translocations t(11;14) and t(14;18)
Multiplex PCR Tubes PCR conditions Positive controls (examples)
Buffer TaqGold (U) MgCl2 (mM) Polyclonal Monoclonala
IGH VH–JH A/B/C Gold/II 1 1.5 Tonsil A: NALM-6; SU-DHL-6; EHEBB: NALM-6; SU-DHL-6; EHEBC: NALM-6; SU-DHL-6; EHEB
IGH DH–JH D/E Gold 1 1.5 Tonsil D: KCA; ROS-15E: HSB-2, HPB-ALL
IGK A/B Gold/II 1 1.5 Tonsil A: KCA; ROS-15B: ROS-15, 380
IGL A Gold/II 1 2.5 Tonsil A: CLL-1; EB-4B; KCA
TCRB A/B/C II 2 (A, B)b 3.0 (A, B) PB-MNCc A: RPMI-8402; JURKAT; PEER; DND-411 (C) 1.5 (C) B: PEER; CML-T1, MOLT-3
C: JURKAT
TCRG A/B II 1 1.5 PB-MNCc A: MOLT-3; RPMI-8402; JURKAT; PEERB: JURKAT; PEER
TCRD A II 1 2.0 PB-MNCc A: PEER, REH, NALM-16
BCL1-IGH A II 1 2.0 NAc A: JVM 2
BCL2-IGH A/B/C II 1 1.5 NAc A: DoHH2; SU-DHL-6B: K231d
C: OZ; SC1d; SU-DHL-16
aMost clonal cell line controls can be obtained via the Deutsche Sammlung von Mikroorganismen und Zellkulturen GmbH; contact person: Dr HGDrexler (address: Department of Human and Animal Cell Cultures, Mascheroder Weg 1B, 38124 Braunschweig, Germany).192,193
bIn most BIOMED-2 multiplex tubes only 1 U TaqGold is needed, but 2 U TaqGold are needed in TCRB tubes A and B because they contain 415different primers.cPB-MNC, mononuclear cells from peripheral blood; NA, not applicable.dThe t(14;18)-positive cell lines K231, OZ, and SC1 were kindly provided by Professor Martin Dyer, University of Leicester, Leicester, UK.
PCR-based clonality studies in lymphoproliferationsJJM van Dongen et al
2305
Leukemia
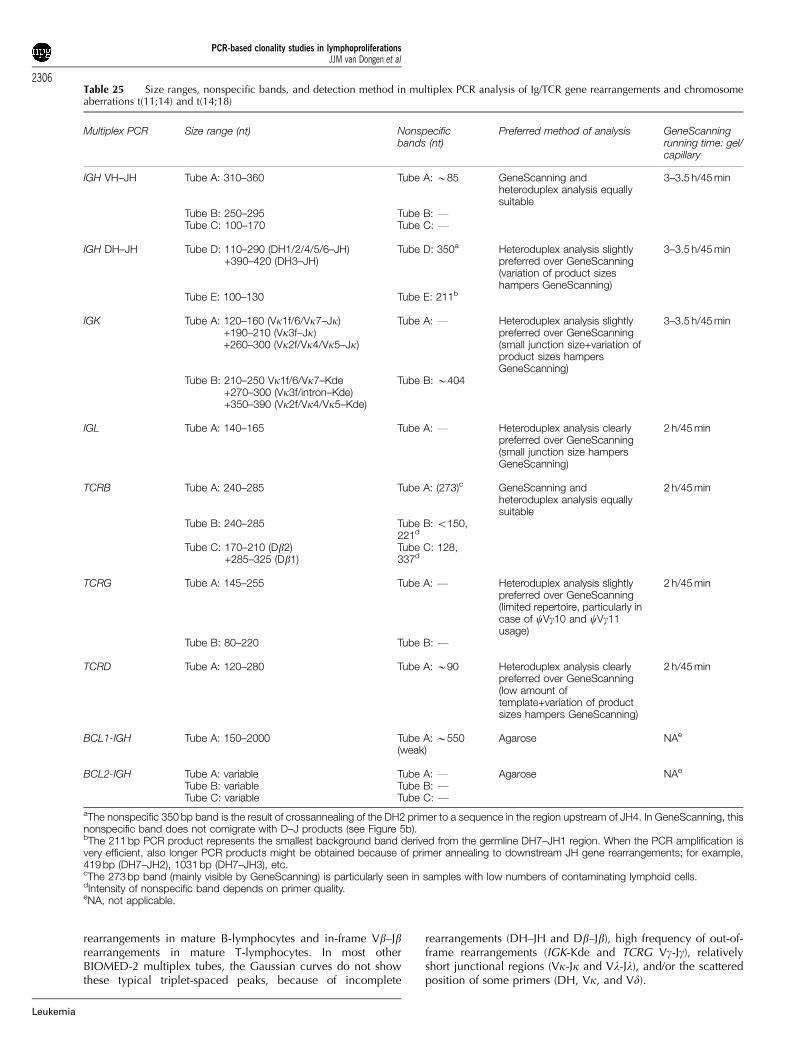
rearrangements in mature B-lymphocytes and in-frame Vb–Jbrearrangements in mature T-lymphocytes. In most otherBIOMED-2 multiplex tubes, the Gaussian curves do not showthese typical triplet-spaced peaks, because of incomplete
rearrangements (DH–JH and Db–Jb), high frequency of out-of-frame rearrangements (IGK-Kde and TCRG Vg-Jg), relativelyshort junctional regions (Vk-Jk and Vl-Jl), and/or the scatteredposition of some primers (DH, Vk, and Vd).
Table 25 Size ranges, nonspecific bands, and detection method in multiplex PCR analysis of Ig/TCR gene rearrangements and chromosomeaberrations t(11;14) and t(14;18)
Multiplex PCR Size range (nt) Nonspecificbands (nt)
Preferred method of analysis GeneScanningrunning time: gel/capillary
IGH VH–JH Tube A: 310–360 Tube A: B85 GeneScanning andheteroduplex analysis equallysuitable
3–3.5 h/45 min
Tube B: 250–295 Tube B: FTube C: 100–170 Tube C: F
IGH DH–JH Tube D: 110–290 (DH1/2/4/5/6–JH)+390–420 (DH3–JH)
Tube D: 350a Heteroduplex analysis slightlypreferred over GeneScanning(variation of product sizeshampers GeneScanning)
3–3.5 h/45 min
Tube E: 100–130 Tube E: 211b
IGK Tube A: 120–160 (Vk1f/6/Vk7–Jk)+190–210 (Vk3f–Jk)+260–300 (Vk2f/Vk4/Vk5–Jk)
Tube A: F Heteroduplex analysis slightlypreferred over GeneScanning(small junction size+variation ofproduct sizes hampersGeneScanning)
3–3.5 h/45 min
Tube B: 210–250 Vk1f/6/Vk7–Kde+270–300 (Vk3f/intron–Kde)+350–390 (Vk2f/Vk4/Vk5–Kde)
Tube B: B404
IGL Tube A: 140–165 Tube A: F Heteroduplex analysis clearlypreferred over GeneScanning(small junction size hampersGeneScanning)
2 h/45 min
TCRB Tube A: 240–285 Tube A: (273)c GeneScanning andheteroduplex analysis equallysuitable
2 h/45 min
Tube B: 240–285 Tube B: o150,221d
Tube C: 170–210 (Db2)+285–325 (Db1)
Tube C: 128,337d
TCRG Tube A: 145–255 Tube A: F Heteroduplex analysis slightlypreferred over GeneScanning(limited repertoire, particularly incase of cVg10 and cVg11usage)
2 h/45 min
Tube B: 80–220 Tube B: F
TCRD Tube A: 120–280 Tube A: B90 Heteroduplex analysis clearlypreferred over GeneScanning(low amount oftemplate+variation of productsizes hampers GeneScanning)
2 h/45 min
BCL1-IGH Tube A: 150–2000 Tube A: B550(weak)
Agarose NAe
BCL2-IGH Tube A: variable Tube A: F Agarose NAe
Tube B: variable Tube B: FTube C: variable Tube C: F
aThe nonspecific 350 bp band is the result of crossannealing of the DH2 primer to a sequence in the region upstream of JH4. In GeneScanning, thisnonspecific band does not comigrate with D–J products (see Figure 5b).bThe 211 bp PCR product represents the smallest background band derived from the germline DH7–JH1 region. When the PCR amplification isvery efficient, also longer PCR products might be obtained because of primer annealing to downstream JH gene rearrangements; for example,419 bp (DH7–JH2), 1031 bp (DH7–JH3), etc.cThe 273 bp band (mainly visible by GeneScanning) is particularly seen in samples with low numbers of contaminating lymphoid cells.dIntensity of nonspecific band depends on primer quality.eNA, not applicable.
PCR-based clonality studies in lymphoproliferationsJJM van Dongen et al
2306
Leukemia
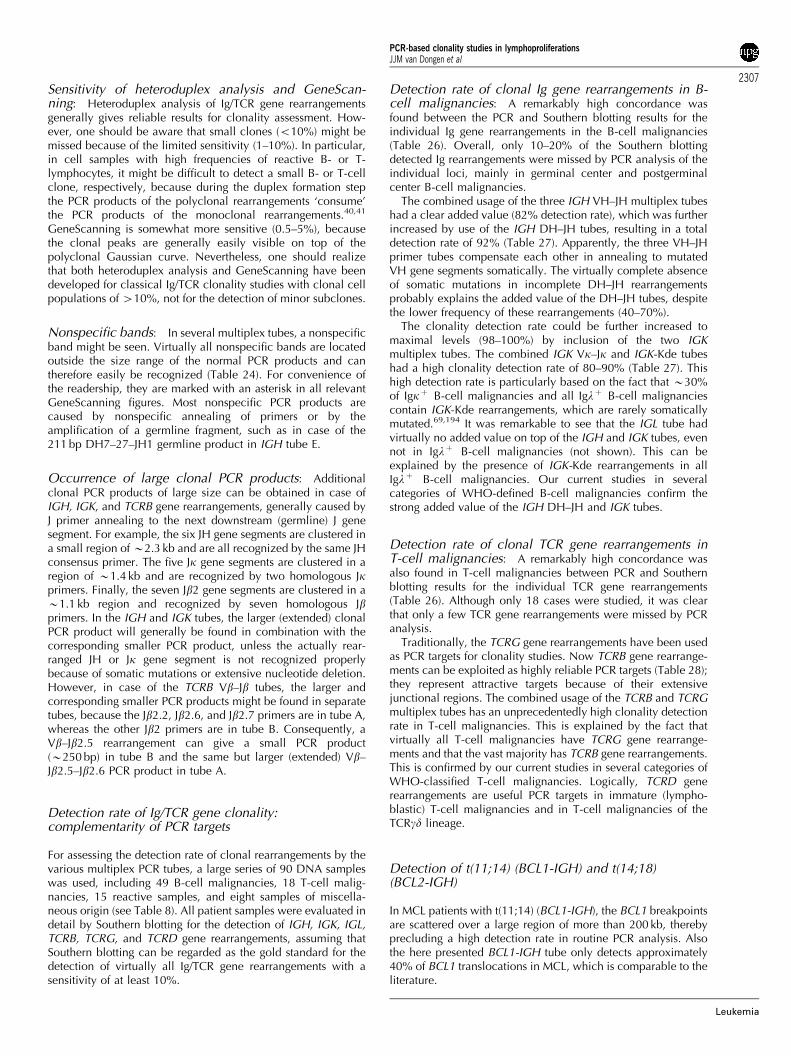
Sensitivity of heteroduplex analysis and GeneScan-ning: Heteroduplex analysis of Ig/TCR gene rearrangementsgenerally gives reliable results for clonality assessment. How-ever, one should be aware that small clones (o10%) might bemissed because of the limited sensitivity (1–10%). In particular,in cell samples with high frequencies of reactive B- or T-lymphocytes, it might be difficult to detect a small B- or T-cellclone, respectively, because during the duplex formation stepthe PCR products of the polyclonal rearrangements ‘consume’the PCR products of the monoclonal rearrangements.40,41
GeneScanning is somewhat more sensitive (0.5–5%), becausethe clonal peaks are generally easily visible on top of thepolyclonal Gaussian curve. Nevertheless, one should realizethat both heteroduplex analysis and GeneScanning have beendeveloped for classical Ig/TCR clonality studies with clonal cellpopulations of 410%, not for the detection of minor subclones.
Nonspecific bands: In several multiplex tubes, a nonspecificband might be seen. Virtually all nonspecific bands are locatedoutside the size range of the normal PCR products and cantherefore easily be recognized (Table 24). For convenience ofthe readership, they are marked with an asterisk in all relevantGeneScanning figures. Most nonspecific PCR products arecaused by nonspecific annealing of primers or by theamplification of a germline fragment, such as in case of the211 bp DH7–27–JH1 germline product in IGH tube E.
Occurrence of large clonal PCR products: Additionalclonal PCR products of large size can be obtained in case ofIGH, IGK, and TCRB gene rearrangements, generally caused byJ primer annealing to the next downstream (germline) J genesegment. For example, the six JH gene segments are clustered ina small region of B2.3 kb and are all recognized by the same JHconsensus primer. The five Jk gene segments are clustered in aregion of B1.4 kb and are recognized by two homologous Jkprimers. Finally, the seven Jb2 gene segments are clustered in aB1.1 kb region and recognized by seven homologous Jbprimers. In the IGH and IGK tubes, the larger (extended) clonalPCR product will generally be found in combination with thecorresponding smaller PCR product, unless the actually rear-ranged JH or Jk gene segment is not recognized properlybecause of somatic mutations or extensive nucleotide deletion.However, in case of the TCRB Vb–Jb tubes, the larger andcorresponding smaller PCR products might be found in separatetubes, because the Jb2.2, Jb2.6, and Jb2.7 primers are in tube A,whereas the other Jb2 primers are in tube B. Consequently, aVb–Jb2.5 rearrangement can give a small PCR product(B250 bp) in tube B and the same but larger (extended) Vb–Jb2.5–Jb2.6 PCR product in tube A.
Detection rate of Ig/TCR gene clonality:complementarity of PCR targets
For assessing the detection rate of clonal rearrangements by thevarious multiplex PCR tubes, a large series of 90 DNA sampleswas used, including 49 B-cell malignancies, 18 T-cell malig-nancies, 15 reactive samples, and eight samples of miscella-neous origin (see Table 8). All patient samples were evaluated indetail by Southern blotting for the detection of IGH, IGK, IGL,TCRB, TCRG, and TCRD gene rearrangements, assuming thatSouthern blotting can be regarded as the gold standard for thedetection of virtually all Ig/TCR gene rearrangements with asensitivity of at least 10%.
Detection rate of clonal Ig gene rearrangements in B-cell malignancies: A remarkably high concordance wasfound between the PCR and Southern blotting results for theindividual Ig gene rearrangements in the B-cell malignancies(Table 26). Overall, only 10–20% of the Southern blottingdetected Ig rearrangements were missed by PCR analysis of theindividual loci, mainly in germinal center and postgerminalcenter B-cell malignancies.
The combined usage of the three IGH VH–JH multiplex tubeshad a clear added value (82% detection rate), which was furtherincreased by use of the IGH DH–JH tubes, resulting in a totaldetection rate of 92% (Table 27). Apparently, the three VH–JHprimer tubes compensate each other in annealing to mutatedVH gene segments somatically. The virtually complete absenceof somatic mutations in incomplete DH–JH rearrangementsprobably explains the added value of the DH–JH tubes, despitethe lower frequency of these rearrangements (40–70%).
The clonality detection rate could be further increased tomaximal levels (98–100%) by inclusion of the two IGKmultiplex tubes. The combined IGK Vk–Jk and IGK-Kde tubeshad a high clonality detection rate of 80–90% (Table 27). Thishigh detection rate is particularly based on the fact that B30%of Igkþ B-cell malignancies and all Iglþ B-cell malignanciescontain IGK-Kde rearrangements, which are rarely somaticallymutated.69,194 It was remarkable to see that the IGL tube hadvirtually no added value on top of the IGH and IGK tubes, evennot in Iglþ B-cell malignancies (not shown). This can beexplained by the presence of IGK-Kde rearrangements in allIglþ B-cell malignancies. Our current studies in severalcategories of WHO-defined B-cell malignancies confirm thestrong added value of the IGH DH–JH and IGK tubes.
Detection rate of clonal TCR gene rearrangements inT-cell malignancies: A remarkably high concordance wasalso found in T-cell malignancies between PCR and Southernblotting results for the individual TCR gene rearrangements(Table 26). Although only 18 cases were studied, it was clearthat only a few TCR gene rearrangements were missed by PCRanalysis.
Traditionally, the TCRG gene rearrangements have been usedas PCR targets for clonality studies. Now TCRB gene rearrange-ments can be exploited as highly reliable PCR targets (Table 28);they represent attractive targets because of their extensivejunctional regions. The combined usage of the TCRB and TCRGmultiplex tubes has an unprecedentedly high clonality detectionrate in T-cell malignancies. This is explained by the fact thatvirtually all T-cell malignancies have TCRG gene rearrange-ments and that the vast majority has TCRB gene rearrangements.This is confirmed by our current studies in several categories ofWHO-classified T-cell malignancies. Logically, TCRD generearrangements are useful PCR targets in immature (lympho-blastic) T-cell malignancies and in T-cell malignancies of theTCRgd lineage.
Detection of t(11;14) (BCL1-IGH) and t(14;18)(BCL2-IGH)
In MCL patients with t(11;14) (BCL1-IGH), the BCL1 breakpointsare scattered over a large region of more than 200 kb, therebyprecluding a high detection rate in routine PCR analysis. Alsothe here presented BCL1-IGH tube only detects approximately40% of BCL1 translocations in MCL, which is comparable to theliterature.
PCR-based clonality studies in lymphoproliferationsJJM van Dongen et al
2307
Leukemia

In contrast, knowledge about the clustering of the breakpointsin the downstream BCL2 region allowed the design of threeBCL2-IGH multiplex tubes that reached a total detection rate of480%, which is an unprecedentedly high frequency ascompared to the literature.
Choice of targets and choice of technique for PCR-basedclonality diagnostics
Based on the above summarized data and the currentexperience of the participants of the BIOMED-2 ConcertedAction BMH4-CT98-3936, it is possible to design stepwisestrategies for PCR-based clonality diagnostics in suspect B-cellor T-cell proliferations. For example, in case of a suspect B-cellproliferation the three IGH VH–JH tubes and the two IGK tubes(Vk–Jk and Kde) can be used as five first-choice multiplex tubes(Table 27). If no clonal PCR products are obtained, extra PCRanalyses can be performed by use of the IGH DH–JH and IGLtubes (three extra tubes). Alternative strategies can be designed,for example, by choosing two IGH VH–JH multiplex tubes (egVH-FR1 and VH-FR2 primers), one IGH DH–JH (tube D) and thetwo IGK multiplex tubes. These five multiplex tubes can detectclonality in virtually all B-cell malignancies.
Logically, if the lymphoproliferation is suspected to be anMCL or FCL, the t(11;14) (BCL1-IGH) and t(14;18) (BCL2-IGH)tubes should also be included, respectively.
For clonality diagnostics in suspect T-cell proliferations, thechoice of PCR targets is relatively simple: three multiplex TCRBtubes (two Vb–Jb and one Db–Jb) as well as two multiplex TCRGtubes. These five TCR multiplex tubes should be able to detectclonality in the vast majority of T-cell malignancies (Table 28).In immature T-cell malignancies or TCRgdþ T-cell prolifera-tions, the TCRD gene rearrangements should also be studied.
As heteroduplex analysis separates PCR products according tolength and composition of the junctional region, this techniquecan be used for all Ig/TCR targets, also for rearrangements withshort junctional regions (IGH DH–JH and IGK). However, a lowtumor load and small subclones (o10%) might be missed.GeneScanning separates PCR products according to length ofthe junctional regions only. Therefore, GeneScanning worksperfectly for IGH VH–JH and TCRB gene targets, but also forTCRG gene targets, with a good sensitivity of 0.5–5%. However,GeneScanning of IGH DH–JH and IGK PCR products might bedifficult, particularly in case of a low tumor load or smallsubclones.
Consequently, the choice of PCR targets and the choice oftechnique will be influenced by the diagnostic problem such asthe type and the estimated relative size of the suspectlymphoproliferation.
Control gene primer sets for quality assessment of DNAfrom paraffin-embedded tissue samples
DNA extracted from paraffin-embedded tissue samples fre-quently is of moderate to poor quality and might contain PCRinhibitors. Consequently, it is essential to evaluate the integrityand amplifiability of DNA extracted from paraffin-embeddedtissues. The multiplex BIOMED-2 Control Gene tube (PCRproducts of 100, 200, 300, 400, and 600 bp) has proven to beinformative for such evaluation. For reliable Ig/TCR assays onDNA from paraffin-embedded tissue samples, the control genePCR tube should result in PCR products of at least 300 bp(sufficient DNA integrity) and at least two concentrations ofDNA should be tested, for example, 100 and 50 ng (dilution ofPCR inhibitors). The better amplifiable DNA concentrationshould be used for duplicate PCR-based clonality studies in
Table 26 Concordance between multiplex PCR results and Southern blot analysis results (PCR/SB) on Ig/TCR gene rearrangements per(sub)category of included frozen samples
Diagnosis IGHa IGK IGL TCRB TCRG TCRD
Prefollicular (n¼8) Cb: 8/8 C: 8/8 C: 4/4 C: 2/4c C: 0/0 C: 0/0Pb: 0/0 P: 0/0 P: 4/4 P: 4/4 P: 8/8 P: 8/8e
B-CLL (n¼ 16) C: 15/16 C: 16/16 C: 5/5 C: 1/1 C: 0/0 C: 2/2P: 0/0 P: 0/0 P: 9/11 P: 15/15 P: 16/16 P: 14/14
(Post)follicular (n¼25) C: 22/25c C: 19/24d C: 3/5 C: 2/4 C: 0/1 C: 0/0P: 0/0 P: 0/1 P: 19/20 P: 21/21e,f P: 22/24 P: 24/25f
All B-cell malignancies (n¼49) C: 45/49 C: 43/48 C: 12/14 C: 5/9 C: 0/1 C: 2/2P: 0/0 P: 0/1 P: 32/35 P: 40/40 P: 46/48 P: 46/47
T-cell malignancies (n¼18) C: 2/2 C: 0/0 C: 0/0 C: 17/17d C: 15/16c C: 2/3P: 15/16f P: 17/18 P: 17/18 P: 1/1 P: 1/2 P: 14/15f
Reactive samples (n¼ 15) C: 0/0 C: 0/0 C: 0/0 C: 0/0 C: 0/0 C: 0/0P: 15/15 P: 15/15 P: 15/15 P: 14/15 P: 15/15 P: 15/15
Miscellaneous (n¼ 8) C: 3/3 C: 2/2 C: 0/0 C: 3/3 C: 1/1 C: 1/1P: 3/5 P: 4/6 P: 6/8 P: 5/5e P: 6/7 P: 5/7
All samples (n¼90) C: 50/54 C: 45/50 C: 12/14 C: 25/29 C: 16/18 C: 5/6P: 33/36 P: 36/40 P: 70/76 P: 60/61 P: 68/72 P: 80/84
aIncludes both VH–JH and DH–JH PCR analysis.bC, clonal rearrangements; P, polyclonal rearrangements.cIn one sample clonality in GeneScanning only.dIn one sample clonality in heteroduplex analysis only.eIn one sample polyclonality in GeneScanning only.fIn one sample polyclonality in heteroduplex analysis only.
PCR-based clonality studies in lymphoproliferationsJJM van Dongen et al
2308
Leukemia
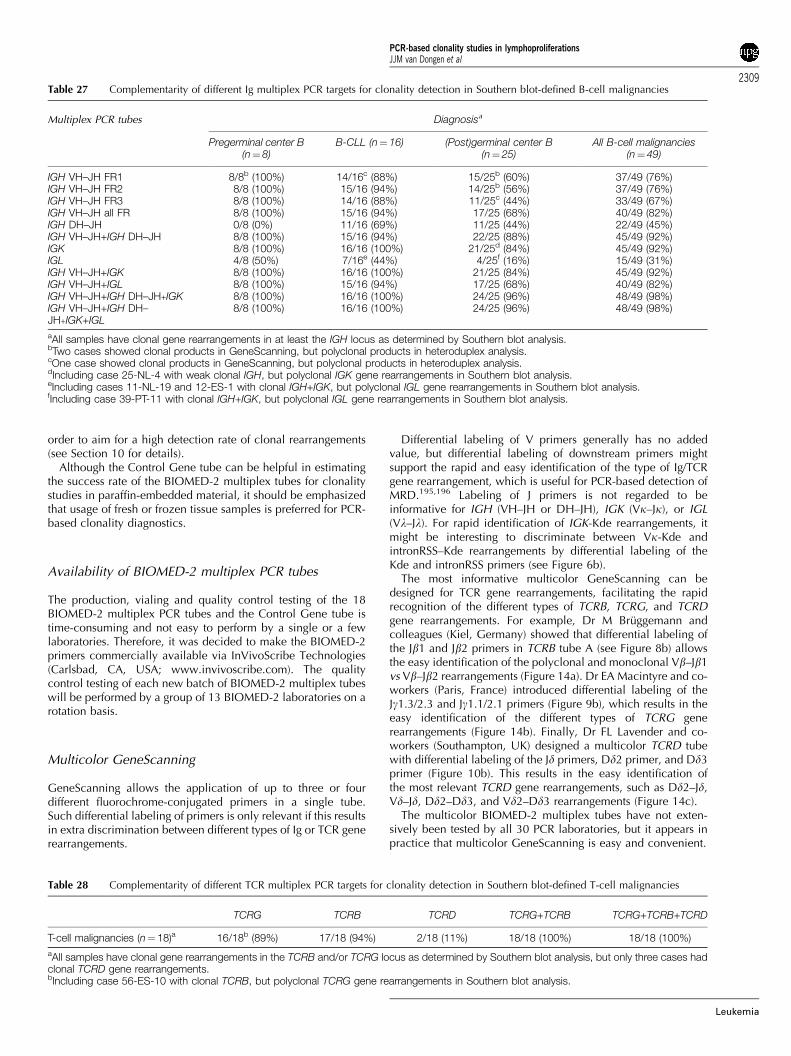
order to aim for a high detection rate of clonal rearrangements(see Section 10 for details).
Although the Control Gene tube can be helpful in estimatingthe success rate of the BIOMED-2 multiplex tubes for clonalitystudies in paraffin-embedded material, it should be emphasizedthat usage of fresh or frozen tissue samples is preferred for PCR-based clonality diagnostics.
Availability of BIOMED-2 multiplex PCR tubes
The production, vialing and quality control testing of the 18BIOMED-2 multiplex PCR tubes and the Control Gene tube istime-consuming and not easy to perform by a single or a fewlaboratories. Therefore, it was decided to make the BIOMED-2primers commercially available via InVivoScribe Technologies(Carlsbad, CA, USA; www.invivoscribe.com). The qualitycontrol testing of each new batch of BIOMED-2 multiplex tubeswill be performed by a group of 13 BIOMED-2 laboratories on arotation basis.
Multicolor GeneScanning
GeneScanning allows the application of up to three or fourdifferent fluorochrome-conjugated primers in a single tube.Such differential labeling of primers is only relevant if this resultsin extra discrimination between different types of Ig or TCR generearrangements.
Differential labeling of V primers generally has no addedvalue, but differential labeling of downstream primers mightsupport the rapid and easy identification of the type of Ig/TCRgene rearrangement, which is useful for PCR-based detection ofMRD.195,196 Labeling of J primers is not regarded to beinformative for IGH (VH–JH or DH–JH), IGK (Vk–Jk), or IGL(Vl–Jl). For rapid identification of IGK-Kde rearrangements, itmight be interesting to discriminate between Vk-Kde andintronRSS–Kde rearrangements by differential labeling of theKde and intronRSS primers (see Figure 6b).
The most informative multicolor GeneScanning can bedesigned for TCR gene rearrangements, facilitating the rapidrecognition of the different types of TCRB, TCRG, and TCRDgene rearrangements. For example, Dr M Bruggemann andcolleagues (Kiel, Germany) showed that differential labeling ofthe Jb1 and Jb2 primers in TCRB tube A (see Figure 8b) allowsthe easy identification of the polyclonal and monoclonal Vb–Jb1vs Vb–Jb2 rearrangements (Figure 14a). Dr EA Macintyre and co-workers (Paris, France) introduced differential labeling of theJg1.3/2.3 and Jg1.1/2.1 primers (Figure 9b), which results in theeasy identification of the different types of TCRG generearrangements (Figure 14b). Finally, Dr FL Lavender and co-workers (Southampton, UK) designed a multicolor TCRD tubewith differential labeling of the Jd primers, Dd2 primer, and Dd3primer (Figure 10b). This results in the easy identification ofthe most relevant TCRD gene rearrangements, such as Dd2–Jd,Vd–Jd, Dd2–Dd3, and Vd2–Dd3 rearrangements (Figure 14c).
The multicolor BIOMED-2 multiplex tubes have not exten-sively been tested by all 30 PCR laboratories, but it appears inpractice that multicolor GeneScanning is easy and convenient.
Table 27 Complementarity of different Ig multiplex PCR targets for clonality detection in Southern blot-defined B-cell malignancies
Multiplex PCR tubes Diagnosisa
Pregerminal center B(n¼8)
B-CLL (n¼ 16) (Post)germinal center B(n¼25)
All B-cell malignancies(n¼49)
IGH VH–JH FR1 8/8b (100%) 14/16c (88%) 15/25b (60%) 37/49 (76%)IGH VH–JH FR2 8/8 (100%) 15/16 (94%) 14/25b (56%) 37/49 (76%)IGH VH–JH FR3 8/8 (100%) 14/16 (88%) 11/25c (44%) 33/49 (67%)IGH VH–JH all FR 8/8 (100%) 15/16 (94%) 17/25 (68%) 40/49 (82%)IGH DH–JH 0/8 (0%) 11/16 (69%) 11/25 (44%) 22/49 (45%)IGH VH–JH+IGH DH–JH 8/8 (100%) 15/16 (94%) 22/25 (88%) 45/49 (92%)IGK 8/8 (100%) 16/16 (100%) 21/25d (84%) 45/49 (92%)IGL 4/8 (50%) 7/16e (44%) 4/25f (16%) 15/49 (31%)IGH VH–JH+IGK 8/8 (100%) 16/16 (100%) 21/25 (84%) 45/49 (92%)IGH VH–JH+IGL 8/8 (100%) 15/16 (94%) 17/25 (68%) 40/49 (82%)IGH VH–JH+IGH DH–JH+IGK 8/8 (100%) 16/16 (100%) 24/25 (96%) 48/49 (98%)IGH VH–JH+IGH DH–JH+IGK+IGL
8/8 (100%) 16/16 (100%) 24/25 (96%) 48/49 (98%)
aAll samples have clonal gene rearrangements in at least the IGH locus as determined by Southern blot analysis.bTwo cases showed clonal products in GeneScanning, but polyclonal products in heteroduplex analysis.cOne case showed clonal products in GeneScanning, but polyclonal products in heteroduplex analysis.dIncluding case 25-NL-4 with weak clonal IGH, but polyclonal IGK gene rearrangements in Southern blot analysis.eIncluding cases 11-NL-19 and 12-ES-1 with clonal IGH+IGK, but polyclonal IGL gene rearrangements in Southern blot analysis.fIncluding case 39-PT-11 with clonal IGH+IGK, but polyclonal IGL gene rearrangements in Southern blot analysis.
Table 28 Complementarity of different TCR multiplex PCR targets for clonality detection in Southern blot-defined T-cell malignancies
TCRG TCRB TCRD TCRG+TCRB TCRG+TCRB+TCRD
T-cell malignancies (n¼ 18)a 16/18b (89%) 17/18 (94%) 2/18 (11%) 18/18 (100%) 18/18 (100%)
aAll samples have clonal gene rearrangements in the TCRB and/or TCRG locus as determined by Southern blot analysis, but only three cases hadclonal TCRD gene rearrangements.bIncluding case 56-ES-10 with clonal TCRB, but polyclonal TCRG gene rearrangements in Southern blot analysis.
PCR-based clonality studies in lymphoproliferationsJJM van Dongen et al
2309
Leukemia
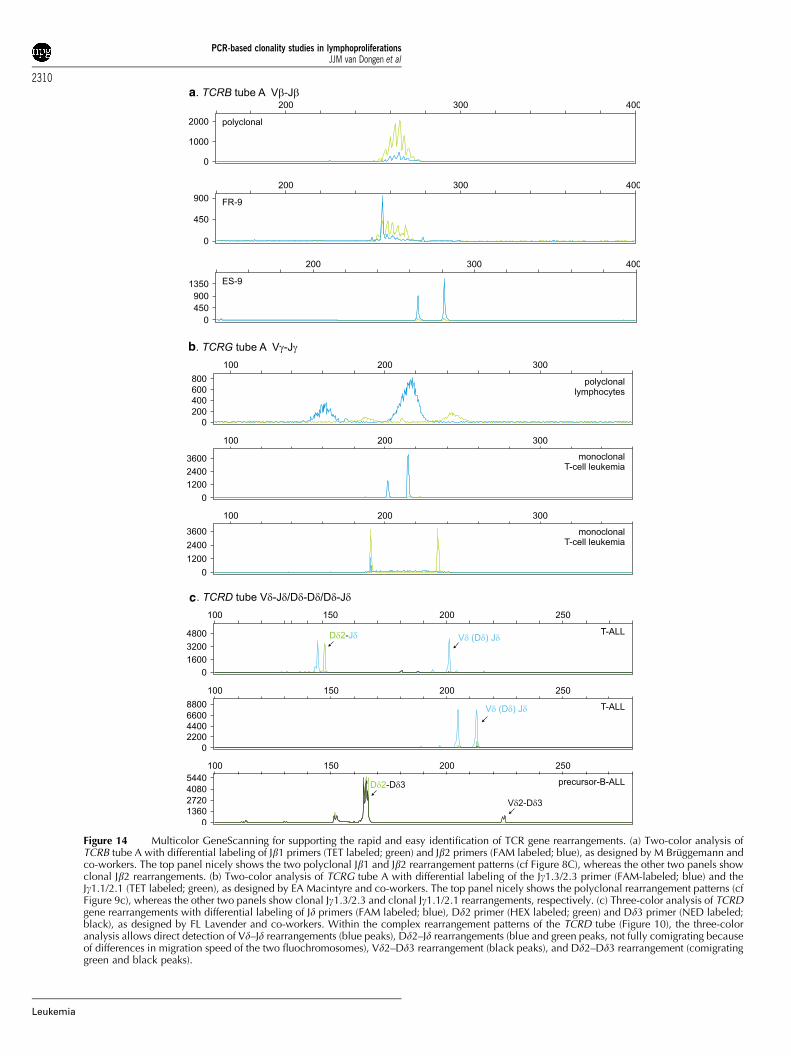
a
b
c
Figure 14 Multicolor GeneScanning for supporting the rapid and easy identification of TCR gene rearrangements. (a) Two-color analysis ofTCRB tube A with differential labeling of Jb1 primers (TET labeled; green) and Jb2 primers (FAM labeled; blue), as designed by M Bruggemann andco-workers. The top panel nicely shows the two polyclonal Jb1 and Jb2 rearrangement patterns (cf Figure 8C), whereas the other two panels showclonal Jb2 rearrangements. (b) Two-color analysis of TCRG tube A with differential labeling of the Jg1.3/2.3 primer (FAM-labeled; blue) and theJg1.1/2.1 (TET labeled; green), as designed by EA Macintyre and co-workers. The top panel nicely shows the polyclonal rearrangement patterns (cfFigure 9c), whereas the other two panels show clonal Jg1.3/2.3 and clonal Jg1.1/2.1 rearrangements, respectively. (c) Three-color analysis of TCRDgene rearrangements with differential labeling of Jd primers (FAM labeled; blue), Dd2 primer (HEX labeled; green) and Dd3 primer (NED labeled;black), as designed by FL Lavender and co-workers. Within the complex rearrangement patterns of the TCRD tube (Figure 10), the three-coloranalysis allows direct detection of Vd–Jd rearrangements (blue peaks), Dd2–Jd rearrangements (blue and green peaks, not fully comigrating becauseof differences in migration speed of the two fluochromosomes), Vd2–Dd3 rearrangement (black peaks), and Dd2–Dd3 rearrangement (comigratinggreen and black peaks).
PCR-based clonality studies in lymphoproliferationsJJM van Dongen et al
2310
Leukemia
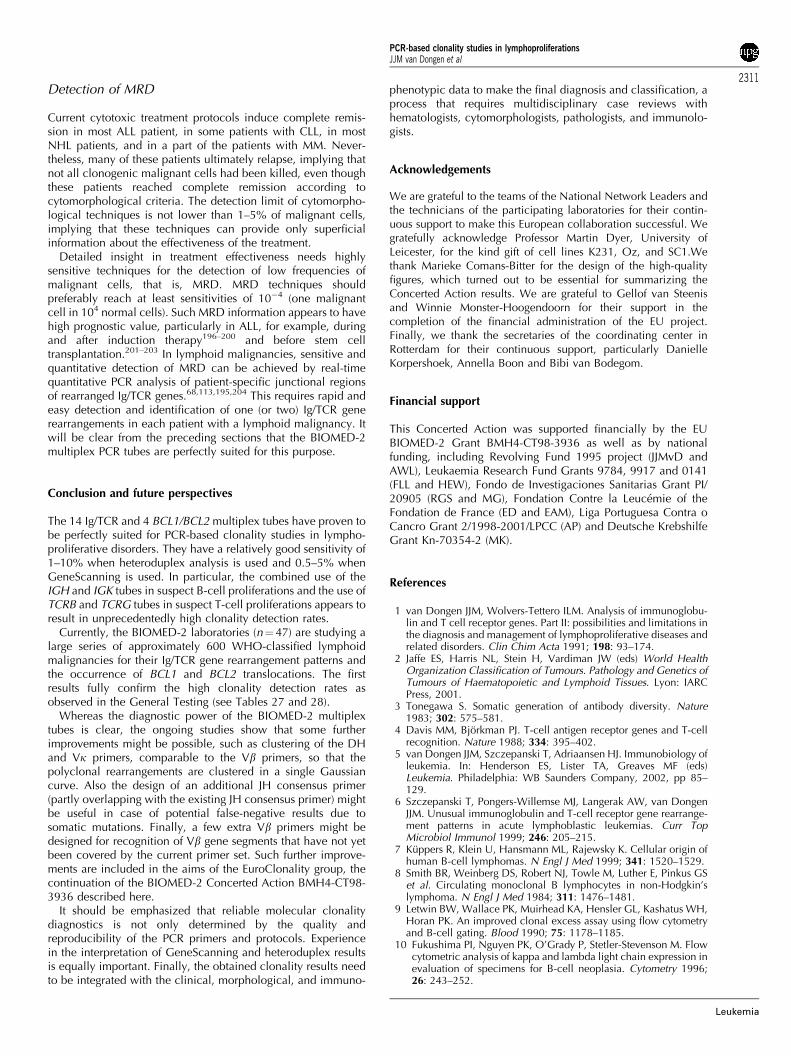
Detection of MRD
Current cytotoxic treatment protocols induce complete remis-sion in most ALL patient, in some patients with CLL, in mostNHL patients, and in a part of the patients with MM. Never-theless, many of these patients ultimately relapse, implying thatnot all clonogenic malignant cells had been killed, even thoughthese patients reached complete remission according tocytomorphological criteria. The detection limit of cytomorpho-logical techniques is not lower than 1–5% of malignant cells,implying that these techniques can provide only superficialinformation about the effectiveness of the treatment.
Detailed insight in treatment effectiveness needs highlysensitive techniques for the detection of low frequencies ofmalignant cells, that is, MRD. MRD techniques shouldpreferably reach at least sensitivities of 10�4 (one malignantcell in 104 normal cells). Such MRD information appears to havehigh prognostic value, particularly in ALL, for example, duringand after induction therapy196–200 and before stem celltransplantation.201–203 In lymphoid malignancies, sensitive andquantitative detection of MRD can be achieved by real-timequantitative PCR analysis of patient-specific junctional regionsof rearranged Ig/TCR genes.68,113,195,204 This requires rapid andeasy detection and identification of one (or two) Ig/TCR generearrangements in each patient with a lymphoid malignancy. Itwill be clear from the preceding sections that the BIOMED-2multiplex PCR tubes are perfectly suited for this purpose.
Conclusion and future perspectives
The 14 Ig/TCR and 4 BCL1/BCL2 multiplex tubes have proven tobe perfectly suited for PCR-based clonality studies in lympho-proliferative disorders. They have a relatively good sensitivity of1–10% when heteroduplex analysis is used and 0.5–5% whenGeneScanning is used. In particular, the combined use of theIGH and IGK tubes in suspect B-cell proliferations and the use ofTCRB and TCRG tubes in suspect T-cell proliferations appears toresult in unprecedentedly high clonality detection rates.
Currently, the BIOMED-2 laboratories (n¼ 47) are studying alarge series of approximately 600 WHO-classified lymphoidmalignancies for their Ig/TCR gene rearrangement patterns andthe occurrence of BCL1 and BCL2 translocations. The firstresults fully confirm the high clonality detection rates asobserved in the General Testing (see Tables 27 and 28).
Whereas the diagnostic power of the BIOMED-2 multiplextubes is clear, the ongoing studies show that some furtherimprovements might be possible, such as clustering of the DHand Vk primers, comparable to the Vb primers, so that thepolyclonal rearrangements are clustered in a single Gaussiancurve. Also the design of an additional JH consensus primer(partly overlapping with the existing JH consensus primer) mightbe useful in case of potential false-negative results due tosomatic mutations. Finally, a few extra Vb primers might bedesigned for recognition of Vb gene segments that have not yetbeen covered by the current primer set. Such further improve-ments are included in the aims of the EuroClonality group, thecontinuation of the BIOMED-2 Concerted Action BMH4-CT98-3936 described here.
It should be emphasized that reliable molecular clonalitydiagnostics is not only determined by the quality andreproducibility of the PCR primers and protocols. Experiencein the interpretation of GeneScanning and heteroduplex resultsis equally important. Finally, the obtained clonality results needto be integrated with the clinical, morphological, and immuno-
phenotypic data to make the final diagnosis and classification, aprocess that requires multidisciplinary case reviews withhematologists, cytomorphologists, pathologists, and immunolo-gists.
Acknowledgements
We are grateful to the teams of the National Network Leaders andthe technicians of the participating laboratories for their contin-uous support to make this European collaboration successful. Wegratefully acknowledge Professor Martin Dyer, University ofLeicester, for the kind gift of cell lines K231, Oz, and SC1.Wethank Marieke Comans-Bitter for the design of the high-qualityfigures, which turned out to be essential for summarizing theConcerted Action results. We are grateful to Gellof van Steenisand Winnie Monster-Hoogendoorn for their support in thecompletion of the financial administration of the EU project.Finally, we thank the secretaries of the coordinating center inRotterdam for their continuous support, particularly DanielleKorpershoek, Annella Boon and Bibi van Bodegom.
Financial support
This Concerted Action was supported financially by the EUBIOMED-2 Grant BMH4-CT98-3936 as well as by nationalfunding, including Revolving Fund 1995 project (JJMvD andAWL), Leukaemia Research Fund Grants 9784, 9917 and 0141(FLL and HEW), Fondo de Investigaciones Sanitarias Grant PI/20905 (RGS and MG), Fondation Contre la Leucemie of theFondation de France (ED and EAM), Liga Portuguesa Contra oCancro Grant 2/1998-2001/LPCC (AP) and Deutsche KrebshilfeGrant Kn-70354-2 (MK).
References
1 van Dongen JJM, Wolvers-Tettero ILM. Analysis of immunoglobu-lin and T cell receptor genes. Part II: possibilities and limitations inthe diagnosis and management of lymphoproliferative diseases andrelated disorders. Clin Chim Acta 1991; 198: 93–174.
2 Jaffe ES, Harris NL, Stein H, Vardiman JW (eds) World HealthOrganization Classification of Tumours. Pathology and Genetics ofTumours of Haematopoietic and Lymphoid Tissues. Lyon: IARCPress, 2001.
3 Tonegawa S. Somatic generation of antibody diversity. Nature1983; 302: 575–581.
4 Davis MM, Bjorkman PJ. T-cell antigen receptor genes and T-cellrecognition. Nature 1988; 334: 395–402.
5 van Dongen JJM, Szczepanski T, Adriaansen HJ. Immunobiology ofleukemia. In: Henderson ES, Lister TA, Greaves MF (eds)Leukemia. Philadelphia: WB Saunders Company, 2002, pp 85–129.
6 Szczepanski T, Pongers-Willemse MJ, Langerak AW, van DongenJJM. Unusual immunoglobulin and T-cell receptor gene rearrange-ment patterns in acute lymphoblastic leukemias. Curr TopMicrobiol Immunol 1999; 246: 205–215.
7 Kuppers R, Klein U, Hansmann ML, Rajewsky K. Cellular origin ofhuman B-cell lymphomas. N Engl J Med 1999; 341: 1520–1529.
8 Smith BR, Weinberg DS, Robert NJ, Towle M, Luther E, Pinkus GSet al. Circulating monoclonal B lymphocytes in non-Hodgkin’slymphoma. N Engl J Med 1984; 311: 1476–1481.
9 Letwin BW, Wallace PK, Muirhead KA, Hensler GL, Kashatus WH,Horan PK. An improved clonal excess assay using flow cytometryand B-cell gating. Blood 1990; 75: 1178–1185.
10 Fukushima PI, Nguyen PK, O’Grady P, Stetler-Stevenson M. Flowcytometric analysis of kappa and lambda light chain expression inevaluation of specimens for B-cell neoplasia. Cytometry 1996;26: 243–252.
PCR-based clonality studies in lymphoproliferationsJJM van Dongen et al
2311
Leukemia

11 McCoy Jr JP, Overton WR, Schroeder K, Blumstein L, DonaldsonMH. Immunophenotypic analysis of the T cell receptor V betarepertoire in CD4+ and CD8+ lymphocytes from normalperipheral blood. Cytometry 1996; 26: 148–153.
12 van Dongen JJM, van den Beemd MWM, Schellekens M, Wolvs-Tettero ILM, Langerak AW, Groeneveld K. Analysis of malignantT cells with the Vb antibody panel. Immunologist 1996; 4: 37–40.
13 Van den Beemd MWM, Boor PPC, Van Lochem EG, Hop WCJ,Langerak AW, Wolvers-Tettero ILM et al. Flow ctometric analysisof the Vb repertoire in healthy controls. Cytometry 2000; 40:336–345.
14 Lima M, Almeida J, Santos AH, dos Anjos Teixeira M, AlgueroMC, Queiros ML et al. Immunophenotypic analysis of the TCR-Vbeta repertoire in 98 persistent expansions of CD3(+)/TCR-alphabeta(+) large granular lymphocytes: utility in assessingclonality and insights into the pathogenesis of the disease. Am JPathol 2001; 159: 1861–1868.
15 Langerak AW, Wolvers-Tettero ILM, van den Beemd MWM, vanWering ER, Ludwig W-D, Hahlen K et al. Immunophenotypic andimmunogenotypic characteristics of TCRgd+ T cell acute lympho-blastic leukemia. Leukemia 1999; 13: 206–214.
16 Langerak AW, van Den Beemd R, Wolvers-Tettero ILM, Boor PP,van Lochem EG, Hooijkaas H et al. Molecular and flowcytometric analysis of the Vbeta repertoire for clonality assess-ment in mature TCRalphabeta T-cell proliferations. Blood 2001;98: 165–173.
17 Semenzato G, Zambello R, Starkebaum G, Oshimi K, Loughran JrTP. The lymphoproliferative disease of granular lymphocytes:updated criteria for diagnosis. Blood 1997; 89: 256–260.
18 Triebel F, Faure F, Graziani M, Jitsukawa S, Lefranc MP, HercendT. A unique V–J–C-rearranged gene encodes a gamma proteinexpressed on the majority of CD3+ T cell receptor-alpha/beta-circulating lymphocytes. J Exp Med 1988; 167: 694–699.
19 Breit TM, Wolvers-Tettero IL, van Dongen JJ. Unique selectiondeterminant in polyclonal V delta 2–J delta 1 junctional regions ofhuman peripheral gamma delta T lymphocytes. J Immunol 1994;152: 2860–2864.
20 Breit TM, Wolvers-Tettero ILM, Hahlen K, Van Wering ER, vanDongen JJM. Limited combinatorial repertoire of gd T-cellreceptors expressed by T-cell acute lymphoblastic leukemias.Leukemia 1991; 5: 116–124.
21 van Dongen JJM, Wolvers-Tettero ILM. Analysis of immunoglo-bulin and T cell receptor genes. Part I: basic and technicalaspects. Clin Chim Acta 1991; 198: 1–91.
22 Beishuizen A, Verhoeven MA, Mol EJ, Breit TM, Wolvers-TetteroILM, van Dongen JJM. Detection of immunoglobulin heavy-chaingene rearrangements by Southern blot analysis: recommendationsfor optimal results. Leukemia 1993; 7: 2045–2053.
23 Breit TM, Wolvers-Tettero ILM, Beishuizen A, Verhoeven M-AJ,van Wering ER, van Dongen JJM. Southern blot patterns,frequencies and junctional diversity of T-cell receptor d generearrangements in acute lymphoblastic leukemia. Blood 1993;82: 3063–3074.
24 Beishuizen A, Verhoeven MA, Mol EJ, van Dongen JJM.Detection of immunoglobulin kappa light-chain gene rearrange-ment patterns by Southern blot analysis. Leukemia 1994; 8:2228–2236.
25 Tumkaya T, Comans-Bitter WM, Verhoeven MA, van DongenJJM. Southern blot detection of immunoglobulin lambda lightchain gene rearrangements for clonality studies. Leukemia 1995;9: 2127–2132.
26 Tumkaya T, Beishuizen A, Wolvers-Tettero ILM, van Dongen JJM.Identification of immunoglobulin lambda isotype gene rearrange-ments by Southern blot analysis. Leukemia 1996; 10: 1834–1839.
27 Moreau EJ, Langerak AW, van Gastel -Mol EJ, Wolvers-TetteroILM, Zhan M, Zhou Q et al. Easy detection of all T cell receptorgamma (TCRG) gene rearrangements by Southern blot analysis:recommendations for optimal results. Leukemia 1999; 13: 1620–1626.
28 Langerak AW, Wolvers-Tettero ILM, van Dongen JJM. Detectionof T cell receptor beta (TCRB) gene rearrangement patterns in Tcell malignancies by Southern blot analysis. Leukemia 1999; 13:965–974.
29 Hara J, Benedict SH, Mak TW, Gelfand EW. T cell receptor alpha-chain gene rearrangements in B-precursor leukemia are in
contrast to the findings in T cell acute lymphoblastic leukemia.Comparative study of T cell receptor gene rearrangement inchildhood leukemia. J Clin Invest 1987; 80: 1770–1777.
30 Szczepanski T, Beishuizen A, Pongers-Willemse MJ, Hahlen K,van Wering ER, Wijkhuijs JM et al. Cross-lineage T-cell receptorgene rearrangements occur in more than ninety percent ofchildhood precursor-B-acute lymphoblastic leukemias: alterna-tive PCR targets for detection of minimal residual disease.Leukemia 1999; 13: 196–205.
31 Szczepanski T, Langerak AW, van Dongen JJ, van Krieken JH.Lymphoma with multi-gene rearrangement on the level ofimmunoglobulin heavy chain, light chain, and T-cell receptorbeta chain. Am J Hematol 1998; 59: 99–100.
32 Przybylski G, Oettle H, Ludwig WD, Siegert W, Schmidt CA.Molecular characterization of illegitimate TCR delta generearrangements in acute myeloid leukaemia. Br J Haematol1994; 87: 301–307.
33 Boeckx N, Willemse MJ, Szczepanski T, van Der Velden VHJ,Langerak AW, Vandekerckhove P et al. Fusion gene transcriptsand Ig/TCR gene rearrangements are complementary but infre-quent targets for PCR-based detection of minimal residual diseasein acute myeloid leukemia. Leukemia 2002; 16: 368–375.
34 Szczepanski T, Pongers-Willemse MJ, Langerak AW, Harts WA,Wijkhuijs JM, van Wering ER et al. Ig heavy chain generearrangements in T-cell acute lymphoblastic leukemia exhibitpredominant DH6-19 and DH7-27 gene usage, can result incomplete V–D–J rearrangements, and are rare in T-cell receptorab lineage. Blood 1999; 93: 4079–4085.
35 Kluin-Nelemans HC, Kester MG, van deCorput L, Boor PP,Landegent JE, van Dongen JJ et al. Correction of abnormal T-cellreceptor repertoire during interferon-alpha therapy in patientswith hairy cell leukemia. Blood 1998; 91: 4224–4231.
36 Sarzotti M, Patel DD, Li X, Ozaki DA, Cao S, Langdon S et al. Tcell repertoire development in humans with SCID after non-ablative allogeneic marrow transplantation. J Immunol 2003;170: 2711–2718.
37 Mariani S, Coscia M, Even J, Peola S, Foglietta M, Boccadoro Met al. Severe and long-lasting disruption of T-cell receptordiversity in human myeloma after high-dose chemotherapy andautologous peripheral blood progenitor cell infusion. Br JHaematol 2001; 113: 1051–1059.
38 Davis TH, Yockey CE, Balk SP. Detection of clonal immunoglo-bulin gene rearrangements by polymerase chain reactionamplification and single-strand conformational polymorphismanalysis. Am J Pathol 1993; 142: 1841–1847.
39 Bourguin A, Tung R, Galili N, Sklar J. Rapid, nonradioactivedetection of clonal T-cell receptor gene rearrangements inlymphoid neoplasms. Proc Natl Acad Sci USA 1990; 87: 8536–8540.
40 Bottaro M, Berti E, Biondi A, Migone N, Crosti L. Heteroduplexanalysis of T-cell receptor gamma gene rearrangements fordiagnosis and monitoring of cutaneous T-cell lymphomas. Blood1994; 83: 3271–3278.
41 Langerak AW, Szczepanski T, van der Burg M, Wolvers-TetteroILM, van Dongen JJM. Heteroduplex PCR analysis of rearranged Tcell receptor genes for clonality assessment in suspect T cellproliferations. Leukemia 1997; 11: 2192–2199.
42 Kneba M, Bolz I, Linke B, Hiddemann W. Analysis of rearrangedT-cell receptor beta-chain genes by polymerase chain reaction(PCR) DNA sequencing and automated high resolution PCRfragment analysis. Blood 1995; 86: 3930–3937.
43 Linke B, Bolz I, Fayyazi A, von Hofen M, Pott C, Bertram J et al.Automated high resolution PCR fragment analysis for identifica-tion of clonally rearranged immunoglobulin heavy chain genes.Leukemia 1997; 11: 1055–1062.
44 Matsuda F, Ishii K, Bourvagnet P, Kuma K, Hayashida H, Miyata Tet al. The complete nucleotide sequence of the humanimmunoglobulin heavy chain variable region locus. J Exp Med1998; 188: 2151–2162.
45 Camacho FI, Algara P, Rodriguez A, Ruiz-Ballesteros E, MollejoM, Martinez N et al. Molecular heterogeneity in MCL defined bythe use of specific VH genes and the frequency of somaticmutations. Blood 2003; 101: 4042–4046.
46 Pritsch O, Troussard X, Magnac C, Mauro FR, Davi F, Payelle-Brogard B et al. VH gene usage by family members affected with
PCR-based clonality studies in lymphoproliferationsJJM van Dongen et al
2312
Leukemia
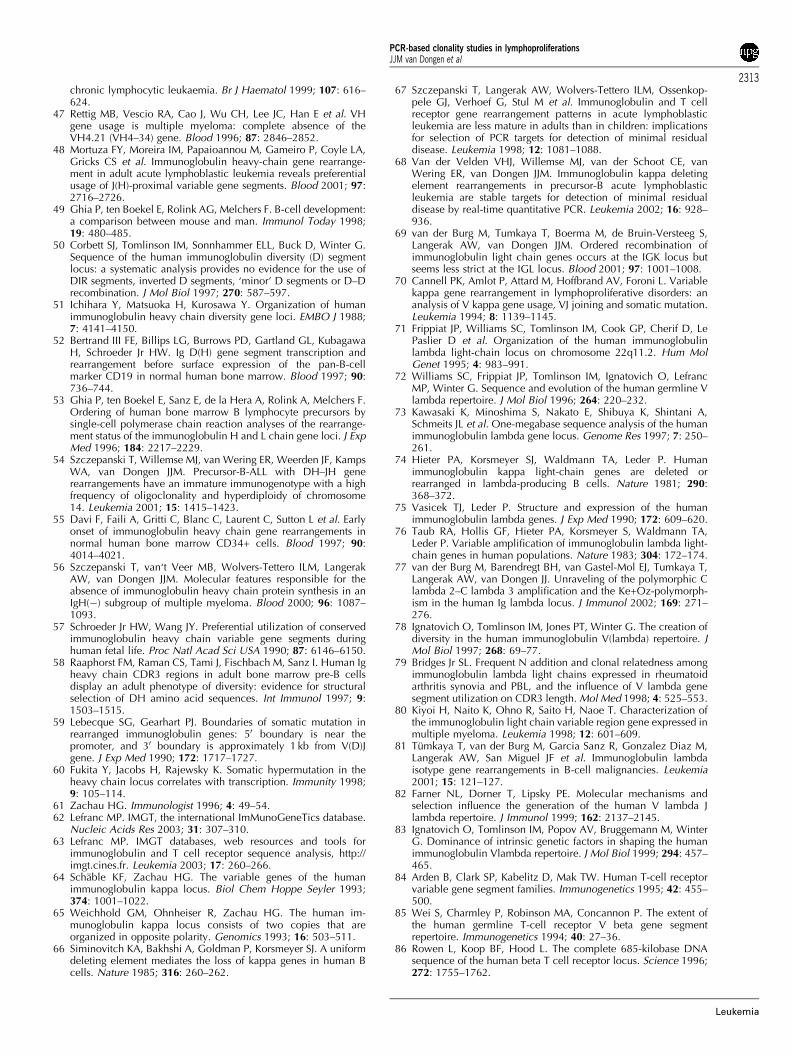
chronic lymphocytic leukaemia. Br J Haematol 1999; 107: 616–624.
47 Rettig MB, Vescio RA, Cao J, Wu CH, Lee JC, Han E et al. VHgene usage is multiple myeloma: complete absence of theVH4.21 (VH4–34) gene. Blood 1996; 87: 2846–2852.
48 Mortuza FY, Moreira IM, Papaioannou M, Gameiro P, Coyle LA,Gricks CS et al. Immunoglobulin heavy-chain gene rearrange-ment in adult acute lymphoblastic leukemia reveals preferentialusage of J(H)-proximal variable gene segments. Blood 2001; 97:2716–2726.
49 Ghia P, ten Boekel E, Rolink AG, Melchers F. B-cell development:a comparison between mouse and man. Immunol Today 1998;19: 480–485.
50 Corbett SJ, Tomlinson IM, Sonnhammer ELL, Buck D, Winter G.Sequence of the human immunoglobulin diversity (D) segmentlocus: a systematic analysis provides no evidence for the use ofDIR segments, inverted D segments, ‘minor’ D segments or D–Drecombination. J Mol Biol 1997; 270: 587–597.
51 Ichihara Y, Matsuoka H, Kurosawa Y. Organization of humanimmunoglobulin heavy chain diversity gene loci. EMBO J 1988;7: 4141–4150.
52 Bertrand III FE, Billips LG, Burrows PD, Gartland GL, KubagawaH, Schroeder Jr HW. Ig D(H) gene segment transcription andrearrangement before surface expression of the pan-B-cellmarker CD19 in normal human bone marrow. Blood 1997; 90:736–744.
53 Ghia P, ten Boekel E, Sanz E, de la Hera A, Rolink A, Melchers F.Ordering of human bone marrow B lymphocyte precursors bysingle-cell polymerase chain reaction analyses of the rearrange-ment status of the immunoglobulin H and L chain gene loci. J ExpMed 1996; 184: 2217–2229.
54 Szczepanski T, Willemse MJ, van Wering ER, Weerden JF, KampsWA, van Dongen JJM. Precursor-B-ALL with DH–JH generearrangements have an immature immunogenotype with a highfrequency of oligoclonality and hyperdiploidy of chromosome14. Leukemia 2001; 15: 1415–1423.
55 Davi F, Faili A, Gritti C, Blanc C, Laurent C, Sutton L et al. Earlyonset of immunoglobulin heavy chain gene rearrangements innormal human bone marrow CD34+ cells. Blood 1997; 90:4014–4021.
56 Szczepanski T, van‘t Veer MB, Wolvers-Tettero ILM, LangerakAW, van Dongen JJM. Molecular features responsible for theabsence of immunoglobulin heavy chain protein synthesis in anIgH(�) subgroup of multiple myeloma. Blood 2000; 96: 1087–1093.
57 Schroeder Jr HW, Wang JY. Preferential utilization of conservedimmunoglobulin heavy chain variable gene segments duringhuman fetal life. Proc Natl Acad Sci USA 1990; 87: 6146–6150.
58 Raaphorst FM, Raman CS, Tami J, Fischbach M, Sanz I. Human Igheavy chain CDR3 regions in adult bone marrow pre-B cellsdisplay an adult phenotype of diversity: evidence for structuralselection of DH amino acid sequences. Int Immunol 1997; 9:1503–1515.
59 Lebecque SG, Gearhart PJ. Boundaries of somatic mutation inrearranged immunoglobulin genes: 50 boundary is near thepromoter, and 30 boundary is approximately 1 kb from V(D)Jgene. J Exp Med 1990; 172: 1717–1727.
60 Fukita Y, Jacobs H, Rajewsky K. Somatic hypermutation in theheavy chain locus correlates with transcription. Immunity 1998;9: 105–114.
61 Zachau HG. Immunologist 1996; 4: 49–54.62 Lefranc MP. IMGT, the international ImMunoGeneTics database.
Nucleic Acids Res 2003; 31: 307–310.63 Lefranc MP. IMGT databases, web resources and tools for
immunoglobulin and T cell receptor sequence analysis, http://imgt.cines.fr. Leukemia 2003; 17: 260–266.
64 Schable KF, Zachau HG. The variable genes of the humanimmunoglobulin kappa locus. Biol Chem Hoppe Seyler 1993;374: 1001–1022.
65 Weichhold GM, Ohnheiser R, Zachau HG. The human im-munoglobulin kappa locus consists of two copies that areorganized in opposite polarity. Genomics 1993; 16: 503–511.
66 Siminovitch KA, Bakhshi A, Goldman P, Korsmeyer SJ. A uniformdeleting element mediates the loss of kappa genes in human Bcells. Nature 1985; 316: 260–262.
67 Szczepanski T, Langerak AW, Wolvers-Tettero ILM, Ossenkop-pele GJ, Verhoef G, Stul M et al. Immunoglobulin and T cellreceptor gene rearrangement patterns in acute lymphoblasticleukemia are less mature in adults than in children: implicationsfor selection of PCR targets for detection of minimal residualdisease. Leukemia 1998; 12: 1081–1088.
68 Van der Velden VHJ, Willemse MJ, van der Schoot CE, vanWering ER, van Dongen JJM. Immunoglobulin kappa deletingelement rearrangements in precursor-B acute lymphoblasticleukemia are stable targets for detection of minimal residualdisease by real-time quantitative PCR. Leukemia 2002; 16: 928–936.
69 van der Burg M, Tumkaya T, Boerma M, de Bruin-Versteeg S,Langerak AW, van Dongen JJM. Ordered recombination ofimmunoglobulin light chain genes occurs at the IGK locus butseems less strict at the IGL locus. Blood 2001; 97: 1001–1008.
70 Cannell PK, Amlot P, Attard M, Hoffbrand AV, Foroni L. Variablekappa gene rearrangement in lymphoproliferative disorders: ananalysis of V kappa gene usage, VJ joining and somatic mutation.Leukemia 1994; 8: 1139–1145.
71 Frippiat JP, Williams SC, Tomlinson IM, Cook GP, Cherif D, LePaslier D et al. Organization of the human immunoglobulinlambda light-chain locus on chromosome 22q11.2. Hum MolGenet 1995; 4: 983–991.
72 Williams SC, Frippiat JP, Tomlinson IM, Ignatovich O, LefrancMP, Winter G. Sequence and evolution of the human germline Vlambda repertoire. J Mol Biol 1996; 264: 220–232.
73 Kawasaki K, Minoshima S, Nakato E, Shibuya K, Shintani A,Schmeits JL et al. One-megabase sequence analysis of the humanimmunoglobulin lambda gene locus. Genome Res 1997; 7: 250–261.
74 Hieter PA, Korsmeyer SJ, Waldmann TA, Leder P. Humanimmunoglobulin kappa light-chain genes are deleted orrearranged in lambda-producing B cells. Nature 1981; 290:368–372.
75 Vasicek TJ, Leder P. Structure and expression of the humanimmunoglobulin lambda genes. J Exp Med 1990; 172: 609–620.
76 Taub RA, Hollis GF, Hieter PA, Korsmeyer S, Waldmann TA,Leder P. Variable amplification of immunoglobulin lambda light-chain genes in human populations. Nature 1983; 304: 172–174.
77 van der Burg M, Barendregt BH, van Gastel-Mol EJ, Tumkaya T,Langerak AW, van Dongen JJ. Unraveling of the polymorphic Clambda 2–C lambda 3 amplification and the Ke+Oz-polymorph-ism in the human Ig lambda locus. J Immunol 2002; 169: 271–276.
78 Ignatovich O, Tomlinson IM, Jones PT, Winter G. The creation ofdiversity in the human immunoglobulin V(lambda) repertoire. JMol Biol 1997; 268: 69–77.
79 Bridges Jr SL. Frequent N addition and clonal relatedness amongimmunoglobulin lambda light chains expressed in rheumatoidarthritis synovia and PBL, and the influence of V lambda genesegment utilization on CDR3 length. Mol Med 1998; 4: 525–553.
80 Kiyoi H, Naito K, Ohno R, Saito H, Naoe T. Characterization ofthe immunoglobulin light chain variable region gene expressed inmultiple myeloma. Leukemia 1998; 12: 601–609.
81 Tumkaya T, van der Burg M, Garcia Sanz R, Gonzalez Diaz M,Langerak AW, San Miguel JF et al. Immunoglobulin lambdaisotype gene rearrangements in B-cell malignancies. Leukemia2001; 15: 121–127.
82 Farner NL, Dorner T, Lipsky PE. Molecular mechanisms andselection influence the generation of the human V lambda Jlambda repertoire. J Immunol 1999; 162: 2137–2145.
83 Ignatovich O, Tomlinson IM, Popov AV, Bruggemann M, WinterG. Dominance of intrinsic genetic factors in shaping the humanimmunoglobulin Vlambda repertoire. J Mol Biol 1999; 294: 457–465.
84 Arden B, Clark SP, Kabelitz D, Mak TW. Human T-cell receptorvariable gene segment families. Immunogenetics 1995; 42: 455–500.
85 Wei S, Charmley P, Robinson MA, Concannon P. The extent ofthe human germline T-cell receptor V beta gene segmentrepertoire. Immunogenetics 1994; 40: 27–36.
86 Rowen L, Koop BF, Hood L. The complete 685-kilobase DNAsequence of the human beta T cell receptor locus. Science 1996;272: 1755–1762.
PCR-based clonality studies in lymphoproliferationsJJM van Dongen et al
2313
Leukemia
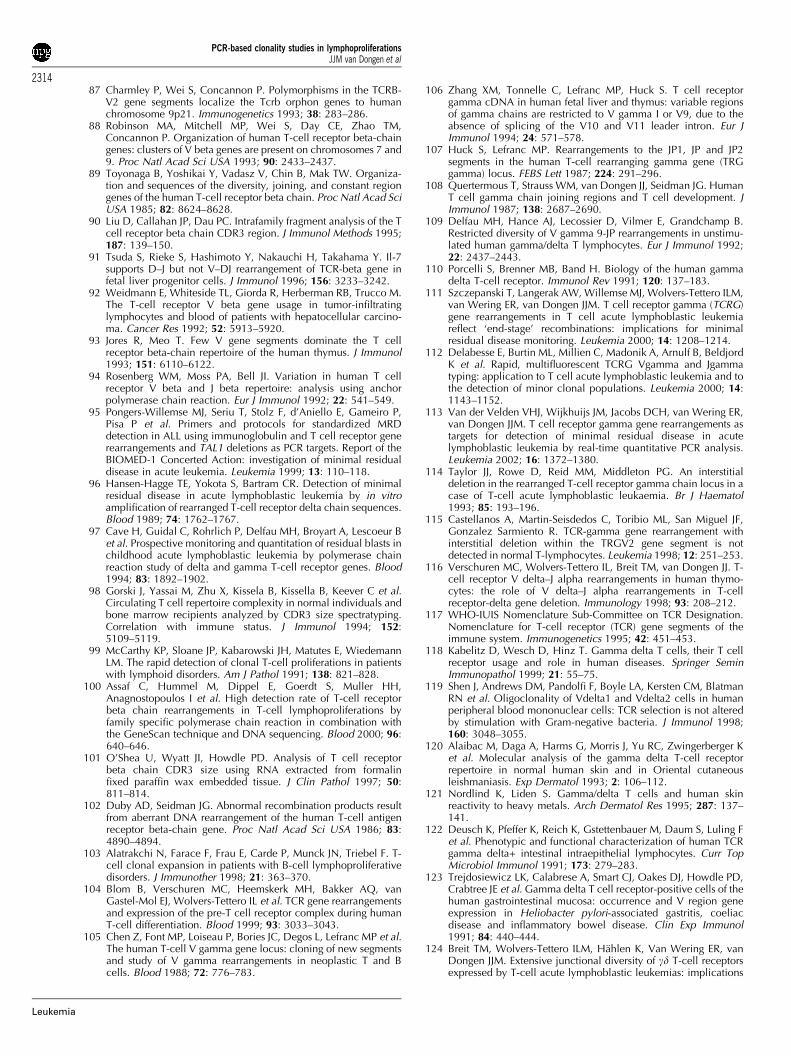
87 Charmley P, Wei S, Concannon P. Polymorphisms in the TCRB-V2 gene segments localize the Tcrb orphon genes to humanchromosome 9p21. Immunogenetics 1993; 38: 283–286.
88 Robinson MA, Mitchell MP, Wei S, Day CE, Zhao TM,Concannon P. Organization of human T-cell receptor beta-chaingenes: clusters of V beta genes are present on chromosomes 7 and9. Proc Natl Acad Sci USA 1993; 90: 2433–2437.
89 Toyonaga B, Yoshikai Y, Vadasz V, Chin B, Mak TW. Organiza-tion and sequences of the diversity, joining, and constant regiongenes of the human T-cell receptor beta chain. Proc Natl Acad SciUSA 1985; 82: 8624–8628.
90 Liu D, Callahan JP, Dau PC. Intrafamily fragment analysis of the Tcell receptor beta chain CDR3 region. J Immunol Methods 1995;187: 139–150.
91 Tsuda S, Rieke S, Hashimoto Y, Nakauchi H, Takahama Y. Il-7supports D–J but not V–DJ rearrangement of TCR-beta gene infetal liver progenitor cells. J Immunol 1996; 156: 3233–3242.
92 Weidmann E, Whiteside TL, Giorda R, Herberman RB, Trucco M.The T-cell receptor V beta gene usage in tumor-infiltratinglymphocytes and blood of patients with hepatocellular carcino-ma. Cancer Res 1992; 52: 5913–5920.
93 Jores R, Meo T. Few V gene segments dominate the T cellreceptor beta-chain repertoire of the human thymus. J Immunol1993; 151: 6110–6122.
94 Rosenberg WM, Moss PA, Bell JI. Variation in human T cellreceptor V beta and J beta repertoire: analysis using anchorpolymerase chain reaction. Eur J Immunol 1992; 22: 541–549.
95 Pongers-Willemse MJ, Seriu T, Stolz F, d’Aniello E, Gameiro P,Pisa P et al. Primers and protocols for standardized MRDdetection in ALL using immunoglobulin and T cell receptor generearrangements and TAL1 deletions as PCR targets. Report of theBIOMED-1 Concerted Action: investigation of minimal residualdisease in acute leukemia. Leukemia 1999; 13: 110–118.
96 Hansen-Hagge TE, Yokota S, Bartram CR. Detection of minimalresidual disease in acute lymphoblastic leukemia by in vitroamplification of rearranged T-cell receptor delta chain sequences.Blood 1989; 74: 1762–1767.
97 Cave H, Guidal C, Rohrlich P, Delfau MH, Broyart A, Lescoeur Bet al. Prospective monitoring and quantitation of residual blasts inchildhood acute lymphoblastic leukemia by polymerase chainreaction study of delta and gamma T-cell receptor genes. Blood1994; 83: 1892–1902.
98 Gorski J, Yassai M, Zhu X, Kissela B, Kissella B, Keever C et al.Circulating T cell repertoire complexity in normal individuals andbone marrow recipients analyzed by CDR3 size spectratyping.Correlation with immune status. J Immunol 1994; 152:5109–5119.
99 McCarthy KP, Sloane JP, Kabarowski JH, Matutes E, WiedemannLM. The rapid detection of clonal T-cell proliferations in patientswith lymphoid disorders. Am J Pathol 1991; 138: 821–828.
100 Assaf C, Hummel M, Dippel E, Goerdt S, Muller HH,Anagnostopoulos I et al. High detection rate of T-cell receptorbeta chain rearrangements in T-cell lymphoproliferations byfamily specific polymerase chain reaction in combination withthe GeneScan technique and DNA sequencing. Blood 2000; 96:640–646.
101 O’Shea U, Wyatt JI, Howdle PD. Analysis of T cell receptorbeta chain CDR3 size using RNA extracted from formalinfixed paraffin wax embedded tissue. J Clin Pathol 1997; 50:811–814.
102 Duby AD, Seidman JG. Abnormal recombination products resultfrom aberrant DNA rearrangement of the human T-cell antigenreceptor beta-chain gene. Proc Natl Acad Sci USA 1986; 83:4890–4894.
103 Alatrakchi N, Farace F, Frau E, Carde P, Munck JN, Triebel F. T-cell clonal expansion in patients with B-cell lymphoproliferativedisorders. J Immunother 1998; 21: 363–370.
104 Blom B, Verschuren MC, Heemskerk MH, Bakker AQ, vanGastel-Mol EJ, Wolvers-Tettero IL et al. TCR gene rearrangementsand expression of the pre-T cell receptor complex during humanT-cell differentiation. Blood 1999; 93: 3033–3043.
105 Chen Z, Font MP, Loiseau P, Bories JC, Degos L, Lefranc MP et al.The human T-cell V gamma gene locus: cloning of new segmentsand study of V gamma rearrangements in neoplastic T and Bcells. Blood 1988; 72: 776–783.
106 Zhang XM, Tonnelle C, Lefranc MP, Huck S. T cell receptorgamma cDNA in human fetal liver and thymus: variable regionsof gamma chains are restricted to V gamma I or V9, due to theabsence of splicing of the V10 and V11 leader intron. Eur JImmunol 1994; 24: 571–578.
107 Huck S, Lefranc MP. Rearrangements to the JP1, JP and JP2segments in the human T-cell rearranging gamma gene (TRGgamma) locus. FEBS Lett 1987; 224: 291–296.
108 Quertermous T, Strauss WM, van Dongen JJ, Seidman JG. HumanT cell gamma chain joining regions and T cell development. JImmunol 1987; 138: 2687–2690.
109 Delfau MH, Hance AJ, Lecossier D, Vilmer E, Grandchamp B.Restricted diversity of V gamma 9-JP rearrangements in unstimu-lated human gamma/delta T lymphocytes. Eur J Immunol 1992;22: 2437–2443.
110 Porcelli S, Brenner MB, Band H. Biology of the human gammadelta T-cell receptor. Immunol Rev 1991; 120: 137–183.
111 Szczepanski T, Langerak AW, Willemse MJ, Wolvers-Tettero ILM,van Wering ER, van Dongen JJM. T cell receptor gamma (TCRG)gene rearrangements in T cell acute lymphoblastic leukemiareflect ‘end-stage’ recombinations: implications for minimalresidual disease monitoring. Leukemia 2000; 14: 1208–1214.
112 Delabesse E, Burtin ML, Millien C, Madonik A, Arnulf B, BeldjordK et al. Rapid, multifluorescent TCRG Vgamma and Jgammatyping: application to T cell acute lymphoblastic leukemia and tothe detection of minor clonal populations. Leukemia 2000; 14:1143–1152.
113 Van der Velden VHJ, Wijkhuijs JM, Jacobs DCH, van Wering ER,van Dongen JJM. T cell receptor gamma gene rearrangements astargets for detection of minimal residual disease in acutelymphoblastic leukemia by real-time quantitative PCR analysis.Leukemia 2002; 16: 1372–1380.
114 Taylor JJ, Rowe D, Reid MM, Middleton PG. An interstitialdeletion in the rearranged T-cell receptor gamma chain locus in acase of T-cell acute lymphoblastic leukaemia. Br J Haematol1993; 85: 193–196.
115 Castellanos A, Martin-Seisdedos C, Toribio ML, San Miguel JF,Gonzalez Sarmiento R. TCR-gamma gene rearrangement withinterstitial deletion within the TRGV2 gene segment is notdetected in normal T-lymphocytes. Leukemia 1998; 12: 251–253.
116 Verschuren MC, Wolvers-Tettero IL, Breit TM, van Dongen JJ. T-cell receptor V delta–J alpha rearrangements in human thymo-cytes: the role of V delta–J alpha rearrangements in T-cellreceptor-delta gene deletion. Immunology 1998; 93: 208–212.
117 WHO-IUIS Nomenclature Sub-Committee on TCR Designation.Nomenclature for T-cell receptor (TCR) gene segments of theimmune system. Immunogenetics 1995; 42: 451–453.
118 Kabelitz D, Wesch D, Hinz T. Gamma delta T cells, their T cellreceptor usage and role in human diseases. Springer SeminImmunopathol 1999; 21: 55–75.
119 Shen J, Andrews DM, Pandolfi F, Boyle LA, Kersten CM, BlatmanRN et al. Oligoclonality of Vdelta1 and Vdelta2 cells in humanperipheral blood mononuclear cells: TCR selection is not alteredby stimulation with Gram-negative bacteria. J Immunol 1998;160: 3048–3055.
120 Alaibac M, Daga A, Harms G, Morris J, Yu RC, Zwingerberger Ket al. Molecular analysis of the gamma delta T-cell receptorrepertoire in normal human skin and in Oriental cutaneousleishmaniasis. Exp Dermatol 1993; 2: 106–112.
121 Nordlind K, Liden S. Gamma/delta T cells and human skinreactivity to heavy metals. Arch Dermatol Res 1995; 287: 137–141.
122 Deusch K, Pfeffer K, Reich K, Gstettenbauer M, Daum S, Luling Fet al. Phenotypic and functional characterization of human TCRgamma delta+ intestinal intraepithelial lymphocytes. Curr TopMicrobiol Immunol 1991; 173: 279–283.
123 Trejdosiewicz LK, Calabrese A, Smart CJ, Oakes DJ, Howdle PD,Crabtree JE et al. Gamma delta T cell receptor-positive cells of thehuman gastrointestinal mucosa: occurrence and V region geneexpression in Heliobacter pylori-associated gastritis, coeliacdisease and inflammatory bowel disease. Clin Exp Immunol1991; 84: 440–444.
124 Breit TM, Wolvers-Tettero ILM, Hahlen K, Van Wering ER, vanDongen JJM. Extensive junctional diversity of gd T-cell receptorsexpressed by T-cell acute lymphoblastic leukemias: implications
PCR-based clonality studies in lymphoproliferationsJJM van Dongen et al
2314
Leukemia

for the detection of minimal residual disease. Leukemia 1991; 5:1076–1086.
125 Langlands K, Eden OB, Micallef-Eynaud P, Parker AC, AnthonyRS. Direct sequence analysis of TCR V delta 2–D delta 3rearrangements in common acute lymphoblastic leukaemia andapplication to detection of minimal residual disease. Br JHaematol 1993; 84: 648–655.
126 Schneider M, Panzer S, Stolz F, Fischer S, Gadner H, Panzer-Grumayer ER. Crosslineage TCR delta rearrangements occurshortly after the DJ joinings of the IgH genes in childhoodprecursor B ALL and display age-specific characteristics. Br JHaematol 1997; 99: 115–121.
127 Hettinger K, Fischer S, Panzer S, Panzer-Grumayer ER. MultiplexPCR for TCR delta rearrangements: a rapid and specificapproach for the detection and identification of immatureand mature rearrangements in ALL. Br J Haematol 1998; 102:1050–1054.
128 Theodorou I, Raphael M, Bigorgne C, Fourcade C, Lahet C,Cochet G et al. Recombination pattern of the TCR gamma locusin human peripheral T-cell lymphomas. J Pathol 1994; 174: 233–242.
129 Kanavaros P, Farcet JP, Gaulard P, Haioun C, Divine M, LeCouedic JP et al. Recombinative events of the T cell antigenreceptor delta gene in peripheral T cell lymphomas. J Clin Invest1991; 87: 666–672.
130 Przybylski GK, Wu H, Macon WR, Finan J, Leonard DG, FelgarRE et al. Hepatosplenic and subcutaneous panniculitis-likegamma/delta T cell lymphomas are derived from different Vdeltasubsets of gamma/delta T lymphocytes. J Mol Diagn 2000; 2:11–19.
131 Kadin ME. Cutaneous gamma delta T-cell lymphomas – how andwhy should they be recognized? Arch Dermatol 2000; 136:1052–1054.
132 Hodges E, Quin C, Farrell AM, Christmas S, Sewell HF, DohertyM et al. Arthropathy, leucopenia and recurrent infectionassociated with a TcR gamma delta population. Br J Rheumatol1995; 34: 978–983.
133 Van Oostveen JW, Breit TM, de Wolf JT, Brandt RM, Smit JW, vanDongen JJM et al. Polyclonal expansion of T-cell receptor–gd+ Tlymphocytes associated with neutropenia and thrombocytopenia.Leukemia 1992; 6: 410–418.
134 Borst J, Wicherink A, van Dongen JJ, De Vries E, Comans-BitterWM, Wassenaar F et al. Non-random expression of T cellreceptor gamma and delta variable gene segments in functional Tlymphocyte clones from human peripheral blood. Eur J Immunol1989; 19: 1559–1568.
135 Krejci O, Prouzova Z, Horvath O, Trka J, Hrusak O. TCR deltagene is frequently rearranged in adult B lymphocytes. J Immunol2003; 171: 524–527.
136 Triebel F, Faure F, Mami-Chouaib F, Jitsukawa S, Griscelli A,Genevee C et al. A novel human V delta gene expressedpredominantly in the Ti gamma A fraction of gamma/delta+peripheral lymphocytes. Eur J Immunol 1988; 18: 2021–2027.
137 De Boer CJ, van Krieken JH, Schuuring E, Kluin PM. Bcl-1/cyclinD1 in malignant lymphoma. Ann Oncol 1997; 8: 109–117.
138 Tsujimoto Y, Yunis J, Onorato-Showe L, Erikson J, Nowell PC,Croce CM. Molecular cloning of the chromosomal breakpoint ofB-cell lymphomas and leukemias with the t(11;14) chromosometranslocation. Science 1984; 224: 1403–1406.
139 Vaandrager JW, Kleiverda JK, Schuuring E, Kluin-Nelemans JC,Raap AK, Kluin PM. Cytogenetics on released DNA fibers. VerhDtsch Ges Pathol 1997; 81: 306–311.
140 Vaandrager JW, Schuuring E, Zwikstra E, de Boer CJ, KleiverdaKK, van Krieken JH et al. Direct visualization of dispersed 11q13chromosomal translocations in mantle cell lymphoma by multi-color DNA fiber fluorescence in situ hybridization. Blood 1996;88: 1177–1182.
141 Pott C, Tiemann M, Linke B, Ott MM, von Hofen M, Bolz I et al.Structure of Bcl-1 and IgH-CDR3 rearrangements as clonalmarkers in mantle cell lymphomas. Leukemia 1998; 12: 1630–1637.
142 Luthra R, Hai S, Pugh WC. Polymerase chain reaction detectionof the t(11;14) translocation involving the bcl-1 major transloca-tion cluster in mantle cell lymphoma. Diagn Mol Pathol 1995; 4:4–7.
143 de Boer CJ, Schuuring E, Dreef E, Peters G, Bartek J, Kluin PMet al. Cyclin D1 protein analysis in the diagnosis of mantle celllymphoma. Blood 1995; 86: 2715–2723.
144 Haralambieva E, Kleiverda K, Mason DY, Schuuring E, Kluin PM.Detection of three common translocation breakpoints in non-Hodgkin’s lymphomas by fluorescence in situ hybridization onroutine paraffin-embedded tissue sections. J Pathol 2002; 198:163–170.
145 Williams ME, Swerdlow SH, Meeker TC. Chromosomet(11;14)(q13;q32) breakpoints in centrocytic lymphoma arehighly localized at the bcl-1 major translocation cluster.Leukemia 1993; 7: 1437–1440.
146 Segal GH, Masih AS, Fox AC, Jorgensen T, Scott M, Braylan RC.CD5-expressing B-cell non-Hodgkin’s lymphomas with bcl-1gene rearrangement have a relatively homogeneous immuno-phenotype and are associated with an overall poor prognosis.Blood 1995; 85: 1570–1579.
147 Janssen JW, Vaandrager JW, Heuser T, Jauch A, Kluin PM, GeelenE et al. Concurrent activation of a novel putative transforminggene, myeov, and cyclin D1 in a subset of multiple myeloma celllines with t(11;14)(q13;q32). Blood 2000; 95: 2691–2698.
148 Troussard X, Mauvieux L, Radford-Weiss I, Rack K, Valensi F,Garand R et al. Genetic analysis of splenic lymphoma withvillous lymphocytes: a Groupe Francais d’Hematologie Cellulaire(GFHC) study. Br J Haematol 1998; 101: 712–721.
149 Limpens J, Stad R, Vos C, de Vlaam C, de Jong D, van Ommen GJet al. Lymphoma-associated translocation t(14;18) in blood Bcells of normal individuals. Blood 1995; 85: 2528–2536.
150 Rabbitts P, Douglas J, Fischer P, Nacheva E, Karpas A, CatovskyD et al. Chromosome abnormalities at 11q13 in B cell tumours.Oncogene 1988; 3: 99–103.
151 Fukuhara S, Rowley JD, Variakojis D, Golomb HM. Chromosomeabnormalities in poorly differentiated lymphocytic lymphoma.Cancer Res 1979; 39: 3119–3128.
152 Weiss LM, Warnke RA, Sklar J, Cleary ML. Molecular analysis ofthe t(14;18) chromosomal translocation in malignant lymphomas.N Engl J Med 1987; 317: 1185–1189.
153 Bakhshi A, Jensen JP, Goldman P, Wright JJ, McBride OW,Epstein AL et al. Cloning the chromosomal breakpoint of t(14;18)human lymphomas: clustering around JH on chromosome 14 andnear a transcriptional unit on 18. Cell 1985; 41: 899–906.
154 Cleary ML, Sklar J. Nucleotide sequence of a t(14;18) chromo-somal breakpoint in follicular lymphoma and demonstration of abreakpoint-cluster region near a transcriptionally active locus onchromosome 18. Proc Natl Acad Sci USA 1985; 82: 7439–7443.
155 Korsmeyer SJ. BCL-2 gene family and the regulation ofprogrammed cell death. Cancer Res 1999; 59: 1693s–1700s.
156 Lithgow T, van Driel R, Bertram JF, Strasser A. The proteinproduct of the oncogene bcl-2 is a component of the nuclearenvelope, the endoplasmic reticulum, and the outer mitochon-drial membrane. Cell Growth Differ 1994; 5: 411–417.
157 Woodland RT, Schmidt MR, Korsmeyer SJ, Gravel KA. Regulationof B cell survival in xid mice by the proto-oncogene bcl-2. JImmunol 1996; 156: 2143–2154.
158 Hsu SY, Lai RJ, Finegold M, Hsueh AJ. Targeted overexpression ofBcl-2 in ovaries of transgenic mice leads to decreased follicleapoptosis, enhanced folliculogenesis, and increased germ celltumorigenesis. Endocrinology 1996; 137: 4837–4843.
159 Lee MS, Chang KS, Cabanillas F, Freireich EJ, Trujillo JM, StassSA. Detection of minimal residual cells carrying the t(14;18) byDNA sequence amplification. Science 1987; 237: 175–178.
160 Crescenzi M, Seto M, Herzig GP, Weiss PD, Griffith RC,Korsmeyer SJ. Thermostable DNA polymerase chain amplifica-tion of t(14;18) chromosome breakpoints and detection ofminimal residual disease. Proc Natl Acad Sci USA 1988; 85:4869–4873.
161 Lee MS. Molecular aspects of chromosomal translocationt(14;18). Semin Hematol 1993; 30: 297–305.
162 Buchonnet G, Lenain P, Ruminy P, Lepretre S, Stamatoullas A,Parmentier F et al. Characterisation of BCL2-JH rearrangements infollicular lymphoma: PCR detection of 30 BCL2 breakpoints andevidence of a new cluster. Leukemia 2000; 14: 1563–1569.
163 Cleary ML, Galili N, Sklar J. Detection of a second t(14;18)breakpoint cluster region in human follicular lymphomas. J ExpMed 1986; 164: 315–320.
PCR-based clonality studies in lymphoproliferationsJJM van Dongen et al
2315
Leukemia
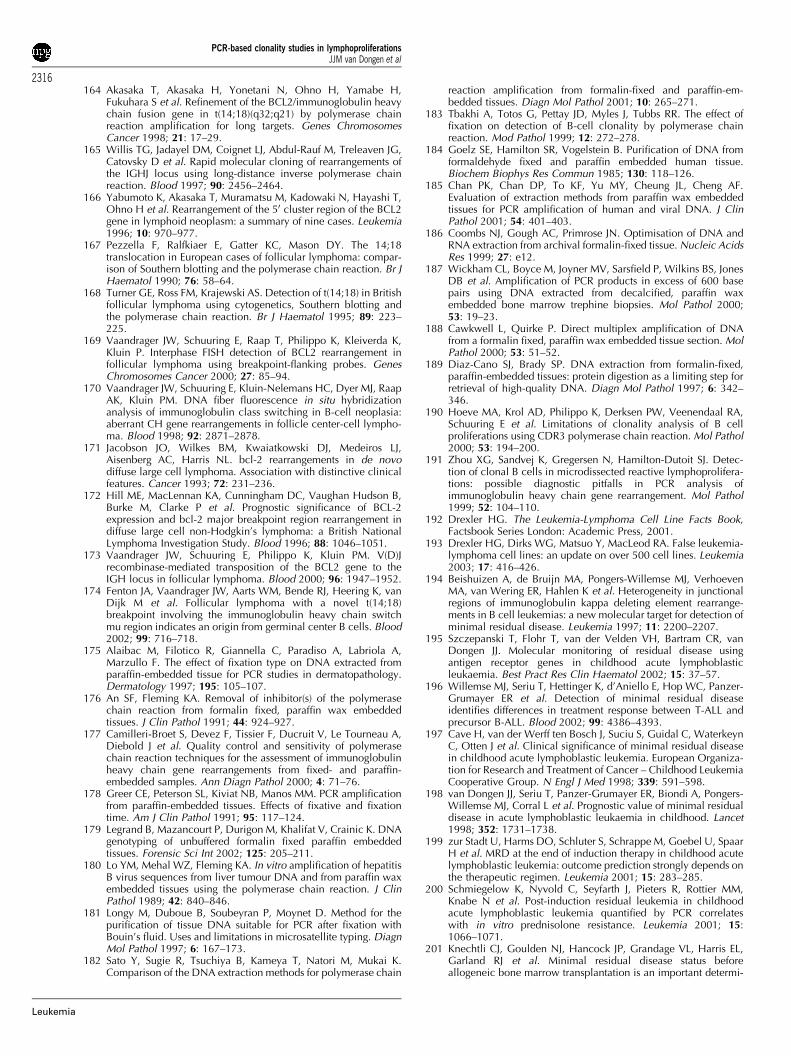
164 Akasaka T, Akasaka H, Yonetani N, Ohno H, Yamabe H,Fukuhara S et al. Refinement of the BCL2/immunoglobulin heavychain fusion gene in t(14;18)(q32;q21) by polymerase chainreaction amplification for long targets. Genes ChromosomesCancer 1998; 21: 17–29.
165 Willis TG, Jadayel DM, Coignet LJ, Abdul-Rauf M, Treleaven JG,Catovsky D et al. Rapid molecular cloning of rearrangements ofthe IGHJ locus using long-distance inverse polymerase chainreaction. Blood 1997; 90: 2456–2464.
166 Yabumoto K, Akasaka T, Muramatsu M, Kadowaki N, Hayashi T,Ohno H et al. Rearrangement of the 50 cluster region of the BCL2gene in lymphoid neoplasm: a summary of nine cases. Leukemia1996; 10: 970–977.
167 Pezzella F, Ralfkiaer E, Gatter KC, Mason DY. The 14;18translocation in European cases of follicular lymphoma: compar-ison of Southern blotting and the polymerase chain reaction. Br JHaematol 1990; 76: 58–64.
168 Turner GE, Ross FM, Krajewski AS. Detection of t(14;18) in Britishfollicular lymphoma using cytogenetics, Southern blotting andthe polymerase chain reaction. Br J Haematol 1995; 89: 223–225.
169 Vaandrager JW, Schuuring E, Raap T, Philippo K, Kleiverda K,Kluin P. Interphase FISH detection of BCL2 rearrangement infollicular lymphoma using breakpoint-flanking probes. GenesChromosomes Cancer 2000; 27: 85–94.
170 Vaandrager JW, Schuuring E, Kluin-Nelemans HC, Dyer MJ, RaapAK, Kluin PM. DNA fiber fluorescence in situ hybridizationanalysis of immunoglobulin class switching in B-cell neoplasia:aberrant CH gene rearrangements in follicle center-cell lympho-ma. Blood 1998; 92: 2871–2878.
171 Jacobson JO, Wilkes BM, Kwaiatkowski DJ, Medeiros LJ,Aisenberg AC, Harris NL. bcl-2 rearrangements in de novodiffuse large cell lymphoma. Association with distinctive clinicalfeatures. Cancer 1993; 72: 231–236.
172 Hill ME, MacLennan KA, Cunningham DC, Vaughan Hudson B,Burke M, Clarke P et al. Prognostic significance of BCL-2expression and bcl-2 major breakpoint region rearrangement indiffuse large cell non-Hodgkin’s lymphoma: a British NationalLymphoma Investigation Study. Blood 1996; 88: 1046–1051.
173 Vaandrager JW, Schuuring E, Philippo K, Kluin PM. V(D)Jrecombinase-mediated transposition of the BCL2 gene to theIGH locus in follicular lymphoma. Blood 2000; 96: 1947–1952.
174 Fenton JA, Vaandrager JW, Aarts WM, Bende RJ, Heering K, vanDijk M et al. Follicular lymphoma with a novel t(14;18)breakpoint involving the immunoglobulin heavy chain switchmu region indicates an origin from germinal center B cells. Blood2002; 99: 716–718.
175 Alaibac M, Filotico R, Giannella C, Paradiso A, Labriola A,Marzullo F. The effect of fixation type on DNA extracted fromparaffin-embedded tissue for PCR studies in dermatopathology.Dermatology 1997; 195: 105–107.
176 An SF, Fleming KA. Removal of inhibitor(s) of the polymerasechain reaction from formalin fixed, paraffin wax embeddedtissues. J Clin Pathol 1991; 44: 924–927.
177 Camilleri-Broet S, Devez F, Tissier F, Ducruit V, Le Tourneau A,Diebold J et al. Quality control and sensitivity of polymerasechain reaction techniques for the assessment of immunoglobulinheavy chain gene rearrangements from fixed- and paraffin-embedded samples. Ann Diagn Pathol 2000; 4: 71–76.
178 Greer CE, Peterson SL, Kiviat NB, Manos MM. PCR amplificationfrom paraffin-embedded tissues. Effects of fixative and fixationtime. Am J Clin Pathol 1991; 95: 117–124.
179 Legrand B, Mazancourt P, Durigon M, Khalifat V, Crainic K. DNAgenotyping of unbuffered formalin fixed paraffin embeddedtissues. Forensic Sci Int 2002; 125: 205–211.
180 Lo YM, Mehal WZ, Fleming KA. In vitro amplification of hepatitisB virus sequences from liver tumour DNA and from paraffin waxembedded tissues using the polymerase chain reaction. J ClinPathol 1989; 42: 840–846.
181 Longy M, Duboue B, Soubeyran P, Moynet D. Method for thepurification of tissue DNA suitable for PCR after fixation withBouin’s fluid. Uses and limitations in microsatellite typing. DiagnMol Pathol 1997; 6: 167–173.
182 Sato Y, Sugie R, Tsuchiya B, Kameya T, Natori M, Mukai K.Comparison of the DNA extraction methods for polymerase chain
reaction amplification from formalin-fixed and paraffin-em-bedded tissues. Diagn Mol Pathol 2001; 10: 265–271.
183 Tbakhi A, Totos G, Pettay JD, Myles J, Tubbs RR. The effect offixation on detection of B-cell clonality by polymerase chainreaction. Mod Pathol 1999; 12: 272–278.
184 Goelz SE, Hamilton SR, Vogelstein B. Purification of DNA fromformaldehyde fixed and paraffin embedded human tissue.Biochem Biophys Res Commun 1985; 130: 118–126.
185 Chan PK, Chan DP, To KF, Yu MY, Cheung JL, Cheng AF.Evaluation of extraction methods from paraffin wax embeddedtissues for PCR amplification of human and viral DNA. J ClinPathol 2001; 54: 401–403.
186 Coombs NJ, Gough AC, Primrose JN. Optimisation of DNA andRNA extraction from archival formalin-fixed tissue. Nucleic AcidsRes 1999; 27: e12.
187 Wickham CL, Boyce M, Joyner MV, Sarsfield P, Wilkins BS, JonesDB et al. Amplification of PCR products in excess of 600 basepairs using DNA extracted from decalcified, paraffin waxembedded bone marrow trephine biopsies. Mol Pathol 2000;53: 19–23.
188 Cawkwell L, Quirke P. Direct multiplex amplification of DNAfrom a formalin fixed, paraffin wax embedded tissue section. MolPathol 2000; 53: 51–52.
189 Diaz-Cano SJ, Brady SP. DNA extraction from formalin-fixed,paraffin-embedded tissues: protein digestion as a limiting step forretrieval of high-quality DNA. Diagn Mol Pathol 1997; 6: 342–346.
190 Hoeve MA, Krol AD, Philippo K, Derksen PW, Veenendaal RA,Schuuring E et al. Limitations of clonality analysis of B cellproliferations using CDR3 polymerase chain reaction. Mol Pathol2000; 53: 194–200.
191 Zhou XG, Sandvej K, Gregersen N, Hamilton-Dutoit SJ. Detec-tion of clonal B cells in microdissected reactive lymphoprolifera-tions: possible diagnostic pitfalls in PCR analysis ofimmunoglobulin heavy chain gene rearrangement. Mol Pathol1999; 52: 104–110.
192 Drexler HG. The Leukemia-Lymphoma Cell Line Facts Book,Factsbook Series London: Academic Press, 2001.
193 Drexler HG, Dirks WG, Matsuo Y, MacLeod RA. False leukemia-lymphoma cell lines: an update on over 500 cell lines. Leukemia2003; 17: 416–426.
194 Beishuizen A, de Bruijn MA, Pongers-Willemse MJ, VerhoevenMA, van Wering ER, Hahlen K et al. Heterogeneity in junctionalregions of immunoglobulin kappa deleting element rearrange-ments in B cell leukemias: a new molecular target for detection ofminimal residual disease. Leukemia 1997; 11: 2200–2207.
195 Szczepanski T, Flohr T, van der Velden VH, Bartram CR, vanDongen JJ. Molecular monitoring of residual disease usingantigen receptor genes in childhood acute lymphoblasticleukaemia. Best Pract Res Clin Haematol 2002; 15: 37–57.
196 Willemse MJ, Seriu T, Hettinger K, d’Aniello E, Hop WC, Panzer-Grumayer ER et al. Detection of minimal residual diseaseidentifies differences in treatment response between T-ALL andprecursor B-ALL. Blood 2002; 99: 4386–4393.
197 Cave H, van der Werff ten Bosch J, Suciu S, Guidal C, WaterkeynC, Otten J et al. Clinical significance of minimal residual diseasein childhood acute lymphoblastic leukemia. European Organiza-tion for Research and Treatment of Cancer – Childhood LeukemiaCooperative Group. N Engl J Med 1998; 339: 591–598.
198 van Dongen JJ, Seriu T, Panzer-Grumayer ER, Biondi A, Pongers-Willemse MJ, Corral L et al. Prognostic value of minimal residualdisease in acute lymphoblastic leukaemia in childhood. Lancet1998; 352: 1731–1738.
199 zur Stadt U, Harms DO, Schluter S, Schrappe M, Goebel U, SpaarH et al. MRD at the end of induction therapy in childhood acutelymphoblastic leukemia: outcome prediction strongly depends onthe therapeutic regimen. Leukemia 2001; 15: 283–285.
200 Schmiegelow K, Nyvold C, Seyfarth J, Pieters R, Rottier MM,Knabe N et al. Post-induction residual leukemia in childhoodacute lymphoblastic leukemia quantified by PCR correlateswith in vitro prednisolone resistance. Leukemia 2001; 15:1066–1071.
201 Knechtli CJ, Goulden NJ, Hancock JP, Grandage VL, Harris EL,Garland RJ et al. Minimal residual disease status beforeallogeneic bone marrow transplantation is an important determi-
PCR-based clonality studies in lymphoproliferationsJJM van Dongen et al
2316
Leukemia
nant of successful outcome for children and adolescentswith acute lymphoblastic leukemia. Blood 1998; 92: 4072–4079.
202 van der Velden VH, Joosten SA, Willemse MJ, van Wering ER,Lankester AW, van Dongen JJ et al. Real-time quantitative PCR fordetection of minimal residual disease before allogeneic stem celltransplantation predicts outcome in children with acute lympho-blastic leukemia. Leukemia 2001; 15: 1485–1487.
203 Bader P, Hancock J, Kreyenberg H, Goulden NJ, Niethammer D,Oakhill A et al. Minimal residual disease (MRD) status prior toallogeneic stem cell transplantation is a powerful predictor forpost-transplant outcome in children with ALL. Leukemia 2002;16: 1668–1672.
204 Guidal C, Vilmer E, Grandchamp B, Cave H. A competitive PCR-based method using TCRD, TCRG and IGH rearrangements forrapid detection of patients with high levels of minimal residual
disease in acute lymphoblastic leukemia. Leukemia 2002; 16:762–764.
205 Wagner SD, Luzzatto L. V kappa gene segments rearranged inchronic lymphocytic leukemia are distributed over a large portionof the V kappa locus and do not show somatic mutation. Eur JImmunol 1993; 23: 391–397.
206 Wagner SD, Martinelli V, Luzzatto L. Similar patterns of V kappagene usage but different degrees of somatic mutation in hairy cellleukemia, prolymphocytic leukemia, Waldenstrom’s macroglo-bulinemia, and myeloma. Blood 1994; 83: 3647–3653.
207 Solomon A. Light chains of immunoglobulins: structural–geneticcorrelates. Blood 1986; 68: 603–610.
208 Cuisinier AM, Fumoux F, Moinier D, Boubli L, Guigou V, Milili Met al. Rapid expansion of human immunoglobulin repertoire (VH,V kappa, V lambda) expressed in early fetal bone marrow. NewBiol 1990; 2: 689–699.
PCR-based clonality studies in lymphoproliferationsJJM van Dongen et al
2317
Leukemia