Design and Implementation of a High-Fidelity AC Metering ...prabal/pubs/papers/jiang09acme.pdf ·...
12
Design and Implementation of a High-Fidelity AC Metering Network Xiaofan Jiang, Stephen Dawson-Haggerty, Prabal Dutta, and David Culler Computer Science Division University of California, Berkeley {fxjiang, stevedh, prabal, culler}@cs.berkeley.edu ABSTRACT We present the architecture, design, and preliminary evaluation of ACme, a wireless sensor and actuator net- work for monitoring AC energy usage and controlling AC devices in a large and diverse building environment. The ACme system consists of three tiers: the ACme node which provides a metering and control interface to a single outlet, a network fabric which allows this inter- face to be exported to arbitrary IP endpoints, and ap- plication software that uses this networked interface to provide various power-centric applications. The ACme node integrates an Epic core module with a dedicated energy metering IC to provide real, reactive, and ap- parent power measurements, with optional control of an attached load. The network comprises a complete IPv6/6LoWPAN stack on every node and an edge router that connects to other IP networks. The application tier receives and stores readings in a database and uses a web server for visualization. Nodes automatically join the IPv6 subnet after being plugged in, and begin inter- actions with the application layer. We evaluate our sys- tem in a preliminary green building deployment with 49 nodes spread over several floors of a Computer Science Building and present energy consumption data from this preliminary deployment. Categories and Subject Descriptors B.0 [Hardware]: General; B.4 [Hardware]: Input/Output & Data Communication; J.4 [Computer Applications]: Social and Behavior Sciences Permission to make digital or hard copies of all or part of this work for personal or classroom use is granted without fee provided that copies are not made or distributed for profit or commercial advantage and that copies bear this notice and the full citation on the first page. To copy otherwise, to republish, to post on servers or to redistribute to lists, requires prior specific permission and/or a fee. IPSN’09, April 15–18, 2009, San Francisco, California, USA. Copyright 2009 ACM 978-1-60558-371-6/09/04 ...$5.00. General Terms Design, Experimentation, Performance, Measurement Keywords Architecture, AC, Meter, Green, Energy, Power, Plat- form, Wireless, Sensor Network, Mote, Measurement 1. INTRODUCTION Sensor network research has made great progress over the past decade in creating low-power wireless embed- ded devices, systems, and networking technology, and this technology has been applied to numerous studies of real-world environments. Many of these, including habitat and climate monitoring demand extremely low energy consumption, long lifetime on batteries, low sam- ple rates, and reliable ad-hoc networking in wide open spaces. In this paper we focus on a large scale wireless sensor network for a very different kind of application– high fidelity, building-wide, electricity monitoring. Electricity usage in residential and commercial build- ings represent a significant fraction of total energy ex- penditure and, since electricity is generated from fossil fuels, it represents a significant portion of the carbon footprint of the occupant. The typical Pacific Gas & Electric (PG&E) customer uses about 540kWh of elec- tricity per month, while the Computer Science Division building at the authors’ institution consumes approxi- mately 12MWh of electricity per day. This usage is di- vided between HVAC, lighting, plug-loads, and servers. Preliminary data show that the plug-load usage repre- sents approximately 20%, or 2.4MWh, of the total usage and that much of this is desktop systems. In addition, these loads generate heat that must be removed by the HVAC system. Desktop usage is also highly correlated with lighting loads. Our goal is to build an interac- tive, near real-time monitoring capability of numerous small loads, as well as the fewer large ones, so that oc- cupants can understand their electricity usage patterns and adapt their behavior to reduce their energy foot- print.
Transcript of Design and Implementation of a High-Fidelity AC Metering ...prabal/pubs/papers/jiang09acme.pdf ·...

Design and Implementation of a High-FidelityAC Metering Network
Xiaofan Jiang, Stephen Dawson-Haggerty, Prabal Dutta, and David CullerComputer Science Division
University of California, Berkeleyfxjiang, stevedh, prabal, [email protected]
ABSTRACTWe present the architecture, design, and preliminaryevaluation of ACme, a wireless sensor and actuator net-work for monitoring AC energy usage and controllingAC devices in a large and diverse building environment.The ACme system consists of three tiers: the ACmenode which provides a metering and control interface toa single outlet, a network fabric which allows this inter-face to be exported to arbitrary IP endpoints, and ap-plication software that uses this networked interface toprovide various power-centric applications. The ACmenode integrates an Epic core module with a dedicatedenergy metering IC to provide real, reactive, and ap-parent power measurements, with optional control ofan attached load. The network comprises a completeIPv6/6LoWPAN stack on every node and an edge routerthat connects to other IP networks. The applicationtier receives and stores readings in a database and usesa web server for visualization. Nodes automatically jointhe IPv6 subnet after being plugged in, and begin inter-actions with the application layer. We evaluate our sys-tem in a preliminary green building deployment with 49nodes spread over several floors of a Computer ScienceBuilding and present energy consumption data from thispreliminary deployment.
Categories and Subject DescriptorsB.0 [Hardware]: General; B.4 [Hardware]: Input/Output& Data Communication; J.4 [Computer Applications]:Social and Behavior Sciences
Permission to make digital or hard copies of all or part of this work forpersonal or classroom use is granted without fee provided that copies arenot made or distributed for profit or commercial advantage and that copiesbear this notice and the full citation on the first page. To copy otherwise, torepublish, to post on servers or to redistribute to lists, requires prior specificpermission and/or a fee.IPSN’09, April 15–18, 2009, San Francisco, California, USA.Copyright 2009 ACM 978-1-60558-371-6/09/04 ...$5.00.
General TermsDesign, Experimentation, Performance, Measurement
KeywordsArchitecture, AC, Meter, Green, Energy, Power, Plat-form, Wireless, Sensor Network, Mote, Measurement
1. INTRODUCTIONSensor network research has made great progress over
the past decade in creating low-power wireless embed-ded devices, systems, and networking technology, andthis technology has been applied to numerous studiesof real-world environments. Many of these, includinghabitat and climate monitoring demand extremely lowenergy consumption, long lifetime on batteries, low sam-ple rates, and reliable ad-hoc networking in wide openspaces. In this paper we focus on a large scale wirelesssensor network for a very different kind of application–high fidelity, building-wide, electricity monitoring.
Electricity usage in residential and commercial build-ings represent a significant fraction of total energy ex-penditure and, since electricity is generated from fossilfuels, it represents a significant portion of the carbonfootprint of the occupant. The typical Pacific Gas &Electric (PG&E) customer uses about 540kWh of elec-tricity per month, while the Computer Science Divisionbuilding at the authors’ institution consumes approxi-mately 12MWh of electricity per day. This usage is di-vided between HVAC, lighting, plug-loads, and servers.Preliminary data show that the plug-load usage repre-sents approximately 20%, or 2.4MWh, of the total usageand that much of this is desktop systems. In addition,these loads generate heat that must be removed by theHVAC system. Desktop usage is also highly correlatedwith lighting loads. Our goal is to build an interac-tive, near real-time monitoring capability of numeroussmall loads, as well as the fewer large ones, so that oc-cupants can understand their electricity usage patternsand adapt their behavior to reduce their energy foot-print.

The AC metering application drives a different set oftechnical challenges and pushes sensor network researchin some new directions. Although ultra low power op-eration on batteries is not required, since the embed-ded devices are mains-powered, they must consume lit-tle enough energy that they do not adversely affect thestandby monitoring load. Moreover, since they are mon-itoring the very flow of electricity that they utilize, sothe design of the AC-DC power supply and the powermetering is inter-related and rather subtle. The designof the embedded device must address a family of ther-mal, noise isolation, and safety concerns that few sensornetworks have examined. We use this challenge to ex-ercise the recently published Epic [15] design methodol-ogy of expert modules and application-specific “glue” tosupport the progression from prototype to pilot to pro-duction. While the network need not operate with a lowradio duty cycle, it needs to be robust even though thedevices are deployed in highly RF challenged settings –behind refrigerators, under metal desks, in metal cabi-nets, on the microwave, and so on.
Moreover, the collection of devices is not a distributedinstrument deployed by a single authority, i.e., a macro-scope; rather, it is a network deployed bottom up by in-dividuals for a variety of reasons in a variety of settings.The application and usage can be quite heterogeneous,although all the devices cooperate at the network layerto route traffic for one another. This application is onethe first deployments of a new, open source IPv6 net-work stack over 802.15.4 using 6LoWPAN. All of therouting on the motes is true IP routing and a collec-tion of modified Meraki Mini nodes route between the6LoWPAN subnet and the various other subnets. Thisenables a distribution, deployment, management, anddata analysis model that is essentially that of a dis-tributed collection of hosts: some clients, some servers,some both.
To evaluate our design, we apply the technology tothe problem of excessive energy usage in our ComputerScience Building. In this project, we made ACme nodesavailable to a relatively large number of students, fac-ulty, and staff, and encouraged them to monitor theirworkstations, laptops, and other electronics. Collec-tively the data collection occurs over our ad-hoc meshnetwork. We have also instrumented other devices withsignificant power draw in common areas, and made com-plete power traces from these devices publicly availablevia the database and web interface. Section 6 presentsnoteworthy results from this deployment.
2. SYSTEM ARCHITECTUREThe overall design of the ACme monitoring and con-
trol system is shown in Figure 1. The design decom-position is three tiers: the end nodes, the network, and
Figure 1: Three tier ACme system.
the server-hosted, application-specific code.The ACme node supports a set of sampling and con-
trol operations such as read_energy(), switch(state),and report(ip_addr, rate). The ACme network is awireless IPv6 network that uses a small dual-interfaceLinux device to route packets between the ACme nodesand other IP networks. The application tier is an energyapplication that interacts with the network of ACmenodes via its API.
In the following sections, we present the design andimplementation of each tier of the ACme system. Atthe node level, we discuss various tradeoffs present inthe hardware design, and present a narrow interface toaccess the hardware and we consider physical design is-sues such as form factor and thermal dissipation, whichmust be addressed for a deployment in an office settingto be practical. The result is the ACme meter: an inte-grated, small form-factor device with energy metering,control, and networking in one package.
A set of disconnected meters is much less interest-ing than real-time data. Traditional monitoring designsuse sneakernet and a small LCD, a serial port, or otherwired ports connecting instruments to data loggers. Akey motivation of our work is to allow the quick deploy-ment and instrumentation of a large numbers of AC plugmeters and enable continuous real-time access. Requir-ing connectivity over USB, serial, Ethernet, or otherwired channel would not be practical. Also, althoughmost places we wish to measure have substantial 802.11infrastructure installed, the reality is that it is not easyto add additional devices to these networks. Thus, oursolution is the development of an ad-hoc IEEE 802.15.4network layer that provides IP connectivity to ACmenodes without the use of either wiring or infrastructure.The network provides connectivity between the sensornodes and other networks using a dual-interface router.

Finally, application specific code can be placed on anynetwork connected to the ACme meter subnet. Appli-cations use the node API as exported over the network.Typically, a server daemon populates a database that isaccessed by a variety of web applications, but direct ac-cess to ACme including telnet and a UDP RPC is avail-able as well. We present a green building power profilingapplication which allows users to view their individualreal-time energy consumption using a web interface. Itconsists of a logger daemon which formats and insertsthe reported data into a database, and a presentationlayer which synthesizes reports from this logged data.A key architectural separation is that applications aredeveloped independently from the network used.
3. ACME NODEThe power measurement and control is performed by
a device consisting of five primary components: current-to-voltage conversion, energy metering, AC/DC powersupply, microcontroller with radio, and solid state ACrelay, as shown in Figure 2(a).
The current-to-voltage converter converts the currentused by the AC appliance to voltage, as described inSection 3.1. This signal is amplified and filtered be-fore multiplying with the AC voltage to obtain power.To obtain real, reactive, and apparent power measure-ments, a dedicated IC is usually used to perform the nec-essary analog-digital conversions and calculations. Theresult is output over a digital bus to the Epic micro-controller. ACme also takes advantage of the availableAC to power its own operation; this requires an AC/DCpower supply. To give ACme the ability to control theAC device, a solid state relay is used. Finally, a mi-crocontroller is used to communicate with the energymetering chip via SPI, and to the network via radio.
There are several design choices for each component,each with its own advantages and disadvantages. De-sign decisions for the different components of ACmeare not independent. For example, a particular choiceof current-to-voltage conversion requires a compatiblechoice of power supply and energy meter. We find thatthere are only a few internally consistent combinations,each appropriate for a distinct class of applications. Toexplore the available design space, we built two meters,shown in Figure 2(b) and 2(c). We compare the two de-signs and evaluate their effectiveness for our applicationin Section 3.4.
3.1 Current-to-Voltage ConversionThere are multiple ways to convert current to voltage.
The design choices we make in I-V conversion constrainour choice of power supply and energy meter. We eval-uate their differences and tradeoffs with respect to theircorresponding power supply and energy meter.
3.1.1 Shunt ResistorA shunt resistor is the most common choice for inex-
pensive AC meters used in 2-wire single phase systems.It is used in the ACme-A design as shown in Figure 2(b).A precision resistor in the range of mΩ is typically usedin series with the AC load. The small voltage dropacross the resistor is proportional to the current, and isfirst amplified, and then multiplied by the voltage, toproduce power measurements.
Shunt resistors are inexpensive and small in size, butthey have drawbacks. The voltage drop across the shuntmay effect the AC device if the load has a high powerdraw. Also, the resistive heating results in thermal de-sign concerns as well as measurement issues, since theresistance of the shunt is proportional to its tempera-ture.
The power supply typically must establish a virtualground at one end of the shunt resistor because mostenergy meter ICs are not fully differential. This impliesthat direct rectification should be used in the power sup-ply. The safety of this design is less than ideal becausea virtual ground is established at AC mains, couplingthe rest of the metering circuit to high voltage. Thismethod is also inefficient because it requires “dumping”energy to ground.
3.1.2 Current TransformerAnother common method of converting current to volt-
age is to use a current transformer. There are two com-mon versions of current transformers: a traditional in-line version, and non-contacting clamp-on version.
In-line current transformers are a popular choice formoderately priced AC meters used in 3-wire distribu-tion systems. The current transformer performs vectoraddition of Phase A and Phase B via two primary turnsof opposite polarity [1] and transfers the current to thesecondary via magnetic induction. The current on thesecondary is converted to voltage via a“burden”resistor.
Current transformers cleanly decouple the low volt-age DC circuit from the high voltage AC input, whichmake them safer than a shunt resistor. Using a currenttransformer in the I-V conversion stage allows us to usea step-down transformer followed by low-voltage rectifi-cation as the power supply, which is more efficient thandirect AC rectification. However, current transformersare more expensive than shunt resistors and also requirephase compensation. They are also generally large insize and weight; the smallest current transformer read-ily available is relatively large compared to the rest ofthe ACme board. For this reason, we decided againstusing current transformer as the I-V conversion elementin ACme.
The second form of current transformers are clamp-onmeters, in which case the entire sensor is the secondary
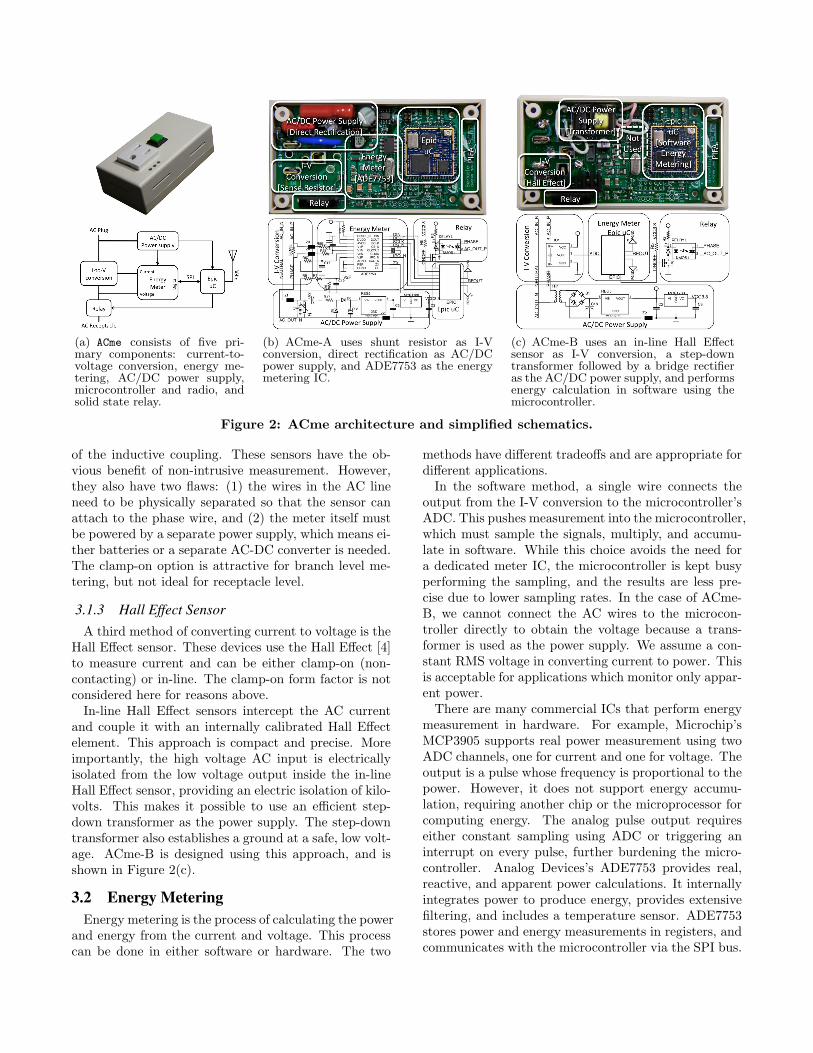
(a) ACme consists of five pri-mary components: current-to-voltage conversion, energy me-tering, AC/DC power supply,microcontroller and radio, andsolid state relay.
(b) ACme-A uses shunt resistor as I-Vconversion, direct rectification as AC/DCpower supply, and ADE7753 as the energymetering IC.
(c) ACme-B uses an in-line Hall Effectsensor as I-V conversion, a step-downtransformer followed by a bridge rectifieras the AC/DC power supply, and performsenergy calculation in software using themicrocontroller.
Figure 2: ACme architecture and simplified schematics.
of the inductive coupling. These sensors have the ob-vious benefit of non-intrusive measurement. However,they also have two flaws: (1) the wires in the AC lineneed to be physically separated so that the sensor canattach to the phase wire, and (2) the meter itself mustbe powered by a separate power supply, which means ei-ther batteries or a separate AC-DC converter is needed.The clamp-on option is attractive for branch level me-tering, but not ideal for receptacle level.
3.1.3 Hall Effect SensorA third method of converting current to voltage is the
Hall Effect sensor. These devices use the Hall Effect [4]to measure current and can be either clamp-on (non-contacting) or in-line. The clamp-on form factor is notconsidered here for reasons above.
In-line Hall Effect sensors intercept the AC currentand couple it with an internally calibrated Hall Effectelement. This approach is compact and precise. Moreimportantly, the high voltage AC input is electricallyisolated from the low voltage output inside the in-lineHall Effect sensor, providing an electric isolation of kilo-volts. This makes it possible to use an efficient step-down transformer as the power supply. The step-downtransformer also establishes a ground at a safe, low volt-age. ACme-B is designed using this approach, and isshown in Figure 2(c).
3.2 Energy MeteringEnergy metering is the process of calculating the power
and energy from the current and voltage. This processcan be done in either software or hardware. The two
methods have different tradeoffs and are appropriate fordifferent applications.
In the software method, a single wire connects theoutput from the I-V conversion to the microcontroller’sADC. This pushes measurement into the microcontroller,which must sample the signals, multiply, and accumu-late in software. While this choice avoids the need fora dedicated meter IC, the microcontroller is kept busyperforming the sampling, and the results are less pre-cise due to lower sampling rates. In the case of ACme-B, we cannot connect the AC wires to the microcon-troller directly to obtain the voltage because a trans-former is used as the power supply. We assume a con-stant RMS voltage in converting current to power. Thisis acceptable for applications which monitor only appar-ent power.
There are many commercial ICs that perform energymeasurement in hardware. For example, Microchip’sMCP3905 supports real power measurement using twoADC channels, one for current and one for voltage. Theoutput is a pulse whose frequency is proportional to thepower. However, it does not support energy accumu-lation, requiring another chip or the microprocessor forcomputing energy. The analog pulse output requireseither constant sampling using ADC or triggering aninterrupt on every pulse, further burdening the micro-controller. Analog Devices’s ADE7753 provides real,reactive, and apparent power calculations. It internallyintegrates power to produce energy, provides extensivefiltering, and includes a temperature sensor. ADE7753stores power and energy measurements in registers, andcommunicates with the microcontroller via the SPI bus.

This simplifies the data acquisition process and allowsthe microcontroller to easily configure parameters in theADE7753. ACme-A (Figure 2(b)) uses this chip.
3.3 AC/DC Power SupplyThe two typical approaches to DC power supply de-
sign are direct rectification or step-down transformerfollowed by rectification. They are each suitable for aparticular type of I-V conversion; the choice is deter-mined by how the ground reference is established, inaddition to efficiency, size, and cost considerations. Webuilt both designs to better understand the relationshipand tradeoffs between components. ACme-A uses directrectification while ACme-B uses a transformer.
There are several methods for rectifying an AC signal.We chose a simple half wave rectifier. Direct rectifica-tion of the high main voltage avoids the use of a trans-former but requires high voltage capacitors. Care needsto be taken when using this method because the groundis at high voltage. This will lead to shorts or even fireif another device that uses earth ground is connectedwhile powered on, as might occur when using a scope todebug the circuit or connecting to a PC.
Traditional step-down transformers followed by a bridgerectifier are more efficient than direct rectification sinceinductive coupling wastes little power and a bridge rec-tifier at low voltage is efficient. However, this does notallow a shunt resistor to be used for the I-V conversion,due to a mismatch in ground level. Instead, we need toeither use a current transformer, which is too large forour application, or an in-line Hall Effect sensor, whichrepresents the design of ACme-B.
3.4 Comparison of ACme-A and ACme-B
ACme-A ACme-BMeasurements real, reactive, apparent apparentEnergy accum. hardware software
CPU load low highCost medium low
Idle power 1W 0.1W
Table 1: Properties of ACme-A and ACme-B.
ACme-A, shown in Figure 2(b) uses the combinationof a 1mΩ precision sensing resistor, direct AC-to-DCrectification, and the ADE7753 energy meter IC. ACme-B, shown in Figure 2(c) uses the combination of in-lineHall Effect sensor, transformer-based power supply, andsoftware-based energy metering. Table 1 shows the ba-sic differences between them. As we can see, ACme-Ais a more capable energy meter at the expense of effi-ciency. ACme-B, on the other hand, reduces cost andcomplexity at the expense of lower power measurementfidelity and higher CPU load. We believe that the fullrange of high-fidelity energy measurements is importantin order to support various types of energy related ap-
plications that this platform is intended to enable. The1W idle power is at the high end of acceptable overhead.For the rest of the paper, we focus on ACme-A, but theobservations carry over to ACme-B.
3.5 ControlThe appropriate form of control for many AC devices
is a simple microcontroller controlled switch. This al-lows the embedded software, and consequently remoteapplication, to have full control over the state of the ACdevice. It is useful for many applications in which wewant to close the sensing-actuation loop. We chose asolid-state-relay over traditional electro-mechanical re-lays due to its smaller size, higher switching speed, higherEMI immunity, and a near-infinite switching lifetime.Our choice, the Sharp S216SE1, provides a high isola-tion voltage due to opto-coupling. The S216SE1 has arated maximum current of 15A (1800W).
3.6 Microcontroller and RadioACme uses the Epic Core [15] as its microcontroller
and radio because Epic exports all the functionalities ofa typical “mote” but in a small and easily-composablepackage. Epic is a single-side-leadless module that canbe easily incorporated into a circuit board. In future it-erations of ACme production, Epic Core can be inlinedinto the ACme layout to further reduce cost and assem-bly time. Epic Core uses the TI MSP430F16 microcon-troller and the CC2420 radio, which are both supportedby TinyOS.
To enable high speed sampling of energy, we con-nected the SPI bus of the ADE7753 to USART1 ofMSP430, since USART0 is already shared by the ra-dio and the flash. This configuration allows high speedsamples to stream into flash. ADE7753’s IRQ and zero-crossing outputs are connected to provide wake-up inter-rupt and dimmer functionality. Finally, a PIFA boardantenna provides good radio range and minimizes cost.
3.7 Mechanical and ThermalUsability is a primary concern for ACme. We use a
plug-through design which minimizes intrusiveness byacting as a small in-line power adaptor. The male plugof the appliance is inserted into the female receptacle ofACme, and the male side of ACme is plugged into theAC outlet. A small form factor is important becauseusers will not accept large, research-grade devices. Wechose a UL approved ABS plastic enclosure the size of aregular power adaptor with a dimension of 10x5.6x4cm.
One of the applications of energy monitoring is to alertusers of abnormalities or excessive energy use. To na-tively support these types of applications and for con-ventional system diagnostics, we expose the red, green,and blue LEDs to the outside via three light-pipes. Users
are also able to control various aspects of ACme via theexternal push-button.
Because the relay and AC/DC power supply produceconsiderable heat under heavy load, we machined theenclosures with vents on all sides in addition to puttinga heat sink on the relay.
3.8 Embedded SoftwareThe ACme node software provides a simple interface
over the network, shown in Table 2, and is built aroundan ASCII shell component running on UDP port 2000.The shell allows us to remotely adjust sample parame-ters, debug the network connection, and access an over-the-air programming facility on individual meters. Datais reported to an external host using a separate UDPport in a binary data format.
ACme command function
read_energy() read the current energyread_power() read current power
report(ip_addr, rate) send reportsswitch(state) set relay to state
Table 2: ACme node interface
The driver for the metering chip and relay is im-plemented in TinyOS as a standard sampling interfacewhich provides the ability to read the energy consumedby the appliance at regular intervals via a start(period)command. The driver can turn on and off the connectedAC device using the set(state) command and querythe current state via a getState() command.
In the ACme-B implementation, we sample the ACwaveform from the Hall Effect sensor at 6kHz, and trackthe peaks. The peaks are proportional to power, as-suming constant voltage. Power is further accumulatedinside the microcontroller to obtain energy.
3.9 EvaluationWe evaluate the design of ACme based on how well
it enables energy related applications and on its easeof use in home and office environments. As shown inTable 3, ACme can be used in challenging applicationswhere high-fidelity data is needed for all three typesof power. ACme can also provide high speed samplingor long term metering. ACme can be easily adoptedinto home and offices due to its plug-through designand small size, comparable to a laptop power adaptor.We evaluate ACme in a building-wide deployment, asdescribed in Section 6.
4. ACME NETWORKMany different approaches to networking a subnet of
low-powered devices been presented in the literature,and some of the most relevant ones are evaluated in
Measurements real, reactive, apparentResolution 40mW
Sampling speed 14kHzReport speed 2.8kHz
Maximum power 1800WEnergy accumulation 6.26min
Radio range multiple floorsIdle power 1W
Size 10x5.6x4cm
Table 3: Summary of ACme
Section 8. However, at the start of the project, no avail-able solution met our needs, and so we drew inspirationfrom ongoing IETF work to adapt IPv6 for low-powerlinks. We have developed blip, a new open-source IPv6implementation in TinyOS.
Key concepts necessary for bringing IPv6 to wirelessembedded systems were explored in [19], and so we re-fer the reader to this reference for a general guide tothe challenges and benefits of embracing this networkarchitecture. Importantly, it provides a standard forIPv6 header compression in the form of the 6lowpanadaptation layer [25], and shows how IPv6 mechanismslike neighbor discover and extension header processingcan be leveraged when using links with extremely smallMTUs. In our case, a low-power (duty cycled) link wasnot necessary since the devices have abundant poweravailable. In this section, we address the specifics oftransport and routing which are implementation-specificand critical for good performance.
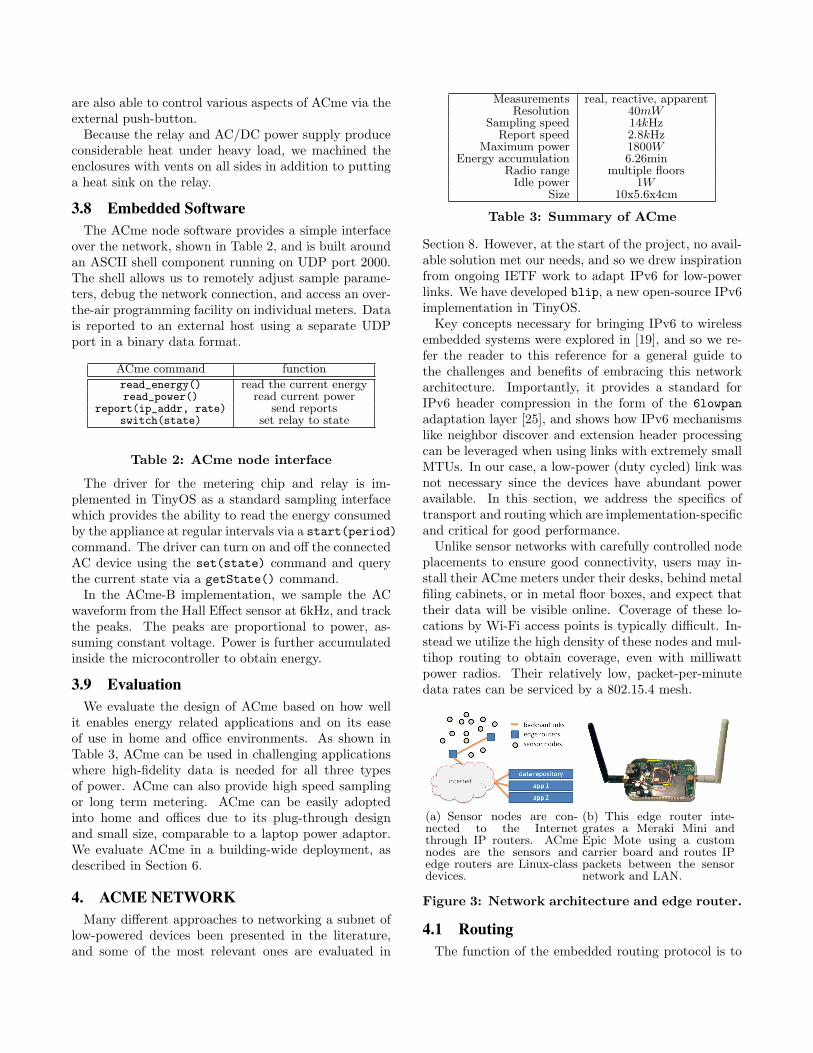
Unlike sensor networks with carefully controlled nodeplacements to ensure good connectivity, users may in-stall their ACme meters under their desks, behind metalfiling cabinets, or in metal floor boxes, and expect thattheir data will be visible online. Coverage of these lo-cations by Wi-Fi access points is typically difficult. In-stead we utilize the high density of these nodes and mul-tihop routing to obtain coverage, even with milliwattpower radios. Their relatively low, packet-per-minutedata rates can be serviced by a 802.15.4 mesh.
(a) Sensor nodes are con-nected to the Internetthrough IP routers. ACmenodes are the sensors andedge routers are Linux-classdevices.
(b) This edge router inte-grates a Meraki Mini andEpic Mote using a customcarrier board and routes IPpackets between the sensornetwork and LAN.
Figure 3: Network architecture and edge router.
4.1 RoutingThe function of the embedded routing protocol is to
provide reliable, multi-hop communication within thesubnet of ACme nodes. This is a requirement of ourdesign; the sensors and server-hosted applications mustbe able to communicate. Our routing protocol functionsas an intra-subnet routing protocol, responsible for rout-ing packets between endpoints within the same subnet,or delivering them to a gateway if the destination isexternal. Each sensor node functions as an IP router,and chooses a set of default routes from its neighborsbased on router solicitations and router advertisements.Nodes with external connectivity (“edge routers”) ad-vertise a cost of zero, and so the basic routing structureis that of a direct acyclic graph rooted at one or moreedge routers. The network protocol improves forward-ing reliability by using this set of default route choicesto provide a small set of possible next-hops, which itsends to sequentially. The forwarding engine also em-ploys link-layer retransmission for each unicast packet.
To enable communication with individual devices, eachsensor node observes a subset of the local radio link con-nectivity and intermittently reports it to an edge routerusing topology update messages. These messages areeither sent in dedicated messages, if the network is qui-escent, or piggybacked on outgoing data messages as anIPv6 destination option header. From the union of re-ported topology, edge routers form paths back into thenetwork. Packets destined into the network are sourcerouted from the edge router to a particular node. Thisbasic algorithm satisfies the requirement both for reli-ability and point-to-point communication. It providesreliable routing to the edge by maintaining multiple can-didate next hops in the direction of an edge router, whileallowing point-to-point communication by sending traf-fic to the edge, where it is re-routed. This solution issimilar to that presented in [19].
4.2 Edge RouterTo provide good network coverage and reliability, we
designed and implemented edge routers using two ex-isting Linux-class devices: the Meraki Mini and theOpenMesh Mini-Router [7, 8]. Both of these platformsare built around Atheros system-on-chip products, andrun the OpenWRT embedded Linux distribution. Inter-nally, both export a single serial port which we use toadd an 802.15.4 radio interface via a user space driver.To improve routing robustness within the subnet, alledge routers join an IPv6 link-local multicast group andforward topology updates to the group; consistency ismaintained by periodic retransmissions.
The edge routers also act as an Internet router forthe subnet assigned to the ACme network. They obtainIPv6 connectivity via a tunnel broker which providesthem with a globally routable subnet. Packets fromother networks destined to an ACme node arrive at an
edge router via the tunnel broker; once they do, they areinjected into the network using the same mechanism asinternal unicast communication.
4.3 Transportblip on the ACme nodes provides TCP and UDP as
available transport protocols. Although either would bea reasonable choice for reporting the data, we initiallychose UDP since the underlying IP datagram deliveryfunctionality is sufficiently reliable for this application,and removing the end-to-end ACK packets generated byTCP sessions reduces contention. This decision resultedin a very usable system since end-to-end loss is less than1% for almost all devices and suggests that overheadassociated with TCP’s fully acknowledged byte streammay not be necessary. The good reliability results fromthe local repair methods we employ of multiple next-hops and retransmission. When developing the proto-col, we found that most datagram drops were caused byforwarding queue drops, which are aggravated by poorlinks since numerous link-layer retries increases queuedwell time. Therefore, the most sensible strategy maybe a lower data rate combined with lazy end-to-endNACKs to achieve 100% delivery.
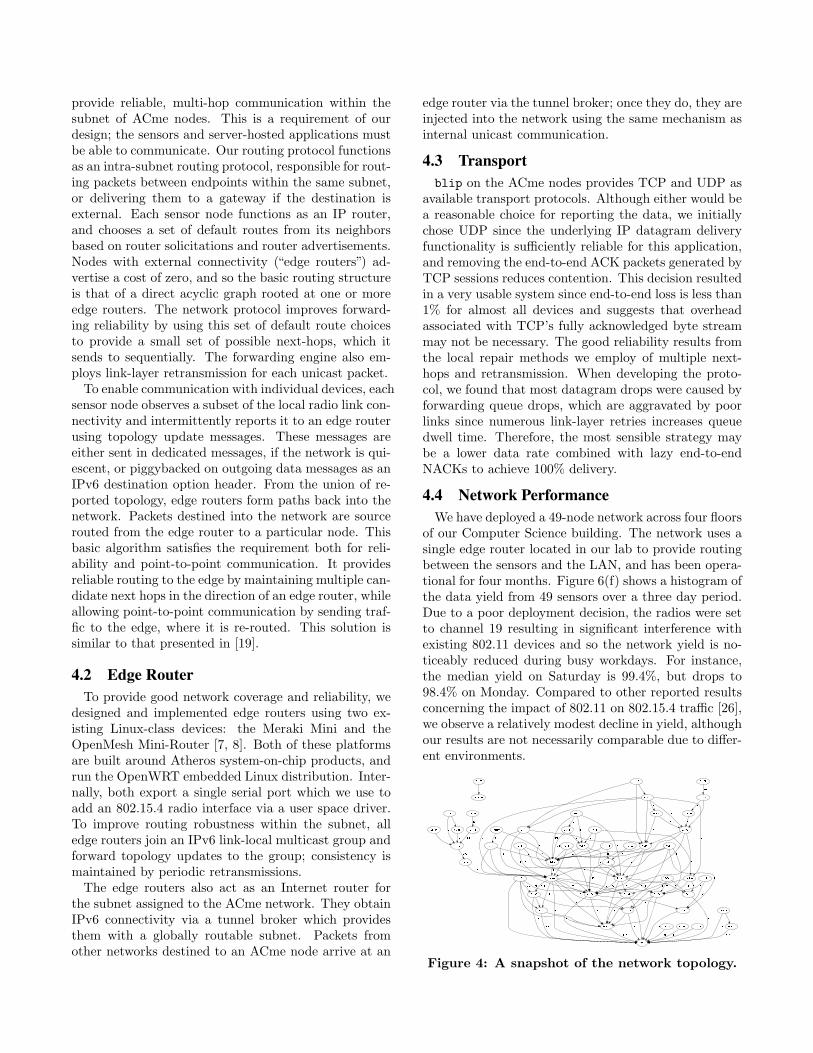
4.4 Network PerformanceWe have deployed a 49-node network across four floors
of our Computer Science building. The network uses asingle edge router located in our lab to provide routingbetween the sensors and the LAN, and has been opera-tional for four months. Figure 6(f) shows a histogram ofthe data yield from 49 sensors over a three day period.Due to a poor deployment decision, the radios were setto channel 19 resulting in significant interference withexisting 802.11 devices and so the network yield is no-ticeably reduced during busy workdays. For instance,the median yield on Saturday is 99.4%, but drops to98.4% on Monday. Compared to other reported resultsconcerning the impact of 802.11 on 802.15.4 traffic [26],we observe a relatively modest decline in yield, althoughour results are not necessarily comparable due to differ-ent environments.
Figure 4: A snapshot of the network topology.

5. ACME APPLICATION TIERThe ACme application consists of a web front-end, a
database back-end, and a daemon process. The appli-cation is built atop the network of ACme nodes and islogically distinct from both the nodes and the network.This architecture allows many distinct applications touse the underlying network concurrently. From the ap-plication’s perspective, each ACme exposes operationsto configure the node and report its energy measure-ments over UDP using a simple binary data format.Applications can use these services divorced from thenode-level details of TinyOS programming or energymetering. In this model, sensornet application develop-ment looks much more like web application developmentwith its familiar N-tier model with the meters playingthe role of an external data feed.
ACme nodes are typically configured to report energyreadings once per minute via UDP to a simple Pythonapplication daemon running on a server. Each UDPpacket includes the energy used in the previous minuteas well as the average, minimum, and maximum in-stantaneous power observed during the same interval.The daemon parses the UDP packets, extracts the rele-vant readings, timestamps the data, checks for duplicatedata, and inserts the readings into a MySQL database.Users access historical energy data through a web inter-face that queries the database and presents the resultsin tabular and graphical form. Although most queriesaccess archival data, the system also allows users to con-trol plug-loads registered to them by switching powerto them (this function is not exposed in the user inter-face). In this case, the web application can directly senda command to the node.
This application architecture marks a departure frominteracting with the sensor network in the aggregateto interacting with the individual nodes themselves asIP endpoints. This approach provides an opportunityto leverage standard networking tools and libraries likeping, wireshark, and netcat to monitor the nodes, de-bug networking problems, and build applications.
Since this architecture eliminates the application-layergateway and the proxy role the gateway plays in theprocess, the architecture raises new concerns. Allow-ing unbridled IP network access to sensor nodes raisesmany security challenges, and they are likely to be morepressing since the nodes are resource-constrained. Tech-niques like NATs, firewalls, and policy-aware switchingalready exist to solve these problems in existing enter-prise networks and they may also be applicable here.
6. GREEN BUILDING DEPLOYMENTMotivated by research that real-time, per-appliance
electricity usage feedback can induce behavioral changes
that lead to 10% to 20% reductions in usage [14], webuilt and deployed a network of nearly 50 ACme metersacross a Computer Science department, and a web ap-plication to monitor the data produced by these nodes.
The goal of this deployment is to enable interactive,near real-time monitoring of numerous small loads anda few of the larger ones found in an office environmentso that occupants can understand their electricity usagepatterns and alter their behavior to reduce their energyfootprint. This deployment enables building occupantsto observe the energy usage of their everyday devices.It also allows us to better understand where energy goesinside the building as a whole.
The green building deployment also serves as a con-crete design point to evaluate the utility and perfor-mance of the ACme node and the blip network as aplatform for energy metering and control applications.This application builds on numerous campus-wide ef-forts to monitor and control energy usage to control op-erating costs and reduce the campus carbon footprint.
6.1 Usage ProfilingBuilding occupants check out one or more ACme me-
ters from our research group, register their meters on-line, plug the loads they want to monitor into the meter,and plug the meter into a power outlet. Figure 5 showsa typical ACme meter installation as well the aggregatestatistics of the type and number of plug-loads currentlymonitored with this system in our self-contained lab.
Load Type CountDesktop 9Other 6Microwave 5Projector 5Monitor 5Laptop 6Printer 4Lamp 3Switch 2Phone 1TV 1Refrigerator 1Coffee Maker 1
Figure 5: The type and number of plug-loadscurrently monitored using ACme nodes.
In addition to enabling individuals to view and adapttheir electricity, data collected from this application willallow us to build models of energy usage aggregated overspace, time, person, load type, or other factors.
6.2 Deployment ModelTo demonstrate that we have met our goal of un-
planned deployment with minimal configuration, we walkthrough the steps necessary to deploy our network con-figured with the data-collection application. For a givendeployment, the first step is to deploy an edge router

which provides routing between our embedded IP net-work and the Internet. For us, this typically means con-necting one of our edge routers to an available LAN. Ifthe subnet is IPv6 enabled, no particular configurationis necessary as the router will automatically acquire anIPv6 prefix. If not, we configure a tunnel to an externalPoint of Presence using one of several freely availableIPv6 tunnel brokers. The ACme’s are pre-configuredwith the IPv6 address of a machine “in the cloud” towhich they report their data. While it would be possi-ble to map the IPv6 subnet of sensors to an IPv4 addressrange, or used NAT, we felt that an IPv6-only networkrepresents a better long-term perspective on how bil-lions of future devices will access the Internet.
When a sensor node is plugged in, it is automaticallyconfigured with a globally-routable IPv6 address usingIPv6 stateless autoconfiguration. Once a node estab-lishes a link with a neighbor, the node sends periodicreports to the central server containing power measure-ments. To enable users to configure their nodes andviews their data, each device is is labeled with a ran-dom 32-bit key. In order to “claim” a particular sensornode, users need only to type that string in the applica-tion’s web page, which then displays the device’s data.
6.3 Preliminary ResultsThis section presents several cuts through the data we
have collected continuously from our operational net-work over the past 4 months. The “green building” ap-plication lets users pose a range of questions that allowusers to meter and visualize the energy usage of theireveryday devices. For example, Figure 6(a) shows thepower profile of a student’s computer and monitor dur-ing a typical Monday. Monitor power draw is roughlycorrelated with computer usage, since the monitor en-ters a power saving mode after a few minutes of inac-tivity. However, the energy savings that accrue fromthe monitor’s automatic power down mode pale in com-parison to the idle power of the computer, as evidentfrom their total combined draw shown in the stackedbottom plot. This observation might cause a student topower down his or her computer over the weekend oreven every night. Figure 6(b) shows the power profileof a different system– a laptop and a 24” LCD screen(not connected to each other).
We observe that the laptop has much better powermanagement than the desktop, consuming less than halfof the desktop during active and going to sleep whennot used. The 24” LCD, on the other hand, draws morepower than the laptop when active. The LCD powertrace also reveals something we did not previously no-tice: at hour 14, the laptop connected to the LCD wasunplugged, but instead of going to sleep, it displays avendor logo and cable disconnect warning. This con-
!"
#!!"
$!!!"
$#!!"
%!!!"
%#!!"
&!!!"
&#!!"
'(!)!!" *" +,,-" $." /01!)!!" &!" +,,-"
!"#$%&'(
)&
23,-0"$4#"
56,7"$4$"
28,90:;,8"%4*"
<,=00"$4$"
>8?@0"$4$"
A<B"C4%#"
ADE;,E"*4%#"
B0FG;,E"%4$#"C#H"
#H"
%IH"
#H"
%H"$#H"
!H"$H"
&"
Monitor On,
Unplugged
Desktop Idle
Obama
Inauguration
Projector Left On Clean Shutdown
Desktop
LCD
Laptop
Projector
Frige
Coffee
XBox Phone
Figure 7: Aggregated energy usage by appli-ance type normalized by number of appliancesin an enclosed environment. The legend indi-cates “Appliance type #metered/#count.”
sumes 68W for almost four hours before sleeping. Thissuggests that we could save 272Wh per day just by turn-ing off the LCD manually after disconnecting the videosource. Figure 6(c) shows the power draw of a refrigera-tor and a water dispenser over a day. In the top graph,we note that the compressor during the refrigerationcycle draws around 100W and starts every 15 minutes;the heating element is active during the defrost cycleand draws 440W every 12 hours. Similarly, the coolingcycles in the water dispenser consume less than heat-ing in the water dispenser but has a higher duty-cycle.Unsurprisingly, the average power is highest during thework day– from about 10 AM to 5 PM.
In addition to these individual questions, the applica-tion lets one pose queries over the entire population ofnodes and their plug-loads. For example, Figure 6(d)shows the power draw of the microwaves across a build-ing. Although it is clear from this data that microwavescontribute relatively little to the department’s carbonfootprint, it suggests natural ways of using electricalconsumption for human activity monitoring. A differ-ent aggregation of the data yields the energy usage, inkWh, of each type of plug-load, as shown in Figure 6(e).The load types, from left to right, are: (1) Refrigerator,(2) Desktop, (3) Switch, (4) Coffee Maker, (5) Projec-tor, (6) Other, (7) Printer, (8) Microwave, (9) Laptop,(10), Monitor, (11) TV, (12) Lamp, and (13) Phone.
This view allows us to build models of energy usagethat can be used to estimate the contribution of thevarious small and large loads based on the number ofsuch loads and the average energy usage of their loadclass. It also focuses attention on the things that mat-ter (in this case, the desktops and network switches),since they are heaviest consumers and they are numer-ous. Figure 7 shows a breakdown of energy usage byappliance type in a laboratory that encompasses half ofan entire floor in the building. The average measuredpower is multiplied by the number of appliances to yieldthe total energy footprint of each plug-load type. The

(a) Power profile of a student’s com-puter and monitor over a typical day.
(b) Power profile of a laptop and alarge LCD over a typical day.
(c) Power draw of a refrigerator anda water dispenser on a typical day.
(d) Power draw of the microwaves onthe 3rd (bottom figure) to 7th (topfigure) floors on a typical day.
(e) Energy usage by plug-load typeon a Monday averaged across allloads of the particular type.
(f) Data yield from 49 nodes over athree day period.
Figure 6: Power traces from various appliances under measurement.
pie chart shows that desktops are the largest energy con-sumer, followed by LCDs and laptops. The time seriesshows that (1) desktops consume a lot of energy evenwhen idle; (2) projector consumption is determined onlyby utilization; and (3) some monitors draw significantpower when the source is unplugged.
7. DISCUSSION AND FUTURE WORKThe development of ACme presented several interest-
ing challenges. However, there are a number of equallyimportant questions which we are now in a position toinvestigate using the machinery developed in this work.In this section, we discuss new research directions usingthe ACme platform, as well as several unresolved issues.
7.1 DiscussionWe have learned many lessons through the design and
implementation of ACme, which we now discuss.First, while the solid state relay gives ACme the abil-
ity to control appliances, it produces considerable heat,limiting the maximum current rating of ACme. Also,ACme should maintain the state of the relay during re-boot and reprogramming. Ideally this would be imple-mented in hardware using a bistable switch; this ver-sion of ACme simply ensures that the plug is turnedon during reboots, maintaining the same semantic as
a pass-through plug. We learned this lesson the hardway, accidentally power-cycling all devices under mea-surement after reprogramming the network over the air!
We have two deployments, one in the Computer Sci-ence building and the other in an apartment; both havebeen streaming data continuously to a single databasefor the past four month. This allows us to first verifychanges in a small controlled environment before trans-ferring them to the larger setting. These two deploy-ments have produced a significant amount of data; theenergy table alone has more than eight million rows. Asthe table fills, SQL queries become slower, which forcedus redesign our database schema about two months intothe deployment to be more modular and easier for data-mining. This did not interrupt the data collection sincewe simply inserted data into both databases during thetransition period. However, queries that aggregate overappliance classes and time take several seconds to per-form, suggesting that more attention should be paid todatabase and query optimization. In a future with tensof thousands or more ACme devices, we may need toinvestigate more scalable data storage mechanisms.
While ACme is relatively small, it still occupies sig-nificant power strip space. A simple modification is toadd a multiplexer at the front-end to enable multipleinput channels, or fold the entire ACme into a power

strip. This decreases the cost per monitored applianceand saves space. Finally, our experience has shown thetext based shell to be a convenient way to configure anddebug our network of meters.
7.2 Enabled ResearchLooking beyond the Green Building deployment, we
consider how ACme could be used in service of futureresearch goals. Many of these goals include human fac-tors and sociological elements which we do not addressbut would be enabled by ACme.
Personal Accountability: The “Green Soda” appli-cation we have presented makes an initial step towardsthe goal of making individuals responsible for the en-ergy they consume. However, we envision much richerdata analytics, social features, and control to encouragepower reduction. It is well established that making peo-ple aware of their consumption causes them to reduce it[14]. In this scenario, we would install ACme devices ona semi-permanent basis and attempt to reduce energyconsumption by fostering a culture of conservation.
Energy Auditing: Our hardware, software, and net-work were designed to enable deployments with little orno planning or preparation. This makes the system idealfor fast energy audits where the system is rapidly de-ployed across an office building and used to collect datafor a short period– from a few days to a week. The datawould make occupants more aware of their power foot-print and identify the largest opportunities for savings;the process would potentially be conducted iterativelyevery few months to set goals and assess progress.
Smart Home: Another way to save power in homesand offices is to infer occupancy from various sensors:both the ACme meters we have developed as well aslight, humidity, or door-position sensors. An applicationcould use this information to adjust lighting, HVAC, en-tertainment systems, and any other devices amenableto remote control. Alternatively, residents might carry“smart badges” which would identify them to the homeand allow localization of their positions. The homewould respond by developing power profiles to save en-ergy without compromising the home’s comfort.
Demand Response: Utilities have a strong incen-tive to reduce peak demand since that would allow themto reduce dirty “peaking” plants used to meet the lastfew percent of demand. One proposal is dynamic pric-ing of power: if price of power increases as generationapproaches capacity, energy consumers would be incen-tivised to reduce their consumption. The combinationof Internet connectivity and control make the ACme ide-ally suited to experiment with“peak-shaving”and“load-shifting”algorithms to reduce the load as generation ap-proaches capacity. For instance, consumers could set uppolicies to reduce energy consumption when they receive
a signal that generation is about to be overloaded, orlimit power use to a certain budget. ACme nodes couldcommunicate with each other and make distributed de-cisions, like an Intelligent Power Switch [18].
8. RELATED WORKVirtually all households in the United States have
electric meters installed. Unfortunately, the data theyprovide is not very useful for either identifying per-appliance energy consumption or generating real-timefeedback of usage because of the low sample rates andlack of network connections. Work in this area has re-sulted in “smart meters,” which replace traditional ana-log meters and are able to report usage data to a utilityat a much finer temporal granularity then previouslyavailable. However, these meters do not extend withinresidences to provide the fine-grain view we provide.
With the recent increase of awareness in energy con-servation, several commercial products have appearedon the market which measure single outlet energy con-sumption, commonly referred to as plug-load meters [6].These are helpful for point measurements, but still re-quire manual measurement. Such an approach does notaddress the deployment challenges at scale, which oursolution addresses directly.
Several startups, such as Tendril [10], GreenBox [2],and EnergyHub [3], have recently announced propri-etary wireless monitoring solutions that are not yet pub-licly available. Their technology is similar to ours, andprovides an interesting parallel in the closed space.
A few sensor network systems have explored AC me-tering including MIT’s “Plug” platform [23]. “Plug”provides apparent power measurements through a cur-rent transformer and uses an ADC for direct sampling.This design choice was discussed in this project but notused due to its size, lack of real and reactive power,and lack of energy accumulation. Microsoft Research’s“smart-socket” [28] uses a similar design as ACme but isbattery-powered. Their web services approach interop-erates with other sensors and control points, and theirresults shows energy savings in a home context, buttheir focus is on application composition.
High fidelity power measurement is also very impor-tant. Several studies have looked at using high fidelitypower traces to identify appliances and their states [20,21, 22]. High fidelity data can also be used for faultdetection [12], power grid health monitoring and faultforecasting [17].
Future experimentation with demand-response con-trol loops will require communication with individualdevices and so collection-only protocols like MultiHo-pLQI or CTP [30, 16] were not an option. CentRoute[29] provides communication with single routers in thenetwork, but we were concerned its static routing de-
cisions would not be sufficiently agile in poor RF en-vironments. Existing open and standardized point-to-point routing protocols for wireless networks such asAODV and DYMO are not appropriate for this class ofnetworks due to high control overheads or large rout-ing state [27, 13]. While S4 appeared promising, actualuse of it would require the design and implementationof a location service [24]. Proprietary stacks such asTSMP, WirelessHART, and PhyNet [9, 11, 5] also ap-pear worthwhile but are not widely available.
9. CONCLUSIONThis paper shows that wireless sensor network tech-
nology has a great deal to offer energy monitoring, man-agement, and control applications. Conversely, energyapplications drive the sensor network research agendain new directions with different requirements and con-straints. Power, for example, while no longer being aconstraint, is still very intertwined with the design. Thenetwork architecture and protocols are still limited bylow bandwidths and small memories, but are now re-quired to provide support for different traffic patternsthan those used in traditional sensor networks. Finally,while radio connectivity is still an important part of de-sign, the focus switches from designing extremely lowduty-cycle media access protocols to coping with thecrowded environment found indoors.
The natural evolution of this work is to move meter-ing from a separate device into the appliance. Cost isan important constraint on the types of devices whichwill find favor, and for this reason the metering de-vices will still have very inexpensive microcontrollersand low-power radios, although appliances may exportmore functionality than is present in our design. Criti-cally, power applications will require a general purposenetwork rather than specialized protocols and appli-cation gateways. Future research may integrate pro-grammability into the end devices to allow them to betasked with more elaborate data processing and gener-ation tasks than our current model allows.
The source code, harware designs, and data are avail-able at http://acme.cs.berkeley.edu/.
10. ACKNOWLEDGEMENTSpecial thanks to Peter Corke, Koen Langendoen, and
Albert Goto for their help. This material is based uponwork supported by the National Science Foundation un-der grants #0435454 (“NeTS-NR”) and #0454432 (“CNS-CRI”), an NSF Graduate Fellowship, a Microsoft Grad-uate Fellowship, and generous gifts from HP and Intel.
11. REFERENCES[1] Ade7753 evaluation kit documentation. http://www.analog.com/
static/imported-files/eval\_boards/ADE7753_EvalBoard.pdf.
[2] Green box. http://www.getgreenbox.com/.
[3] Green hub. http://www.energyhub.net/.
[4] Hall effect sensing and application. http://content.honeywell.com/sensing/prodinfo/solidstate/technical/hallbook.pdf.
[5] Ip-based wireless sensor networking: Secure, reliable, low-powerip connectivity for ieee 82.15.4 networks. Arch Rock.
[6] Kill-a-watt. http://www.p3international.com/products/special/P4400/P4400-CE.html.
[7] Meraki, inc. http://www.meraki.com.
[8] Open mesh mini-router. http://www.open-mesh.com.
[9] Technical overview of time synchronized mesh protocol (tsmp).White paper, Dust Networks.
[10] Tendril. http://www.tendrilinc.com/.
[11] Wirelesshart technical data sheet. Data sheet, HARTCommunication Foundation, 2007.
[12] M. E. H. Benbouzid. A review of intruction motors signatureanalysis as a medium for faults detection. IEEE Transactionson Industrial Electronics, 47(5), 2000.
[13] I. D. Chakeres and C. E. Perkins. Dynamic manet on-demand(dymo) routing (draft-ietf-manet-dymo-10), 2007.
[14] J. Dobson and J. Griffin. Conservation effect of immediateelectricity cost. feedback on residential consumption behavior.Proceedings of the 7th ACEEE Summer Study on EnergyEfficiency in Buildings, 1992.
[15] P. Dutta, J. Taneja, J. Jeong, X. Jiang, and D. Culler. Abuilding block approach to sensornet systems. In Conference onEmbedded Networked Sensor Systems (SenSys ’08), 2008.
[16] R. Fonseca, O. Gnawali, K. Jamieson, and P. Levis. Collectiontree protocol.http://www.tinyos.net/tinyos-2.x/doc/html/tep123.html.
[17] P. Ge, Q. Guo, H. Zhou, X. Li, W. Xu, G. Tang, and Q. Xu.Wide area power grid health state diagnosis and early warningsystem based on fault power flow fingerprint identification andmas technology. DRPT2008, 2008.
[18] M. He, E. Reutzel, X. Jiang, R. Katz, S. Sanders, D. Culler,and K. Lutz. An architecture for local energy generation,distribution, and sharing. IEEE Conference on GlobalSustainable Energy Infrastructure (Energy2030 ’08), 2008.
[19] J. Hui. An Extended Internet Architecture for Low-PowerWireless Networks– Design and Implementation. PhD thesis,University of California at Berkeley, Berkeley, CA, USA, 2008.
[20] M. Ito, R. Uda, S. Ichimura, K. Tago, T. Hoshi, andY. Matsushita. A method of appliance detection based onfeatures of power waveform. Applications and the Internet,IEEE/IPSJ International Symposium on, 0:291, 2004.
[21] C. Laughman, K. Lee, R. Cox, S. Shaw, S. Leeb, L. Norford,and P. Armstrong. Power signature analysis. IEEE Power &Energy Magazine, 2003.
[22] W. Lee, G. Fung, H. Lam, F. Chan, and M. Lucente.Exploration on load signatures. International Conference onElectrical Engineering (ICEE), 2004.
[23] J. Lifton, M. Feldmeier, Y. Ono, C. Lewis, and J. A. Paradiso.A platform for ubiquitous sensor deployment in occupationaland domestic environments. IPSN ’07: Proceedings of the 6thinternational conference on Information processing in sensornetworks, 2007.
[24] Y. Mao, F. Wang, L. Qiu, S. Lam, and J. Smith. S4: Smallstate and small stretch routing protocol implementation.
[25] G. Montenegro, N. Kushalnagar, J. Hui, and D. Culler.Transmission of ipv6 packets over ieee 802.15.4 networks, 2007.
[26] R. Musaloiu-E. and A. Terzis. Minimising the effect of wifiinterference in 802.15.4 wireless sensor networks. Int. J. Sen.Netw., 3(1):43–54, 2007.
[27] C. E. Perkins and E. M. Belding-Royer. Ad-hoc on-demanddistance vector routing. In WMCSA, pages 90–100, 1999.
[28] B. Priyantha, A. Kansal, M. Goraczko, and F. Zhao. Tiny webservices: Design and implementation on interoperable andevolvable sensor networks. In ACM/IEEE Conference onEmbedded Networked Sensor Systems (SenSys ’08), 2008.
[29] T. Stathopoulos, L. Girod, J. Heideman, D. Estrin, andK. Weeks. Centralized routing for resource-constrained wirelesssensor networks (sys 5), 2006.
[30] A. Woo, T. Tong, and D. Culler. Taming the underlyingchallenges of reliable multihop routing in sensor networks. InSenSys ’03: Proceedings of the 1st international conferenceon Embedded networked sensor systems, pages 14–27, NewYork, NY, USA, 2003. ACM.