
Mechanically Stabilized Earth Wall Aggregate Sampling and Testing ...

U. S. Department of Transportation Federal Highway Administration
Publication No. FHWA-NHI-10-025FHWA GEC 011 – Volume II
November 2009
NHI Courses No. 132042 and 132043
Design and Construction of Mechanically Stabilized Earth Walls
and Reinforced Soil Slopes – Volume II Developed following: AASHTO LRFD Bridge Design Specifications, 4th Edition, 2007, with 2008 and 2009 Interims.
and AASHTO LRFD Bridge Construction Specifications, 2nd Edition, 2004, with 2006, 2007, 2008, and 2009 Interims.

NOTICE
The contents of this report reflect the views of the authors, who are responsible for the facts and accuracy of the data presented herein. The contents do not necessarily reflect policy of the Department of Transportation. This report does not constitute a standard, specification, or regulation. The United States Government does not endorse products or manufacturers. Trade or manufacturer's names appear herein only because they are considered essential to the object of this document.
Technical Report Documentation Page
1. REPORT NO.
FHWA-NHI-10-025 FHWA GEC 011-Vol II
2. GOVERNMENT ACCESSION NO.
3. RECIPIENT'S CATALOG NO.
5. REPORT DATE
November 2009
4. TITLE AND SUBTITLE
Design of Mechanically Stabilized Earth Walls and Reinforced Soil Slopes – Volume II 6. PERFORMING ORGANIZATION CODE
7. AUTHOR(S) Ryan R. Berg, P.E.; Barry R. Christopher, Ph.D., P.E. and Naresh C. Samtani, Ph.D., P.E.
8. PERFORMING ORGANIZATION REPORT NO.
10. WORK UNIT NO. 9. PERFORMING ORGANIZATION NAME AND ADDRESS
Ryan R. Berg & Associates, Inc. 2190 Leyland Alcove Woodbury, MN 55125
11. CONTRACT OR GRANT NO.
DTFH61-06-D-00019/T-06-001
13. TYPE OF REPORT & PERIOD COVERED
12. SPONSORING AGENCY NAME AND ADDRESS
National Highway Institute Federal Highway Administration U.S. Department of Transportation Washington, D.C.
14. SPONSORING AGENCY CODE
15. SUPPLEMENTARY NOTES
FHWA Technical Consultants: Rich Barrows, P.E., Silas Nichols, P.E., and Daniel Alzamora, P.E. Technical Consultant: James G. Collin, Ph.D., P.E.
16. ABSTRACT
This manual is the reference text used for the FHWA NHI courses No. 132042 and 132043 on Mechanically Stabilized Earth Walls and Reinforced Soil Slopes and reflects current practice for the design, construction and monitoring of these structures. This manual was prepared to enable the engineer to identify and evaluate potential applications of MSE walls and RSS as an alternative to other construction methods and as a means to solve construction problems. The scope is sufficiently broad to be of value for specifications specialists, construction and contracting personnel responsible for construction inspection, development of material specifications and contracting methods. With the aid of this text, the engineer should be able to properly select, design, specify, monitor and contract for the construction of MSE walls and RSS embankments. The MSE wall design within this manual is based upon Load and Resistance Factor Design (LRFD) procedures. This manual is a revision (to LRFD) and an update to the FHWA NHI-00-043 manual (which was based upon allowable stress design (ASD) procedures).
17. KEY WORDS
Design, Load and Resistance Factor Design (LRFD), analysis, performance criteria, Mechanically Stabilized Earth (MSE) Walls, Reinforced Soil Slopes (RSS), soil reinforcement, geosynthetics, specifications, contracting methods
18. DISTRIBUTION STATEMENT
No restrictions.
19. SECURITY CLASSIF.
Unclassified
20. SECURITY CLASSIF.
Unclassified
21. NO. OF PAGES
378 22

SI CONVERSION FACTORS
APPROXIMATE CONVERSIONS FROM SI UNITS
Symbol When You Know Multiply By To Find Symbol
LENGTH
mm m m km
millimeters meters meters
kilometers
0.039 3.28 1.09 0.621
inches feet
yards miles
in ft yd mi
AREA
mm2 m2
m2 ha
km2
square millimeters square meters square meters
hectares square kilometers
0.0016 10.764 1.195 2.47 0.386
square inches square feet
square yards acres
square miles
in2 ft2 yd2 ac mi2
VOLUME
ml l
m3 m3
millimeters liters
cubic meters cubic meters
0.034 0.264 35.71 1.307
fluid ounces gallons
cubic feet cubic yards
fl oz gal ft3 yd3
MASS
g kg
grams kilograms
0.035 2.202
ounces pounds
oz lb
TEMPERATURE
°C Celsius 1.8 C + 32 Fahrenheit °F
WEIGHT DENSITY
kN/m3 kilonewton / cubic m 6.36 poundforce / cubic foot pcf
FORCE and PRESSURE or STRESS
N kN kPa kPa
newtons kilonewtons kilopascals kilopascals
0.225 225
0.145 20.9
poundforce poundforce
poundforce / sq in. poundforce / sq ft
lbf lbf psi psf

FHWA NHI-10-025 MSE Walls and RSS – Vol II iii November 2009
PREFACE Engineers and specialty material suppliers have been designing reinforced soil structures for the past 35 years. Currently, many state DOTs are transitioning their design of substructures from Allowable Stress Design (ASD) to Load and Resistance Factor Design (LRFD) procedures. This manual is based upon LRFD for MSE wall structures. It has been updated from the 2001 FHWA NHI-00-043 manual. In addition to revision of the wall design to LRFD procedures, expanded discussion on wall detailing and general updates throughout the manual are provided. The primary purpose of this manual is to support educational programs conducted by FHWA for transportation agencies. A second purpose of equal importance is to serve as the FHWA standard reference for highway projects involving MSE wall and reinforced soil structures. This Mechanically Stabilized Earth Walls (MSE) and Reinforced Soil Slopes (RSS), Design and Construction Guidelines Manual which is an update of the current FHWA NHI-00-043, has evolved from the following AASHTO and FHWA references: C AASHTO LRFD Bridge Design Specifications, 4th Edition, 2007, with 2008 and 2009
Interim Revisions. C Earth Retaining Structures, by B.F. Tanyu, P.J. Sabatini, and R.R. Berg, FHWA-NHI-07-
071 (2008). C AASHTO LRFD Bridge Construction Specifications, 2nd Edition, 2004, with 2006
Interim Revisions. C Geosynthetic Design and Construction Guidelines, by R.D. Holtz, B.R. Christopher, and
R.R. Berg, FHWA HI-07-092 (2008).
C Guidelines for Design, Specification, and Contracting of Geosynthetic Mechanically Stabilized Earth Slopes on Firm Foundations, by R.R. Berg, FHWA-SA-93-025, January 1993.
C Reinforced Soil Structures - Volume I, Design and Construction Guidelines - Volume II, Summary of Research and Systems Information, by B.R. Christopher, S.A. Gill, J.P. Giroud, J.K. Mitchell, F. Schlosser, and J. Dunnicliff, FHWA RD 89-043 (1990).
C Design and Construction Monitoring of Mechanically Stabilized Earth Structures, by J.A. DiMaggio, FHWA, (1994).
C AASHTO Bridge T-15 Technical Committee unpublished working drafts for the update of Section 11.0 of the AASHTO LRFD Bridge Design Specifications.

FHWA NHI-10-025 MSE Walls and RSS – Vol II iv November 2009
The authors recognize the efforts and contributions of Messrs. Richard Barrows, P.E., Silas Nichols, P.E., and Daniel Alzamora P.E. who were the FHWA Technical Consultants for this work. The authors also recognize the contributions of the other Technical Consultants on this project. They are: C Tony Allen, P.E. of Washington DOT C Christopher Benda, P.E. of Vermont DOT C James Brennan, P.E. of Kansas DOT C James Collin, Ph.D., P.E. of The Collin Group C Jerry DiMaggio, P.E. of the National Academy of Sciences C Kenneth L. Fishman, Ph.D., P.E. of Earth Reinforcement Testing, Inc. C Kathryn Griswell, P.E. of CALTRANS C John Guido, P.E. of Ohio DOT C Dan Johnston, P.E. of South Dakota DOT C Dov Leshchinsky, Ph.D. of the University of Delaware C Michael Simac, P.E. of Earth Improvement Technologies, Inc. C James L. Withiam, Ph.D., P.E. of D’Appolonia Engineers And the authors acknowledge the contributions of the following industry associations: C Association of Metallically Stabilized Earth (AMSE) C Geosynthetic Materials Association (GMA) C National Concrete Masonry Association (NCMA) A special acknowledgement of Mr. Jerry A. DiMaggio, P.E. who was the FHWA Technical Consultant for most of the above referenced publications. Mr. DiMaggio's guidance and input to this and the previous works has been invaluable. Lastly, the authors wish to acknowledge the extensive work of the late Victor Elias, P.E. for his vital contributions and significant effort as Lead Author in preparing the earlier two (1997, 2001) versions of this manual, and as the author of the earlier companion manuals on corrosion/degradation of soil reinforcements. Mr. Elias was instrumental in the introduction and implementation of reinforced soil technology in the U.S., as a Vice President for The Reinforced Earth Company from 1974 to 1985. He was instrumental in research, refinement of design methods, and standards of practice and codes for MSE walls, as a Consultant from 1985 until 2006.
FHWA NHI-10-025 Table of Contents MSE Walls and RSS – Vol II v November 2009
TABLE OF CONTENTS – Volume II CHAPTER 8 REINFORCED (STEEPENED) SOIL SLOPES PROJECT EVALUATION..... 8-1
8.1 INTRODUCTION ............................................................................................... 8-1 8.2 REINFORCED SOIL SLOPE SYSTEMS .......................................................... 8-1
8.2.1 Types of Systems ..................................................................................... 8-1 8.2.2 Construction Materials............................................................................. 8-2
8.3 DESIGN APPROACH ........................................................................................ 8-2 8.3.1 Use Considerations .................................................................................. 8-2 8.3.2 Design of Reinforcement for Compaction Aid........................................ 8-4 8.3.3 Design of Reinforcement for Steepening Slopes and Slope Repair ........ 8-4 8.3.4 Computer-Assisted Design ...................................................................... 8-6 8.3.5 Evaluation of External Stability .............................................................. 8-8
8.4 CONSTRUCTION SEQUENCE ...................................................................... 8-11 8.5 TREATMENT OF OUTWARD FACE............................................................. 8-15
8.5.1 Grass Type Vegetation........................................................................... 8-15 8.5.2 Soil Bioengineering (Woody Vegetation) ............................................. 8-16 8.5.3 Armored ................................................................................................. 8-19
8.6 DESIGN DETAILS ........................................................................................... 8-20 8.6.1 Guardrail and Traffic Barriers ............................................................... 8-20 8.6.2 Drainage Considerations........................................................................ 8-20 8.6.3 Obstructions ........................................................................................... 8-21
8.7 CASE HISTORIES............................................................................................ 8-21 8.7.1 The Dickey Lake Roadway Grade Improvement Project ...................... 8-21 8.7.2 Salmon-Lost Trail Roadway Widening Project..................................... 8-24 8.7.3 Cannon Creek Alternate Embankment Construction Project ................ 8-26 8.7.4 Pennsylvania SR 54 Roadway Repair Project ....................................... 8-27 8.7.5 Massachusetts Turnpike - Use of Soil Bioengineering.......................... 8-29 8.7.6 242-foot High 1H:1V Reinforced Soil Slope for Airport Runway
Extension................................................................................................ 8-32 8.8 STANDARD RSS DESIGNS............................................................................ 8-34
CHAPTER 9 DESIGN OF REINFORCED SOIL SLOPES ....................................................... 9-1
9.1 INTRODUCTION ............................................................................................... 9-1 9.2 REINFORCED SLOPE DESIGN GUIDELINES............................................... 9-3
9.2.1 Step 1 - Establish the geometric, loading, and performance requirements for design............................................................................ 9-3
9.2.2 Step 2 - Determine the engineering properties of the in-situ soils........... 9-3 9.2.3 Step 3 - Determine the properties of reinforced fill and, if different, the
retained fill ............................................................................................... 9-5 9.2.4 Step 4 - Evaluate design parameters for the reinforcement ..................... 9-5 9.2.5 Step 5 - Check unreinforced stability....................................................... 9-5 9.2.6 Step 6 - Design reinforcement to provide a stable slope ......................... 9-7 9.2.7 Step 7 - Check external stability ............................................................ 9-16 9.2.8 Step 8 - Seismic stability........................................................................ 9-18
9.2.9 Step 9 - Evaluate requirements for subsurface and surface water runoff control .................................................................................................... 9-19

FHWA NHI-10-025 Table of Contents MSE Walls and RSS – Vol II vi November 2009
9.3 COMPUTER ASSISTED DESIGN .................................................................. 9-23 9.4 PROJECT COST ESTIMATES ........................................................................ 9-24
CHAPTER 10 CONTRACTING METHODS AND SPECIFICATIONS
FOR MSE WALLS AND SLOPES............................................................................... 10-1 10.1 POLICY DEVELOPMENT............................................................................... 10-2 10.2 SYSTEM OR COMPONENT APPROVALS................................................... 10-2 10.3 DESIGN AND PERFORMANCE CRITERIA ................................................. 10-5 10.4 AGENCY OR SUPPLIER DESIGN ................................................................. 10-5
10.4.1 Plan and Elevation Sheets...................................................................... 10-6 10.4.2 Facing/Panel Details ............................................................................ 10-7 10.4.3 Drainage Facilities/Special Details ........................................................ 10-7 10.4.4 Design Computations............................................................................. 10-7 10.4.5 Geotechnical Report............................................................................... 10-7 10.4.6 Construction Specifications ................................................................... 10-8
10.5 END RESULT DESIGN APPROACH ............................................................. 10-8 10.5.1 Geometric Requirements ....................................................................... 10-9 10.5.2 Geotechnical Requirements ................................................................... 10-9 10.5.3 Structural and Design Requirements ..................................................... 10-9 10.5.4 Performance Requirements.................................................................. 10-10
10.6 STANDARD DESIGNS.................................................................................. 10-10 10.6.1 MSEW Standard Designs .................................................................... 10-10 10.6.2 RSS Standard Designs ......................................................................... 10-12
10.7 REVIEW AND APPROVALS........................................................................ 10-13 10.8 CONSTRUCTION SPECIFICATIONS AND SPECIAL PROVISIONS FOR
MSEW AND RSS CONSTRUCTION............................................................ 10-14 10.9 EXAMPLE SPECIFICATION FOR MSE WALLS ....................................... 10-15 10.10 CONSTRUCTION SPECIFICATIONS FOR REINFORCED
SLOPE SYSTEMS ...................................................................................... 10-41 10.10.1 Specification Guidelines For RSS Construction (Agency Design)10-42 10.10.2 Specification for Erosion Control Mat or Blanket......................... 10-46 10.10.3 Specification for Geosynthetic Drainage Composite..................... 10-48 10.10.4 Specification Guidelines for Geosynthetic Reinforced Soil
Slope Systems ................................................................................ 10-52 CHAPTER 11 FIELD INSPECTION AND PERFORMANCE MONITORING..................... 11-1
11.1 PRECONSTRUCTION REVIEWS................................................................... 11-1 11.1.1 Plans and Specifications ........................................................................ 11-3 11.1.2 Review of Site Conditions and Foundation Requirements .................... 11-3
11.2 PREFABRICATED MATERIALS INSPECTION......................................... 11-11 11.2.1 Precast Concrete Elements................................................................... 11-11 11.2.2 Reinforcing Elements........................................................................... 11-13 11.2.3 Facing Joint Materials.......................................................................... 11-15 11.2.4 Reinforced Backfill .............................................................................. 11-15
11.3 CONSTRUCTION CONTROL....................................................................... 11-16 11.3.1 Leveling Pad ........................................................................................ 11-16 11.3.2 Erection of Facing Elements................................................................ 11-16

FHWA NHI-10-025 Table of Contents MSE Walls and RSS – Vol II vii November 2009
11.3.3 Reinforced Fill Placement, Compaction .............................................. 11-22 11.3.4 Placement of Reinforcing Elements..................................................... 11-25 11.3.5 Placement of Subsequent Facing Courses (Segmental Facings) ......... 11-26
11.4 PERFORMANCE MONITORING PROGRAMS .......................................... 11-35 11.4.1 Purpose of Monitoring Program .......................................................... 11-35 11.4.2 Limited Monitoring Program............................................................... 11-36 11.4.3 Comprehensive Monitoring Program .................................................. 11-37 11.4.4 Program Implementation ..................................................................... 11-37 11.4.5 Data Interpretation ............................................................................... 11-40
REFERENCES ............................................................................................................................R-1
APPENDICES APPENDIX A LRFD LOAD COMBINATIONS AND LOAD FACTORS, AND LOAD
FACTOR FOR PERMANENT LOADS ....................................................................... A-1 APPENDIX B DETERMINATION OF PULLOUT RESISTANCE FACTORS.................B-1
B.1 EMPIRICAL PROCEDURES TO DETERMINE F* AND α .......................B-1 B.2 EXPERIMENTAL PROCEDURES TO DETERMINE F* AND α .............B-2 B.3 CONNECTION RESISTANCE AND STRENGTH OF PARTIAL AND
FULL FRICTION SEGMENTAL BLOCK/REINFORCEMENT FACING CONNECTIONS ...........................................................................................B-5
B.4 CONNECTION RESISTANCE DEFINED WITH SHORT-TERM TESTING .........................................................................B-12 B.5 REFERENCES ............................................................................................B-15
APPENDIX C TYPICAL DIMENSIONS OF STEEL REINFORCEMENTS .....................C-1 APPENDIX D DETERMINATION OF CREEP STRENGTH REDUCTION FACTOR ... D-1
D.1 BACKGROUND .......................................................................................... D-1 D.2 STEP-BY-STEP PROCEDURES FOR EXTRAPOLATING STRESS
RUPTURE DATA -- CONVENTIONAL METHOD.................................. D-5 D.3 STEP-BY-STEP PROCEDURES FOR EXTRAPOLATING STRESS
RUPTURE DATA -- STEPPED ISOTHERMAL METHOD (SIM) ......... D-10 D.4 DETERMINATION OF RFCR.................................................................... D-13 D.5 USE OF CREEP DATA FROM "SIMILAR" PRODUCTS AND
EVALUATION OF PRODUCT LINES .................................................... D-14 D.6 CREEP EXTRAPOLATION EXAMPLES USING STRESS
RUPTURE DATA .......................................................................................E-16 D.6.1 Stress Rupture Extrapolation Example ............................................E-16
D.7 REFERENCES ............................................................................................E-20

FHWA NHI-10-025 Table of Contents MSE Walls and RSS – Vol II viii November 2009
APPENDIX E EXAMPLE CALCULATIONS E.1 MBW Unit Faced MSE Wall with Broken Back Sloping Fill and Live
Load Surcharge, Reinforced with Geogrid .................................................E.1-1 E.2 Bearing Check for Sloping Toe Conditions, with and without Water........E.2-1 E.3 Segmental Precast Panel MSE Wall with Sloping Backfill Surcharge,
Reinforced with Steel Strips .......................................................................E.3-1 E.4 Segmental Precast Panel MSE Wall with Level Backfill and Live Load
Surcharge, Reinforced with Steel Bar Mats................................................E.4-1 E.5 True Bridge Abutment with Segmental Precast Panel MSE Wall,
Reinforced with Steel Strips .......................................................................E.5-1 E.6 Traffic Barrier Impact Loading on Top of an MSE Wall ...........................E.6-1 E.7 Seismic Loading . . . ., Psuedo-Static Analysis...........................................E.7-1 E.8 Reinforced Soil Slope Design -- Road Widening .......................................E.8-1 E.9 Reinforced Soil Slope Design -- High Slope for New Road Construction.E.9-1 E.10 Reinforced Soil Slope Design -- Facing Stability Calculation .................E.10-1
APPENDIX F OTHER DESIGN PROCEDURES AND ANALSIS MODELS
F.1 ASD Procedure and the Simplified Method ..................................................F-2 F.2 Coherent Gravity Method ..............................................................................F-3 F.3 National Concrete Masonry Association Procedure ......................................F-5 F.4 GRS ......................................................................................................F-5 F.5 FHWA Structural Stiffness Method...............................................................F-7 F.6 K-Stiffness Method........................................................................................F-8 F.7 Deep Patch ...................................................................................................F-11

FHWA NHI-10-025 Table of Contents MSE Walls and RSS – Vol II ix November 2009
LIST OF TABLES – Volume II Table 8-1. RSS Slope Facing Options (after Collin, 1996)................................................. 8-14 Table 9-1. Estimated Project Costs. .................................................................................... 9-25 Table 11-1. Outline of MSE/RSS Field Inspection Checklist............................................... 11-2 Table 11-2. Checklist for Drawing Review........................................................................... 11-5 Table 11-3. Checklist for Specification Compliance. ........................................................... 11-7 Table 11-4. Out-of-Tolerance Conditions and Possible Causes.......................................... 11-30 Table 11-5. Checklist for Construction. .............................................................................. 11-32 Table 11-6. Possible Instruments for Monitoring Reinforced Soil Structures. ................... 11-38

FHWA NHI-10-025 Table of Contents MSE Walls and RSS – Vol II x November 2009

FHWA NHI-10-025 Table of Contents MSE Walls and RSS – Vol II xi November 2009
LIST OF FIGURES – Volume II Figure 8-1. Failure modes for RSSs including internal failure within the reinforced soil
zone, external failure entirely outside the reinforced soil zone, and compound failure starting behind and passing through the reinforced soil zone ………. .... 8-3
Figure 8-2. Modified limit equilibrium analysis for reinforced slope design......................... 8-5 Figure 8-3. External failure modes for reinforced soil slopes. ............................................... 8-9 Figure 8-4. Construction of reinforced soil slopes. .............................................................. 8-12 Figure 8-5. Welded wire mesh detail for temporary (during construction) or permanent
face support. ....................................................................................................... 8-15 Figure 8-6. Components of a vegetated reinforced slope (VRSS) system ........................... 8-17 Figure 8-7. Dickey Lake site. ............................................................................................... 8-23 Figure 8-8. Salmon Lost Trail site........................................................................................ 8-25 Figure 8-9. Cannon Creek project. ....................................................................................... 8-26 Figure 8-10. Pennsylvania SR54. ........................................................................................... 8-28 Figure 8-11. Massachusetts Turnpike during construction, immediately after construction
and after the second growing season. ................................................................ 8-31 Figure 8-12. Reinforced soil slope for runway extension at Yeager Airport, Charleston,
West Virginia ..................................................................................................... 8-33 Figure 8-13. Example of standard RSS design....................................................................... 8-36 Figure 9-1. Flow chart of steps for reinforced soil slope design. ........................................... 9-2 Figure 9-2. Requirements for design of reinforced soil slopes............................................... 9-4 Figure 9-3. Critical zone defined by rotational and sliding surface that meet the required
safety factor.......................................................................................................... 9-6 Figure 9-4. Rotational shear approach to determine required strength of reinforcement....... 9-8 Figure 9-5. Chart solution for determining the reinforcement strength requirements.......... 9-10 Figure 9-6. Reinforcement spacing considerations for high slopes...................................... 9-11 Figure 9-7. Developing reinforcement lengths..................................................................... 9-14 Figure 9-8. Failure through the foundation........................................................................... 9-17 Figure 9-9. Seismic stability analysis. .................................................................................. 9-19 Figure 9-10. Subsurface drainage considerations................................................................... 9-20 Figure 11-1. Casting yard for precast facing elements. ........................................................ 11-12 Figure 11-2. Inspect reinforcing elements: top photo shows a variety of reinforcements
including metallic strips, welded wire mesh, and geosynthetics and bottom photo shows reinforcement length painted on geogrid reinforcement............. 11-14
Figure 11-3. Leveling pads: a) leveling the concrete, b) completed pad, and c) placing the facing elements on the leveling pad................................................................. 11-17
Figure 11-4. Checking facing element batter and alignment................................................ 11-18 Figure 11-5. Full height facing panels require special alignment care................................. 11-19 Figure 11-6. Setting first row of precast facing elements..................................................... 11-21 Figure 11-7. Placement of reinforced fill. ............................................................................ 11-23 Figure 11-8. Compaction equipment showing: a) large equipment permitted away from
face; and b) lightweight equipment within 3 ft (1 m) of the face. ................... 11-24 Figure 11-9. Facing connection examples ............................................................................ 11-27 Figure 11-10. Geotextile joint cover and neoprene pads........................................................ 11-29

FHWA NHI-10-025 Table of Contents MSE Walls and RSS – Vol II xii November 2009

FHWA NHI-10-025 Table of Contents MSE Walls and RSS – Vol II xiii November 2009
TABLE OF CONTENTS – Volume I CHAPTER 1 INTRODUCTION ................................................................................................. 1-1
1.1 OBJECTIVES...................................................................................................... 1-1 1.1.1 Scope ...................................................................................................... 1-1 1.1.2 Source Documents ................................................................................... 1-2 1.1.3 Terminology............................................................................................. 1-3
1.2 HISTORICAL DEVELOPMENT ....................................................................... 1-4 1.3 LOAD AND RESISTANCE FACTOR DESIGN (LRFD) ............................... 1-12
CHAPTER 2 SYSTEMS AND PROJECT EVALUATION....................................................... 2-1
2.1 APPLICATIONS ................................................................................................. 2-1 2.1.1 MSE Walls ............................................................................................... 2-1 2.1.2 Reinforced Soil Slopes............................................................................. 2-4
2.2 ADVANTAGES AND POTENTIAL DISADVANTAGES............................... 2-6 2.2.1 Advantages of Mechanically Stabilized Earth (MSE) Walls................... 2-6 2.2.2 Advantages of Reinforced Soil Slopes (RSS).......................................... 2-6 2.2.3 Potential Disadvantages ........................................................................... 2-7
2.3 RELATIVE COSTS............................................................................................. 2-7 2.4 DESCRIPTION OF MSE/RSS SYSTEMS....................................................... 2-10
2.4.1 Systems Differentiation ......................................................................... 2-10 2.4.2 Types of Systems ................................................................................... 2-11 2.4.3 Facing Systems ...................................................................................... 2-12 2.4.4 Reinforcement Types ............................................................................. 2-16 2.4.5 Reinforced Fill Materials ....................................................................... 2-17 2.4.6 Appurtenant Materials of Construction ................................................. 2-18
2.5 CONSTRUCTION SEQUENCE....................................................................... 2-18 2.5.1 Construction of MSEW systems with precast facings........................... 2-18 2.5.2 Construction of MSE systems with Flexible Facings ............................ 2-24 2.5.3 RSS Construction................................................................................... 2-28
2.6 SITE EVALUATION ........................................................................................ 2-28 2.6.1 Site Exploration ..................................................................................... 2-28 2.6.2 Field Reconnaissance............................................................................. 2-30 2.6.3 Subsurface Exploration.......................................................................... 2-30 2.6.4 Laboratory Testing................................................................................. 2-32 2.6.5 Foundation Soils .................................................................................... 2-33
2.7 PROJECT EVALUATION................................................................................ 2-34 2.7.1 Structure Selection Factors .................................................................... 2-34 2.7.2 Geologic and Topographic Conditions .................................................. 2-35 2.7.3 Environmental Conditions ..................................................................... 2-36 2.7.4 Size and Nature of Structure .................................................................. 2-37 2.7.5 Aesthetics............................................................................................... 2-38 2.7.6 Questionable Applications ..................................................................... 2-38
2.8 ESTABLISHMENT OF PROJECT CRITERIA ............................................... 2-38 2.8.1 Alternates ............................................................................................... 2-39 2.8.2 Facing Considerations............................................................................ 2-39

FHWA NHI-10-025 Table of Contents MSE Walls and RSS – Vol II xiv November 2009
2.8.3 Performance Criteria.............................................................................. 2-40 2.8.4 Design Life............................................................................................. 2-46
2.9 PROPRIETARY ASPECTS .............................................................................. 2-46 2.10 CASE HISTORIES -- MSE WALLS ................................................................ 2-47
2.10.1 Mn/DOT Crosstown Project MSE Walls............................................... 2-47 2.10.2 Veterans Memorial Overpass True Abutment MSE Walls.................... 2-49 2.10.3 SEATAC Runway Extension Wall........................................................ 2-50 2.10.4 Guanella Pass Roadway Reconstruction................................................ 2-51
CHAPTER 3 SOIL REINFORCEMENT PRINCIPLES AND SYSTEM DESIGN PROPERTIES........................................................................ 3-1 3.1 OVERVIEW ........................................................................................................ 3-1 3.2 ESTABLISHMENT OF ENGINEERING PROPERTIES BASED ON SITE
EXPLORATION AND TESTING ...................................................................... 3-2 3.2.1 Reinforced Fill Soil.................................................................................. 3-2 3.2.2 Retained Backfill and Natural Retained Soil ........................................... 3-8 3.2.3 Electrochemical Properties ...................................................................... 3-9
3.3 REINFORCED SOIL CONCEPTS ................................................................... 3-10 3.3.1 Stress Transfer Mechanisms .................................................................. 3-10 3.3.2 Mode of Reinforcement Action ............................................................. 3-12 3.3.3 Geometric Characteristics...................................................................... 3-12
3.4 SOIL REINFORCEMENT INTERACTION USING NORMALIZED CONCEPTS ....................................................................................................... 3-13 3.4.1 Evaluation of Pullout Performance........................................................ 3-13 3.4.2 Estimate of the Reinforcement Pullout Capacity in MSE Structures .... 3-16 3.4.3 Interface Shear ....................................................................................... 3-21
3.5 ESTABLISHMENT OF STRUCTURAL DESIGN PROPERTIES ................. 3-22 3.5.1 Strength Properties of Steel Reinforcements ......................................... 3-22 3.5.2 Strength Properties of Geosynthetic Reinforcement.............................. 3-28 3.5.2.a Ultimate Tensile Strength, Tult ................................................... 3-31 3.5.2.b Installation Damage Reduction Factor, RFID............................. 3-31 3.5.2.c Creep Reduction Factor, RFCR................................................... 3-32 3.5.2.d Durability Reduction Factor, RFD.............................................. 3-33 3.5.2.e Durability Reduction Factor, RFD, at Wall Face Unit ............... 3-38 3.5.2.f LRFD Geosynthetic Resistance Factor, .................................. 3-38 3.5.2.g Preliminary Design Reduction Factor, RF................................. 3-39 3.5.2.h Serviceability Limit State .......................................................... 3-40
3.6 FACING MATERIALS..................................................................................... 3-41 3.6.1 Precast Concrete Panels ......................................................................... 3-41 3.6.1.a Segmental Panels ....................................................................... 3-41 3.6.1.b Full-Height Panels ..................................................................... 3-42 3.6.2 Modular Block Wall (MBW) Units ....................................................... 3-43 3.6.3 Welded Wire Mesh Facing .................................................................... 3-46 3.6.4 Geosynthetic Wrap-Around Facing ....................................................... 3-47 3.6.5 Other Facings ......................................................................................... 3-47 3.6.6 Two-Stage Facings................................................................................. 3-50

FHWA NHI-10-025 Table of Contents MSE Walls and RSS – Vol II xv November 2009
CHAPTER 4 DESIGN OF MSE WALLS .................................................................................. 4-1 4.1 DESIGN METHODOLOGY AND ANALYSIS METHODS............................ 4-1
4.1.1 Load and Resistance Factor Design (LRFD) Platform............................ 4-1 4.1.2 Analysis Methods..................................................................................... 4-2
4.2 LOADS AND LOAD COMBINATIONS........................................................... 4-3 4.3 DESIGN OF MSE WALLS USING LRFD METHODOLOGY ........................ 4-6
4.3.1 Design Steps............................................................................................. 4-7 4.4 MSE WALLS DESIGN GUIDELINES .............................................................. 4-9
4.4.1 Step 1 - Establish Project Requirements.................................................. 4-9 4.4.2 Step 2 - Establish Project Parameters ...................................................... 4-9 4.4.3 Step 3 - Estimate Wall Embedment Depth & Reinforcement Length ... 4-10 4.4.4 Step 4 - Define Nominal Loads ............................................................. 4-11 4.4.5 Step 5 - Summarize Load Combinations, Load Factors, and Resistance
Factors ................................................................................................... 4-17 4.4.6 Step 6 - Evaluate External Stability ....................................................... 4-18 4.4.6.a Evaluate Sliding Stability .......................................................... 4-19 4.4.6.b Evaluate Eccentricity ................................................................. 4-22 4.4.6.c Evaluate Bearing on Foundation................................................ 4-26 4.4.6.d Settlement Estimate ................................................................... 4-31 4.4.7 Step 7 - Evaluate Internal Stability ........................................................ 4-31 4.4.7.a Select Type of Reinforcement ................................................... 4-32 4.4.7.b Define Critical Slip Surface ....................................................... 4-33 4.4.7.c Define Unfactored Loads........................................................... 4-35 4.4.7.d Establish Vertical Layout of Soil Reinforcements..................... 4-38 4.4.7.e Calculate Factored Tensile Forces in Reinforcements............... 4-39 4.4.7.f Calculate Soil Reinforcement Resistance .................................. 4-47 4.4.7.g Select Grade of &/or Number of Elements at Each Level......... 4-49 4.4.7.h Internal Stability with Respect to Pullout Failure...................... 4-49 4.4.7.i Check Connection Strength ....................................................... 4-52 4.4.7.j Lateral Movements .................................................................... 4-57 4.4.7.k Vertical Movement and Bearing Pads ....................................... 4-57 4.4.8 Step 8 - Design of Facing Elements....................................................... 4-58 4.4.8.a Design of Concrete, Steel, and Timber Facings ........................ 4-58 4.4.8.b Design of Flexible Wall Facings................................................ 4-59 4.4.9 Step 9 - Assess Overall Stability............................................................ 4-59 4.4.10 Step 10 - Assess Compound Stability.................................................... 4-61 4.4.11 Step 11 - Wall Drainage Systems .......................................................... 4-65 4.11.a Surface Drainage........................................................................ 4-65 4.11.b Surface Water Runoff ................................................................ 4-65 4.11.c Scour .......................................................................................... 4-65
4.5 TEMPORARY WALLS .................................................................................... 4-66 4.6 DESIGN CHECKLIST...................................................................................... 4-66 4.7 COMPUTER-AIDED DESIGN ........................................................................ 4-80 4.8 VENDOR........................................................................................................... 4-80 4.9 STANDARD MSEW DESIGNS....................................................................... 4-80

FHWA NHI-10-025 Table of Contents MSE Walls and RSS – Vol II xvi November 2009
CHAPTER 5 MSE WALL DESIGN DETAILS ......................................................................... 5-1 5.1 TOP OF WALL ELEMENTS ............................................................................. 5-1
5.1.1 Copings .................................................................................................... 5-1 5.1.2 Traffic Barriers......................................................................................... 5-4 5.1.3 Parapets .................................................................................................... 5-4 5.1.4 Post and Beam Barriers............................................................................ 5-4 5.1.5 Drainage Related to Top of Wall Elements ............................................. 5-6
5.2 BOTTOM OF WALL ELEMENTS .................................................................... 5-6 5.3 DRAINAGE......................................................................................................... 5-8
5.3.1 Internal Drainage Systems ....................................................................... 5-9 5.3.2 External Drainage .................................................................................. 5-17 5.3.3 Filtration and Drainage System Component Requirements................... 5-24 5.3.4 Maintenance of Drainage....................................................................... 5-34
5.4 INTERNAL DETAILS...................................................................................... 5-35 5.4.1 Contact Between Dissimilar Metals....................................................... 5-35 5.4.2 Vertical Obstructions in Reinforced Soil Mass ..................................... 5-35 5.4.3 Horizontal Obstructions in Reinforced Soil Mass ................................. 5-42 5.4.4 Wall Face Penetrations .......................................................................... 5-44 5.4.5 Slip Joints............................................................................................... 5-46 5.4.6 Wall Curves ........................................................................................... 5-47 5.4.7 Wall Corners .......................................................................................... 5-51 5.4.8 Two-Stage Facing .................................................................................. 5-52
5.5 WALL INITIATIONS AND TERMINATIONS .............................................. 5-54 5.6 AESTHETICS.................................................................................................... 5-56
CHAPTER 6 DESIGN OF MSE WALLS WITH COMPLEX GEOMETRICS ........................ 6-1
6.1 BRIDGE ABUTMENTS ..................................................................................... 6-3 6.1.1 MSEW Abutments on Spread Footings................................................... 6-3 6.1.2 MSEW Abutments on Stub Footings Supported by Deep Foundations
through Reinforced Wall Fill ................................................................... 6-6 6.1.3 Alternative Configuration of MSE Walls at Bridge Abutments............ 6-10 6.1.4 Protection of MSE Wall at Abutments .................................................. 6-11
6.2 SUPERIMPOSED (TIERED) MSE WALLS.................................................... 6-13 6.2.1 2-Tier Superimposed Wall..................................................................... 6-13
6.2.2 Superimposed Walls with More than 2-Tiers ........................................ 6-15 6.3 WALLS WITH UNEVEN REINFORCEMENT LENGTHS ........................... 6-16 6.4 BACK-TO-BACK (BBMSE) WALLS ............................................................. 6-17 6.5 SHORED MSE WALLS FOR STEEP TERRAINS AND LOW VOLUME
ROADS.............................................................................................................. 6-19 6.6 STABLE FEATURE MSE (SFMSE) WALLS ................................................. 6-26
CHAPTER 7 DESIGN OF MSE WALLS FOR EXTREME EVENTS...................................... 7-1
7.1 SEISMIC EVENTS ............................................................................................. 7-1 7.1.1 External Stability ..................................................................................... 7-1 7.1.2 Internal Stability....................................................................................... 7-9 7.1.2.a Tensile Failure ........................................................................... 7-11 7.1.2.b Pullout Failure............................................................................ 7-12

FHWA NHI-10-025 Table of Contents MSE Walls and RSS – Vol II xvii November 2009
7.1.3 Facing Reinforcement Connections....................................................... 7-13 7.2 VEHICULAR IMPACT EVENTS.................................................................... 7-14
7.2.1 Traffic Barriers....................................................................................... 7-15 7.2.2 Post and Beam Railings ......................................................................... 7-17 7.3 FLOODS AND SCOUR.................................................................................... 7-18

FHWA NHI-10-025 Table of Contents MSE Walls and RSS – Vol II xviii November 2009

FHWA NHI-10-025 Table of Contents MSE Walls and RSS – Vol II xix November 2009
LIST OF TABLES – Volume I Table 1-1. Summary of Reinforcement and Face Details for MSE Wall Systems. .............. 1-7 Table 1-2. Representative List of Geogrid and Geotextile Reinforcement Manufacturers
and Suppliers...................................................................................................... 1-11 Table 2-1. Typical Minimum Length of Reinforcement..................................................... 2-43 Table 2-2. Minimum MSEW Embedment Depths.............................................................. 2-43 Table 2-3. Relationship Between Joint Width and Limiting Differential
Settlements for MSE Precast Panels .................................................................. 2-46 Table 3-1. MSE Wall Select Granular Reinforced Fill Requirements .................................. 3-3 Table 3-2. RSS Granular Reinforced Fill Requirements....................................................... 3-6 Table 3-3. Recommended Limits of Electrochemical Properties for Reinforced Fills with
Steel Reinforcement............................................................................................. 3-9 Table 3-4. Recommended Limits of Electrochemical Properties for Reinforced Fills with
Geosynthetic Reinforcements ............................................................................ 3-10 Table 3-5. Basic Aspects of Reinforcement Pullout Performance in Granular
and Cohesive Soils of Low Plasticity ................................................................ 3-15 Table 3-6. Summary of Pullout Capacity Design Parameters............................................. 3-17 Table 3-7. Minimum Galvanization Thickness by Steel Thickness.................................... 3-26 Table 3-8. Steel Corrosion Rates for Mildly Corrosive Reinforced Fill ............................. 3-26 Table 3-9. Installation Damage Reduction Factors. ............................................................ 3-32 Table 3-10. Anticipated Resistance of Polymers to Specific Environments......................... 3-34 Table 3-11. Durability (Aging) Reduction Factors for PET. ................................................ 3-36 Table 3-12. Minimum Requirements for use of Default Durability Reduction Factors
(RFD) for Primary Geosynthetic Reinforcement................................................ 3-37 Table 3-13. Minimum Requirements for use of Preliminary Design Reduction Factor (RF)
for Primary Geosynthetic Reinforcement. ......................................................... 3-40 Table 3-14. Additional MBW Cold Weather Requirements Recommended by Mn/DOT (2008). ................................................................................................ 3-45 Table 4-1. Typical MSE Wall Load Combinations and Load Factors (after Table 3.4.1-1,
AASHTO, 2007) ................................................................................................. 4-4 Table 4-2. Typical MSE Wall Load Factors for Permanent Loads, γp (after Table 3.4.1-2,
AASHTO, 2007) ................................................................................................. 4-4 Table 4-3. Basic LRFD Design Steps for MSE Walls .......................................................... 4-8 Table 4-4. Equivalent Height of Soil, heq, for Traffic Loading on Abutments ........................... Perpendicular to Traffic (Table 3.11.6.4-1, AASHTO {2007}) ....................... 4-17 Table 4-5. External Stability Resistance Factors for MSE Walls (Table 11.5.6-1, AASHTO {2007}) ............................................................................................ 4-19 Table 4-6. Bearing Resistance Factors (Table 10.6.3.1.2a-1, AASHTO {2007}) ............. 4-29 Table 4-7. Resistance Factors for Tensile and Pullout Resistance for MSE Walls (after
Table 11.5.6-1, AASHTO (2007........................................................................ 4-48 Table 4-8. Example MBW Faced MSE Wall Standard Design (Minnesota DOT, 2008) .. 4-82

FHWA NHI-10-025 Table of Contents MSE Walls and RSS – Vol II xx November 2009
Table 5-1. Values of B for Various Cu Values for Soils with less than 50% Passing the No. 200 Sieve ..................................................................................................... 5-27 Table 5-2. Values of B and AOS for Soils with more than 50% Passing the No. 200 Sieve Based on Type of Geotextile............................................................................... 5-27 Table 5-3. Geotextile Survivability Requirements (AASHTO M 288, 2006) ................... 5-29 Table 5-4. Recommended Minimum Properties for General Geomembrane Installation
Survivability (after Koerner, 1998) ................................................................... 5-33

FHWA NHI-10-025 Table of Contents MSE Walls and RSS – Vol II xxi November 2009
LIST OF FIGURES – Volume I Figure 1-1. Generic cross section of an MSE structure. ......................................................... 1-4 Figure 1-2. Generic cross sections of reinforced soil slope structures, reinforcements used
to: (a) increase stability of a slope; and (b) provide improved compaction and surficial stability at edge of a slopes. ................................................................... 1-5
Figure 2-1. Representative MSE applications (a) retaining wall; (b) access ramp; (c)
waterfront structure; and (d) bridge abutment. .................................................... 2-2 Figure 2-2. MSE walls to support temporary bridge abutment roadway embankment.......... 2-3 Figure 2-3. MSE wall used to temporarily support a permanent roadway embankment for
phased construction.............................................................................................. 2-3 Figure 2-4. Application of reinforced soil slopes. .................................................................. 2-5 Figure 2-5. Cost evaluation of reinforced soil slopes. .......................................................... 2-10 Figure 2-6. Example MSE wall surface treatments. ............................................................. 2-13 Figure 2-7. Examples of commercially available MBW units (NCMA, 1997).................... 2-14 Figure 2-8. Erection of precast panels. ................................................................................. 2-21 Figure 2-9. Fill spreading and reinforcement connection..................................................... 2-22 Figure 2-10. Compaction of reinforced wall fill..................................................................... 2-23 Figure 2-11. Lift construction sequence for geosynthetic faced MSE walls. ......................... 2-25 Figure 2-12. Typical geosynthetic face construction detail.................................................... 2-26 Figure 2-13. Types of geosynthetic reinforced soil wall facing (after Wu, 1994) ................. 2-27 Figure 2-14. Reinforced slope construction: (a) geogrid and fill placement; (b) soil filled
erosion control mat placement; and (c) finished, vegetated 1:1 slope............... 2-29 Figure 2-15. Empirical curve for estimating probable anticipated lateral displacement
during construction for MSE walls (after FHWA 89-043 {Christopher et al., 1990}) .............................................................................................................. 2-41
Figure 2-16. MSE wall embedment depth requirements, (a) level toe condition and (b) benched slope toe condition............................................................................... 2-44
Figure 2-17. MSE wall construction on Mn/DOT Crosstown Project, 2008. ........................ 2-48 Figure 2-18. Veterans Memorial Overpass............................................................................. 2-49 Figure 2-19. MSE true bridge abutment ................................................................................. 2-49 Figure 2-20. Typical cross section, VMO project .................................................................. 2-50 Figure 2-21. SeaTac Airport runway extension MSE wall..................................................... 2-51 Figure 2-22. Guanella Pass wire-faced wall ........................................................................... 2-52 Figure 2-23. Guanella Pass architectural concrete faced wall ................................................ 2-52 Figure 3-1. Examples of reinforced fill zone extension beyond the reinforced zone............. 3-8 Figure 3-2. Stress transfer mechanisms for soil reinforcement. ........................................... 3-11 Figure 3-3. Coverage ratio.................................................................................................... 3-13 Figure 3-4. Definition of grid dimensions for calculating pullout capacity ......................... 3-18 Figure 3-5. Parameters for metal reinforcement strength calculations showing (a) steel
strips and (b) metallic grids and bar mats .......................................................... 3-24 Figure 3-6. Long-term geosynthetic reinforcement strength concepts................................. 3-29 Figure 3-7. Large, wet-cast concrete face unit with reinforcement placed between units. .. 3-48 Figure 3-8. Large, wet-cast concrete face unit with embedded reinforcement connectors. . 3-49 Figure 3-9. Geocell face unit with vegetation. ..................................................................... 3-49

FHWA NHI-10-025 Table of Contents MSE Walls and RSS – Vol II xxii November 2009
Figure 4-1. External stability load factors for simple walls.................................................... 4-5 Figure 4-2. External analysis: nominal earth pressures; horizontal backslope with traffic
surcharge (after AASHTO, 2007) ..................................................................... 4-12 Figure 4-3. External analysis: earth pressure; sloping backfill case (after AASHTO,
2007). ................................................................................................................ 4-13 Figure 4-4. External analysis: earth pressure; broken backslope case (after AASHTO,
2007) ................................................................................................................ 4-14 Figure 4-5. Notation for Coulomb active earth pressures used with wall batters, , greater
than 100 (after AASHTO, 2007)..................................................................... 4-16 Figure 4-6. Potential external failure mechanisms for a MSE wall...................................... 4-18 Figure 4-7. Calculation of eccentricity and vertical stress for bearing check, for horizontal
backslope with traffic surcharge condition ........................................................ 4-24 Figure 4-8. Calculation of eccentricity and vertical stress for bearing check, for sloping
backslope condition ........................................................................................... 4-25 Figure 4-9. Location of potential failure surface for internal stability design of MSE Walls
(a) inextensible reinforcements and (b) extensible reinforcements ................... 4-34 Figure 4-10. Variation of the coefficient of lateral stress ratio (K/Ka) with depth in a MSE
wall (Elias and Christopher, 1997; AASHTO, 2002; after AASHTO, 2007) .. 4-37 Figure 4-11. Calculation of vertical stress for sloping backfill conditions for internal
stability............................................................................................................... 4-38 Figure 4-12. Distribution of stress from concentrated vertical load for internal and external
stability calculations........................................................................................... 4-44 Figure 4-13. Distribution of stresses from concentrated horizontal loads.............................. 4-45 Figure 4-14. Reinforcement load contributory height ............................................................ 4-46 Figure 4-15. Nominal vertical stress at the reinforcement level in the resistant zone,
beneath a sloping backfill .................................................................................. 4-50 Figure 4-16. Bodkin connection detail (looking at cross section of segmental panel face .... 4-53 Figure 4-17. Determination of hinge height for modular concrete block faced MSE walls
(NMCA, 1997) .................................................................................................. 4-56 Figure 4-18. Typical geometries where MSE wall compound stability is of concern: steep
and tall backslope on top of the wall; tiered walls; slope at the toe of the wall; and water at toe of the slope .............................................................................. 4-64
Figure 4-19. Example of standard MSEW design. (Minnesota DOT, 2008) ....................... 4-83 Figure 5-1. Example copings for MSE walls.......................................................................... 5-2 Figure 5-2. Example traffic barrier for MSE walls. (a) Barrier behind coping, (b) barrier
on top of panels, (c) barrier on top of modular block units ................................. 5-5 Figure 5-3. Leveling pads, (a) Common size, b) Step detail for precast panel facing units,
(c) Step detail for modular block facing units ..................................................... 5-7 Figure 5-4. Potential sources and flowpaths of water........................................................... 5-10 Figure 5-5. Example layout of filter at joints between segmental precast facing units........ 5-11 Figure 5-6. Layout of drainage fabric and drainage fill at the face for modular block units.
(Collin et al., 2002) ............................................................................................ 5-12 Figure 5-7. Example layout of geotextile filter near the face for welded wire facing units . 5-13 Figure 5-8. Example drainage blanket detail behind the retained backfill ........................... 5-14 Figure 5-9. Example drainage detail using a geocomposite sheet drain............................... 5-15

FHWA NHI-10-025 Table of Contents MSE Walls and RSS – Vol II xxiii November 2009
Figure 5-10. Example drainage detail using a blanket drain with chimney drain (Collin et al., 2002) ............................................................................................................ 5-16
Figure 5-14. Example detail for wall that may experience inundation................................... 5-17 Figure 5-12. Example MSE wall overflow sill at top of wall................................................. 5-19 Figure 5-13. Example drainage swale near top of wall. ((b) Collin et al., 2002) ................... 5-20 Figure 5-14. (a) Example geomembrane barrier details, (b) Installation of geomembrane
deicing salt runoff barrier, (c) Geomembrane installation around manhole penetration.......................................................................................................... 5-22
Figure 5-15. Example of undesirable water seepage through pavement due to deficient grades (Collin et al., 2002)................................................................................. 5-23
Figure 5-16. Example of surface flow erosion at the bottom of an MSE wall ....................... 5-24 Figure 5-17. Examples of avoiding a vertical obstruction without severing soil
reinforcements.................................................................................................... 5-37 Figure 5-18. Vertical obstructions in reinforced soil mass with segmental precast facing
units ................................................................................................................ 5-39 Figure 5-19. Example of a structural frame around vertical obstruction (a) with segmental
precast facing - note that vertically adjacent layers of reinforcement to be separated by a minimum of 3-in. (75 mm) of wall fill, (b)-(c) with modular block face – note corner detail ........................................................................... 5-40
Figure 5-20. Example details of reinforcements around vertical obstructions in reinforced soil mass with modular block units.................................................................... 5-41
Figure 5-21. Navigating horizontal obstruction in MSE walls with inextensible reinforcements.................................................................................................... 5-43
Figure 5-22. Navigating horizontal obstruction in MSE walls with extensible reinforcement ..................................................................................................... 5-43 Figure 5-23. Example of backup panels for large horizontal obstructions............................. 5-44 Figure 5-24. Example pipe penetrations through segmental precast panel facing units ........ 5-45 Figure 5-25. Example pipe penetration through modular block facing units ......................... 5-46 Figure 5-26. Example slip joints for segmental precast panel facings ................................... 5-48 Figure 5-27. Example slip joint for modular block wall facings............................................ 5-49 Figure 5-28. Example layout of geogrid reinforcement for walls with curves....................... 5-50 Figure 5-29. Example corner details....................................................................................... 5-51 Figure 5-30. Conceptual connection details for a 2-stage facing system ............................... 5-53 Figure 5-31. Common joint details between segmental precast panel facing units and CIP
structures ............................................................................................................ 5-55 Figure 5-32. Common joint between modular block facing units and CIP structures ........... 5-55 Figure 5-33. Example of MSE wall aesthetics ....................................................................... 5-58 Figure 5-34. Examples of cast-in-place abutment to MSE wall panel transitions.................. 5-59 Figure 6-1. Types of complex MSE structures....................................................................... 6-2 Figure 6-2. Geometry definition, location of critical failure surface and variation of Kr and
F* parameters for analysis of a MSEW abutment on spread footing ................. 6-4 Figure 6-3. Details of a typical pile supported MSE abutment .............................................. 6-7 Figure 6-4. Geometry definition and typical supplemental lateral pressure distribution
from deep foundation on MSE wall face ............................................................. 6-9 Figure 6-5. Example of use of a geosynthetic wrapped face wall behind an integral
abutment............................................................................................................. 6-12

FHWA NHI-10-025 Table of Contents MSE Walls and RSS – Vol II xxiv November 2009
Figure 6-6. Example abutment seat detail ............................................................................ 6-12 Figure 6-7. Design rules for a 2-tier superimposed MSE wall system................................. 6-14 Figure 6-8. Dimensioning of MSE wall with uneven reinforcement lengths....................... 6-17 Figure 6-9. Back–to–back MSE walls .................................................................................. 6-18 Figure 6-10. Generic cross-section of a shored MSE (SMSE) wall system for steep terrains
(Morrison et al., 2006) ....................................................................................... 6-19 Figure 6-11. Minimum recommended geometry of a shored MSE wall system in steep
terrains, (a) with extension of upper two rows of reinforcement, and (b) with the upper two rows connected to the shoring wall (Morrison et al., 2006) ....... 6-21
Figure 6-12. Location of potential failure surface for internal stability design of shored MSE walls (a) extensible reinforcements, (b) inextensible reinforcements (Morrison et al., 2006) ....................................................................................... 6-23
Figure 6-13. Distribution of stress from concentrated vertical load for internal and external stability calculations (Morrison et al., 2006) ..................................................... 6-23
Figure 6-14. Computation for TMAX and evaluation of pullout resistance (after Morrison et al., 2006) ............................................................................................................ 6-25
Figure 6-15. Example global stability and compound failure surfaces (Morrison et al., 2006) ................................................................................................................ 6-26
Figure 6-16. Minimum recommended geometry of a stable feature MSE (SFMSE) wall system ................................................................................................................ 6-28
Figure 7-1. Definition of heights for seismic analyses..................................................................7-3 Figure 7-2. Use of a slope stability approach to compute seismic earth pressure........................7-6 Figure 7-3. Procedure for determination of ky (Anderson et al., 2008)........................................7-7 Figure 7-4. Boundary between WUS and CEUS (Anderson et al. 2008) ...................................7-8 Figure 7-5. Seismic internal stability of a MSE wall............................................................ 7-10 Figure 7-6. Comparison of static and dynamic impact force with 1-inch (25 mm)
maximum displacement (Bligh et al., 2009)...................................................... 7-15

FHWA NHI-10-025 8 – Reinforced Soil Slopes MSE Walls and RSS – Vol II 8 – 1 November 2009
CHAPTER 8 REINFORCED SOIL SLOPES PROJECT EVALUATION
8.1 INTRODUCTION Where right of way is available and the cost of a MSE wall is high, a steepened slope should be considered. In this chapter the background and design requirements for evaluating a reinforced soil slope (RSS) alternative are reviewed. Step-by-step design procedures are presented in Chapter 9. Section 8.2 reviews the types of systems and the materials of construction. Section 8.3 provides a discussion of the internal stability design approach for use of reinforcement as compaction aids, steepening slopes and slope repair. Computer assisted design programs are also reviewed. The section concludes with a discussion of external stability requirements. Section 8.4 reviews the construction sequence. Section 8.5 covers treatment of the outward face of the slope to prevent erosion. Section 8.6 covers design details of appurtenant features including traffic barrier and drainage considerations. Finally, section 8.7 presents several case histories to demonstrate potential cost savings.
8.2 REINFORCED SOIL SLOPE SYSTEMS
8.2.1 Types of Systems Reinforced soil systems consist of planar reinforcements arranged in nearly horizontal planes in the reinforced fill to resist outward movement of the reinforced fill mass. Facing treatments ranging from vegetation to flexible armor systems are applied to prevent unraveling and sloughing of the face. These systems are generic in nature and can incorporate any of a variety of reinforcements and facing systems. Design assistance is often available through many of the reinforcement suppliers, which often have proprietary computer programs. This manual does not cover reinforcing the base section of an embankment for construction over soft soils, which is a different type reinforcement application. The user is referred to the FHWA Geosynthetics Design and Construction Guidelines (Holtz et al., 2008) for that application. An extension of this application is to lengthen reinforcement at the base of the embankment to improve the global stability of a reinforced soil slope. This application will be covered; however, steepening a slope significantly increases the potential for bearing capacity failure over soft soils and extensive geotechnical exploration along with rigorous analysis is required.

FHWA NHI-10-025 8 – Reinforced Soil Slopes MSE Walls and RSS – Vol II 8 – 2 November 2009
An alternate slope reinforcement technique, the “Deep Patch” method, is used for stabilizing and potentially repairing roadway fill slopes on secondary roads where removal and replacement are not feasible (e.g., in mountainous terrain). In this method, reinforcements (typically geogrids) are placed in the upper portion of the slope to essentially tie it back. An empirical design approach has been developed by the U.S. Department of Agriculture (USDA) Forest Service technology in partnership with FHWA Federal Lands Highway (Musser and Denning, 2005). The method is not explicitly included in the design sections of Chapters 8 and 9 as this approach is often considered as a temporary repair method to retard the movement of a slope until a more permanent solution can be implemented; however, a brief description of the method is included in Appendix F.
8.2.2 Construction Materials Reinforcement types. Reinforced soil slopes can be constructed with any of the reinforcements described in Chapter 2. While discrete strip type reinforcing elements can be used, a majority of the systems are constructed with continuous sheets of geosynthetics (i.e., geotextiles or geogrids) or wire mesh. Small, discrete micro reinforcing elements such as fibers, yarns, and microgrids located very close to each other have also been used. However, the design is based on more conventional unreinforced designs with cohesion added by the reinforcement (which is not covered in this manual). Reinforced Fill Requirements. Reinforced fill requirements for reinforced soil slopes are discussed in Chapter 3. Because a flexible facing (e.g. wrapped facing) is normally used, minor face distortion that may occur due to reinforced fill settlement, freezing and thawing, or wetting and drying can be tolerated. Thus, lower quality reinforced fill than recommended for MSE walls can be used. The recommended reinforced fill is limited to low-plasticity, granular material (i.e., PI ≤ 20 and ≤ 50 percent finer than a No. 200 US sieve {0.075 mm}). However, with good drainage, careful evaluation of soil and soil-reinforcement interaction characteristics, field construction control, and performance monitoring (see Chapter 11), most indigenous soil can be considered.
8.3 DESIGN APPROACH
8.3.1 Application Considerations As reviewed in Chapter 2, there are two main purposes for using reinforcement in slopes:
Improved stability for steepened slopes and slope repair.
Compaction aids, for support of construction equipment and improved face stability.

FHWA NHI-10-025 8 – Reinforced Soil Slopes MSE Walls and RSS – Vol II 8 – 3 November 2009
The design of reinforcement for safe, steep slopes requires a rigorous analysis. The design of reinforcement for this application is critical, as failure of the reinforcement would result in failure of the slope. The overall design requirements for reinforced slopes are similar to those for unreinforced slopes: A limit equilibrium, allowable stress approach is used and the factor of safety must be adequate for both the short-term and long-term conditions and for all possible modes of failure. LRFD methods have not been fully developed for either unreinforced or reinforced slopes and are thus not included in this manual. As illustrated in Figure 8-1, there are three failure modes for reinforced slopes:
Internal, where the failure plane passes through the reinforcing elements.
External, where the failure surface passes behind and underneath the reinforced zone.
Compound, where the failure surface passes behind and through the reinforced soil zone.
In some cases, the calculated stability safety factor can be approximately equal in two or all three modes, if the reinforcement strengths, lengths and vertical spacings are optimized (Berg et al., 1989).
Figure 8-1. Failure modes for reinforced soil slopes including internal failure within the reinforced soil zone, external failure entirely outside the reinforced soil zone, and compound failure starting behind and passing through the reinforced soil zone.

FHWA NHI-10-025 8 – Reinforced Soil Slopes MSE Walls and RSS – Vol II 8 – 4 November 2009
8.3.2 Design of Reinforcement for Compaction Aid For the use of geosynthetics as compaction aids, the design is relatively simple. Assuming the slope is safe without reinforcement, no reinforcement design is required. Place any geotextile or geogrid that will survive construction at every lift or every other lift of compacted soil in a continuous plane along the edge of the slope. Only narrow strips, about 4 to 6 ft (1.2 to 1.8 m) in width, at 8 to 18 in. (200 to 500 mm) vertical spacing are required. Where the slope angle approaches the angle of repose of the soil, it is recommended that a face stability analysis be performed using the method presented in the reinforcement design section of Chapter 9. Where reinforcement is required by analysis, the narrow strip reinforcement may be considered as secondary reinforcement used to improve compaction and stabilize the slope face between primary reinforcing layers.
8.3.3 Design of Reinforcement for Steepening Slopes and Slope Repair For steepened reinforced slopes (face inclination up to 70 degrees) and slope repair, design is based on modified versions of the classical limit equilibrium slope stability methods as shown in Figure 8-2:
Circular or wedge-type potential failure surface is assumed.
The relationship between driving and resisting forces or moments determines the slope factor of safety.
Reinforcement layers intersecting the potential failure surface are assumed to increase the resisting force or moment based on their tensile capacity and orientation. (Usually, the shear and bending strengths of stiff reinforcements are not taken into account.)
The tensile capacity of a reinforcement layer is taken as the minimum of its allowable pullout resistance behind (or in front of) the potential failure surface and its long-term allowable design strength, Tal.
As shown in Figure 8-1, a wide variety of potential failure surfaces must be considered, including deep-seated surfaces through or behind the reinforced zone. For the internal analysis, the critical slope stability factor of safety is taken from the internal unreinforced failure surface requiring the maximum reinforcement. This is the failure surface with the largest unbalanced driving moment to resisting moment and not the surface with the minimum calculated unreinforced factor of safety. This failure surface is equivalent to the critical reinforced failure surface with the lowest factor of safety. Detailed design of reinforced zone is performed by determining the factor of safety with successively modified reinforcement layouts until the target factor of safety is achieved. External and compound stability of the reinforced zone are then evaluated.

FHWA NHI-10-025 8 – Reinforced Soil Slopes MSE Walls and RSS – Vol II 8 – 5 November 2009
Figure 8-2. Modified limit equilibrium analysis for reinforced slope design. For slope repair applications, it is also very important to identify the cause of the original failure to make sure that the new reinforced soil slope will not have the same problems. If a water table or erratic water flows exist, particular attention has to be paid to drainage. In natural soils, it is also necessary to identify any weak seams that might affect stability. The method presented in this manual uses any conventional slope stability computer program and the steps necessary to manually calculate the reinforcement requirements for almost any condition. Figure 8-2 shows the conventional rotational slip surface method used in the analysis. Fairly complex conditions can be accommodated depending on the analytical method used (e.g., Modified Bishop, Spencer). The computer program ReSSA (ADAMA, 2001) was developed by the FHWA to specifically perform this analysis. The rotational slip surface approach is used for slopes up to 70 degrees, although technically it is a valid method for evaluating even steeper slopes. Slopes steeper than 70 degrees are defined as walls and lateral earth pressure procedures in Chapter 4 apply.

FHWA NHI-10-025 8 – Reinforced Soil Slopes MSE Walls and RSS – Vol II 8 – 6 November 2009
The assumed orientation of the reinforcement tensile force influences the calculated slope safety factor. In a conservative approach, the deformability of the reinforcements is not taken into account, and thus, the tensile forces per unit width of reinforcement Tr are assumed to always be in the horizontal direction of the reinforcements. When close to failure, however, the reinforcements may elongate along the failure surface, and an inclination from the horizontal can be considered. The above reinforcement orientations represent a simplifying assumption considering the reinforcement is not incorporated directly into the analysis of the slope. If a more rigorous evaluation is performed in which the vertical and horizontal components of the tension forces are included in the equations of equilibrium, then it can be shown that an increase in normal stress will occur for reinforcements with an orientation other than tangential to the failure surface (Wright and Duncan, 1990). In effect, this increase in normal stress will result in practically the same reinforcement influence on the safety factor whether it is assumed to act tangentially or horizontally. Although these equilibrium considerations may indicate that the horizontal assumption is conservative for discontinuous strip reinforcements, it should be recognized that the stress distribution near the point of intersection of the reinforcement and the failure surface is complicated. The conclusion concerning an increase in normal stress should only be considered for continuous and closely spaced reinforcements: it is questionable and should not be applied to reinforced slopes with widely spaced and/or discrete, strip type reinforcements. Tensile force direction is, therefore, dependent on the extensibility and continuity of the reinforcements used, and the following inclination is suggested:
Discrete, strip reinforcements: T parallel to the reinforcements.
Continuous, sheet reinforcements: T tangent to the sliding surface.
8.3.4 Computer-Assisted Design The ideal method for reinforced slope design is to use a conventional slope stability computer program that has been modified to account for the stabilizing effect of reinforcement. Such programs should account for reinforcement strength and pullout capacity, compute reinforced and unreinforced safety factors automatically, and have some searching routine to help locate critical surfaces. The method may also include the confinement effects of the reinforcement on the shear strength of the soil in the vicinity of the reinforcement.

FHWA NHI-10-025 8 – Reinforced Soil Slopes MSE Walls and RSS – Vol II 8 – 7 November 2009
A number of reinforced slope programs are commercially available, several of which follow the design approach detailed in Chapter 9 of this manual. As previously indicated the development of program ReSSA was initially sponsored by the FHWA. ReSSA implicitly contains the design approach in this manual, noted as the FHWA Bishop Method in the program’s rotational stability analysis section, and contains the previous version of this manual in the help screens. ReSSA also provides alternate methods of analysis and the help screens describe those methods in detail including a theoretical discussion of the approaches. FHWA does not exclude the use of other methods of analysis, especially those which are more comprehensive. However, the user must have a fundamental understanding of which design method(s) are being used and how the algorithms incorporate the reinforcement into the stability analysis, with some programs using simplifying assumptions, while others apply comprehensive formulation and correspondingly complicated computations. Appropriate factors of safety must then be applied to account for uncertainties of the analytical method and the geotechnical and reinforcement materials. Some of the less sophisticated programs do not design the reinforcement but allow for an evaluation of a given reinforcement layout. An iterative approach then follows to optimize either the reinforcement strength or layout. Many of these programs are limited to simple soil profiles and, in some cases, simple reinforcement layouts. Also, external stability evaluation may be limited to specific soil and reinforcement conditions and a single mode of failure. In some cases, these programs are reinforcement-specific.
With computerized analyses, the actual factor of safety value (FS) is dependent upon how the specific program accounts for the reinforcement tension in the moment equilibrium equation. The method of analysis in Chapter 9 and in FHWA Bishop method in ReSSa, as well as many others, assume the reinforcement force as contributing to the resisting moment, i.e.:
D
SRR M
RTMFS
(8-1)
where, FSR = the required stability factor of safety MR = resisting moment provided by the strength of the soil MD = driving moment about the center of the failure circle
TS = sum of tensile force per unit width of reinforcement (considering rupture and pullout) in all reinforcement layers intersecting the failure surface
R = the moment arm of TS about the center of failure circle as shown in Figure 8-2

FHWA NHI-10-025 8 – Reinforced Soil Slopes MSE Walls and RSS – Vol II 8 – 8 November 2009
With this assumption, FSR is applied to both the soil and the reinforcement as part of the analysis. As a result, the stability with respect to breakage of the reinforcement requires that the allowable reinforcement strength Tal from Chapter 3, equation 3-12 must be greater than or equal to the required maximum design tension Tmax for each reinforcement layer. Some computer programs use an assumption that the reinforcement force is a negative driving component, thus the FS is computed as:
RTM
MFS
SD
R
(8-2)
With this assumption, the stability factor of safety is not applied to TS. Therefore, the allowable design strength Tal should be computed as the ultimate tensile strength TULT divided by the required safety factor (i.e., target stability factor of safety) along with the
appropriate reduction factors RF in equation 8-12; i.e., Tal = TULT / (FSR RF). This provides
an equivalent factor of safety to equation 8-1, which is appropriate to account for uncertainty in material strengths and reduction factors. The method used to develop design charts should likewise be carefully evaluated to determine FS used to obtain the allowable reinforcement strength.
8.3.5 Evaluation of External Stability The external stability of reinforced soil slopes depends on the ability of the reinforced zone to act as a stable block and withstand all external loads without failure. Failure possibilities as shown in Figure 8-3 include wedge and block type sliding, deep-seated overall instability, local bearing capacity failure at the toe (lateral squeeze type failure), as well as excessive settlement from both short- and long-term conditions. The reinforced zone must be sufficiently wide at any level to resist wedge and block type sliding. To evaluate sliding stability, a wedge type failure surface defined by the limits of the reinforcement can be analyzed using the conventional sliding block method of analysis as detailed in the FHWA Soils and Foundations Workshop Reference Manual, (Samtani and Nowatzki, 2006). The computer program ReSSA incorporates wedge analysis of the reinforced system, using force equilibrium to analyze sliding both beyond and through the reinforced section. Conventional soil mechanics stability methods should also be used to evaluate the global stability of the reinforced soil zone. Both rotational and wedge type failure surfaces extending behind and below the structure should be considered. Care should be taken to

FHWA NHI-10-025 8 – Reinforced Soil Slopes MSE Walls and RSS – Vol II 8 – 9 November 2009
identify any weak soil layers in the retained fill and natural soils behind and/or foundation soil below the reinforced soil zone. Evaluation of potential seepage forces is especially critical for global stability analysis. Compound failure surfaces initiating externally and passing through or between reinforcement sections should also be evaluated, especially for complex slope or soil conditions. Extending the lengths of lower level reinforcements may improve the overall global stability, however, special considerations for the orientation of the reinforcement in the analysis must be considered based on the foundation conditions, as detailed in Chapter 9.
Figure 8-3. External failure modes for reinforced soil slopes.
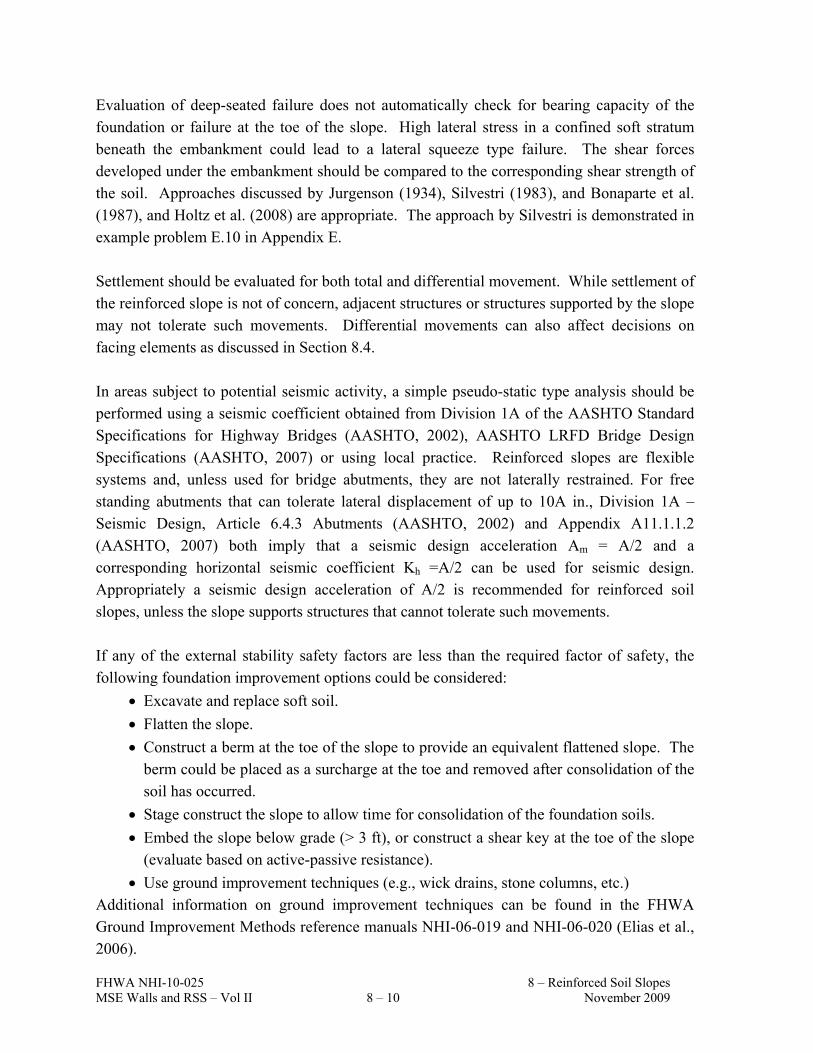
FHWA NHI-10-025 8 – Reinforced Soil Slopes MSE Walls and RSS – Vol II 8 – 10 November 2009
Evaluation of deep-seated failure does not automatically check for bearing capacity of the foundation or failure at the toe of the slope. High lateral stress in a confined soft stratum beneath the embankment could lead to a lateral squeeze type failure. The shear forces developed under the embankment should be compared to the corresponding shear strength of the soil. Approaches discussed by Jurgenson (1934), Silvestri (1983), and Bonaparte et al. (1987), and Holtz et al. (2008) are appropriate. The approach by Silvestri is demonstrated in example problem E.10 in Appendix E. Settlement should be evaluated for both total and differential movement. While settlement of the reinforced slope is not of concern, adjacent structures or structures supported by the slope may not tolerate such movements. Differential movements can also affect decisions on facing elements as discussed in Section 8.4. In areas subject to potential seismic activity, a simple pseudo-static type analysis should be performed using a seismic coefficient obtained from Division 1A of the AASHTO Standard Specifications for Highway Bridges (AASHTO, 2002), AASHTO LRFD Bridge Design Specifications (AASHTO, 2007) or using local practice. Reinforced slopes are flexible systems and, unless used for bridge abutments, they are not laterally restrained. For free standing abutments that can tolerate lateral displacement of up to 10A in., Division 1A – Seismic Design, Article 6.4.3 Abutments (AASHTO, 2002) and Appendix A11.1.1.2 (AASHTO, 2007) both imply that a seismic design acceleration Am = A/2 and a corresponding horizontal seismic coefficient Kh =A/2 can be used for seismic design. Appropriately a seismic design acceleration of A/2 is recommended for reinforced soil slopes, unless the slope supports structures that cannot tolerate such movements. If any of the external stability safety factors are less than the required factor of safety, the following foundation improvement options could be considered:
Excavate and replace soft soil.
Flatten the slope.
Construct a berm at the toe of the slope to provide an equivalent flattened slope. The berm could be placed as a surcharge at the toe and removed after consolidation of the soil has occurred.
Stage construct the slope to allow time for consolidation of the foundation soils.
Embed the slope below grade (> 3 ft), or construct a shear key at the toe of the slope (evaluate based on active-passive resistance).
Use ground improvement techniques (e.g., wick drains, stone columns, etc.) Additional information on ground improvement techniques can be found in the FHWA Ground Improvement Methods reference manuals NHI-06-019 and NHI-06-020 (Elias et al., 2006).

FHWA NHI-10-025 8 – Reinforced Soil Slopes MSE Walls and RSS – Vol II 8 – 11 November 2009
8.4 CONSTRUCTION SEQUENCE As the reinforcement layers are easily incorporated between the compacted lifts of fill, construction of reinforced slopes is very similar to normal slope construction. The elements of construction consist of simply:
1. Placing the soil 2. Placing the reinforcement 3. Constructing the face
The following is the usual construction sequence as shown in Figure 8-4:
Site Preparation - Clear and grub site. - Remove all slide debris (for slope reinstatement projects). - Prepare a level subgrade for placement of the first level of reinforcement. - Proof-roll subgrade at the base of the slope with a roller or rubber-tired
vehicle. - Observe and approve foundation prior to fill placement. - Place drainage features (e.g., basedrain and/or backdrain) as required.
Reinforcing Layer Placement - Reinforcement should be placed with the principal strength direction
perpendicular to the face of the slope. - Secure reinforcement with retaining pins to prevent movement during fill
placement. - A minimum overlap of 6 in. (150 mm) is recommended along the edges
perpendicular to the slope for wrapped face structures. Alternatively with grid reinforcement, the edges may be clipped or tied together. When reinforcements are not required for face support, no overlap is required and edges should be butted.
Reinforced fill Placement - Place fill to the required lift thickness on the reinforcement using a front end
loader or dozer operating on previously placed fill or natural ground. - Maintain a minimum of 6 in. (150 mm) of fill between the reinforcement and
the wheels or tracks of construction equipment.

FHWA NHI-10-025 8 – Reinforced Soil Slopes MSE Walls and RSS – Vol II 8 – 12 November 2009
Figure 8-4. Construction of reinforced soil slopes.

FHWA NHI-10-025 8 – Reinforced Soil Slopes MSE Walls and RSS – Vol II 8 – 13 November 2009
- Compact with a vibratory roller or plate type compactor for granular materials or a rubber-tired or smooth drum roller for cohesive materials.
- When placing and compacting the reinforced fill material, care should be taken to avoid any deformation or movement of the reinforcement.
- Use lightweight compaction equipment near the slope face with welded wire mesh systems to help maintain face alignment.
Compaction Control - Provide close control on the water content and density of the reinforced fill. It
should be compacted to at least 95 percent of the standard AASHTO T99 maximum density within 2 percent of optimum moisture.
- If the reinforced fill is a coarse aggregate, then a relative density or a method type compaction specification should be used.
Face Construction - Slope facing requirements will depend on soil type, slope angle and the
reinforcement spacing as shown in Table 8-1.
If slope facing is required to prevent sloughing (i.e., slope angle β is greater than soil)
or erosion, several options are available. Sufficient reinforcement lengths could be provided for wrapped faced structures. A face wrap may not be required for slopes up to about 1H:1V as indicated in Figure 8-4. In this case, the reinforcements (primary and secondary) can be simply extended to the face. For this option, a facing treatment as detailed under Section 8.5 Treatment of Outward Face, should be applied at sufficient intervals during construction to prevent face erosion. For wrapped or no wrap construction, the reinforcement should be maintained at close spacing (i.e., every lift or every other lift but no greater than 16 in. {400 mm}). For armored, hard faced systems the maximum spacing should be no greater than 32 in. (800 mm). A positive frictional or mechanical connection should be provided between the reinforcement and armored type facing systems.
The following procedures are recommended for wrapping the face. - Turn up reinforcement at the face of the slope and return the reinforcement a
minimum of 3 ft (1 m) into the embankment below the next reinforcement layer (see Figure 8-4).
- For steep slopes, formwork may be required to support the face during construction, improving compaction at the face and providing a smoother face finish. Welded wire mesh is often used as a face form (see Figure 8-5). The
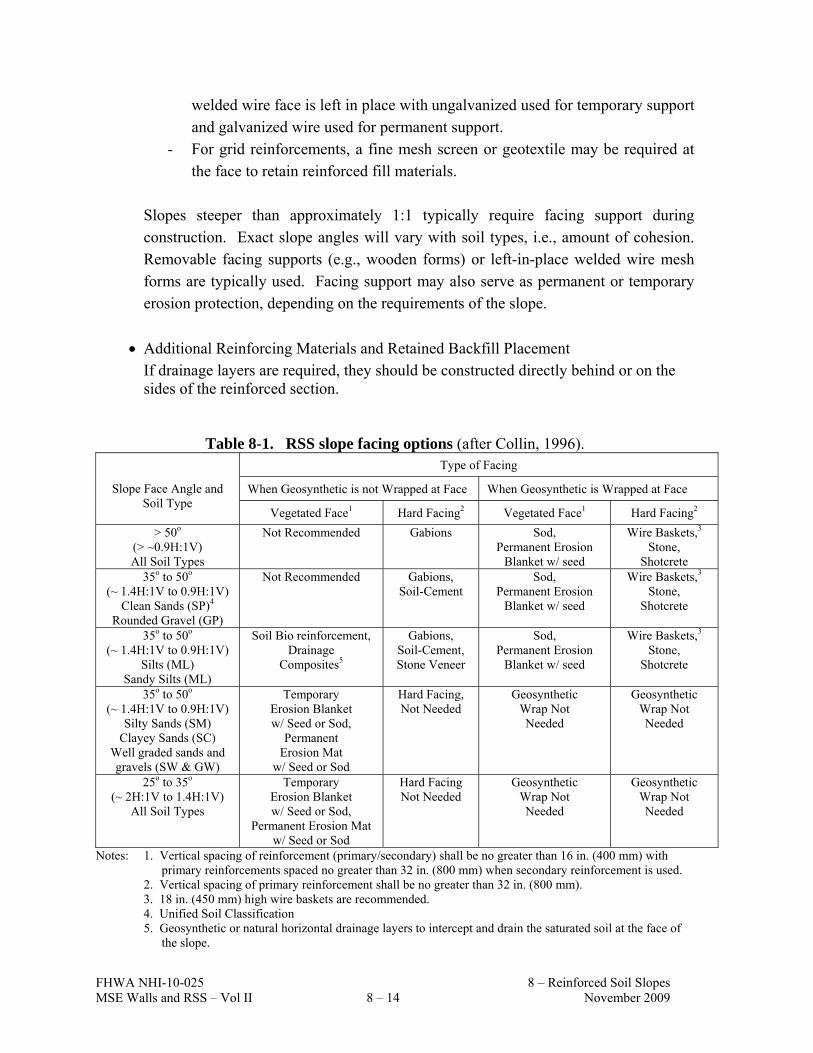
FHWA NHI-10-025 8 – Reinforced Soil Slopes MSE Walls and RSS – Vol II 8 – 14 November 2009
welded wire face is left in place with ungalvanized used for temporary support and galvanized wire used for permanent support.
- For grid reinforcements, a fine mesh screen or geotextile may be required at the face to retain reinforced fill materials.
Slopes steeper than approximately 1:1 typically require facing support during construction. Exact slope angles will vary with soil types, i.e., amount of cohesion. Removable facing supports (e.g., wooden forms) or left-in-place welded wire mesh forms are typically used. Facing support may also serve as permanent or temporary erosion protection, depending on the requirements of the slope.
Additional Reinforcing Materials and Retained Backfill Placement If drainage layers are required, they should be constructed directly behind or on the sides of the reinforced section.
Table 8-1. RSS slope facing options (after Collin, 1996). Type of Facing
When Geosynthetic is not Wrapped at Face When Geosynthetic is Wrapped at Face
Slope Face Angle and Soil Type
Vegetated Face1 Hard Facing2 Vegetated Face1 Hard Facing2
> 50o
(> ~0.9H:1V) All Soil Types
Not Recommended Gabions Sod, Permanent Erosion
Blanket w/ seed
Wire Baskets,3 Stone,
Shotcrete 35o to 50o
(~ 1.4H:1V to 0.9H:1V) Clean Sands (SP)4
Rounded Gravel (GP)
Not Recommended Gabions, Soil-Cement
Sod, Permanent Erosion
Blanket w/ seed
Wire Baskets,3 Stone,
Shotcrete
35o to 50o
(~ 1.4H:1V to 0.9H:1V) Silts (ML)
Sandy Silts (ML)
Soil Bio reinforcement, Drainage
Composites5
Gabions, Soil-Cement, Stone Veneer
Sod, Permanent Erosion
Blanket w/ seed
Wire Baskets,3 Stone,
Shotcrete
35o to 50o (~ 1.4H:1V to 0.9H:1V)
Silty Sands (SM) Clayey Sands (SC)
Well graded sands and gravels (SW & GW)
Temporary Erosion Blanket w/ Seed or Sod,
Permanent Erosion Mat
w/ Seed or Sod
Hard Facing, Not Needed
Geosynthetic Wrap Not Needed
Geosynthetic Wrap Not Needed
25o to 35o (~ 2H:1V to 1.4H:1V)
All Soil Types
Temporary Erosion Blanket w/ Seed or Sod,
Permanent Erosion Mat w/ Seed or Sod
Hard Facing Not Needed
Geosynthetic Wrap Not Needed
Geosynthetic Wrap Not Needed
Notes: 1. Vertical spacing of reinforcement (primary/secondary) shall be no greater than 16 in. (400 mm) with primary reinforcements spaced no greater than 32 in. (800 mm) when secondary reinforcement is used.
2. Vertical spacing of primary reinforcement shall be no greater than 32 in. (800 mm). 3. 18 in. (450 mm) high wire baskets are recommended. 4. Unified Soil Classification 5. Geosynthetic or natural horizontal drainage layers to intercept and drain the saturated soil at the face of
the slope.

FHWA NHI-10-025 8 – Reinforced Soil Slopes MSE Walls and RSS – Vol II 8 – 15 November 2009
A) B) Figure 8-5. Example of welded wire mesh detail for temporary (during construction) or
permanent face support showing a) smooth inclined face, and b) stepped face.
8.5 TREATMENT OF OUTWARD FACE
8.5.1 Grass Type Vegetation Stability of a slope can be threatened by erosion due to surface water runoff. Erosion control and revegetation measures must, therefore, be an integral part of all reinforced slope system designs and specifications. If not otherwise protected, reinforced slopes should be vegetated after construction to prevent or minimize erosion due to rainfall and runoff on the face. Vegetation requirements will vary by geographic and climatic conditions and are, therefore, project specific. For the unwrapped face (the soil surface exposed), erosion control measures are necessary to prevent raveling and sloughing of the face. A wrapped face helps reduce erosion problems; however, treatments are still required on the face to shade geosynthetic soil reinforcement and prevent ultraviolet light exposure that will degrade the geosynthetic over time. In either case, conventional vegetated facing treatments generally rely on low growth, grass type
AASHTO M288 Class 2 Geotextile Filter
Reinforcement
SEEDED TOPSOIL

FHWA NHI-10-025 8 – Reinforced Soil Slopes MSE Walls and RSS – Vol II 8 – 16 November 2009
vegetation with more costly flexible armor occasionally used where vegetation cannot be established. Due to the steep grades that can be achieved with reinforced soil slopes, it can be difficult to establish and maintain grass type vegetative cover. The steepness of the grade limits the amount of water absorbed by the soil before runoff occurs. Although root penetration should not affect the reinforcement, the reinforcement may restrict root growth, depending on the reinforcement type. This can have an adverse influence on the growth of some plants. Grass is also frequently ineffective where slopes are impacted by waterways. A synthetic (permanent) erosion control mat is normally used to improve the performance of grass cover. This mat must also be stabilized against ultra-violet light and should be inert to naturally occurring soil-born chemicals and bacteria. The erosion control mat serves to: 1) protect the bare soil face against erosion until the vegetation is established; 2) assist in reducing runoff velocity for increased water absorption by the soil, thus promoting long-term survival of the vegetative cover; and 3) reinforce the surficial root system of the vegetative cover. Once vegetation is established on the face, it must be protected to ensure long-term survival. Maintenance issues, such as mowing (if applicable), must also be carefully considered. The shorter, weaker root structure of most grasses may not provide adequate reinforcement and erosion protection. Grass is highly susceptible to fire, which can also destroy the synthetic erosion control mat. Downdrag from snow loads or upland slides may also strip matting and vegetation off the slope face. The low erosion tolerance combined with other factors previously mentioned creates a need to evaluate revegetation measures as an integral part of the design. Slope face protection should not be left to the construction contractor or vendor's discretion. Guidance should be obtained from maintenance and regional landscaping groups in the selection of the most appropriate low maintenance vegetation.
8.5.2 Soil Bioengineering (Woody Vegetation) An alternative to low growth, grass type vegetation is the use of soil bioengineering methods to establish hardier, woody type vegetation in the face of the slope (Sotir and Christopher, 2000). Soil bioengineering uses living vegetation purposely arranged and imbedded in the ground to prevent shallow mass movement and surficial erosion. However, the use of soil bioengineering in itself is limited to stable slope masses. Combining this highly erosive system with geosynthetic reinforcement produces a very durable, low maintenance structure with exceptional aesthetic and environmental qualities.
Appropriately applied, soil bioengineering offers a cost-effective and attractive approach for stabilizing slopes against erosion and shallow mass movement, capitalizing on the benefits and advantages that vegetation offers. The value of vegetation in civil engineering and the

FHWA NHI-10-025 8 – Reinforced Soil Slopes MSE Walls and RSS – Vol II 8 – 17 November 2009
role woody vegetation plays in the stabilization of slopes has gained considerable recognition in recent years (Gray and Sotir, 1995). Woody vegetation improves the hydrology and mechanical stability of slopes through root reinforcement and surface protection. The use of deeply-installed and rooted woody plant materials, purposely arranged and imbedded during slope construction offers:
Immediate erosion control for slopes; stream, and shoreline.
Improved face stability through mechanical reinforcement by roots.
Reduced maintenance costs, with less need to return to revegetate or cut grass.
Modification of soil moisture regimes through improved drainage and depletion of soil moisture and increase of soil suction by root uptake and transpiration.
Enhanced wildlife habitat and ecological diversity.
Improved aesthetic quality and naturalization. The biological and mechanical elements must be analyzed and designed to work together in an integrated and complementary manner to achieve the required project goals. In addition to using engineering principles to analyze and design the slope stabilization systems, plant science and horticulture are needed to select and establish the appropriate vegetation for root reinforcement, erosion control, aesthetics and the environment. Numerous areas of expertise must integrate to provide the knowledge and awareness required for success. RSS systems require knowledge of the mechanisms involving mass and surficial stability of slopes. Likewise when the vegetative aspects are appropriate to serve as reinforcements and drains, an understanding of the hydraulic and mechanical effects of slope vegetation is necessary. Figure 8-6 shows a cross section of the components of a vegetated reinforced slope (VRSS) system. The design details for face construction include vegetation selection, placement, and development as well as several agronomic and geotechnical design issues (Sotir and Christopher, 2000). Figure 8-6. Components of a
vegetated reinforced slope (VRSS) system.

FHWA NHI-10-025 8 – Reinforced Soil Slopes MSE Walls and RSS – Vol II 8 – 18 November 2009
Vegetation Selection The vegetation used in the VRSS system is typically in the form of live woody branch cuttings from species that root adventitiously or from bare root and/or container plants. Plant materials may be selected for a variety of tolerances including: drought, salt, flooding, fire, deposition, and shade. They may be chosen for their environmental wildlife value, water cleansing capabilities, flower, branch and leaf color or fruits. Other interests for selection may include size, form, rate of growth rooting characteristics and ease of propagation. Time of year for construction of a VRSS system also plays a critical roll in plant selection.
Vegetation Placement The decision to use native, naturalized or ornamental species is also an important consideration. The plant materials are placed on the frontal section of the formed terraces. Typically 6 to 12 in. (150 to 300 mm) protrude beyond the constructed terrace edge or finished face, and 1.5 to 10 ft (0.5 to 3 m) of the live branch cuttings (when used) are embedded in the reinforced fill behind, or as in the case of rooted plants, are placed 1 to 3 ft (0.3 to 1 m) into the reinforced fill. The process of plant installation is best and least expensive when it occurs simultaneously with the conventional construction activities, but may be incorporated later if necessary.
Vegetation Development Typically soil bioengineering VRSS systems offer immediate results from the surface erosion control structural/mechanical and hydraulic perspectives. Over time, (generally within the first year) they develop substantial top and root growth further enhancing those benefits, as well as providing aesthetic and environmental values.
Design Issues There are several agronomic and geotechnical design issues that must be considered, especially in relation to selection of geosynthetic reinforcement and type of vegetation. Considerations include root and top growth potential. The root growth potential consideration is important when face reinforcement enhancement is required. This will require a review of the vertical spacing based on the anticipated root growth for the specific type of plant. In addition to spacing, the type of reinforcements is also important. Open-mesh geogrid-type reinforcements, for example, are excellent as the roots will grow through the grid and further "knit" the system together. On the other hand, geocomposites, providing both reinforcement and lateral drainage, offer enhanced water and oxygen opportunities for the healthy development of the woody vegetation. Dependent upon the species selected, aspect,

FHWA NHI-10-025 8 – Reinforced Soil Slopes MSE Walls and RSS – Vol II 8 – 19 November 2009
climatic conditions, soils, etc., dense woody vegetation can provide ultraviolet light protection within the first growing season and maintain the cover thereafter.
In arid regions, geosynthetics that will promote moisture movement into the slope such as non-woven geotextiles or geocomposites may be preferred. Likewise, the need for water and nutrients in the slope to sustain and promote vegetative growth must be balanced against the desire to remove water so as to reduce hydrostatic pressures. Plants can be installed to promote drainage toward geosynthetic drainage net composites placed at the back of the reinforced soil section.
Organic matter is not required; however, a medium that provides nourishment for plant growth and development is necessary. As mentioned earlier, the agronomic needs must be balanced with the geotechnical requirements, but these are typically compatible. For both, a well-drained reinforced fill is needed. The plants also require sufficient fines to provide moisture and nutrients. While this may be a limitation, under most circumstances, some slight modifications in the specifications to allow for some non-plastic fines in the reinforced fill in the selected frontal zone offers a simple solution to this problem.
While many plants can be installed throughout the year, the most cost effective, highest rate of survival and best overall performance and function occurs when construction is planned around the dormant season for the plants, or just prior to the rainy season. This may require some specific construction coordination in relation to the placement of fill, and in some cases could preclude the use of a VRSS structure.
8.5.3 Armored A permanent facing such as gunite or emulsified asphalt may be applied to a geosynthetic reinforcement RSS slope face to provide long-term ultra-violet protection, if the geosynthetic UV resistance is not adequate for the life of the structure. Galvanized welded wire mesh reinforcement or facing or gabions may also be used to facilitate face construction and provide permanent facing systems.
Other armored facing elements may include riprap, stone veneer, articulating modular units, or fabric-formed concrete.
Structural elements. Structural facing elements (see MSE walls) may also be used, especially if discrete reinforcing elements such as metallic strips are used. These facing elements may include prefabricated concrete slabs, modular precast blocks, or precast slabs.

FHWA NHI-10-025 8 – Reinforced Soil Slopes MSE Walls and RSS – Vol II 8 – 20 November 2009
8.6 DESIGN DETAILS As with MSE wall projects, certain design details must often be considered that are not directly connected with internal or external stability evaluation. These important details include:
Guardrail and traffic barriers.
Drainage considerations.
Obstructions.
8.6.1 Guardrail and Traffic Barriers Guardrails are usually necessary for steeper highway embankment slopes. Guardrail posts usually can be installed in their standard manner (i.e. drilling or driving) through geosynthetic reinforcements. Special wedge shaped shoes can be used to facilitate installation. This does not significantly impair the overall strength of the geosynthetic and no adjustments in the design are required. Alternatively, post or concrete form tubes at post locations can be installed during construction. Either this procedure or cantilever type guardrail systems are generally used for metallic reinforcement. Impact traffic load on barriers constructed at the face of a reinforced soil slope is designed on the same basis as an unreinforced slope. The traffic barrier may be designed to resist the overturning moment in accordance with Article 2.7 in Division I of AASHTO Standard Specifications for Highway Bridges (AASHTO, 2002), Section 13 of AASHTO LRFD Bridge Design Specifications (AASHTO, 2007) or as addressed in the 2006 AASHTO Roadside Design Guide, and will be covered in detail in Chapter 9.
8.6.2 Drainage Considerations Uncontrolled subsurface water seepage can decrease stability of slopes and could ultimately result in slope failure.
Hydrostatic forces on the back of the reinforced zone will decrease stability against sliding failure.

FHWA NHI-10-025 8 – Reinforced Soil Slopes MSE Walls and RSS – Vol II 8 – 21 November 2009
Uncontrolled seepage into the reinforced zone will increase the weight of the reinforced mass and may decrease the shear strength of the soil, thus decreasing stability.
Seepage through the reinforced zone can reduce pullout capacity of the reinforcement at the face and increase soil weight, creating erosion and sloughing problems.
As a precaution, drainage features should be included unless detailed analysis proves that drainage is not required. Drains are typically placed at the rear of the reinforced soil zone to control subsurface water seepage as detailed in Chapter 9. Surface runoff should also be diverted at the top of the slope to prevent it from flowing over the face.
8.6.3 Obstructions If encountered in a design, guidance provided in Chapters 5 should be considered.
8.7 CASE HISTORIES The following case histories are presented to provide representative examples of cost-effective, successful reinforced slope projects. In several cases, instrumentation was used to confirm the performance of the structure. All project information was obtained from the indicated references which, in most cases, contain additional details.
8.7.1 The Dickey Lake Roadway Grade Improvement Project (Yarger and Barnes,1993) Dickey Lake is located in northern Montana approximately 25 miles (40 km) south of the Canadian border. Reconstruction of a portion of U.S. 93 around the shore of Dickey Lake required the use of an earth-retention system to maintain grade and alignment. The fill soils available in the area consist primarily of glacial till. Groundwater is active in the area. A slope stability factor of safety criteria of 1.5 was established for the embankments. A global stability analysis of reinforced concrete retaining walls to support the proposed embankment indicated a safety factor that was less than required. Analysis of a reinforced soil wall or slope indicated higher factors of safety. Based on an evaluation of several reinforcement systems, a decision was made to use a reinforced slope for construction of the embankment. The Montana Department of Transportation (MDT) decided that the embankment would not be designed “in-house,” due to their limited experience with this type of structure.

FHWA NHI-10-025 8 – Reinforced Soil Slopes MSE Walls and RSS – Vol II 8 – 22 November 2009
Proposals were solicited from a variety of suppliers, who were required to design the embankment. An outside consultant, experienced in geosynthetic reinforcement design, was retained to review all submittals. Plans and specifications for the geosynthetic reinforced embankments(s) were developed by MDT, with the plans indicating the desired finished geometry. The slopes generally ranged from 30 to 60 ft (9 to 18.3 m) in height. Face angles varied from 1.5H:1V to 0.84H:1V with the typical angle being 1H:1V. The chosen supplier provided a design that utilized both uniaxially and biaxially oriented geogrids. The resulting design called for primary reinforcing geogrids 15 to 60 ft (4.6 to 18.3 m) long and spaced 2 to 4 ft (0.6 to 1.2 m) vertically throughout the reinforced embankment. The ultimate strength of the primary reinforcement was on the order of 6850 lb/ft (100 kN/m). The length of primary reinforcement was partially dictated by global stability concerns. In addition, intermediate reinforcement consisting of lower strength, biaxial geogrids was provided in lengths of 5 ft (1.5 m) with a vertical spacing of 1 ft (0.3 m) at the face of slopes 1H:1V or flatter. Erosion protection on the 1H:1V or flatter sections was accomplished by using an organic erosion blanket. Steeper sections (maximum 0.84H:1V) used L-shaped, welded wire forms with a biaxial grid wrap behind the wire. A design evaluation of this project is presented in Chapter 9. The design also incorporated subsurface drainage. This drainage was judged to be particularly important due to springs or seeps present along the backslope of the embankment. The design incorporated geocomposite prefabricated drains placed along the backslope, draining into a French drain at the toe of the backslope. Laterals extending under the embankment were used to "daylight" the French drain. The project was constructed in 1989 at a cost of approximately $17/ft2 ($180/m2) of vertical face and has been periodically monitored by visual inspection and slope inclinometers. Project photos are shown in Figure 8-7. To date, the embankment performance has been satisfactory with no major problems observed. Some minor problems have been reported with respect to the erosion control measures and some minor differential movement in one of the lower sections of the embankment.

FHWA NHI-10-025 8 – Reinforced Soil Slopes MSE Walls and RSS – Vol II 8 – 23 November 2009
Figure 8-7. Dickey Lake site.

FHWA NHI-10-025 8 – Reinforced Soil Slopes MSE Walls and RSS – Vol II 8 – 24 November 2009
8.7.2 Salmon-Lost Trail Roadway Widening Project (Zornberg et al., 1995)
As part of a highway widening project in Idaho, the FHWA Western Federal Lands Highway Division designed and supervised the construction of a 565 ft long, 50 ft high (172 m long, 15.3 m high) permanent geosynthetic-reinforced slope to compare its performance with retaining structures along the same alignment. Widening of the original road was achieved by turning the original 2H:1V unreinforced slope into a 1H:1V reinforced slope. Aesthetics was an important consideration in the selection of the retaining structures along scenic Highway 93, which has been recognized by articles in National Geographic. A vegetated facing was, therefore, used for the reinforced slope section. On-site soil consisting of decomposed granite was used as the reinforced fill. An important factor in the design was to deal with water seepage from existing slope. Geotextile reinforcements with an in-plane transmissivity were selected to evaluate the potential of modifying the seepage regime in the slope. The geotextile-reinforced slope was designed in accordance with the guidelines presented in Chapters 8 and 9 of this manual. The final design consisted of two reinforced zones with a constant reinforcing spacing of 1 ft (0.3 m). The reinforcement in the lower zone had an ultimate tensile strength of 6,850 lb/ft (100 kN/m), and the reinforcement in the upper zone had a reinforcement strength of 1,370 lb/ft (20 kN/m). The reinforcement strength was reduced based on partial reduction factors which are reviewed in Chapter 3. Field tests were used to reduce the reduction factor for construction damage from the assumed value of 2.0 to the test value of 1.1 at a substantial savings to the project (40 percent reduction in reinforcement). The construction was completed in 1993 (see Figure 8-8 for project photos). The structure was constructed as an experimental features project and was instrumented with inclinometers within the reinforced zone, extensometers on the reinforcement, and piezometers within and at the back of the reinforced section. Survey monitoring was also performed during construction. Total lateral displacements recorded during construction were on the order of 0.1 to 0.2 percent of the height of the slope, with maximum strains in the reinforcement measured at only 0.2 percent. Post construction movement has not been observed within the accuracy of the instruments. These measurements indicate the excellent performance of the structure as well as the conservative nature of the design. Long-term monitoring is continuing. The steepened slope was constructed at a faster rate and proved more economical than the other retaining structures constructed along the same alignment. The constructed cost of the reinforced slope section was on the order of $15/ft2 ($160/m2) of vertical face. Metallic grid reinforced MSE wall costs in other areas of the site were on the order of $22/ft2 ($240/m2) of vertical face for similar or lower heights.

FHWA NHI-10-025 8 – Reinforced Soil Slopes MSE Walls and RSS – Vol II 8 – 25 November 2009
Figure 8-8. Salmon Lost Trail site.

FHWA NHI-10-025 8 – Reinforced Soil Slopes MSE Walls and RSS – Vol II 8 – 26 November 2009
8.7.3 Cannon Creek Alternate Embankment Construction Project (Hayden et al., 1991) A large embankment was planned to carry Arkansas State Highway 16 over Cannon Creek. The proposed 100,000 yd3 (77,000 m3) embankment had a maximum height of 75 ft (23 m) and was to be constructed with on-site clay soils and 2H:1V side slopes (with questionable stability). A cast-in-place concrete box culvert was first constructed to carry the creek under the embankment. Embankment construction commenced but was halted quickly when several small slope failures occurred. It then became apparent that the embankment fill could not be safely constructed at 2H:1V. With the box culvert in place, there were two options for continuation of embankment construction. A gravelly soil could be used for embankment fill, or the on-site soil could be used with geosynthetic reinforcement. Both options were bid as alternatives and the geosynthetic option was selected for construction (see Figure 8-9). The reinforcement used was a high-density polyethylene geogrid with a reported wide-width strength of 6850 lb/ft (100 kN/m). The geogrid reinforcement option was estimated to be $200,000 less expensive than the gravelly soil fill option. Figure 8-9. Cannon Creek project.

FHWA NHI-10-025 8 – Reinforced Soil Slopes MSE Walls and RSS – Vol II 8 – 27 November 2009
8.7.4 Pennsylvania SR 54 Roadway Repair Project (Wayne and Wilcosky, 1995)
During the winter of 1993 - 1994, a sinkhole formed in a section of State Route 54 in Pennsylvania. Further investigation revealed that an abandoned railroad tunnel had collapsed. The traditional repair would have involved the removal and replacement of the 50 ft (15 m) high embankment. The native soil, a sandy clay, was deemed an unsuitable reinforced fill due to its wet nature and potential stability and settlement problems with the embankment. Imported granular fill to replace the native soil was estimated to be $21/yd3 ($16/m3). Due to the high cost of replacement materials, the Pennsylvania Department of Transportation decided to use geosynthetics to provide drainage of the native soil and reinforce the side slopes. A polypropylene needlepunched nonwoven geotextile was selected to allow for pore pressure dissipation of the native soil during compaction, thus accelerating consolidation settlement and improving its strength. Field tests were used to confirm pore pressure response. With the geotextile placed at a compacted lift spacing of 1 ft (0.3 m), full pore pressure dissipation was achieved within approximately 4 days as compared with a minimum dissipation (approximately 25 percent) without the geosynthetic during the same time period. By placing the geotextile at 1 ft (0.3 m) lift intervals, the effective drainage path was reduced from the full height of the slope of 50 ft (15 m) to 0.5 ft (0.15 m) or by a factor of over 100. This meant that consolidation of the embankment would essentially be completed by the end of construction as opposed to waiting almost a year for completion of the settlement without the geosynthetic.
The geotextile, with an ultimate strength of 1100 lb/ft (16 kN/m) and placed at every lift 12 in. (0.3 m), also provided sufficient reinforcement to safely construct 1.5H:1V side slopes. Piezometers at the base and middle of the slope during construction confirmed the test pad results. Deformations of the geotextile in the side slope were also monitored and found to be less than the precision of the gages (± 1 percent strain). Project photos are shown in Figure 8-10 along with the measurements of pore pressure dissipation during construction. The contractor was paid on a time and material basis with the geotextile purchased by the agency and provided to the contractor for installation. The cost of the geotextile was
approximately $1/yd2 ($1.2/m2). In-place costs of the geotextile, along with the on-site fill
averaged just over $3/yd3 ($4/m3) for a total cost of $70,000, resulting in a savings of
approximately $200,000 over the select-fill alternative. Additional savings resulted from not having to remove the on-site soils from the project site.

FHWA NHI-10-025 8 – Reinforced Soil Slopes MSE Walls and RSS – Vol II 8 – 28 November 2009
Figure 8-10. Pennsylvania SR54.

FHWA NHI-10-025 8 – Reinforced Soil Slopes MSE Walls and RSS – Vol II 8 – 29 November 2009
PORE PRESSURE READINGS DURING CONSTRUCTION Figure 8-10. Pennsylvania SR54 continued. 8.7.5 Massachusetts Turnpike - Use of Soil Bioengineering (Sotir et al., 1998; Sotir and
Stulgis,1999)
The Massachusetts Turnpike in Charlton, Massachusetts is an example where a vegetated reinforced slope (VRSS) system was used to construct 1H:4V slopes to replace unstable 1.5H:1V slopes along a 500 ft (150 m) section of the Turnpike. This slope eroded for a number of years. The erosion was widening and threatening to move back into private property beyond the right-of-way. Eventually, the increased maintenance to clean up the sloughed material, the visual scar on the landscape and the threat of private property loss prompted the Turnpike Authority to seek a solution. The combined soil bioengineering and geosynthetic reinforcement approach was adopted to meet the narrow right-of-way requirement, assist in controlling internal drainage, and reconstruct an aesthetically pleasing and environmentally sound system that would blend into the natural landscape. The 10 to 60 ft (3 to 18 m) high 1H:4V slope was stabilized with layers of primary and secondary geogrids, erosion control blankets, brushlayers in the frontal geogrid wrapped portion of the face, and additional soil bioengineering treatments above the constructed slope.
-10
0
10
20
30
40
50
60
70
80
0 20 40 60 80
Tim e (days )
Po
re P
res
su
re (
kP
a)
1 kPa = 0.145 lb/ft2, 1 m = 3.28 ft

FHWA NHI-10-025 8 – Reinforced Soil Slopes MSE Walls and RSS – Vol II 8 – 30 November 2009
The design was essentially the same as the soil bioengineering cross section shown in Figure 8-6. The primary geogrid was designed to provide global, internal and compound stability to the slope. This grid extends approximately 20 ft (6.1 m) from the face to the back of the slope. The vertical spacing of the primary geogrid is 2 ft (0.6 m) and 4 ft (1.2 m), respectively, over the lower and upper halves of the slope. The face wrap extends approximately 3 ft (0.9 m) into the slope at the bottom of each vertical lift and 5 ft (1.5 m) at the top to form 3 ft (0.9 m) thick earthen terraces. Brushlayers consisting of 8 to 10 ft (2.4 m to 3 m) long willow (Salix sp.) and dogwood (Cornus sp.) live cut branches were placed on each constructed wrapped section at a vertical spacing of 1 ft (0.9 m), extending back to approximately the mid point of the slope. The branches and geogrids were sloped back to promote drainage to backdrains placed in the slopes while providing moisture for the plants. Live fascine bundles (see Figure 8-11) were installed above the reinforced slope in a 3H:1V cut section to prevent surface erosion and assist in revegetating that portion of the slope. The backdrain system consisted of 3.3 ft (1 m) wide geocomposite panels spaced 15 ft (4.6 m) on center. Design of the panels and spacing was based on the anticipated groundwater flow and surface infiltration conditions. The panels connect into a 1 ft (0.3 m) thick crushed-stone drainage layer at the base of the slope, which extends the full length and width of the slope. The reinforced fill soils consisted of granular borrow, ordinary borrow, 50/50 mix of ordinary granular fill and specified fill. The first three materials constitute the structurally competent core while the specified fill was placed at the face to provide a media amenable to plant growth. The specified fill consisted of fertilizers and a blend of four parts ordinary borrow to one part organic loam by volume and was used in the front 10 ft (3 m) of each lift for the installed brushlayers to optimize the growing conditions. This was a modification from the normal geotechnical specification to accommodate the soil bioengineering. The VRSS slope was constructed in the winter/spring of 1995/96 at a cost of US $25/ft2 ($270/m2) of vertical face. After the fourth growing season, the vegetated slope face was evaluated and found to perform as intended, initially protecting the surface from erosion while providing a pleasing aesthetic look (see Figure 8-11). Natural invasion from the surrounding plant community occurred, causing the system to blend into the naturally wooded scenic setting of the area and meeting the long-term aesthetic and ecological goals. Lessons Learned: In the future on similar projects, the use of more rooted plants rather than all live cut branches is recommended to provide greater diversity and to improve construction efficiency. Reducing the height of the wrapped earth terraces would allow for the vegetation to be more evenly distributed with less densities, and possibly using a preformed wire form in the front. These items would all reduce construction costs by improving efficiency.

FHWA NHI-10-025 8 – Reinforced Soil Slopes MSE Walls and RSS – Vol II 8 – 31 November 2009
Figure 8-11. Massachusetts Turnpike during construction, immediately after construction and the after the second growing season.

FHWA NHI-10-025 8 – Reinforced Soil Slopes MSE Walls and RSS – Vol II 8 – 32 November 2009
8.7.6 242 ft (74 m) High 1H:1V Reinforced Soil Slope for Airport Runway Extension (Lostumbo, 2009)
The tallest reinforced soil slope in North America as of this writing was constructed to extend the runway at Yeager Airport in Charleston, WV. Yeager Airport was constructed in the 1940’s atop mountainous terrain. Due to the mountainous conditions, the ground surface around the airport slopes down steeply over 300 ft (91 m) to the surrounding Elk and Kanawha Rivers, roadways, churches, houses and other structures. In order to meet recent FAA Safety Standards, updates to the airport runways required extending Runway 5 approximately 500 ft (150 m) to create an emergency stopping apron for airplanes. Construction options for extending the runway past the existing hillside included evaluation of bridge structures, retaining walls and reinforced slopes. Engineering evaluation indicated the reinforced slope provided the most cost effective and easiest constructed option. In addition, the vegetated facing of the completed slope will provide a structure that will blend into the surrounding green hills of Charleston, WV. The final design was a 242 ft (74 m) high, 1H:1V reinforced steepened slope (RSS). The design utilized polyester woven geogrid reinforcements with long term design strengths Tal of 2,970 lb/ft (43.4 kN/m), 3720 lb/ft (54.4 kN/m) and 3860 lb/ft (56.4 kN/m) as the primary reinforcement. The vertical spacing of the primary reinforcement was 1.5 ft (460 mm) in the lower portion of the slope and 3 ft (900 m) in the upper portion. The design embedment length of the primary reinforcement in the taller section of the slope ranged from 175 feet (53 m) at the bottom to 145 ft (44 m) at the top. The design also incorporated a geosynthetic drainage composite for drainage behind the reinforced zone along the back of the excavation to intercept and drain seepage water from the existing mountain side away from the reinforced zone. A geosynthetic erosion control mat was installed on the face of the slope at 2 ft (0.6 m) vertical intervals, with 3 foot (0.9 m)embedded into the slope face and 2.5 ft (0.76 m) down the face for facial stability and erosion protection. An open mesh biaxial geosynthetic specifically designed as a face wrap material was also used in the slope face. The RSS allowed for an economical solution and less complicated construction than the other, traditional methods that were considered. The reinforced slope was successfully completed and is performing as expected. The structure allowed the airport to meet recent FAA Safety Standards while creating an engineered structure that blends into the scenic green hills of Charleston, WV.

FHWA NHI-10-025 8 – Reinforced Soil Slopes MSE Walls and RSS – Vol II 8 – 33 November 2009
a) Early construction at the bottom of the slope. b) Slope face during construction.
c) Aerial photo of slope during construction, approximately d) Slope shortly after completion with early vegetation growth
80% complete.
Figure 8-12. Reinforced soil slope for runway extension at Yeager Airport, Charleston,
West Virginia.

FHWA NHI-10-025 8 – Reinforced Soil Slopes MSE Walls and RSS – Vol II 8 – 34 November 2009
8.8 STANDARD RSS DESIGNS RSS structures are customarily designed on a project-specific basis. Most agencies use a line-and-grade contracting approach, thus the contractor selected RSS vendor provides the detailed design after contract bid and award. This approach works well. However, in addition to agencies performing project specific designs, standard designs can be developed and implemented by an agency for RSS structures. Use of standard designs for RSS structures offers the following advantages over a line-and-grade approach: C Agency is more responsible for design details and integrating slope design with other
components. C Pre-evaluation and approval of materials and material combinations, as opposed to
evaluating contractor submittal post bid. C Economy of agency design versus vendor design/stamping of small reinforced slopes. C Agency makes design decisions versus vendors making design decisions. C More equitable bid environment as agency is responsible for design details, and vendors
are not making varying assumptions. C Filters out substandard work, systems and designs with associated approved product lists. The Minnesota Department of Transportation (Mn/DOT) developed and implemented (in-house) standardized RSS designs (Berg, 2000). The use of these standard designs are limited by geometric, subsurface and economic constraints. Structures outside of these constraints should be designed on a project-specific basis. The general approach used in developing these standards could be followed by other agencies to develop their own, agency-specific standard designs. Standardized designs require generic designs and generic materials. Generic designs require definition of slope geometry and surcharge loads, soil reinforcement strength, structure height limit, and slope facing treatment. As an example, the Mn/DOT standard designs address two geometric and surcharge loadings, two reinforced soil fills, and can be used for slopes up to 26.2 ft (8 m) in height. Three reinforcement long-term strengths, Tal, of 700, 1050 and 1400 lb/ft (10, 15 and 20 kN/m) are used in the standard designs, although a structure must use the same reinforcement throughout its height and length. Generic material properties used definitions of shear strength and unit weight of the reinforced fill, retained backfill and foundation soils applicable to the agency’s specifications and regional geology. Definition of generic material properties requires the development of approved product lists for soil reinforcements and face erosion control materials. A standard

FHWA NHI-10-025 8 – Reinforced Soil Slopes MSE Walls and RSS – Vol II 8 – 35 November 2009
face treatment is provided, however, it is footnoted with Develop site specific recommendations for highly shaded areas, highly visible urban applications, or in sensitive areas. An example design cross section and reinforcement layout table from the Mn/DOT standard designs is presented in Figure 8-13. Note that the Mn/DOT standard designs are not directly applicable to, nor should they be used by, other agencies.

FHWA NHI-10-025 8 – Reinforced Soil Slopes MSE Walls and RSS – Vol II 8 – 36 November 2009
Figure 8-13. Example of standard RSS design (Mn/DOT, 2008).

FHWA NHI-10-025 9 – Design of Reinforced Soil Slopes MSE Walls and RSS – Vol II 9 – 1 November 2009
CHAPTER 9 DESIGN OF REINFORCED SOIL SLOPES
9.1 INTRODUCTION This chapter provides step-by-step procedures for the design of reinforced soil slopes. Design and analysis of existing design using a computer program is also presented. The design approach principally assumes that the slope is to be constructed on a stable foundation. Recommendations for deep seated failure analysis are included. The user is referred to standard soil mechanics texts and FHWA Geosynthetics Design and Construction Guidelines (Holtz et al., 2008) in cases where the stability of the foundation is at issue. As indicated in Chapter 8, there are several approaches to the design of reinforced steepened slopes. The method presented in this chapter uses the classic rotational, limit equilibrium slope stability method as shown in Figure 8-2. As for the unreinforced case, a circular arc failure surface (not location) is assumed for the reinforced slope. This geometry provides a simple means of directly increasing the resistance to failure from the inclusion of reinforcement, is directly adaptable to most available conventional slope stability computer programs, and agrees well with experimental results. The reinforcement is represented by a concentrated force within the soil mass that intersects the potential failure surface. By adding the failure resistance provided by this force to the resistance already provided by the soil, a factor of safety equal to the rotational stability safety factor is inherently applied to the reinforcement. The tensile capacity of a reinforcement layer is taken as the minimum of its allowable pullout resistance behind the potential failure surface or its long-term allowable design strength. The slope stability factor of safety is taken from the critical surface requiring the maximum amount of reinforcement. Final design is performed by distributing the reinforcement over the height of the slope and evaluating the external stability of the reinforced section. The suitability of this design approach has been verified through extensive experimental evaluation by the FHWA including numerical analysis, centrifuge models, and full scale instrumented structures and found to be somewhat conservative. A chart solution developed for simplistic structures is provided as a check for the results. The method for evaluating a given reinforced soil profile is also presented. The flow chart in Figure 9-1 shows the steps required for design of reinforced soil slopes.

FHWA NHI-10-025 9 – Design of Reinforced Soil Slopes MSE Walls and RSS – Vol II 9 – 2 November 2009
Establish the geometric, loading, and performance requirements for design
Determine engineering properties of the in-situ soils
Determine properties of available fill
Evaluate design parameters for the reinforcement allowable reinforcement strength durability criteria soil-reinforcement interaction
Check unreinforced stability of the slope
Design reinforcement to provide stable slope strength spacing length
Extensible Inextensible
Check external stability
Sliding Deep Seated
Global
Local Bearing Capacity
Settlement Seismic
Evaluate requirements for subsurface and surface water control
Develop specifications and contract documents
Figure 9-1. Flow chart of steps for reinforced soil slope design.

FHWA NHI-10-025 9 – Design of Reinforced Soil Slopes MSE Walls and RSS – Vol II 9 – 3 November 2009
9.2 REINFORCED SLOPE DESIGN GUIDELINES The design steps outlined in the flow chart are as follows:
9.2.1 Step 1. Establish the geometric, loading, and performance requirements for design. a. Geometric and loading requirements (see Figure 9-2).
Slope height, H Slope angle, θ External (surcharge) loads:
- Surcharge load, q
- Temporary live load, ∆q
- Design seismic acceleration, Am (See Division 1A, AASHTO Standard Specifications for Highway Bridges {AASHTO, 2002} or AASHTO LRFD Bridge Design Specifications {AASHTO, 2007}).
Traffic Barrier - See article 2.7 of AASHTO Standard Specifications for Highway Bridges
(AASHTO, 2002), Section 13 of AASHTO LRFD Bridge Design Specifications (AASHTO, 2007), and AASHTO Roadside Design Guide (AASHTO, 2006).
b. Performance requirements.
External stability and settlement - Sliding: F.S. ≥ 1.3 - Deep seated (overall stability): F.S. ≥ 1.3 - Local bearing failure (lateral squeeze): F.S. ≥ 1.3 - Dynamic loading: F.S. ≥ 1.1 - Settlement-post construction magnitude and time rate based on project requirements
Compound failure: F.S. ≥ 1.3 Internal slope stability: F.S. ≥ 1.3
9.2.2 Step 2. Determine the engineering properties of the in-situ soils. (see recommendations in Chapter 2, Section 2.6 and Chapter 3, Section 3.2.2)
The foundation and retained soil (i.e., soil beneath and behind reinforced zone) profiles.
Strength parameters cu and u, or c´ and ´ for each soil layer.
Unit weights γwet and γdry. Consolidation parameters (Cc, Cr, cv and σ´p). Location of the groundwater table dw, and piezometric surfaces. For failure repair, identify location of previous failure surface and cause of failure.

FHWA NHI-10-025 9 – Design of Reinforced Soil Slopes MSE Walls and RSS – Vol II 9 – 4 November 2009
Figure 9-2. Requirements for design of reinforced soil slopes.
Notations: H = slope height
= slope angle
Tal = allowable strength of reinforcement L = length of reinforcement Sv = vertical spacing of reinforcement q = surcharge load
q = temporary live load
Ao = ground acceleration coefficient Am = design seismic acceleration dw = depth to ground water table in slope dwf = depth to ground water table in foundation
cu and u or cand = strength parameters for each soil layer
wet and dry = unit weights for each soil layer
Cc, Cr, cv and p = consolidation parameters for each soil layer

FHWA NHI-10-025 9 – Design of Reinforced Soil Slopes MSE Walls and RSS – Vol II 9 – 5 November 2009
9.2.3 Step 3. Determine the properties of reinforced fill and, if different, the retained backfill. (see recommendations in Chapter 3, Section 3.2)
Gradation and plasticity index Compaction characteristics based on 95% AASHTO T-99, γd and ±2% of optimum
moisture, wopt Compacted lift thickness
Shear strength parameters, cu, u or c´, and ´
Electro chemical properties of reinforced fill - For geosynthetic reinforcement: pH - For steel reinforcement: pH, resistivity, chlorides, sulfates, and organic content
9.2.4 Step 4. Evaluate design parameters for the reinforcement. (see recommendations
in Chapter 3, Section 3.5.)
Allowable geosynthetic strength (Eq. 3-12), Tal = ultimate strength (TULT) ÷ reduction
factor (RF) for creep, installation damage and durability:
For granular reinforced fill meeting the recommended gradation in Chapter 3, and electrochemical properties in Chapter 3, RF = 7 may be conservatively used for preliminary design and for routine, noncritical structures where the minimum test requirements outlined in Table 3-12 are satisfied. Remember, there is a significant
cost advantage in obtaining lower RF from test data supplied by the manufacture and/or from agency evaluation!
Allowable steel strength (Eq. 3-11), Tal = Fy Ac / b, where Ac is the area of the steel adjusted for corrosion. Note: Soils with higher fines are often more corrosive and
Table 3-3 property requirements must be carefully checked for the reinforced fill.
Pullout Resistance: (See recommendations in Chapter 3 and Appendix B) - Use F.S. = 1.5 for granular soils - Use F.S. = 2 for cohesive soils - Minimum anchorage length, Le, = 3 ft (1 m)
9.2.5 Step 5. Check unreinforced stability. (see discussion in Chapter 8) a. Evaluate unreinforced stability to determine: if reinforcement is required; critical nature
of the design (i.e., unreinforced F.S. ≤ or ≥ 1); potential deep-seated failure problems;

FHWA NHI-10-025 9 – Design of Reinforced Soil Slopes MSE Walls and RSS – Vol II 9 – 6 November 2009
and the extent of the reinforced zone. Perform a stability analysis using conventional stability methods (see FHWA Soils and Foundations Workshop Reference Manual {Samtani and Nowatzki, 2006}) to determine safety factors and driving moments for potential failure surfaces.
Use both circular-arc and sliding-wedge methods, and consider failure through the
toe, through the face (at several elevations), and deep-seated below the toe.
(A number of stability analysis computer programs are available for rapid evaluation, e.g., FHWA sponsored programs including ReSSA and the STABL family of programs developed at Purdue University including the current version, STABL4M. In all cases, a few calculations should be made by hand to be sure the computer program is giving reasonable results.)
b. Determine the size of the critical zone to be reinforced.
Examine the full range of potential failure surfaces found to have: Unreinforced safety factor, FSU ≤ Required safety factor, FSR.
Plot all of these surfaces on the cross-section of the slope. The surfaces that just meet the required safety factor roughly envelope the limits of
the critical zone to be reinforced as shown in Figure 9-3.
Figure 9-3. Critical zone defined by rotational and sliding surfaces that meets the required
safety factor.

FHWA NHI-10-025 9 – Design of Reinforced Soil Slopes MSE Walls and RSS – Vol II 9 – 7 November 2009
c. Critical failure surfaces extending below the toe of the slope are indications of deep foundation and edge bearing capacity problems that must be addressed prior to completing the design. Where foundation problems are indicated, a more extensive foundation analysis is warranted, and foundation improvement measures should be considered as discussed in Chapter 8.
9.2.6 Step 6. Design reinforcement to provide a stable slope. (see Figure 9-4, and discussion in Chapter 8.) a. Calculate the total reinforcement tension per unit width of slope TS required to obtain
the required factor of safety FSR for each potential failure surface inside the critical zone in step 5 that extends through or below the toe of the slope using the following:
D
MFSFST D
URS (9-1)
where: TS = the sum of the required tensile force per unit width of reinforcement
(considering rupture and pullout) in all reinforcement layers intersecting the failure surface
MD = driving moment about the center of the failure circle
D = the moment arm of TS about the center of failure circle = radius of circle R for continuous, sheet type extensible
reinforcement (i.e., assumed to act tangentially to the circle) = radius of circle R for continuous, sheet type inextensible
reinforcement (e.g., wire mesh reinforcement) to account for normal stress increase on adjacent soil
= vertical distance, Y, to the centroid of TS for discrete element, strip type reinforcement. Assume H/3 above slope base for preliminary calculations (i.e. assumed to act in a horizontal plane intersecting the failure surface at H/3 above the slope base)
FSU = unreinforced slope safety factor
FSR = target minimum slope factor of safety which is applied to both the soil and reinforcement
TS-MAX = the largest TS calculated and establishes the total design tension
Note: the minimum unreinforced safety factor usually does not control the location of TS-MAX; the most critical surface is the surface requiring the greatest amount of reinforcement strength.

FHWA NHI-10-025 9 – Design of Reinforced Soil Slopes MSE Walls and RSS – Vol II 9 – 8 November 2009
Figure 9-4. Rotational shear approach to determine required strength of reinforcement.

FHWA NHI-10-025 9 – Design of Reinforced Soil Slopes MSE Walls and RSS – Vol II 9 – 9 November 2009
b. Determine the total design tension per unit width of slope, TS-MAX, using the charts in Figure 9-5 and compare with TS-MAX from step 6a. If significantly different, check the validity of the charts based on the limiting assumptions listed in the figure and recheck calculations in steps 5 and equation 9-1.
Figure 9-5 is provided for a quick check of computer-generated results. The figure
presents a simplified method based on a two-part wedge type failure surface and is limited by the assumptions noted on the figure.
Note that Figure 9-5 is not intended to be a single design tool. Other design charts available from the literature could also be used (e.g., Ruegger, 1986; Leshchinsky and Boedeker, 1989; Jewell, 1990). As indicated in Chapter 8, several computer programs are also available for analyzing a slope with given reinforcement and can be used as a check. Judgment in selection of other appropriate design methods (i.e., most conservative or experience) is required.
c. Determine the distribution of reinforcement:
For low slopes (H ≤ 20 ft {6 m}) assume a uniform reinforcement distribution and use TS-MAX to determine spacing or the required tension TMAX requirements for each reinforcement layer.
For high slopes (H > 20 ft {6 m}), either a uniform reinforcement distribution may be used (preferable) or the slope may be divided into two (top and bottom) or three (top, middle, and bottom) reinforcement zones of equal height using a factored TS-MAX in each zone for spacing or design tension requirements (see Figure 9-6). The total required tension in each zone is found from:
For 1 zone:
Use TS-MAX For 2 zones:
TBottom = 3/4 TS-MAX (9-2) TTop = 1/4 TS-MAX (9-3)
For 3 zones: TBottom = 1/2 TS-MAX (9-4) TMiddle = 1/3 TS-MAX (9-5) TTop = 1/6 TS-MAX (9-6)
The force is assumed to be uniformly distributed over the entire zone.

FHWA NHI-10-025 9 – Design of Reinforced Soil Slopes MSE Walls and RSS – Vol II 9 – 10 November 2009
CHART PROCEDURE:
1) Determine force coefficient K from figure above, where r = friction angle of reinforced fill:
R
r1f FR
tantan
2) Determine: TS-MAX = 0.5 K γr (H’)2
where: H' = H + q/γr q = a uniform load
3) Determine the required reinforcement length at the top LT and bottom LB of the slope from the figure above.
LIMITING ASSUMPTIONS ● Extensible reinforcement ● Slopes constructed with uniform, cohesionless soil, c = 0) ● No pore pressures within slope ● Competent, level foundation soils ● No seismic forces ● Uniform surcharge not greater than 0.2 γr H
● Relatively high soil/reinforcement interface friction angle, sg = 0.9 r (may not be appropriate for some geosynthetics)
Figure 9-5. Chart solution for determining the reinforcement strength requirements (after Schmertmann et. al., 1987). NOTE: Charts © The Tensar Corporation

FHWA NHI-10-025 9 – Design of Reinforced Soil Slopes MSE Walls and RSS – Vol II 9 – 11 November 2009
Figure 9-6. Reinforcement spacing considerations for high slopes.
32 in. (800 mm)
4 ft (1,2 m)16 in. (400 mm)
4 ft (1,2 m)

FHWA NHI-10-025 9 – Design of Reinforced Soil Slopes MSE Walls and RSS – Vol II 9 – 12 November 2009
d. Determine reinforcement vertical spacing Sv or the maximum design tension TMAX requirements for each reinforcement layer.
For each zone, calculate TMAX for each reinforcing layer in that zone based on an
assumed Sv or, if the allowable reinforcement strength is known, calculate the minimum vertical spacing and number of reinforcing layers N required for each zone based on:
calzone
zone
vzonemax RT
N
T
H
STT (9-7)
where: Rc = coverage ratio of the reinforcement which equals the width of
the reinforcement b divided by the horizontal spacing Sh
Sv = vertical spacing of reinforcement in meters; multiples of compacted layer thickness for ease of construction
Tzone = maximum reinforcement tension required for each zone
= TS-MAX for low slopes (H< 6m)
Tal = Tult /RF (see Chapter 3 and equation 3-12)
Hzone = height of zone
= Ttop, Tmiddle, and TBottom for high slopes (H > 20 ft {6 m})
N = number of reinforcement layers
Use short 4 to 6.5 ft (1.2 to 2 m) lengths of intermediate reinforcement layers to maintain a maximum vertical spacing of 16 in. (400 mm) or less for face stability and compaction quality (see Figure 9-6b).
- For slopes flatter than 1H:1V, closer spaced reinforcements (i.e., every lift or
every other lift, but no greater than 16 in. {400 mm}) preclude having to wrap the face in well graded soils (e.g., sandy gravel and silty and clayey sands). Wrapped faces are required for steeper slopes and uniformly graded soils to prevent face sloughing. Alternative vertical spacings could be used to prevent face sloughing, but in these cases a face stability analysis should be performed either using the method presented in this chapter or by evaluating the face as an infinite slope using (Collin, 1996):

FHWA NHI-10-025 9 – Design of Reinforced Soil Slopes MSE Walls and RSS – Vol II 9 – 13 November 2009
sinβcosβzHγ
φtanβsinsinβcosβFφ'tanβcoszHγγHc'F.S.
g
2g
2wg
(9-8)
where: c = effective cohesion
= effective friction angle
γg = saturated unit weight of soil γw = unit weight of water z = vertical depth to failure plane defined by the depth of saturation H = vertical slope height β = slope angle Fg = summation of geosynthetic resisting force
- Intermediate reinforcement should be placed in continuous layers and needs not
be as strong as the primary reinforcement, but it must be strong enough to survive construction (e.g. minimum survivability requirements for geotextiles in road stabilization applications in AASHTO M-288, 2006) and provide localized tensile reinforcement to the surficial soils.
- If the interface friction angle of the intermediate reinforcement ρsr (from ASTM
D 5321 or estimated as discussed in Chapter 3, Section 3.4.3) is less than that of the primary reinforcement ρr, then ρsr should be used in the analysis for the portion of the failure surface intersecting the reinforced soil zone.
e. To ensure that the rule-of-thumb reinforcement force distribution is adequate for critical
or complex structures, recalculate TS using equation 9-1 to determine potential failure above each layer of primary reinforcement.
f. Determine the reinforcement lengths required:
The embedment length Le of each reinforcement layer beyond the most critical sliding surface (i.e., circle found for TS-MAX) must be sufficient to provide adequate pullout resistance based on:
CRσ'α*F
FSTL
cv
maxe (9-9)
where F*, α , Rc, C and σ́v are defined in Chapter 3, Section 3.4.

FHWA NHI-10-025 9 – Design of Reinforced Soil Slopes MSE Walls and RSS – Vol II 9 – 14 November 2009
Minimum value of Le is 3 ft (1 m). For cohesive soils, check Le for both short- and long-term pullout conditions, when using the semi empirical equations in Chapter 3 to obtain F*.
For long-term design, use r with cr = 0
For short-term evaluation, conservatively use r with cr = 0 from consolidated
undrained triaxial or direct shear tests or run pullout tests
Plot the reinforcement lengths as obtained from the pullout evaluation on a slope cross section containing the rough limits of the critical zone determined in step 5 (see Figure 9-7).
- The length required for sliding stability at the base will generally control the
length of the lower reinforcement levels.
- Lower layer lengths must extend at least to the limits of the critical zone as shown in Figure 9-7. Longer reinforcements may be required to resolve deep seated failure problems (see step 7).
- Upper levels of reinforcement may not be required to extend to the limits of the
critical zone, provided sufficient reinforcement exists in the lower levels to provide the FSR for all circles within the critical zone as shown in Figure 9-7.
Check that the sum of the reinforcement forces passing through each failure surface
is greater than Ts required for that surface.
- Only count reinforcement that extends 3 ft (1 m) beyond the surface to account for pullout resistance.
- If the available reinforcement force is not sufficient, increase the length of
reinforcement not passing through the surface or increase the strength of lower-level reinforcement.
Simplify the layout by lengthening some reinforcement layers to create two or three
sections of equal reinforcement length for ease of construction and inspection. Reinforcement layers do not generally need to extend to the limits of the critical
zone, except for the lowest levels of each reinforcement section.

FHWA NHI-10-025 9 – Design of Reinforced Soil Slopes MSE Walls and RSS – Vol II 9 – 15 November 2009
Check the length obtained using chart b in Figure 9-5. Note: Le is already included
in the total length, Lt and LB from chart B. g. Check design lengths of complex designs.
When checking a design that has zones of different reinforcement length, lower zones may be over reinforced to provide reduced lengths of upper reinforcement levels.
In evaluating the length requirements for such cases, the pullout stability for the
reinforcement must be carefully checked in each zone for the critical surfaces exiting at the base of each length zone.
Figure 9-7. Developing reinforcement lengths.
Le from pullout 4 ft (1.2 m)

FHWA NHI-10-025 9 – Design of Reinforced Soil Slopes MSE Walls and RSS – Vol II 9 – 16 November 2009
9.2.7 Step 7. Check external stability. (see discussion in Chapter 8.)
Sliding resistance (Figure 9-8)
- Evaluate the width of the reinforced soil zone at any level to resist sliding along the reinforcement. Use a two-part wedge type failure surface defined by the limits of the reinforcement (the length of the reinforcement at the depth of evaluation defined in step 5). The analysis can best be performed using a computerized method which takes into account all soil strata and interface friction values. If the computer program does not account for the presents of
reinforcement, the back of the failure surface should be angled at 45 + /2 or
parallel to the back of the reinforced zone, whichever is flatter (i.e., the wedge should not pass through layers of reinforcement to avoid an overly conservative analysis). The frictional resistance provided by the weakest layer, either the reinforced soil, the foundation soil or the soil-reinforcement interface, should be used in the analysis.
A simple analysis using Figure 9-5b can be performed as a quick check, but
should not be used for the primary analysis due to the limiting assumptions noted on the figure. The method also assumes that the reinforcement layers are truncated along a plane parallel to the slope face, which may or may not be the case. The analysis was based on a two-part wedge model to predict LB assuming that the reinforcement interface is the weakest plane. A reduction is
applied to the interface friction angle, sg = 0.9 r, which may not be appropriate
for some geosynthetics. The frictional resistance provided by the weakest layer in contact with the geosynthetic, either the reinforced soil or the foundation soil, should be used in the analysis.
Deep seated global stability (Figure 9-8a).
- Evaluate potential deep-seated failure surfaces behind the reinforced soil zone
to provide:
1.3M
MF.S.
D
R minimum (9-14)
Note: F.S. 1.3 is recommended as a minimum and that value should be
increased based on the criticality of the slope (e.g., slopes beneath bridge abutments and major roadways) and/or confidence in geotechnical conditions (e.g., soil properties and location of groundwater).

FHWA NHI-10-025 9 – Design of Reinforced Soil Slopes MSE Walls and RSS – Vol II 9 – 17 November 2009
The analysis performed in step 5 should provide the factor of safety for failure surfaces behind the reinforced soil zone. However, as a check, classical rotational slope stability methods such as simplified Bishop, Morgenstern and Price, Spencer, or others may be used (see FHWA’s Ground Improvement Manuals, FHWA NHI-06-019 and FHWA NHI-06-020 {Elias et al., 2006}). Appropriate computer programs also may be used.
Figure 9-8. Failure through the foundation.

FHWA NHI-10-025 9 – Design of Reinforced Soil Slopes MSE Walls and RSS – Vol II 9 – 18 November 2009
Local bearing failure at the toe (lateral squeeze) (Figure 9-8b).
- If a weak soil layer exists beneath the embankment to a limited depth DS which is less than the width of the slope b', the factor of safety against failure by squeezing may be calculated from (Silvestri, 1983):
1.3γH
c4.14
tanθDγ
c2FS u
s
usqueezing (9-15)
where: θ = angle of slope γ = unit weight of soil in slope Ds = depth of soft soil beneath slope base of the embankment H = height of slope cu = undrained shear strength of soft soil beneath slope
Caution is advised and rigorous analysis (e.g., numerical modeling) should be performed when FS < 2. This approach is somewhat conservative as it does not provide any influence from the reinforcement. When the depth of the soft layer, DS, is greater than the slope base width, b', general slope stability will govern design.
Foundation settlement.
- Determine the magnitude and rate of total and differential foundation
settlements using classical geotechnical engineering procedures (see FHWA Soils and Foundations Workshop Reference Manual, {Samtani and Nowatzki, 2006}).
9.2.8 Step 8. Seismic stability.
Dynamic stability (Figure 9-9). - Perform a pseudo-static type analysis using a seismic ground coefficient A,
obtained from local building code and a design seismic acceleration Am equal to Am = A/2. Reinforced soil slopes are clearly yielding type structures, more so than walls. As such, Am can be taken as A/2 as allowed by AASHTO in Division 1A-Seismic Design, 6.4.3 Abutments (AASHTO, 2002) and Appendix A11.1.1.2 (AASHTO, 2007)
F.S. dynamic ≥ 1.1
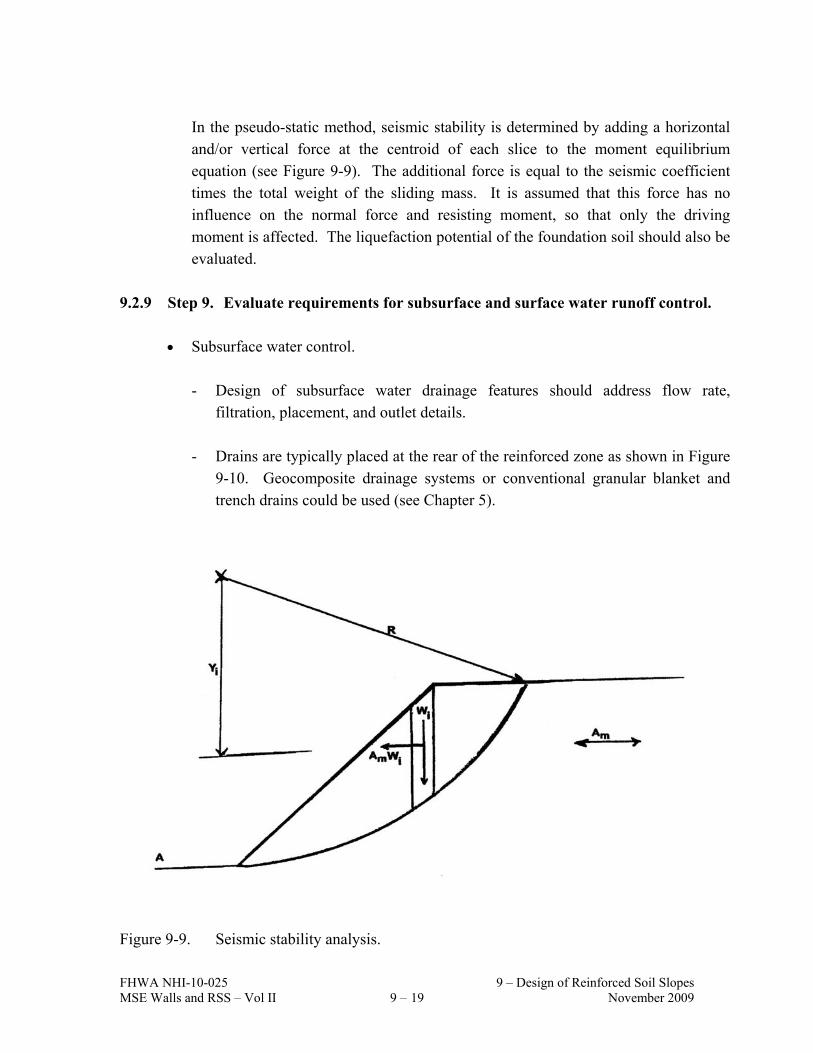
FHWA NHI-10-025 9 – Design of Reinforced Soil Slopes MSE Walls and RSS – Vol II 9 – 19 November 2009
In the pseudo-static method, seismic stability is determined by adding a horizontal and/or vertical force at the centroid of each slice to the moment equilibrium equation (see Figure 9-9). The additional force is equal to the seismic coefficient times the total weight of the sliding mass. It is assumed that this force has no influence on the normal force and resisting moment, so that only the driving moment is affected. The liquefaction potential of the foundation soil should also be evaluated.
9.2.9 Step 9. Evaluate requirements for subsurface and surface water runoff control.
Subsurface water control.
- Design of subsurface water drainage features should address flow rate, filtration, placement, and outlet details.
- Drains are typically placed at the rear of the reinforced zone as shown in Figure
9-10. Geocomposite drainage systems or conventional granular blanket and trench drains could be used (see Chapter 5).
Figure 9-9. Seismic stability analysis.

FHWA NHI-10-025 9 – Design of Reinforced Soil Slopes MSE Walls and RSS – Vol II 9 – 20 November 2009
Figure 9-10. Subsurface drainage considerations.
0.2 ft (0.6 m) TYP
0.2 ft (0.6 m) TYP
FHWA NHI-10-025 9 – Design of Reinforced Soil Slopes MSE Walls and RSS – Vol II 9 – 21 November 2009
- Lateral spacing of outlets is dictated by site geometry, estimated flow, and existing agency standards. Outlet design should address long-term performance and maintenance requirements.
- Geosynthetic drainage composites can be used in subsurface water drainage
design. Drainage composites should be designed with consideration of:
o Geotextile filtration/clogging
o Long-term compressive strength of polymeric core
o Reduction of flow capacity due to intrusion of geotextile into the core
o Long-term inflow/outflow capacity
Procedures for checking geotextile permeability and filtration/clogging criteria were presented in FHWA Geosynthetic Design and Construction Guidelines (Holtz et al., 2008). Long-term compressive stress and eccentric loadings on the core of a geocomposite should be considered during design and selection. Though not yet addressed in standardized test methods or standards of practice, the following criteria are suggested for addressing core compression. The design pressure on a geocomposite core should be limited to either:
o the maximum pressure sustained on the core in a test of 10,000 hours
minimum duration
o the crushing pressure of a core, as defined with a quick loading test, divided by a factor of safety of 5
Note that crushing pressure can only be defined for some core types. For cases where a crushing pressure cannot be defined, suitability should be based on the maximum load resulting in a residual thickness of the core adequate to provide the required flow after 10,000 hours, or the maximum load resulting in a residual thickness of the core adequate to provide the required flow as defined with the quick loading test divided by a factor of safety of 5.
Intrusion of the geotextiles into the core and long-term outflow capacity should be measured with a sustained transmissivity test. The ASTM D4716 test procedure Constant Head Hydraulic Transmissivity of Geotextiles and Geotextile Related Products, should be followed. The test procedure should be modified for sustained testing and for use of sand sub-stratum and super-stratum

FHWA NHI-10-025 9 – Design of Reinforced Soil Slopes MSE Walls and RSS – Vol II 9 – 22 November 2009
in lieu of closed cell foam rubber. Load should be maintained for 100 hours or until equilibrium is reached, whichever is greater.
- Slope stability analyses should account for interface shear strength along a
geocomposite drain. The geocomposite/soil interface will most likely have a friction value that is lower than that of the soil. Thus, a potential failure surface may be induced along the interface.
- Geotextile reinforcements (primary and intermediate layers) must be more
permeable than the reinforced fill material to prevent a hydraulic build up above the geotextile layers during precipitation.
Special emphasis on the design and construction of subsurface drainage features is recommended for structures where drainage is critical for maintaining slope stability. Redundancy in the drainage system is also recommended for these cases.
Surface water runoff.
- Surface water runoff should be collected above the reinforced slope and
channeled or piped below the base of the slope. Standard Agency drainage details should be utilized.
- Wrapped faces and/or intermediate layers of secondary reinforcement may be
required at the face of reinforced slopes to prevent local sloughing. Guidance is provided in Chapter 8 and Table 8-1. Intermediate layers of reinforcement help achieve compaction at the face, thus increasing soil shear strength and erosion resistance. These layers also act as reinforcement against shallow or sloughing types of slope failures. Intermediate reinforcement is typically placed on each or every other soil lift, except at lifts where primary structural reinforcement is placed. Intermediate reinforcement also is placed horizontally, adjacent to primary reinforcement, and at the same elevation as the primary reinforcement when primary reinforcement is placed at less than 100 percent coverage in plan view. The intermediate reinforcement should extend 4 to 6.5 ft (1.2 to 2 m) back into the fill from the face.
- Select a long-term facing system to prevent or minimize erosion due to rainfall
and runoff on the face.

FHWA NHI-10-025 9 – Design of Reinforced Soil Slopes MSE Walls and RSS – Vol II 9 – 23 November 2009
- Calculate flow-induced tractive shear stress on the face of the reinforced slope by:
λ = d · γW · s (9-16)
where: λ = tractive shear stress, psf (kPa)
d = depth of water flow, ft (m) γw = unit weight of water, lbs/ft3 (kN/m3) s = the vertical to horizontal angle of slope face, ft/ft (m/m)
For λ < 2 psf (100 Pa), consider vegetation with temporary or permanent erosion control mat For λ > 2 psf (100 Pa), consider vegetation with permanent erosion control mat or other armor type systems (e.g., riprap, gunite, prefab modular units, fabric-formed concrete, etc.)
- Select vegetation based on local horticultural and agronomic considerations and
maintenance. - Select a synthetic (permanent) erosion control mat that is stabilized against
ultra-violet light and is inert to naturally occurring soil-born chemicals and bacteria. Erosion control mats and blankets vary widely in type, cost, and, more importantly, applicability to project conditions. Slope protection should not be left to the construction contractor or vendor's discretion. Guideline material specifications for synthetic permanent erosion control mats are provided in Chapter 10.
9.3 COMPUTER ASSISTED DESIGN An alternative to reinforcement design (step 6 in the previous section) is to develop a trial layout of reinforcement and analyze the reinforced slope with a computer program such as the FHWA ReSSA program. Layout includes number, length, design strength, and vertical distribution of the geosynthetic reinforcement. The charts presented in Figure 9-5 provide a method for generating a preliminary layout. Note that these charts were developed with the specific assumptions noted on the figure.

FHWA NHI-10-025 9 – Design of Reinforced Soil Slopes MSE Walls and RSS – Vol II 9 – 24 November 2009
Analyze the reinforced soil slope with the trial geosynthetic reinforcement layouts. The most
economical reinforcement layout must provide the minimum required stability safety factors for internal, external, and compound failure planes. A contour plot of lowest safety factor values about the trial failure circle centroids is recommended to map and locate the minimum safety factor values for the three modes of failure. The method of analysis in section 9.2 assumes that the reinforcing force contributed to the resisting moment and thus inherently applies the required factor of safety to the reinforcement. However, some computer programs (and design charts) are based on the assumption that the reinforcement force reduces the driving moment with the stability factor of safety FS calculated as:
DTM
MFS
sD
R
(9-17)
With this assumption, the stability factory of safety is not applied to the reinforcement. For such computations and any other methods not applying a factor of safety to the reinforcement, the allowable strength of the reinforcement Tal must be divided by a required minimum factor of safety FSR = 1.3 to provide an equivalent material uncertainty. External stability analysis as was previously shown in step 7 will include an evaluation of local bearing capacity, foundation settlement, and dynamic stability.
9.4 PROJECT COST ESTIMATES Cost estimates for reinforced slope systems are generally per square foot of vertical face. Table 9-1 can be used to develop a cost estimate. As an example, the following provides a cost estimate for the 6.5 ft (5 m) high reinforced slope design Example E.8. Considering the 12 layers of reinforcement at a length of 16 ft (4.9 m), the reinforced section would require a total reinforcement of 192 ft2 per ft (60 m2 per meter) length of embankment or 12 ft2 per vertical ft of height (12 m2 per vertical meter of height). Adding 10 to 15 percent for overlaps and overages results in an anticipated reinforcement quantity of 13.5 ft2 per ft (13.5 m2 per meter embankment height). Based on the cost information from suppliers, reinforcement with an allowable strength Ta ≥ 280 lb/ft (4.14 kN/m) would cost on the order of $0.10 to 0.15/ft2 ($1.00 to $1.50/m2). Assuming $0.05 ft2 ($0.50 m2) for handling and placement, the in-place cost of reinforcement would be approximately $2.50/ft2 ($25/m2) of vertical embankment face. Approximately 24.6 yd3 (18.8 m3) of additional fill would be required for the reinforced section per foot (per meter) of embankment length. Using a typical in-place cost for locally
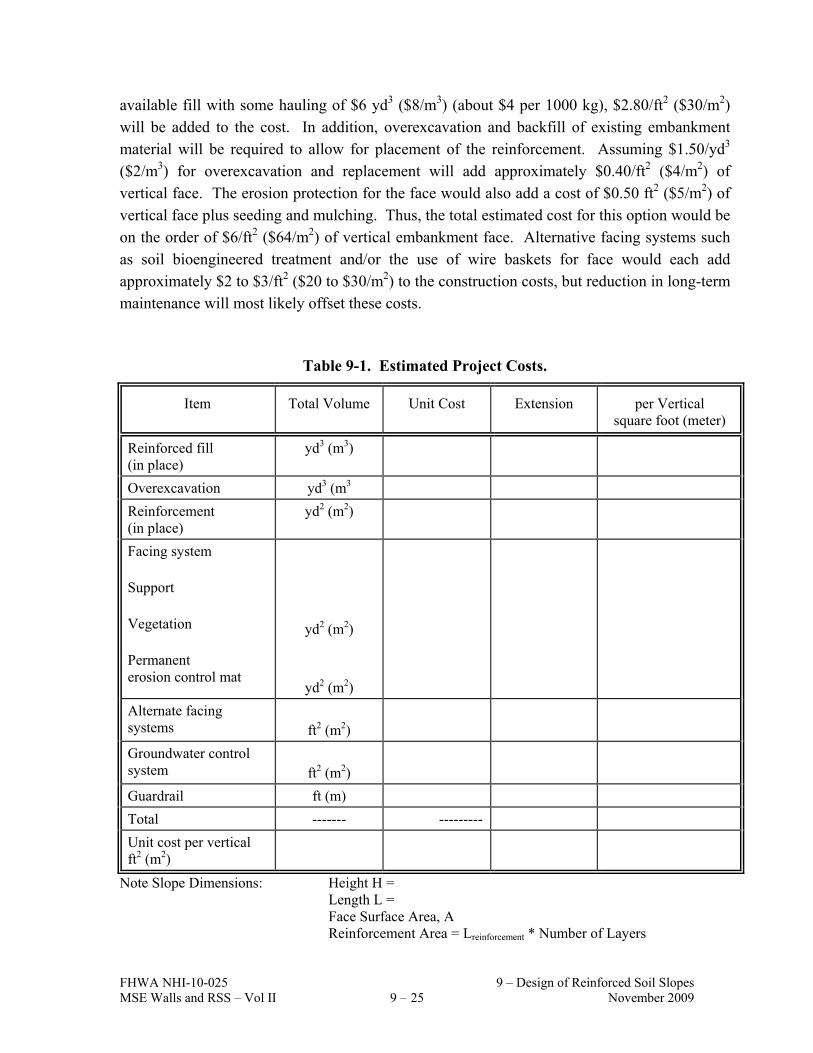
FHWA NHI-10-025 9 – Design of Reinforced Soil Slopes MSE Walls and RSS – Vol II 9 – 25 November 2009
available fill with some hauling of $6 yd3 ($8/m3) (about $4 per 1000 kg), $2.80/ft2 ($30/m2) will be added to the cost. In addition, overexcavation and backfill of existing embankment material will be required to allow for placement of the reinforcement. Assuming $1.50/yd3 ($2/m3) for overexcavation and replacement will add approximately $0.40/ft2 ($4/m2) of vertical face. The erosion protection for the face would also add a cost of $0.50 ft2 ($5/m2) of vertical face plus seeding and mulching. Thus, the total estimated cost for this option would be on the order of $6/ft2 ($64/m2) of vertical embankment face. Alternative facing systems such as soil bioengineered treatment and/or the use of wire baskets for face would each add approximately $2 to $3/ft2 ($20 to $30/m2) to the construction costs, but reduction in long-term maintenance will most likely offset these costs.
Table 9-1. Estimated Project Costs.
Item Total Volume Unit Cost Extension per Vertical square foot (meter)
Reinforced fill (in place)
yd3 (m3)
Overexcavation yd3 (m3
Reinforcement (in place)
yd2 (m2)
Facing system Support Vegetation Permanent erosion control mat
yd2 (m2)
yd2 (m2)
Alternate facing systems
ft2 (m2)
Groundwater control system
ft2 (m2)
Guardrail ft (m)
Total ------- ---------
Unit cost per vertical ft2 (m2)
Note Slope Dimensions: Height H = Length L = Face Surface Area, A Reinforcement Area = Lreinforcement * Number of Layers

FHWA NHI-10-025 9 – Design of Reinforced Soil Slopes MSE Walls and RSS – Vol II 9 – 26 November 2009

FHWA NHI-10-025 10 – Contracting Methods MSE Walls and RSS – Vol II 10 - 1 November 2009
CHAPTER 10 CONTRACTING METHODS AND SPECIFICATIONS
FOR MSE WALLS AND SLOPES From its introduction in the early 1970s, it is estimated that the total construction value of MSE walls is in excess of $2 billion. This estimate does not include reinforced slope construction, for which estimates are not available. Since the early 1980s, hundreds of millions of dollars have been saved on our Nation's highways by bidding alternates for selection of earth retaining structures. During that time, the number of available MSE systems or components have increased, and some design and construction problem areas that have been identified. These include misapplication of wall technology; poor specifications; lack of specification enforcement; inequitable bidding procedures; poor construction techniques; inadequate inspection; and inconsistent selection, review, and acceptance practices on the part of public agencies. Although the actual causes of each particular problem are unique, Agency procedures that address the design and construction of earth retaining systems Can, when well formulated and enforced, minimize such problems; or when not well formulated or enforced, can contribute to such problems. MSE wall and RSS systems are contracted using two different approaches: C Agency or material supplier designs with system components, drainage details, erosion
measures, and construction execution explicitly specified in the contracting documents; or
C Performance or end-result approach using approved or generic systems or components, with lines and grades noted on the drawings and geometric and design criteria specified. In this case, a project-specific design review and detail plan submittal occurs in conjunction with working drawing submittal.
Some user agencies prefer one approach to the other or a mixed use of approaches developed based upon criticality of a particular structure. Both contracting approaches are valid if properly implemented. Each approach has advantages and disadvantages. This chapter will outline the necessary elements of each contracting procedure, the approval process, and current material and construction specifications.
While this chapter specifically addresses the need for formal policy and procedures for MSE and RSS structures, the recommendations and need for uniformity of practice applies to all types of retaining structures.

FHWA NHI-10-025 10 – Contracting Methods MSE Walls and RSS – Vol II 10 - 2 November 2009
10.1 POLICY DEVELOPMENT It is desirable that each Agency develop a formal policy with respect to design and contracting of MSE wall and RSS systems. The general objectives of such a policy are to: C Obtain uniformity within the Agency. C Establish standard policies and procedures for design technical review and acceptance of
MSEW and RSS systems or components. C Establish a policy for the review/acceptance of new retaining wall and reinforced slope
systems and or components. C Delineate responsibility in house for the preparation of plans, design review and
construction control. C Delineate design responsibility for plans prepared by consultants and material suppliers. C Develop design and performance criteria standards to be used on all projects. C Develop and or update material and construction specifications to be used on all projects. C Establish contracting procedures by weighing the advantages/disadvantages of
prescriptive or end-result methods.
10.2 SYSTEM OR COMPONENT APPROVALS The recent expiration of most process or material patents associated with MSE systems has led to introduction by numerous suppliers of a variety of complete systems or components that are applicable for use. Alternatively, it opens the possibility of Agency-generic designs that may incorporate proprietary and generic elements. Approval of systems or components is a highly desirable feature of any policy for reinforced soil systems prior to their inclusion during the design phase, or as part of a value engineering alternate. For the purpose of prior approval, it is desirable that the supplier submit data that satisfactorily addresses the following items as a minimum: C System development or component and year it was commercialized. C Systems or component supplier organizational structure, specifically engineering and
construction support staff. C Limitations and disadvantages of system or component. C Prior list of users including contact persons, addresses and telephone numbers.

FHWA NHI-10-025 10 – Contracting Methods MSE Walls and RSS – Vol II 10 - 3 November 2009
C Sample material and construction control specifications showing material type, quality, certifications, field testing, acceptance and rejection criteria and placement procedures.
C A documented field construction manual describing in detail, with illustrations as necessary, the step-by-step construction sequence and the contractor’s quality control plan.
C Detailed design calculations for typical applications in conformance with current practice or AASHTO, whenever applicable.
C Typical unit costs, supported by data from actual projects. C Independent performance evaluations of a typical project by a professional engineer. The development, submittal, and approval of such a technical package provides a complete bench-mark for comparison with systems that have been in successful use and a standard when checking project-specific designs. Some vendor wall systems have been reviewed, and others are currently being reviewed, under the HITEC program (see Section 1.2). The HITEC program is still available within the American Society of Civil Engineers (ASCE) organization. Wall system suppliers are encouraged to conduct an independent review of newly developed components and/or systems related to materials, design, construction, performance, and quality assurance for use be DOTs in their system approval process. For the purpose of review and approval of geosynthetics (systems or components) used for reinforcement applications, the manufacturer/supplier submittal must satisfactorily address the following items that are related to the establishment of a long-term allowable tensile strength used in design: C Laboratory test results documenting creep performance over a range of load levels for
minimum duration of 10,000 hr. in accordance with ASTM D5262. C Laboratory test results and methodology for extrapolation of creep data for 75- and 100-
year design life as described in Appendix D. C Laboratory test results documenting ultimate strength in accordance with ASTM D4595
for geotextiles or ASTM D6637 for geogrids. Tests to be conducted at a strain rate of 10 percent per minute.
C Laboratory test results and extrapolation techniques, documenting the hydrolysis resistance of polyester (PET), oxidative resistance of polypropylene (PP) and high density polyethylene (HDPE), and stress cracking resistance of HDPE for all components of geosynthetic and values for partial factor of safety for aging degradation calculated for a 75- and 100-year design life. Recommended methods are outlined in FHWA RD 97-144 (Elias et al., 1999).

FHWA NHI-10-025 10 – Contracting Methods MSE Walls and RSS – Vol II 10 - 4 November 2009
C Field and laboratory test results along with literature review documenting reduction factor values for installation damage as a function of backfill gradation.
C For projects where a potential for biological degradation exists, laboratory test results and extrapolation techniques, documenting biological resistance of all material components of the geosynthetic and values for a reduction factor for biological degradation.
C Laboratory test results documenting joint (seams and connections) strength (ASTM D4884 and GRI:GG2).
C Laboratory tests documenting pullout interaction coefficients for various soil types or site-specific soils in accordance with ASTM D6706.
C Laboratory tests documenting direct sliding coefficients for various soil types or project specific soils in accordance with ASTM D5321.
C Manufacturing quality control program and data indicating minimum test requirements, test methods, test frequency, and lot size for each product. Further minimum conformance requirements as proscribed by the manufacturer shall be indicated. The following is a minimum list of conformance criteria required for approval:
Test Test Procedure Minimum Conformance
Requirement Wide Width Tensile (geotextiles) ASTM D4595 Specific Gravity (HDPE only) ASTM D1505 Melt Flow index (PP & HDPE) ASTM D1238 Intrinsic Viscosity (PET only) ASTM D4603 Carboxyl End Group (PET only) ASTM D2455 Single Rib Tensile (geogrids) ASTM D6637
To be provided by material supplier or specialty company
C The primary resin used in manufacturing shall be identified as to its ASTM type, class,
grade, and category.
For HDPE resin type, class, grade and category in accordance with ASTM D1248 shall be identified. For example type III, class A, grade E5, category 5.
For PP resins, group, class and grade in accordance with ASTM D4101 shall be identified. For example group 1, class 1, grade 4.
For PET resins minimum production intrinsic viscosity (ASTM4603) and maximum carboxyl end groups (ASTM D2455) shall be identified.

FHWA NHI-10-025 10 – Contracting Methods MSE Walls and RSS – Vol II 10 - 5 November 2009
For all products the minimum UV resistance as measured by ASTM D4355 shall be identified.
Prior approval should be based on Agency evaluations with respect on the following: C The conformance of the design method and construction specifications to current Agency
requirements for MSE walls and RSS slopes and any deviations to current engineering practice. For reinforced slope systems, conformance to current geotechnical practice.
C Past experience in construction and performance of the proposed system. C The adequacy of the data in support of nominal long-term strength (Tal) for geosynthetic
reinforcements. C The adequacy of the QA/QC plan for the manufacture of geosynthetic reinforcements.
10.3 DESIGN AND PERFORMANCE CRITERIA It is highly desirable that each Agency formalize its design and performance criteria as part of a design manual that may be incorporated in the Bridge Design Manual under Retaining Structures for MSE walls and/or a Highway Design Manual for reinforced slope structures. This would ensure that all designs whether Agency/Consultant or Supplier prepared, are based on equal, sound principles. The design manual may adopt current AASHTO LRFD Bridge Design Specifications (2007) Section 11.10 Mechanically Stabilized Earth Walls, or methods outlined in this manual as a primary basis for design and performance criteria and list under appropriate sections any deviations, additions and clarification to this practice that are relevant to each particular Agency, based on its experience. Construction material specifications for MSE walls may be modeled on Section 7 of current AASHTO LRFD Bridge Construction Specifications (2004), Earth Retaining Systems, or the complete specifications contained in this chapter. With respect to reinforced slope design, the performance criteria should be developed based on data outlined in Chapter 9. Material and construction specifications for RSS are provided in this chapter as well as for drainage and erosion control materials usually required for such construction.
10.4 AGENCY OR SUPPLIER DESIGN This contracting approach includes the development of a detailed set of MSE wall or RSS slope plans and material specifications in the bidding documents.

FHWA NHI-10-025 10 – Contracting Methods MSE Walls and RSS – Vol II 10 - 6 November 2009
The advantage of this approach is that the complete design, details, and material specifications can be developed and reviewed over a much longer design period. This approach further empowers Agency engineers to examine more options during design but requires an engineering staff trained in MSE and RSS technology. This trained staff is also a valuable asset during construction, when questions arise or design modifications are required. The disadvantage is that for alternate bids, additional sets of designs and plans must be processed, although only one will be constructed. A further disadvantage is that newer systems or components may not be considered during the design stage. The fully detailed plans shall include but not be limited to, the following items:
10.4.1 Plan and Elevation Sheets C Plan view to reflect the horizontal alignment and offset from the horizontal control line to
the face of wall or slope. Beginning and end stations for the reinforced soil construction and transition areas, and all utilities, signs, lights, etc. that affect the construction should be shown.
C For MBW unit faced walls, the plan view should show alignment baseline, limits of bottom of wall alignment and limits of top of wall alignment, as alignments vary with the batter of MBW system actually supplied.
C Elevation views indicating elevations at top and bottom of walls or slopes, beginning and end stations, horizontal and vertical break points, location and elevation of copings and barriers, and whole station points. Location and elevation of final ground line shall be indicated.
C Length, size, and type of soil reinforcement and where changes in length or type occur shall be shown.
C Panel and MBW unit layout and the designation of the type or module, the elevation of the top of leveling pad and footings, the distance along the face of the wall to all steps in the footings and leveling pads.
C Internal drainage alignment, elevation, and method of passing reinforcements around such structures.
C Any general notes required for construction. C Cross sections showing limits of construction, fill requirements, and excavation limits.
Mean high water level, design high water level, and drawdown conditions shall be shown where applicable.
C Limits and extent of reinforced soil volume.
FHWA NHI-10-025 10 – Contracting Methods MSE Walls and RSS – Vol II 10 - 7 November 2009
C All construction constraints, such as staged construction, vertical clearance, right-of-way limits, etc.
C Payment limits and quantities.
10.4.2 Facing/Panel Details C Facing details for erosion control for reinforced slopes and all details for facing modules,
showing all dimensions necessary to construct the element, reinforcing steel, and the location of reinforcing attachment devices embedded in the panels.
C All details of the architectural treatment or surface finishes.
10.4.3 Drainage Facilities/Special Details C All details for construction around drainage facilities, overhead sign footings, and
abutments. C All details for connection to traffic barriers, copings, parapets, noise walls, and attached
lighting. C All details for temporary support including slope face support where warranted. C All details for wall initiation and termination, and any transitions.
10.4.4 Design Computations The plans shall be supported by detailed computations for internal and external stability and life expectancy for the reinforcement. For plans prepared by material suppliers, the Owner and/or their consultant normally determine deep seated global stability. The Owner must define responsibility for compound stability analysis, when applicable.
10.4.5 Geotechnical Report The plans shall be prepared based on a geotechnical report that details the following: C Engineering properties of the foundation soils including shear strength and consolidation
parameters used to establish settlement and stability potential for the proposed construction. Maximum bearing pressures must be established for MSE wall construction.
C Engineering properties of the reinforced soil including shear strength parameters (φ, c) compaction criteria, gradation, and electrochemical limits.

FHWA NHI-10-025 10 – Contracting Methods MSE Walls and RSS – Vol II 10 - 8 November 2009
C Engineering properties of the fill or in-situ soil behind the reinforced soil mass, including shear strength parameters (φ, c) and compaction criteria.
C Groundwater or free water conditions and required drainage schemes if required.
10.4.6 Construction Specifications Construction and material specifications for the applicable system or component as detailed later in this chapter, which include testing requirements for all materials used.
10.5 END RESULT DESIGN APPROACH Under this approach, often referred as "line and grade" or "two line drawing," the Agency prepares drawings of the geometric requirements for the structure or reinforced slope and material specifications for the components or systems that may be used. The components or systems that are permitted are specified or are from a pre-approved list maintained by the Agency, from its prequalification process. The end-result approach, with sound specifications and prequalification of suppliers and materials, offers several benefits. Trained and experienced staff performs design of the MSE structure. The prequalified material components (facing, reinforcement, and miscellaneous) have been successfully and routinely used together, which may not be the case for in-house design with generic specifications for components. Also, the system specification approach lessens engineering costs and manpower for an Agency and transfers some of the project's design cost to construction. The disadvantage is that Agency engineers may not fully understand the technology at first and, therefore may not be fully qualified to review and approve construction modifications. Newer systems may not be considered due to the lack of confidence of Agency personnel to review and accept these systems. In addition, complex phasing and special details are not addressed until after the contract has been awarded. The bid quantities are obtained from specified pay limits denoted on the "line and grade" drawings and can be bid on a lump-sum or unit-price basis. The basis for detailed designs to be submitted after contract award are contained either as complete special provisions or by reference to AASHTO or Agency manuals, as a special provision. Plans, furnished as part of the contract documents, contain the geometric, geotechnical and design-specific information listed below.

FHWA NHI-10-025 10 – Contracting Methods MSE Walls and RSS – Vol II 10 - 9 November 2009
10.5.1 Geometric Requirements C Plan and elevation of the areas to be retained, including beginning and end stations. C For MBW unit faced walls, the plan view should show alignment baseline, limits of
bottom of wall alignment and limits of top of wall alignment, as alignments vary with the batter of MBW system actually supplied.
C Typical cross section that indicates face batter, pay limits, drainage requirements, excavation limits, etc.
C Elevation view of each structure showing original ground line, minimum foundation level, finished grade at ground surface, and top of wall or slope line.
C Location of utilities, signs, etc., and the loads imposed by each such appurtenance, if any. C Construction constraints such as staged construction, right-of-way, construction
easements, etc. C Mean high water level, design high water level, and drawdown conditions where
applicable.
10.5.2 Geotechnical Requirements They are the same as in Section 8.4 except that the design responsibility is clearly delineated as to areas of contractor/supplier and Agency responsibility. Typically, the Agency would assume design responsibility for developing global stability, bearing resistance and settlement analyses, as they would be the same regardless of the system used. The contractor/supplier would assume responsibility for both internal and local external stability for the designed structures.
10.5.3 Structural and Design Requirements C Reference to specific governing sections of the Agency design manual (materials,
structural, hydraulic and geotechnical), construction specifications and special provisions. If none is available for MSE walls, refer to current AASHTO, both Division I, Design and Division II, Specifications.
C Magnitude, location, and direction of external loads due to bridges, overhead signs and lights, and traffic surcharges.
C Limits and requirements of drainage features beneath, behind, above, or through the reinforced soil structure.
C Slope erosion protection requirements for reinforced slopes. C Size and architectural treatment of concrete panels for MSE walls.

FHWA NHI-10-025 10 – Contracting Methods MSE Walls and RSS – Vol II 10 - 10 November 2009
10.5.4 Performance Requirements C Tolerable movement of the structure both horizontal and vertical. C Tolerable face panel movement. C Monitoring and measurement requirements.
10.6 STANDARD DESIGNS The development and use of standard MSEW and RSS designs are discussed in Sections 4.8 and 8.8, respectively. With standard design, the Agency has certain responsibilities in preparation of the project plans and the vendor has certain responsibilities. For the example standard designs (Berg, 2000), the following Agency responsibilities are noted on the standard plans.
10.6.1 MSEW Standard Designs
Agency Responsibilities: In addition to the standard sheets, plan and front elevation views of the modular block retaining walls shall be included in the plans. The plan view must show alignment baseline, limits of bottom of wall alignment, and limits of top of wall alignment as alignments vary with batter of wall system supplied. The front elevation must identify bottom and top of wall elevations, existing grades, and finished grades. If the wall is curved, show the radius at the bottom and the top of each wall segment and the P.C. and P.T. station points off of baseline and limits of bottom and top of wall alignment. Reference adjacent pavement elevations (including superelevations, as applicable). Reference standard plates and provide details for traffic barriers, curb and gutter, handrails and fencing as required by project conditions. See AASHTO and Agency design manuals, standard plates and details for requirements. Surface drainage patterns shall be shown in the plan view. Provide dimensions for width and depth of the drainage swale as well as the type of impervious liner material. Surface water runoff should be collected above and diverted around wall face. Detail lines and grades of the internal drainage collection pipe. Detail or note the destination of internal wall drains as well as the method of termination (daylight end of pipe or connection into hydraulic structure).
FHWA NHI-10-025 10 – Contracting Methods MSE Walls and RSS – Vol II 10 - 11 November 2009
Soft soils and/or high water conditions may not be suitable for application of standard designs and may require a project specific design. Standard design charts are not applicable to: C Project/sites where foundation soils shear strength and/or bearing capacity do not meet or
exceed values used in the development of standard design charts. C Projects with a large (Agency defined) quantity of face area where project specific
designs are recommended. C Where slopes in front of wall are steeper than 1:3. C Where maximum wall height exceeds 32 ft (7.0 m). C Where walls are tiered. C Walls with soundwalls.
Contractor Responsibilities: Approved combinations of modular block unit and soil reinforcement products list with MBW reinforcement class noted are held and maintained by the Agency. Only approved product combinations may be used in standard designs. Provide detailed drawings for construction containing: C Elevation view with reinforcement placement requirements, wall facing layout, and
geometric information. Top of wall may extend up to 4 inches (100 mm) above plan top of wall elevation.
C Plan view with bottom and top of wall alignment, and plan limits of wall alignment. C Cross sections detailing batter, reinforcement, vertical spacing. Reinforcement lengths.
Subsurface drainage, surface drainage, and water runoff collection above wall. C Reinforcement layouts reinforcement shall be placed at 100% coverage ratio.
Reinforcement elevations shall be consistent across length of wall structure. C Note block, reinforcement, and fill placement methods and requirements. C Detail all wall fill penetrations and wall face penetrations. Detail reinforcement and/or
wall facing unit placement around penetrations. C Details that are specific to vendor products and their interaction with other project
components. C List information on approved combination of MBW unit and geosynthetic reinforcement,
including Agency classification code, nominal block width, properties for field identification, and installation instructions.
C Details of cap units and installation/fastening instructions for the caps. Cap units shall be set in a bed of adhesive designed to withstand moisture and temperature extremes, remain flexible, and shall be specifically formulated for bonding masonry to masonry.

FHWA NHI-10-025 10 – Contracting Methods MSE Walls and RSS – Vol II 10 - 12 November 2009
C Certification by professional engineer that the construction layout meets the requirements of plans and Agency MSEW standards. Deviation from standard design tables by value engineering submittal only.
10.6.2 RSS Standard Designs
Agency Responsibilities: Review by Turf and Erosion Prevention Unit and the Office of Environmental Services (or similar), shall be performed for all RSS applications. Turf establishment and maintenance items, hydroseeding over erosion control blanket, use of turf reinforcement mat in channelized flow areas, modification of seed mix, turf maintenance contract items, in addition to the details contained on these drawings, should be evaluated on a project basis. In addition to the standard sheets, typical cross sections of the soil slopes shall be included in the plans as well as including soil slopes on the project cross sections. Detail transition of RSS to adjacent slopes or structures. Reference standard plates and provide details for traffic barriers, curb and cutter, handrails and fencing as required by project conditions. See AASHTO and Agency design manuals, standard plates, and details for requirements. Detail lines and grades of the internal drainage collection pipe. Detail or note the destination of internal drains as well as the method of termination (daylight end of pipe or connection into adjacent hydraulic structure). Surface drainage patterns shall be shown in the plan view. Surface water runoff should be collected above and diverted around slope face. Define reinforced soil slope angle and define construction limits on the plan view based on this angle. Standard slope angles are 45 and 70 degrees. Soft soils and/or high water conditions (defined as groundwater within a depth equal to the slope height H) may not be suitable for application of standard designs and requires special consideration by the Agency. Standard designs are not applicable for projects with large quantity (Agency defined) of vertical face area where project specific designs are recommended.

FHWA NHI-10-025 10 – Contracting Methods MSE Walls and RSS – Vol II 10 - 13 November 2009
Designs based on level backfill, zero toe slope and traffic surcharge. Slopes above or below the oversteepened reinforced slope are not suitable for application of standard designs and require special consideration by the Agency. Refer to Case 1A and 1B for soil slopes between l:2 (26.5°) and 45° maximum. Use Case 2 for soil slopes greater than 45° and up to 70° maximum. Geotechnical investigation shall be performed for all RSS applications.
Agency Responsibilities: Approved soil reinforcement products list, with type noted, and approved erosion control products list, are held and maintained by the Agency. Only approved products may be used in standard designs. Provide detailed drawings for construction, containing: C Elevation view with reinforcement placement requirements, soil slope layout and
geometric information. C Cross sections detailing slope face angle, reinforcement vertical spacing, reinforcement
lengths, subsurface drainage, surface drainage, and slope face erosion protection. C Detail all reinforced fill penetrations and face penetrations. Detail reinforcement and
erosion protection placement around penetrations. C List information on approved geosynthetic reinforcement, including Agency
classification code, properties for field identification and installation directions. List product and installation information on welded wire mesh facing forms if utilized.
C Certification by Professional Engineer that construction layout meets the requirements of plans and Agency RSS standards. Deviation from standard design tables by value engineering submittal only.
10.7 REVIEW AND APPROVALS Where Agency design is based on a supplier’s plans, it should be approved for incorporation in the contract documents following a rigorous evaluation by Agency structural and geotechnical engineers. The following is a checklist of items requiring review: C Conformance to the project line and grade. C Conformance of the design calculations to Agency standards or codes such as current
AASHTO with respect to design methods, allowable bearing capacity, allowable tensile strength, connection design, pullout parameters, surcharge loads, and factors of safety.

FHWA NHI-10-025 10 – Contracting Methods MSE Walls and RSS – Vol II 10 - 14 November 2009
C Development of design details at obstructions such as drainage structures or other appurtenances, traffic barriers, cast-in-place junctions, etc.
C Facing details and architectural treatment. For end result contracting methods, the special provisions should contain a requirement that complete design drawings and calculations be submitted within 60 days of contract award for Agency review. The review process should be similar to the supplier design outlined above and be conducted by the Agency's structural and geotechnical engineers.
10.8 CONSTRUCTION SPECIFICATIONS AND SPECIAL PROVISIONS FOR MSE WALL AND RSS CONSTRUCTION
A successful reinforced soil project will require sound, well-prepared material and construction specifications to communicate project requirements as well as construction guidance to both the contractor and inspection personnel. Poorly prepared specifications often result in disputes between the contractor and owner representatives. A frequently occurring problem with MSE systems is the application of different or unequal construction specifications for similar MSE systems. Users are encouraged to utilize a single unified specification that applies to all systems, regardless of the contracting method used. The construction and material requirements for MSE systems are sufficiently well developed and understood to allow for unified material specifications and common construction methods. Guide construction and material specifications are presented in this chapter for the following types of construction: C Section 10.9 – Example specification for MSE walls with segmental precast concrete,
WWM, or MBW facings and steel (grid or strip) or geosynthetic reinforcements. C Section 10.10 – Example specifications for RSS systems. These guide specifications should serve as the technical basis for Agency developed standard specifications for these items. Local experience and practice should be incorporated as applicable. EDIT NOTE: Some key items that may be edited based upon local experience and/or practice are noted with a text box insert and discussion. The contractor should be required to submit a quality control plan detailing measurements and documentation that will

FHWA NHI-10-025 10 – Contracting Methods MSE Walls and RSS – Vol II 10 - 15 November 2009
be maintained during construction to assure consistency in meeting specification requirement.
10.9 EXAMPLE SPECIFICATION FOR MECHANICALLY STABILIZED EARTH (MSE) WALLS
The following specification addresses MSE walls reinforced with galvanized steel or geosynthetics, and faced with precast segmental panels, welded wire mesh (WWM), or masonry modular block wall (MBW) units. This example specification has been modified from the Arizona DOT (2009) LRFD MSE Wall specification. It is consistent with the design checklist in Chapter 4 and with recommendations with in this manual, but in some cases may extend beyond these recommendations. Sections to be filled in are shown as: ________ or with an example value noted, e.g. 30 days. MECHANICALLY STABILIZED EARTH (MSE) WALLS 1 Description: 1.01 General: The work under this section consists of designing, furnishing all materials and constructing Mechanically Stabilized Earth (MSE) retaining walls in accordance with these specifications and in compliance with the lines and grades, dimensions and details shown on the project plans and as directed by the Engineer. The contractor shall provide the MSE wall designer with a complete set of project plans and specifications and shall ensure that the wall design is compatible with all other project features that can impact the design and construction of the wall. The following terms are used in this specification for identification of various entities for which the contractor shall be fully responsible: Term Entity Wall Manufacturer The entity contractually retained by the contractor to provide materials and
construction services for an accepted MSE wall system as identified in Subsection 1.03.
Wall Designer The entity contractually retained by the contractor to provide design of an accepted MSE wall system as identified in Subsection 1.03. The wall designer may be a representative of the wall manufacturer.
1.02 Certifications: (A) Certification of Design Parameters:
See Subsection 2.01 herein specified.
(B) Certification of Materials: See Subsections 3.04, 3.07 and 3.10 herein specified.

FHWA NHI-10-025 10 – Contracting Methods MSE Walls and RSS – Vol II 10 - 16 November 2009
1.03 Accepted Systems: The contractor shall select one of the appropriate __DOT pre-approved earth retaining systems to be constructed for the MSE walls designated on the plans. Pre-approved systems are listed under category “Proprietary Retaining Walls” in the Approved Products List (APL). Copies of the most current version of the APL are available on the Internet at ____________________. The features of the system furnished, including design and configuration of precast elements, fasteners, connections, soil reinforcements, joint fillers, geotextile filter, and other necessary components, shall be those that have been pre-approved. Heights and lengths of earth retaining walls may vary from, but shall not be less than, those shown on the plans. The height and length to be used for any system shall be the minimum for that system that will effectively retain the earth behind the wall for the loading conditions and the contours, profile, or slope lines shown on the plans, or on the approved working drawings, and in accordance with all relevant internal and external stability design criteria, but not more than the pre-approved height for the particular MSE wall system selected. 1.04 Manufacturer’s Field Representative: The manufacturer’s field representative performing the work described in this specification shall have, in the past three years, successfully installed at least four MSE retaining walls of heights, lengths and complexity similar to those shown on the plans and meeting the tolerances specified herein. The manufacturer’s field representative may make field changes subject to the approval of the Engineer. Any such changes shall be documented in writing within 24 hours of the approved changes. This written document shall be sealed by the manufacturer’s design engineer, who is registered as a Civil Engineer in the State . 1.05 MSE Pre-Activity Meeting: A pre-activity meeting will be scheduled prior to commencement of MSE wall construction activity. As a minimum, this meeting shall be attended by the Engineer, contractor (including wall construction crew chiefs), the MSE wall sub-contractor, MSE wall manufacturer’s and MSE Wall designer’s representatives. No wall construction activity shall be performed until the contractor’s final submittals have been approved as having satisfactorily resolved all review comments and the pre-activity meeting has been held. 1.06 Wall Aesthetics: Wall aesthetics shall be as specified in the project plans and special provisions. 2 Submittals (Working Drawings and Design): 2.01 Submittals: The submittals required shall include working drawings, construction procedures, supporting design calculations, verification of experience, and a transmittal letter. The transmittal letter shall only list
FHWA NHI-10-025 10 – Contracting Methods MSE Walls and RSS – Vol II 10 - 17 November 2009
the documents included in the submittal. No technical information shall be included in the transmittal letter. Working drawings and calculations shall be sealed by an engineer, who is registered as a Civil Engineer in the State. The MSE wall designer/supplier shall document on the working drawings all assumptions made in the design. The following statement shall be included near the P.E. seal on the first sheet of the working drawings: “All design assumptions are validated through notes or details on these drawings.” Six complete sets of working drawings, design calculations and MSE supplier’s construction procedures modified as necessary by the contractor and Wall Designer for site-specific conditions shall be submitted to the Engineer for review. The Engineer shall have 30 calendar days after receiving the six complete sets to finish a review. The revised package shall be resubmitted to the Engineer for review. The Engineer shall have 15 calendar days to complete this review. This review process shall be repeated until the entire submittal is accepted by the Engineer. The Department assumes no responsibility for errors or omissions in the working drawings. Acceptance of the final working drawings submitted by the contractor shall not relieve the contractor of any responsibility under the contract for the successful completion of the work. Construction of the wall shall not commence until the contractor receives a written Notification To Proceed (NTP) from the Engineer. The NTP will be issued once the complete wall package (drawings, calculations and construction procedures) is approved. Fabrication of any of the wall components before the NTP shall be at the sole risk of the contractor. 2.02 Working Drawings: The contractor shall submit complete working drawings and specifications for each installation of the system in accordance with the requirements of Subsection _____ as modified herein. Working drawings shall include the following at a minimum:
(1) Layout of the wall including plan and elevation views; (2) All design parameters and assumptions including design life; (3) Existing ground elevations and utilities impacted by the wall, and those that should be field
verified by the contractor, for each location; (4) Complete details of all elements and component parts required for the proper construction of
the system at each location and any required accommodations for drainage systems, foundation subgrades or other facilities shown on the contract documents;
(5) The working drawing submittal shall clearly detail any special design requirements. These
special design requirements may include, but are not limited to; structural frames to place reinforcements around obstructions such as deep foundations and storm drain crossings, drainage systems, placement sequence of drainage and unit core fill with respect to reinforced (structure) fill behind a wall face using modular block facing units, guardrail post installation, scour protection, foundation subgrade modification, all corner details (acute, obtuse and 90 degrees), slip joints, joint details of MSE walls with other cast-in-place structures, wedges,
FHWA NHI-10-025 10 – Contracting Methods MSE Walls and RSS – Vol II 10 - 18 November 2009
shims and other devices such as clamps and bracing to establish and maintain vertical and horizontal wall facing alignments;
(6) A complete listing of components and materials specifications; and (7) Other site-specific or project specific information required by the contract.
2.03 MSE Wall Design: (A) General: The working drawings shall be supplemented with all design calculations for the particular installation as required herein. Installations that deviate from the pre-approved design shall be accompanied by supporting stability (internal; external; and global/overall and/or compound if required in the project documents) calculations of the proposed structure as well as supporting calculations for all special details not contained in the pre-approved design. The MSE wall designer/supplier shall note all deviations of the proposed wall design from the pre-approved design. The proposed design shall satisfy the design parameters shown on the project plans and listed in these specifications, and comply with the design requirements of the following document:
FHWA NHI-10-024 Vol I and NHI-10-025 Vol II, “Design of MSE Walls and Reinforced
Slopes,” (Berg et al., 2009). AASHTO (2007),”AASHTO LRFD Bridge Design Specifications,” 4th Edition, including 2008
and 2009 Interims. All references to AASHTO (2007) shall mean to include the latest interims. Maximum reinforcement loads shall be calculated using the “Simplified Method” as presented in AASHTO (2007) and as per the requirements specified herein. No other design method will be allowed. EDIT NOTE: The 2008 Interims states that the Simplified Method or the Coherent Gravity Method may be used. Agencies should specify what method(s) are acceptable and not leave as a contractor option. Sample analyses and hand-calculations shall be submitted to verify the output from software used by the MSE wall designer. Sample analyses and hand-calculations shall be required for complex walls having geometries and loading conditions that are not readily amenable to computer analysis. Failure modes, including circular, non-circular, and multi-part wedge, shall be analyzed for deep-seated global stability and compound stability to verify the most critical failure case. EDIT NOTE: Agency must specify who – the Agency or the contractor/wall vendor – is responsible for global and for compound stability analyses. If the contractor/wall supplier is responsible, subsurface data in sufficient detail to perform the analyses must be provided by the Agency to the contractor/wall supplier. See Chapter 4 for additional discussion. Unless otherwise specified in the contract, all structures shall be designed to conform to the requirements shown in Table 1 and other requirements specified herein.

FHWA NHI-10-025 10 – Contracting Methods MSE Walls and RSS – Vol II 10 - 19 November 2009
TABLE 1
DESIGN PARAMETERS Description Limit State Value Note*
1. Design Life All limit states 75 Years 2. Effective (Drained) Friction Angle a. Retained Backfill All limit states 32o min b. Reinforced Backfill All limit states 34o to max 40o 1
3. Length of soil reinforcement, B All limit states 0.7H min or 8-ft
whichever is more 2
Strength (all) B/4 (soil), 3/8B (rock) 4. Limiting eccentricity
Service I B/6 (soil), B/4 (rock) 5. Coefficient of Sliding Friction Strength (all) tan[min(r, f, i)] 3 6. Resistance factors a. Sliding Strength (all) 1.0 4 b. Bearing Strength (all) 0.65 5 c. Overall (slope) stability I. Deep Seated Stability Service I 0.65 6 II. Compound Stability Service I 0.65 6 d. Pullout resistance I. Static Strength (all) 0.90 7 II. Combined static/earthquake Strength (all) 1.20 7 e. Tensile resistance of metallic
reinforcements and connectors
I. Static - Strip reinforcement
- Grid reinforcement
Strength (all) Strength (all)
0.75 0.65
8
8,9 II. Combined static/earthquake
- Strip reinforcement - Grid reinforcement
Strength (all) Strength (all)
1.00 0.85
8
8,9 f. Tensile resistance of geosynthetic
reinforcements and connectors
I. Static Strength (all) 0.90 II. Combined static/earthquake Strength (all) 1.20 * Refer to Table 1.1 for notes.

FHWA NHI-10-025 10 – Contracting Methods MSE Walls and RSS – Vol II 10 - 20 November 2009
TABLE 1.1
NOTES FOR TABLE 1 # Note 1 A minimum friction angle of 34 degrees shall be substantiated by laboratory tests discussed in
Subsection 3.05(D). If the measured friction angle in laboratory tests as per Subsection 3.05(D) is greater than 40-degrees then the friction angle in the analysis shall be limited to 40-degrees.
2 H is the design height of the wall and is defined as the difference in elevation between from the finished grade at the tope of wall and the top of leveling pad. The top of the leveling pad shall always be below the minimum embedment reference line as indicated on the plans for that location. The length of the soil reinforcement, B, is measured from the backface of the wall facing unit. In case of grid type reinforcements the length of the soil reinforcement is measured from the backface of the wall to the last full transverse member. For modular block facing units, the total length of the reinforcement, BT, as measured from the front face of the wall is the length B as defined above plus the width of the modular block unit (the horizontal dimension of the block unit measured perpendicular to the wall face).
3 r= friction angle of reinforced wall fill; f = friction angle of foundation soil; i = friction angle of the interface between reinforcement and soil for cases of sheet reinforcement such as geotextiles. All friction angles are effective (drained) friction angles. Refer to Geotechnical Report for friction angle of foundation soil.
4 Passive resistance shall not be considered in evaluation of sliding resistance. 5 For all limit states, the design loading for the MSE retaining wall system shall not exceed the
factored general and local bearing resistances specified in the Geotechnical Report(s). 6 For earthquake loading condition, a resistance factor of 0.90 shall be used. 7 Live load due to vehicular traffic shall be included in the computations to determine the
maximum tensile forces in reinforcement layers, but shall be neglected in the computations for pullout resistance. EDIT NOTE: Agency should specify whether or not to include live load in tensile force calculations for pullout check, see Chapter 4 for discussion. Intensity of live load shall be considered as a uniform surcharge using the equivalent height of soil in accordance with Section Article 3.11.6.4 of AASHTO (2007).
8 Apply to gross cross-section less sacrificial area. For sections with holes, reduce gross area in accordance with Article 6.8.3 of AASHTO (2007) and apply to net section less sacrificial area.
9 Applies to grid reinforcements connected to a rigid facing element, e.g., a concrete panel or block. For grid reinforcements connected to a flexible facing mat or which are continuous with the facing mat, use the resistance factor for strip reinforcements.
10 Unless otherwise specified, all resistance factors shall be taken as 1.0 when investigating an extreme event limit state.
(B) Subsurface Drainage Systems: Walls shall be provided with subsurface drainage measures as shown on the project plans and specifications. As a minimum, an underdrain system shall be provided for leading subsurface and surface water away from the backfill and outside the limits of the wall. Geocomposite drains, if used for subsurface drainage, shall be in accordance with Subsection ____ and _____ of the specifications.

FHWA NHI-10-025 10 – Contracting Methods MSE Walls and RSS – Vol II 10 - 21 November 2009
(C) Obstructions in Backfill: (1) General:
Where obstructions, such as deep foundations or storm drains crossings, are located in the reinforced backfill zone, cutting of reinforcements to avoid obstructions shall not be permitted. A minimum offset of one diameter but not less than three (3) feet shall be maintained between the face of any pipe crossings and the back face of retaining wall panels. A minimum clearance of three (3) feet shall be maintained between the face of any other obstruction and the back face of retaining wall panels.
(2) Horizontal Deflection of Reinforcements:
In the horizontal plane at a reinforcing level, a deviation up to fifteen (15) degrees from the normal to the face of the wall may be allowed for strip reinforcement and bolted connection. This deviation is herein referred to as the splay angle. Grid reinforcements may not be splayed, unless connection has been specifically fabricated to accommodate a splay and connection detail has been approved by the Agency. If used, the splay in grid reinforcement is limited to fifteen (15) degrees. For obstructions that cannot be accommodated with splayed reinforcement, structural frames and connections shall be required, and shall be designed in accordance with Section 10 (“Steel Structures”) of AASHTO (2007) for the maximum tension in the reinforcements. The structural frame design shall be such that bending moments are not generated in the soil reinforcement or the connection at the wall face. The design, along with supporting calculations, shall be included in the working drawings.
(3) Vertical Deflection of Reinforcements:
Vertical deflection of the reinforcement to avoid obstructions such as utilities along the wall face shall be limited to a maximum of 15 degrees from normal to face of wall. Bends in the reinforcement shall be smooth and gradual to ensure that galvanization remains intact.
(D) Hydrostatic Pressures: As determined by the Engineer and/or as noted on the plans, for walls potentially subject to inundation, such as those located adjacent to rivers, canals, detention basins or retention basins, a minimum hydrostatic pressure equal to three (3) feet shall be applied at the high-water level for the design flood event. Effective unit weights shall be used in the calculations for internal and external stability beginning at levels just below the equivalent surface of the pressure head line. Where the wall is influenced by water fluctuations, the wall shall be designed for rapid drawdown conditions which could result in differential hydrostatic pressure greater than three (3) feet. As an alternative to designing for rapid drawdown conditions, Size 57 coarse aggregate, as specified in AASHTO M 43, shall be provided as reinforced wall fill for the full length of the wall and to the maximum height of submergence of the wall. Separation geotextile, as specified in Subsection ____, shall be provided at the interface of the Size 57 coarse aggregate and reinforced wall fill above it, and at the interface of the retained backfill behind it. Adjoining sections of separation geotextile shall be overlapped by a minimum of 12 inches.

FHWA NHI-10-025 10 – Contracting Methods MSE Walls and RSS – Vol II 10 - 22 November 2009
(E) Acute Angle Corners: Wall corners with an included angle of less than 70 degrees shall be designed for bin-type lateral pressures for the extent of the wall where the full length of the reinforcement cannot be installed without encountering a wall face. Acute angle corner structures shall not be stand-alone separate structures. Computations shall be provided that demonstrate deformation compatibility between the acute angle corner structure and the rest of the MSE wall. Full-height vertical slip joints shall be provided at the acute angle corner and after the last column of panels where full length of the reinforcements can be placed. The soil reinforcement attached to the slip joints shall be oriented perpendicular to the slip joint panels and shall be the full design length. Special connection and compaction details shall be provided on the working drawings. (F) Spacing of Metallic Reinforcement for Flexible Face Wall Systems: For permanent walls, vertical and horizontal spacing of metallic reinforcements for flexible face (welded wire or similar) wall systems shall not exceed 18 inches. The stiffness of the facing and spacing of reinforcements shall be such that the maximum local deformation between soil reinforcement layers shall be limited to less than 1½ inches. EDIT NOTE: Recommended limitation range, see Chapter 3, is 1 to 2 inches. Agency should specify specific value. Facing elements shall not yield in bending and tension. For temporary walls, i.e., walls with up to 36 months service life, the contractor may adjust the stiffness of the facing and spacing of the reinforcements such that the local deformation between the reinforcement is within the elastic range in bending and tension, and the overall geometry meets the line and grade requirements for the temporary walls. (G) Soil Reinforcement for Modular Block Wall Systems: The soil reinforcement lengths and percent coverage at a given reinforcement level shall be in accordance with the plans. All soil reinforcement shall be positively connected to the modular block facing units that is capable of resisting 100% of the maximum tension in the soil reinforcements at any level within the wall. Detailed documentation for connection strength shall be submitted as noted in Subsection 3.10. The vertical spacing of the soil reinforcement for walls with modular block facing units shall be as follows:
1. The first (bottom) layer of soil reinforcement shall be no further than 16 inches above the top of the leveling pad.
2. The last (top) layer of soil reinforcement shall be no further than 20 inches on the average below the top of the uppermost MBW unit.
3. The maximum vertical spacing between layers of adjacent soil reinforcement shall not exceed 32 inches. For walls deriving any part of their connection capacity by friction the maximum vertical spacing of the reinforcement should be limited to two times the block depth (front face to back face) to assure construction and long-term stability. The top row of reinforcement should be one-half the vertical spacing.
(H) Initial Batter of Wall: The initial batter of the wall, both during construction and upon completion, shall be within the vertical and horizontal alignment tolerances included in this specification. The initial batter of the wall at the start of construction and the means and methods necessary to achieve the batter shall be provided on the working drawings. Subject to Engineer’s approval, the initial batter may be modified

FHWA NHI-10-025 10 – Contracting Methods MSE Walls and RSS – Vol II 10 - 23 November 2009
at the start of construction by the manufacturer’s field representative based on the evaluation of the backfill material selected by the contractor. Any such changes shall be documented in writing within 24 hours of the approved changes. This written document shall be sealed by the manufacturer’s design engineer who is registered as a Civil Engineer in the state. Details of the wedges or shims or other devices, such as clamps and external bracing used to achieve or maintain the wall batter, shall be as shown on the working drawings and/or accompanying construction manual. Permanent shims shall comply with the design life criteria, and shall maintain the design stress levels required for the walls. 3 Material Requirements: 3.01 Precast Concrete Elements: Precast concrete elements shall conform to the requirements for precast minor structures in Sections ___ and ____. The concrete shall be Class __ with minimum design strength of 4,000 pounds per square inch. The mix design shall conform to the requirements of Subsection 3.02. Prior to casting, all embedded components shall be set in place to the dimensions and tolerances designated in the plans and specifications. Rustication for wall aesthetics shall be in accordance with project plans, special provisions, and applicable requirements of Sections ___, ___, ___ and ___. (A) Concrete Testing and Inspection: Precast concrete elements shall be subjected to compressive strength testing in accordance with Subsection ___, and inspected for dimensional tolerances and surface conditions in accordance with Subsections ____ and ____ respectively. Panels delivered to the site without the Agency acceptance stamp will be rejected. (B) Casting: Precast concrete face panels shall be cast on a horizontal surface with the front face of the panel at the bottom of the form. Connection hardware shall be set in the rear face. The concrete in each precast concrete panel shall be placed without interruption and shall be consolidated by deploying an approved vibrator, supplemented by such hand tamping as may be necessary to force the concrete into the corner of the forms, and to eliminate the formation of stone pockets or cleavage planes. Form release agents as specified in Subsection _____ shall be used on all form faces for all casting operations. The contractor shall advise the Engineer of the starting date for concrete panel casting at least 14 calendar days prior to beginning the operation if the casting operation is within the State, or 21 calendar days if the casting operation is outside the State. (C) Finish:
(1) Non-Exposed Surfaces:
Rear faces of precast concrete panels shall receive a Class 1 finish in accordance with Subsection ____.

FHWA NHI-10-025 10 – Contracting Methods MSE Walls and RSS – Vol II 10 - 24 November 2009
(2) Exposed Surfaces: The type of finish required on exposed surfaces shall be as shown in the plans. (a) Exposed Aggregate Finish:
(1) Prior to placing concrete, a set retardant shall be applied to the casting forms in accordance with the manufacturer’s instructions.
(2) After removal from the forms and after the concrete has set sufficiently to prevent its
dislodging, the aggregate shall be exposed by a combination of brushing and washing with clear water. The depth of exposure shall be between ⅜ inch and ½ inch.
(3) An acrylic resin sealer consisting of 80 percent thinner and 20 percent acrylic solids
by weight shall be applied to the exposed aggregate surface at a rate of one (1) gallon per 250 square feet.
(b) Concrete Panel Finish: Concrete panel finish shall be in accordance with Subsection ____. (D) Tolerances: Precast concrete elements shall comply with Subsection ____ and ____. Connection device placement shall be within ± 1 inch of the dimensions shown on the drawings. Panel squareness as determined by the difference between the two diagonals shall not exceed ½ inch. (E) Identification and Markings: The date of manufacture, the production lot number, and the piece mark shall be inscribed on a non-exposed surface of each element. (F) Handling, Storage and Shipping: All panels shall be handled, stored, and shipped in such a manner to eliminate the dangers of chipping, discoloration, cracks, fractures, and excessive bending stresses. Panels in storage shall be supported in firm blocking to protect panel connection devices and the exposed exterior finish. Storing and shipping shall be in accordance with the manufacturer’s recommendations. (G) Compressive Strength: Precast concrete elements shall not be shipped or placed in the wall until a compressive strength of 3,400 pounds per square inch has been attained. The facing elements shall be cast on a flat and level area and shall be fully supported until a compressive strength of 1,000 pounds per square inch has been attained.

FHWA NHI-10-025 10 – Contracting Methods MSE Walls and RSS – Vol II 10 - 25 November 2009
(H) Precast Concrete Panel Joints:
(1) General: Where the wall wraps around an inside corner, a corner block panel shall be provided with flange extensions that will allow for differential movement without exposing the panel joints. The back face of vertical and horizontal joints shall be covered with geotextile filter. Joint filler, bearing pads, and geotextile filter shall be as recommended by the wall manufacturer and shall meet the requirements shown on the approved working drawings.
If required, as indicated on the plans, flexible open-cell polyurethane foam strips shall be used for filler for vertical joints between panels, and in horizontal joints where pads are used.
All joints between panels on the back side of the wall shall be covered with a geotextile meeting the requirements for filtration applications as specified by AASHTO M 288. The minimum width shall be one (1) foot.
(2) Bearing Pads:
All horizontal and diagonal joints between panels shall include bearing pads. Bearing pads shall meet or exceed the following material requirements:
Preformed EPDM (Ethylene Propylene Diene Monomer) rubber pads conforming to
ASTM D 2000 Grade 2, Type A, Class A with a Durometer Hardness of 70.
Preformed HDPE (High Density Polyethylene) pads with a minimum density of 0.946 grams per cubic centimeter in accordance with ASTM D 1505.
The stiffness (axial and lateral), size, and number of bearing pads shall be determined such that the final joint opening shall be ¾+1/8 inch unless otherwise shown on the plans. The MSE wall designer shall submit substantiating calculations verifying the stiffness (axial and lateral), size, and number of bearing pads assuming, as a minimum, a vertical loading at a given joint equal to 2 times the weight of facing panels directly above that level. As part of the substantiating calculations, the MSE wall designer shall submit results of certified laboratory tests in the form of vertical load-vertical strain and vertical load-lateral strain curves for the specific bearing pads proposed by the MSE wall designer. The vertical load-vertical strain curve should extend beyond the first yield point of the proposed bearing pad.
3.02 Steel Components: Steel components shall conform to the applicable requirements of Sections ___ and ___. (A) Galvanization: Soil reinforcement steel shall be hot-dip galvanized in accordance with AASHTO M 111 (ASTM A123). Connection hardware steel can be galvanized by hot-dipping or other means, provided the method satisfies the requirements of AASHTO M 111 (ASTM A123). A minimum galvanization coating of 2.0 oz/ft2 (605 g/m2) or 3.4 mils (85 μm) thickness is required. Soil reinforcement steel shall be adequately supported while lifting and placing such that the galvanization remains intact.

FHWA NHI-10-025 10 – Contracting Methods MSE Walls and RSS – Vol II 10 - 26 November 2009
Steel members with damaged (peeled) galvanization shall be repaired according to ASTM A780 and as specified in approved working drawings, at no additional cost to the Agency. (B) Metallic Reinforcing Strips and Tie Strips: Reinforcing strips shall be hot-rolled from bars to the required shape and dimensions. The strips’ physical and mechanical properties shall conform to the requirements of ASTM A572, Grade 65 minimum. Tie strips shall be shop fabricated of hot-rolled steel conforming to the requirements of ASTM A1101, Grade 50 minimum. The minimum bending radius of the tie strips shall be ⅜ inch. Galvanization shall be applied after the strips are fabricated, inclusive of punch holes for bolts as shown on approved drawings. (C) Metallic Reinforcing Mesh: Reinforcing mesh shall be shop fabricated of cold-drawn steel wire conforming to the requirements of AASHTO M 32, and shall be welded into the finished mesh fabric in accordance with AASHTO M 55. Galvanization shall be applied after the mesh is fabricated. A minimum galvanization coating of 2.0 oz/ft2 (605 g/m2) or 3.4 mils (85 μm) thickness is required. (D) Connector Pins: Connector pins and mat bars shall be fabricated and connected to the soil reinforcement mats as shown in the approved working drawings. Connector bars shall be fabricated of cold drawn steel wire conforming to the requirements of AASHTO M 32. (E) Welded Wire Fabric: All welded wire fabric shall conform to the requirements of AASHTO M 32, AASHTO M 55, and the approved working drawings. Welded wire fabric shall be galvanized in conformance with the requirements of ASTM A123. (F) Fasteners: Connection hardware shall conform to the requirements shown in the approved working drawings. Connection hardware shall be cast in the precast concrete panels such that all connectors are in alignment and able to transfer full and even load to the soil reinforcement. Once the reinforcement is connected to the panel, the amount of slack shall not exceed ⅛ inch between the connector and the reinforcement during field installation. Fasteners shall be galvanized and conform to the requirements of AASHTO M 164 or equivalent. 3.03 Geosynthetic Reinforcement: Geosynthetic soil reinforcement shall be limited to geogrids listed on the Agency’s Approved Products List (APL). The geogrid shall be a regular network of integrally connected polymer tensile elements, with aperture geometry sufficient to permit significant mechanical interlock with the surrounding soil. Geogrid structure shall be dimensionally stable and able to retain its geometry under manufacture, transport and installation.

FHWA NHI-10-025 10 – Contracting Methods MSE Walls and RSS – Vol II 10 - 27 November 2009
The nominal long-term tensile design strength (Tal) of specific geosynthetic material shall meet or exceed the Agency’s APL. 3.04 Certificate of Analysis for Soil Reinforcements: The contractor shall furnish the Engineer with a Certificate of Analysis conforming to the requirements of Subsection ____ for all materials. For geosynthetics, the Certificate of Analysis shall verify that the supplied geosynthetic is the type approved by the Engineer and as measured in full accordance with all test methods and standards specified herein. The manufacturer’s certificate shall state that the furnished geosynthetic meets the requirements of the specifications, as evaluated by the manufacturer’s quality control program. In case of dispute over validity of values, the Engineer can require the contractor to supply test data from an Agency-approved laboratory to support the certified values submitted, at no additional cost to the Department. For metallic wall reinforcement, a mill test report containing the ultimate tensile strength for the soil reinforcement shall be included in the certification. For metallic wall reinforcement, a mill test report containing the galvanization coverage shall be included in the certification. For metallic mesh wall reinforcement, a mill test report containing the ultimate weld strength for the soil reinforcement shall be included in the certification. 3.05 Reinforced Wall Fill Material: (A) General: Reinforced wall fill material shall be free of shale, organic matter, mica, gypsum, smectite, montmorillonite, or other soft poor durability particles. No salvaged material, such as asphaltic concrete millings or Portland Cement Concrete rubble, etc., will be allowed. (B) Soundness: The reinforced backfill material shall have a soundness loss of 30 percent or less when tested in accordance with AASHTO T 104 using a magnesium sulfate solution with a test duration of four cycles. Alternatively, the material shall have a soundness loss of 15 percent or less when tested in accordance with AASHTO T 104 using a sodium sulfate solution with a test duration of five cycles. (C) Gradation and Plasticity Index: Gradations will be determined per AASTHO T 27 and shall be in accordance with Table 2, unless otherwise specified. The reinforced backfill shall be well-graded in accordance with the Unified Soil Classification System (USCS) in ASTM D2487. Furthermore, the reinforced wall fill shall not be gap-graded. Plasticity Index (PI), as determined in accordance with AASHTO T 90, shall not exceed six.

FHWA NHI-10-025 10 – Contracting Methods MSE Walls and RSS – Vol II 10 - 28 November 2009
Table 2
BACKFILL GRADATION REQUIREMENTS Sieve Size Percent Passing
4 inch (Note 1) 100 No. 40 0-60
No. 200 0-15 Note 1: Maximum particle size shall be limited to ¾ inch for geosynthetics and epoxy- or PVC-coated reinforcements unless the contractor provides tests, acceptable to the Engineer, that have evaluated the extent of construction damage anticipated for the specific fill material and reinforcement combination. Construction damage testing shall be performed in accordance with the requirements of Chapter 5 of Publication No. FHWA NHI-09-087, dated 2009 (“Corrosion/Degradation of Soil Reinforcements for Mechanically Stabilized Earth Walls and Reinforced Soil Slopes.”)
(D) Internal Friction Angle Requirement: The reinforced wall fill material shall exhibit an effective (drained) angle of internal friction of not less than 34 degrees, as determined in accordance with AASHTO T 236. The test shall be run on the portion finer than the No. 10 sieve. The sample shall be compacted at optimum moisture content to 95 percent of the maximum dry density, as determined in accordance with the requirements of AASHTO T 99. The sample shall be tested at the compacted condition without addition of water. No direct shear testing will be required when 80 percent or more of the material is larger than ¾ inch. (E) Electrochemical Requirements: The reinforced backfill material shall meet the electrochemical requirements of Table 3 when metallic soil reinforcement is used and Table 4 when geosynthetic soil reinforcement is used. For all soil reinforcements, the organic content of backfill shall be less than one (1) percent, determined in accordance with AASHTO T-267.
Table 3 ELECTROCHEMICAL REQUIREMENTS FOR METALLIC REINFORCEMENTS
Characteristic Requirement Test Method pH 5.0 to 10.0 AASHTO T-289 Resistivity, min. 3,000 ohm-cm AASHTO T-288 Chlorides, max. 100 ppm ASTM D4327 Sulfates, max. 200 ppm ASTM D4327 * If the resistivity is greater or equal to 5,000 ohm-cm, the chloride and sulfate requirements may be waived.
Table4
ELECTROCHEMICAL REQUIREMENTS FOR GEOSYNTHETIC REINFORCEMENTS Base Polymer Property Requirement Test Method
Polyolefin (PP and HDPE)* pH > 3 AASHTO T-289 Polyester pH > 3 and < 9 AASHTO T-289
* PP: Polypropylene and HDPE: High Density Polyethylene.
FHWA NHI-10-025 10 – Contracting Methods MSE Walls and RSS – Vol II 10 - 29 November 2009
(F) Rock Reinforced Wall Fill: Material that is composed primarily of rock fragments (material having less than 25 percent passing a ¾-inch sieve) shall be considered to be a rock fill. The maximum particle size shall not exceed the limits listed in Table 2. Such material shall meet all the other requirements of Subsection 3.05(B) and Subsection 3.05(E). When such material is used, a very high survivability separation geotexitle, meeting the minimum requirements for filtration applications specified in AASHTO M 288 and Subsection ____, shall encapsulate the rock backfill to within three (3) feet below the wall coping. Adjoining sections of separation fabric shall be overlapped by a minimum of 12 inches. Additionally, the upper three (3) feet of backfill shall contain no stones greater than three (3) inches in their greatest dimension, and shall be composed of material not considered to be rock backfill, as defined herein. (G) Limits of Reinforced Wall Fill: For all walls, except back-to-back walls, the reinforced backfill shall extend to at least one (1) foot beyond the free end of the reinforcement. EDIT to Agency practice/requirements. For back-to-back walls wherein the free ends of the reinforcement of the two walls are spaced apart less than or equal to one-half the design height of the taller wall, reinforced wall fill shall be used for the space between the free ends of the reinforcements as well. The design height of the wall is defined as the difference in elevation between finished grade at top of wall and the top of leveling pad. The top of the leveling pad shall always be below the minimum embedment reference line as indicated on the plans for the location under consideration. 3.06 Retained Backfill Material: (A) General: Backfill behind the limits of the reinforced backfill shall be considered as retained backfill for a distance equal to 50 percent of the design height of the MSE wall or as shown on the plans, except for back-to-back MSE walls as described in Subsection 3.05(G) above. The retained backfill shall be free of shale, mica, gypsum, smectite, montmorillonite or other soft particles of poor durability. The retained backfill shall meet the soundness criteria as described in Subsection 3.05(B). The percent fines (the fraction passing No. 200 sieve) shall be less than 50 as determined in accordance with ____ Test Method, and the Liquid Limit (LL) and the Plasticity Index (PI) shall be less than 40 and 20, respectively, as determined in accordance with AASHTO T-90. Material that is composed primarily of rock fragments (material having less than 25 percent passing a ¾-inch sieve), shall be considered to be a rock backfill and the requirements of Subsection 3.05(F) shall apply. (B) Internal Friction Angle Requirement: Unless otherwise noted on the plans, the retained backfill material shall exhibit an effective (drained) angle of internal friction of not less than degrees as determined by AASHTO T 236. EDIT insert Agency value consistent with material specification. The test shall be run on the portion finer than the No. 10 sieve. The sample shall be compacted at optimum moisture content and to 95 percent of maximum dry density, as determined in accordance with AASHTO T 99 (Proctor) test OR AASHTO T 180 (Modified Proctor) test. EDIT NOTE:

FHWA NHI-10-025 10 – Contracting Methods MSE Walls and RSS – Vol II 10 - 30 November 2009
Specify test method consistent with compaction specification. The sample shall be tested at the compacted condition without addition of water. No direct shear testing will be required when 80 percent or more of the material is larger than ¾ inch. 3.07 Certificate of Analysis for Reinforced Wall Fill and Retained Backfill Materials At least three weeks prior to construction of the MSE wall, the contractor shall furnish the Engineer with an 80-pound representative sample of each of the backfill material and a Certificate of Analysis conforming to the requirements of Subsection 106.05 certifying that the backfill materials comply with the requirements specified herein. During construction the reinforced and retained backfill shall be sampled and tested by the Contractor for acceptance and quality control testing in accordance with the requirements stated in Table 929-5 and Table 929-6, respectively. A new sample and Certificate of Analysis shall be provided any time the reinforced and retained backfill material changes as noted in Table 929-5 and 929-6, respectively.
Table 5 Sampling Frequency for Reinforced Backfill Material
Test Frequency Gradation (AASHTO T 26), Plasticity Index (AASHTO T 90)
One per 2,000 CY At job site
Resistivity, pH, Organic Content, Chlorides, Sulfates (Table 929-3) One per 2,000 CY At job site
Internal friction angle (AASHTO T 236) Proctor density and Optimum Moisture by AASHTO T 99 OR AASHTO T 180 EDIT NOTE: Specify one, consistent with compaction specification. Test pad section (Subsection 4.06(B))
One per material change and change
in source*
* The gradation and plasticity tests performed at the frequency noted in Table 5 shall be used to determine the Unified Soil Classification System (USCS) designation as per ASTM D 2487. New tests shall be required with each change in USCS designation including change in dual symbol designations (example: SW-SM, SW-SC, etc.). All requirements of Subsection 3.05 shall be satisfied. New tests shall also be required for each new source regardless of whether the USCS designation changes or not.
Table 6
Sampling Frequency for Retained Backfill Material Test Frequency
Gradation (AASHTO T 27), Plasticity Index (AASHTO T 90)
One per 5,000 CY At job site
Internal friction angle (AASHTO T 236) Proctor density and Optimum Moisture by AASHTO T 99 OR AASHTO T 180 EDIT NOTE: Specify one, consistent with compaction specification.
One per material change and change
in source* * The gradation and plasticity tests performed at the frequency noted in Table 6 shall be used to determine the Unified Soil Classification System (USCS) designation as per ASTM D2487. New tests shall be required with each change in USCS designation including change in dual symbol designations (example: SW-SM, SW-SC, etc.). All requirements of Subsection 3.06 shall be satisfied. New tests shall also be required for each new source regardless of whether the USCS designation changes or not.

FHWA NHI-10-025 10 – Contracting Methods MSE Walls and RSS – Vol II 10 - 31 November 2009
3.08 Cast-in-Place Concrete: Cast-in-place concrete shall conform to the requirements of Sections ___ and ___. Unless otherwise approved, all cast-in-place concrete shall be Class __ with a minimum compressive strength of 4,000 pounds per square inch. 3.09 Modular Block (Segmental) Facing Units: This section covers dry-cast hollow and solid concrete masonry structural retaining wall units, machine made from Portland cement, water, and suitable mineral aggregates. The units are intended for use as facing units in the construction of mortarless, modular block walls (MBW) also known as segmental retaining walls (SRW). Metallic or geosynthetic reinforcement specified in Section 3.02 and 3.03, respectively, may be used as soil reinforcement in the reinforced (structure) wall fill zone. (A) Casting: Cementitious material in the modular block facing unit shall be Portland cement conforming to the requirements of ASTM C 150. If fly ash is used it shall not exceed 20% by weight of the total cement content and shall conform to ASTM C 618. Aggregates used in concrete blocks shall conform to ASTM C 33 for normal weight concrete aggregate. Efflorescence control agent shall be used in concrete mix design to prevent efflorescence on the block. The contractor shall advise the Engineer of the starting date for concrete panel casting at least 14 calendar days prior to beginning the operation if the casting operation is within the State, or 21 calendar days if the casting operation is outside the State. (B) Physical Requirements: At the time of delivery to the work site, the modular block facing units shall conform to the following physical requirements:
1) Minimum required compressive strength of 4,000 psi (average 3 coupons) 2) Minimum required compressive strength of 3,500 psi (individual coupon) 3) Minimum oven dry unit weight of 125 pcf 4) Maximum water absorption of 5 % after 24 hours 5) Maximum number of blocks per lot of 2,000. Tests on blocks shall be submitted at the
frequency of one set per lot. Acceptance of the concrete block, with respect to compressive strength, water absorption and unit weight, will be determined on a lot basis. The lot shall be randomly sampled and tested in accordance with ASTM C140. As no additional expense to the Department, the manufacturer shall perform the tests at an Agency approved laboratory and submit the results to the Engineer for approval. Compressive strength test specimens shall be cored or shall conform to the saw-cut coupon provisions of ASTM C 140. Block lots represented by test coupons that do not reach an average compressive strength of 4,000 psi will be rejected.
(C) Freeze-Thaw Durability: In areas where repeated freezing and thawing under saturated conditions occur, the units shall be tested to demonstrate freeze-thaw durability in accordance with Test Method ASTM C1262. Freeze-thaw durability shall be based on tests from five specimens made with the same materials, concrete

FHWA NHI-10-025 10 – Contracting Methods MSE Walls and RSS – Vol II 10 - 32 November 2009
mix design, manufacturing process, and curing method, conducted not more than 18 months prior to delivery. Specimens used for absorption testing shall not subsequently be used for freeze-thaw testing. Specimens shall comply with either or both of the following acceptance criteria depending on the severity of the project location as determined by the Department:
1) The weight loss of four out of five specimens at the conclusion of 150 cycles shall not exceed
1% of its initial weight when tested in water. 2) The weight loss of each of four out of the five test specimens at the conclusion of 50 cycles
shall not exceed 1.5% of its initial mass when tested in a saline (3% sodium chloride by weight) solution.
(D) Tolerances for Modular Block Dimensions: Modular blocks shall be manufactured within the following tolerances:
1) The length and width of each individual block shall be within ⅛ inch of the specified dimension. Hollow units shall have a minimum wall thickness of 1¼ inches.
2) The height of each individual block shall be within 1/16 inch of the specified dimension. 3) When a broken (split) face finish is required, the dimension of the front face shall be within
1.0 inch of the theoretical dimension of the unit. (E) Finish and Appearance: Units that indicate imperfect molding, honeycomb or open texture concrete and color variation on front face of block due to excess form oil or other reasons shall be rejected. All units shall be visually efflorescence free. All units shall be sound and free of cracks or other defects that would interfere with the proper placing of the unit or significantly impair the strength or permanence of the construction. Minor cracks (e.g. no greater than 1/50 inch in width and no longer than 25% of the unit height) incidental to the usual method of manufacture or minor chipping resulting from shipment and delivery, are not grounds for rejection.
The exposed faces shall be free of chips, cracks or other imperfections when viewed from a distance of 30 feet under diffused lighting. Up to five (5) percent of a shipment may contain slight cracks or small chips not larger than 1.0 inch.
Color and finish shall be as shown on the plans and shall be erected with a running bond configuration. (F) Pins: If pins are required to align modular block facing units, they shall consist of a non-degrading polymer or hot-dipped galvanized steel and be made for the express use with the modular block units supplied. Connecting pins shall be capable of holding the geogrid in the proper design position during backfilling. (G) Cap Units and Adhesive: The cap unit connection to the block unit immediately under it shall be of a positive interlocking type and not frictional. Cap units shall be cast to or attached to the top of modular block facing units in strict accordance with the requirements of the manufacturer of the blocks and the adhesive. The surface of the block units under the cap units shall be clear of all debris and standing water before the

FHWA NHI-10-025 10 – Contracting Methods MSE Walls and RSS – Vol II 10 - 33 November 2009
approved adhesive is placed. Contractor shall provide a written 10-year warranty, acceptable to Owner, that the integrity of the materials used to attach the cap blocks will preclude separation and displacement of the cap blocks for the warranty period. (H) Unit (Core) Fill: Unit (core) fill is defined as free-draining, coarse grained material that is placed within the empty cores of the modular block facing units. Unit (core) fill shall be a well graded crushed stone or granular fill meeting the gradation shown in Table 7. Gradation for unit fill shall be tested at the frequency of 1 test per 50 yd3 at the job site and for every change in the material source.
Table 7 Gradation for Unit (Core) Fill
U.S. Sieve Size Percent Passing
1½-inch 100
1-inch 75-100
¾-inch 50-75
No. 4 0-60
No. 40 0-50
No. 200 0-5
(I) Gravel Fill: A minimum width of 1-ft of gravel fill should be provided behind solid (non-hollow) modular block units. A minimum volume of 1-ft3/ft2 of drainage fill shall be provided. Gravel fill shall meet the requirements of the unit (core) fill. A suitable geotextile fabric between the gravel fill and reinforced wall fill shall be used to meet the filtration requirements if the gravel fill does not meet the filtration criteria. The selection of a suitable geotextile for filtration purposes shall be supported by design computations taking in to account the actual gradations of the gravel fill and the reinforced wall fill to be used on the project. Gradation for gravel fill shall be tested at the frequency of 1 test per 50 yd3 at the job site and for every change in the material source. 3.10 Certificate of Analysis for Modular Block Connection For modular block facing units, a certification shall be provided with detailed calculations according to AASHTO (2007) and the results of laboratory test results performed in accordance with Section C.3 in Appendix B of FHWA NHI-10-025, dated 2009 (“Mechanically Stabilized Earth Walls and Reinforced Soil Slopes – Volume II”). Such certification shall demonstrate that all connections, including block-to-reinforcement and block-to-block connections, and all related components meet or exceed the current AASHTO 75 year design life requirements and are capable of resisting 100% of the maximum tension in the soil reinforcements at any level within the wall. Long-term connection testing for extensible reinforcements is also required. The effect of wall batter and normal pressures representative of the full range of wall configurations and heights shall be incorporated in the tests.
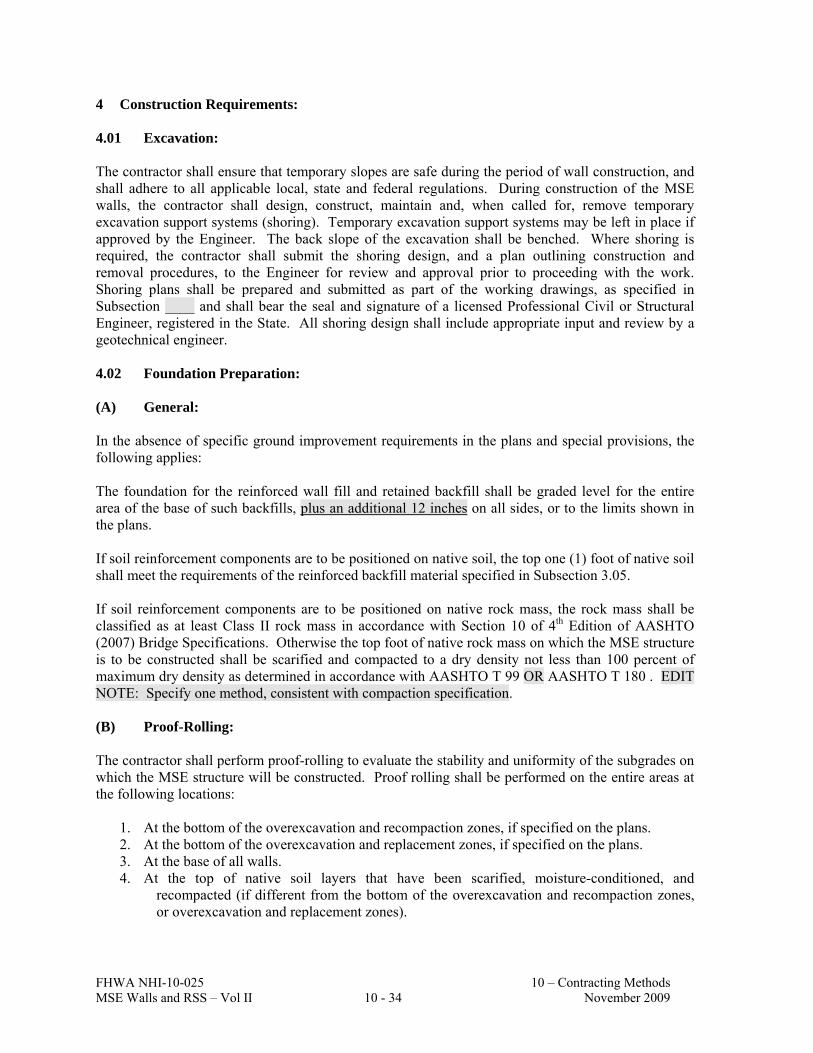
FHWA NHI-10-025 10 – Contracting Methods MSE Walls and RSS – Vol II 10 - 34 November 2009
4 Construction Requirements: 4.01 Excavation: The contractor shall ensure that temporary slopes are safe during the period of wall construction, and shall adhere to all applicable local, state and federal regulations. During construction of the MSE walls, the contractor shall design, construct, maintain and, when called for, remove temporary excavation support systems (shoring). Temporary excavation support systems may be left in place if approved by the Engineer. The back slope of the excavation shall be benched. Where shoring is required, the contractor shall submit the shoring design, and a plan outlining construction and removal procedures, to the Engineer for review and approval prior to proceeding with the work. Shoring plans shall be prepared and submitted as part of the working drawings, as specified in Subsection ____ and shall bear the seal and signature of a licensed Professional Civil or Structural Engineer, registered in the State. All shoring design shall include appropriate input and review by a geotechnical engineer. 4.02 Foundation Preparation: (A) General: In the absence of specific ground improvement requirements in the plans and special provisions, the following applies: The foundation for the reinforced wall fill and retained backfill shall be graded level for the entire area of the base of such backfills, plus an additional 12 inches on all sides, or to the limits shown in the plans. If soil reinforcement components are to be positioned on native soil, the top one (1) foot of native soil shall meet the requirements of the reinforced backfill material specified in Subsection 3.05. If soil reinforcement components are to be positioned on native rock mass, the rock mass shall be classified as at least Class II rock mass in accordance with Section 10 of 4th Edition of AASHTO (2007) Bridge Specifications. Otherwise the top foot of native rock mass on which the MSE structure is to be constructed shall be scarified and compacted to a dry density not less than 100 percent of maximum dry density as determined in accordance with AASHTO T 99 OR AASHTO T 180 . EDIT NOTE: Specify one method, consistent with compaction specification. (B) Proof-Rolling: The contractor shall perform proof-rolling to evaluate the stability and uniformity of the subgrades on which the MSE structure will be constructed. Proof rolling shall be performed on the entire areas at the following locations:
1. At the bottom of the overexcavation and recompaction zones, if specified on the plans. 2. At the bottom of the overexcavation and replacement zones, if specified on the plans. 3. At the base of all walls. 4. At the top of native soil layers that have been scarified, moisture-conditioned, and
recompacted (if different from the bottom of the overexcavation and recompaction zones, or overexcavation and replacement zones).

FHWA NHI-10-025 10 – Contracting Methods MSE Walls and RSS – Vol II 10 - 35 November 2009
Proof-rolling shall be done immediately after subgrade compaction while the moisture content of the subgrade soil is near optimum, or at the moisture content that was used to achieve the required compaction. If proof-rolling is performed after installation of pipe underdrains, the proof-roller shall not be used within 1½ feet of the underdrains. Proof-rolling shall be performed with a pneumatic-tired tandem axle roller with at least three wheels on each axle, a gross weight of 25 tons (50 kips), a minimum tire pressure of 75 pounds per square inch, and a minimum rolling width of 75 inches. A Caterpillar PS-300B (or PF-300B), Ingersoll-Rand PT-240R, BOMAG BW24R, Dynapac CP271, or equipment with equivalent capabilities shall be used for proof-rolling. Proof-rolling equipment shall be operated at a speed between 1.5 and 3 miles per hour, or slower as required by the Engineer to permit measurements of the deformations, ruts and/or pumping. Proof-rolling shall be carried out in two directions at right angles to each other with no more than 24 inches between tire tracks of adjacent passes. The contractor shall operate the proof-roller in a pattern that readily allows for the recording of deformation data and complete coverage of the subgrade. The following actions shall be taken based on the results of the proof-rolling activity:
1. Rutting less than ¼-inch – The grade is acceptable. 2. Rutting greater than ¼-inch and less than 1½ inches – The grade shall be scarified and re-
compacted. 3. Rutting greater than 1½ inches – The compacted area shall be removed and reconstructed. 4. Pumping (deformation that rebounds, or materials that are squeezed out of a wheel’s path)
greater than one(1) inch – The area shall be remediated as directed by the Engineer. The contractor shall be responsible for maintaining the condition of the approved proof-rolled soils throughout the duration of the retaining wall construction. Wall construction shall not commence until the foundation has been approved by the Engineer. 4.03 Concrete Leveling Pad: Leveling pads shall be constructed of unreinforced concrete as shown on the working drawings. Gravel leveling pads shall not be allowed. As a minimum, the concrete for leveling pads shall meet the requirements of Section __. The elevation of the top of leveling pad shall be within ⅛ inch from the design elevation when measured by a straightedge over any 10-foot run of the leveling pad. The minimum width of the leveling pad shall be the width of the facing unit plus 8-inches. The centerline of the leveling pad shall be within 1 inch from design location. When the facing units are centered on the leveling pad, the leveling pad shall extend approximately 4-inches beyond the limits of the facing unit as measured in the direction perpendicular to the face of the wall. Cast-in-place leveling pads shall be cured for a minimum of 24 hours before placement of wall facing units. A geotextile shall be applied over the back of the area of any openings between the facing units and leveling pad steps. The geotextile shall extend a minimum of six (6) inches beyond the edges of the opening. The opening shall be filled with concrete, conforming to Section ___, or shall be concurrently backfilled on both sides with soil..

FHWA NHI-10-025 10 – Contracting Methods MSE Walls and RSS – Vol II 10 - 36 November 2009
4.04 Subsurface Drainage: Prior to wall erection, the contractor shall install a subsurface drainage system as shown on the working drawings. 4.05 Wall Erection: (A) General: Walls shall be erected in accordance with the manufacturer’s written instructions. The contractor shall be responsible for ensuring that a field representative from the manufacturer is available at the site during construction of the initial 10-foot height of the full length of wall, and as called upon thereafter by the Engineer, to assist the contractor and Engineer at no additional cost to the Agency. All temporary construction aids (e.g., wedges, clamps, etc.) shall be in accordance with the manufacturer’s recommendations. (B) Placement Tolerances for Walls with Precast Facing: For walls with rigid facing, such as precast concrete panels, the panels shall be placed such that their final position is vertical or battered as shown on the working drawings. As wall fill material is placed, the panels shall be maintained in the correct vertical alignment by means of temporary wedges, clamps, or bracing as recommended by the manufacturer. A minimum of two, but not more than three, rows of panel wedges shall remain in place at all times during wall erection. Wedges shall be removed from lower rows as panel erection progresses, so as to prevent chipping or cracking of concrete panels. The contractor shall repair any damage to erected concrete panels as directed by the Engineer and to the Engineer’s satisfaction. No external wedges in front of the wall shall remain in place when the wall is complete. Erection of walls with panel facing shall be in accordance with the following tolerances:
Vertical and horizontal alignment of the wall face shall not vary by more than ¾ inch when measured along a 10-foot straightedge.
The overall vertical tolerance (plumbness) of the finished wall shall not exceed ½ inch per 10 feet of wall height. Negative (outward leaning) batter is not acceptable.
The maximum permissible out of plane offset at any panel joint shall not exceed ⅜ inch. The final horizontal and vertical joint gaps between adjacent facing panel units shall be
within ⅛ inch and ¼ inch, respectively, of the design final joint opening per the approved calculations required in Subsection 3.01(H).
Wall sections not conforming to these tolerances shall be reconstructed at no additional cost to the Department. (C) Placement Tolerances for Permanent Walls with Flexible Facing: Erection of permanent walls with flexible facing (such as welded wire mesh) shall be in accordance with the following tolerances:
Vertical and horizontal alignment of the wall face shall not vary by more than two (2) inches when measured along a 10-foot straightedge, or as shown in the plans and specifications.

FHWA NHI-10-025 10 – Contracting Methods MSE Walls and RSS – Vol II 10 - 37 November 2009
The overall vertical tolerance (plumbness) of the wall shall not exceed one (1) inch per 10 feet of wall height. Negative (outward leaning) batter is not acceptable.
The offset limit between consecutive rows of facing shall not exceed one (1) inch from planned offset.
Wall sections not conforming to these tolerances shall be reconstructed at no additional cost to the Department. (D) Placement Tolerances for Modular Block Units: Erection of walls with Modular Block Units shall be as per the following requirements:
Vertical and horizontal alignment of the wall face shall not vary by more than ¾-inch when measured along a 10-feet straightedge.
Overall vertical tolerance (plumbness) of the wall shall not exceed 1¼-inch per 10-ft of wall height from the final wall batter. Negative (outward leaning) batter is not acceptable.
The first row of units shall be level from unit-to-unit and from front-to-back. Use the tail of the units for alignment and measurement.
All units shall be laid snugly together and parallel to the straight or curved line of the wall face.
Unless otherwise noted, all blocks shall be dry-stacked and placed with each block evenly spanning the joint in the row below (running bond). Shimming or grinding shall control the elevations of any two adjacent blocks within 1/16 inch.
The top of blocks shall be checked with a minimum length of 3-feet long straight edge bubble level. Any high points identified by the straight edge shall be ground flat. Block front to back tilting shall be checked frequently, however correction by shimming shall be done no later than 3 completed courses.
Wall sections not conforming to these tolerances shall be reconstructed at no additional cost to the Department. (E) Placement of Metallic Reinforcement Elements: Metallic reinforcement elements shall be placed normal (perpendicular) to the face of the wall, unless otherwise shown on the approved plans. All reinforcement shall be structurally connected to the wall face. At each level of the soil reinforcement, the reinforced wall fill material shall be roughly leveled and compacted before placing the next layer of reinforcement. The reinforcement shall bear uniformly on the compacted reinforced soil from the connection to the wall to the free end of the reinforcing elements. The reinforcement placement elevation shall be at the connection elevation to two (2) inches higher than the connection elevation. Where overlapping of reinforcing may occur, such as at corners, reinforcing connections to panels shall be adjusted to maintain at least three (3) inches of vertical separation between overlapping reinforcement.
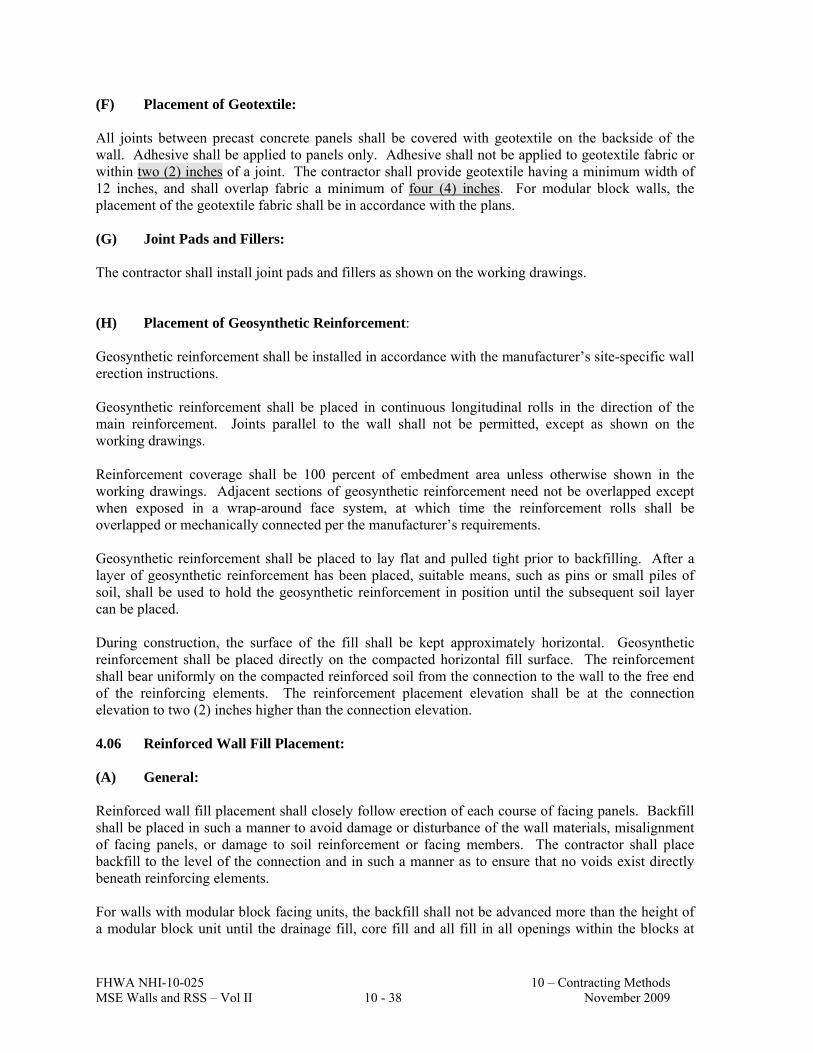
FHWA NHI-10-025 10 – Contracting Methods MSE Walls and RSS – Vol II 10 - 38 November 2009
(F) Placement of Geotextile: All joints between precast concrete panels shall be covered with geotextile on the backside of the wall. Adhesive shall be applied to panels only. Adhesive shall not be applied to geotextile fabric or within two (2) inches of a joint. The contractor shall provide geotextile having a minimum width of 12 inches, and shall overlap fabric a minimum of four (4) inches. For modular block walls, the placement of the geotextile fabric shall be in accordance with the plans. (G) Joint Pads and Fillers: The contractor shall install joint pads and fillers as shown on the working drawings. (H) Placement of Geosynthetic Reinforcement: Geosynthetic reinforcement shall be installed in accordance with the manufacturer’s site-specific wall erection instructions. Geosynthetic reinforcement shall be placed in continuous longitudinal rolls in the direction of the main reinforcement. Joints parallel to the wall shall not be permitted, except as shown on the working drawings. Reinforcement coverage shall be 100 percent of embedment area unless otherwise shown in the working drawings. Adjacent sections of geosynthetic reinforcement need not be overlapped except when exposed in a wrap-around face system, at which time the reinforcement rolls shall be overlapped or mechanically connected per the manufacturer’s requirements. Geosynthetic reinforcement shall be placed to lay flat and pulled tight prior to backfilling. After a layer of geosynthetic reinforcement has been placed, suitable means, such as pins or small piles of soil, shall be used to hold the geosynthetic reinforcement in position until the subsequent soil layer can be placed. During construction, the surface of the fill shall be kept approximately horizontal. Geosynthetic reinforcement shall be placed directly on the compacted horizontal fill surface. The reinforcement shall bear uniformly on the compacted reinforced soil from the connection to the wall to the free end of the reinforcing elements. The reinforcement placement elevation shall be at the connection elevation to two (2) inches higher than the connection elevation. 4.06 Reinforced Wall Fill Placement: (A) General: Reinforced wall fill placement shall closely follow erection of each course of facing panels. Backfill shall be placed in such a manner to avoid damage or disturbance of the wall materials, misalignment of facing panels, or damage to soil reinforcement or facing members. The contractor shall place backfill to the level of the connection and in such a manner as to ensure that no voids exist directly beneath reinforcing elements. For walls with modular block facing units, the backfill shall not be advanced more than the height of a modular block unit until the drainage fill, core fill and all fill in all openings within the blocks at

FHWA NHI-10-025 10 – Contracting Methods MSE Walls and RSS – Vol II 10 - 39 November 2009
that level have been placed. The filled units shall be swept clean of all debris before installing the next level of units and/or placing the geogrid materials. For walls with flexible facing with gabion style facing, the rock near the wall face shall be hand-placed in accordance with the recommendations of the wall manufacturer. The maximum lift thickness before compaction shall not exceed ten (10) inches. EDIT NOTE: Insert Agency maximum lift height. The contractor shall decrease this lift thickness, if necessary, to obtain the specified density. For geosynthetic reinforcements, the fill shall be spread by moving the machinery parallel to or away from the wall facing and in such a manner that the geogrid remains taut. Construction equipment shall not operate directly on the geogrid. A minimum fill thickness of six (6) inches over the geogrid shall be required prior to operation of vehicles. Sudden braking and sharp turning shall be avoided. For metallic reinforcements, the fill shall be spread by moving the machinery parallel to or away from the wall facing and in such a manner that the steel reinforcement remains normal to the face of the wall. Construction equipment shall not operate directly on the steel reinforcement. A minimum fill thickness of three (3) inches over the steel reinforcement shall be required prior to operation of vehicles. Sudden braking and sharp turning shall be avoided. Wall materials which are damaged during backfill placement shall be removed and replaced by the contractor, at no additional cost to the Department. The contractor may submit alternative corrective procedures to the Engineer for consideration. Proposed alternative corrective procedures shall have the concurrence of the MSE wall supplier and designer, in writing, prior to submission to the Engineer for consideration. All corrective actions shall be at no additional cost to the Department. (B) Compaction: Reinforced wall fill shall be compacted to 95 percent of the maximum dry density as determined in accordance with the requirements of AASHTO T 99 OR AASHTO T 180. EDIT NOTE: Specify one method, consistent with compaction specification. Retained backfill shall be compacted to 95 percent of the maximum dry density as determined in accordance with the requirements of AASHTO T 99 (Standard Proctor) OR AASHTO T 180 (Modified Proctor). EDIT NOTE: Specify one method, consistent with compaction specification. Backfill shall be compacted using a static-weighted or vibratory roller. Sheeps-foot or grid-type rollers shall not be used for compacting material within the limits of the soil reinforcement. The contractor shall take soil density tests, in accordance with _______________, to ensure compliance with the specified compaction requirements. Soil density tests shall be taken at intervals of not less than one for every 2000 cubic yards, with a minimum of one test per lift. Compaction tests shall be taken at locations determined by the Engineer. The backfill density requirement within three (3) feet of the wall facing shall be 90 percent of maximum dry density as determined by AASHTO T 99 (Standard Proctor) OR AASHTO T 180 (Modified Proctor). EDIT NOTE: Specify one method, consistent with compaction specification.. Compaction within three (3) feet of the wall shall be achieved by a minimum number of passes of a lightweight mechanical tamper or roller system. The minimum number of passes and rolling pattern shall be determined, prior to construction of the wall, by constructing a test pad section. The

FHWA NHI-10-025 10 – Contracting Methods MSE Walls and RSS – Vol II 10 - 40 November 2009
minimum dimensions of the test pad shall be five (5) feet wide, 15 feet long, and three (3) feet final depth. Compaction in the test pad section shall be performed as follows:
Maximum lift thickness before compaction shall be eight (8) inches. Minimum one density test per lift.
Only those methods used to establish compaction compliance in the test pad section shall be used for production work. Any change in the material as per Table 5 or the approved equipment shall require the contractor to conduct a new test pad section and obtain re-approval by the Engineer of the minimum number of passes and rolling pattern. No measurement or payment will be made for test pad sections. (C) Moisture Control: The moisture content of the backfill material prior to and during compaction shall be uniformly dispersed throughout each layer. Backfill materials shall have a placement moisture content three (3) percent less than or equal to optimum moisture content, as determined in accordance with the requirements of AASHTO T 99 (Standard Proctor) OR AASHTO T 180 (Modified Proctor). EDIT NOTE: Specify one method, consistent with compaction specification. for the reinforced wall fill, and AASHTO T 99 (Standard Proctor) OR AASHTO T 180 for (Modified Proctor). EDIT NOTE: Specify one method, consistent with compaction specification. the retained backfill. Backfill material with a placement moisture content in excess of optimum shall be removed and reworked until the moisture content is uniform and acceptable throughout the entire lift. (D) Protection of the Work: The contractor shall not allow surface runoff from adjacent areas to enter the wall construction site at any time during construction operations. In addition, at the end of each day’s operation, the contractor shall slope the last lift of backfill away from the wall facing so that runoff is directed away from the structure. If the subgrade is damaged due to water or otherwise, such that it does not meet the requirements of Subsection 4.02, then as directed by the Engineer, the contractor shall rework and repair the damaged subgrade at no additional expense to the Department. The criteria in Subsection 4.02 shall be used to judge the adequacy of the repair. Rework and repair shall extend to a depth where undamaged work is encountered. 5 Method of Measurement: Mechanically Stabilized Earth (MSE) retaining walls will be measured by the square foot of completed wall. The vertical height will be taken as the difference in elevation measured from the top of wall to the top of the leveling pad. OR The pay area will be taken as the wall panel area supplied. EDIT NOTE: Specify one or the other option. 6 Basis of Payment: The accepted quantities of Mechanically Stabilized Earth (MSE) retaining walls, measured as provided above, will be paid for at the contract unit price per square foot of wall, complete in place. Such price shall include full compensation for furnishing all designs, design revisions, associated working drawings, engineering calculations, labor, materials EDIT NOTE: may or may not include reinforced wall fill, see below, tools, equipment, and incidentals. Such price shall also include

FHWA NHI-10-025 10 – Contracting Methods MSE Walls and RSS – Vol II 10 - 41 November 2009
provision of manufacturer’s field representative, and all work involved in constructing the retaining walls, including foundation preparation, proof-rolling, footings, drainage features, wall facing, slip joints, concrete or shotcrete caps and aprons, rustication, paint or stain, grout, tendons, cables, anchors, fabric, and all hardware and reinforcing steel, complete in place as shown on the plans and as specified herein. No separate measurement or payment will be made for excavation, reinforced wall fill, and retained backfill associated with retaining walls, the cost of such work being considered as included in the price paid for the MSE retaining wall. EDIT NOTE: Reinforced wall fill is a separate pay item for some Agencies, and is listed as such. No separate measurement or payment will be made for the design, construction, or removal of temporary excavation support systems (shoring), or associated geotechnical review, the cost of such work being considered as included in the price paid for the MSE retaining wall.
10.10 CONSTRUCTION SPECIFICATIONS FOR REINFORCED SLOPE
SYSTEMS The availability of many different geosynthetic reinforcement materials as well as drainage and erosion control products requires consideration of different alternatives prior to preparation of contract documents so contractors are given an opportunity to bid using feasible, cost-effective materials. Any proprietary material should undergo an Agency review prior to inclusion as either an alternate offered during design (in-house) or construction (value engineering or end result) phase. It is highly recommended that each Agency develop documented procedures for: C Review and approval of geosynthetic soil reinforcing materials. C Review and approval of drainage composite materials. C Review and approval of erosion control materials. C Review and approval of geosynthetic reinforced slope systems and suppliers. C In-house design and performance criteria for reinforced slopes. The following guidelines are recommended as the basis for specifications or special provisions for the furnishing and construction of reinforced soil slopes on the basis of pre approved reinforcement materials. Specification guidelines are presented for each of the following topics: 1. Specification Guidelines for RSS Construction (Agency design). 2. Specifications for Erosion Control Mat or Blanket. 3. Specifications for Geosynthetic Drainage Composite. 4. Specification Guidelines for Proprietary Geosynthetic RSS Systems.

FHWA NHI-10-025 10 – Contracting Methods MSE Walls and RSS – Vol II 10 - 42 November 2009
10.10.1 Specification Guidelines For RSS Construction (Agency Design) Description Work shall consist of furnishing and placing geosynthetic soil reinforcement for construction of reinforced soil slopes.
Geosynthetic Reinforcement Material The specific geosynthetic reinforcement material and supplier shall be pre approved by the Agency as outlined in the Agency's reinforced soil slope policy. The geosynthetic reinforcement shall consist of a geogrid or a geotextile that can develop sufficient mechanical interlock with the surrounding soil or rock. The geosynthetic reinforcement structure shall be dimensionally stable and able to retain its geometry under construction stresses and shall have high resistance to damage during construction, ultraviolet degradation, and all forms of chemical and biological degradation encountered in the soil being reinforced. The geosynthetics shall have a Nominal Long-Term Strength (Tal) and Pullout Resistance, for the soil type(s) indicated, as listed in Table S1 for geotextiles and/or Table S2 for geogrids. The Contractor shall submit a manufacturer's certification that the geosynthetics supplied meet the respective index criteria set when the geosynthetic was approved by the Agency, measured in full accordance with all test methods and standards specified. In case of dispute over validity of values, the Engineer can require the Contractor to supply test data from an Agency approved laboratory to support the certified values submitted, the Contractor’s cost. Quality Assurance/Index Properties: Testing procedures for measuring design properties require elaborate equipment, tedious set up procedures and long durations for testing. These tests are inappropriate for quality assurance (QA) testing of geosynthetic reinforcements received on site. In lieu of these tests for design properties, a series of index criteria may be established for QA testing. These index criteria include mechanical and geometric properties that directly impact the design strength and soil interaction behavior of geosynthetics. It is likely each family of products will have varying index properties and QC/QA test procedures. QA testing should measure the respective index criteria set when the geosynthetic was approved by the Agency. Minimum average roll values, per ASTM D 4759, shall be used for conformance.

FHWA NHI-10-025 10 – Contracting Methods MSE Walls and RSS – Vol II 10 - 43 November 2009
Table S-1. Required Geotextile Reinforcement Properties.
Geotextile(1) Ultimate Strength (TULT)
ASTM D4595(2)
Nominal Long-Term Strength(3)
(Tal)
For use with these Fills(4)
A GW-GM A
SW-SM-SC
B GW-GM B
SW-SM-SC
NOTES: 1. For geotextiles, minimum permeability > ___ cm/s > reinforced soil permeability.
Minimum survivability properties – Class 1 per AASHTO M-288 specification. 2. Based on minimum average roll values (MARV) (lb/ft {kN/m}). 3. Nominal long-term strength (Tal) based on (lb/ft {kN/m})
CRIDD
ULTal RFRFRF
TT
where RFCR is developed from creep tests performed in accordance with ASTM D5262, RFID obtained from site installation damage testing and RFD from hydrolysis or oxidative degradation testing extrapolated to 75 or 100 year design life. For default reduction factors, include the durability requirements in Table 3-12 as additional reinforcement property requirements.
4. Unified Soil Classification.
Table S-2. Required Geogrid Properties.
Geosynthetic(1) Ultimate Strength (TULT)
ASTM D6637(2)
Nominal Long-Term Strength(3)
(Tal)
For use with these Fills(4)
A GW-GM A
SW-SM-SC
B GW-GM B
SW-SM-SC
NOTES: 1. For geotextiles, minimum permeability > ___ cm/s > reinforced soil permeability.
Minimum survivability properties – Class 1 per AASHTO M-288 specification. 2. Based on minimum average roll values (MARV) (kN/m). Use D6637 for
geogrids. 3. Nominal long-term strength (Tal) based on (lb/ft {kN/m})
CRIDD
ULTal RFRFRF
TT
where RFCR is developed from creep tests performed in accordance with ASTM D5262, RFID obtained from site installation damage testing and RFD from hydrolysis or oxidative degradation testing extrapolated to 75 or 100 year design life. For default reduction factors, include the durability requirements in Table 3-12 as additional reinforcement property requirements.
4. Unified Soil Classification.

FHWA NHI-10-025 10 – Contracting Methods MSE Walls and RSS – Vol II 10 - 44 November 2009
Construction Delivery, Storage, and Handling - Follow requirements set forth under materials specifications for geosynthetic reinforcement, drainage composite, and geosynthetic erosion mat. Site Excavation - All areas immediately beneath the installation area for the geosynthetic reinforcement shall be properly prepared as detailed on the plans, specified elsewhere within the specifications, or directed by the Engineer. Subgrade surface shall be level, free from deleterious materials, loose, or otherwise unsuitable soils. Prior to placement of geosynthetic reinforcement, subgrade shall be proof-rolled to provide a uniform and firm surface. Any soft areas, as determined by the Owner's Engineer, shall be excavated and replaced with suitable compacted soils. The foundation surface shall be inspected and approved by the Owner's Geotechnical Engineer prior to fill placement. Benching the backcut into competent soil shall be performed as shown on the plans or as directed, in a manner that ensures stability. Geosynthetic Placement - The geosynthetic reinforcement shall be installed in accordance with the manufacturer's recommendations, unless otherwise modified by these specifications. The geosynthetic reinforcement shall be placed within the layers of the compacted soil as shown on the plans or as directed.
C The geosynthetic reinforcement shall be placed in continuous longitudinal strips in the direction of main reinforcement. Joints in the design strength direction (perpendicular to the slope) shall not be permitted with geotextile or geogrid, except as indicated on the drawings.
C Horizontal coverage of less than 100 percent shall not be allowed unless specifically detailed in the construction drawings. In the case of 100% coverage in plan view adjacent strips need not be overlapped.
C Adjacent rolls of geosynthetic reinforcement shall be overlapped or mechanically connected where exposed in a wrap-around face system, as applicable.
C Place only that amount of geosynthetic reinforcement required for immediately pending work to prevent undue damage. After a layer of geosynthetic reinforcement has been placed, the next succeeding layer of soil shall be placed and compacted as appropriate. After the specified soil layer has been placed, the next geosynthetic reinforcement layer shall be installed. The process shall be repeated for each subsequent layer of geosynthetic reinforcement and soil.
C Geosynthetic reinforcement shall be placed to lay flat and pulled tight prior to backfilling. After a layer of geosynthetic reinforcement has been placed, suitable means, such as pins or small piles of soil, shall be used to hold the geosynthetic reinforcement in position until the subsequent soil layer can be placed. Under no circumstances shall a track-type vehicle be allowed on the geosynthetic reinforcement before at least 6 in. (150 mm) of soil has been placed. Sudden braking and sharp turning – sufficient to displace fill – shall be avoided.
C During construction, the surface of the fill should be kept approximately horizontal. Geosynthetic reinforcement shall be placed directly on the compacted horizontal fill surface. Geosynthetic reinforcements are to be placed within 3 in. (75 mm) of the design elevations and extend the length as shown on the elevation view unless otherwise directed by the

FHWA NHI-10-025 10 – Contracting Methods MSE Walls and RSS – Vol II 10 - 45 November 2009
Owner's Engineer. Correct orientation of the geosynthetic reinforcement shall be verified by the Contractor.
Fill Placement - Fill shall be compacted as specified by project specifications or to at least 95 percent of the maximum density determined in accordance with AASHTO T-99, whichever is greater.
C Density testing shall be made every 500 yd3 (420 m3) of soil placement or as otherwise specified by the Owner's Engineer or contract documents.
C Backfill shall be placed, spread, and compacted in such a manner to minimize the
development of wrinkles and/or displacement of the geosynthetic reinforcement. C Fill shall be placed in 12-inch (300 mm) maximum lift thickness where heavy compaction
equipment is to be used, and 6-inch (150 mm) maximum uncompacted lift thickness where hand operated equipment is used.
C Backfill shall be graded away from the slope crest and rolled at the end of each work day to prevent ponding of water on surface of the reinforced soil mass.
C Tracked construction equipment shall not be operated directly upon the geosynthetic reinforcement. A minimum fill thickness of 6-in. (150 mm) is required prior to operation of tracked vehicles over the geosynthetic reinforcement. Turning of tracked vehicles should be kept to a minimum to prevent tracks from displacing the fill and the geosynthetic reinforcement.
C If approved by the Engineer, rubber-tired equipment may pass over the geosynthetic reinforcement at speeds of less than 25 mph (16 km/h). Sudden braking and sharp turning shall be avoided.
Erosion Control Material Installation. See Erosion Control Material Specification for installation notes. Geosynthetic Drainage Composite. See Geocomposite Drainage Composite Material Specification for installation notes. Final Slope Geometry Verification. Contractor shall confirm that as-built slope geometries conform to approximate geometries shown on construction drawings. Method of Measurement Measurement of geosynthetic reinforcement is on a square yard (meter) basis and will be computed on the total area of geosynthetic reinforcement shown on the construction drawings, exclusive of the area of geosynthetics used in any overlaps. Overlaps are an incidental item.

FHWA NHI-10-025 10 – Contracting Methods MSE Walls and RSS – Vol II 10 - 46 November 2009
Basis of Payment The accepted quantities of geosynthetic reinforcement by Type will be paid for per square yard (meter) in-place. Payment will be made under:
Pay Item Pay Unit Geogrid Soil Reinforcement – Type A Square yard (meter) Geogrid Soil Reinforcement – Type B square yard (meter) Or Geotextile Soil Reinforcement – Type A square yard (meter) Geotextile Soil Reinforcement – Type B square yard (meter)
10.10.2 Specification for Erosion Control Mat or Blanket
Description Work shall consist of furnishing and placing a synthetic erosion control mat and/or degradable erosion control blanket for slope face protection and lining of runoff channels for use in construction of reinforced soil slopes as shown on the plans or as specified by the Engineer. Materials (1) Erosion Control
The specific erosion control material and supplier shall be prequalified by the Agency prior to use.
Prequalification procedures and a current list of prequalified materials may be obtained by writing to the Agency. A 1 ft by 1 ft (0.3 m by 0.3 m) sample of the material may be required by the Engineer in order to verify prequalification.
The soil erosion control mat shall be a Class __ material and be one (1) of the following types as shown on the plans:
(i) Type __. Long-term duration (Longer than 2 Years) Shear Stress (td) > 2 psf (95 Pa) to < 5 psf (240 Pa) Prequalified Type __ products are: ______________ ______________ ______________ ______________ (ii) Type __. Long-term duration (Longer than 2 Years) Shear Stress (td) greater than or equal to 5 psf (240 Pa)

FHWA NHI-10-025 10 – Contracting Methods MSE Walls and RSS – Vol II 10 - 47 November 2009
Prequalified Type __ products are: ______________ ______________ ______________ ______________
Certification. The Contractor shall submit a manufacturer's certification that the erosion mat/blanket supplied meets the property criteria specified when the material was approved by the Agency. The manufacturer's certification shall include a submittal package of documented test results that confirm the property values. In case of dispute over validity of property values, the Engineer can require the Contractor to supply property test data from an approved laboratory to support the certified values submitted. Minimum average roll values, per ASTM D4759, shall be used for conformance.
(2) Staples.
Staples for anchoring the soil erosion control mat shall be U-shaped, made of 1/8 in. (3 mm) or large diameter steel wire, or other approved material, have a width of 1 to 2 in. (25 to 50 mm), and a length of not less than 18 in. (450 mm) for the face of RSS, and not less than 12 in. (300 mm) for runoff channels.
Construction Methods (1) General.
The soil erosion control mat shall conform to the class and type shown on the plans. The Contractor has the option of selecting an approved soil erosion control mat conforming to the class and type shown on the plans, and according to the current approved material list.
(2) Installation.
The soil erosion control mat, whether installed as slope protection or as flexible channel liner in accordance with the approved materials list, shall be placed within 24 hours after seeding or sodding operations have been completed, or as approved by the Engineer. Prior to placing the mat, the area to be covered shall be relatively free of all rocks or clods over 1-½ inches (38 mm) in maximum dimension and all sticks or other foreign material which will prevent the close contact of the mat with the soil. The area shall be smooth and free of ruts or depressions exist for any reason, the Contractor shall be required to rework the soil until it is smooth and to reseed or resod the area at the Contractor’s expense.
Installation and anchorage of the soil erosion control mat shall be in accordance with the project construction drawings unless otherwise specified in the contract or directed by the Engineer.
The erosion control material shall be placed and anchored on a smooth graded, firm surface approved by the Engineer. Anchoring terminal ends of the erosion control material shall be accomplished through use of key trenches. The material in the trenches shall be anchored to the soil with staples on maximum 20 in. (0.5 m) centers.

FHWA NHI-10-025 10 – Contracting Methods MSE Walls and RSS – Vol II 10 - 48 November 2009
Erosion control material shall be anchored, overlapped, and otherwise constructed to ensure performance until vegetation is well established. Pins shall be as designated on the construction drawings, with a maximum spacing of 4 ft. (1.25 m) recommended.
Soil Filling. If noted on the construction drawings, the erosion control mat shall be filled with a fine grained topsoil, as recommended by the manufacturer. Soil shall be lightly raked or brushed on/into the mat to fill mat thickness or to a maximum depth of 1 in. (25 mm).
Method of Measurement Measurement of erosion mat and erosion blanket material is on a square meter basis and will be computed on the projected slope face area from defined plan lines, exclusive of the area of material used in any overlaps, or from payment lines established in writing by the Engineer. Overlaps, anchors, checks, terminals or junction slots, and wire staples or wood stakes are incidental items. Quantities of erosion control material as shown on the plans may be increased or decreased at the direction of the Engineer based on construction procedures and actual site conditions. Such variations in quantity will not be considered as alterations in the details of construction or a change in the character of work. Basis of Payment The accepted quantities of erosion control material will be paid for per square meter in place. Payment will be made under:
Pay Item Pay Unit
Geosynthetic (Permanent) Erosion Control Mat square yard (meter) and/or
Degradable (Temporary) Erosion Control Blanket square yard (meter)
10.10.3 Specification for Geosynthetic Drainage Composite Description Work shall consist of furnishing and placing a geosynthetic drainage system as a subsurface drainage media for reinforced soil slopes.

FHWA NHI-10-025 10 – Contracting Methods MSE Walls and RSS – Vol II 10 - 49 November 2009
Drainage Composite Materials The specific drainage composite material and supplier shall be preapproved by the Agency. The geocomposite drain shall be:
[ insert approved materials that meet the project requirements. Geocomposites should be designed on a project specific basis. Design criteria for flow capacity, filtration, and permeability are summarized in the FHWA Geosynthetic, Design and Construction Guidelines (Holtz et al., 2008). ]
OR
The geocomposite drain shall be a composite construction consisting of a supporting structure or drainage core material surrounded by a geotextile. The geotextile shall encapsulate the drainage core and prevent random soil intrusion into the drainage structure. The drainage core material shall consist of a three dimensional polymeric material with a structure that permits flow along the core laterally. The core structure shall also be constructed to permit flow regardless of the water inlet surface. The drainage core shall provide support to the geotextile. The core and fabric shall meet the minimum property requirements listed in Table S3. A geotextile flap shall be provided along all drainage core edges. This flap shall be of sufficient width for sealing the geotextile to the adjacent drainage structure edge to prevent soil intrusion into the structure during and after installation. The geotextile shall cover the full length of the core. The geocomposite core shall be furnished with an approved method of constructing and connecting with outlet pipes or weepholes as shown on the plans. Any fittings shall allow entry of water from the core but prevent intrusion of backfill material into the core material. Certification and Acceptance. The Contractor shall submit a manufacturer's certification that the geosynthetic drainage composite supplied meets the design properties and respective index criteria measured in full accordance with all test methods and standards specified. The manufacturer's certification shall include a submittal package of documented test results that confirm the design values. In case of dispute over validity of design values, the Engineer can require the Contractor to supply design property test data from an approved laboratory, to support the certified values submitted. Minimum average roll values, per ASTM D4759, shall be used for conformance.

FHWA NHI-10-025 10 – Contracting Methods MSE Walls and RSS – Vol II 10 - 50 November 2009
Table S3. Minimum Physical Property Criteria For Geosynthetic Drainage Composites In Reinforced Soil Slopes
PROPERTY TEST METHOD VALUE1
Composite:
Flow Capacity2 ASTM D4716 ft2/s/ unit width (min)
Geotextile:
AOS3 ASTM D4751 ___ Max. Diameter (mm)
Permeability4 ASTM D44915 ______ cm/s
Trapezoidal Tear CLASS 26
CLASS 37
ASTM D4533 56 lb (250 N) 40 lb (180 N)
Grab Strength CLASS 26 CLASS 37
ASTM D4632 160 lb (700 N) 110 lb (500 N)
Puncture CLASS 26 CLASS 37
ASTM D6241 310 lb (1375 N) 40 lb (180 N)
Notes: 1. Values are minimum unless noted otherwise. Use value in weaker principal direction, as applicable. All
numeric values represent minimum average roll values. 2. The flow capacity requirements for the project shall be determined with consideration of design flow rate,
compressive load on the drainage material, and slope of drainage composite installation. 3. Both a maximum and a minimum AOS may be specified. Sometimes a minimum diameter is used as a
criterion for improved clogging resistance. See FHWA Geosynthetic Design and Construction Guidelines (Holtz et al., 2008) for further information.
4. Permeability is project specific. A nominal coefficient of permeability may be determined by multiplying permittivity value by nominal thickness. The k value of the geotextile should be greater than the k value of the soil.
5. Standard Test Methods for Water Permeability (hydraulic conductivity) of Geotextiles by Permittivity. 6. CLASS 2 geotextiles are recommended where construction conditions are unknown or where sharp angular
aggregate is used and a heavy degree of compaction (95% AASHTO T99) is specified. 7. CLASS 3 geotextiles (from AASHTO M-288) may be used with smooth graded surfaces having no sharp
angular projections, no sharp aggregate is used, and compaction requirements are light (<95% AASHTO T99).
Construction Delivery, Storage, and Handling. The Contractor shall check the geosynthetic drainage composite upon delivery to ensure that the proper material has been received. During all periods of shipment and storage, the geosynthetic drainage composite shall be protected from temperatures greater than 140o F (60o C), mud, dirt, and debris. Follow manufacturer's recommendations in regards to

FHWA NHI-10-025 10 – Contracting Methods MSE Walls and RSS – Vol II 10 - 51 November 2009
protection from direct sunlight. At the time of installation, the geosynthetic drainage composite shall be rejected if it has defects, tears, punctures, flaws, deterioration, or damage incurred during manufacture, transportation, or storage. If approved by the Engineer, torn or punctured sections may be removed or repaired. Any geosynthetic drainage composite damaged during storage of installation shall be replaced by the Contractor at no additional cost to the Owner. Placement. The soil surface against which the geosynthetic drainage composite is to be placed shall be free of debris and inordinate irregularities that will prevent intimate contact between the soil surface and the drain. Seams. Edge seams shall be formed by utilizing the flap of geotextile extending from the geocomposite's edge and lapping over the top of the geotextile of the adjacent course. The geotextile flap shall be securely fastened to the adjacent fabric by means of plastic tape or non-water-soluble construction adhesive, as recommended by the supplier. Where vertical splices are necessary at the end of a geocomposite roll or panel, a 8-inch (200-mm)-wide continuous strip of geotextile may be placed, centered over the seam and continuously fastened on both sides with plastic tape or non water soluble construction adhesive. As an alternative, rolls of geocomposite drain material may be joined together by turning back the geotextile at the roll edges and interlocking the cuspidations approximately 2 in. (50 mm). For overlapping in this manner, the geotextile shall be lapped over and tightly taped beyond the seam with tape or adhesive. Interlocking of the core shall always be made with the upstream edge on top in the direction of water flow. To prevent soil intrusion, all exposed edges of the geocomposite drainage core shall be covered by tucking the geotextile flap over and behind the core edge. Alternatively, a 1 ft (300 mm) wide strip of geotextile may be used in the same manner, fastening it to the exposed fabric 8 in. (200 mm) in from the edge and fold the remaining flap over the core edge. Repairs. Should the geocomposite be damaged during installation by tearing or puncturing, the damaged section shall be cut out and replaced completely or repaired by placing a piece of geotextile that is large enough to cover the damaged area and provide a sufficient overlap on all sides to fasten. Soil Fill Placement. Structural backfill shall be placed immediately over the geocomposite drain. Care shall be taken during the backfill operation not to damage the geotextile surface of the drain. Care shall also be taken to avoid excessive settlement of the backfill material. The geocomposite drain, once installed, shall not be exposed for more than seven days prior to backfilling. Method of Measurement Measurement of geosynthetic drainage composite is on a square meter basis and will be computed on the total area of geosynthetic drainage composite shown on the construction drawings, exclusive of the area of drainage composite used in any overlaps. Overlaps, connections, and outlets are incidental items.

FHWA NHI-10-025 10 – Contracting Methods MSE Walls and RSS – Vol II 10 - 52 November 2009
Quantities of drainage composite material as shown on the plans may be increased or decreased at the direction of the Engineer based on construction procedures and actual site conditions. Such variations in quantity will not be considered as alterations in the details of construction or a change in the character of work. Basis of Payment The accepted quantities of drainage composite material will be paid for per square meter in place. Payment will be made under:
Pay Item Pay Unit Geosynthetic Drainage Composite square yard (meter)
10.10.4 Specification Guidelines for Geosynthetic Reinforced Soil Slope Systems Description Work shall consist of design, furnishing materials, and construction of geosynthetic reinforced soil slope structure. Supply of geosynthetic reinforcement, drainage composite, and erosion control materials, and site assistance are all to be furnished by the slope system supplier. Reinforced Slope System Acceptable Suppliers - The following suppliers can provide Agency approved system: (1) (2) (3) Materials. Only geosynthetic reinforcement, drainage composite, and erosion mat materials approved by the contracting Agency prior to project advertisement shall be utilized in the slope construction. Geogrid Soil Reinforcement, Geotextile Soil Reinforcement, Drainage Composite, and Geosynthetic Erosion Mat materials are specified under respective material specifications. Design Submittal. The Contractor shall submit six sets of detailed design calculations, construction drawings, and shop drawings for approval within 30 days of authorization to proceed and at least 60 days prior to the beginning of reinforced slope construction. The calculations and drawings shall be prepared and sealed by a Professional Engineer, licensed in the State. Submittal shall conform to Agency requirements for RSS.

FHWA NHI-10-025 10 – Contracting Methods MSE Walls and RSS – Vol II 10 - 53 November 2009
Material Submittals. The Contractor shall submit six sets of manufacturer's certification that indicate the geosynthetic soil reinforcement, drainage composite, and geosynthetic erosion mat meet the requirements set forth in the respective material specifications, for approval at least 60 days prior to start of RSS. Construction (Should follow the specifications details in this chapter) Method of Measurement Measurement of geosynthetic RSS Systems is on a vertical square foot basis. Payment shall include reinforced slope design and supply and installation of geosynthetic soil reinforcement, reinforced soil fill, drainage composite, and geosynthetic erosion mat. Excavation of any unsuitable materials and replacement with select fill, as directed by the Engineer shall be paid under a separate pay item. Quantities of reinforced soil slope system as shown on the plans may be increased or decreased at the direction of the Engineer based on construction procedures and actual site conditions. Basis of Payment The accepted quantities of geosynthetic RSS system will be paid for per vertical square foot (meter) in place. Payment will be made under:
Pay Item Pay Unit Geosynthetic RSS System Vertical square foot (meter)

FHWA NHI-10-025 10 – Contracting Methods MSE Walls and RSS – Vol II 10 - 54 November 2009
FHWA NHI-10-025 11 – Field Inspection MSE Walls and RSS – Vol II 11 – 1 November 2009
CHAPTER 11 FIELD INSPECTION AND PERFORMANCE MONITORING
Construction of MSE and RSS systems is relatively simple and rapid. The construction sequence consists mainly of preparing the subgrade, placing and compacting backfill in normal lift operations, laying the reinforcing layer into position, and installing the facing elements (tensioning of the reinforcement may also be required) or outward facing for RSS slopes. Special skills or equipment are usually not required, and locally available labor can be used, however, experienced crews can provide higher production rates. Most material suppliers provide training for construction of their systems. The outline of a checklist showing general requirements for monitoring and inspecting MSE and RSS systems is provided in Table 11-1. The table should be expanded by the agency to include detailed requirements based on the agencies specifications and the specific project plans and specification requirements. Examples of detailed checklists for specific sections are provided later in this chapter. There are some special construction considerations that the designer, construction personnel, and inspection team need to be aware of so that potential performance problems can be avoided. These considerations relate to the type of system to be constructed, to specific site conditions, the backfill material used and facing requirements. The following sections review items relating to:
C Section 11.1 - preconstruction reviews. C Section 11.2 - prefabricated materials inspection. C Section 11.3 - construction control. C Section 11.4 - performance monitoring programs.
11.1 PRECONSTRUCTION REVIEWS Prior to erection of the structure, personnel responsible for observing the field construction of the retaining structure must become thoroughly familiar with the following items:
C Plans and specifications. C Site conditions relevant to construction requirements. C Material requirements. C Construction sequences for the specific reinforcement system.

FHWA NHI-10-025 11 – Field Inspection MSE Walls and RSS – Vol II 11 – 2 November 2009
Table 11-1. Outline of MSE/RSS Field Inspection Checklist Requirements. □ 1. Read the specifications and become familiar with: - material requirements - construction procedures - soil compaction procedures - alignment tolerances - acceptance/rejection criteria □ 2. Review the construction plans and become familiar with: - construction sequence - corrosion protection requirements - special placement to reduce damage - soil compaction restrictions - details for drainage requirements - details for utility construction - construction of slope face - contractor's documents □ 3. Review material requirements and approval submittals. Review construction sequence for the reinforcement system. □ 4. Check site conditions and foundation requirements. Observe: - preparation of foundations - leveling pad construction (check level and alignment) - site accessibility - limits of excavation - construction dewatering - drainage features; seeps, adjacent streams, lakes, etc. □ 5. On site, check reinforcements and prefabricated units. Perform inspection of prefabricated
elements (i.e. casting yard) as required. Reject precast facing elements if: - compressive strength < specification requirements - molding defects (e.g., bent molds) - honey-combing - severe cracking, chipping or spalling - color of finish variation - tolerance control - misaligned connections □ 6. Check reinforcement labels to verify whether they match certification documents. □ 7. Observe materials in batch of reinforcements to make sure they are the same. Observe
reinforcements for flaws and nonuniformity. □ 8. Obtain test samples according to specification requirements from randomly selected
reinforcements. □ 9. Observe construction to see that the contractor complies with specification requirements for
installation. □ 10. If possible, check reinforcements after aggregate or riprap placement for possible damage. This
can be done either by constructing a trial installation, or by removing a small section of aggregate or riprap and observing the reinforcement after placement and compaction of the aggregate, at the beginning of the project. If damage has occurred, contact the design engineer.
□ 11. Check all reinforcement and prefabricated facing units against the initial approved shipment and collect additional test samples.
□ 12. Monitor facing alignment: - adjacent facing panel joints - precast face panels - modular block walls - wrapped face walls - line and grade

FHWA NHI-10-025 11 – Field Inspection MSE Walls and RSS – Vol II 11 – 3 November 2009
11.1.1 Plans and Specifications Specification requirements for MSE and RSS are reviewed in Chapter 10. The owner's field representatives should carefully read the specification requirements for the specific type of system to be constructed, with special attention given to material requirements, construction procedures, soil compaction procedures, alignment tolerances, and acceptance/rejection criteria. Plans should be reviewed. Unique and complex project details should be identified and reviewed with the designer and contractor, if possible. Special attention should be given to material handling and storage, the construction sequence, corrosion protection requirements for metallic reinforcement and UV protection for geosynthetics, special placement requirements to reduce construction damage of reinforcement, soil compaction restrictions, details for drainage requirements and utility construction, and construction of the outward slope. The contractor's documents should be checked to make sure that the latest issue of the approved plans, specifications, and contract documents are being used. A checklist for review of MSE structures drawings is presented in Table 11-2 (FHWA NHI-08-094 and 095). A checklist for review of MSE specifications is presented in Table 11-3 (FHWA NHI-08-094/095).
11.1.2 Review of Site Conditions and Foundation Requirements The site conditions should be reviewed to determine if there will be any special construction procedures required for preparation of the foundations, site accessibility, excavation for obtaining the required reinforcement length, and construction dewatering and other drainage features. Foundation preparation involves the removal of unsuitable materials from the area to be occupied by the retaining structure including all organic matter, vegetation, and slide debris, if any. This is most important in the facing area to reduce facing system movements and, therefore, to aid in maintaining facing alignment along the length of the structure. The field personnel should review the borings to determine the anticipated extent of the removal required. Where construction of reinforced fill will require a side slope cut, a temporary earth support system may be required to maintain stability. The contractor's method and design should be reviewed with respect to safety and the influence of its performance on adjacent structures. Caution is also advised for excavation of utilities or removal of temporary bracing or sheeting in front of the completed MSE structures. Loss of ground from these activities could result in settlement and lateral displacement of the retaining structure.

FHWA NHI-10-025 11 – Field Inspection MSE Walls and RSS – Vol II 11 – 4 November 2009
The groundwater level found in the site investigation should be reviewed along with levels of any nearby bodies of water that might affect drainage requirements. Slopes into which a cut is to be made should be carefully observed, especially following periods of precipitation, for any signs of seeping water (often missed in borings). Construction dewatering operations should be required for any excavations performed below the water table to prevent a reduction in shear strength due to hydrostatic water pressure. MSE/RSS structures should be designed to permit drainage of any seepage or trapped groundwater in the retained soil. If water levels intersect the structure, it is also likely that a drainage structure behind and beneath the wall will be required. Surface water infiltration into the retained fill and reinforced fill should be minimized by providing an impermeable cap and adequate slopes to nearby surface drain pipes or paved ditches with outlets to storm sewers or to natural drains. Internal drainage of the reinforced fill can be attained by use of a free-draining granular material that is free of fines (material passing No. 200 {0.075 mm} sieve should be less than 5 percent). Because of its high permeability, this type of fill will prevent retention of any water in the soil fill as long as a drainage outlet is available. Details are generally provided for drainage to the base of the fill as shown on Figures 5-6, 5-9 and 5-10, to avert water from exiting through the face of the wall, which could cause erosion and/or face stains. The drains will, of course, require suitable outlets for discharge of seepage away from the reinforced soil structure. Care should be taken to avoid creating planes of weakness within the structure with drainage layers.

FHWA NHI-10-025 11 – Field Inspection MSE Walls and RSS – Vol II 11 – 5 November 2009
Table 11-2. Checklist for Drawing Review. (after FHWA NHI-08-094/095) YES NO NA
1.0 DOCUMENTS
1.1 Have you thoroughly reviewed the design drawings?
1.2 Is there a set of all project drawings in the field trailer?
1.3 Has the contractor submitted shop drawings?
1.4 Have the shop drawings been approved by the designer and/or construction division manager?
2.0 LAYOUT
2.1 Have you located the horizontal and vertical control points?
2.2 Do you know where the MSEW/RSS begins and ends?
2.3 Have you identified any locations of existing utilities, signs, piles, lights that affect the proposed construction?
2.4 Have you identified the elevations/ grade at top and at bottom of MSEWs/RSSs?
2.5 Have you identified the existing and finished grades?
2.6 Do you know where the construction limits are?
2.7 Have you identified how the site will be accessed and any provisions for material storage?
2.8 Is phased construction involved?
3.0 FOUNDATION PREPARATION
3.1 Are any special foundation treatments required?
3.2 Is the foundation stepped?
3.3 Is concrete leveling pad and the required elevation(s) shown on the drawings?
3.4 Is shoring required?
4.0 DRAINAGE
4.1 Have you located the details for drainage?
4.2 When must the drainage provisions be installed?
4.3 Where does the drainage system outlet and does it allow for positive drainage?
4.4 Are geotextile filters required?
4.5 Is a drainage barrier (geomembrane) required for this project?
5.0 FACING
5.1 Have you identified the facing type, shape, size, and architectural finishing?
5.2 Are there different types, colors, or sized facing units on the job?
5.3 How do the facing units fit together?

FHWA NHI-10-025 11 – Field Inspection MSE Walls and RSS – Vol II 11 – 6 November 2009
YES NO NA
5.4 Do you understand any corner/curve details?
5.5 Do you understand bracing, bearing pads, wedging and shimming requirements?
5.6 Is the facing battered?
5.7 Are geotextile filters required for wall joints and is the placement shown on the drawings including overlaps and termination at the base and toe of the wall.
6.0 REINFORCING
6.1 What type of reinforcement is used in this project?
6.2 Can you determine the length, location and type of reinforcement throughout the length and height of the wall or slope?
6.3 Do you understand how the reinforcing connects to the facing?
6.4 Have you identified any details for avoiding obstructions when placing reinforcement?
6.5 Are cross sections showing reinforcement location? Are cross sections shown for each stationing and major elevation change?
7.0 BACKFILL
7.1 Are different types of fill required in different locations in the wall?
8.0 ANCILLARY ITEMS
8.1 Is there any coping specified in the drawings?
8.2 Is there any traffic barrier or guard rail specified in the drawings?
8.3 Have you considered interfaces with CIP structures?
8.4 Do you understand the details for joints at or connections to CIP structures?
8.5 Are any of the following involved in this project?
8.5.1 Catch Basins/Drop Inlets
8.5.2 Culverts/Pipes?
8.5.3 Piles/Drilled Shafts?
8.5.4 Utilities and other obstructions?
8.6 Have you identified and do you understand any special detail to accommodate these obstructions?
8.7 Do you know who is responsible for installation of each ancillary item?
8.8 Are diversion ditches, collection ditches, or slope drains shown on the drawings?
8.9 Is a permanent or temporary erosion control blanket required?
8.10 Do you understand any erosion control details?

FHWA NHI-10-025 11 – Field Inspection MSE Walls and RSS – Vol II 11 – 7 November 2009
Table 11-3. Checklist for Specification Compliance. (after FHWA NHI-08-094/095) YES NO NA
1.0 DOCUMENTS
1.1 Have you thoroughly reviewed the specifications?
1.2 Is there a set of specifications in the field trailer?
1.3 Are standard specifications or special provisions required in addition to the project specifications? Do you have a copy?
2.0 PRE-CONSTRUCTION QUALIFYING OF MATERIAL SOURCES / SUPPLIERS
2.1 Has the Contractor submitted pre-construction qualification test results (showing that it meets the gradation, density, electrochemical, and other soil-property requirements) for:
2.1.1 Reinforced soil
2.1.2 Retained soil
2.1.3 Facing soil (if applicable)
2.1.4 Drainage aggregate
2.1.4 Graded granular filters (if applicable)
2.2 Has the Contractor or Manufacturer submitted pre-construction qualification test results and/or Certificate of Compliance demonstrating that the facing materials comply with the applicable sections of the specifications including:
2.2.1 Facing unit and connections
2.2.2 Horizontal facing joint bearing pads
2.2.3 Geotextile filter for facing joint
2.3 Has the Contractor or Manufacturer submitted pre-construction qualification test results and/or Certificate of Compliance demonstrating that the reinforcing materials comply with the applicable sections of the specifications?
2.4 Has the Contractor or Manufacturer submitted pre-construction qualification test results and/or Certificate of Compliance demonstrating that the drainage materials comply with the applicable sections of the specifications including:
2.2.1 Geotextile filters (e.g., Type, AOS, permittivity, strength)
2.2.2 Prefabricated Drains (i.e., geotextile filter and core)
2.2.3 Drainage Pipe (material, type, ASTM designation and schedule
2.4 Has approval of the soil sources been officially granted for:
2.4.1 Reinforced soil
2.4.2 Retained soil

FHWA NHI-10-025 11 – Field Inspection MSE Walls and RSS – Vol II 11 – 8 November 2009
YES NO NA
2.4.3 Facing soil
2.4.4 Drainage aggregate
2.5 Has approval of the facing material sources been officially granted
2.6 Has approval of the reinforcing material sources been officially granted?
3.0 FOUNDATION PREPARATION
3.1 Has temporary shoring been designed and approved?
4.0 DRAINAGE
4.1 Is the Contractor or Manufacturer submitting QC test results at the specified frequency demonstrating that the drainage materials comply with the applicable sections of the specifications?
4.2 Do the drainage materials delivered to the site correspond to the approved shop drawings?
4.3 Do the identification labeling/markings on the geotextile filters and/or prefabricated drainage materials delivered to the site correspond to the pre-construction and QC submittals (date of manufacturing, lot number, roll numbers, etc.)?
4.4 Have the drainage materials been inspected for damage due to transport, handling, or storage activities?
4.5 Are the drainage materials properly stored to prevent damage, exposure to UV light, contamination?
4.6 If any drainage materials were found damaged, have they been set aside, rejected, or repaired in accordance with the specifications?
4.7 Has QA sampling of the drainage materials been performed at the required frequency?
4.8 Does the QA lab know exactly which tests to run and the required test parameters?
4.9 Do the QA test results for the drainage materials meet the specified property values?
5.0 FACING
5.1 Is the Contractor or Manufacturer submitting QC test results at the specified frequency demonstrating that the facing materials comply with the applicable sections of the specifications?
5.2 Do the facing components delivered to the site correspond to the approved shop drawings including:
5.2.1 Facing unit (shape, dimensions, reinforcement connections, overall quantity)?
5.2.2 Horizontal facing joint bearing pads (material type, hardness, modulus)
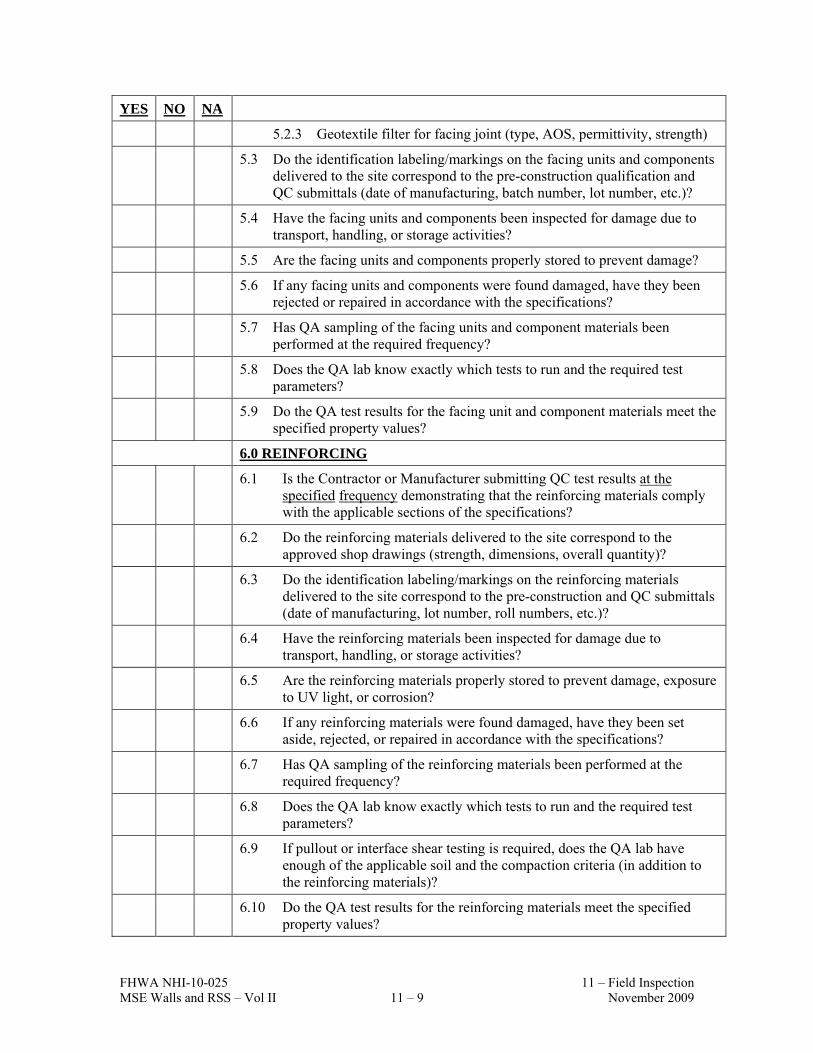
FHWA NHI-10-025 11 – Field Inspection MSE Walls and RSS – Vol II 11 – 9 November 2009
YES NO NA
5.2.3 Geotextile filter for facing joint (type, AOS, permittivity, strength)
5.3 Do the identification labeling/markings on the facing units and components delivered to the site correspond to the pre-construction qualification and QC submittals (date of manufacturing, batch number, lot number, etc.)?
5.4 Have the facing units and components been inspected for damage due to transport, handling, or storage activities?
5.5 Are the facing units and components properly stored to prevent damage?
5.6 If any facing units and components were found damaged, have they been rejected or repaired in accordance with the specifications?
5.7 Has QA sampling of the facing units and component materials been performed at the required frequency?
5.8 Does the QA lab know exactly which tests to run and the required test parameters?
5.9 Do the QA test results for the facing unit and component materials meet the specified property values?
6.0 REINFORCING
6.1 Is the Contractor or Manufacturer submitting QC test results at the specified frequency demonstrating that the reinforcing materials comply with the applicable sections of the specifications?
6.2 Do the reinforcing materials delivered to the site correspond to the approved shop drawings (strength, dimensions, overall quantity)?
6.3 Do the identification labeling/markings on the reinforcing materials delivered to the site correspond to the pre-construction and QC submittals (date of manufacturing, lot number, roll numbers, etc.)?
6.4 Have the reinforcing materials been inspected for damage due to transport, handling, or storage activities?
6.5 Are the reinforcing materials properly stored to prevent damage, exposure to UV light, or corrosion?
6.6 If any reinforcing materials were found damaged, have they been set aside, rejected, or repaired in accordance with the specifications?
6.7 Has QA sampling of the reinforcing materials been performed at the required frequency?
6.8 Does the QA lab know exactly which tests to run and the required test parameters?
6.9 If pullout or interface shear testing is required, does the QA lab have enough of the applicable soil and the compaction criteria (in addition to the reinforcing materials)?
6.10 Do the QA test results for the reinforcing materials meet the specified property values?

FHWA NHI-10-025 11 – Field Inspection MSE Walls and RSS – Vol II 11 – 10 November 2009
YES NO NA
7.0 BACKFILL
7.1 Is the Contractor submitting QC test results at the specified frequency for:
7.1.1 Reinforced soil
7.1.2 Retained soil
7.1.3 Facing soil
7.2 Does the QA lab know exactly which tests to run and the required test parameters?
7.3 Do the QA test results for the various materials meet the specified property values:
7.3.1 Reinforced Soil
7.3.2 Retained Soil
7.3.3 Facing Soil
8.0 ANCILLARY ITEMS
8.1 Do any ancillary materials delivered to the site correspond to the approved shop drawings (prefabricated copings, cap blocks and attachment glue, if required, catch basins, pipe, guardrail, etc.)?
8.2 Do the identification labeling/markings on the ancillary materials delivered to the site correspond to the QC submittals (date of manufacturing, batch number, etc.)?
8.3 Have the ancillary materials been inspected for damage due to transport, handling, or storage activities?
8.4 Are the ancillary materials properly stored to prevent damage?
8.5 If any ancillary materials were found damaged, have they been set aside, rejected, or repaired in accordance with the specifications?
8.6 Have all requirements to sample/test any aspect of the work product after assembly, installation, compaction been met?

FHWA NHI-10-025 11 – Field Inspection MSE Walls and RSS – Vol II 11 – 11 November 2009
11.2 PREFABRICATED MATERIALS INSPECTION Material components should be examined at the casting yard (for systems with precast elements) and on site. Typical casting operations are shown on Figure 11-1. Material acceptance should be based on a combination of material testing, certification, and visual observations. When delivered to the project site, the inspector should carefully inspect all material (precast facing elements, reinforcing elements, bearing pads, facing joint materials, and reinforced backfill). On site, all system components should be satisfactorily stored and handled to avoid damage. The material supplier's construction manual should contain additional information on this matter.
11.2.1. Precast Concrete Elements At the casting yard, the inspector should assure the facing elements are being fabricated in accordance with the agency's standard specifications. For example, precast concrete facing panels should be cast on a flat surface. Clevis loop embeds, tie strips, and other connection devices must not contact or be attached to the facing element reinforcing steel. Curing should follow required procedures and requirements (e.g., temperature, cover, moisture, etc.).
Facing elements delivered to the project site should be examined prior to erection. Panels should be rejected on the basis of the following deficiencies or defects: C Insufficient compressive strength. C Mold defects (e.g., bent molds). C Honey-combing. C Severe cracking, chipping, or spalling. C Significant variation in color of finish. C Out-of-tolerance dimensions. C Misalignment of connection devices. The following maximum facing element dimension tolerances are usually specified for precast concrete: C Overall dimensions: 1/2-inch (13 mm) C Connection device locations: 1-inch (25 mm) C Clevis loop embeds: 1/8-inch (3 mm) horizontal alignment C Element squareness: 1/2-inch (13 mm) difference between diagonals C Surface finish: 1/8-inch in 5 ft (2 mm in 1 m) (smooth surface) C Surface finish: 5/16-inch in 5 ft (5 mm in 1 m) (textured surface)

FHWA NHI-10-025 11 – Field Inspection MSE Walls and RSS – Vol II 11 – 12 November 2009
Figure 11-1. Casting yard for precast facing elements.

FHWA NHI-10-025 11 – Field Inspection MSE Walls and RSS – Vol II 11 – 13 November 2009
In cases where repair to damaged facing elements is possible, it should be accomplished to the satisfaction of the engineer. For drycast modular blocks, it is essential that compressive strengths and water absorption be carefully checked on a lot basis. The following dimensional tolerances are usually specified: C Overall dimensions: ± 1/8-inch (3.2 mm) C Height of each block: ± 1/16-inch (1.6 mm)
11.2.2 Reinforcing Elements Reinforcing elements (strips, mesh, sheets) should arrive at the project site securely bundled or packaged to avoid damage (see Figure 11-2). These materials are available in a variety of types, configurations, and sizes (gauge, length, product styles), and even a simple structure may have different reinforcement elements at different locations. The inspector should verify that the material is properly identified and check the specified designation (AASHTO, ASTM, or agency specifications). Grid reinforcement should be checked for wire diameter, length, width, and spacing of longitudinal and transverse members. For strip reinforcements, the length and thickness should be checked. Material verification is especially important for geotextiles and geogrids where many product styles look similar but have different properties. In addition to the above measurements, geogrids or geotextile samples should be weighed in the field to compare the mass per unit area with the manufacturer’s identification value. Samples should also be sent to the laboratory for verification testing. Color coding of roll ends can be helpful, especially in complex configurations to prevent improper installations. Where more than one style will be used, the roll ends could be painted and when reinforcements are cut to length, the lengths could be painted on the material as shown in Figure 11-2.
Galvanization (application thickness 2 oz/ft2 {610 g/m2}), epoxy coatings (thickness 16 mils {0.41 mm}) or other coatings, should be verified by certification or agency conducted tests and checked for defects. Geosynthetic reinforcements should be properly packaged and protective wraps should be maintained during shipping and handling to protect the material from UV (e.g., sunlight) exposure. Storage areas should meet both specifications and manufacturer’s storage requirements. Materials should be stored off the ground to protect reinforcement from mud, dirt, and debris. Geosynthetic reinforcements should not be exposed to temperatures greater than 140o F (60oC) and manufacturer's recommendations should be followed in regards to UV protection from direct sunlight.

FHWA NHI-10-025 11 – Field Inspection MSE Walls and RSS – Vol II 11 – 14 November 2009
Figure 11-2. Inspect reinforcing elements: top photo shows a variety of reinforcements
including metallic strips, welded wire mesh, and geosynthetics and bottom photo shows reinforcement length painted on geogrid reinforcement.

FHWA NHI-10-025 11 – Field Inspection MSE Walls and RSS – Vol II 11 – 15 November 2009
At the time of installation, the reinforcement should be rejected if it has defects, flaws, deterioration, or damage incurred during manufacture, transportation, or storage. Metal reinforcements should not contain bent, cut or repaired (e.g., welded or bent and straightened) sections without approval of the MSE wall or RSS design engineer of record. Geosynthetics should not contain tears, cuts or punctures and should be replaced or repaired at the direction of the design engineer.
11.2.3 Facing Joint Materials Bearing pads (HDPE, EPDM, PVC and neoprene), joint filler and joint cover (e.g., geotextiles) should be properly packaged to minimize damage in unloading and handling. For example, polymer filler material and geotextiles, as previously indicated, must be protected from sunlight during storage.
Although these items are often considered as miscellaneous materials, it is important for the inspector to recognize that use of the wrong material or its incorrect placement can result in significant structure distress. Properties of these materials must be checked, either based on laboratory tests submitted by the supplier or preapproval (e.g., from a qualified products list), for conformance with specification requirements. Samples should be sent to the laboratory for verification testing.
11.2.4 Reinforced Backfill The backfill in MSE/RSS structures is the key element in satisfactory performance. Both use of the appropriate material and its correct placement are important considerations. Reinforced backfill is normally specified to meet certain gradation, plasticity, soundness, and electrochemical requirements. Depending on the type of contract, tests to ensure compliance may be performed by either the contractor or the owner. The tests conducted prior to construction and periodically during construction for quality assurance form the basis for approval. During construction these tests include gradation and plasticity index testing at the rate required in the agency’s or project-specific specifications (e.g., typically one test per 2000 yd3 (1500 m3) of material placed on large projects) and whenever the appearance and behavior of the backfill changes noticeably.

FHWA NHI-10-025 11 – Field Inspection MSE Walls and RSS – Vol II 11 – 16 November 2009
11.3 CONSTRUCTION CONTROL Each of the steps in the sequential construction of MSE and RSS systems is controlled by certain method requirements and tolerances. Construction manuals for proprietary MSE systems should be obtained from the contractor to provide guidance during construction monitoring and inspection. A detailed description of general construction requirements for MSE walls follows with requirements that apply to RSS systems noted.
11.3.1 Leveling Pad A concrete leveling pad should have minimum dimensions in conformance with the plans and specifications (typically 6 inches {150 mm} thick by the panel width plus 8 in. {200 mm} wide). The concrete compressive strength should also meet minimum specification requirements. Curing of cast-in-place pads should follow the requirements in the specifications (e.g., typically a minimum of 12 to 24 hours before facing units are placed). Careful inspection of the leveling pad to assure correct line, grade, and offset is important. A vertical tolerance of ⅛-inch (3 mm) to the design elevation is recommended. If the leveling pad is not at the correct elevation, the wall will likely be difficult to construct and the leveling pad elevation should be corrected. An improperly placed leveling pad can result in subsequent facing unit misalignment, cracking, and spalling. Full height precast facing elements may require a larger leveling pad to maintain alignment and provide temporary foundation support. Gravel pads of suitable dimensions may be used with modular block walls used for landscaping type applications. Typical installations are shown on Figure 11-3.
11.3.2 Erection of Facing Elements Precast facing panels are purposely set at a slight backward batter (toward the reinforced fill) in order to assure correct final vertical alignment after backfill placement as shown on Figure 11-4. Minor outward movement of the facing elements from wall fill placement and compaction cannot be avoided and is expected as the interaction between the reinforcement and reinforced backfill occurs. Typical backward batter for segmental precast panels is ½-in. in 4 ft (20 mm per meter) of panel height with steel reinforcements. Modular block units are typically stacked with an offset ½ to 1 in. to account for horizontal movements. Full height precast panels as shown on Figure 11-5 are more susceptible cracking during backfilling and misalignment difficulties than segmental panels. When using full-height panels, the construction procedure should be carefully controlled to maintain tolerances. Special construction procedures such as additional bracing and larger face panel batter may be necessary.

FHWA NHI-10-025 11 – Field Inspection MSE Walls and RSS – Vol II 11 – 17 November 2009
Figure 11-3. Concrete leveling pad showing: a) leveling the concrete, b) completed
pad, and c) placing the facing elements on the leveling pad.
(a) (b)
(c)

FHWA NHI-10-025 11 – Field Inspection MSE Walls and RSS – Vol II 11 – 18 November 2009
Figure 11-4. Checking facing element batter and alignment.

FHWA NHI-10-025 11 – Field Inspection MSE Walls and RSS – Vol II 11 – 19 November 2009
Figure 11-5. Full height facing panels require special alignment care.

FHWA NHI-10-025 11 – Field Inspection MSE Walls and RSS – Vol II 11 – 20 November 2009
First Row of Facing Elements. Setting the first row of facing elements is a key detail as shown in Figure 11-6. Construction should always begin adjacent to any existing structure and proceed toward the open end of the wall. The facing units should be set directly on the concrete leveling pad. Horizontal joint material or shims generally should not be permitted between the first course of panels and the leveling pad unless specifications specifically allow for and provide detail requirements (e.g., material type, properties, maximum thickness (e.g., 1/16-inch, 1/8-inch) and other dimensional requirements) for such materials. Temporary wood wedges may be used between the first course of concrete panels and the leveling pad to set panel batter, but they must be removed during subsequent construction. Some additional important details are: C The first row of segmental panels must be braced until the bottom several layer(s) of
reinforcements has been backfilled. Adjacent panels should be clamped together to prevent individual panel displacement.
C After setting and battering the first row of panels or placing the first row of modular blocks, horizontal alignment should be visually checked (i.e., with survey instruments or with a string-line).
C When using full-height panels, initial bracing and clamping are even more critical because misalignments are difficult to correct as construction continues.
C Most MSE systems use a variety of panel sizes to best fit the wall envelope. Special panels or modular block types may also be used to accommodate aesthetic treatments design requirements (geometric shape, size, color, finish, connection points). The facing element types must be checked to make sure that they are installed exactly as shown on the plans.
C A geotextile filter should be placed over the back of the area of any openings between the facing units and the leveling pad. The geotextile should extend a minimum of 6-in. (150 mm) beyond the edges of the openings. For large openings > than 1 in. (25 mm) in width (such as where stepped leveling pads are required or wall drain outlets are placed over the leveling pad), the openings should either be filled in with concrete or the section should be concurrently backfilled on both sides of the facing unit with soil.

FHWA NHI-10-025 11 – Field Inspection MSE Walls and RSS – Vol II 11 – 21 November 2009
Figure 11-6. Setting first row of precast facing elements.

FHWA NHI-10-025 11 – Field Inspection MSE Walls and RSS – Vol II 11 – 22 November 2009
11.3.3 Reinforced Fill Placement, Compaction Moisture and density control is imperative for construction of MSE and RSS systems. Even when using high-quality granular materials, problems can occur if compaction control is not exercised. Reinforced wall fill material should be placed and compacted at or within 2 percent dry of the optimum moisture content. If the reinforced fill is free draining with less than 5 percent passing a No. 200 (0.075 mm) U.S. Sieve, water content of the fill may be within ±3 percentage points of the optimum. Placement moisture content can have a significant effect on reinforcement-soil interaction. Moisture content wet of optimum makes it increasingly difficult to maintain an acceptable facing alignment, especially if the fines content is high. Moisture contents that are too dry may not achieve required density and could result in significant settlement during periods of precipitation (i.e., due to bulking). A density of 95 percent of T-99 maximum value or 90 percent of T-180 is typically recommended for retaining walls and slopes, and 100 percent of T-99 or 95% of T-180 is usually recommended for abutments and walls or slopes supporting structural foundations. A procedural specification is preferable where a significant percentage of coarse material, generally 30 percent or greater retained on the ¾-inch (19 mm) sieve, prevents the use of the AASHTO T-99 or T-180 test methods. In this situation, typically four to five passes with conventional vibratory roller compaction equipment is adequate to attain the maximum practical density. The actual requirements should be determined based on a test section as discussed in Chapter 3, Section 3.2.1. Reinforced backfill should be dumped onto or parallel to the rear and middle of the reinforcements and bladed toward and away from the front face as shown on Figure 11-7. At no time should any construction equipment be in direct contact with the reinforcements because the reinforcements can be damaged. Soil layers should be compacted up to 2 in. (50 mm) above but no less than even with the elevation of each level of reinforcement connections prior to placing that layer of reinforcing elements. Compaction Equipment - With the exception of the 3-foot (1-m) zone directly behind the facing elements or slope face, large, smooth-drum, vibratory rollers should be used to obtain the desired compaction as shown on Figure 11-8a. Sheepsfoot and grid type rollers should not be permitted because of possible damage to the reinforcements. When compacting uniform medium to fine sands (in excess of 60 percent passing a No. 40 sieve) use a smooth-drum static roller or lightweight (walk behind) vibratory roller, especially for the last pass. The use of large vibratory compaction equipment with this type of backfill material will make wall alignment control difficult and actually may loosen the upper surface of the soil.
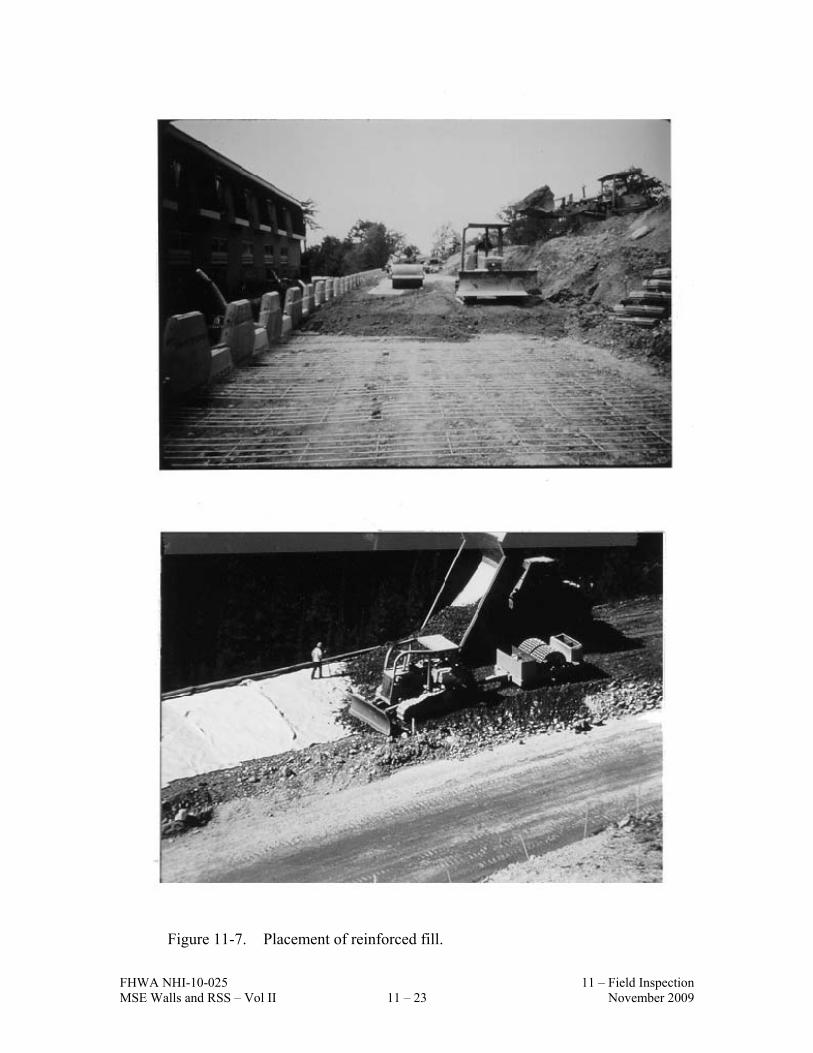
FHWA NHI-10-025 11 – Field Inspection MSE Walls and RSS – Vol II 11 – 23 November 2009
Figure 11-7. Placement of reinforced fill.

FHWA NHI-10-025 11 – Field Inspection MSE Walls and RSS – Vol II 11 – 24 November 2009
Figure 11-8. Compaction equipment showing: a) large equipment permitted away
from face; and b) lightweight equipment within 3 ft (1 m) of the face.

FHWA NHI-10-025 11 – Field Inspection MSE Walls and RSS – Vol II 11 – 25 November 2009
Within 3 ft (1 m) of the wall or slope face, use small single or double drum, walk-behind vibratory rollers or vibratory plate compactors as shown in Figure 11-8b. Placement of the reinforced backfill near the front should not lag behind the remainder of the structure by more than one lift. Poor fill placement and compaction in this area has in some cases resulted in facing movement and/or downdrag on reinforcements, which increases connection stresses. Within this 3 ft (1 m) zone, quality control should be maintained by a method specification such as four passes of a light, walk-behind vibratory plate or drum compactor. Test pads should be constructed to determine the actual number of passes and lift thickness required to achieve compaction requirements with the compaction equipment to be used. Higher quality fill is sometimes used in this zone so that the desired properties can be achieved with less compactive effort. Excessive compactive effort or use of too heavy equipment near the wall face could result in excessive face unit movement (segmental panels and modular blocks) or structural damage (full-height, precast panels), and overstressing of reinforcement layers. For welded wire wall facing systems, caution must be exercised such that struts do not become dislodged during placement of backfill and compaction, which could jeopardize the wall face integrity.
Inconsistent compaction and undercompaction caused by insufficient compactive effort or allowing the contractor to "compact" backfill with trucks and dozers will lead to gross misalignments and settlement problems and should not be permitted. Flooding of the backfill to facilitate compaction should also not be permitted. Compaction control testing of the reinforced backfill should be performed on a regular basis during the entire construction project. A minimum frequency of one test within the reinforced soil zone per lift for every 150 ft (45 m) of wall is recommended.
11.3.4 Placement of Reinforcing Elements Reinforcing elements for MSE and RSS systems should be installed in strict compliance with spacing and length requirements shown on the plans. Reinforcements should generally be placed perpendicular to the back of the facing panel. In specific situations (e.g., abutments and curved walls) it may be permissible to skew the reinforcements from their design location in either the horizontal or vertical direction. Skewing should not exceed the limits defined in the specifications and overlapping layers of reinforcements should be separated by 3-in. (75-mm) minimum thickness of fill. Curved walls create special considerations with MSE panel and reinforcement details. Different placement procedures are generally required for convex and concave curves. For reinforced fill systems with precast panels or modular blocks, joints will either be further closed or opened by nominal facing movements that normally occur during construction.

FHWA NHI-10-025 11 – Field Inspection MSE Walls and RSS – Vol II 11 – 26 November 2009
Special considerations also arise when constructing MSE/RSS structures around deep foundation elements or drainage structures. For deep foundations either drive piles prior to face construction or use hollow sleeves at proposed pile locations during reinforced fill erection. The latter method is generally preferred. Predrilling for pile installation through the reinforced soil structure between reinforcements is risky and should be avoided. Reinforcement skew to avoid obstructions must be within specification tolerances and in no case should reinforcements be cut or excessively bent. Connections. Each MSE system has a unique facing connection detail. Several types of connections are shown on Figure 11-9. Connections are manufacturer specific and must be made in accordance with the approved drawings. For example on Reinforced Earth structures bolts are inverted between tie strips making a connection that acts in shear (i.e., double shear on the connector). Nuts are securely tightened with hand tools. Flexible reinforcements, such as geotextiles and geogrids, usually require pretensioning to remove any slack in the reinforcement and in the connection to the facing unit. The tension is then maintained by staking or by placing fill during tensioning. Tensioning and staking will reduce subsequent horizontal movements of the panel as the wall fill is placed.
11.3.5 Placement of Subsequent Facing Courses (Segmental Facings) Throughout construction of segmental panel walls, facing panels should only be set at grade. Placement of a panel on top of one not completely backfilled should not be permitted. Alignment Tolerances. The key to a satisfactory end product is maintaining reasonable horizontal and vertical alignments during construction. Generally, the degree of difficulty in maintaining vertical and horizontal alignment increases as the vertical distance between reinforcement layers increases. The following alignment tolerances are recommended: C Adjacent facing panel joint gaps (all reinforcements): ¾-inch ± ¼-inch (19 mm ± 6 mm) C Precast face panel (all reinforcements): 1/2-inch per 10 ft (6 mm per m) (horizontal and
vertical directions) C Wrapped face walls and slopes (e.g., welded wire or geosynthetic facing): 2-inch per 10
ft (15 mm per m) (horizontal and vertical directions) C Wrapped face walls and slopes (e.g., welded wire or geosynthetic facing) overall vertical:
1-inch per 10 ft (8 mm per m) C Wrapped face walls and slopes (e.g., welded wire or geosynthetic facing) bulging: 1 to 2
inches (25 to 50 mm) maximum C Reinforcement placement elevations: 1-inch (25 mm) of connection elevation
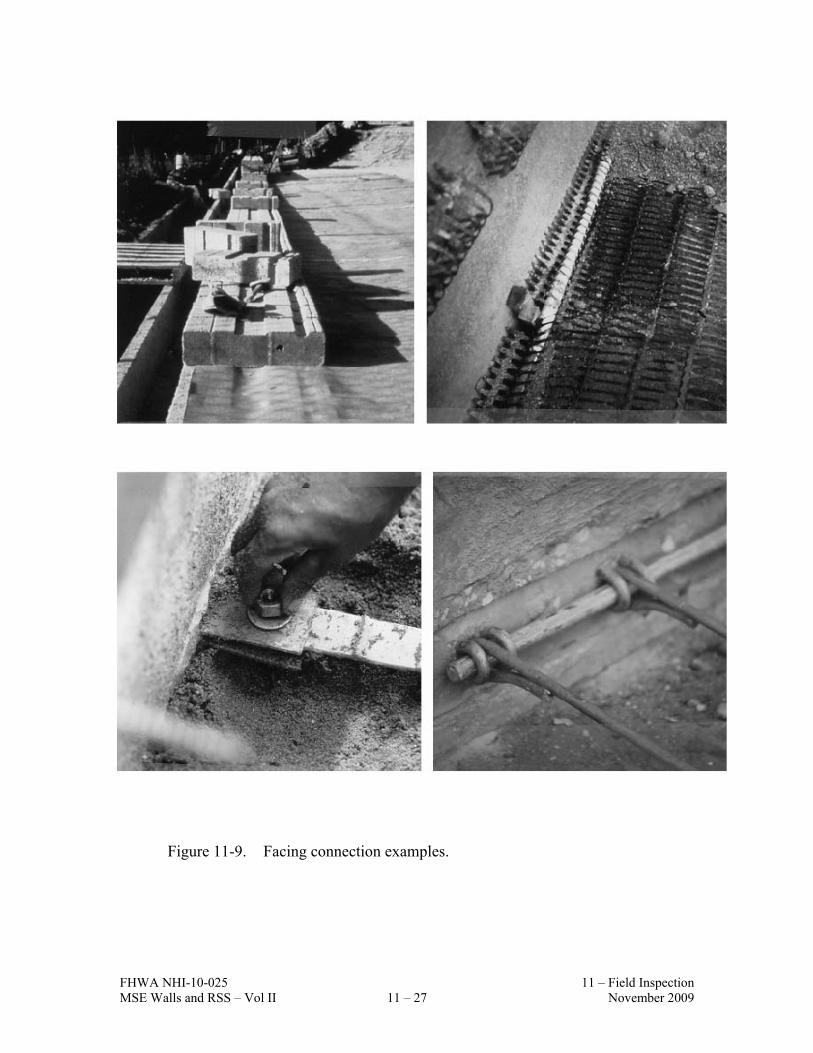
FHWA NHI-10-025 11 – Field Inspection MSE Walls and RSS – Vol II 11 – 27 November 2009
Figure 11-9. Facing connection examples.

FHWA NHI-10-025 11 – Field Inspection MSE Walls and RSS – Vol II 11 – 28 November 2009
Failure to attain these tolerances when following suggested construction practices indicates that changes in the contractor's procedures are necessary. These might include changes in reinforced backfill placement and compaction techniques, construction equipment, and facing panel batter. Facing elements that are out of alignment should not be pushed or pulled into place because this may damage the panels and reinforcements and, hence, weaken the system. Appropriate measures to correct an alignment problem are the removal of reinforced fill and reinforcing elements, followed by the resetting of the panels. Decisions to reject structure sections that are out of alignment should be made expediently because panel resetting and reinforced fill handling are time consuming and expensive. “Post erection" deformations may be an indication of foundation, drainage (i.e., if after a heavy rain). or retained soil problems and should be evaluated immediately by qualified geotechnical specialists. All material suppliers use bearing pads (HDPE, EPDM, PVC or neoprene are typically used) on horizontal joints between segmental facing panels to keep the panel joints open. The thickness of the bearing pads is based on the amount of anticipated short term and long term settlement. Pads that are two thin could result in cracking and spalling of panels due to point stresses and excessively large panel joint openings may result in an unattractive end product. Filter materials (usually geotextiles) are used to prevent erosion of fill through the facing joints while allowing water to pass. These materials should be installed in strict accordance with the plans and specifications, especially with regard to type of material, thickness of bearing pads, opening characteristics of geosynthetics, and quantity. Geotextile joint covers and bearing pads are shown on Figure 11-10. Wooden wedges shown on Figure 11-6 placed during erection to aid in alignment should remain in place until the third layer of segmental panels are set, at which time the bottom layer of wedges should be removed. Each succeeding layer of wedges should be removed as the succeeding panel layer is placed. When the wall is completed, all temporary wedges should be removed. At the completion of each day's work, the contractor should grade the wall fill away from the face and lightly compact the surface to reduce the infiltration of surface water from precipitation. At the beginning of the next day's work, the contractor should scarify the backfill surface, especially backfills containing fines, to prevent shear planes from developing between lifts.

FHWA NHI-10-025 11 – Field Inspection MSE Walls and RSS – Vol II 11 – 29 November 2009
(a)
(b) Figure 11-10. Joint materials: a) geotextile joint cover, and b) EPDM bearing pads.

FHWA NHI-10-025 11 – Field Inspection MSE Walls and RSS – Vol II 11 – 30 November 2009
A summary of several out-of-tolerance conditions and their possible causes is presented in Table 11-4.
Table 11-4. Out-of-Tolerance Conditions and Possible Causes. MSEW structures are to be erected in strict compliance with the structural and aesthetic requirements of the plans, specifications, and contract documents. The desired results can generally be achieved through the use of quality materials, correct construction/erection procedures, and proper inspection. However, there may be occasions when dimensional tolerances and/or aesthetic limits are exceeded. Corrective measures should quickly be taken to bring the work within acceptable limits. Presented below are several out-of-tolerance conditions and their possible causes.
CONDITION POSSIBLE CAUSE
1. Distress in wall: 1. a.
a. Differential settlement or low spot in wall. (Cause 1. a & b apply)
b.
b. Overall wall leaning beyond vertical alignment tolerance. (Cause 1 a&b)
Foundation (subgrade) material too soft or wet for proper bearing.
Fill material of poor quality or not properly compacted.
c. Spalling, chipping, or cracking of facing units (Cause 1 a – e apply) (e.g., from panel to panel contact or differential movement of modular block facing units).
c.
d.
e.
Inadequate spacing in horizontal and vertical joints
Use of improper bearing pads
Stones or concrete pieces between facing units (e.g. units not clean or used to level face units)
2. First panel course difficult (impossible) to set and/or maintain level.
2. a. Leveling pad not level.
3. 3. a. Panel not battered sufficiently.
Wall out of vertical alignment tolerance (plumbness), or leaning out.
b. Oversized compaction equipment working within 3 ft (1 m) of wall facing panels.
c. Backfill material placed wet of optimum moisture content. Backfill contains excessive fine materials (beyond the specifications for percent of materials passing a No. 200 sieve).
d. Backfill material pushed against back of facing panel before being placed

FHWA NHI-10-025 11 – Field Inspection MSE Walls and RSS – Vol II 11 – 31 November 2009
and compacted above reinforcing elements.
e. Excessive compaction of uniform, medium-fine sand (more than 60 percent passing a No. 40 sieve).
f. Backfill material dumped close to free end of reinforcing elements, then spread toward wall face, causing displacement of reinforcements and pushing panel out.
g. Shoulder wedges not seated securely.
h. Shoulder clamps not tight.
i. Slack in reinforcement to facing connections.
j. Inconsistent tensioning of geosynthetic reinforcement to facing.
k. Localized over-compaction adjacent to MBW unit.
4. 4. a. Excessive batter set in panels or offset in modular block units for select granular backfill material being used.
Wall out of vertical alignment tolerance (plumbness) or leaning in.
b. Inadequate compaction of backfill.
c. Possible bearing capacity failure.
5. Wall out of horizontal alignment tolerance, or bulging.
5. a. See Causes 3c, 3d, 3e, 3j, 3k. Backfill saturated by heavy rain or improper grading of backfill after each day's operations.
6. 6. a. Panels are not level. Differential settlement (see Cause 1).
Panels do not fit properly in their intended locations.
b. Panel cast beyond tolerances.
7. 7. a. Backfill material not uniform.
Large variations in movement of adjacent panels.
b. Backfill compaction not uniform.
c. Inconsistent setting of facing panels

FHWA NHI-10-025 11 – Field Inspection MSE Walls and RSS – Vol II 11 – 32 November 2009
Table 11-5. Checklist for Construction. (after FHWA NHI-08-094/095) YES NO NA
1.0 DOCUMENTS AND PLANS
1.1 Has the Contractor furnished a copy of the installation plans or instructions from the MSEW or RSS supplier as required by the Specifications?
1.2 Have the installation plans or instructions been approved by the Designer and/or Construction Division Manager?
1.3 Have stockpile and staging areas been discussed and approved?
1.4 Have access routes and temporary haul roads been discussed and approved?
2.0 LAYOUT
2.1 Has the contractor staked out sufficient horizontal and vertical control points, including points required for stepped foundations?
2.2 Has the contractor accounted for wall batter when staking the base of the wall?
2.3 Have drainage features and all utilities been located and marked?
2.4 Have Erosion & Sedimentation Controls been installed?
3.0 FOUNDATION PREPARATION
3.1 Has the MSEW or RSS foundation area been excavated to the proper elevation?
3.2 Has the foundation subgrade been inspected (e.g., proof rolled) as required by the specifications?
3.3 Has all soft or loose material been compacted or unsuitable materials (e.g., wet soil, organics) been removed and replaced?
3.4 Has the leveling-pad (if applicable) area been properly excavated and set to the proper vertical and horizontal alignment?
3.5 Has the leveling pad (if applicable) cured for the specified time (typically at least 12 hours) before the Contractor sets any facing panels?
4.0 DRAINAGE
4.1 Is the drainage being installed in the correct location?
4.2 Are drainage aggregates being kept free of fine materials?
4.3 Are all holes, rips and punctures in geotextiles being repaired in accordance with the specifications?
4.4 Are composite drain materials being placed with the proper side to the seepage face?
4.5 Do all collection and outlet pipes have a positive slope?

FHWA NHI-10-025 11 – Field Inspection MSE Walls and RSS – Vol II 11 – 33 November 2009
YES NO NA
5.0 FACING
5.1 Is the first row of facing panels (when applicable) properly placed? Do they have proper spacing, bracing, batter, and do they have the wood spacers installed?
5.2 Is the Contractor using the correct facing unit (correct size, shape, color, and with the proper number of connections) for the applicable location and elevation?
5.3 Is a geotextile filter being properly placed over joints in the facing panels?
5.4 Are the lower tiers of facing baskets (when applicable) properly placed? Are they setback correctly to result in the designed slope angle? Are the struts spaced correctly?
5.5 Have secondary reinforcing layers (e.g., biaxial geogrid) and vegetated matting (where applicable) been properly placed? Are they setback correctly to result in the designed slope angle?
5.6 Is the vertical elevation and horizontal alignment being checked periodically and adjusted as needed?
5.7 Is the contractor removing the wooden wedges as per the specifications? (Typically removed as soon as soon as erection and backfilling the panel above the wedged panel is completed.)
5.8 Is the spacing between individual facing units (or for RSS and wrapped face walls, overlap of reinforcement) in accordance with the specifications?
6.0 REINFORCING
6.1 Is the reinforcement being properly connected (connections tight and all of the slack in the reinforcing layers removed)
6.2 Is the reinforcement in the proper alignment?
6.3 Is the reinforcement the right type?
6.4 Is the reinforcement the correct length?
6.5 Is the reinforcement being placed at the correct spacing and location?
6.6 Is the fill being brought up to 2” above the soil reinforcement elevation before the reinforcement is connected?
6.7 Is construction equipment being kept from operating directly on the reinforcement (i.e., until adequate soil cover is placed over the reinforcement)?
7.0 BACKFILL
7.1 At the end of each day's operation is the Contractor grading the upper surface of reinforced and retained soil to ensure runoff of storm water away from the MSEW or RSS face or provide a positive means of controlling runoff away from the construction area?

FHWA NHI-10-025 11 – Field Inspection MSE Walls and RSS – Vol II 11 – 34 November 2009
YES NO NA
7.2 Where applicable, has the Contractor backfilled in front of the MSEW or RSS?
7.3 Is the Contractor placing the reinforced soil in lifts that are thin enough to ensure good compaction, but thick enough not to damage the reinforcement?
7.4 If the Contractor is using water to adjust the moisture of the reinforced, retained, or facing soil, does it meet the requirements set forth in the specifications?
7.5 Is the reinforced soil being placed to prevent damage to the reinforcement?
7.6 Are the lifts being spread to prevent excessive tension or excess slack in the reinforcement?
7.7 Is the fill being compacted using the correct equipment and in the correct pattern?
7.8 Is the soil moisture content within the specified range?
7.9 Is the soil compaction (dry density) within the specified range?
7.10 Is large compaction equipment being kept at least 3’ from the face?
8.0 ANCILLARY ITEMS AND FINISHED PRODUCT
8.1 Could installation of ancillary components (e.g., catch basins, storm-water piping, guardrail) affect the reinforcing or facing components already installed?
8.2 Have ancillary items been installed in accordance with the drawings and specifications?
8.3 Are ancillary items being installed at the proper locations?
8.4 Are diversion ditches, collection ditches, or slope drains installed in accordance with the drawings and specifications?
8.5 Is permanent or temporary erosion control blanket installed at the required locations and using the details shown on the drawings?
8.6 Are there any visible signs of MSEW or RSS tilting, bulging, or deflecting?
8.7 Has the vertical and horizontal alignment been confirmed by survey?
8.8 Is there a need to confirm the vertical or horizontal alignment at a future time to evaluate whether movement is occurring?
8.9 Are there any signs of distress to the facing components (e.g., fracturing or spalling of concrete panels, bowing of wire baskets, etc)?

FHWA NHI-10-025 11 – Field Inspection MSE Walls and RSS – Vol II 11 – 35 November 2009
11.4 PERFORMANCE MONITORING PROGRAMS Since MSE wall and RSS technologies are well established, the need for monitoring programs should be limited to cases in which new features or materials have been incorporated in the design, substantial post construction settlements are anticipated and/or construction rates require control, where degradation/corrosion rates of reinforcements are to monitored (e.g., to allow use of marginal fills), or for asset management. Degradation/Corrosion monitoring schemes are fully outlines in the companion Corrosion/ Degradation document.
11.4.1 Purpose of Monitoring Program The first step in planning a monitoring program is to define the purpose of the measurements. Every instrument on a project should be selected and placed to assist in answering a specific question. If there is no question, there should be no instrumentation. Both the questions that need to be answered and the clear purpose of the instrumentation in answering those questions should be established. The most significant parameters of interest should be selected, with care taken to identify secondary parameters that should be measured if they may influence primary parameters. Important parameters that may be considered include: C Horizontal movements of the face (for MSEW structures). C Vertical movements of the surface of the overall structure. C Local movements or deterioration of the facing elements. C Drainage behavior of the backfill. C Performance of any structure supported by the reinforced soil, such as approach slabs for
bridge abutments or footings. C Horizontal movements within the overall structure. C Vertical movements within the overall structure. C Lateral earth pressure at the back of facing elements. C Vertical stress distribution at the base of the structure. C Stresses in the reinforcement, with special attention to the magnitude and location of the
maximum stress. C Stress distribution in the reinforcement due to surcharge loads. C Relationship between settlement and stress-strain distribution.

FHWA NHI-10-025 11 – Field Inspection MSE Walls and RSS – Vol II 11 – 36 November 2009
C Stress relaxation in the reinforcement with time. C Aging condition of reinforcement such as metal losses due to corrosion or degradation of
polymeric reinforcements. C Pore pressure response below structure. C Temperature which often is a cause of real changes in other parameters, and also may
affect instrument readings. C Rainfall which often is a cause of real changes in other parameters. C Barometric pressure, which may affect readings of earth pressure and pore pressure
measuring instruments. The characteristics of the subsurface, backfill material, reinforcement, and facing elements in relation to their effects on the behavior of the structure must be assessed prior to developing the instrumentation program. It should be remembered that foundation settlement will affect stress distribution within the structure. Also, the stiffness of the reinforcement will affect the anticipated lateral stress conditions within the retained soil mass.
11.4.2 Limited Monitoring Program Limited observations and monitoring that should be performed on practically all structures will typically include: C Horizontal and vertical movements of the face (for MSEW structures). C Vertical movements of the surface of the overall structure. C Local movements or deterioration of the facing elements. C Performance of any structure supported by the reinforced soil, such as approach slabs for
bridge abutments or footings. Horizontal and vertical movements can be monitored by surveying methods, using suitable measuring points on the retaining wall facing elements or on the pavement or surface of the retained soil. Permanent benchmarks are required for vertical control. For horizontal control, one horizontal control station should be provided at each end of the structure. The maximum lateral movement of the wall face during construction is anticipated to be on the order of H/250 for inextensible reinforcement and H/75 for extensible reinforcement. Tilting due to differential lateral movement from the bottom to the top of the wall would be anticipated to be less than ¼-inch per 5 ft (4 mm per m) of wall height for either system. Post-construction horizontal movements are anticipated to be very small. Post construction vertical movements should be estimated from foundation settlement analyses, and measurements of actual foundation settlement during and after construction should be made.
FHWA NHI-10-025 11 – Field Inspection MSE Walls and RSS – Vol II 11 – 37 November 2009
11.4.3 Comprehensive Monitoring Program Comprehensive studies involve monitoring of surface behavior as well as internal behavior of the reinforced soil. A comprehensive program may involve the measurement of nearly all of the parameters enumerated above and the prediction of the magnitude of each parameter at working stress to establish the range of accuracy for each instrument. Whenever measurements are made for construction control or safety purposes, or when used to support less conservative designs, a predetermination of warning levels should be made. An action plan must be established, including notification of key personnel and design alternatives so that remedial action can be discussed or implemented at any time. A comprehensive program may involve all or some of the following key purposes: C Deflection monitoring to establish gross structure performance and as an indicator of the
location and magnitude of potential local distress to be more fully investigated. C Structural performance monitoring to primarily establish tensile stress levels in the
reinforcement and or connections. A second type of structural performance monitoring would measure or establish degradation rates of the reinforcements.
C Pullout resistance proof testing to establish the level of pullout resistance within a reinforced mass as a function of depth and elongation.
The possible instruments for monitoring are outlined in Table 11-6.
11.4.4 Program Implementation Selection of instrument locations involves three steps. First, sections containing unique design features are identified. For example, sections with surcharge or sections with the highest stress. Appropriate instrumentation is located at these sections. Second, a selection is made of cross sections where predicted behavior is considered representative of behavior as a whole. These cross sections are then regarded as primary instrumented sections, and instruments are located to provide comprehensive performance data. There should be at least two "primary instrumented sections." Third, because the selection of representative zones may not be representative of all points in the structure, simple instrumentation should be installed at a number of "secondary instrumented sections" to serve as indices of comparative behavior. For example, surveying the face of the wall in secondary cross sections would examine whether comprehensive survey and inclinometer measurements at primary sections are representative of the behavior of the wall.

FHWA NHI-10-025 11 – Field Inspection MSE Walls and RSS – Vol II 11 – 38 November 2009
Table 11-6. Possible Instruments for Monitoring Reinforced Soil Structures.
PARAMETERS POSSIBLE INSTRUMENTS
Horizontal movements of face Visual observation Surveying methods Horizontal control stations Tiltmeters
Vertical movements of overall structure Visual observation Surveying methods Benchmarks Tiltmeters
Local movements or deterioration of facing elements
Visual observation Crack gauges
Drainage behavior of backfill Visual observation at outflow points Open standpipe piezometers
Horizontal movements within overall structure Surveying methods Horizontal control stations Probe extensometers Fixed embankment extensometers Inclinometers Tiltmeters
Vertical movements within overall structure Surveying methods Benchmarks Probe extensometers Horizontal inclinometers Liquid level gauges
Performance of structure supported by reinforced soil
Numerous possible instruments (depends on details of structure)
Lateral earth pressure at the back of facing elements
Earth pressure cells Strain gauges at connections Load cells at connections
Stress distribution at base of structure Earth pressure cells
Stress in reinforcement Resistance strain gauges Induction coil gauges Hydraulic strain gauges Vibrating wire strain gauges Multiple telltales
Stress distribution in reinforcement due to surcharge loads
Same instruments as for stress in reinforcement

FHWA NHI-10-025 11 – Field Inspection MSE Walls and RSS – Vol II 11 – 39 November 2009
PARAMETERS POSSIBLE INSTRUMENTS
Relationship between settlement and stress-strain distribution
Same instruments as for: C vertical movements of surface of overall
structure C vertical movements within mass of overall
structure C stress in reinforcement Earth pressure cells
Stress relaxation in reinforcement Same instruments as for stress in reinforcement
Total stress within backfill and at back of reinforced wall section
Earth pressure cells
Pore pressure response below structures Open standpipe piezometers Pneumatic piezometers Vibrating wire piezometers
Temperature Ambient temperature record Thermocouples Thermistors Resistance temperature devices Frost gauges
Rainfall Rainfall gauge
Barometric pressure Barometric pressure gauge
Access to instrumentation locations and considerations for survivability during construction are also important. Locations should be selected, when possible, to provide cross checks between instrument types. For example, when multipoint extensometers (multiple telltales) are installed on reinforcement to provide indications of global (macro) strains, and strain gauges are installed to monitor local (micro) strains, strain gauges should be located midway between adjacent extensometer attachment points. Most instruments measure conditions at a point. In most cases, however, parameters are of interest over an entire section of the structure. Therefore, a large number of measurement points may be required to evaluate such parameters as distribution of stresses in the reinforcement and stress levels below the retaining structure. For example, accurate location of the locus of the maximum stress in the reinforced soil mass will require a significant number of gauge points, usually spaced on the order of 1-foot (300 mm) apart in the critical zone. Reduction in the number of gauge points will make interpretation difficult, if not impossible, and may compromise the objectives of the program.
FHWA NHI-10-025 11 – Field Inspection MSE Walls and RSS – Vol II 11 – 40 November 2009
In preparing the installation plan, consideration should be given to the compatibility of the installation schedule and the construction schedule. If possible, the construction contractor should be consulted concerning details that might affect his operation or schedule. Step-by-step installation procedures should be prepared well in advance of scheduled installation dates for installing all instruments. Detailed guidelines for choosing instrument types, locations and installation procedures are given in FHWA RD 89-043 (Christopher et al., 1989) and FHWA HI-98-034 (Dunnicliff, 1998).
11.4.5 Data Interpretation Monitoring programs have failed because the data generated was never used. If there is a clear sense of purpose for a monitoring program, the method of data interpretation will be guided by that sense of purpose. Without a purpose, there can be no interpretation. When collecting data during the construction phase, communication channels between design and field personnel should remain open so that discussions can be held between design engineers who planned the monitoring program and field engineers who provide the data. Early data interpretation steps should have already been taken, including evaluation of data, to determine reading correctness and also to detect changes requiring immediate action. The essence of subsequent data interpretation steps is to correlate the instrument readings with other factors (cause and effect relationships) and to study the deviation of the readings from the predicted behavior. After each set of data has been interpreted, conclusions should be reported in the form of an interim monitoring report and submitted to personnel responsible for implementation of action. The report should include updated summary plots, a brief commentary that draws attention to all significant changes that have occurred in the measured parameters since the previous interim monitoring report, probable causes of these changes, and recommended action. A final report is often prepared to document key aspects of the monitoring program and to support any remedial actions. The report also forms a valuable bank of experience and should be distributed to the owner and design consultant so that any lessons may be incorporated into subsequent designs.

FHWA NHI-10-025 References MSE Walls and RSS – Vol II R – 1 November 2009
REFERENCES AASHTO (2007). LRFD Bridge Design Specifications. 4th Edition, with 2008 and 2009
Interims, American Association of State Highway and Transportation Officials, Washington, D.C.
AASHTO (2006). Roadside Design Guide, 3rd Edition, American Association of State
Transportation and Highway Officials, Washington, D.C.
AASHTO (2006). Corrugated Polyethylene Drainage Pipe - M 252, Standard Specifications for Transportation Materials and Methods of Sampling and Testing, 26th Edition, American Association of State Transportation and Highway Officials, Washington, D.C.
AASHTO (2006). Standard Specifications for Geotextiles - M 288, Standard Specifications for Transportation Materials and Methods of Sampling and Testing, 26th Edition, American Association of State Transportation and Highway Officials, Washington, D.C.
AASHTO (2004). LRFD Bridge Construction Specifications, 2nd Edition, 2004, with 2006,
2007, 2008, and 2009 Interim Revisions
AASHTO (2002). Standard Specifications for Highway Bridges, 17th Edition, American Association of State Highway and Transportation Officials, Washington, D.C.
AASHTO (1994). 1994 Interims to 1992 Standard Specifications for Highway Bridges, 15th Edition, American Association of State Highway and Transportation Officials, Washington, D.C.
AASHTO (1986). AASHTO Guide for Design of Pavement Structures, American Association of State Highway and Transportation Officials, Washington, D.C.
ADAMA Engineering, Inc. (2008), ReSSA3: Reinforced Slope Stability Analysis (3RD edition), www.msew.com, Newark, DE,
ADAMA Engineering, Inc. (2001). ReSSA: Reinforced Slope Stability Analysis, developed under contract with Federal Highway Administration, www.msew.com, Newark, DE,
ADAMA Engineering, Inc. (2000). Mechanically Stabilized Earth Walls: Program MSEW, developed under contract with Federal Highway Administration, www.msew.com, Newark, DE.
Adib M.E. (1988). “Internal Lateral Earth Pressure in Earth Walls,” Doctor of Philosophy Dissertation, Department of Civil Engineering, University of California, Berkeley.
FHWA NHI-10-025 References MSE Walls and RSS – Vol II R – 2 November 2009
Andrawes, K. Z., McGown, A. and Murray, R. T. (1986). “The Load-Strain-Time Behavior of Geotextiles and Geogrids,” Proceedings of the Third International. Conference on Geotextiles, Vienna, Austria, pp. 707-712.
AGA, 2004. Hot-Dip Galvanizing for Corrosion Protection of Steel Products, American Galvanizing Association, Centenial, OH, 12 pp.
Allen, T.M. and Bathurst, R.J. (2006), “Design and performance of an 11-m high block-faced geogrid wall,” Proceedings of the 8th International Conference on Geosynthetics, Yokohama, Japan, pp. 953-956.
Allen, T.M., Bathurst, R.J., Lee, W. F., Holtz, R.D. and Walters, D.L., (2004) “A New Method for Prediction of Loads in Steel Reinforced Walls”, ASCE Journal of Geotechnical and Geo-environmental Engineering, Vol. 130, No. 11, pp. 1109-1120.
Allen and Bathurst 2003
Allen et al. 2004
Allen et al. 2003
Allen, T., Christopher, B.R., Elias, V.E. and DiMaggio, J. (2001) Development of the Simplified Method for Internal Stability Design of Mechanically Stabilized Earth (MSE) Walls, Washington State Department of Transportation Research Report WA-RD 513.1, 108 p.
Allen et al. 1993
Allen, T.M., Christopher, B.R. and Holtz, R.D., (1992), “Performance of a 12.6 m High Geotextile Wall in Seattle, Washington,” Geosynthetics Reinforced Soil Retaining Walls, J.T.H. Wu Editor, A.A. Balkema, Rotterdam, pp. 81-100.
Anderson D.G., Martin, G.R., Lam, I. And Wang, J.N. (2008). Seismic Analysis and Design of Retaining Walls, Buried Structures, Slopes, and Embankments, Project NCHRP 12-70, National Cooperative Highway Research Program, NCHRP Report 611, Transportation Research Board, National Research Council, Washington, D.C.
Anderson, L.R., Nelson, K.J. and Sampaco, C.L. (1995). Mechanically Stabilized Earth Walls, Transportation Research Circular Number 444, Transportation Research Board, Washington, D.C., 17 p.
Anderson, S.A., Alzamora, D. and DeMarco, (2008). Asset Management Systems for Retaining Walls, Proceedings of the 2008 Colorado ASCE Geotechnical Seminar Program in Lakewood, CO, pp 162 – 177.
FHWA NHI-10-025 References MSE Walls and RSS – Vol II R – 3 November 2009
ASTM (2008). Annual Book of Standards, Vol. 4.13, Geosynthetics, ASTM International, Philadelphia, PA, USA.
Arizona DOT 2009
Bathurst, R.J., Nernheim, A., and Allen, T.M. (2009). “Predicted loads in steel reinforced soil walls using the AASHTO Simplified Method,” ASCE Journal of Geotechnical and Geoenvironmental Engineering, Vol. 135, No. 2, pp. 177-184.
Bathurst, R. J., Miyata, Y., Nernheim, A., and Allen, T. M., (2008a), “Refinement of K-stiffness Method for geosynthetic reinforced soil walls,” Geosynthetics International, Vol. 15, No. 4, pp. 269-295.
Bathurst, R.J., Allen, T.M., and Nowak, A.S., (2008b), “Calibration Concepts for Load and Resistance Factor Design (LRFD) of Reinforced Soil Walls,” Canadian Geotechnical Journal, Vol. 45, pp. 1377-1392.
Bathurst, R.J., Nernheim, A. and Allen, T.M. (2008c). “Comparison of measured and predicted loads using the Coherent Gravity Method for steel soil walls.” Ground Improvement, Vol. 161, No. 3, 113-120.
Bathurst, R.J., Walters, D., Vlachopoulos, N., Burgess P., and Allan, T.H., (2000). “Fullscale Testing of Geosynthetic Reinforced Walls,” Proceedings of GeoDenver, ASCE Special Publication 2000.
Berg, R.R., Christopher, B.R. and Samtani, N.C. (2009). Design and Construction of Mechanically Stabilized Earth Walls and Reinforced Soil Slopes, FHWA NHI-10-024 Volume I and NHI-10-025 Volume II, U.S. Department of Transportation, Federal Highway Administration, Washington, D.C., 306 p (Vol I) and 380p (Vol II).
Berg, R.R., (2000). Minnesota Department of Transportation Standard MSEW and RSS Designs, Project Report – Volume I, Summary Report, Minnesota Department of Transportation, Oakdale, MN, 98 p.
Berg, R.R. (1993), Guidelines for Design, Specification, and Contracting of Geosynthetic Mechanically Stabilized Earth Slopes on Firm Foundations, FHWA-SA-93-025, Federal Highway Administration, Washington, D.C.

FHWA NHI-10-025 References MSE Walls and RSS – Vol II R – 4 November 2009
Berg, R.R., Anderson, R.P., Race, R.J., and Chouery-Curtis, V.E. (1990). “Reinforced Soil Highway Slopes,” Transportation Research Record No. 1288, Geotechnical Engineering, Transportation Research Board, Washington, D.C., pp. 99-108.
Berg, R.R., Chouery-Curtis, V.E., and Watson, C.H., (1989). "Critical Failure Planes in Analysis of Reinforced Slopes," Proceedings of Geosynthetics '89, Volume 1, San Diego, February.
Bligh et al. (2009). Design of Roadside Barrier Systems Placed on MSE Retaining Walls- Report in Review, Project NCHRP 22-20, National Cooperative Highway Research Program, Transportation Research Board, National Research Council, Washington, D.C.
Bonarparte, R., Holtz, R.D. and Giroud, J.P., (1987). "Soil Reinforcement Design Using Geotextiles and Geogrids", Geotextile Testing and The Design Engineer, ASTM, Special Technical Publication 952.
Bonczkiewicz, C., Christopher, B. R., and Atmatzidis, D. K. (1988). "Evaluation of Soil Reinforcement Interaction by Large-Scale Pullout Tests," Transportation Research Record 1188, pp. 1-18.
Bush, D.I. (1990). “Variation of Long-Term Design Strength of Geosynthetics in
Temperatures up to 40oC”, Proceedings of the Fourth International. Conference on Geotextiles, Geomembranes, and Related Products, The Hague, Netherlands, pp. 673-676.
Cedergren, H.R. (1989). Seepage, Drainage, and Flow Nets, Third Edition, John Wiley and Sons, New York, 465 p.
Chan C., Hover, K.C., Folliard, K.J., Hance R.M. and Trejo, D. (2007). Durability of Segmental Retaining Wall Blocks: Final Report, FHWA HRT-07-021, FHWA, McLean, VA, 271 p.
Chow and Van Laeken (1991). “Viscoelastic Relaxation in oriented Semicrystalline Polymers,” Polymer, Vol. 32, pp. 1798-1802.
Christopher, B. R. (1993). Deformation Response and Wall Stiffness in Relation to Reinforced Soil Wall Design, Ph.D. Dissertation, Purdue University, 352 pp.
Christopher, B. R., Gill, S. A., Giroud, J. P., Juran, I., Mitchell, J. K., Schlosser, F., and Dunnicliff, J., (1990). “Design and Construction Guidelines for Reinforced Soil Structure - Volume 1.” FHWA-RD-89-043, Federal Highway Administration, Washington, D. C.

FHWA NHI-10-025 References MSE Walls and RSS – Vol II R – 5 November 2009
Christopher, B. R., Gill, S. A., Giroud, J. P., Juran, I., Mitchell, J. K., Schlosser, F., and Dunnicliff, J. (1989). Design and Construction Guidelines - Volume II, Summary of Research and Systems Information , FHWA RD 89-043, FHWA, Washington, D.C.
Collin, J.G. (1996). "Controlling Surficial Stability Problems on Reinforced Steepened Slopes" Geotechnical Fabrics Report IFAI.
Collin, J. G., Berg, R.R., and Meyers, M. (2002). Segmental Retaining Wall Drainage Manual, National Concrete Masonry Association, Herdon, Virginia, 2002, 96 p.
Collin J.G. (1986). Earth Wall Design, Doctor of Philosophy Dissertation, University of Berkeley, 419 p.
Daniel, D.E. and Koerner, R.M. (1993). Quality Assurance and Quality Control for Waste Containment Facilities, U.S. EPA Technical Guidance Document, EPA/600/R-93/182, Cincinnati, OH, 305 p.
den Hoedt, G., Voskamp, W., van den Heuvel, C. J. M. (1994). “Creep and Time-to-Rupture of Polyester Geogrids at Elevated Temperatures,” Proceedings of the Fifth International. Conference on Geotextiles, Geomembranes, and Related Products, Singapore, pp. 1125-1130.
DiMagiio, J. (1994). Design and Construction Monitoring of Mechanically Stabilized Earth Structures, FHWA.
Dunnicliff, J. (1998). Geotechnical Instrumentation, U.S. Department of Transportation, Federal Highway Administration, Washington DC, FHWA-HI-98-034, 238 p.
Elias, V., Fishman, K.L., Christopher, B.R. and Berg, R.R. (2009). Corrosion/Degradation of Soil Reinforcements for Mechanically Stabilized Earth Walls and Reinforced Soil Slopes, U.S. Department of Transportation, Federal Highway Administration, Washington DC, FHWA-NHI-09-087, 146 p.
Elias, V., Welsh, J., Warren, J., Lukas, R.,. Collin, J.G. and Berg, R.R. (2006). Ground Improvement Methods, U.S. Department of Transportation, Federal Highway Administration, Washington, D.C., FHWA NHI-06-019 (Vol. I) and FHWA NHI-06-020 (Vol. II), 2006.
Elias, V, Christopher, B.R. and Berg, R.R. (2001). Mechanically Stabilized Earth Walls and Reinforced Soil Slopes, Design and Construction Guidelines, U.S. Department of Transportation, Federal Highway Administration, Washington DC, FHWA-NHI-00-043, 418 p.
Elias, V. (2000). Corrosion/Degradation of Soil Reinforcements for Mechanically Stabilized Earth Walls and Reinforced Soil Slopes, FHWA-NHI-00-044, Washington, D.C., 94p.

FHWA NHI-10-025 References MSE Walls and RSS – Vol II R – 6 November 2009
Elias, V., Salman, A., Juran, I., Pearce, E., Lu, S., (1999). “Testing Protocols for Oxidation and Hydrolysis of Geosynthetics,” FHWA RD-97-144, Washington, D.C.
Elias, V. and Christopher, B.R., (1997). Mechanically Stabilized Earth Walls and Reinforced Soil Slopes, Design and Construction Guidelines, Federal Highway Administration, FHWA SA-96-071, Washington, D.C., 371 p.
Elias V. (1989). "Corrosion/Durability of Soil Reinforced Structures" FHWA RD 89-186. Washington D.C., 105 p.
Elias, V., Zehong, Y., Swan, R.H., and Bachus, R.C., (1998). Testing Protocols for Confined Creep and Extension Testing of Geosynthetics, FHWA-RD-97-143, FHWA, Washington, D.C., 211 p.
Embacher, R., Schultz, A. and Snyder, M. (2001a). Condition and Durability of Segmental Concrete Block Retaining Walls Along Roadways in Minnesota, Minnesota Department of Transportation, 348 p.
Embacher, R., Schultz, A. and Snyder, M. (2001b).
Eurocode 7 Geotechnical Design, European Committee for Standardization
Ferry, J. D. (1980). Viscoelastic Properties of Polymers, 3rd Edition, John Wiley and Sons, NY.
FHWA Federal Lands Highway Division’s Roadway Aesthetic Treatments Photo Album
(RATPA) available at http://gallery.company39.com/FLH/gallery/.
Findley, W. N., Lai, J. S., Onaran, K. (1976). Creep and Relaxation of Nonlinear Viscoelastic Materials, Dover Publications, NY, 369 pp.
Gray, D.H. and Sotir, R. (1995). Biotechnical and Soil Bioengineering Slope Stabilization, A Practical Guide for Erosion Control, John Wiley & Sons, New York, NY.
Hayden, R.F., Schmertmann, G.R., Qedan, B.Q., and McGuire, M.S. (1991) “High Clay Embankment Over Cannon Creek Constructed with Geogrid Reinforcement,” Proceedings of Geosynthetics ‘91, Atlanta, GA.
Helwany, B., Wu, J. T. H., 1992, “A Generalized Creep Model for Geosynthetics,” International Symposium on Earth Reinforcement Practice, Japan, pp.
Holtz, R. D., Christopher, B. R., and Berg, R. R. (2008). Geosynthetic Design and
Construction Guidelines, Federal Highway Administration, Report FHWA-NHI-07-092, McLean, VA.

FHWA NHI-10-025 References MSE Walls and RSS – Vol II R – 7 November 2009
Huntington, W.C. (1957). Earth Pressures and Retaining Walls, John Wiley and Sons, New York, pp. 175-217.
ISO/FDIS 9080 (2001)
Jewell, R.A. (1990). "Revised Design Charts for Steep Reinforced Slopes, Reinforced Embankments: Theory and Practice in the British Isles", Thomas Telford, London, U.K.
Jewell, R.A. and Greenwood, J.H. (1988). “Long-Term Strength and Safety in Steep Soil Slopes Reinforced by Polymer Materials”, Geotextiles and Geomembranes, Vol. 7, Nos. 1 and 2, pp. 81-118.
Jurgenson, L. (1934). "The Shearing Resistance of Soils", Journal of the Boston Society of Civil Engineers, Also in Contribution to Soil Mechanics, 1925-1940, Boston Society of Civil Engineers, pp 134-217.
Kavazanjian, E. (2009). Personal communication.
Kenney, T.C. and Lau, D. (1986). Reply (to discussions), Vol. 23, No. 3, pp. 420-423, Internal Stability of Granular Filters, Canadian Geotechnical Journal, Vol. 22, No. 2, 1985, pp. 215-225.
Kenney, T.C. and Lau, D. (1985). Internal Stability of Granular Filters, Canadian Geotechnical Journal, Vol. 22, No. 2, 1985, pp. 215-225.
Koerner, G.R., Hsuan, Y.G. and Hart, M. (2000). Field Monitoring and Laboratory Study of Geosynthetics in Reinforcement Applications, Tasks B1 and B2, Geosynthetic Research Institute, Philadelphia, PA, 116 p.
Koerner, R.M., (1998). Designing With Geosynthetics, 4th Edition, Prentice-Hall Inc., Englewood Cliffs, NJ, 761p.
Lazarte, C. A., Elias, V., Espinoza, R. D., Sabatini, P.J. (2003). “Soil Nail Walls”, Geotechnical Engineering Circular, No. 7, Federal Highway Administration Report, Report No. FHWA-IF-03-017, Washington, D.C.
Leshchinsky and Han (2004).
Leshchinsky, E. and Boedeker, R.H. (1989). "Geosynthetic Reinforced Soil Structures", Journal of Geotechnical Engineering, ASCE, Volume 115, Number 10, pp. 1459-1478.
Lostumbo, J.M. (2009). “Yeager Airport Runway Extension: Tallest Known 1H:1V Slope in U.S.,” Proceedings of Geosynthetics 2009, Salt Lake City, Utah, pp. 593-598.

FHWA NHI-10-025 References MSE Walls and RSS – Vol II R – 8 November 2009
Lothspeich, S., and Thornton, S. (2000). “Comparison of Long-term Design Reduction Factors Based on Creep Rupture and Creep Strength Criteria for Several Geosynthetic Reinforcing Materials,” EuroGeo 2, pp. 341-346.
Mayne, P. W., Christopher, B. R., and DeJong, J. (2002). “Manual on Subsurface Investigations”, National Highway Institute Publication, Federal Highway Administration, Report FHWA-NHI-01-031, Washington, D.C.
McGown, A., Paine, N., and DuBois, D.D. (1984). “Use of Geogrid Properties in Limit Equilibrium Analysis”, Proceedings of the Symposium on Polymer Grid Reinforcement in Civil Engineering, Paper No. 1.4, pp. 1-5.
Meyerhof, G.G., (1951). “The Ultimate Bearing Capacity of Foundations.” Geotechnique
Vol. 2 pp. 301-332.
Minnesota Department of Transportation (Mn/DOT), (2008). Approved Products List for MBW Unit – Geosynthetic Reinforcement Combinations (available at http://www.dot.state.mn.us/materials/geoteng.html).
Minnesota Department of Transportation (Mn/DOT), (2008). Standard Drawings.
Minnesota Department of Transportation (Mn/DOT), (2008). Use of Dry-Cast Segmental Masonry Retaining Wall Units, Technical Memorandum No. 08-06-MRR-01, April 7, 2008, 5 p. (available at www.dot.state.mn.us/design/tech-memos/active).
Minnesota Department of Transportation (Mn/DOT), (2001). Technical Memorandum No.: 01-05-MR-01, Program Support Group, Minnesota Department of Transportation, 8 February 2001, 8 p.
Morrison, K. F., Harrison, F. E., Collin, J. G., Dodds, A., and Arndt, B. (2006). “Shored Mechanically Stabilized Earth (SMSE) Wall Systems”, Technical Report, Federal Highway Administration, Washington, D.C., Report No. FHWA-CFL/TD-06-001, 212 p.
Munfakh, G., Arman, A., Collin, J.G., Hung, J,C-J. and Brouillette, R.P. (2001). Shallow Foundations, Federal Highway Administration, FHWA-NHI-01-023, Washington, D.C., 222 p.
Murray, R. T. and McGown, A. (1988). “Assessment of the Time Dependent Behavior of Geotextiles for Reinforced Soil Applications,” Durability of Geotextiles RILEM, Chapman and Hall.
Musser and Denney (2005).
FHWA NHI-10-025 References MSE Walls and RSS – Vol II R – 9 November 2009
NCMA (2009). Design Manual for Segmental Retaining Walls, National Concrete Masonry Association, 3rd Edition, Herndon, VA.
NCMA (1997). Design Manual for Segmental Retaining Walls, National Concrete Masonry Association, Collin, J.G., editor 2nd Edition, Herndon, VA, TR-127A.
Newmark, N.M., (1965). “Effects of Earthquakes on Dams and Embankments,” Geotehcnique, Vol. 14, No. 2, pp. 139-160.
O’Neill, M.W. and Reese, L.C. (1999). Drilled Shafts: Construction Procedures and Design Methods, U.S. Department of Transportation, Federal Highway Administration, Washington, D.C., FHWA-NHI-99-025.
Popelar, et al., (1990). “Viscoelastic Material Characterization and Modeling for Polyethylene,” Polymer Engineering and Science, Vol. 30, no. 10, pp. 577-586.
Popelar, C.H., Kenner, V.H., and Wooster, J.P. (1991). “An Accelerated Method for Establishing the Long Term Performance of Polyethylene Gas Pipe Materials”, Polymer Engineering and Science, Vol. 31, pp. 1693-1700.
Prandtl, L. (1921). àber die eindingungsfestigkeit (hate) plasticher baustoffe und die festigkeit von schneiden, Zeitschrift fár Angewandte Mathematik und Mechanik, Vol 1, No. 1, pp. 15-20.
Reissner H. (1924). Zum erddruckproblem, Proceedings of the 1st Intem. Congress of Applied Mechanics, Delft, Germany, pp. 295-311.
Ruegger, R. (1986). "Geotextile Reinforced Soil Structures on which Vegetation can be Established", Proceedings of the 3rd International Conference on Geotextiles, Vienna, Austria, Volume II, pp. 453-458.
Sabatini, P. J., Pass, D. G. and Bachus, R. C. (1999). “Ground Anchors and Anchored Systems.” Geotechnical Engineering Circular, No. 4, U.S. Department of Transportation, Federal Highway Administration, FHWA-SA-99-015.
Samtani, N. C. and Nowatzki, E. A. (2006). “Soils and Foundations”, Reference Manual - Volume I and II, Report No. FHWA NHI-06-088 and FHWA NHI-06-089, Federal Highway Administration, U. S. Department of Transportation.
Sankey, J.E., Bailey, M.J., and Chen, B. (2007). “SeaTac Third Runway: Design and Performance of MSE Tall Wall,” New Horizons in Earth Reinforcement, 5th International Symposium on Earth Reinforcement, IS Kyushu 2007, Fukuoka, Japan.

FHWA NHI-10-025 References MSE Walls and RSS – Vol II R – 10 November 2009
Schmertmann, G.R., Chouery-Curtis, V.E., Johnson, R.D. and Bonaparte, R. (1987). Design Charts for Geogrid-Reinforced Soil Slopes, Proceedings of Geosynthetics '87, New Orleans, LA, Volume 1, pp. 108-120.
Schwanz, N., Meyers, M.S., and Berg, R.R. (1997). Specifying and Bidding Segmental Concrete Faced MSE Walls on Corps of Engineers Projects, Proceedings of Geosynthetics '97 Conference, Long Beach, California, pp. 789-801.
Silvestri, V. (1983). "The Bearing Capacity of Dykes and Fills Founded on Soft Soils of Limited Thickness", Canadian Geotechnical Journal, Volume 20, Number 3, pp. 428-436.
Simac, M.R., Bathhurst R.J. Berg R.R., Lothspeich S.E., (1993). Design Manual for Segmental Retaining Walls, National Concrete Masonry Association. Herndon, VA, 1993, 336 p.
Sotir, R.B. and Christopher, B.R. (2000). “Soil Bioengineering and Geosynthetics for Slope Stabilization,” Proceedings, Geosynthetics Asia 2000, Selangor Daruf, Ehsan Malaysia.
Sotir, R.B. and Stulgis, R.P. (1999). "Slope Stabilization Using Soil Bioengineering Case
Studies", Proceedings ASCE International Water Resource Engineering Conference Program, Seattle, WA.
Sotir, R.B., Difini, J.T. and McKown, A.F. (1998). "Soil Bioengineering Biotechnical
Stabilization of a Slope Failure," Proceedings, The Sixth International Conference on Geosynthetics, Atlanta, GA.
Stuedlein, A.W., Mikkelsen, P.E. and Bailey, M.J. (2007). Instrumentation and Performance of the Third Runway North MSE Wall at Seattle-Tacoma International Airport, Field Measurements in Geomechanics 2007, GSP No. 175, ASCE, J. DiMaggio and P. Osborn (Eds.), pp 1-14.
Takaku, A. (1981). “Effect of Drawing on Creep Fracture of Polypropylene Fibers”, Journal of Applied Polymer Science, Vol. 26, pp. 3565-3573.
Takemura (1959). Theoretical Consideration of the Effect of Crystallinity on the Viscoelastic Properties of Polyethylene,” Journal of Applied Polymer Science, Vol. 38, pp. 471-478.
Tanyu, B.F., Sabatini, P.J. and Berg, R.R. (2008). Earth Retaining Structures, U.S.
Department of Transportation, Federal Highway Administration, Washington, D.C., FHWA-NHI-07-071, 2008.

FHWA NHI-10-025 References MSE Walls and RSS – Vol II R – 11 November 2009
Terzaghi, K., Peck, R.B., and Mesri, G. (1996). Soil Mechanics in Engineering Practice, Third Edition, John Wiley & Sons, New York, pp 330-332.
Thornton, J. S., Allen, S. R., and Thomas, R. W., (1997) “Approaches for the Prediction of
Long Term Viscoelastic Properties of Geosynthetics from Short-Term Tests,” Geosynthetics ’97, IFAI, Long Beach, CA, Vol. 1, pp. 277-291.
Thornton, J. S., Allen, S. R., Thomas, R. W., and Sandri, D., 1998b, “The Stepped Isothermal Method for Time-Temperature Superposition and Its Application to Creep Data of Polyester Yarns,” Sixth International Conference on Geotextiles, Geomembranes, and Related Products, Atlanta, GA, pp.699-706.
Thornton, J. S., and Baker, T. L., 2002, “Comparison of SIM and conventional Methods for Determining Creep-Rupture Behavior of a Polypropylene Geotextile,” 7th International Geosynthetics Conference, Nice, France, Vol. 4, pp. 1545-1550.
Thornton, J. S., Paulson, J., and Sandri, D., (1998a), “Conventional and Stepped Isothermal Methods for Characterizing Long-Term Creep Strength of Polyester Geogrids,” Sixth International Conference on Geotextiles, Geomembranes, and Related Products, Atlanta, GA, pp.691-698.
Vesic’A.S. (1975). Bearing Capacity of Shallow Foundations, Foundation Engineering
Handbook, Winterkorn, H. and H.Y. Fang, H.Y. (Eds.), Van Nostrand Reinhold Co., New York, NY, Chapter 3, pp. 121-147.
Wadsworth, H. (1998). Handbook of Statistical Methods for Engineers and Scientists,
McGraw-Hill, 688 pp. Washington Department of Transportation (2009). Standard Practice T 925, Standard
Practice for Determination of Long-Term Strength for Geosynthetic Reinforcement, WSDOT Materials Manual M46-01.03.
Washington State Department of Transportation (WSDOT), (2006). Geotechnical Design
Manual, M 46-03, Chapter 15 – Abutments, Retaining Walls, and Reinforced Slopes. Wayne and Wilcosky (1995). "An innovative use of a nonwoven geotextile in the repair of
Pennsylvania State Route 54", Geotechnical Fabrics Report, Volume 13, Number 2.
Wilding, M.A. and Ward, I.M. (1978). “Tensile and Creep Recovery in Ultra-High Modulus Polyethylenes,” Polymer, Vol. 19, pp.
Wilding, M.A. and Ward, I.M. (1981). “Creep and Recovery of Ultra High Modulus Polyethylene”, Polymer, Vol. 22, pp. 870-876.

FHWA NHI-10-025 References MSE Walls and RSS – Vol II R – 12 November 2009
Wright, S. (2005)
Wright, S.G. and Duncan, J.M. (1990). "Limit Equilibrium Stability Analyses for Reinforced Slopes," presented at the Transportation Research Board 70th Annual Meeting, January 13-17, Washington D.C.
Wrigley et al. 2000 Wrigley et al. 1999
Wu, J.T.H, Lee, K., Helwany, S., and Ketchart, K. (2006). Design and Construction Guidelines for Geosynthetic-Reinforced Soil Bridge Abutments with a Flexible Facing System, NCHRP Report 556, Project 12-59, National Cooperative Highway Research Program, Transportation Research Board, National Research Council, Washington, D.C.
Wu, J.T.H. (1994). Design and Construction of Low Cost Retaining Walls – The Next Generation in Technology, Colorado Transportation Institute, Report CTI-UCD-1-94, 152p.
Yarger, T.L. and Barnes R.S. (1993), "Montana Department of Transportation's Introduction to Geogrid Use for Steepened Embankment Design", Proceedings of Geosynthetics '93, Vancouver, B.C., Canada, pp 311-326.
Zhurko 1965
Zornberg J., Barrows, R., Christopher, B.R. and Wayne, M. (1995). "Construction and Instrumentation of a Highway Slope Reinforced with High-Strength Geotextiles", Proceedings of Geosynthetics '95, Nashville, TN.
FHWA NHI-10-025 Appendix A – LRFD Factors & Nomenclature MSE Walls and RSS – Vol II A –1 November 2009
APPENDIX A LRFD LOAD NOTATION,
LOAD COMBINATIONS, AND LOAD FACTORS
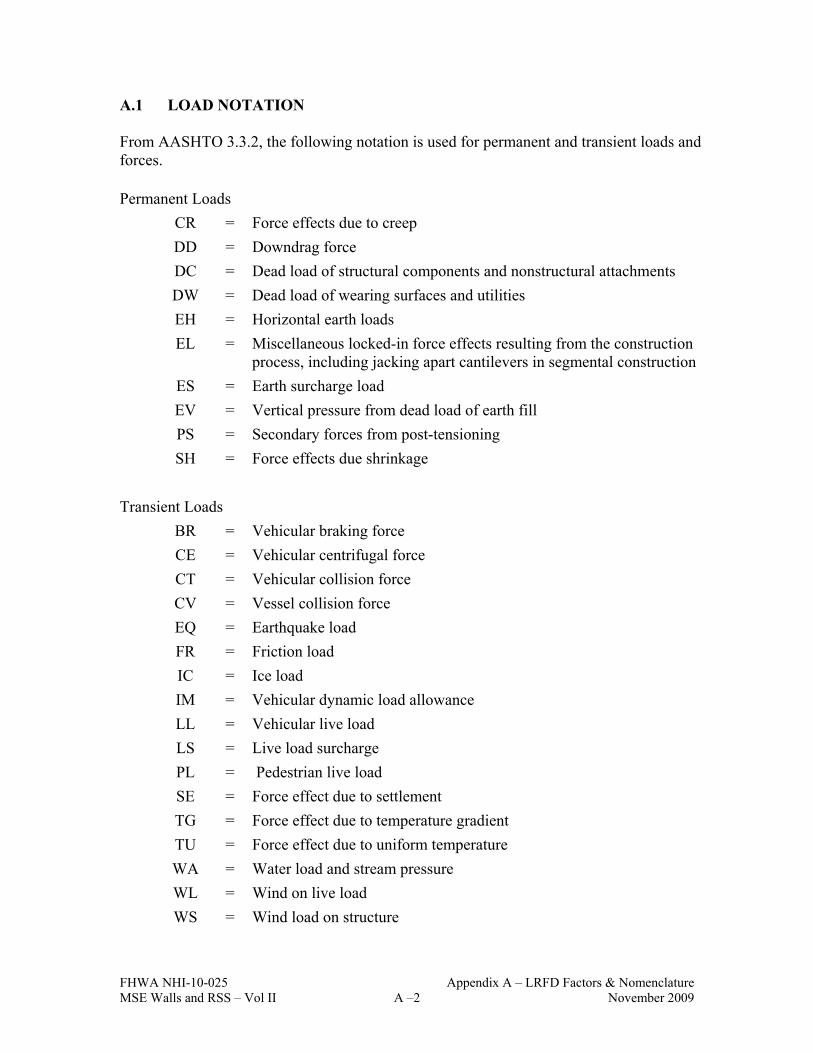
FHWA NHI-10-025 Appendix A – LRFD Factors & Nomenclature MSE Walls and RSS – Vol II A –2 November 2009
A.1 LOAD NOTATION From AASHTO 3.3.2, the following notation is used for permanent and transient loads and forces. Permanent Loads
CR = Force effects due to creep
DD = Downdrag force
DC = Dead load of structural components and nonstructural attachments
DW = Dead load of wearing surfaces and utilities
EH = Horizontal earth loads
EL = Miscellaneous locked-in force effects resulting from the construction process, including jacking apart cantilevers in segmental construction
ES = Earth surcharge load
EV = Vertical pressure from dead load of earth fill
PS = Secondary forces from post-tensioning
SH = Force effects due shrinkage
Transient Loads
BR = Vehicular braking force
CE = Vehicular centrifugal force
CT = Vehicular collision force
CV = Vessel collision force
EQ = Earthquake load
FR = Friction load
IC = Ice load
IM = Vehicular dynamic load allowance
LL = Vehicular live load
LS = Live load surcharge
PL = Pedestrian live load
SE = Force effect due to settlement
TG = Force effect due to temperature gradient
TU = Force effect due to uniform temperature
WA = Water load and stream pressure
WL = Wind on live load
WS = Wind load on structure

FHWA NHI-10-025 Appendix A – LRFD Factors & Nomenclature MSE Walls and RSS – Vol II A –3 November 2009
A.2 LOAD COMBINATIONS Load combinations and load factors from AASHTO 3.4, Table 3.4.1-1 are listed below.
Load Combinations and Load Factors (Table 3.4.1-1, AASHTO, 2007) Use One of These at a Time Load
Combination
Limit State
DC DD DW EH EV ES EL PS CR SH
LL IM CE BR PL LS WA WS WL FR TU TG SE EQ IC CT CV
STRENGTH I (unless noted)
γp 1.75 1.00 – – 1.00 0.50/1.20 γTG γSE – – – –
STRENGTH II γp 1.35 1.00 – – 1.00 0.50/1.20 γTG γSE – – – –
STRENGTH III γp – 1.00 1.40 – 1.00 0.50/1.20 γTG γSE – – – –
STRENGTH IV γp – 1.00 – – 1.00 0.50/1.20 – – – – – –
STRENGTH V γp 1.35 1.00 0.40 1.0 1.00 0.50/1.20 γTG γSE – – – –
EXTREME EVENT I
γp γEQ 1.00 – – 1.00 – – – 1.00 – – –
EXTREME EVENT II
γp 0.50 1.00 – – 1.00 – – – – 1.00 1.00 1.00
SERVICE I 1.00 1.00 1.00 0.30 1.0 1.00 1.00/1.20 γTG γSE – – – –
SERVICE II 1.00 1.30 1.00 – – 1.00 1.00/1.20 – – – – – –
SERVICE III 1.00 0.80 1.00 – – 1.00 1.00/1.20 γTG γSE – – – –
SERVICE IV 1.00 – 1.00 0.70 – 1.00 1.00/1.20 – 1.0 – – –
FATIGUE – LL, IM & CE ONLY
– 0.75 – – – – – – – – – – –

FHWA NHI-10-025 Appendix A – LRFD Factors & Nomenclature MSE Walls and RSS – Vol II A –4 November 2009
A.3 LOAD FACTORS FOR PERMANENT LOADS Load factors for permanent loads, from AASHTO 3.4, Table 3.4.1-2 are listed below.
Load Factors for Permanent Loads, γp (Table 3.4.1-2, AASHTO, 2007)
Load Factor Type of Load, Foundation Type, and Method Used to Calculate Downdrag Maximum Minimum
DC: Component and Attachments DC: Strength IV only
1.25 1.50
0.90 0.90
DD: Downdrag Piles, α Tomlinson Method Piles, Method Drilled shafts, O’Neill and Reese (1999) Method
1.4 1.05 1.25
0.25 0.30 0.35
DW: Wearing Surfaces and Utilities 1.50 0.65
EH: Horizontal Earth Pressure Active At-Rest AEP for anchored walls
1.50 1.35 1.35
0.90 0.90 N/A
EL: Locked-in Construction Stresses 1.00 1.00
EV: Vertical Earth Pressure Overall Stability Retaining Walls and Abutments Rigid Buried Structure Rigid Frames Flexible Buried Structures other than Metal Box Culverts Flexible Metal Box Culverts
1.00 1.35 1.30 1.35 1.95 1.50
N/A 1.00 0.90 0.90 0.90 0.90
ES: Earth Surcharge 1.50 0.75

FHWA NHI-10-025 Appendix B – Pullout & Connection Strengths MSE Walls and RSS – Vol II B–1 November 2009
APPENDIX B DETERMINATION OF PULLOUT RESISTANCE FACTORS and
MBW UNIT – GEOSYNTHETIC CONNECTION STRENGTH
Pullout resistance of soil reinforcement is defined by the ultimate pullout resistance required to cause outward sliding of the reinforcement through the soil. Reinforcement specific data has been developed and is presented in Chapter 3. The empirical data uses different interaction parameters, and it is therefore difficult to compare the pullout performance of different reinforcements. The method for determining reinforcement pullout presented herein, consists of the normalized approach recommended in the FHWA manual FHWA-RD-89-043 (Christopher et al., 1990). The pullout resistance, F* is a function of both frictional and passive resistance, depending on the specific reinforcement type. The scale effect correction factor, α, is a function of the nonlinearity in the pullout load - mobilized reinforcement length relationship observed in pullout tests. Inextensible reinforcements usually have little, if any nonlinearity in this relationship, resulting in α equal to 1.0, whereas extensible reinforcements can exhibit substantial nonlinearity due to a decreasing shear displacement over the length of the reinforcement, resulting in an α of less than 1.0. Both F* and α must be determined through product specific tests, or empirically/theoretically using the procedures provided herein and in Section 3.3, in particular Table 5. It should be noted that the empirical procedures provided in this appendix for the determination of F* reduce, for the most part, to the equations currently provided in 2007 AASHTO for pullout design. The pullout resistance of partial/full friction facing/reinforcement connections is defined as the load required to cause sliding of the reinforcement relative to the facing blocks or reinforcement rupture at the facing connection, whichever occurs first.
B.1 EMPIRICAL PROCEDURES TO DETERMINE F* AND α Pullout resistance can be estimated empirically/theoretically using the method provided in Chapter 3. F* using this method, is calculated as follows: F* = Frictional Resistance + Passive Resistance = Tan ρ + Fq αβ

FHWA NHI-10-025 Appendix B – Pullout & Connection Strengths MSE Walls and RSS – Vol II B–2 November 2009
where Tan ρ is an apparent friction coefficient for the specific reinforcement, ρ is the soil-reinforcement interface friction angle, Fq is the embedment (or surcharge) bearing capacity factor, and αβ is a structural geometric factor for passive resistance. The determination of each of these parameters is provided in Table 5, Chapter 3, with α estimated analytically using direct shear test data and the "t-z" method used in the design of friction piles. However, since some test data is required and the analytical method is complex, it is better to obtain α directly from pullout test data or use conservative default values for α. If pullout test data is not available, a default value of 1.0 can be used for α for inextensible reinforcements and a default value of 0.6 to 0.8 can be used for extensible reinforcements.
B.2 EXPERIMENTAL PROCEDURES TO DETERMINE F* AND α Two types of tests are used to obtain pullout resistance parameters: the direct shear test, and the pullout test. The direct shear test is useful for obtaining the peak or residual interface friction angle between the soil and the reinforcement material. ASTM D-5321 should be used for this purpose. In this case, F* would be equal to tan ρpeak. F
* can be obtained directly from this test for sheet and strip type reinforcements. However, the value for α must be assumed or analytically derived, as α cannot be determined directly from direct shear tests. A pullout test can also be used to obtain pullout parameters for these types of soil reinforcement. A pullout test must be used to obtain pullout parameters for bar mat and grid type reinforcements, and to obtain values for α for all types of reinforcements. In general, the pullout test is preferred over the direct shear test for obtaining pullout parameters for all soil reinforcement types. It is recommended that ASTM D6706 test procedure using the controlled strain rate method be used. For long-term interaction coefficients, the constant stress (creep) method can be used. For extensible reinforcements, it is recommended that specimen deformation be measured at several locations along the length of the specimen (e.g., three to four points) in addition to the deformation at the front of the specimen. For all reinforcement materials, it is recommended that the specimen tested for pullout have a minimum embedded length of 24 inches (600 mm). Additional guidance is provided herein regarding interpretation of pullout test results. For geogrids, the grid joint, or junction strength, must be adequate to allow the passive resistance on the transverse ribs to develop without failure of the grid joint throughout the design life of the structure. To account for this, F* for geogrids should be determined using one of the following approaches:

FHWA NHI-10-025 Appendix B – Pullout & Connection Strengths MSE Walls and RSS – Vol II B–3 November 2009
C Using quick effective stress pullout tests (i.e., constant rate of displacement method for short-term loading condition per ASTM D6706) and creep testing (per ASTM D5262) of the geogrid with clamping and loading through-the-junction.
C Using quick effective stress pullout tests (i.e., constant rate of displacement method for short-term loading condition per ASTM D6706), but with the geogrid transverse ribs severed.
C Using quick effective stress pullout tests (i.e., constant rate of displacement method for short-term loading condition per ASTM D6706) if the summation of the shear strengths of the joints occurring in a 1 ft. (300 mm) length of grid sample is equal to or greater than the ultimate strength of the grid element to which they are attached. If this joint strength criteria is used, grid joint shear strength should be measured in accordance with GRI:GG2 (GRI, 1988).
C Conduct long-term effective stress pullout tests of the entire geogrid structure in accordance with the constant stress (creep) method of ASTM D6706.
For pullout tests, a normalized pullout versus mobilized reinforcement length curve should be established as shown in Figure B-1. Different mobilized lengths can be obtained by instrumenting the reinforcement specimen. Strain or deformation measuring devices such as wire extensometers attached to the reinforcement surface at various points back from the grips should be used for this purpose. A section of the reinforcement is considered to be mobilized when the deformation measuring device indicates movement at its end. Note that the displacement versus mobilized length plot (uppermost plot in figure) represents a single confining pressure. Tests must be run at several confining pressures to develop the Pr versus σvLp plot (middle plot in figure). The value of Pr selected at each confining pressure to be plotted versus σvLp is the lessor of either the maximum value of Pr (i.e., maximum sustainable load), the load which causes rupture of the specimen, or the value of Pr obtained at a predefined maximum deflection measured at either the front or the back of the specimen. Note that Pr is measured in terms of load per unit reinforcement width.

FHWA NHI-10-025 Appendix B – Pullout & Connection Strengths MSE Walls and RSS – Vol II B–4 November 2009
Figure B-1 Experimental procedure to determine F* and α for soil reinforcement using pullout test.

FHWA NHI-10-025 Appendix B – Pullout & Connection Strengths MSE Walls and RSS – Vol II B–5 November 2009
It is recommended that for inextensible reinforcements, a maximum deflection of ¾-inch (20 mm) measured at the front of the specimen be used to select Pr if the maximum value for Pr or rupture of the specimen does not occur first. For extensible reinforcements, it is recommended that a maximum deflection of 15 mm (5/8-inch) measured at the back of the specimen be used to select Pr if the maximum value for Pr or rupture of the specimen does not occur first. Note that it is acceptable, as an alternative, to define Pr for inextensible reinforcements based on a maximum deflection of 5/8-inch (15 mm) measured at the back of the specimen as is recommended for extensible reinforcements. F*
peak and F*m are determined from the pullout data as shown in Figure B-1. The method
provided in this figure is known as the corrected area method (Bonczkiewicz et. al., 1988). The determination of α is also illustrated in Figure B-1. Typical values of F* and α for various types of reinforcements are provided by Christopher (1993). Note that the conceptualized curves provided in Figure B-1 represent a relatively extensible material. For inextensible materials, the deflection at the front of the specimen will be nearly equal to the deflection at the back of the specimen, making the curves in the uppermost plot in the figure nearly horizontal. Therefore, whether the deflection criteria to determine Pr for inextensible reinforcements is applied at the front of the specimen or at the back of the specimen makes little difference. For extensible materials, the deflection at the front of the specimen can be considerably greater than the deflection at the back of the specimen. The goal of the deflection criteria is to establish when pullout occurs, not to establish some arbitrary serviceability criteria. For extensible materials, the pullout test does not model well the reinforcement deflections which occur in full scale structures. Therefore, just because relatively large deflections occur at the front of an extensible reinforcement material in a pullout test when applying the deflection criteria to the back of the specimen does not mean that unacceptable deflections will occur in the full scale structure.
B.3 CONNECTION RESISTANCE AND STRENGTH OF PARTIAL AND FULL FRICTION SEGMENTAL BLOCK/REINFORCEMENT FACING CONNECTIONS
For reinforcement connected to the facing through embedment between facing elements using a partial or full friction connection (e.g., segmental concrete block faced walls), the connection strength can be determined directly through long-term testing of the connection to failure. The test set up should be in general accordance with ASTM D6638 with the modifications as described in the interim Long-Term Connection Strength Testing Protocol described below. Extrapolation of test data should be conducted in general accordance with
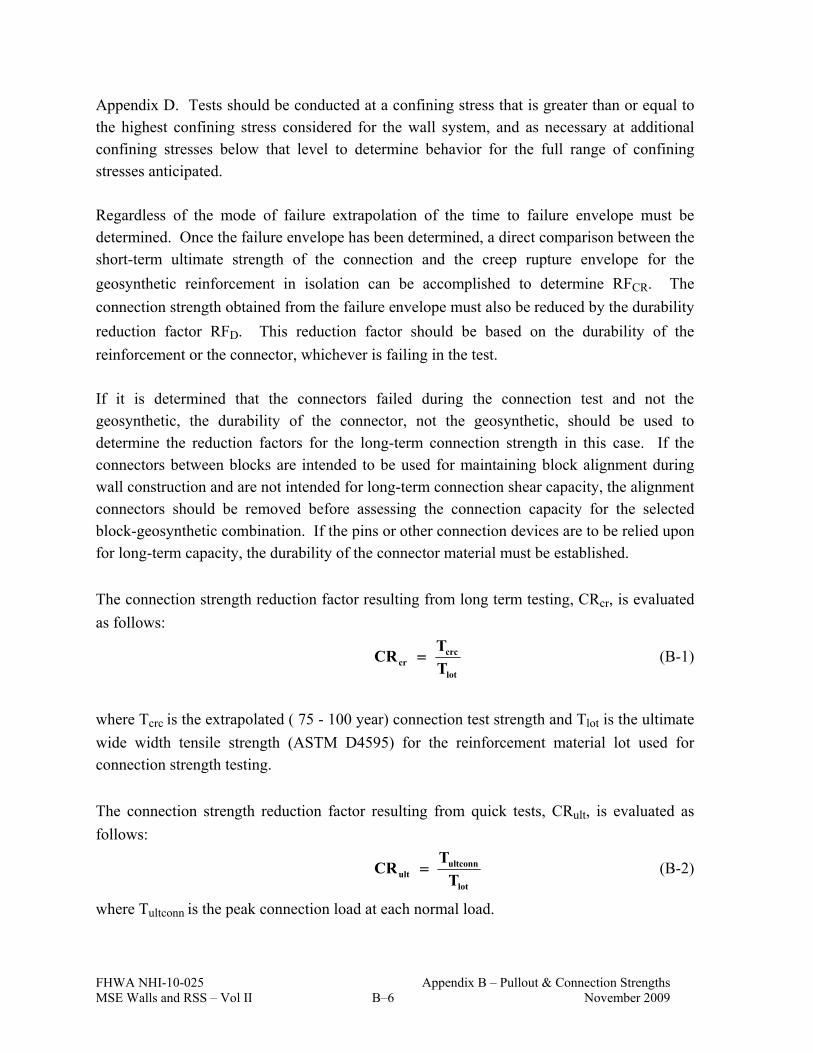
FHWA NHI-10-025 Appendix B – Pullout & Connection Strengths MSE Walls and RSS – Vol II B–6 November 2009
Appendix D. Tests should be conducted at a confining stress that is greater than or equal to the highest confining stress considered for the wall system, and as necessary at additional confining stresses below that level to determine behavior for the full range of confining stresses anticipated. Regardless of the mode of failure extrapolation of the time to failure envelope must be determined. Once the failure envelope has been determined, a direct comparison between the short-term ultimate strength of the connection and the creep rupture envelope for the
geosynthetic reinforcement in isolation can be accomplished to determine RFCR. The
connection strength obtained from the failure envelope must also be reduced by the durability
reduction factor RFD. This reduction factor should be based on the durability of the
reinforcement or the connector, whichever is failing in the test. If it is determined that the connectors failed during the connection test and not the geosynthetic, the durability of the connector, not the geosynthetic, should be used to determine the reduction factors for the long-term connection strength in this case. If the connectors between blocks are intended to be used for maintaining block alignment during wall construction and are not intended for long-term connection shear capacity, the alignment connectors should be removed before assessing the connection capacity for the selected block-geosynthetic combination. If the pins or other connection devices are to be relied upon for long-term capacity, the durability of the connector material must be established.
The connection strength reduction factor resulting from long term testing, CRcr, is evaluated
as follows:
lot
crccr T
TCR (B-1)
where Tcrc is the extrapolated ( 75 - 100 year) connection test strength and Tlot is the ultimate
wide width tensile strength (ASTM D4595) for the reinforcement material lot used for connection strength testing.
The connection strength reduction factor resulting from quick tests, CRult, is evaluated as
follows:
lot
ultconnult T
TCR (B-2)
where Tultconn is the peak connection load at each normal load.

FHWA NHI-10-025 Appendix B – Pullout & Connection Strengths MSE Walls and RSS – Vol II B–7 November 2009
Testing Protocol Objective: Determine the sustained load capacity of the connection between a modular block wall (MBW) facing element and a geosynthetic reinforcing material. Method: Construct a test apparatus of full-scale MBW units and geosynthetic reinforcing material in a laboratory. Perform a series of tests at different normal loads (confining pressures) to model different wall heights, varying the applied load from 95 percent of the peak connection capacity determined from the quick connection test (SRWU-1) to 50 percent of the peak connection capacity. Measure and record the deflections and time to pullout or rupture of the connection.
Procedure:1. Determine index properties of the geosynthetic reinforcing roll being tested:
a. Wide width tensile strength (ASTM D4595)
Note: it is preferable to perform the D4595 test on the roll sample being tested and to perform the test in the same apparatus being used for the long-term connection testing. This will help remove uncertainty in the test results from using different lots of the geosynthetic reinforcement material and from comparing test results from different test equipment. b. Creep rupture envelope for geosynthetic: develop a rupture envelope for the
specific geosynthetic being tested based on creep rupture tests, Appendix D, using the same longitudinal strip of reinforcement.
Figure B-2 Creep Rupture Envelope for Geosynthetic Reinforcement
Cre
ep L
oad
(as
a %
of
the
U
ltim
ate
Str
engt
h)
Elapsed Time (Hours)
Material Creep Rupture Envelope
T ULT
75-year life
1

FHWA NHI-10-025 Appendix B – Pullout & Connection Strengths MSE Walls and RSS – Vol II B–8 November 2009
2. Determine short-term (quick test) connection properties of the MBW unit/geosynthetic reinforcement combination, per ASTM D6638, as modified below. a. Construct a test setup in general accordance with the ASTM D6638 test method with
the following revisions: i. Testing shall be carried out on a single width block specimen. Setup shall
consist of two MBW units at the base with one MBW unit centered over the two base units.
ii. Geosynthetic reinforcement width shall be as close as possible to the length of the MBW unit (for geogrids this is dependent on the transverse aperture). In no case shall the geosynthetic be wider than the length of the MBW unit.
iii. Geosynthetic specimen shall have sufficient length to cover the interface surface as specified by the user. The specimen must be trimmed to provide sufficient anchorage at the geosynthetic loading clamp and a free length between the back of the MBW units and loading clamp ranging from a minimum of 8 in. to a maximum of 24 in. (203 to 610 mm). The same free length used for the short-term test shall be used for the long-term test. The same longitudinal strip of reinforcement shall be used for all short-term and long-term connection tests.
iv. The temperature in the test space, especially close to the gage length of the specimen shall be maintained within ± 2° C (±4° F) of the targeted value.
v. Where granular infill is required in the connection, half units may be used to provide confinement for the granular fill on each side of the single top unit. Granular fill may or may not be used in the short-term and long-term test as desired. Whichever condition (with or without infill) is selected for the short-term tests shall be the same for the long-term tests. Where granular infill is not required as part of the connection, the single unit may be used.
vi. Normal load shall be applied to the top of the MBW unit to provide the desired confining pressure by a mechanism capable of maintaining the desired load for a period of not less than one year. (It has been observed that under
rapid loading some blocks may rotate and short-term instantaneous high normal loads can result if the vertical loading system does not have the mechanical compliance necessary to dilate. Tests shall be run for a period of 1,000 hours, however the apparatus should be capable of sustaining loads for longer periods if determined later during the test.)
vii. Tension loads shall be applied to the reinforcing member in a direction parallel to the connection interface, and in the plane of the connection interface. (The mechanism for applying the tensile loads shall be capable of
sustaining an applied load for periods of not less than one-year.)

FHWA NHI-10-025 Appendix B – Pullout & Connection Strengths MSE Walls and RSS – Vol II B–9 November 2009
b. Perform a series of quick tests in accordance with ASTM D6638, as modified above, on the MBW unit/ geosynthetic reinforcement combination at different normal loads to establish the Tultconn/Normal Load connection curve.
3. Determine the normal and tensile load levels for sustained load testing on the MBW unit/geosynthetic reinforcement combination. a. The highest normal load for the sustained load test may not exceed point A (Figure B-
3) when the Tultconn/Normal load curve is bilinear or multilinear or point B (Figure B-
3) when the slope of the curve is linear. Tultconn is defined as the ultimate connection
strength determined from ASTM D6638. Additional normal loads may be evaluated to determine the long-term connection strength as a function of normal load.
b. From the connection strength verses displacement curve (Figure B-4) for the quick test, using the normal load determined in step A, determine the applied tensions loads for a range of percentages of the Peak Connection Capacity (e.g., 95, 90, 85, 80,75, 66 and 50 percent of Peak Connection capacity). The tensile loads should be selected to define the connection rupture curve for 1000 hours.
4. Perform sustained load testing on the MBW unit/geosynthetic reinforcement combination at the normal and tensile load levels determined from step 3 using the same test apparatus used to determine the short-term connection properties. A different test apparatus may be used to perform the long-term tests as long as a correlation is made between the two test machines. Unless otherwise agreed upon, a minimum of four normal load levels shall be used to develop the connection rupture curve.
a. Assemble the MBW unit/geosynthetic reinforcement test as done in step 3, and apply the normal load desired to the top MBW unit.
b. Apply the full load (e.g., 95, 90, 85, and 80 percent of Tultconn) tensile load rapidly and smoothly to the specimen, preferably at a strain rate of 10 ± 3%/min. Record the total time for loading.
c. Measure the extension/deflection of the connection, at the back of the MBW unit in accordance with the following approximate time schedule: 1, 2, 6, 10, 30 min, and 1, 2, 5, 10, 30, 100, 200, 500 and 1,000 hrs (Note: shorter reading times may be required).
Record the time to failure of the connection. d. Repeat steps A through C for the other normal load levels recording the loads and
time to failure. 5. Presentation of data.
a. Plot the results of the creep rupture test on a log time plot extrapolated to a minimum of 75 years, per Appendix D. The extrapolated load is the (75 - 100
year) connection load, Tcrc
b. On the same graph, plot the time to failure for the results of the sustained load tests on the reinforcement itself from Step 1.

FHWA NHI-10-025 Appendix B – Pullout & Connection Strengths MSE Walls and RSS – Vol II B–10 November 2009
c. From the data plot, extrapolate to 75 years (670,000 hrs), per Appendix D. d. All deviations from the connection test setup from the actual connection used for
construction shall be noted in the test report. Figure B-3 Connection Strength verses Normal Load
P
eak
Co
nn
ecti
on
Lo
ad
Normal Load (kN)
T ultconn
T ultconn
A (example 1 connection – where curve becomes horizontal)
B (example 2 connection – where curve is linear)

FHWA NHI-10-025 Appendix B – Pullout & Connection Strengths MSE Walls and RSS – Vol II B–11 November 2009
Figure B-4 Connection Strength verses Displacement
Displacement (mm)
Co
nn
ecti
on
Lo
ad
Tultconnn
T95 T90 T85 T80

FHWA NHI-10-025 Appendix B – Pullout & Connection Strengths MSE Walls and RSS – Vol II B–12 November 2009
B.4 CONNECTION RESISTANCE DEFINED WITH SHORT-TERM TESTING
B.4.1 Protocol As discussed in Section 4.4.7.i, the long-term connection strength reduction factor to account for reduced ultimate strength resulting from the connection, CRcr, may be obtained from long-term or short-term tests. as described below. Short-term (i.e., quick) ultimate strength tests, per ASTM D6638, are used to define an ultimate connection strength, Tultconn, at a specified confining pressure. Tests should be performed in accordance with ASTM D6638, Determining Connection Strength Between Geosynthetic Reinforcement and Segmental Concrete Units (Modular Concrete Blocks). With short-term testing, CRcr, is defined as follows:
lotcr
ultconncr TRF
TCR (4-43)
RFcr is the geosynthetic creep reduction factor (see Chapter 3), and Tlot is the ultimate wide width tensile strength of the reinforcement material roll/lot used for the connection strength testing. The raw data from short-term connection strength laboratory testing should not be used for design. The wall designer (and/or system supplier) should evaluate the data and define the nominal long-term connection strength, Talc. Steps for this data reduction are summarized and discussed below.
Step 1: Separate laboratory test data by failure mode – pullout and rupture
The laboratory data is separated by observed failure mode – pullout or rupture. Note that observed pullout may be more of a combination of pullout and rupture versus a clearly defined pullout.
Step 2: Replot data and develop equations for ultimate connection strength, Tultconn Data should be plotted and Tultconn defined as a function of normal load or normal pressure. Tultconn is defined in one or two straight-line segments on the plot. Data points for the two different failure modes should be plotted as separate lines.
Step 3: Evaluate data with consideration of other tests

FHWA NHI-10-025 Appendix B – Pullout & Connection Strengths MSE Walls and RSS – Vol II B–13 November 2009
Evaluate data with consideration of data from testing of different grade(s) of reinforcement with same MBW unit. Replot data and develop equations, as appropriate. Trends in data between different tests should be rational.
Step 4: Determine short-term ultimate connection strength reduction factor, CRu CRu is the short-term ultimate connection strength reduction factor defined as follows:
lot
ultconnu T
TCR (B-3)
Step 5: Determine reinforcement creep reduction factor, RFCR
The creep reduction factor for the geosynthetic reinforcement was previously defined (see Chapter 3 and Appendix D).
Step 6: Determine long-term connection strength, CRcr CRcr, the long-term ultimate connection strength reduction factor (based upon short-term testing) is defined as follows:
CR
ucr RF
CRCR (B-4)
Note that the creep reduction factor is applied to short-term ultimate connection strength regardless of observed failure mode (i.e., rupture or pullout).
Step 7: Determine nominal long-term connection strength, Talc Use equation 4-41 to determine Talc.
The nominal long-term connection strength, Talc developed by frictional and/or structural means, determined as follows:
D
crultalc RF
CRTT
(4-41)
where: Talc = nominal long-term reinforcement/facing connection
strength per unit reinforcement width at a specified confining pressure
Tult = ultimate tensile strength of the geosynthetic soil reinforcement, defined as the minimum average roll value (MARV)

FHWA NHI-10-025 Appendix B – Pullout & Connection Strengths MSE Walls and RSS – Vol II B–14 November 2009
RFD = reduction factor to account for chemical and biological degradation
CRcr = long-term connection strength reduction factor to account for reduced ultimate strength resulting from the connection
Step 8: Define limits of applicability of the defined Talc
The nominal long-term connection strength equation defined is applicable to the test conditions utilized. The limits of the testing program normal loading should be stated with Talc. Extrapolation of the connection strength equation should not be extended significantly above or below this normal loading range.
B.4.2 Example Calculation An example problem is presented within to demonstrate the analysis of laboratory connection strength data of modular block wall (MBW) units and geosynthetic reinforcements. Data is analyzed to determine the nominal strength envelope to use in design. This example is for a large MBW unit where one grade of a geogrid was tested, and all failure occurred by rupture of the reinforcement. (Fictional MBW unit and geosynthetic manufacturer names are used within.)
Table B-1. Summary of steps for data reduction of MBW connection strength, with short-term (quick) test data.
Step Item 1 Separate laboratory test data by failure mode – pullout and rupture 2 Replot data and develop equations for ultimate connection strength, Tultconn 3 Evaluate data with consideration of data from testing of different grade(s) of
reinforcement with same MBW unit. Replot data and develop equations, as appropriate.
4 Determine short-term ultimate connection strength reduction factor, CRu 5 Determine reinforcement creep reduction factor, RFCR 6 Determine long-term connection strength, CRcr 7 Determine nominal long-term connection strength, Talc 8 Define limits of applicability (i.e., limits of testing program normal loading)

FHWA NHI-10-025 Appendix B – Pullout & Connection Strengths MSE Walls and RSS – Vol II B–15 November 2009
Laboratory Report The following information was provided in the two laboratory test reports (a report for each grade of geogrid used).
AA MBW Unit and Grade II, Type XX Geogrid”
Apparatus and General Test Procedure:
per ASTM D6638
Large Modular Block Unit: AA
42 in. wide (toe to heel), 18 in. high, 48 in. long
Weight 2,200 lbs per unit
Geogrid: Grade II, Type XX
Tult-MARV = 4,300 lb/ft (reported by manufacturer)
Lot and roll numbers provided
TLOT = 4,730 lb/ft
Connection Test Results: Tensile loads at peak capacity
Tensile loads at ¾-inch displacement
7 normal loads
Two tests at one normal load
Data – see table below
Recommended design curve and equation presented
Connection Test Notes: All tests ended in geogrid rupture after large deformation.
Evidence of slippage of the geogrid within the MBW unit-geogrid interface in all tests.
Amount of slippage diminished with increased normal loading.
The actual design capacity envelope could be lower than presented if the quality of construction in the field is less than that adopted in this controlled laboratory investigation.

FHWA NHI-10-025 Appendix B – Pullout & Connection Strengths MSE Walls and RSS – Vol II B–16 November 2009
Test Number Normal Load
(lb/ft) Approximate
Wall Height (ft)
Tensile Capacity (lb/ft) at ¾-inch Displacement
Peak Tensile Capacity (lb/ft)
1 816 2.4 557 1073 2 1665 4.9 659 1431 3 2498 7.3 620 1259 4 2509 7.3 669 1445 5 2509 7.3 688 1293 6 3353 9.8 641 1390 7 4219 12.4 667 1582 8 5074 14.9 859 1637
Peak connection capacity, Tultconn = 1068 + N tan 6 in (lb/ft of geogrid) and N in lb/ft of wall
length Evaluate Data Step 1. Separate data by failure mode – pullout and rupture. All data for this MBW unit and soil reinforcement is rupture failure. Step 2. Replot raw data and check equation for Tultconn. Equation provided in report checks. Tultconn = 1068 + N tan 6 in (lb/ft) and N in lb/ft Step 3. Evaluate data with consideration of data from different grade of soil
reinforcement. There is no additional test data with similar products to compare this data to.
Step 4. Determine CRu The short-term connection strength reduction factor is:
lot
ultconnu T
TCR
Tlot is the ultimate tensile strength of the material used in the connection testing. The was laboratory test report listed a Tlot = 4,730 lb/ft. Step 5. Determine the creep reduction factor, RFCR
The agency had previously evaluated the long-term (i.e., nominal) strength of the Grade II, Type XX geogrid. The agency evaluation used a creep reduction factor equal to 1.9, which was based upon an evaluation of the data supplied by the manufacturer.

FHWA NHI-10-025 Appendix B – Pullout & Connection Strengths MSE Walls and RSS – Vol II B–17 November 2009
Step 6. Determine CRcr Short-term connection strength testing was used. Therefore, the long-term connection strength reduction factor to account for reduced ultimate strength resulting from the connection, using Equation 4-43, is equal to:
MARVultMARVultlotcr
ultconncr T
N
T
N
TRF
TCR
09.2
6tan1068
10.19.1
6tan1068
Step 7. Determine Talc
The nominal long-term reinforcement/facing connection strength per unit reinforcement width at a specified normal load, N, using Equation 4-41, is equal to:
N
T
NT
RF
CRTT MARVult
MARVult
D
crultalc 044.0444
15.1
09.2
6tan1068
where Talc is in terms of lb/ft width of reinforcement and N is in terms of lb/ft width of wall facing length.
The laboratory test data and the nominal long-term connection strength lines are presented in Figure B-5.
Step 8. Define limits of applicability
The nominal long-term connection strength equation defined is applicable to the test conditions utilized. The limits of the testing program normal loading should be stated with Talc. Extrapolation of the connection strength equation should not be extended significantly above or below this normal loading range. As noted in the laboratory test report (see data table under Laboratory Report) the limits of this test program are approximate wall heights of 2.4 to 14.9 ft.

FHWA NHI-10-025 Appendix B – Pullout & Connection Strengths MSE Walls and RSS – Vol II B–18 November 2009
AA MBW Unit - Type XX, Grade II Geogrid Connection Rupture Strength
y = 0.1132x + 1068.2
y = 0.044x + 444
0
200
400
600
800
1000
1200
1400
1600
1800
0 1000 2000 3000 4000 5000 6000
Normal Pressure (lb/ft)
Ult
imat
e C
onn
ecti
on S
tren
gth
(lb
/ft
Test Data Design Line Linear (Test Data) Linear (Design Line)
Figure B-5. Laboratory test data and the nominal long-term connection strength lines for
AA MBW unit and Type XX, Grade II geogrid. Practical Considerations
The nominal long-term connection strength should be compared that of other soil reinforcements with this MBW unit and to other MBW units with this soil reinforcement, as a check for reasonableness.
The laboratory test reports presented “design connection strength” lines. These were based on ultimate strength reduced by a factor of safety equal to 1.5 and a 3/4 –inch displacement criteria. These “design connection strength” lines are for a design standard that is different from AASHTO, and therefore should not be used fro transportation works. Data should be evaluated in accordance with AASHTO/FHWA criteria, as detailed within this example.

FHWA NHI-10-025 Appendix C – Steel Reinforcements MSE Walls and RSS – Vol II C –1 November 2009
APPENDIX C STEEL SOIL REINFORCEMENTS
Linear Strip Reinforcements
Type Dimensions Fy/Fu Vertical Spacing
Horizontal Spacing
Steel Strips (ribbed)
5/32 in. thick by 2 in. wide (4 mm thick by 50 mm wide)
65/75 ksi (450/520 MPa)
30 in. (750 mm)
Varies, but typically 12 to 30in,
(300 to 750 mm)
Welded Wire
Wire Area
Wire Diameter
Wire Area
Wire Diameter
Wire Designation
in2 in. mm2 mm
W3.5 0.035 0.211 22.6 5.4 Fy/Fu 65/80 ksi (450/550 MPa)
W4 0.040 0.226 25.8 5.7 W4.5* 0.045 0.239 29.0 6.0
Longitudinal Wire Spacing
Typically 6 in. (150 mm)
W5 0.050 0.252 32.3 6.4 W7 0.070 0.298 45.2 7.6
Transverse Wire Spacing
Typically varies 9 to 24 in. (230 to 600 mm)
W9.5 0.095 0.348 61.3 8.8 W11 0.110 0.374 71.0 9.5 W12 0.120 0.391 77.4 9.9 W14 0.140 0.422 90.3 10.7 W16 0.160 0.451 103 11.5 W20 0.200 0.505 129 12.8
Mat Spacing: For welded wire faced walls, vertically 12, 18 or 24 in. (300, 450, or 600 mm) and continuous horizontally. For precast concrete faced walls, vertically 24 to 30 in. (600 to 750 mm), horizontally 3.6 to 4 ft. (1.1 to 1.2 m) wide mats spaced at 6.2 ft (1.9 m) center-to-center or continuous
*Typical min. size for permanent walls
Bar Mats
Wire Area
Wire Diameter
Wire Area
Wire Diameter
Wire Designation
in2 in. mm2 mm
Fy/Fu 65/75 ksi (450/520 MPa)
W8 0.080 0.319 51.6 8.1 Longitudinal Wire Spacing
Typically 6 in. (150 mm) with 4 to 7 longitudinal bars per mat
W11 0.110 0.374 71.0 9.5 Transverse Wire Spacing
Typically varies 6 to 24 in. (150 to 600 mm)
W15 0.150 0.437 96.8 11.1
W20 0.200 0.505 129 12.8
Mat Spacing:
Mat Spacing:
Typically 30 in. (750 mm) vertically and 5 ft (1.5 m) center-to-center horizontally
Specific wall manufacturers may be able to provide a much wider range of reinforcement configurations depending on the design needs.

FHWA NHI-10-025 Appendix C – Steel Reinforcements MSE Walls and RSS – Vol II C –2 November 2009

FHWA NHI-10-025 Appendix D – Geosynthetic Creep Factor MSE Walls and RSS – Vol II D –1 November 2009
APPENDIX D DETERMINATION OF CREEP STRENGTH REDUCTION FACTOR, RFCR AND
DETERMINATION LONG-TERM ALLOWABLE STRENGTH, Tal (after WSDOT Standard Practice T 925, Standard Practice for Determination
of Long-Term Strength for Geosynthetic Reinforcement)
D.1 BACKGROUND The effect of long-term load/stress on geosynthetic reinforcement strength and deformation characteristics should be determined from the results of product specific, controlled, long-term laboratory creep tests conducted for a range of load levels and durations in accordance with ASTM D5262 adequate for extrapolation purposed to the desired design life, carried out to rupture when possible. Creep testing in accordance with ASTM D5262, but carried out to rupture where feasible, is described herein as the “conventional method.” A limited number of conventional creep tests may be supplemented and extended to longer creep rupture times using ASTM D6992 (Stepped Isothermal Method, or SIM) as described in this appendix. Specimens should be tested in the direction in which the load will be applied in use. Test results should be extrapolated to the required structure design life. Based on the extrapolated test results, the following is to be determined: • For ultimate limit state design, the highest load level, designated T1, which precludes
both ductile and brittle creep rupture within the required lifetime. • For the limit state design, creep test results should be extrapolated to the required
design life and design site temperature in general accordance with the procedures outlined in this Appendix.
C In both cases, unless otherwise specified or mutually agreed upon by the geosynthetic
supplier, the testing laboratory, and the owner, a baseline testing temperature of 68o F (20o C) shall be used for this testing. Higher test temperatures shall be considered as elevated temperatures to be used for the purpose of time extrapolation. ASTM D5262 requires that the testing temperature be maintained at +3.6o F (2o C). For some polymers, this degree of variance could significantly affect the accuracy of the shift factors and extrapolations determined in accordance with this appendix. For polymers that are relatively sensitive to temperature variations, this issue should be considered when extrapolating creep data using time-temperature superposition techniques, or minimized by using a tighter temperature tolerance.

FHWA NHI-10-025 Appendix D – Geosynthetic Creep Factor MSE Walls and RSS – Vol II D –2 November 2009
• The creep reduction factor, RFCR, is determined by comparing the long-term creep strength, T1, to the ultimate tensile strength (ASTM D4595 for geotextiles, ASTM D6637 for geogrids) of the sample tested for creep. The sample tested for ultimate strength should be taken from the same lot, and preferably the same roll, of material that is used for the creep testing. For ultimate limit state design, the strength reduction factor to prevent long-term creep rupture is determined as follows:
l
ultlotCR T
TRF (D-1)
where, Tultlot is the average lot specific ultimate tensile strength (ASTM D4595) for the lot of material used for the creep testing.
At present, creep tests are conducted in-isolation (ASTM D5262) rather than confined in-soil (e.g., FHWA RD-97-143, Elias et al., 1998), even though in-isolation creep tests tend to overpredict creep strains and underpredict the true creep strength when used in a structure. Note that the procedures provided in this appendix are for in-isolation creep rupture testing. Considering that typical design lives for permanent MSE structures are 75 years or more, extrapolation of creep data is required. No standardized method of geosynthetic creep data modeling and extrapolation exists at present, though a number of extrapolation and creep modeling methods have been reported in the literature (Findley et al., 1976; Wilding and Ward, 1978; Wilding and Ward, 1981, Takaku, 1981; McGown et al., 1984; Andrawes et al., 1986; Murray and McGown, 1988; Bush, 1990; Popelar et al., 1991; Helwany and Wu, 1992). Many of the methods discussed in the literature are quite involved and mathematically complex. Therefore, rather than attempting to develop mathematical models which also have physical significance to characterize and extrapolate creep, as is often the case in the literature (for example, using Rate Process Theory to develop rheological models of the material), a simplified visual/graphical approach will be taken. This does not mean that the more complex mathematical modeling techniques cannot be used to extrapolate creep of geosynthetics; they are simply not outlined in this appendix. The determination of T1 can be accomplished through the use of stress rupture data. Rupture data is necessary to determine the creep reduction factor for ultimate limit state conditions.. Stress rupture test results, if properly accelerated and extrapolated can be used to investigate the effects of stress cracking and the potential for a ductile to brittle transition to occur. Since the primary focus of creep evaluation in current practice is at rupture, only extrapolation of stress rupture data will be explained in this appendix. Creep strain data can

FHWA NHI-10-025 Appendix D – Geosynthetic Creep Factor MSE Walls and RSS – Vol II D –3 November 2009
be used to estimate T1, provided that the creep strain data is not extrapolated beyond the estimated long-term rupture strain. The use of rupture data, and not strain data, is recommended. Therefore, no guidance is provided regarding extrapolation of creep strain data to determine T1. Single ribs for geogrids, or yarns or narrow width specimens for woven geotextiles may be used for creep testing for ultimate limit state design provided that it can be shown through a limited creep testing program (conducted as described in Section D.5) that the rupture behavior and envelope for the single ribs, yarns, or narrow width specimens are the same as that for the full product, with product width as defined in ASTM D5262. This comparison must demonstrate that there is no statistical difference between the full width product creep rupture regression line and the single rib, yarn, or narrow width specimen regression line at a time of 1,000 hours using a student-t distribution at a confidence level of 0.10 (see Equation D.3-1). Considering that typical design lives for permanent MSE structures are 75 years or more, extrapolation of creep data will be required. Current practice allows creep data to be extrapolated up to one log cycle of time beyond the available data without some form of accelerated creep testing, or possibly other corroborating evidence (Jewell and Greenwood, 1988; GRI, 1990). Based on this, unless one is prepared to obtain 7 to 10 years of creep data, temperature accelerated creep data, or possibly other corroborating evidence, must be obtained. It is well known that temperature accelerates many chemical and physical processes in a predictable manner. In the case of creep, this means that the creep strains under a given applied load at a relatively high temperature and relatively short times will be approximately the same as the creep strains observed under the same applied load at a relatively low temperature and relatively long times. Temperature affects time to rupture at a given load in a similar manner. This means that the time to a given creep strain or to rupture measured at an elevated temperature can be made equivalent to the time expected to reach a given creep strain or to rupture at in-situ temperature through the use of a time shift factor. The ability to accelerate creep with temperature for polyolefins such as polypropylene (PP) or high density polyethylene (HDPE) has been relatively well defined (Takaku, 1981; Bush, 1990; Popelar et al., 1991). Also for polyolefins, there is some risk that a "knee" in the stress rupture envelope due to a ductile to brittle transition could occur at some time beyond the available data (Popelar et al., 1991). Therefore, temperature accelerated creep data is strongly recommended for polyolefins. However, in practice, a ductile to brittle transition for polyolefin geosynthetic reinforcement products has so far not been observed, likely due to

FHWA NHI-10-025 Appendix D – Geosynthetic Creep Factor MSE Walls and RSS – Vol II D –4 November 2009
the highly oriented nature of polymer resulting from the processing necessary to make fibers and ribs. In general, the degree of orientation of the polymer is an important factor regarding the potential for ductile to brittle transitions. For polyester (PET) geosynthetics, available evidence indicates that temperature can also be used to accelerate PET creep, based on data provided by den Hoedt et al., (1994) and others. However, the creep rupture envelopes for PET geosynthetics tend to be flatter than polyolefin creep rupture envelopes, and accurate determination of time-shift factors can be difficult for PET geosynthetics because of this. This may require greater accuracy in the PET stress rupture data than would be required for polyolefin geosynthetics to perform accurate extrapolations using elevated temperature data. This should be considered if using elevated temperature data to extrapolate PET stress rupture data. Note that a "knee" in the stress rupture envelope of PET does not appear to be likely based on the available data and the molecular structure of polyester. If elevated temperature is used to obtain accelerated creep data, it is recommended that minimum increments of 10o C be used to select temperatures for elevated temperature creep testing. The highest temperature tested, however, should be below any transitions for the polymer in question. If one uses test temperatures below 70 to75o C for polypropylene (PP), high density polyethylene (HDPE), and PET geosynthetics, significant polymer transitions will be avoided. If higher temperatures must be used, the effect of any transitions on the creep behavior should be carefully evaluated. One should also keep in mind that at these high temperatures, significant chemical interactions with the surrounding environment are possible, necessitating that somewhat lower temperatures or appropriate environmental controls be used. These chemical interactions are likely to cause the creep test results to be conservative. Therefore, from the user's point of view, potential for chemical interactions is not detrimental to the validity of the data for predicting creep limits. However, exposure to temperatures near the upper end of these ranges could affect the stress-strain behavior of the material due to loss of molecular orientation, or possibly other effects that are not the result of chemical degradation. Therefore, care needs to be exercised when interpreting results from tests performed at temperatures near the maximum test temperature indicated above. In general, if the stiffness of the material after exposure to the environment is significantly different from that of the virgin material, the stress-strain properties, and possibly the strength, of the material may have been affected by the exposure temperature in addition to the chemical environment. If the stiffness has been affected, the cause of the stiffness change should be thoroughly investigated to determine whether or not the change in stiffness is partially or fully due to the effect of temperature, or alternatively not use the data obtained at and above the temperature where the stiffness was affected.

FHWA NHI-10-025 Appendix D – Geosynthetic Creep Factor MSE Walls and RSS – Vol II D –5 November 2009
Unless otherwise specified or required by site-specific temperature data, an effective design temperature of 20o C (Tamb) should be assumed. A number of extrapolation and creep modeling methods have been reported in the literature (Findley et al., 1976; Wilding and Ward, 1978; Wilding and Ward, 1981; Takaku, 1981; McGown et al., 1984; Andrawes et al., 1986; Murray and McGown, 1988; Bush, 1990; Popelar et al., 1991; Helwany and Wu, 1992). Many of the methods discussed in the literature are quite involved and mathematically complex. Two creep extrapolation techniques are provided herein for creep rupture evaluation: the conventional method, which utilizes a simplified visual/graphical approach, temperature acceleration of creep, regression techniques, and statistical extrapolation, and the Stepped Isothermal Method (SIM). This does not mean that the more complex mathematical modeling techniques cannot be used to extrapolate creep of geosynthetics; they are simply not explained herein. These two techniques are described in more detail as follows:
D.2 STEP-BY-STEP PROCEDURES FOR EXTRAPOLATING STRESS RUPTURE DATA – CONVENTIONAL METHOD
Step 1: Plot the creep rupture data as log time to rupture versus log load level or versus load level, as shown in Figure D.2-1. Do this for each temperature in which creep rupture data is available. The plotting method that provides the best and most consistent fit of the data should be used. In general, 12 to 18 data points (i.e., combined from all temperature levels tested to produce the envelope for a given product, with a minimum of 4 data points at each temperature) are required to establish a rupture envelope (Jewell and Greenwood, 1988; ASTM D5262. 2007). The data points should be evenly distributed through each log cycle of time. Rupture points with a time to rupture of less than 5 hours should in general not be used, unless it can be shown that these shorter duration points are consistent with the rest of the envelope (i.e., they do not contribute to non-linearity of the envelope). As a guide: C three of the test results should have rupture times (not shifted by temperature
acceleration) of 10 to 100 hours, C four of the test results should have rupture times between 100 and 1,000 hours, and C four of the test results should have rupture times of 1,000 to 10,000 hours, with at least
one additional test result having a rupture time of approximately 10,000 hours (1.14 years) or more.
It is recommended that creep strain be measured as well as time to rupture, since the creep strain data may assist with conventional time-temperature shifting and in identifying any change in behavior that could invalidate extrapolation of the results.
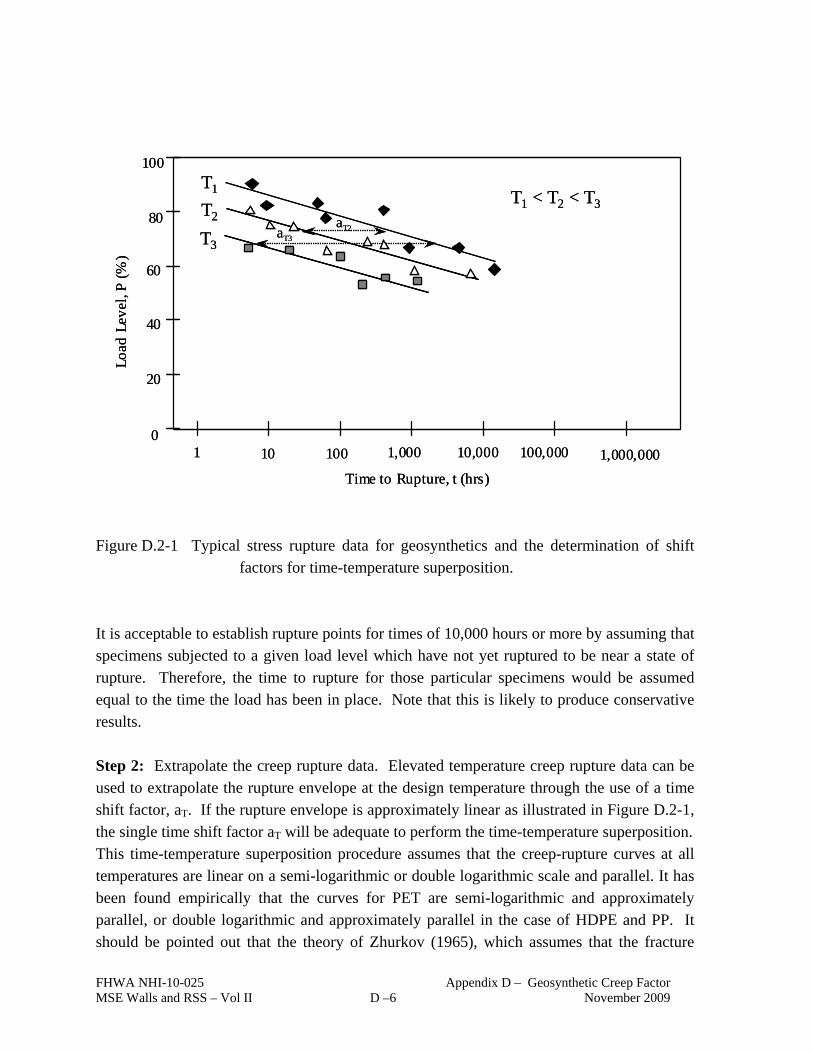
FHWA NHI-10-025 Appendix D – Geosynthetic Creep Factor MSE Walls and RSS – Vol II D –6 November 2009
Figure D.2-1 Typical stress rupture data for geosynthetics and the determination of shift
factors for time-temperature superposition. It is acceptable to establish rupture points for times of 10,000 hours or more by assuming that specimens subjected to a given load level which have not yet ruptured to be near a state of rupture. Therefore, the time to rupture for those particular specimens would be assumed equal to the time the load has been in place. Note that this is likely to produce conservative results. Step 2: Extrapolate the creep rupture data. Elevated temperature creep rupture data can be used to extrapolate the rupture envelope at the design temperature through the use of a time shift factor, aT. If the rupture envelope is approximately linear as illustrated in Figure D.2-1, the single time shift factor aT will be adequate to perform the time-temperature superposition. This time-temperature superposition procedure assumes that the creep-rupture curves at all temperatures are linear on a semi-logarithmic or double logarithmic scale and parallel. It has been found empirically that the curves for PET are semi-logarithmic and approximately parallel, or double logarithmic and approximately parallel in the case of HDPE and PP. It should be pointed out that the theory of Zhurkov (1965), which assumes that the fracture
1 10 100 1,000 10,000 100,000 1,000,0000
20
40
60
80
100
Load
Lev
el, P
(%)
Time to Rupture, t (hrs)
T1
T3
T2T1 < T2 < T3
aT2aT3
1 10 100 1,000 10,000 100,000 1,000,0000
20
40
60
80
100
Load
Lev
el, P
(%)
Time to Rupture, t (hrs)
T1
T3
T2T1 < T2 < T3
aT2aT3

FHWA NHI-10-025 Appendix D – Geosynthetic Creep Factor MSE Walls and RSS – Vol II D –7 November 2009
process is activated thermally with the additional effect of applied stress, predicts that the creep-rupture characteristics should be straight when plotted on a double logarithmic diagram, and that their gradients should be stress-dependent. Use of a single time shift factor to shift all the creep rupture data at a given temperature, termed “block shifting,” assumes that the shift factor aT is not highly stress level dependent and that the envelopes at all temperatures are parallel, allowing an average value of aT to be used for all of the rupture points at a given temperature. While research reported in the literature indicates that aT may be somewhat stress level dependent and that the curves at all temperatures are not completely parallel, this assumption tends to result in a more conservative assessment of the creep reduction factor RFCR (Thornton and Baker, 2002). The time to rupture for the elevated temperature rupture data is shifted in accordance with the following equation:
)(a)(tt Televamb (D.2-1)
where, tamb is the predicted time at in-situ temperature to reach rupture under the specified load, telev is the measured time at elevated temperature to reach a rupture under the specified load, and aT is the time shift factor. aT can be approximately estimated using a visual/graphical approach as illustrated in Figures D.2-1 and D.2-2. The preferred approach, however, is to use a computer spreadsheet optimization program to select the best shift factors for each constant temperature block of data to produce the highest R2 value for the combined creep rupture envelope to produce the result in Figure D.2-2. Note that incomplete tests may be included, with the test duration replacing the time to rupture, but should be listed as such in the reported results, provided that the test duration, after time shifting, is 10,000 hours or more. The rule for incomplete tests is as follows. The regression should be performed with and without the incomplete tests included. If the incomplete test results in an increase in the creep limit, keep the incomplete tests in the regression, but if not, do not include them in the regression, in both cases for incomplete tests that are 10,000 hours in duration after time shifting or more. Record the duration of the longest test which has ended in rupture, or the duration of the longest incomplete test whose duration exceeds its predicted time to failure: this duration is denoted as tmax.

FHWA NHI-10-025 Appendix D – Geosynthetic Creep Factor MSE Walls and RSS – Vol II D –8 November 2009
Figure D.2-2. Extrapolation of Stress Rupture Data and the Determination of the Creep Limit Load. It is preferred that creep rupture data be extrapolated statistically beyond the elevated temperature time shifted data using regression analysis (i.e., curve fitting) up to a maximum of one log cycle of time for all geosynthetic polymers (greater extrapolation using only statistical methods is feasible, but uncertainty in the result increases substantially and must be taken into account). Therefore, adequate elevated temperature data should be obtained to limit the amount of statistical extrapolation required. Also note that there may be situations where extrapolation to create a creep rupture envelope at a lower temperature than was tested is necessary. Situations where this may occur include the need to elevate the ambient temperature to have greater control regarding the temperature variations during the creep testing (i.e., ambient laboratory temperature may vary too much), or for sites where the effective design temperature is significantly lower than the “standard” reference temperature used for creep testing (e.g., northern or high elevation climates). In such cases, it is feasible to use lower bound shift factors based on previous creep testing experience to allow the creep rupture envelope to be shifted to the lower temperature, as shift factors for the materials typically used for geosynthetic reinforcement are reasonably consistent. Based on previous creep testing experience and data reported in the literature
1 10 100 1,000 10,000 100,000 1,000,0000
20
40
60
80
100
Load
Lev
el, P
(%)
Time to Rupture, t (hrs)
T1
T3
T2T1 < T2 < T3
aT2aT3
td
Pd
tmax
1 10 100 1,000 10,000 100,000 1,000,0000
20
40
60
80
100
Load
Lev
el, P
(%)
Time to Rupture, t (hrs)
T1
T3
T2T1 < T2 < T3
aT2aT3
td
Pd
tmax

FHWA NHI-10-025 Appendix D – Geosynthetic Creep Factor MSE Walls and RSS – Vol II D –9 November 2009
(Chow and Van Laeken, 1991; Thornton et al., 1998a; Thornton, et al., 1998b; Lothspeich and Thornton, 2000; Takemura 1959; Bush, 1990; Popelar et al., 1990; Wrigley et al., 2000; Takaku 1981; Thornton and Baker, 2002), shift factors for HDPE and PP geosynthetics are typically in the range of 0.05 to 0.18 decades (i.e., log cycles of time) per 1o C increase in temperature (i.e., a 10o C increase would result in a time shift factor of 12 to 15) and 0.05 to 0.12 decades per 1o C increase in temperature for PET geosynthetics. It is recommended that if shifting the creep rupture envelope to temperatures below the available data is necessary, that a shift factor of 0.05 decades per 1o C increase in temperature for PP, HDPE, and PET be used. This default shift factor should not be used to shift the creep rupture data more than 10o C. Step 3: Once the creep data has been extrapolated, determine the design, lot specific, creep limit load by taking the load level at the desired design life directly from the extrapolated stress rupture envelope as shown in Figure D.2-2. If statistical extrapolation beyond the time shifted stress rupture envelopes (PP or HDPE), or beyond the actual data if temperature accelerated creep data is not available, is necessary to reach the specified design life, the calculated creep load T1 should be reduced by an extrapolation uncertainty factor as follows:
1x
cll
1.2
PT (D.2-2)
where Pcl is the creep limit load taken directly from the extrapolated stress rupture envelope, and "x" is the number of log cycles of time the rupture envelope must be extrapolated beyond the actual or time shifted data, and is equal to log td – log tmax as illustrated in Figure D.2-2. The factor (1.2)x-1 is the extrapolation uncertainty factor. If extrapolating beyond the actual or time shifted data less than one log cycle, set “x-1” equal to “0”. This extrapolation uncertainty factor only applies to statistical extrapolation beyond the actual or time shifted data using regression analysis and assumes that a “knee” in the rupture envelope beyond the actual or time shifted data does not occur. Note that a condition on the extrapolation is that there is no evidence or reason to believe that the rupture behavior will change over the desired design life. It should be checked that at long durations, and at elevated temperatures if used:
There is no apparent change in the gradient of the creep-rupture curve
There is no evidence of disproportionately lower strains to failure
There is no significant change in the appearance of the fracture surface. Any evidence of such changes, particularly in accelerated tests, should lead to the exclusion of any reading where either the gradient, strain at failure or appearance of the failure is different to those in the test with the longest failure duration. Particular attention is drawn to
FHWA NHI-10-025 Appendix D – Geosynthetic Creep Factor MSE Walls and RSS – Vol II D –10 November 2009
the behavior of unoriented thermoplastics under sustained load, where a transition in behavior is observed in long-term creep-rupture testing (i.e., the so called “ductile to brittle transition – Popelar et al., 1991). The effect of this transition is that the gradient of the creep-rupture curve becomes steeper at the so-called “knee” such that long-term failures occur at much shorter lifetimes than would otherwise be predicted. The strain at failure is greatly reduced and the appearance of the fracture surface changes from ductile to semi-brittle. If this is observed, any extrapolation should assume that the “knee” will occur. For the method of extrapolation reference should be made to ISO/FDIS 9080 (2001), ASTM D5262 (2007), and Popelar et al., (1991). This extrapolation uncertainty factor also assumes that the data quality is good, data scatter is reasonable, and that approximately 12 to 18 data points which are well distributed (see Step 1 for a definition of well distributed) defines the stress rupture envelope for the product. If these assumptions are not true for the data in question, this uncertainty factor should be increased. The uncertainty factor may also need to be adjusted if a method other than the one presented in detail herein is used for extrapolation. This will depend on how well that method compares to the method provided in this appendix. This extrapolation uncertainty factor should be increased to as much as (1.4)x if there is the potential for a "knee" in the stress rupture envelope to occur beyond the actual or time shift data, or if the data quality, scatter, or amount is inadequate. Furthermore, if the data quantity or over the time scale is inadequate, it may be necessary to begin applying the extrapolation uncertainty factor before the end of the time shifted data. Note that based on experience, the R2 value for the composite (i.e., time shifted) creep rupture envelope should be approximately 0.8 to 0.9 or higher to be confident that Equation B.2-3 will adequately address the extrapolation uncertainty. If the R2 value is less than approximately 0.6 to 0.7, extrapolation uncertainty is likely to be unacceptably high, and additional testing and investigation should be performed. In general, such low R2 values are typically the result of data that is too bunched up, unusually high specimen-to-specimen variability, or possibly poor testing technique.
D.3 PROCEDURES FOR EXTRAPOLATING CREEP RUPTURE DATA – STEPPED ISOTHERMAL METHOD (SIM)
An alternative creep strain/rupture analysis and extrapolation approach that has recently become available for geosynthetics is the Stepped Isothermal Method (SIM) proposed, illustrated, and investigated by Thornton et al. (1997), Thornton et al. (1998a), Thornton et al. (1998b), and Thornton and Baker (2000). SIM has been applied successfully to PET

FHWA NHI-10-025 Appendix D – Geosynthetic Creep Factor MSE Walls and RSS – Vol II D –11 November 2009
geogrids and PP geotextiles. SIM utilizes an approach similar to the Williams-Landell-Ferry, or WLF, approach to creep extrapolation (Ferry, 1980), where master creep curves for a given material are produced from a series of short-term tests (i.e., creep test durations on the order of a few hours) on the same specimen over a wide range of temperatures (i.e., while the load on the specimen is held constant, the temperature is increased in steps). The sections of creep curve at the individual temperatures are shifted in time and combined to form a continuous prediction of the creep strain at the starting temperature. Though the general principles of this method have been in use for many years in the polymer industry (Ferry, 1980), it has been only recently that this approach has been used for geosynthetics. Though this approach was initially developed to extrapolate creep strain data, it has been adapted to produce stress rupture data by taking the specimen to rupture once the highest test temperature is reached. In effect, through time shifting of the creep strain data obtained prior to rupture, the rupture point obtained has an equivalent shifted time that is several orders of magnitude greater than the actual test time, which could be on the order of only a few days. The method is conducted in accordance with ASTM D6992. Key issues are the very short test time used for this method, potential use of temperatures that are well above transitions in the geosynthetic material, and its complexity. Key technical advantages of the method, however, include more accurate determination of time shift factors, since the same specimen is used at the same load level at all of the temperatures (the “conventional” method must deal with the effect of specimen to specimen variability when determining the shift factors), and that time shift factors between temperatures are determined at the same load level, eliminating the effect of load level in the determination of the shift factors (in the “conventional” method, the shift factors used are in fact an average value for a wide range of loads). SIM can be considered for use in generating and extrapolating geosynthetic creep and creep rupture data provided this method is shown to produce results which are consistent with the “conventional” extrapolation techniques recommended in this appendix. To this end, creep-rupture testing shall be conducted using conventional tests (ASTM D5262) and SIM tests (ASTM D6992). At least six SIM rupture tests and six conventional rupture tests and shall be conducted on one of the products in the product line being evaluated. Of the six SIM rupture tests, four shall have rupture times (shifted as appropriate) between 100 and 2000 hours and two shall have rupture times greater than 2000 hours. All of the conventional creep rupture points shall be obtained at the reference temperature (i.e., not temperature shifted). Creep rupture plots shall be constructed, regression lines computed and the log times to rupture determined at a load level that corresponds to 1,000 hours and 50,000 hours

FHWA NHI-10-025 Appendix D – Geosynthetic Creep Factor MSE Walls and RSS – Vol II D –12 November 2009
on the conventional creep rupture envelope, for the two data sets. The log time to rupture for the SIM regression at this load level shall be within the upper and lower 90% confidence limits of the mean conventional regressed rupture time at the same load level using Student’s
t test. The following minimum creep rupture data points are recommended where conventional and
SIM data points are used in combination:
C 4 conventional rupture and 4 SIM rupture data points between 100 and 2,000 hours
(after shifting)
C 2 conventional and 2 SIM rupture data points between 2,000 and ~10,000 hours
(after shifting), with
o 1 conventional rupture data point at ~10,000 hours or greater with 1 SIM
rupture data point at ~10,000 hours or greater (after shifting); OR
o 2 conventional rupture data points at ~10,000 hours or greater without SIM
data point at ~10,000 hours or greater (after shifting)
The confidence limit for the regression performed for the conventional creep rupture data is given by (Wadsworth, 1998):
2
2
2,
1loglog
PP
PP
nttt
i
nregL (D.3-1)
and
2
loglogloglog
2
2
2
n
PP
ttPPtt
i
iii
(D.3-2)
where: log tL = lower and upper bound confidence limit. The + or – term in Equation B.2-1
results in the lower and upper bound confidence limits, respectively. treg = time corresponding to the load level from the conventional creep rupture
envelope at which the comparison between the two envelopes will be made (e.g., at 1,000 and 50,000 hrs after time shifting)
t,n-2 = value of the t distribution determined from applicable Student t table (or
from the Microsoft EXCEL function TINV(,n-2)) at = 0.10 and n-2
degrees of freedom (this corresponds to the 90% two-sided prediction limit). n = the number of rupture or allowable run-out points in the original test sample
(i.e., the conventional creep rupture data)

FHWA NHI-10-025 Appendix D – Geosynthetic Creep Factor MSE Walls and RSS – Vol II D –13 November 2009
P = load level obtained at treg from the regression line developed from the conventional creep rupture testing
P = the mean rupture load level for the original test sample (i.e., all rupture or run-
out points used in the regression to establish the conventional creep rupture envelope)
Pi = the rupture load level of the i’th point for the rupture points used in the regression for establishing the conventional creep rupture envelope
log t = the mean of the log of rupture time for the original test sample (i.e., all rupture
or run-out points used in the regression to establish the conventional creep rupture envelope)
ti = the rupture time of the i’th point for the rupture points used in the regression for establishing the conventional creep rupture envelope
Once log tL, both upper and lower bound, has been determined at the specified load level, compare these values to the log rupture time (i.e., log tSIM) obtained for the SIM creep rupture envelope test at the specified load level (e.g., 1,000 and 50,000 hours). The value of log tSIM at the two specified load levels must be between the upper and lower bound confidence limits (log tL). If this requirement is not met, perform two additional SIM tests at each load level P for the specified treg where this comparison was made and develop a new SIM creep rupture envelope using all of the SIM data. If for the revised SIM regression envelope resulting from these additional tests this criterion is still not met, perform adequate additional conventional creep rupture testing to establish the complete rupture envelope for the product in accordance with this appendix). If the criterion provided above is met, the SIM testing shall be considered to be consistent with the conventional data, and SIM may be used in combination with the conventional data to meet the requirements of Section D.2 regarding the number of rupture points and their distribution in time and maximum duration. Therefore, the combined data can be used to create the creep rupture envelope as shown in Figure D.2-2. In that figure, the SIM data shall be considered to already be time shifted. Equation D.2-3 is then used to determine Tl.
D.4 DETERMINATION OF RFCR Step 4: The creep reduction factor, RFCR, is determined by comparing the long-term creep strength, T1, to the ultimate tensile strength (ASTM D4595 or ASTM D6637) of the sample tested for creep (Tlot). The sample tested for ultimate tensile strength should be taken from the same lot, and preferably the same roll, of material that is used for the creep testing. For
FHWA NHI-10-025 Appendix D – Geosynthetic Creep Factor MSE Walls and RSS – Vol II D –14 November 2009
ultimate limit state design, the strength reduction factor to prevent long-term creep rupture is determined as follows:
l
ultlotCR T
TRF (D.4-1)
where, Tultlot is the average lot specific ultimate tensile strength (ASTM D4595 or ASTM D6637) for the lot of material used for the creep testing. Note that this creep reduction factor takes extrapolation uncertainty into account, but does not take into account variability in the strength of the material. Material strength variability is taken into account when RFCR, along with RFID and RFD, are applied to Tult to determine the long-term allowable tensile strength, as Tult is a minimum average roll value. The minimum average roll value is essentially the value that is two standard deviations below the average value.
D.5 USE OF CREEP DATA FROM "SIMILAR" PRODUCTS and EVALUATION OF PRODUCT LINES
Long-term creep data obtained from tests performed on older product lines, or other products within the same product line, may be applied to new product lines, or a similar product within the same product line, if one or both of the following conditions are met: C The chemical and physical characteristics of tested products and proposed products are
shown to be similar. Research data, though not necessarily developed by the product manufacturer, should be provided which shows that the minor differences between the tested and the untested products will result in equal or greater creep resistance for the untested products.
C A limited testing program is conducted on the new or similar product in question and
compared with the results of the previously conducted full testing program. For polyolefins, similarity could be judged based on molecular weight and structure of the main polymer (i.e., is the polymer branched or crosslinked, is it a homopolymer or a blend, percent crystallinity, etc.?), percentage of material reprocessed, tenacity of the fibers and processing history, and polymer additives used (i.e., type and quantity of antioxidants or other additives used). For polyesters and polyamides, similarity could be judged based on molecular weight or intrinsic viscosity of the main polymer, carboxyl end group content, percent crystallinity, or other molecular structure variables, tenacity of the fibers and processing history, percentage of material reprocessed or recycled, and polymer additives

FHWA NHI-10-025 Appendix D – Geosynthetic Creep Factor MSE Walls and RSS – Vol II D –15 November 2009
used (e.g., pigments, etc.). The untested products should also have a similar macrostructure (i.e., woven, nonwoven, extruded grid, needlepunched, yarn structure, etc.) and fiber dimensions (e.g., thickness) relative to the tested products. It should be noted that percent crystallinity is not a controlled property and there is presently no indication of what an acceptable value for percent crystallinity should be. For creep evaluation of a similar product not part of the original product line, this limited testing program should include creep tests taken to at least 1,000 to 2,000 hours in length before time shifting if using the “conventional” creep testing approach, with adequate elevated temperature data to permit extrapolation to 50,000 hours or more. If it has been verified that SIM can be used, in accordance with Section D.3, durations after time shifting due to elevated temperature up to a minimum of 50,000 hours are required. A minimum of 4 data points per temperature level tested should be obtained to determine time shift factors and to establish the envelope for the similar product. These limited creep test results must show that the performance of the similar product is equal to or better than the performance of the product previously tested. This comparison must demonstrate that there is no statistical difference between the old product regression line and the regression line obtained for the similar product at a time of 2,000 hours (not temperature accelerated) and 50,000 hours (after time shifting) using a student-t distribution at a confidence level of 0.10 (see Equation D.3-1). If no statistical difference is observed, the results from the full testing program on the older or similar product could be used for the new/similar product. If this is not the case, then a full testing and evaluation program for the similar product should be conducted. Similarly, for extension of the creep data obtained on one product in the product line (i.e., the primary product tested, which is typically a product in the middle of the range of products in the product line) to the entire product line as defined herein, a limited creep testing program must be conducted on at least two additional products in the product line. The combination of the three or more products must span the full range of the product line in terms of weight and/or strength. The limited test program described in the preceding paragraph should be applied to each additional product in the product line. The loads obtained for the data in each envelope should then be normalized by the lot specific ultimate tensile strength, Tlot. All three envelopes should plot on top of one another, once normalized in this manner, and the two additional product envelopes should be located within the confidence limits for the product with the more fully developed creep rupture envelope (i.e., the “primary” product) as described above for “similar” products. If this is the case, then the creep reduction factor for the product line shall be the lesser of the reduction factor obtained for the product with the fully developed rupture envelope and the envelope of all three products combined, and normalization using the ultimate tensile strength shall be considered acceptably accurate.

FHWA NHI-10-025 Appendix D – Geosynthetic Creep Factor MSE Walls and RSS – Vol II D –16 November 2009
If this is not the case, then the creep rupture envelopes for the other two products, plus enough other products within the product line, to establish the trend in RFCR as a function of product weight or ultimate tensile strength, so that the RFCR for the other products within the product line can be accurately interpolated. Furthermore, Tal must be determined in accordance with the following: Note that normalization using the ultimate lot specific tensile strength may not be completely accurate for some geosynthetic products regarding characterization of creep rupture behavior, and other normalization techniques may be needed (Wrigley et al., 1999). In such cases, individual creep reduction factors for each product in the product line may need to be established through fully developed creep rupture envelopes for representative products obtained at the low, middle, and high strength end of the product series. Once the creep limited strength, Pcl and the creep reduction factors are established for each product, in this case, product variability must still be taken into account. In such cases, Tal must be the lesser of the determination from Equation 1 and the following determination:
DID
95al RFRF
PT
where, P95 = the tensile strength determined from the 95% lower bound prediction limit for
the creep rupture envelope at the specified design life (see Equations 4 and 5 in “Quality Assurance (QA) Criteria for Comparison to Initial Product Acceptance Test Results”)
D.6 CREEP EXTRAPOLATION EXAMPLES USING STRESS RUPTURE DATA A creep extrapolation example using stress rupture data is provided. The example uses hypothetical stress rupture data, which is possible for PET geosynthetics, to illustrate the simplest extrapolation case.
D.6.1 Stress Rupture Extrapolation Example
The following example utilizes hypothetical stress rupture data for a PET geosynthetic. The data provided in this example is for illustration purposes only. Given: A PET geosynthetic proposed for use as soil reinforcement in a geosynthetic MSE wall. A design life of 1,000,000 hours is desired. The manufacturer of the geogrid has provided stress rupture data at one temperature for use in establishing the creep limit for the material. The stress rupture data came from the same lot of material as was used for the wide

FHWA NHI-10-025 Appendix D – Geosynthetic Creep Factor MSE Walls and RSS – Vol II D –17 November 2009
width load-strain tests. The wide width ultimate strength data for the lot is as provided in Figure D.6-1. The stress rupture data is provided in Figure D.6-2. Find: The long-term creep strength, T1, at a design life of 1,000,000 hours and a design temperature of 20o C, and the design reduction factor for creep, RFCR using the stress rupture data. Solution: The step-by-step procedures provided for stress rupture data extrapolation will be followed. Step 1 has already been accomplished (Figure D.6-2). Step 2: Extrapolate the stress rupture data. Use regression analysis to establish the best fit line through the stress rupture data. Extend the best fit line to 1,000,000 hours as shown in Figure D.6-2. Step 3: Determine the design, lot specific, creep limit load from the stress rupture envelope provided in Figure D.6-2. The load taken directly from the rupture envelope at 1,000,000 hours is 63.4 kN/m. This value has been extrapolated 1.68 log cycles beyond the available data. Using Equation D.4,
kN/m56.01.2/kN/m63.4T 11.68l
Step 4: The strength reduction factor to prevent long-term creep rupture RFCR is determined as follows (see Equation D.1):
l
ultlotCR T
TRF
where, Tutlot is the average lot specific ultimate tensile strength for the lot material used for creep testing. From Figure D.6-1, Tutlot is 110 kN/m. Therefore,
0.2kN/m56.0/kN/m110RFCR
In summary, using rupture based creep extrapolation, T1 = 56.0 kN/m, and RFCR = 2.0
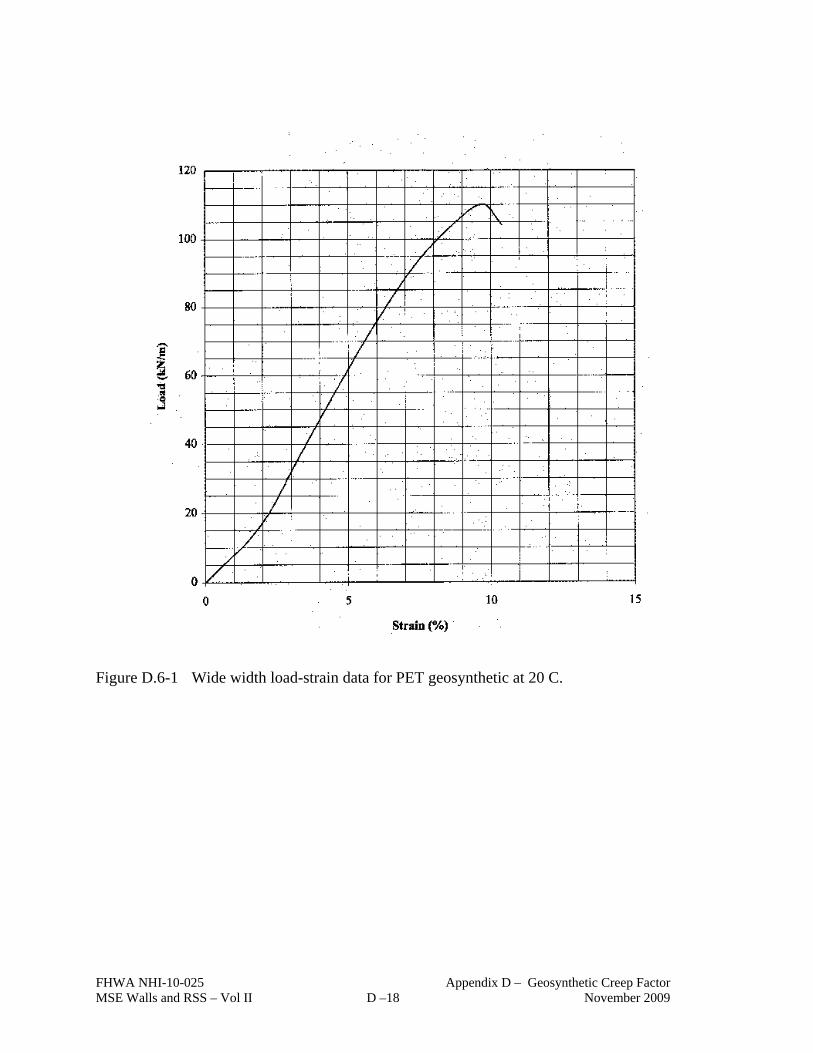
FHWA NHI-10-025 Appendix D – Geosynthetic Creep Factor MSE Walls and RSS – Vol II D –18 November 2009
Figure D.6-1 Wide width load-strain data for PET geosynthetic at 20 C.

FHWA NHI-10-025 Appendix D – Geosynthetic Creep Factor MSE Walls and RSS – Vol II D –19 November 2009
Figure D.6-2 Stress rupture data for PET geosynthetic at 20 C.
D.7 RECOMMENDED PROCEDURES TO DETERMINE Tal (after WSDOT Standard Practice T 925, Standard Practice for Determination of Long-Term Strength for Geosynthetic Reinforcement) The AASHTO LRFD Bridge Design Specifications provide minimum requirements for the assessment of Tal for use in the design of geosynthetic reinforced soil structures. A framework for the use of installation damage, creep, and durability test data that can be obtained from available ASTM, ISO, and GRI test standards to determine RFID, RFCR, and RFD is presented below. This protocol should be used to establish values of RFID, RFCR, and RFD that are not project or site specific, that can applied to the typical situations a given agency or owner will face. These reduction factors could then be applied to most design situations. Using this approach, a generalized step-by-step procedure to determine these reduction factors is as follows:

FHWA NHI-10-025 Appendix D – Geosynthetic Creep Factor MSE Walls and RSS – Vol II D –20 November 2009
1. Characterize the typical environment to which the geosynthetic reinforcement will be exposed during installation and throughout its life. Key environmental parameters to be considered include the soil gradation and its angularity above and below the geosynthetic layers (RFID), likely backfill placement procedures (RFID), in-soil “average” site temperature to be used for design (RFCR and RFD), backfill pH range likely to be present (RFD), potential exposure to sunlight, in particular UV light, and special soil conditions that may affect aging, such as summarized in Table 3-9 (RFD). “Average” site temperature to be used for design is defined as the temperature which is halfway between the average yearly air temperature and normal daily air temperature for the highest month at the site. This site temperature definition is considered to be a conservative estimation of the average effective temperature in the soil. Note that at the connection between the soil reinforcement and the facing elements, the temperature could be significantly higher than this, especially if the facing has a southern exposure.
2. To determine RFCR, conduct laboratory creep tests as described previously, using the “average” site temperature as the baseline test temperature. For those located in the northern tier of states within the USA, in most cases, it is sufficiently accurate, and a little conservative, to use a default baseline temperature of 20o C. For those located in the southern reaches of the U.S., where “average” in-soil temperatures could approach 30o C or higher, a higher baseline temperature should be used. Using the creep test results and time-temperature superposition to shift elevated temperature creep data to the baseline temperature timescale (see following section), create a creep rupture envelope for the baseline temperature, making sure that the rupture envelope extends out to the desired design life (typically 75 years). If necessary, extrapolate the envelope to the design life beyond the time shifted data using regression analysis techniques.
3. To determine RFD, conduct the index durability tests described previously and as summarized in Table 3-11, provided that the environment to which the geosynthetic will be exposed during its life (i.e., step 1 above) is within the boundaries of conditions to which the index test results are applicable. These environment boundaries are as follows:
Granular soils (sands, gravels) used in the reinforced volume.
pH as determined by AASHTO T289 ranging from 4.5 < pH < 9 for permanent applications and 3 < pH < 10 for temporary applications
Site temperature < 85o F (30o C) for permanent applications and < 95o F (35o C) for temporary applications
Maximum backfill particle size of ¾-inch (19 mm), unless full scale installation damage tests conducted in accordance with ASTM D5818 are

FHWA NHI-10-025 Appendix D – Geosynthetic Creep Factor MSE Walls and RSS – Vol II D –21 November 2009
available and indicate that RFID for the site backfill soil and geosynthetic combination is less than 1.7, and
Soil organic content, as determined by AASHTO T267 for material finer than the 0.0787 in. (No. 10) sieve < 1 percent.
Site conditions not within these boundaries should be considered to be aggressive with regard to the determination of RF. If the test results meet the established criteria to consider the geosynthetic adequately durable, a default value for RFD as specified herein may be used. If the index test results do not meet the specified criteria, or if the anticipated environment is likely to be outside the boundaries applicable to the index tests, long-term durability tests such as described by Elias et al. (2009) should be considered to determine RFD directly.
4. To determine RFID, field expose samples of the geosynthetic to three or more different fill materials that encompass the range of soil conditions likely to be encountered. For state agencies, the selection of backfill gradations could be tied to the standard backfill materials used for reinforced walls and slopes by the agency. Once the samples exposed to installation stresses are tested to determine tensile strength loss for each backfill condition, the tensile strength loss and RFID could be plotted as a function of a key gradation parameter, such as the d50 size, to enable selection of RFID for the specific backfill gradation being considered.
The four step approach provided above is also applicable to specifically target the determination of these reduction factors to a specific site environment. The most common adaptation for targeting a site specific condition is to conduct installation damage tests using the actual backfill material to be used in the reinforced soil structure. The value of RFID derived from that site specific testing is then used with the values of RFCR and RFD determined as described in the above four step process. Site specific determination of RFCR, primarily in consideration of a site specific baseline temperature, can also be accomplished, provided that adequate creep data is available to establish a rupture envelope for the site specific baseline temperature (assuming that site specific temperature is significantly different from the baseline temperature used for the available creep test data). If inadequate creep rupture data is available to accomplish that, it is generally cost and time prohibitive to conduct a new suite of creep tests targeted to the site specific temperature as a baseline. Also, determination of RFD for site specific conditions is time and cost prohibitive and is rarely done, as such testing typically takes one to two years or more to complete. Once the reduction factors are determined, then Tal can be determined in accordance with Equation 3-12 and used to design the geosynthetic structure (see Chapter 4).

FHWA NHI-10-025 Appendix D – Geosynthetic Creep Factor MSE Walls and RSS – Vol II D –22 November 2009

FHWA NHI-10-025 Appendix E – Example Calculations MSE Walls and RSS – Vol II E –1 November 2009
APPENDIX E EXAMPLE CALCULATIONS
This appendix presents ten example problems that illustrate the application of the various equations and principles for design of MSE walls and slopes discussed in Chapters 2 to 8. The ten example problems were chosen to encompass a variety of geometries, soil reinforcements, and loading conditions. The first seven examples are for MSE walls, and the final three examples are for reinforced soil slopes (RSS). A summary of the example problems is included in Table E0.
Table E0 Summary of Example Problems
No. Problem Description
MSE Walls
E1 Modular Block Wall (MBW) Faced MSE wall with broken back sloping fill and live load surcharge, reinforced with geogrids
E2 Bearing check for sloping toe conditions, with and without high groundwater
E3 Segmental precast panel MSE wall with sloping backfill surcharge, reinforced with steel strips
E4 Segmental precast panel MSE wall with level backfill and live load surcharge, reinforced with steel bar mats
E5 Bridge abutment with spread footing on top of a segmental precast panel faced MSE wall with steel strips
E6 Example E4 with traffic barrier impact loading
E7 Example E4 with seismic loading
RSS
E8 Road widening
E9 High slope for new road construction
E10 Facing stability calculation
MSE Wall Examples: While using LRFD methodology care has to be taken in using the correct load factors and load combinations. There are several different ways in which the computations using LRFD can be performed. As noted in Chapter 4, for simple problem geometries the critical loading conditions can be readily identified while for complex geometries this may not be possible because the critical load effects due to various combinations of maximum and minimum loads may not be clear without performing all the intermediate computations for various load
FHWA NHI-10-025 Appendix E – Example Calculations MSE Walls and RSS – Vol II E –2 November 2009
factors. Therefore, the MSE wall example problems in this appendix have been solved in the following two formats: Format A: In this format designs are developed based on critical load combinations that
are readily identifiable based on the problem geometry. This format is used in Example E1.
Format B: In this format, the computations for load effects are first performed using
maximum load factors and minimum load factors. Then, using the values computed for maximum and minimum load combinations, the critical load effects are obtained by suitably combining the maximum and minimum loads. This format is used in Examples E2, E3 and E4.
Format B involves more computations than Format A. However, in the LRFD context, Format B is essential while evaluating MSE walls with complex geometries such as those discussed in Chapter 6. This is because the critical combination of various loads may not be readily apparent until the complex system of surcharges on and within the MSE walls are analyzed with applicable maximum and minimum load factors. Rather than introduce the more comprehensive Format B in Example E5 which addresses a case of complex geometry, a conscious attempt was made to first introduce Format B with respect to relatively simpler geometries. Thus, Example E3 and E4 have been solved with Format B. Example E3 is similar to Example E1 in the sense that they both include sloping backfill. Thus, the reader can develop a good feel for the design using both formats. Then, in Example E5 it will become evident that Format B represents a more logical way of handling complex geometries. Format B also permits easier incorporation of extreme events such as vehicular impact and seismic events as demonstrated in Examples E6 and E7, respectively. Format B will also provide a more adaptable solution scheme in the event that load factors are modified and/or additional recommendations are developed for load combinations in future versions of AASHTO.

FHWA NHI-10-025 Example E1 – Broken Backslope & Traffic MSE Walls and RSS – Vol II E1 – 1 November 2009
EXAMPLE E1 MBW UNIT FACED, MSE WALL WITH BROKEN BACKSLOPE AND
LIVE LOAD SURCHARGE, REINFORCED WITH GEOGRIDS
E1-1 INTRODUCTION This example problem demonstrates the analysis of an MSE wall with a broken backslope and live load traffic surcharge. The MSE wall is faced with modular block wall (MBW) units and has geogrid soil reinforcements. The MSE wall configuration to be analyzed is shown in Figure E.1-1. This MSE wall is (assumed to be) a “simple” structure and, therefore, is analyzed with the load factors that typically control external stability analyses (see Figure 4-1). The design steps used in these calculations follow the basic design steps presented in Table 4-3, of which, the primary steps are presented in Table E1-1. Each of the steps and sub-steps are sequential. Therefore, if the design is revised at any step or sub-step the previous computations need to be re-examined. Each step and sub-step follow.
Figure E.1-1 Configuration of example problem E1.

FHWA NHI-10-025 Example E1 – Broken Backslope & Traffic MSE Walls and RSS – Vol II E1 – 2 November 2009
Table E.1-1. Primary Design/Analysis Steps
Step 1. Establish Project Requirements
Step 2. Establish Project Parameters
Step 3. Estimate Wall Embedment Depth, Design Height(s), and Reinforcement Length
Step 4 Define unfactored loads
Step 5 Summarize Load Combinations, Load Factors, and Resistance Factors
Step 6. Evaluate External Stability
Step 7. Evaluate Internal Stability
Step 8. Design of Facing Elements
Step 9. Assess Overall Global Stability
Step 10. Assess Compound Stability
Step 11. Design Wall Drainage Systems
Step 1. Establish Project Requirements
C Geometry
o Exposed wall height above finished grade, He = 18 ft
o MBW unit facing, with 3 batter
o 2H:1V broken backslope, 9 feet high o Level toe slope
C Loading Conditions o Broken back slope o Traffic surcharge o No loads from adjacent structures o No seismic o No traffic barrier impact
C Performance Criteria o Design code – AASHTO/FHWA LRFD o Maximum tolerable differential settlement = 1/200 o Design life = 100 years

FHWA NHI-10-025 Example E1 – Broken Backslope & Traffic MSE Walls and RSS – Vol II E1 – 3 November 2009
Step 2. Establish Project Parameters C Subsurface conditions
o Foundation soil, 'f = 30°, f = 125 pcf
o Factored Bearing resistance of foundation soil For service limit consideration, qnf-ser = 7.50 ksf for 1-inch of total settlement For strength limit consideration, qnf-str = 10.50 ksf No groundwater influence
C Reinforced wall fill, 'r = 34°, r = 125 pcf, pH = 7.3, maximum size ¾-inch
C Retained backfill, 'b = 30°, b = 125 pcf
Step 3. Estimate Wall Embedment Depth and Reinforcement Length The minimum embedment depth = H/20 for walls with horizontal ground in front of wall, see Table 2-1; i.e., 0.9 ft for exposed wall height of 18 ft. Therefore, use minimum embedment depth of 2.0 ft. Thus, design height of the wall, H = 20 ft.
Due to the 2H:1V backslope and traffic surcharge on the retained backfill, the initial length of reinforcement is assumed to be 0.9H or 18 ft. This length will be verified as part of the design process.
Step 4 – Define Unfactored Loads The primary sources of external loading on an MSE wall are the earth pressure from the retained backfill behind the reinforced zone and any surcharge loadings above the reinforced
zone. The 3 batter is a near vertical face, therefore assume a vertical face and that the MSE
wall acts as a rigid body with earth pressures developed on a vertical pressure plane at the back end of the reinforcements. Estimate the earth pressures on wall for the broken backslope condition as shown in Figure 4-4 (reproduced below) and with Equations 4-2 and 4-3. From figure: H = 20.0 ft 2H = 40.0 ft Height of slope = 9 ft
Therefore, angle I = arctan (9/40) = 12.7 Slope crest is at the end of the reinforcement length, therefore, h = 20 + 9 = 29 ft

FHWA NHI-10-025 Example E1 – Broken Backslope & Traffic MSE Walls and RSS – Vol II E1 – 4 November 2009
Figure 4-4. External analysis: earth pressure; broken backslope case (after AASHTO,
2007). Using Eq. 4-3, and = I , = I, for vertical and near vertical wall face, and b = 30
133.2
7.1290sin7.1290sin
7.1230sin7.1230sin1
) + ( sin ) - ( sin
) - ( sin ) + ( sin + 1 =
2'b
'b
2
The external lateral pressure coefficient, Kab, using Eq. 4-2, is equal to:
360.0
7.1290sin90sin133.2
3090sin
) - ( sin sin
) + ( sin = K 2
2
2
'b
2
ab
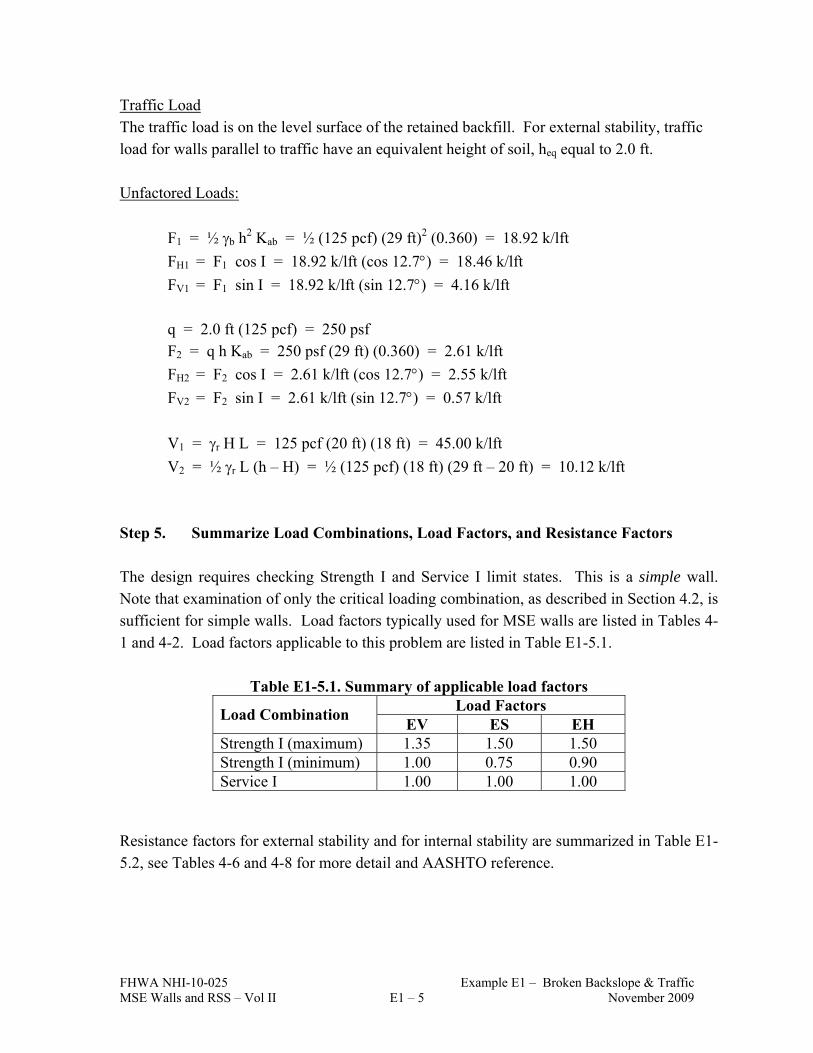
FHWA NHI-10-025 Example E1 – Broken Backslope & Traffic MSE Walls and RSS – Vol II E1 – 5 November 2009
Traffic Load The traffic load is on the level surface of the retained backfill. For external stability, traffic load for walls parallel to traffic have an equivalent height of soil, heq equal to 2.0 ft. Unfactored Loads:
F1 = ½ b h2 Kab = ½ (125 pcf) (29 ft)2 (0.360) = 18.92 k/lft
FH1 = F1 cos I = 18.92 k/lft (cos 12.7) = 18.46 k/lft
FV1 = F1 sin I = 18.92 k/lft (sin 12.7) = 4.16 k/lft
q = 2.0 ft (125 pcf) = 250 psf F2 = q h Kab = 250 psf (29 ft) (0.360) = 2.61 k/lft
FH2 = F2 cos I = 2.61 k/lft (cos 12.7) = 2.55 k/lft
FV2 = F2 sin I = 2.61 k/lft (sin 12.7) = 0.57 k/lft
V1 = r H L = 125 pcf (20 ft) (18 ft) = 45.00 k/lft
V2 = ½ r L (h – H) = ½ (125 pcf) (18 ft) (29 ft – 20 ft) = 10.12 k/lft
Step 5. Summarize Load Combinations, Load Factors, and Resistance Factors The design requires checking Strength I and Service I limit states. This is a simple wall. Note that examination of only the critical loading combination, as described in Section 4.2, is sufficient for simple walls. Load factors typically used for MSE walls are listed in Tables 4-1 and 4-2. Load factors applicable to this problem are listed in Table E1-5.1.
Table E1-5.1. Summary of applicable load factors Load Factors
Load Combination EV ES EH
Strength I (maximum) 1.35 1.50 1.50 Strength I (minimum) 1.00 0.75 0.90 Service I 1.00 1.00 1.00
Resistance factors for external stability and for internal stability are summarized in Table E1-5.2, see Tables 4-6 and 4-8 for more detail and AASHTO reference.

FHWA NHI-10-025 Example E1 – Broken Backslope & Traffic MSE Walls and RSS – Vol II E1 – 6 November 2009
Table E1-5.2. Summary of applicable resistance factors for evaluation of resistances Item Resistance Factor
Sliding of MSE wall on foundation soil s = 1.00 Bearing resistance b = 0.65 Tensile resistance and connectors for geosynthetic reinforcement – static t = 0.90
Pullout resistance – static p = 0.90
Step 6. Evaluate External Stability The external stability is a function of the various forces and moments that are shown in Figure E1-2. In the LRFD context the forces and moments need to be categorized into various load types. For this example problem, the primary load types are soil loads (EV, EH and ES). 6.1 Evaluate Sliding Stability This is a simple wall and, therefore, which load factor – minimum or maximum – is readily identified, see Figure E1.6-1 below (or Figure 4-1) for load factors for sliding and eccentricity checks. E.1.6-1 Typical load factors for sliding stability and eccentricity check. The factored resistance against failure by sliding (RR) can be estimated with Eq. 4-4:
RR = R
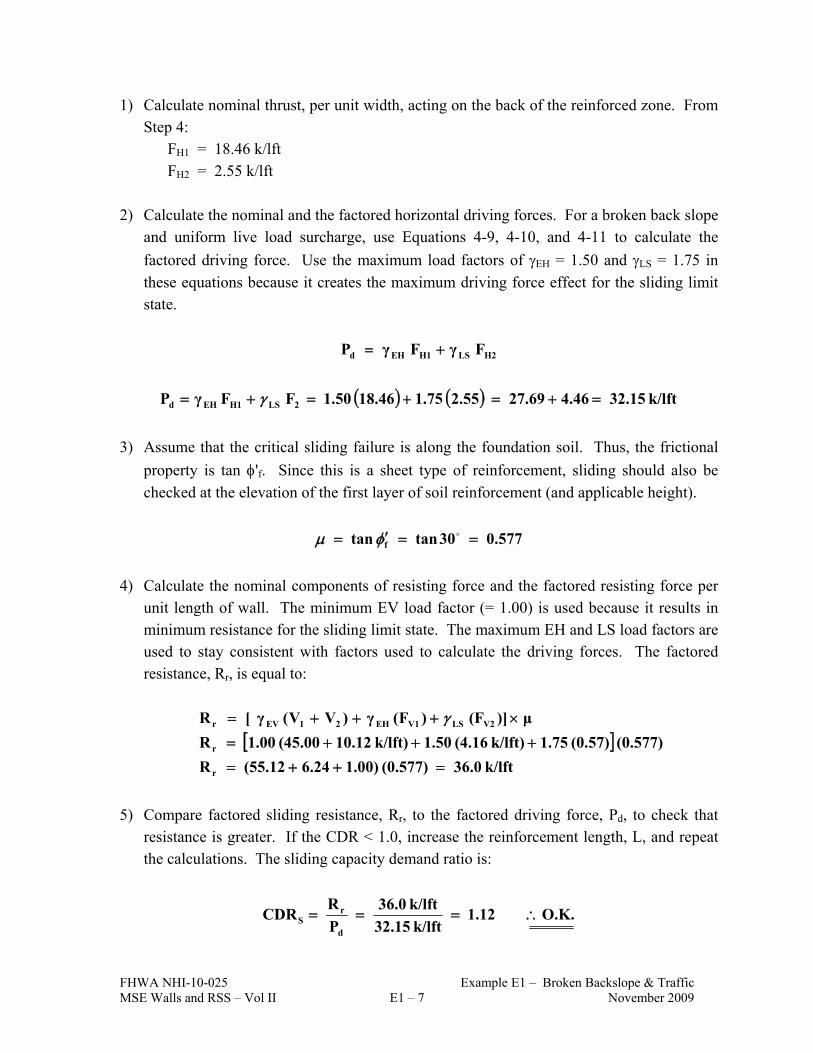
FHWA NHI-10-025 Example E1 – Broken Backslope & Traffic MSE Walls and RSS – Vol II E1 – 7 November 2009
1) Calculate nominal thrust, per unit width, acting on the back of the reinforced zone. From Step 4:
FH1 = 18.46 k/lft FH2 = 2.55 k/lft
2) Calculate the nominal and the factored horizontal driving forces. For a broken back slope
and uniform live load surcharge, use Equations 4-9, 4-10, and 4-11 to calculate the
factored driving force. Use the maximum load factors of EH = 1.50 and LS = 1.75 in
these equations because it creates the maximum driving force effect for the sliding limit state.
H2LSH1EHd FγFγP
k/lft15.3246.469.2755.275.146.1850.1FFγP 2LSH1EHd
3) Assume that the critical sliding failure is along the foundation soil. Thus, the frictional
property is tan 'f. Since this is a sheet type of reinforcement, sliding should also be
checked at the elevation of the first layer of soil reinforcement (and applicable height).
577.030tantan f
4) Calculate the nominal components of resisting force and the factored resisting force per
unit length of wall. The minimum EV load factor (= 1.00) is used because it results in minimum resistance for the sliding limit state. The maximum EH and LS load factors are used to stay consistent with factors used to calculate the driving forces. The factored resistance, Rr, is equal to:
k/lft36.0(0.577)1.00)6.24(55.12R
(0.577)(0.57)1.75k/lft)(4.161.50k/lft)10.12(45.001.00R
μ)](F)F(γ)VV(γ[R
r
r
V2LSV1EH21EVr
5) Compare factored sliding resistance, Rr, to the factored driving force, Pd, to check that
resistance is greater. If the CDR < 1.0, increase the reinforcement length, L, and repeat the calculations. The sliding capacity demand ratio is:
O.K.1.12k/lft32.15
k/lft36.0
P
RCDR
d
rS

FHWA NHI-10-025 Example E1 – Broken Backslope & Traffic MSE Walls and RSS – Vol II E1 – 8 November 2009
6.2 Eccentricity Limit Check The system of forces for checking the eccentricity at the base of the wall is shown on Figure E1.6-2. The weight and width of the wall facing is neglected in the calculations. Sum the factored moments about the centerline of the wall zone, with the loads as previously defined and moment arms as shown in Figure E1.6-1. This is a simple wall and, therefore, which load factor – minimum or maximum – is readily identified, see Figure 4-1, and are the same as used for the sliding check.
Figure E1.6-2 Forces for eccentricity check.
V
MMe RO
V2LSV1MAXEH2MINEV1MIN-EV
V2LSV1MAX-EH2MINEV1MINEVH2LSH1MAX-EH
FFVV
ft9FFft3V0Vft14.5Fft9.67Fe

FHWA NHI-10-025 Example E1 – Broken Backslope & Traffic MSE Walls and RSS – Vol II E1 – 9 November 2009
57.075.116.450.112.1000.145.001.00
ft957.075.116.450.1ft312.1000.1000.4500.1ft14.555.275.1ft9.6718.46 1.50e
ft803.k62.36
ft-k237.00
k1.00k6.24k10.12k45.00
ft-k65.14ft-k30.360ft-k 64.70ft-k 267.8e
Check that e < L/4:
O.K.ft4.503.80eft4.54
18
4
L
6.3 Evaluate Bearing on Foundation This step, 6.3, requires a different computation of the eccentricity value computed in Step 6.2 because different, i.e., maximum in lieu of minimum, load factor(s) are used. This is a simple wall and, therefore, which load factor – minimum or maximum – is readily identified, see Figure E1.6-3 below (or Figure 4-1) for load factors for bearing check. E.1.6-1 Typical load factors for bearing check.

FHWA NHI-10-025 Example E1 – Broken Backslope & Traffic MSE Walls and RSS – Vol II E1 – 10 November 2009
1) Calculate the eccentricity, eB, of the resulting force at the base of the wall. The e value from the eccentricity check, Step 6.a, cannot be used, calculate eB with factored loads.
The maximum load factors for EH and EV are used to be consistent with the computation
for v (below) where maximum load factors results in the maximum vertical stress.
V2LSV1MAXEH2MAXEV1MAX-EV
V2LSV1MAX-EH2MAXEV1MAXEVH2LSH1MAX-EHB FFVV
ft9FFft3V0Vft14.5Fft9.67Fe
57.075.116.450.112.1035.145.001.35
ft957.075.116.450.1ft312.1035.1000.4535.1ft14.555.275.1ft9.6718.46 1.50eB
ft.772k81.65
ft-k226.36
k1.00k6.24k13.66k60.75
ft-k65.14ft-k41.000ft-k 64.70ft-k 267.8eB
2) Calculate the factored vertical stress V-F at the base assuming Meyerhof-type
distribution. Maintain consistency with loads and load factors used in the eccentricity calculation and corresponding bearing stress calculation.
BV 2eL
Vσ
For this wall with a broken backslope and traffic surcharge the factored bearing stress is:
B
V2LSV1MAX-EH2MAX-EV1MAX-EVF-V 2eL
FγFγVγVγq
ksf6.55ft2.772ft18
k/lft81.65q F-V
3) Determine the nominal bearing resistance, qn, see Eq. 4-22.
The nominal bearing resistance for strength limit state was provided. qn-str = 10.50 ksf

FHWA NHI-10-025 Example E1 – Broken Backslope & Traffic MSE Walls and RSS – Vol II E1 – 11 November 2009
4) Compute the factored bearing resistance, qR. The resistance factor, , for MSE walls is
equal to 0.65 (see Table E1-5.2). The factored bearing resistance (qR or qnf-str) was given in Step 2 as equal to 10.50 ksf. (see Eq. 4-23) as:
qR = qn
qR = 10.50 ksf
5) Compare the factored bearing resistance, qR, to the factored bearing stress, V-F, to check that the resistance is greater.
O.K.1.60ksf6.55
ksf10.50qCDR
F-V
RS
6.4 Settlement Estimate Settlement is evaluated at Service I Limit State. From Step 2, the estimated settlement under a bearing stress of 7.50 ksf is 1.00 in. The bearing stress for Service I limit state is ___ ksf. Therefore, the settlement will be less than 1.00 in.
Step 7 EVALUATE INTERNAL STABILITY 7.1 Select Type of Soil Reinforcement Geogrid soil reinforcement will be used. Three grades, or strengths, of geogrid may be used. The grades and ultimate tensile strengths of these geogrids are summarized in Table E1-7.1.
Table E1-7.1. Geogrid grades and strengths.
Name (Grade): GG-I GG-II GG-III
Ultimate Tensile Strength (lb/ft): 6,000 9,000 12,000
7.2 Define Critical Slip Surface The critical failure surface is approximately linear in the case of extensible, geogrid reinforcements (see Figure E1-7-1), and passes through the toe of the wall.

FHWA NHI-10-025 Example E1 – Broken Backslope & Traffic MSE Walls and RSS – Vol II E1 – 12 November 2009
Figure E.7-1. Location of failure surface for internal stability of MSE walls and extensible
reinforcements (from Figure 4-9.
7.3 Define Unfactored Loads The relationship between the type of the reinforcement and the overburden stress is shown in Figure 4-10. The Kr/Ka ratio extensible (e.g., geogrid) reinforcement is a constant, and is equal to 1.0. The lateral earth pressure coefficient Kr is determined by applying a multiplier to the active earth pressure coefficient. The active earth pressure coefficient is determined using a Coulomb earth pressure relationship, assuming no wall friction and a β angle equal to zero (i.e., equivalent to the Rankine earth pressure coefficient, see Eq. 4-25). With a reinforced
fill friction angle of 34, the active lateral earth pressure coefficient is:
283.023445tan245tanK 2
'r2
a
Therefore,
283.00.1283.0
a
rar K
KKK

FHWA NHI-10-025 Example E1 – Broken Backslope & Traffic MSE Walls and RSS – Vol II E1 – 13 November 2009
The stress, 2, due to a sloping backfill on top of an MSE wall can be determined as shown
in Figure 4-11. An equivalent soil height, S, is computed based upon the slope geometry. The value of S should not exceed the slope height for broken back sloping fills. A
reinforcement length of 0.7H is used to compute the sloping backfill stress, 2, on the soil
reinforcement, as a greater length would only have minimal effect on the reinforcement. The vertical stress is equal to the product equivalent soil height and the reinforced fill unit weight, and is uniformly applied across the top of the MSE zone. The equivalent uniform height of soil, Seq, is equal to:
ft3.5126.6tanft200.721tanβ0.7H2
1Seq
7.4 Establish Vertical Layout of Soil Reinforcements The MBW units are 8 inches tall. The geogrid soil reinforcement spacing is listed in Table E1-7.5. The upper layer of geogrid will be 8 inches below top of wall, and the bottom layer of geogrid will be 8 inches above the leveling pad. The grade of geogrid to use at each elevation will be determined by strength and connection requirements. 7.5 Calculate Factored Tensile Forces in the Reinforcement Layers
The factored horizontal stress, H, at any depth Z below the top of wall is equal to (after
equation 4-29):
σH = Kr [r (Z + Seq) γEV-MAX]
The maximum tension TMAX in each reinforcement layer per unit width of wall based on the vertical spacing Sv (see Eq. 4-32a) is:
vHMAX SσT
The term Sv is equal to the vertical reinforcement spacing for a layer where vertically adjacent reinforcements are equally spaced from the layer under consideration. In this case,
H, calculated at the level of the reinforcement, is at the center of the contributory height.
The contributory height is defined as the midpoint between vertically adjacent reinforcement elevations, except for the top and bottom layers reinforcement. For the top and bottom layers

FHWA NHI-10-025 Example E1 – Broken Backslope & Traffic MSE Walls and RSS – Vol II E1 – 14 November 2009
of reinforcement, Sv is the distance from top or bottom of wall, respectively, to the midpoint between the first and second layer (from top or bottom of wall, respectively) of reinforcement. Sv distances are illustrated in Figure 4-14. The factored horizontal stress, vertical spacing, and maximum tension for all layers are summarized in Table E1-7.5. Example calculation, for layer #3 follows.
For all layers: Kr = 0.283 r = 125 pcf
Seq = 3.51 ft EV-MAX = 1.35
For Layer #3: Z = 4.67 ft SV = 2.0 ft
σH = Kr [r (Z + Seq) γEV-MAX] = 0.283 [125 pcf (4.67 + 3.51 ft) (1.35)] = 391 lb/ft2
TMAX = H SV = 391 lb/ft2 (2.0 ft) = 781 lb/lft
For Layer #1: Z = 0.67 ft SV = 1.67 ft SV-Top = 0 ft SV-Bottom = 1.67 ft ZAve = 0.835 ft
σH = Kr [r (ZAVE + Seq) γEV-MAX] = 0.283 [125 pcf (0.835 + 3.51 ft) (1.35)] = 207 lb/ft2
TMAX = H SV = 207 lb/ft2 (1.67 ft) = 346 lb/lft
Table E1-7.2 Maximum Tension in Geogrid Layers.
Layer #
Z (ft)
SV (ft)
H (lb/ft2)
TMAX (lb/lft)
1 0.67 1.67 115 346 2 2.67 2.0 203 590 3 4.67 2.0 298 781 4 6.67 2.0 394 972 5 8.67 2.0 489 1163 6 10.67 2.0 585 1354 7 12.67 2.0 681 1545 8 14.67 2.0 776 1736 9 16.67 2.0 872 1927 10 18.67 1.33 951 1366 11 19.33 1.0 1006 1091

FHWA NHI-10-025 Example E1 – Broken Backslope & Traffic MSE Walls and RSS – Vol II E1 – 15 November 2009
7.6 Calculate Soil Reinforcement Resistance The nominal geosynthetic reinforcement strength, Tal, per Eq. 3-12, is equal to:
DCRID
ultultal RFRFRF
T
RF
TT
The procedure and discussion on definition of nominal long-term reinforcement design strength (Tal), for both steel and geosynthetic reinforcements, are presented in Section 3.5 of this manual. The factored soil resistance is the product of the nominal long-term strength and applicable
resistance factor, . The resistance factors for tensile rupture of MSE wall soil
reinforcements are summarized in Table 4-8. The resistance factor for geosynthetic reinforcement is 0.90. The factored soil reinforcement tensile resistance, Tr, is (per Eq. 4-33) equal to:
Tr = Tal
The strength reduction factors, nominal resistance, and factored resistance for the three grades of geogrids are summarized in Table E1-7.3.
Table E1-7.3 Geogrid Nominal and Factored Resistance.
Geogrid: GG-I GG-II GG-III
Tult (lb/ft) 3,000 6,000 9,000
Creep, RFCR 1.85 1.85 1.85
Durability, RFD 1.15 1.15 1.15
Installation, RFID 1.3 1.3 1.2
Tal (lb/ft) 1,085 2,169 3,525
Tr 976 1,952 3,173
7.7 Select Grade of and/or Number of Soil Reinforcement Elements at Each Level The soil reinforcement vertical layout, the factored tensile force at each reinforcement level, and the factored soil reinforcement resistance were defined in the previous three steps. Suitable grades (strength) of reinforcement for the defined vertical reinforcement layout is summarized in Table E1-7.4. The CRD for each layer is also listed.

FHWA NHI-10-025 Example E1 – Broken Backslope & Traffic MSE Walls and RSS – Vol II E1 – 16 November 2009
Check this layout for pullout and connection resistance. Adjust layout if/as necessary.
Table E1-7.4 Geogrid Nominal and Factored Resistance.
Geogrid Layer
# Z
(ft) SV (ft)
TMAX (lb/lft) Grade
Tr (lb/ft)
CDR
1 0.67 1.67 346 GG-I 976 2.82 2 2.67 2.0 590 GG-I 976 1.65 3 4.67 2.0 781 GG-I 976 1.25 4 6.67 2.0 972 GG-I 976 1.00 5 8.67 2.0 1163 GG-II 1,952 1.68 6 10.67 2.0 1354 GG-II 1,952 1.44 7 12.67 2.0 1545 GG-II 1,952 1.26 8 14.67 2.0 1736 GG-II 1,952 1.12 9 16.67 2.0 1927 GG-II 1,952 1.01 10 18.67 1.33 1366 GG-II 1,952 1.43 11 19.33 1.0 1091 GG-II 1,952 1.79
7.8 Internal Stability with Respect to Pullout Failure Therefore, the required embedment length in the resistance zone (i.e., beyond the potential failure surface) can be determined from (Eq. 4-36):
m1ft3RC*F
TL
cv
MAXe
where: Le = Length of embedment in the resisting zone
TMAX = Maximum reinforcement tension
= Resistance factor for soil reinforcement pullout, = 0.90
F* = Pullout resistance factor, = 0.45 for these geogrids α = Scale correction factor, = 0.8 for these geogrids
σv = Average (see Figure E.7-2), nominal (i.e., unfactored) vertical stress at the reinforcement level in the resistant zone
C = 2 for geogrid type reinforcement Rc = Coverage ratio, = 1.0 for geogrid and 100% coverage

FHWA NHI-10-025 Example E1 – Broken Backslope & Traffic MSE Walls and RSS – Vol II E1 – 17 November 2009
Figure E.7-2. Nominal vertical stress at the reinforcement level in the resistant zone,
beneath a sloping backfill (also presented as Figure 4-15).
Table E1-7.5 Pullout Check.
Layer #
Z (ft)
La (ft)
Available Le (ft)
TMAX (lb/lft)
ZP (ft)
Required Le (ft)
CDR
1 0.67 10.28 7.72 346 7.74 0.55 14.0 2 2.67 9.22 8.78 590 9.47 0.77 11.4 3 4.67 8.16 9.84 781 11.21 0.86 11.4 4 6.67 7.09 10.91 972 12.94 0.93 11.8 5 8.67 6.03 11.97 1163 14.68 0.98 12.2 6 10.67 4.96 13.04 1354 16.41 1.02 12.8 7 12.67 3.90 14.10 1545 18.14 1.05 13.4 8 14.67 2.84 15.16 1736 19.88 1.08 14.1 9 16.67 1.77 16.23 1927 21.61 1.10 14.7 10 18.67 0.71 17.29 1366 23.35 0.72 23.9 11 19.33 0.36 17.64 1091 23.92 0.56 31.1
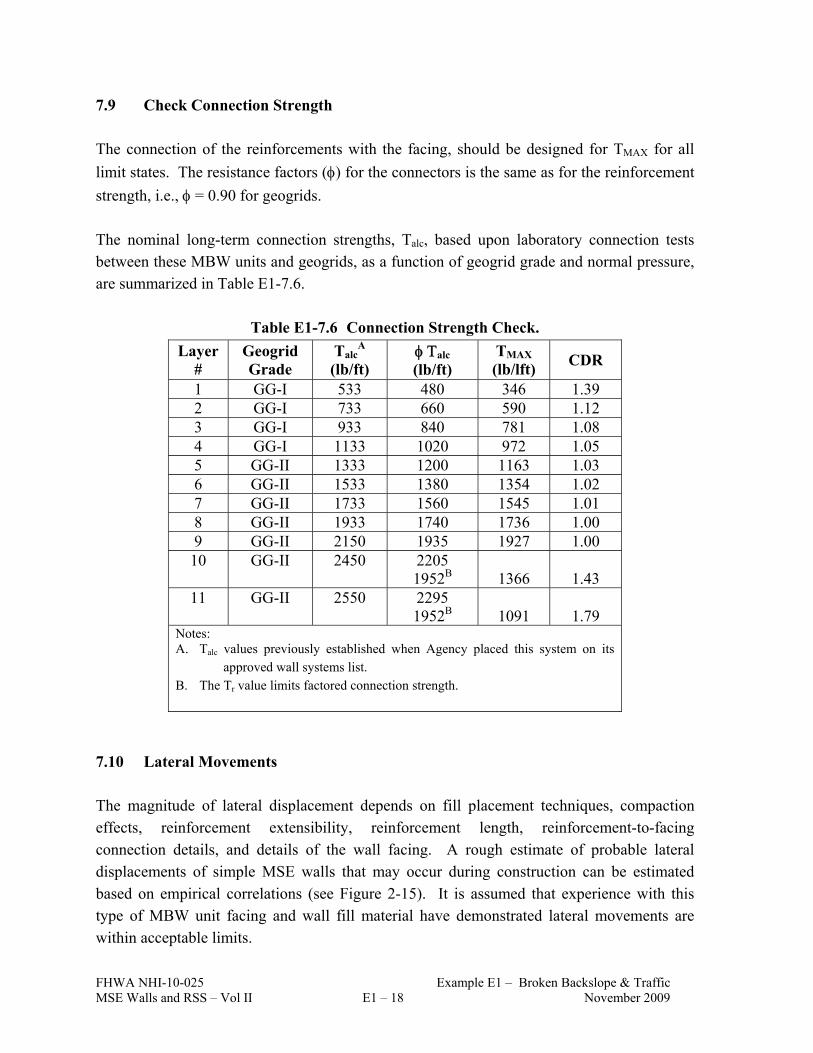
FHWA NHI-10-025 Example E1 – Broken Backslope & Traffic MSE Walls and RSS – Vol II E1 – 18 November 2009
7.9 Check Connection Strength The connection of the reinforcements with the facing, should be designed for TMAX for all
limit states. The resistance factors () for the connectors is the same as for the reinforcement
strength, i.e., = 0.90 for geogrids.
The nominal long-term connection strengths, Talc, based upon laboratory connection tests between these MBW units and geogrids, as a function of geogrid grade and normal pressure, are summarized in Table E1-7.6.
Table E1-7.6 Connection Strength Check.
Layer #
Geogrid Grade
TalcA
(lb/ft) alc (lb/ft)
TMAX (lb/lft)
CDR
1 GG-I 533 480 346 1.39 2 GG-I 733 660 590 1.12 3 GG-I 933 840 781 1.08 4 GG-I 1133 1020 972 1.05 5 GG-II 1333 1200 1163 1.03 6 GG-II 1533 1380 1354 1.02 7 GG-II 1733 1560 1545 1.01 8 GG-II 1933 1740 1736 1.00 9 GG-II 2150 1935 1927 1.00 10 GG-II 2450 2205
1952B
1366
1.43 11 GG-II 2550 2295
1952B
1091
1.79 Notes: A. Talc values previously established when Agency placed this system on its
approved wall systems list. B. The Tr value limits factored connection strength.
7.10 Lateral Movements The magnitude of lateral displacement depends on fill placement techniques, compaction effects, reinforcement extensibility, reinforcement length, reinforcement-to-facing connection details, and details of the wall facing. A rough estimate of probable lateral displacements of simple MSE walls that may occur during construction can be estimated based on empirical correlations (see Figure 2-15). It is assumed that experience with this type of MBW unit facing and wall fill material have demonstrated lateral movements are within acceptable limits.

FHWA NHI-10-025 Example E1 – Broken Backslope & Traffic MSE Walls and RSS – Vol II E1 – 19 November 2009
7.11 Vertical Movement and Bearing Pads Bearing pads are generally not used with MBW unit facings, and are not used with this example problem. The wall height is 20 feet, and is below the recommended maximum height of 32 ft without bearing pads (see 3.6.1). Calculation of the external settlement was reviewed in Step 6.4. The reinforced wall fill is a well graded, granular soil and, therefore, the internal movement will be negligible with good compaction control during construction.
Step 8. Design of Facing Elements Facing elements are designed to resist the horizontal forces developed in Step 7. With the modular concrete facing blocks (MBW), the maximum spacing between reinforcement layers should be limited to twice the front to back width, i.e., 24 in. The maximum depth of facing below the bottom reinforcement layer is 8 in., and is less than the MBW unit depth. The top row of reinforcement is 8 in. below top of wall, and is less than 1.5 the block depth. Sufficient inter-unit shear capacity exceeds the factored horizontal earth pressure at the facing.
Step 9. Assess Overall/Global Stability This design step is performed to check the overall, or global, stability of the wall. Overall stability is determined using rotational or wedge analyses, as appropriate, to examine potential failure planes passing behind and under the reinforced zone. Analyses can be performed using a classical slope stability analysis method with standard slope stability computer programs. This step is not detailed in this example calculation, see Chapter 9.
Step 10. Assess Compound Stability This design step is performed to check potential compound failure planes passing through the reinforced soil zone. Compound stability is determined using rotational or wedge analyses, as appropriate, performed with computer programs that directly incorporate reinforcement elements in the analyses. This step is not detailed in this example calculation, see Chapter 9.

FHWA NHI-10-025 Example E1 – Broken Backslope & Traffic MSE Walls and RSS – Vol II E1 – 20 November 2009
Step 11. Wall Drainage Systems Subsurface and surface drainage are important aspects in the design and specifying of MSE walls. The Agency should detail and specify drainage requirements for vendor designed walls. Furthermore, the Agency should coordinate the drainage design and detailing (e.g., outlets) within its own designers and with the vendor. This step is not detailed in this example calculation, see Chapter 5.

FHWA NHI-10-025 Example E2 – Bearing Resistance MSE Walls and RSS – Vol II E2 – 1 November 2009
EXAMPLE E2 BEARING CHECK FOR EXAMPLE E1 MSE WALL
WITHOUT and WITH HIGH GROUNDWATER, and WITH A SLOPING TOE
E2-1 INTRODUCTION This example problem demonstrates the strength limit state bearing resistance analyses of an MSE wall with various foundation conditions. A flat bearing surface with and without a high groundwater condition, and a sloping toe without groundwater are examined. The MSE wall configuration to be analyzed is shown in Figure E.2-1 (and in Figure E.1-1). This MSE wall is (assumed to be) a “simple” structure and, therefore, is analyzed with the load factors that typically control external stability analyses (see Figure 4-1). The design steps used in these calculations follow the basic design steps presented in Table 4-3, of which, the primary steps are presented in Table E1-1. Each of the steps and sub-steps are sequential. Therefore, if the design is revised at any step or sub-step the previous computations need to be re-examined. Each step and sub-step follow.
Figure E.2-1 Configuration of example problem E1.

FHWA NHI-10-025 Example E2 – Bearing Resistance MSE Walls and RSS – Vol II E2 – 2 November 2009
Table E.2-1. Primary Design/Analysis Steps
Step 1. Establish Project Requirements
Step 2. Establish Project Parameters
Step 3. Estimate Wall Embedment Depth, Design Height(s), and Reinforcement Length
Step 4 Define unfactored loads
Step 5 Summarize Load Combinations, Load Factors, and Resistance Factors
Step 6. Evaluate External Stability
Step 7. Evaluate Internal Stability
Step 8. Design of Facing Elements
Step 9. Assess Overall Global Stability
Step 10. Assess Compound Stability
Step 11. Design Wall Drainage Systems
See Example E1 for Steps 1 – 11. However, for these computations, bearing resistances are computed (for several cases) in lieu of defined bearing resistances.
Step 2. Establish Project Parameters
C Foundation soil, 'f = 30°, f = 125 pcf
C Factored bearing resistance of foundation soil o For service limit consideration, qnf-ser = 7.5 ksf for 1-inch of total settlement o For strength limit consideration, qnf-str – is to be determined
C Reinforced wall fill, 'r = 34°, r = 125 pcf, pH = 7.3, maximum size ¾-inch
C Retained backfill, 'b = 30°, b = 125 pcf
From Example E1:
Step 4. Define Unfactored Loads Traffic Load The traffic load is on the level surface of the retained backfill. For external stability, traffic load for walls parallel to traffic and more than 1-ft behind the backface of the MSE wall is represented by an equivalent height of soil, heq equal to 2.0 ft.

FHWA NHI-10-025 Example E2 – Bearing Resistance MSE Walls and RSS – Vol II E2 – 3 November 2009
Unfactored Loads:
F1 = ½ b h2 Kab = ½ (125 pcf) (29 ft)2 (0.360) = 18,922 lb/lft = 18.92 k/lft
FH1 = F1 cos I = 18.92 k/lft (cos 12.7) = 18.46 k/lft
FV1 = F1 sin I = 18.92 k/lft (sin 12.7) = 4.16 k/lft
q = 2.0 ft (125 pcf) = 250 psf F2 = q h Kab = 250 psf (29 ft) (0.360) = 2,610 lb/lft = 2.61 k/lft
FH2 = F2 cos I = 2.61 k/lft (cos 12.7) = 2.55 k/lft
FV2 = F2 sin I = 2.61 k/lft (sin 12.7) = 0.57 k/lft
V1 = r H L = 125 pcf (20 ft) (18 ft) = 45,000 lb/lft = 45.0 k/lft
V2 = ½ r L (h – H) = ½ (125 pcf) (18 ft) (29ft – 20ft) = 10,125 lb/lft = 10.12 k/lft
Step 5. Summarize Load Combinations, Load Factors, and Resistance Factors The design requires checking Strength I limit state. This is a simple wall. Note that examination of only the critical loading combination, as described in Section 4.2, is sufficient for simple walls. Load factors typically used for MSE walls are listed in Tables 4-1 and 4-2. Load factors applicable to this problem are listed in Table E2-5.1. Bearing resistance factor for MSE walls is listed in Table E2-5.2
Table E2-5.1. Summary of applicable load factors Load Factors
Load Combination EV ES EH
Strength I (maximum) 1.35 1.50 1.50 Strength I (minimum) 1.00 0.75 0.90
Table E2-5.2. Bearing resistance factor Item Resistance Factor
Bearing resistance b = 0.65

FHWA NHI-10-025 Example E2 – Bearing Resistance MSE Walls and RSS – Vol II E2 – 4 November 2009
Step 6. Evaluate Bearing on Foundation This step, 6.3, requires a different computation of the eccentricity value computed in Step 6.2 because different, i.e., maximum in lieu of minimum, load factor(s) are used. This is a simple wall and, therefore, which load factor – minimum or maximum – is readily identified for load factors for bearing check.
2) Calculate the factored vertical stress V-F at the base assuming Meyerhof-type
distribution. Maintain consistency with loads and load factors used in the eccentricity calculation and corresponding bearing stress calculation.
BV 2eL
Vσ
For this wall with a broken backslope and traffic surcharge the factored bearing stress is
(see Example E1):
B
V2LSV1MAX-EH2MAX-EV1MAX-EVF-V 2eL
FγFγVγVγq
ksf6.55ft2.772ft18
k/lft81.65q F-V
E2-1 CALCULATIONS It is not obvious whether the strength or the service (i.e., settlement) limit state controls. Therefore, check both. 2) (cont.) Calculate e for service limit state:
V2V121
V2V121H2H1ser-b FFVV
ft9FFft3V0Vft14.5Fft9.67Fe
57.016.412.1045.00
ft957.016.4ft312.10000.45ft14.555.2ft9.6718.46e ser-b
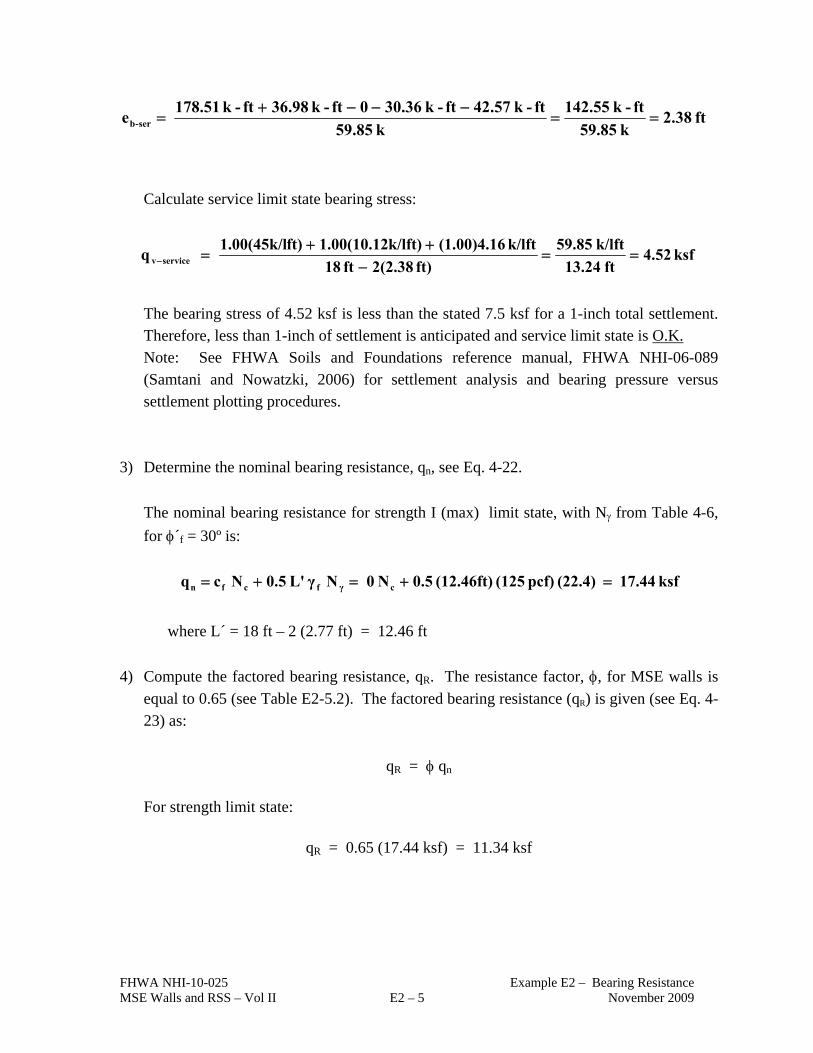
FHWA NHI-10-025 Example E2 – Bearing Resistance MSE Walls and RSS – Vol II E2 – 5 November 2009
ft38.2k59.85
ft-k142.55
k85.59
ft-k57.42ft-k30.360ft-k 98.36ft-k 178.51e ser-b
Calculate service limit state bearing stress:
ksf 52.4ft13.24
k/lft59.85
ft) 2(2.38ft 18
k/lft (1.00)4.16k/lft)1.00(10.12ft)1.00(45k/lq servicev
The bearing stress of 4.52 ksf is less than the stated 7.5 ksf for a 1-inch total settlement. Therefore, less than 1-inch of settlement is anticipated and service limit state is O.K. Note: See FHWA Soils and Foundations reference manual, FHWA NHI-06-089 (Samtani and Nowatzki, 2006) for settlement analysis and bearing pressure versus settlement plotting procedures.
3) Determine the nominal bearing resistance, qn, see Eq. 4-22.
The nominal bearing resistance for strength I (max) limit state, with N from Table 4-6,
for ´f = 30º is:
ksf.4417(22.4)pcf)(125(12.46ft)0.5N0NγL'0.5Ncq cγfcfn
where L´ = 18 ft – 2 (2.77 ft) = 12.46 ft
4) Compute the factored bearing resistance, qR. The resistance factor, , for MSE walls is
equal to 0.65 (see Table E2-5.2). The factored bearing resistance (qR) is given (see Eq. 4-23) as:
qR = qn
For strength limit state:
qR = 0.65 (17.44 ksf) = 11.34 ksf

FHWA NHI-10-025 Example E2 – Bearing Resistance MSE Walls and RSS – Vol II E2 – 6 November 2009
5) Compare the factored bearing resistance, qR, to the factored bearing stress, V-F, to check that the resistance is greater.
For strength limit state:
O.K.73.1ksf6.55
ksf11.34qCDR
F-V
RStrength

FHWA NHI-10-025 Example E2 – Bearing Resistance MSE Walls and RSS – Vol II E2 – 7 November 2009
E2-2 CALCULATIONS WITH GROUNDWATER NEAR SURFACE Compute Strength I (max) limit state bearing resistance and CDR assuming groundwater is 12 ft below the ground surface, as illustrated in Figure E.2-2. Figure E.2-2. Bearing groundwater influence terms for spread footing (Note: Bf = L´ for MSE wall design). With groundwater consideration, and no cohesion, the nominal bearing resistance (see Eq. 4-22 and AASHTO 10.6.3.1.2a-1) is equal to:
wγfn CNγL'0.5q
The term Cw is defined in Table 10.6.3.1.2a-2 (AASHTO, 2007):
Coefficient Cw for Various Groundwater Depths
(after AASHTO Table 10.6.3.1.2a-2)
Dw Cw
0.0 0.5
Df 0.5
> 1.5 L' + Df 1.0 Note: Interpolate between the values shown for intermediate positions of the groundwater table.

FHWA NHI-10-025 Example E2 – Bearing Resistance MSE Walls and RSS – Vol II E2 – 8 November 2009
Calculations:
Given: Moist unit weight, m = 125 lb/ft3
Dw = 12 ft The buoyant unit weight should be used to compute the overburden pressure if the groundwater table is located with the potential failure zone.
ft20.69ft2ft2.772ft181.5DL1.5 f
At Dw = Df = 2.0 ft Cw = 0.5
At Dw = 1.5 L' + Df = 20.7 ft Cw = 1.0
Interpolating to Dw = 12 ft
77.0269.20
2125.05.0
ftft
ftftCw
The nominal bearing resistance for strength limit state, with Cw = 0.77, moist unit weight ' = 125 pcf, and N from Table 4-6, is:
ksf13.43 psf3,4321(0.77)(22.4)pcf)(125(12.46ft)0.5CNγL'0.5q γfn w
The factored strength limit state bearing resistance is:
qR = 0.65 (13.43 ksf) = 8.73 ksf
The capacity to demand ratio is:
O.K.33.1ksf6.55
ksf8.73qCDR
F-V
RStrength

FHWA NHI-10-025 Example E2 – Bearing Resistance MSE Walls and RSS – Vol II E2 – 9 November 2009
E2-3 CALCULATIONS WITH TOE SLOPE AND WITHOUT GROUNDWATER Compute Strength I (max) limit state bearing resistance and CDR assuming with sloping toe and no groundwater, as illustrated in Figure E.2-3, and with the following geometry: B = L – 2 eB = 12.46 ft b = 4 ft Df = assume = 0 I = 18.4º (3H:1V) Figure E.2-3. Bearing sloping toe terms.
For footings bearing near a slope the term N is replaced by Nq (AASHTO 10.6.3.1.2c). The
Nq term is taken from AASTHO Figure 10.6.3.1.2c-2. The nominal bearing resistance, for a
foundation soil with no cohesion, is equal to:
γqfn NγL'0.5q
From AASTHO Figure 10.6.3.1.2c-2 an Nq value equal to approximately 18 is found for f = 30º, b/B = 0.32, and = 18.4º.

FHWA NHI-10-025 Example E2 – Bearing Resistance MSE Walls and RSS – Vol II E2 – 10 November 2009
The nominal bearing resistance for strength limit state with Nq = 20 is:
ksf14.02 psf017,14(18)pcf)(125ft)(12.460.5NγL'0.5q γqfn
The factored strength limit state bearing resistance is:
qR = 0.65 (14.02 ksf) = 9.11 ksf The capacity to demand ratio is:
O.K.39.1ksf6.55
ksf9.11qCDR
F-V
RStrength

FHWA NHI-10-025 Example E3 – Sloping backfill surcharge MSE Walls and RSS – Vol II E3 – 1 November 2009
EXAMPLE E3 SEGMENTAL PRECAST PANEL MSE WALL WITH SLOPING BACKFILL
SURCHARGE E3-1 INTRODUCTION This example problem demonstrates the analysis of a MSE wall with a sloping backfill surcharge. The MSE wall is assumed to include a segmental precast panel face with ribbed steel strip reinforcements. The MSE wall configuration to be analyzed is shown in Figure E3-1. The analysis is based on various principles that were discussed in Chapter 4. Table E3-1 presents a summary of steps involved in the analysis. Each of the steps and sub-steps is sequential and if the design is revised at any step or sub-step then all the previous computations need to be re-visited. Each of the steps and the sub-steps in Table E3-1 is explained in detail herein.
Table E3-1. Summary of steps in analysis of MSE wall with sloping backfill
Step Item 1 Establish project requirements 2 Establish project parameters 3 Estimate wall embedment depth and length of reinforcement 4 Estimate unfactored loads 5 Summarize applicable load and resistance factors 6 Evaluate external stability of MSE wall
6.1 Evaluation of sliding resistance 6.2 Evaluation of limiting eccentricity 6.3 Evaluation of bearing resistance 6.4 Settlement analysis
7 Evaluate internal stability of MSE wall 7.1 Estimate critical failure surface, variation of Kr and F* for internal stability 7.2 Establish vertical layout of soil reinforcements 7.3 Calculate horizontal stress and maximum tension at each reinforcement level 7.4 Establish nominal and factored long-term tensile resistance of soil reinforcement 7.5 Establish nominal and factored pullout resistance of soil reinforcement 7.6 Establish number of soil reinforcing strips at each level of reinforcement
8 Design of facing elements 9 Check overall and compound stability at the service limit state. 10 Design wall drainage system
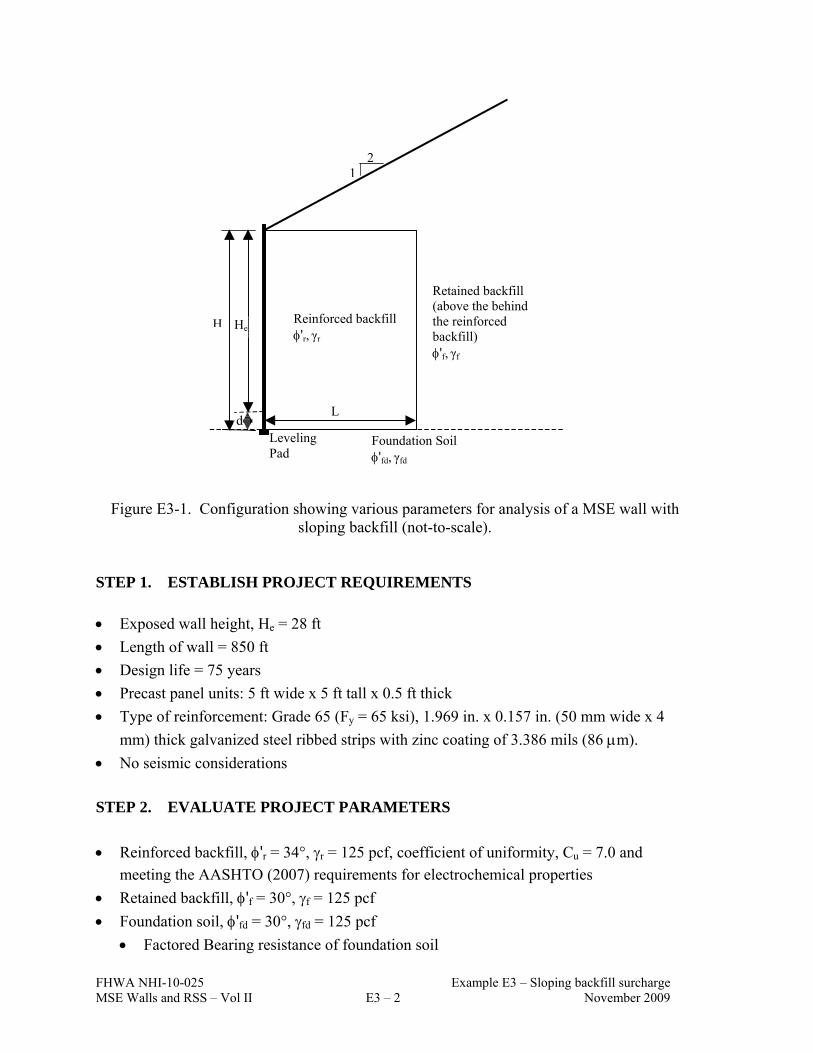
FHWA NHI-10-025 Example E3 – Sloping backfill surcharge MSE Walls and RSS – Vol II E3 – 2 November 2009
Figure E3-1. Configuration showing various parameters for analysis of a MSE wall with
sloping backfill (not-to-scale). STEP 1. ESTABLISH PROJECT REQUIREMENTS
Exposed wall height, He = 28 ft
Length of wall = 850 ft
Design life = 75 years
Precast panel units: 5 ft wide x 5 ft tall x 0.5 ft thick
Type of reinforcement: Grade 65 (Fy = 65 ksi), 1.969 in. x 0.157 in. (50 mm wide x 4
mm) thick galvanized steel ribbed strips with zinc coating of 3.386 mils (86 m).
No seismic considerations
STEP 2. EVALUATE PROJECT PARAMETERS
Reinforced backfill, 'r = 34°, r = 125 pcf, coefficient of uniformity, Cu = 7.0 and
meeting the AASHTO (2007) requirements for electrochemical properties
Retained backfill, 'f = 30°, f = 125 pcf
Foundation soil, 'fd = 30°, fd = 125 pcf
Factored Bearing resistance of foundation soil
21
Reinforced backfill 'r, γr
He H
L d
Retained backfill (above the behind the reinforced backfill) 'f, γf
Leveling Pad
Foundation Soil 'fd, γfd

FHWA NHI-10-025 Example E3 – Sloping backfill surcharge MSE Walls and RSS – Vol II E3 – 3 November 2009
o For service limit consideration, qnf-ser = 7.50 ksf for 1-inch of total settlement o For strength limit consideration, qnf-str = 10.50 ksf
Note: the above bearing resistance values are assumed values for the purpose of this example problem. In actual designs, the geotechnical engineer should develop appropriate project and wall specific values.
STEP 3. ESTIMATE DEPTH OF EMBEDMENT AND LENGTH OF
REINFORCEMENT Based on Table C.11.10.2.2.-1 of AASHTO (2007), the minimum embedment depth = H/20 for walls with horizontal ground in front of wall, i.e., 1.4 ft for exposed wall height of 28 ft. For this design, assume embedment, d = 2.0 ft. Thus, design height of the wall, H = He + d = 28 ft + 2.0 ft = 30 ft. Due to the 2H:1V backslope, the initial length of reinforcement is assumed to be 0.8H or 24 ft. This length will be verified as part of the design process. The length of the reinforcement is assumed to be constant throughout the height to limit differential settlements across the reinforced zone because differential settlements could overstress the reinforcements.
STEP 4. ESTIMATE UNFACTORED LOADS Tables E3-4.1 and E3-4.2 present the equations for unfactored loads and moment arms about Point A shown in Figure E3-2. The moments are a product of the respective forces and moment arms. Each force is assigned a designation representing the applicable load type as per Tables 3.4.1-1 and 3.4.1-2 of AASHTO (2007).
To compute the numerical values of various forces and moments, the parameters provided in Step 2 are used. Using the values of the various friction angles, the coefficients of lateral earth pressure for the retained fill is computed as follows: Coefficient of active earth pressure per Eq. 3.11.5.3-1 of AASHTO (2007) is
)sin(sin
sinK
2f
2
a
where per Eq. 3.11.5.3-2 of AASHTO (2007) the various parameters in above equation are as follows:

FHWA NHI-10-025 Example E3 – Sloping backfill surcharge MSE Walls and RSS – Vol II E3 – 4 November 2009
2ff
)sin()sin(
)sin()sin(1
= friction angle between fill and wall taken as specified
= angle (nominal) of fill to horizontal
= angle of back face of wall to horizontal
'f = effective angle of internal friction of retained backfill
For the case of level backfill with vertical backface, = = 0° and = 90°, the coefficient of
active earth pressure is given as follows:
Ka = (1-sin'f)/(1+sin'f)
For this example problem, compute the coefficient of active earth pressure for the retained
fill, Kaf, using = 26.56° (for the 2:1 backslope), vertical backface, = 90°, and = as
follows
563.1)894.0)(894.0(
)060.0)(834.0(1
)56.2690sin()56.2690sin(
)56.2630sin()56.2630sin(1
22
oooo
oooo
537.0
)894.0)(0.1)(563.1(
750.0
)]56.2690sin([)90(sin563.1
)3090(sin
)sin(sin
sinK
oo2o
oo2
2f
2
af
For the example problem, Tables E3-4.3 and E3-4.4 summarize the numerical values unfactored forces and moments, respectively, based on the equations, various dimensions and values of lateral earth pressure coefficients presented above. Refer to Figure E3-2 for notations of various forces.
The unfactored forces and moments in Tables E3-4.3 and E3-4.4 form the basis of all computations in this example problem. The unfactored forces and moments should be multiplied by the appropriate load factors based on the load types identified in the second column of the Tables E3-4.1 and E3-4.2 to perform the analysis for various load combinations such as Strength I, Service I, etc. The load factors for various load types relevant to this example problem are discussed in Step 5.

FHWA NHI-10-025 Example E3 – Sloping backfill surcharge MSE Walls and RSS – Vol II E3 – 5 November 2009
Figure E3-2. Legend for computation of forces and moments (a) for external stability analysis, (b) for internal stability analysis (not-to-scale).
A
(a)
(b)
(2/3)L
L/2 FTV
FTH

FHWA NHI-10-025 Example E3 – Sloping backfill surcharge MSE Walls and RSS – Vol II E3 – 6 November 2009
Table E3-4.1. Equations of computing unfactored vertical forces and moments
Moment arm (Length units) Vertical Force (Force/length units)
LRFD Load Type @ Point A
V1=(γr)(H)(L) EV L/2
V2= ))(tanL)(L( 2
1f
EV (2/3)L
FTV = (1/2)(γr)(h2)(Kaf)(sin) EH L
Note: h = H + Ltan
Table E3-4.2. Equations of computing unfactored horizontal forces and moments Moment arm (Length units) Horizontal Force
(Force/length units) LRFD
Load Type @ Point A FTH = (1/2)(γr)(h
2)(Kaf)(cos) EH h/3 Note: h = H + Ltan For this example problem, tan = 0.5, and h = 30 ft + 24 ft (0.5) = 42.00 ft.
Table E3-4.3. Unfactored vertical forces and moments
Force Value k/ft
Moment Arm @
Point A, ft Moment
Moment at Point A, k-ft/ft
V1 = 90.00 12.00 MV1 = 1080.00 V2 = 18.00 16.00 MV2 = 288.00 FTV = 26.48 24.00 MFTV = 635.44
Table E3-4.4. Unfactored horizontal forces and moments
Force Value k/ft
Moment Arm @
Point A, ft Moment
Moment at Point A, k-ft/ft
FTH = 52.95 14.00 MFTH = 741.35

FHWA NHI-10-025 Example E3 – Sloping backfill surcharge MSE Walls and RSS – Vol II E3 – 7 November 2009
STEP 5. SUMMARIZE APPLICABLE LOAD AND RESISTANCE FACTORS Table E3-5.1 summarizes the load factors for the various LRFD load type shown in second column of Tables E3-4.1 and E3-4.2. Throughout the computations in this example
problem, the forces and moments in Tables E3-4.1 and E3-4.2 should be multiplied by appropriate load factors. For example, if computations are being done for Strength I (maximum) load combination, the forces and moments corresponding to load V2 should be multiplied by 1.35 which is associated with load type EV assigned to load V2.
Table E3-5.1. Summary of applicable load factors Load Factors
(after AASHTO, 2007 Tables 3.4.1-1 and 3.4.1-2) Load Combination EV EH
Strength I (maximum) 1.35 1.50 Strength I (minimum) 1.00 0.90 Service I 1.00 1.00
For computation of factored resistances during evaluation of strength limits states, appropriate resistance factors have to be used. Table E3-5.2 summarizes the applicable resistance factors. For service limit state, all resistance factors are equal to 1.0.
Table E3-5.2. Summary of applicable resistance factors for evaluation of resistances
Item Resistance
Factors AASHTO (2007)
Reference Sliding of MSE wall on foundation soil s = 1.00 Table 11.5.6-1 Bearing resistance b = 0.65 Table 11.5.6-1 Tensile resistance (for steel strips) t = 0.75 Table 11.5.6-1 Pullout resistance p = 0.90 Table 11.5.6-1
STEP 6. EVALUATE EXTERNAL STABILITY OF MSE WALL The external stability of MSE wall is a function of the various forces and moments that are shown in Figure E3-2a. In the LRFD context the forces and moments need to be categorized into various load types. For this example problem, the primary load types are soil loads (EV and EH).

FHWA NHI-10-025 Example E3 – Sloping backfill surcharge MSE Walls and RSS – Vol II E3 – 8 November 2009
6.1 Sliding Resistance at Base of MSE Wall The purpose of these computations is to evaluate the sliding resistance at the base of the MSE wall. Since the computations are related to sliding resistance, the beneficial contribution of live load to resisting forces and moments is neglected. The computations for sliding resistance at the base of the MSE wall are illustrated in Table E3-6.1. Note that sliding resistance is a strength limit state check and therefore service limit state calculations are not
performed. Since the friction angle of foundation soil, fd, is less than the friction angle for
reinforced soil, r, the sliding check will be performed using fd. The critical values based on
max/min result in the extreme force effect and govern the sliding mode of failure. The resistance to load ratio, CDR, based on critical values of max/min is 1.07 indicating that the choice of 24 ft long reinforcement is justified because lesser length would result in CDR < 1.0 which is not acceptable.
Table E3-6.1. Computations for evaluation of sliding resistance of MSE wall
Item Unit Str I
(max) Str I (min)
Ser I
Lateral load on the MSE wall, Hm = FTH k/ft 79.43 47.66 N/AVertical load at base of MSE wall, VA1 = V1+V2 k/ft 145.80 108.00 N/AVertical load at base of MSE wall, VA2 = FTV k/ft 39.72 23.83 N/ATotal vertical load at base of MSE wall, VA=VA1+VA2 k/ft 185.52 131.83 N/ANominal sliding resistance at base of MSE wall, VNm1 = tan('fd)( V1+V2)
k/ft 84.18 62.35 N/A
Nominal sliding resistance at base of MSE wall, VNm2 = tan('fd)( FTV)
k/ft 22.93 13.76 N/A
Nominal sliding resistance at base of MSE wall, VNm = VNm1+VNm2
k/ft 107.11 76.11 N/A
Factored sliding resistance at base of MSE wall, VFm1= s*VNm1
k/ft 84.18 62.35 N/A
Factored sliding resistance at base of MSE wall, VFm2= s*VNm2
k/ft 22.93 13.76 N/A
Factored sliding resistance at base of MSE wall, VFm= VFm1+VFm2
k/ft 107.11 76.11 N/A
Is VFm > Hm? - Yes Yes N/ACapacity:Demand Ratio (CDR) = VFm:Hm dim 1.35 1.60 N/ACRITICAL VALUES BASED ON MAX/MIN Minimum VF (VFmin) k/ft 85.28* Maximum Hm (Hmmax) k/ft 79.43 Is VFmin > Hmmax? - Yes Capacity:Demand Ratio (CDR) = VFmin:Hmmax dim 1.07 Note: *85.28 = 62.35+22.93. This is to maintain consistency between the total inclined lateral force and its components.
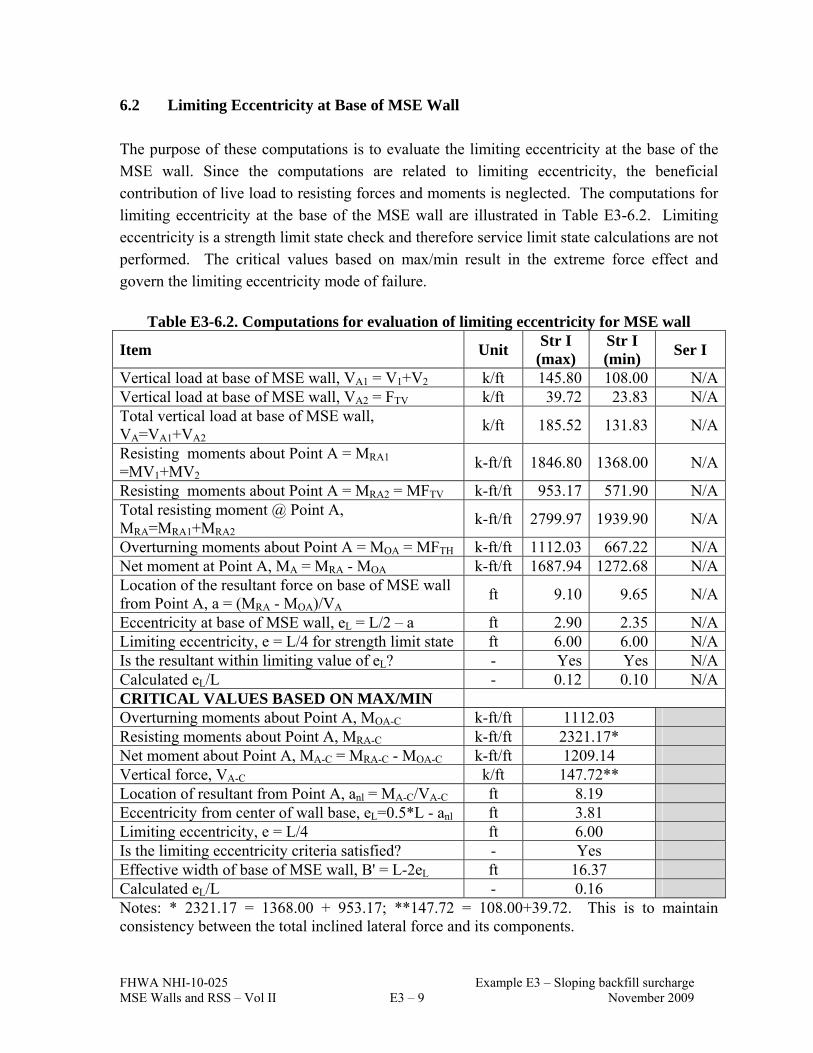
FHWA NHI-10-025 Example E3 – Sloping backfill surcharge MSE Walls and RSS – Vol II E3 – 9 November 2009
6.2 Limiting Eccentricity at Base of MSE Wall The purpose of these computations is to evaluate the limiting eccentricity at the base of the MSE wall. Since the computations are related to limiting eccentricity, the beneficial contribution of live load to resisting forces and moments is neglected. The computations for limiting eccentricity at the base of the MSE wall are illustrated in Table E3-6.2. Limiting eccentricity is a strength limit state check and therefore service limit state calculations are not performed. The critical values based on max/min result in the extreme force effect and govern the limiting eccentricity mode of failure.
Table E3-6.2. Computations for evaluation of limiting eccentricity for MSE wall
Item Unit Str I
(max) Str I (min)
Ser I
Vertical load at base of MSE wall, VA1 = V1+V2 k/ft 145.80 108.00 N/AVertical load at base of MSE wall, VA2 = FTV k/ft 39.72 23.83 N/ATotal vertical load at base of MSE wall, VA=VA1+VA2
k/ft 185.52 131.83 N/A
Resisting moments about Point A = MRA1 =MV1+MV2
k-ft/ft 1846.80 1368.00 N/A
Resisting moments about Point A = MRA2 = MFTV k-ft/ft 953.17 571.90 N/ATotal resisting moment @ Point A, MRA=MRA1+MRA2
k-ft/ft 2799.97 1939.90 N/A
Overturning moments about Point A = MOA = MFTH k-ft/ft 1112.03 667.22 N/ANet moment at Point A, MA = MRA - MOA k-ft/ft 1687.94 1272.68 N/ALocation of the resultant force on base of MSE wall from Point A, a = (MRA - MOA)/VA
ft 9.10 9.65 N/A
Eccentricity at base of MSE wall, eL = L/2 – a ft 2.90 2.35 N/ALimiting eccentricity, e = L/4 for strength limit state ft 6.00 6.00 N/AIs the resultant within limiting value of eL? - Yes Yes N/ACalculated eL/L - 0.12 0.10 N/ACRITICAL VALUES BASED ON MAX/MIN Overturning moments about Point A, MOA-C k-ft/ft 1112.03 Resisting moments about Point A, MRA-C k-ft/ft 2321.17* Net moment about Point A, MA-C = MRA-C - MOA-C k-ft/ft 1209.14 Vertical force, VA-C k/ft 147.72** Location of resultant from Point A, anl = MA-C/VA-C ft 8.19 Eccentricity from center of wall base, eL=0.5*L - anl ft 3.81 Limiting eccentricity, e = L/4 ft 6.00 Is the limiting eccentricity criteria satisfied? - Yes Effective width of base of MSE wall, B' = L-2eL ft 16.37 Calculated eL/L - 0.16 Notes: * 2321.17 = 1368.00 + 953.17; **147.72 = 108.00+39.72. This is to maintain consistency between the total inclined lateral force and its components.

FHWA NHI-10-025 Example E3 – Sloping backfill surcharge MSE Walls and RSS – Vol II E3 – 10 November 2009
6.3 Bearing Resistance at base of MSE Wall The bearing stress at the base of the MSE wall can be computed as follows:
Lv e2L
V
where ΣV = R = V1+V2+FTV is the resultant of vertical forces and the load eccentricity eL is calculated by principles of statics using appropriate loads and moments with the applicable load factors. In LRFD, σv is compared with the factored bearing resistance when computed for strength limit state and used for settlement analysis when computed for service limit state. The various computations for evaluation of bearing resistance are presented in Table E3-6.3. The Strength I (max) load combination results in the extreme force effect in terms of maximum bearing stress and therefore governs the bearing resistance mode of failure. The Service I load combination is evaluated to compute the bearing stress for settlement analysis. Since the CDR ≈ 1.0 for Strength I (max) and Service I load combinations, shorter reinforcement lengths are not recommended.
6.4 Settlement Analysis Settlement is evaluated at Service I Limit State. From Step 2, the estimated settlement under a bearing stress of 7.50 ksf is 1.00 in. From Table E3-6.3, the bearing stress for Service I limit state is 7.16 ksf. Therefore, the settlement will be less than 1.00 in.

FHWA NHI-10-025 Example E3 – Sloping backfill surcharge MSE Walls and RSS – Vol II E3 – 11 November 2009
Table E3-6.3. Computations for evaluation of bearing resistance for MSE wall
Item Unit Str I
(max) Str I (min)
Ser I
Vertical load at base of MSE wall, VAb1 = V1+V2 k/ft 145.80 108.00 108.00Vertical load at base of MSE wall, VAb2 = FTV k/ft 39.72 23.83 26.48Total vertical load at base of MSE wall, ΣV = R = VAb1+VAb2
k/ft 185.52 131.83 134.48
Resisting moments about Point A, MRA1 =MV1+MV2
k-ft/ft 1846.80 1368.00 1368.00
Resisting moments about Point A, MRA2 = MFTV k-ft/ft 953.17 571.90 635.44Total resisting moment @ Point A, MRA=MRA1+MRA2
k-ft/ft 2799.97 1939.90 2003.44
Overturning moments @ Point A, MOA = MFTH k-ft/ft 1112.03 667.22 741.35Net moment at Point A, MA = MRA - MOA k-ft/ft 1687.94 1272.68 1262.09Location of the resultant force on base of MSE wall from Point A, a = (MRA - MOA)/VA
ft 9.10 9.65 9.39
Eccentricity at base of MSE wall, eL = 0.5*L – a ft 2.90 2.35 2.61Limiting eccentricity, e = L/4 for strength limit states and e= L/6 for service limit state
ft 6.00 6.00 4.00
Is the resultant within limiting value of e? - Yes Yes YesEffective width of base of MSE wall, B' = L-2eL ft 18.20 19.31 18.77Bearing stress due to MSE wall =ΣV/(L-2eL) = v ksf 10.19 6.83 7.16Factored bearing resistance, (qnf-str for strength) or (qnf-ser for service) (given)
ksf 10.50 10.50 7.50
Is factored bearing stress less than the factored bearing resistance?
- Yes Yes Yes
Capacity:Demand Ratio (CDR) = qnf:σv dim 1.03 1.54 1.05CRITICAL VALUES BASED ON MAX/MIN Overturning moments about Point A, MOA-C k-ft/ft 1112.03 Resisting moments about Point A, MRA-C k-ft/ft 2321.17* Net moment about Point A, MA-C = MRA-C - MOA-C k-ft/ft 1209.14 Vertical force, ΣVC k/ft 147.72** Location of resultant from Point A, a = MA-C/ ΣVC ft 8.19 Eccentricity from center of wall, eL = 0.5*L – a ft 3.81 Limiting eccentricity, e = L/4 ft 6.00 Is the limiting eccentricity criteria satisfied? - Yes Effective width of base of MSE wall, B' = L-2eL ft 16.37 Bearing stress, ΣVC / (L-2eL) = v-c ksf 9.02*** Factored bearing resistance, qnf-str (given) ksf 10.50 Is bearing stress < factored bearing resistance? dim Yes Capacity:Demand Ratio (CDR) = qnf-str:σv-c dim 1.16 Notes: * 2321.17 = 1368.00 + 953.17; **147.72 = 108.00+39.72; ***9.02=147.72/16.37. This is to maintain consistency between the total inclined lateral force and its components.

FHWA NHI-10-025 Example E3 – Sloping backfill surcharge MSE Walls and RSS – Vol II E3 – 12 November 2009
STEP 7: EVALUATE INTERNAL STABILITY ANALYSIS OF MSE WALL
7.1 Estimate critical failure surface, variation of Kr and F* for internal stability For the case of inextensible steel ribbed strips, the profile of the critical failure surface, the variation of internal lateral horizontal stress coefficient, Kr, and the variation of the pullout resistance factor, F*, are as shown in Figure E3-5 wherein other definitions such as measurement of depths Z and Zp as well as heights H and H1 are also shown. It should be noted that the variation of Kr and F* are with respect to depth Z that is measured from the top of the reinforced soil zone. For the computation of Kr, the value of Ka is based on the angle
of internal friction of the reinforced backfill, r, and the assumption that the backslope angle
= 0; thus, Ka = tan2(45° - 34°/2) = 0.283. Hence, the value of Kr varies from 1.7(0.283) =
0.481 at Z = 0 ft to 1.2(0.283) = 0.340 at Z = 20 ft. For steel strips, F*=1.2+log10Cu. Using Cu = 7.0 as given in Step 2, F*= 1.2+log10(7.0) = 2.045 > 2.000. Therefore, use F*=2.000.
Figure E3-5. Geometry definition, location of critical failure surface and variation of Kr and F* parameters for steel ribbed strips.
Z
Zp
Kr F*Z=0 1.7 Ka
1.2 Ka
2.000
tan (1) = 0.675
Z=20 ft
Zp
tan3.01
)H3.0)((tanH
Zp at start of resistant zone, Zp-s= Z + Latan Zp at end of resistant zone, Zp-e= Z + Ltan Use average Zp over the resistance zone, Zp-ave, for computing pullout resistance Zp-ave = Z + 0.5(Latan + Ltan) = Z + 0.5 tan (La + L)
Z=0
Z=20 ft
H
0.3H1
Ka is computed assuming that the backslope angle is zero, i.e., = 0 per Article C11.10.6.2.1 of AASHTO (2007)
H1= H + H
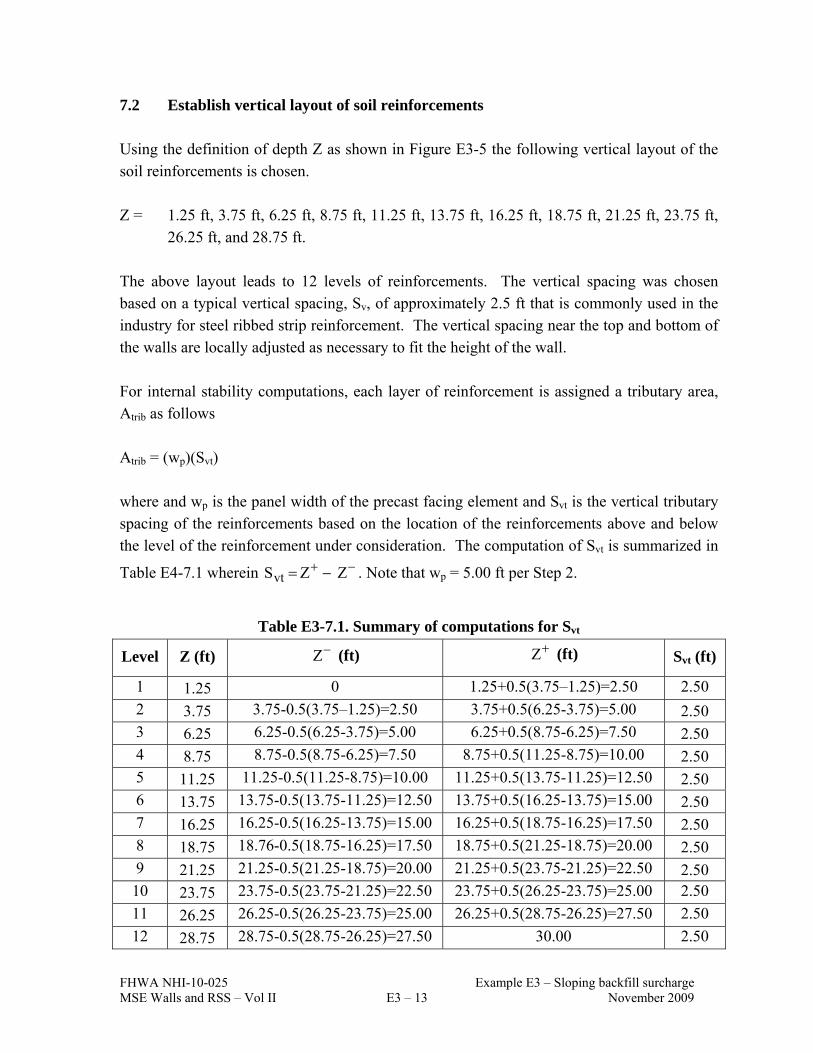
FHWA NHI-10-025 Example E3 – Sloping backfill surcharge MSE Walls and RSS – Vol II E3 – 13 November 2009
7.2 Establish vertical layout of soil reinforcements Using the definition of depth Z as shown in Figure E3-5 the following vertical layout of the soil reinforcements is chosen. Z = 1.25 ft, 3.75 ft, 6.25 ft, 8.75 ft, 11.25 ft, 13.75 ft, 16.25 ft, 18.75 ft, 21.25 ft, 23.75 ft,
26.25 ft, and 28.75 ft. The above layout leads to 12 levels of reinforcements. The vertical spacing was chosen based on a typical vertical spacing, Sv, of approximately 2.5 ft that is commonly used in the industry for steel ribbed strip reinforcement. The vertical spacing near the top and bottom of the walls are locally adjusted as necessary to fit the height of the wall. For internal stability computations, each layer of reinforcement is assigned a tributary area, Atrib as follows Atrib = (wp)(Svt) where and wp is the panel width of the precast facing element and Svt is the vertical tributary spacing of the reinforcements based on the location of the reinforcements above and below the level of the reinforcement under consideration. The computation of Svt is summarized in
Table E4-7.1 wherein ZZSvt . Note that wp = 5.00 ft per Step 2.
Table E3-7.1. Summary of computations for Svt
Level Z (ft) Z (ft) Z (ft) Svt (ft)
1 1.25 0 1.25+0.5(3.75–1.25)=2.50 2.50
2 3.75 3.75-0.5(3.75–1.25)=2.50 3.75+0.5(6.25-3.75)=5.00 2.50 3 6.25 6.25-0.5(6.25-3.75)=5.00 6.25+0.5(8.75-6.25)=7.50 2.50 4 8.75 8.75-0.5(8.75-6.25)=7.50 8.75+0.5(11.25-8.75)=10.00 2.50 5 11.25 11.25-0.5(11.25-8.75)=10.00 11.25+0.5(13.75-11.25)=12.50 2.50 6 13.75 13.75-0.5(13.75-11.25)=12.50 13.75+0.5(16.25-13.75)=15.00 2.50 7 16.25 16.25-0.5(16.25-13.75)=15.00 16.25+0.5(18.75-16.25)=17.50 2.50 8 18.75 18.76-0.5(18.75-16.25)=17.50 18.75+0.5(21.25-18.75)=20.00 2.50 9 21.25 21.25-0.5(21.25-18.75)=20.00 21.25+0.5(23.75-21.25)=22.50 2.50 10 23.75 23.75-0.5(23.75-21.25)=22.50 23.75+0.5(26.25-23.75)=25.00 2.50
11 26.25 26.25-0.5(26.25-23.75)=25.00 26.25+0.5(28.75-26.25)=27.50 2.50
12 28.75 28.75-0.5(28.75-26.25)=27.50 30.00 2.50

FHWA NHI-10-025 Example E3 – Sloping backfill surcharge MSE Walls and RSS – Vol II E3 – 14 November 2009
7.3 Calculate horizontal stress and maximum tension at each reinforcement level The horizontal spacing of the reinforcements is based on the maximum tension (Tmax) at each level of reinforcements which requires computation of the horizontal stress, σH, at each reinforcement level. The reinforcement tensile and pullout resistances are then compared with Tmax and an appropriate reinforcement pattern is adopted. This section demonstrates the calculation of horizontal stress, σH, and maximum tension, Tmax. The horizontal stress, σH, at any depth within the MSE wall is based on only the soil load as summarized in Table E3-7.2. σH = σH-soil + σH-surcharge
Table E3-7.2. Summary of load components leading to horizontal stress
Load Component Load Type Horizontal Stress Soil load from reinforced mass, σv-soil EV σH-soil = [Krσv-soil]γP-EV Surcharge load due to backslope, σ2 EV σH-surcharge = [Krσ2]γP-EV Using the unit weight of the reinforced soil mass and heights Z and S as shown in Figure E3-2b , the equation for horizontal stress at any depth Z within the MSE wall can be written as follows (also see Chapter 4): σH = Kr (r Z) γP-EV + Kr (r S) γP-EV = Kr [r (Z + S) γP-EV]
Once the horizontal stress is computed at any given level of reinforcement, the maximum tension, Tmax, is computed as follows: Tmax = (σH)(Atrib) where Atrib is the tributary area for the soil reinforcement at a given level as discussed in Section 7.2 The computations for Tmax are illustrated at z = 8.75 ft which is Level 4 in the assumed vertical layout of reinforcement. Assume Strength I (max) load combination for illustration purposes and use appropriate load factors from Table E3-5.1.
At Z = 8.75 ft, the following depths are computed Z = 7.50 ft (from Table E3-7.1)
Z = 10.00 ft (from Table E3-7.1)

FHWA NHI-10-025 Example E3 – Sloping backfill surcharge MSE Walls and RSS – Vol II E3 – 15 November 2009
Obtain Kr by linear interpolation between 1.7Ka = 0.481 at Z = 0.00 ft and 1.2Ka = 0.340 at Z = 20.00 ft as follows:
At Z = 7.50 ft, Kr(Z-)= 0.340 + (20.00 ft – 7.50 ft)(0.481-0.340)/20.00 ft = 0.428
At Z = 10.00 ft, Kr(Z+)= 0.340 + (20.00 ft – 10.00 ft)(0.481-0.340)/20.00 ft = 0.411
Compute σH-soil = [Kr σv-soil]γP-EV as follows: γP-EV = 1.35 from Table E3-5.1
At Z = 7.50 ft,
v-soil(Z-) = (0.125 kcf)(7.50 ft) = 0.94 ksf
σH-soil(Z-) = [Kr(Zp-)σv-soil(z-)]γP-EV = (0.428)(0.94 ksf)(1.35) = 0.54 ksf
At Z = 10.00 ft,
v-soil(Z+) = (0.125 kcf)(10.00 ft) = 1.25 ksf
σH-soil(Z+) = [Kr(Zp+)σv-soil(z+)]γP-EV = (0.411)(1.25 ksf)(1.35) = 0.69 ksf σH-soil = 0.5(0.54 ksf + 0.69 ksf) = 0.62 ksf
Compute σH-surcharge = [Kr σ2]γP-EV as follows:
σ2 = (1/2)(0.7Htan)(f) (from Figure E3-2b)
σ2 = (1/2)(0.7*30 ft)[tan (26.56°)](0.125 kcf) = 0.656 ksf γP-EV = 1.35 from Table E3-5.1
At Z = 7.50 ft,
σH-surcharge = [Kr(Z-) σ2]γP-EV = (0.428)(0.656 ksf)(1.35) = 0.38 ksf
At z = 10.00 ft and pZ = 15.29 ft,
σH-surcharge = [Kr(Z+) σ2]γP-ES = (0.411)(0.656 ksf)(1.35) = 0.36 ksf σH-surcharge = 0.5(0.38 ksf + 0.36 ksf) = 0.37 ksf
Compute σH = σH-soil + σH-surcharge as follows: σH = 0.62 ksf + 0.37 ksf = 0.99 ksf
Based on Table E3-7.1, the vertical tributary spacing at Level 4 is Svt = 2.50 ft
The panel width, wp, is 5.00 ft (given in Step 1)
The tributary area, Atrib, is computed as follows: Atrib = (2.50 ft)(5.00 ft) = 12.50 ft2
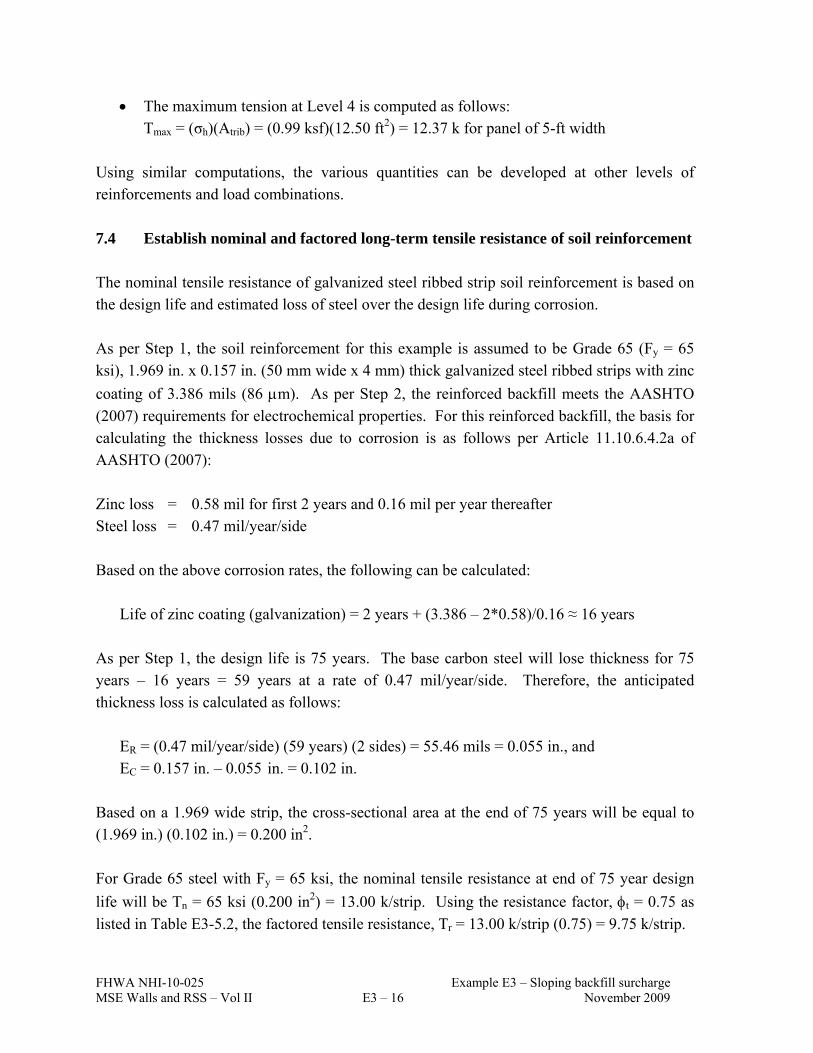
FHWA NHI-10-025 Example E3 – Sloping backfill surcharge MSE Walls and RSS – Vol II E3 – 16 November 2009
The maximum tension at Level 4 is computed as follows: Tmax = (σh)(Atrib) = (0.99 ksf)(12.50 ft2) = 12.37 k for panel of 5-ft width
Using similar computations, the various quantities can be developed at other levels of reinforcements and load combinations.
7.4 Establish nominal and factored long-term tensile resistance of soil reinforcement The nominal tensile resistance of galvanized steel ribbed strip soil reinforcement is based on the design life and estimated loss of steel over the design life during corrosion. As per Step 1, the soil reinforcement for this example is assumed to be Grade 65 (Fy = 65 ksi), 1.969 in. x 0.157 in. (50 mm wide x 4 mm) thick galvanized steel ribbed strips with zinc
coating of 3.386 mils (86 m). As per Step 2, the reinforced backfill meets the AASHTO
(2007) requirements for electrochemical properties. For this reinforced backfill, the basis for calculating the thickness losses due to corrosion is as follows per Article 11.10.6.4.2a of AASHTO (2007): Zinc loss = 0.58 mil for first 2 years and 0.16 mil per year thereafter Steel loss = 0.47 mil/year/side Based on the above corrosion rates, the following can be calculated:
Life of zinc coating (galvanization) = 2 years + (3.386 – 2*0.58)/0.16 ≈ 16 years As per Step 1, the design life is 75 years. The base carbon steel will lose thickness for 75 years – 16 years = 59 years at a rate of 0.47 mil/year/side. Therefore, the anticipated thickness loss is calculated as follows: ER = (0.47 mil/year/side) (59 years) (2 sides) = 55.46 mils = 0.055 in., and
EC = 0.157 in. – 0.055 in. = 0.102 in. Based on a 1.969 wide strip, the cross-sectional area at the end of 75 years will be equal to (1.969 in.) (0.102 in.) = 0.200 in2. For Grade 65 steel with Fy = 65 ksi, the nominal tensile resistance at end of 75 year design
life will be Tn = 65 ksi (0.200 in2) = 13.00 k/strip. Using the resistance factor, t = 0.75 as
listed in Table E3-5.2, the factored tensile resistance, Tr = 13.00 k/strip (0.75) = 9.75 k/strip.
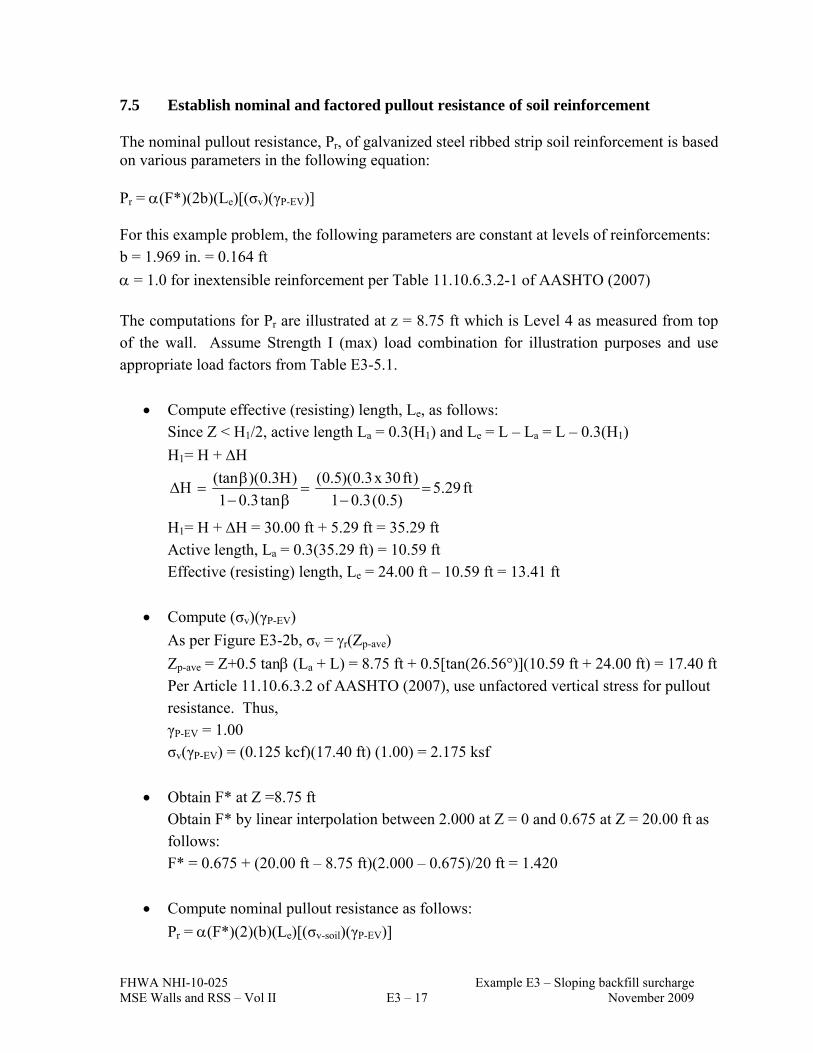
FHWA NHI-10-025 Example E3 – Sloping backfill surcharge MSE Walls and RSS – Vol II E3 – 17 November 2009
7.5 Establish nominal and factored pullout resistance of soil reinforcement The nominal pullout resistance, Pr, of galvanized steel ribbed strip soil reinforcement is based on various parameters in the following equation: Pr = (F*)(2b)(Le)[(σv)(γP-EV)] For this example problem, the following parameters are constant at levels of reinforcements: b = 1.969 in. = 0.164 ft
= 1.0 for inextensible reinforcement per Table 11.10.6.3.2-1 of AASHTO (2007)
The computations for Pr are illustrated at z = 8.75 ft which is Level 4 as measured from top of the wall. Assume Strength I (max) load combination for illustration purposes and use appropriate load factors from Table E3-5.1.
Compute effective (resisting) length, Le, as follows: Since Z < H1/2, active length La = 0.3(H1) and Le = L – La = L – 0.3(H1)
H1= H + H
ft29.5)5.0(3.01
)ft30x3.0)(5.0(
tan3.01
)H3.0)((tanH
H1= H + H = 30.00 ft + 5.29 ft = 35.29 ft
Active length, La = 0.3(35.29 ft) = 10.59 ft Effective (resisting) length, Le = 24.00 ft – 10.59 ft = 13.41 ft
Compute (σv)(γP-EV)
As per Figure E3-2b, σv = r(Zp-ave)
Zp-ave = Z+0.5 tan (La + L) = 8.75 ft + 0.5[tan(26.56°)](10.59 ft + 24.00 ft) = 17.40 ft
Per Article 11.10.6.3.2 of AASHTO (2007), use unfactored vertical stress for pullout resistance. Thus, γP-EV = 1.00 σv(γP-EV) = (0.125 kcf)(17.40 ft) (1.00) = 2.175 ksf
Obtain F* at Z =8.75 ft Obtain F* by linear interpolation between 2.000 at Z = 0 and 0.675 at Z = 20.00 ft as follows: F* = 0.675 + (20.00 ft – 8.75 ft)(2.000 – 0.675)/20 ft = 1.420
Compute nominal pullout resistance as follows:
Pr = (F*)(2)(b)(Le)[(σv-soil)(γP-EV)]

FHWA NHI-10-025 Example E3 – Sloping backfill surcharge MSE Walls and RSS – Vol II E3 – 18 November 2009
Pr = (1.0)(1.420)(2)(0.164 ft)(13.41 ft)(2.175 ksf) = 13.58 k/strip
Compute factored pullout resistance as follows:
Prr = Pr = (0.90)(13.58 k/strip) = 12.23 k/strip
Using similar computations, the various quantities can be developed at other levels of reinforcements and load combinations. 7.6 Establish number of soil reinforcing strips at each level of reinforcement Based on Tmax, Tr and Prr, the number of strip reinforcements at any given level of reinforcements can be computed as follows:
Based on tensile resistance considerations, the number of strip reinforcements, Nt, is computed as follows: Nt = Tmax/Tr
Based on pullout resistance considerations, the number of strip reinforcements, Np, is computed as follows: Np = Tmax/Prr
Using the Level 4 reinforcement at Z = 8.75 ft, the number of strip reinforcements can be computed as follows:
Tmax = 13.13 k for panel of 5-ft width, Tr = 9.75 k/strip, Prr = 12.23 k/strip
Nt = Tmax/Tr = (13.13 k for panel of 5 ft width)/(9.75 k/strip) = 1.35 strips for panel of 5-ft width
Np = Tmax/Prr = (13.13 k for panel of 5 ft width)/(12.23 k/strip) = 1.07 strips for panel of 5-ft width
Since Nt > Np, tension breakage is the governing criteria and therefore the governing value, Ng, is 1.35. Round up to select 2 strips at Level 4 for each panel of 5 ft width.
The computations in Sections 7.4 to 7.6 are repeated at each level of reinforcement. Table E3-7.3 presents the computations at all levels of reinforcement for Strength I (max) load
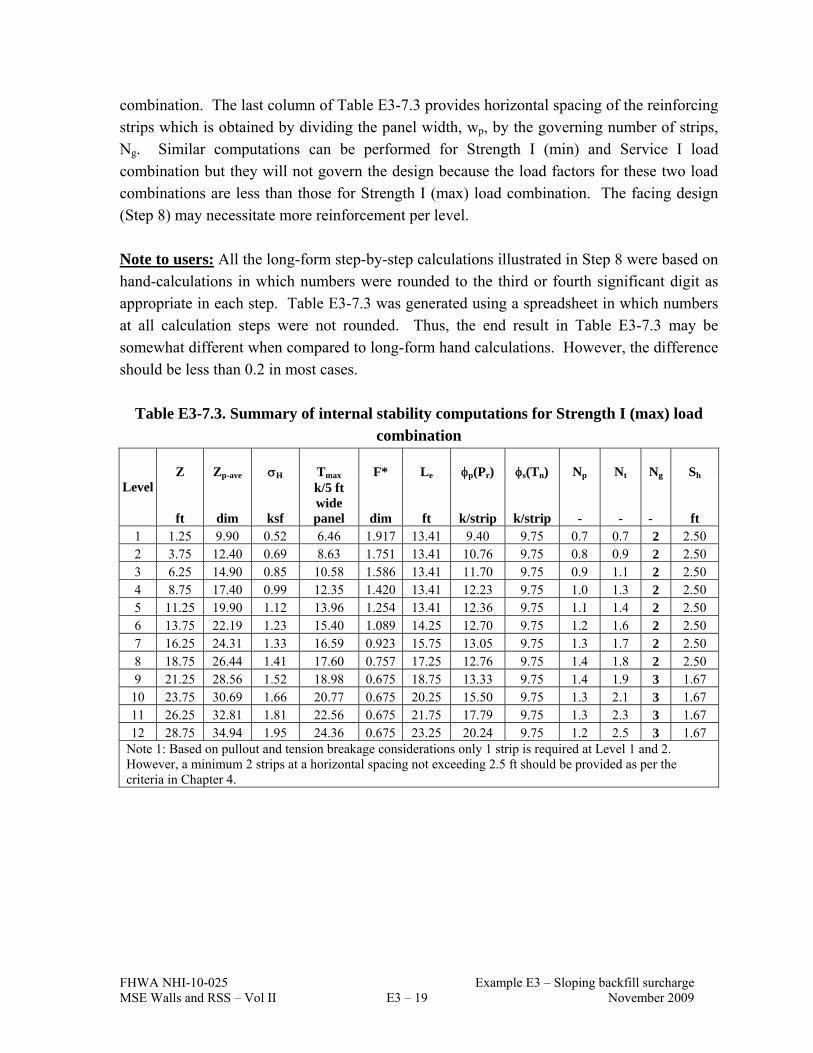
FHWA NHI-10-025 Example E3 – Sloping backfill surcharge MSE Walls and RSS – Vol II E3 – 19 November 2009
combination. The last column of Table E3-7.3 provides horizontal spacing of the reinforcing strips which is obtained by dividing the panel width, wp, by the governing number of strips, Ng. Similar computations can be performed for Strength I (min) and Service I load combination but they will not govern the design because the load factors for these two load combinations are less than those for Strength I (max) load combination. The facing design (Step 8) may necessitate more reinforcement per level. Note to users: All the long-form step-by-step calculations illustrated in Step 8 were based on hand-calculations in which numbers were rounded to the third or fourth significant digit as appropriate in each step. Table E3-7.3 was generated using a spreadsheet in which numbers at all calculation steps were not rounded. Thus, the end result in Table E3-7.3 may be somewhat different when compared to long-form hand calculations. However, the difference should be less than 0.2 in most cases.
Table E3-7.3. Summary of internal stability computations for Strength I (max) load combination
Z Zp-ave H Tmax F* Le p(Pr) s(Tn)
Np
Nt
Ng Sh Level
ft dim ksf
k/5 ft wide panel dim ft k/strip k/strip - - - ft
1 1.25 9.90 0.52 6.46 1.917 13.41 9.40 9.75 0.7 0.7 2 2.50 2 3.75 12.40 0.69 8.63 1.751 13.41 10.76 9.75 0.8 0.9 2 2.50 3 6.25 14.90 0.85 10.58 1.586 13.41 11.70 9.75 0.9 1.1 2 2.50 4 8.75 17.40 0.99 12.35 1.420 13.41 12.23 9.75 1.0 1.3 2 2.50 5 11.25 19.90 1.12 13.96 1.254 13.41 12.36 9.75 1.1 1.4 2 2.50 6 13.75 22.19 1.23 15.40 1.089 14.25 12.70 9.75 1.2 1.6 2 2.50 7 16.25 24.31 1.33 16.59 0.923 15.75 13.05 9.75 1.3 1.7 2 2.50 8 18.75 26.44 1.41 17.60 0.757 17.25 12.76 9.75 1.4 1.8 2 2.50 9 21.25 28.56 1.52 18.98 0.675 18.75 13.33 9.75 1.4 1.9 3 1.67
10 23.75 30.69 1.66 20.77 0.675 20.25 15.50 9.75 1.3 2.1 3 1.67 11 26.25 32.81 1.81 22.56 0.675 21.75 17.79 9.75 1.3 2.3 3 1.67 12 28.75 34.94 1.95 24.36 0.675 23.25 20.24 9.75 1.2 2.5 3 1.67
Note 1: Based on pullout and tension breakage considerations only 1 strip is required at Level 1 and 2. However, a minimum 2 strips at a horizontal spacing not exceeding 2.5 ft should be provided as per the criteria in Chapter 4.
FHWA NHI-10-025 Example E3 – Sloping backfill surcharge MSE Walls and RSS – Vol II E3 – 20 November 2009
STEP 8: DESIGN OF FACING ELEMENTS The precast facing elements must be designed as structural elements with appropriate connection strength as discussed in Chapter 4. Depending on the design of the facing panel, the number of strips at each level may have to be increased.
STEP 9: CHECK OVERALL AND COMPOUND STABILITY AT SERVICE LIMIT
STATE
From Step 2, it is given that the foundation soil is dense clayey sand that has f = 30°, f =
125 pcf. Furthermore, the ground in front of the wall is horizontal and the foundation soil has no water table. Therefore, based on observation, overall stability is adequate. For actual projects, overall stability should be investigated at the Service I load combination and a resistance factor of 0.65.
STEP 10: DESIGN WALL DRAINAGE SYSTEMS Drains are detailed on construction drawings. For a MSE wall with sloping backfill, the drainage system for the MSE wall must be carefully integrated with the other hillside drain systems as appropriate.

FHWA NHI-10-025 Example E4 – Level backfill with LL MSE Walls and RSS – Vol II E4 – 1 November 2009
EXAMPLE E4 SEGMENTAL PRECAST PANEL MSE WALL WITH LEVEL BACKFILL AND
LIVE LOAD SURCHARGE E4-1 INTRODUCTION This example problem demonstrates the analysis of a MSE wall with a level backfill and live load surcharge. The MSE wall is assumed to include a segmental precast panel face with steel grid (bar mat) reinforcements. The MSE wall configuration to be analyzed is shown in Figure E4-1. The analysis is based on various principles that were discussed in Chapter 4. Table E4-1 presents a summary of steps involved in the analysis. Each of the steps and sub-steps is sequential and if the design is revised at any step or sub-step then all the previous computations need to be re-visited. Each of the steps and the sub-steps in Table E4-1 is explained in detail herein. Practical considerations are presented in Section E4-2 after the illustration of the step-by-step procedures.
Table E4-1. Summary of steps in analysis of MSE wall with level backfill and live load surcharge
Step Item 1 Establish project requirements 2 Establish project parameters 3 Estimate wall embedment depth and length of reinforcement 4 Estimate unfactored loads 5 Summarize applicable load and resistance factors 6 Evaluate external stability of MSE wall
6.1 Evaluation of sliding resistance 6.2 Evaluation of limiting eccentricity 6.3 Evaluation of bearing resistance 6.4 Settlement analysis
7 Evaluate internal stability of MSE wall 7.1 Estimate critical failure surface, variation of Kr and F* for internal stability 7.2 Establish vertical layout of soil reinforcements 7.3 Calculate horizontal stress and maximum tension at each reinforcement level 7.4 Establish nominal and factored long-term tensile resistance of soil reinforcement 7.5 Establish nominal and factored pullout resistance of soil reinforcement 7.6 Establish number of soil reinforcing elements at each level of reinforcement
8 Design of facing elements 9 Check overall and compound stability at the service limit state. 10 Design wall drainage system

FHWA NHI-10-025 Example E4 – Level backfill with LL MSE Walls and RSS – Vol II E4 – 2 November 2009
Figure E4-1. Configuration showing various parameters for analysis of a MSE wall with level backfill and live load surcharge (not-to-scale).
STEP 1. ESTABLISH PROJECT REQUIREMENTS
Exposed wall height, He = 23.64 ft
Length of wall = 850 ft
Design life = 75 years
Precast panel units: 5 ft wide x 5 ft tall x 0.5 ft thick
Type of reinforcement: Grade 65 (Fy = 65 ksi), steel bar mat with W15 and W11 wires.
Assume wires to be galvanized with zinc coating of 3.386 mils (86 m).
No seismic considerations
STEP 2. EVALUATE PROJECT PARAMETERS
Reinforced backfill, 'r = 34°, r = 125 pcf, coefficient of uniformity, Cu = 7.0 and
meeting the AASHTO (2007) requirements for electrochemical properties
Retained backfill, 'f = 30°, f = 125 pcf
Foundation soil, dense clayey sand with 'fd = 30°, fd = 125 pcf
Factored Bearing resistance of foundation soil o For service limit consideration, qnf-ser = 7.50 ksf for 1-inch of total settlement o For strength limit consideration, qnf-str = 10.50 ksf
Live load surcharge, heq = 2 ft of soil per Table 3.11.6.4-2 of AASHTO (2007)
Reinforced backfill
'r, γr He H
L d
Retained backfill
'f, γf
Leveling Pad
Foundation Soil
'fd, γfd
Traffic Surcharge
Roadway Surface
FHWA NHI-10-025 Example E4 – Level backfill with LL MSE Walls and RSS – Vol II E4 – 3 November 2009
STEP 3. ESTIMATE DEPTH OF EMBEDMENT AND LENGTH OF REINFORCEMENT
Based on Table C.11.10.2.2.-1 of AASHTO (2007), the minimum embedment depth = H/20 for walls with horizontal ground in front of wall, i.e., 1.2 ft for exposed wall height of 23.64 ft. For this design, assume embedment, d = 2.0 ft. Thus, design height of the wall, H = He + d = 23.64 ft + 2.0 ft = 25.64 ft. Due to the level backfill, the minimum initial length of reinforcement is assumed to be 0.7H or 18 ft. This length will be verified as part of the design process. The length of the reinforcement is assumed to be constant throughout the height to limit differential settlements across the reinforced zone because differential settlements could overstress the reinforcements.
STEP 4. ESTIMATE UNFACTORED LOADS Tables E4-4.1 and E4-4.2 present the equations for unfactored loads and moment arms about Point A shown in Figure E4-2. The moments are a product of the respective forces and moment arms. Each force is assigned a designation representing the applicable load type as per Tables 3.4.1-1 and 3.4.1-2 of AASHTO (2007).
To compute the numerical values of various forces and moments, the parameters provided in Step 2 are used. Using the values of the various friction angles, the coefficients of lateral earth pressure are as follows: Kar = (1 - sin34°)/(1 + sin34°) = 0.283 Kaf = (1 - sin30°)/(1 + sin30°) = 0.333
For the example problem, Tables E4-4.3 and E4-4.4 summarize the numerical values unfactored forces and moments, respectively, based on the equations, various dimensions and values of lateral earth pressure coefficients presented above. Refer to Figure E4-2 for notations of various forces.

FHWA NHI-10-025 Example E4 – Level backfill with LL MSE Walls and RSS – Vol II E4 – 4 November 2009
Figure E4-2. Legend for computation of forces and moments (not-to-scale).
(a)
(b)
A

FHWA NHI-10-025 Example E4 – Level backfill with LL MSE Walls and RSS – Vol II E4 – 5 November 2009
The unfactored forces and moments in Tables E4-4.3 and E4-4.4 form the basis of all computations in this example problem. The unfactored forces and moments should be multiplied by the appropriate load factors based on the load types identified in the second column of the Tables E4-4.1 and E4-4.2 to perform the analysis for various load combinations such as Strength I, Service I, etc. The load factors for various load types relevant to this example problem are discussed in Step 5.
Table E4-4.1. Equations of computing unfactored vertical forces and moments
Moment arm (Length units)
Vertical Force (Force/length units)
LRFD Load Type
@ Point A V1 = (γr)(H)(L) EV L/2 VS = (γf)(heq)(L) = (q)L LL L/2 Note: heq is the equivalent height of soil such that q = (γf)(heq)
Table E4-4.2. Equations of computing unfactored horizontal forces and moments
Moment arm (Length units)
Horizontal Force (Force/length)
LRFD Load Type
@ Point A F1 = ½(Kaf)(γf)H
2 EH H/3 F2 = (Kaf)[(γf)(heq)](H) LL H/2
Table E4-4.3. Unfactored vertical forces and moments
Force Value k/ft
Moment Arm @
Point A, ft Moment
Moment at Point A, k-ft/ft
V1 = 57.69 9.00 MV1 = 519.21
Vs = 4.50 9.00 MVs = 40.50 Note: Vs is based on heq of 2 ft per Table 3.11.6.4-1 of AASHTO (2007).
Table E4-4.4. Unfactored horizontal forces and moments
Force Value k/ft
Moment Arm @
Point A, ft Moment
Moment at Point A, k-ft/ft
F1 = 13.68 8.55 MF1 = 116.94
F2 = 2.13 12.82 MF2 = 27.36

FHWA NHI-10-025 Example E4 – Level backfill with LL MSE Walls and RSS – Vol II E4 – 6 November 2009
STEP 5. SUMMARIZE APPLICABLE LOAD AND RESISTANCE FACTORS Table E4-5.1 summarizes the load factors for the various LRFD load type shown in second column of Tables E4-4.1 and E4-4.2. Throughout the computations in this example
problem, the forces and moments in Tables E4-4.1 and E4-4.2 should be multiplied by appropriate load factors. For example, if computations are being done for Strength I (maximum) load combination, the forces and moments corresponding to load V1 should be multiplied by 1.35 which is associated with load type EV assigned to load V1.
Table E4-5.1. Summary of applicable load factors Load Factors
(after AASHTO, 2007 Tables 3.4.1-1 and 3.4.1-2) Load Combination EV EH LL
Strength I (maximum) 1.35 1.50 1.75 Strength I (minimum) 1.00 0.90 1.75 Service I 1.00 1.00 1.00
For computation of factored resistances during evaluation of strength limits states, appropriate resistance factors have to be used. Table E4-5.2 summarizes the applicable resistance factors. For service limit state, all resistance factors are equal to 1.0.
Table E4-5.2. Summary of applicable resistance factors for evaluation of resistances
Item Resistance
Factors AASHTO (2007)
Reference Sliding of MSE wall on foundation soil s = 1.00 Table 11.5.6-1 Bearing resistance b = 0.65 Table 11.5.6-1 Tensile resistance (for steel bar mats) t = 0.65 Table 11.5.6-1 Pullout resistance p = 0.90 Table 11.5.6-1 STEP 6. EVALUATE EXTERNAL STABILITY OF MSE WALL The external stability of MSE wall is a function of the various forces and moments shown in Figure E4-2. In the LRFD context the forces and moments need to be categorized into various load types. The primary load types for this example problem are soil loads (EV, EH) and live load (LL).
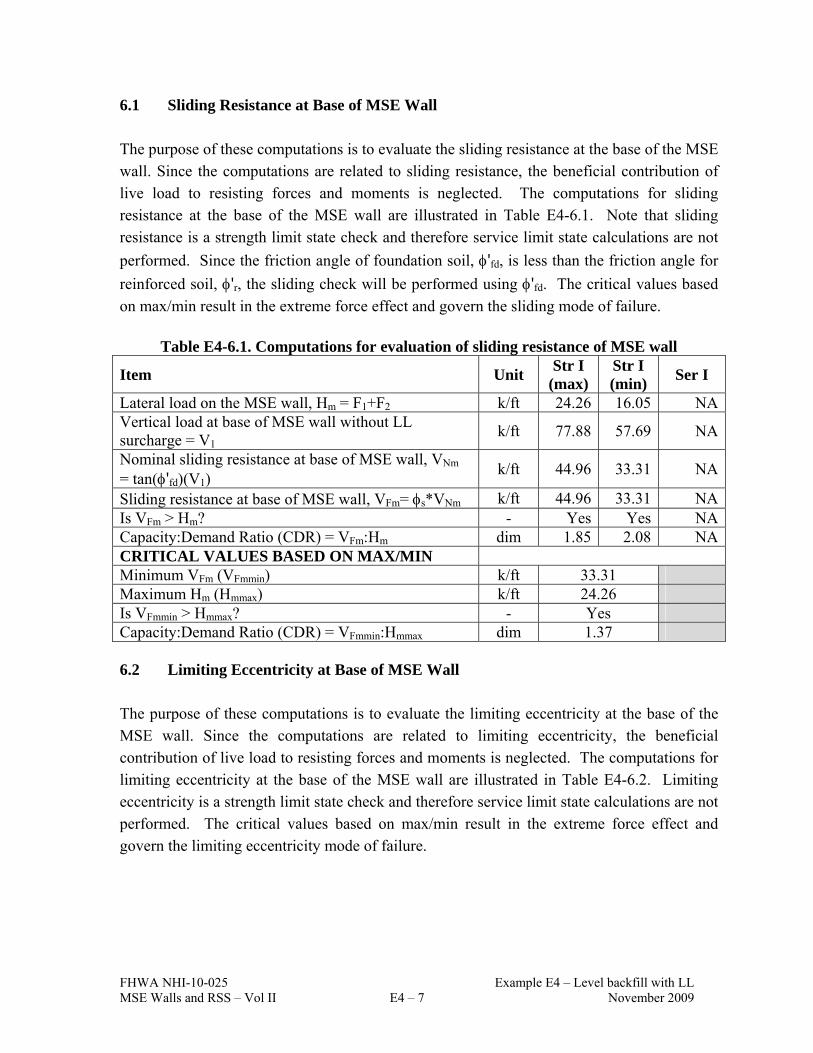
FHWA NHI-10-025 Example E4 – Level backfill with LL MSE Walls and RSS – Vol II E4 – 7 November 2009
6.1 Sliding Resistance at Base of MSE Wall The purpose of these computations is to evaluate the sliding resistance at the base of the MSE wall. Since the computations are related to sliding resistance, the beneficial contribution of live load to resisting forces and moments is neglected. The computations for sliding resistance at the base of the MSE wall are illustrated in Table E4-6.1. Note that sliding resistance is a strength limit state check and therefore service limit state calculations are not
performed. Since the friction angle of foundation soil, 'fd, is less than the friction angle for
reinforced soil, 'r, the sliding check will be performed using 'fd. The critical values based
on max/min result in the extreme force effect and govern the sliding mode of failure.
Table E4-6.1. Computations for evaluation of sliding resistance of MSE wall
Item Unit Str I
(max) Str I (min)
Ser I
Lateral load on the MSE wall, Hm = F1+F2 k/ft 24.26 16.05 NAVertical load at base of MSE wall without LL surcharge = V1
k/ft 77.88 57.69 NA
Nominal sliding resistance at base of MSE wall, VNm = tan('fd)(V1)
k/ft 44.96 33.31 NA
Sliding resistance at base of MSE wall, VFm= s*VNm k/ft 44.96 33.31 NAIs VFm > Hm? - Yes Yes NACapacity:Demand Ratio (CDR) = VFm:Hm dim 1.85 2.08 NACRITICAL VALUES BASED ON MAX/MIN Minimum VFm (VFmmin) k/ft 33.31 Maximum Hm (Hmmax) k/ft 24.26 Is VFmmin > Hmmax? - Yes Capacity:Demand Ratio (CDR) = VFmmin:Hmmax dim 1.37 6.2 Limiting Eccentricity at Base of MSE Wall The purpose of these computations is to evaluate the limiting eccentricity at the base of the MSE wall. Since the computations are related to limiting eccentricity, the beneficial contribution of live load to resisting forces and moments is neglected. The computations for limiting eccentricity at the base of the MSE wall are illustrated in Table E4-6.2. Limiting eccentricity is a strength limit state check and therefore service limit state calculations are not performed. The critical values based on max/min result in the extreme force effect and govern the limiting eccentricity mode of failure.

FHWA NHI-10-025 Example E4 – Level backfill with LL MSE Walls and RSS – Vol II E4 – 8 November 2009
Table E4-6.2. Computations for evaluation of limiting eccentricity for MSE wall
Item Unit Str I
(max) Str I (min)
Ser I
Total vertical load at base of MSE wall without LL, VA = V1
k/ft 77.88 57.69 N/A
Resisting moments about Point A without LL surcharge= MRA = MV1
k-ft/ft 700.93 519.21 N/A
Overturning moments about Point A = MOA = MF1+MF2
k-ft/ft 223.30 153.13 N/A
Net moment about Point A = MA = MRA – MOA k-ft/ft 477.64 366.08 N/ALocation of the resultant force on base of MSE wall from Point A, a = MA/VA
ft 6.13 6.35 N/A
Eccentricity at base of MSE wall, eL = L/2 – a ft 2.87 2.65 N/ALimiting eccentricity, e = L/4 for strength limit state ft 4.50 4.50 N/AIs the resultant within limiting value of e? - Yes Yes N/ACalculated eL/L - 0.16 0.15 N/ACRITICAL VALUES BASED ON MAX/MIN Overturning moments about Point A, MOA-C k-ft/ft 223.30 Resisting moments about Point A, MRA-C k-ft/ft 519.21* Net moment about Point A, MA-C = MRA-C - MOA-C k-ft/ft 295.91 Vertical force, VA-C k/ft 57.69* Location of resultant from Point A, anl = MA-C/VA-C ft 5.13 Eccentricity from center of wall base, eL=0.5*L - anl ft 3.87 Limiting eccentricity, e = L/4 ft 4.50 Is the limiting eccentricity criteria satisfied? - Yes Effective width of base of MSE wall, B' = L-2eL ft 10.26 Calculated eL/L - 0.22 Note: *519.21 and 57.69 are consistent values based on the mass of reinforced soil block 6.3 Bearing Resistance at base of MSE Wall For bearing resistance computations, the effect of live load is included since it creates larger bearing stresses. The bearing stress at the base of the MSE wall can be computed as follows:
Lv e2L
V
where ΣV = R = V1 + VS is the resultant of vertical forces and the load eccentricity eL is calculated by principles of statics using appropriate loads and moments with the applicable load factors. In LRFD, σv is compared with the factored bearing resistance when computed for strength limit state and used for settlement analysis when computed for service limit state. The
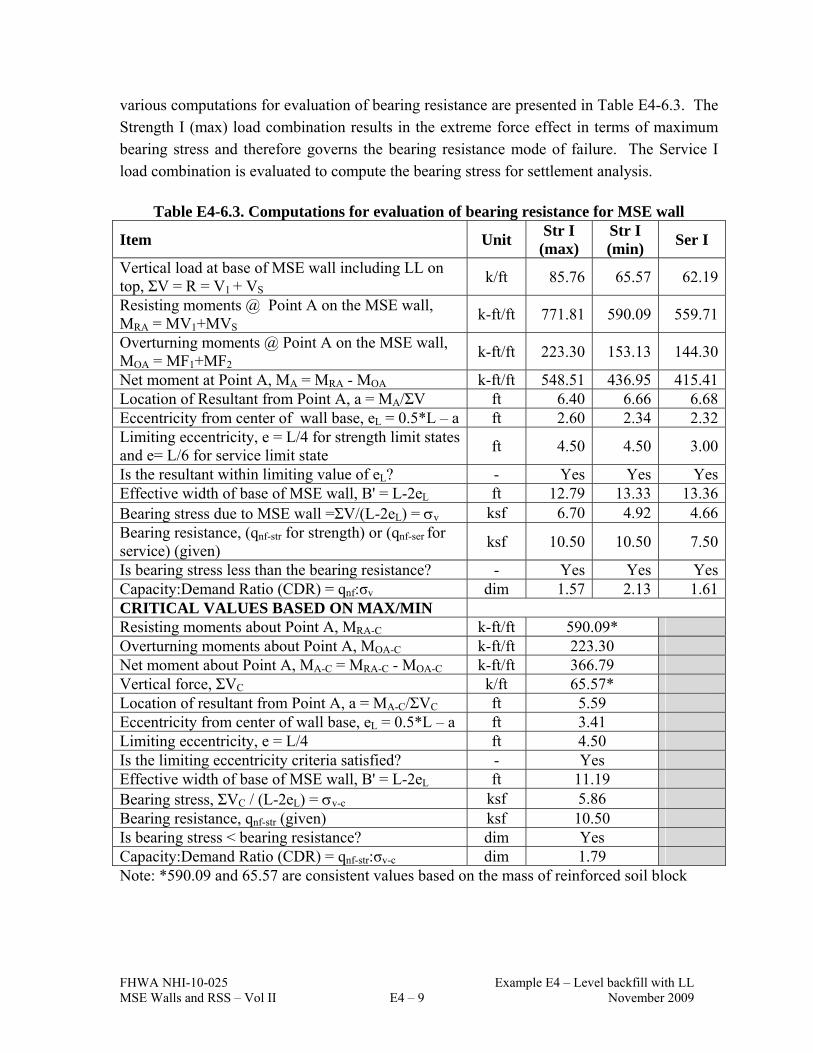
FHWA NHI-10-025 Example E4 – Level backfill with LL MSE Walls and RSS – Vol II E4 – 9 November 2009
various computations for evaluation of bearing resistance are presented in Table E4-6.3. The Strength I (max) load combination results in the extreme force effect in terms of maximum bearing stress and therefore governs the bearing resistance mode of failure. The Service I load combination is evaluated to compute the bearing stress for settlement analysis.
Table E4-6.3. Computations for evaluation of bearing resistance for MSE wall
Item Unit Str I
(max) Str I (min)
Ser I
Vertical load at base of MSE wall including LL on top, ΣV = R = V1 + VS
k/ft 85.76 65.57 62.19
Resisting moments @ Point A on the MSE wall, MRA = MV1+MVS
k-ft/ft 771.81 590.09 559.71
Overturning moments @ Point A on the MSE wall, MOA = MF1+MF2
k-ft/ft 223.30 153.13 144.30
Net moment at Point A, MA = MRA - MOA k-ft/ft 548.51 436.95 415.41Location of Resultant from Point A, a = MA/ΣV ft 6.40 6.66 6.68Eccentricity from center of wall base, eL = 0.5*L – a ft 2.60 2.34 2.32Limiting eccentricity, e = L/4 for strength limit states and e= L/6 for service limit state
ft 4.50 4.50 3.00
Is the resultant within limiting value of eL? - Yes Yes YesEffective width of base of MSE wall, B' = L-2eL ft 12.79 13.33 13.36Bearing stress due to MSE wall =ΣV/(L-2eL) = v ksf 6.70 4.92 4.66Bearing resistance, (qnf-str for strength) or (qnf-ser for service) (given)
ksf 10.50 10.50 7.50
Is bearing stress less than the bearing resistance? - Yes Yes YesCapacity:Demand Ratio (CDR) = qnf:σv dim 1.57 2.13 1.61CRITICAL VALUES BASED ON MAX/MIN Resisting moments about Point A, MRA-C k-ft/ft 590.09* Overturning moments about Point A, MOA-C k-ft/ft 223.30 Net moment about Point A, MA-C = MRA-C - MOA-C k-ft/ft 366.79 Vertical force, ΣVC k/ft 65.57* Location of resultant from Point A, a = MA-C/ΣVC ft 5.59 Eccentricity from center of wall base, eL = 0.5*L – a ft 3.41 Limiting eccentricity, e = L/4 ft 4.50 Is the limiting eccentricity criteria satisfied? - Yes Effective width of base of MSE wall, B' = L-2eL ft 11.19 Bearing stress, ΣVC / (L-2eL) = v-c ksf 5.86 Bearing resistance, qnf-str (given) ksf 10.50 Is bearing stress < bearing resistance? dim Yes Capacity:Demand Ratio (CDR) = qnf-str:σv-c dim 1.79 Note: *590.09 and 65.57 are consistent values based on the mass of reinforced soil block
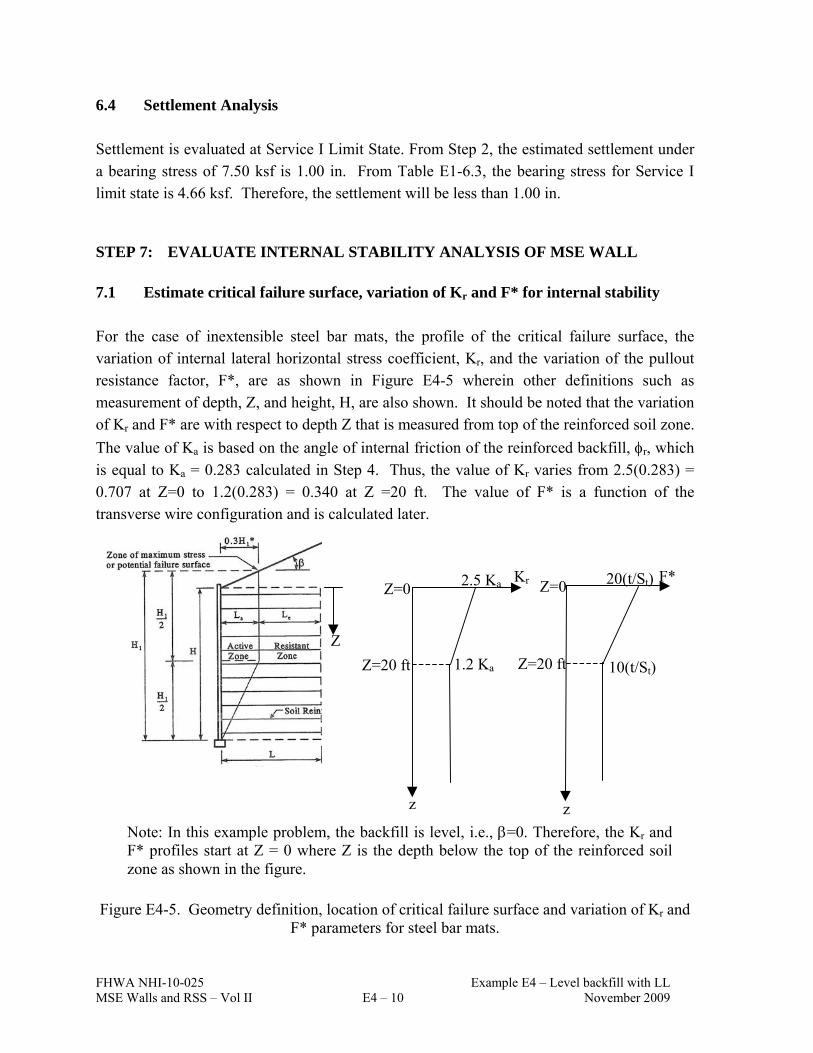
FHWA NHI-10-025 Example E4 – Level backfill with LL MSE Walls and RSS – Vol II E4 – 10 November 2009
6.4 Settlement Analysis Settlement is evaluated at Service I Limit State. From Step 2, the estimated settlement under a bearing stress of 7.50 ksf is 1.00 in. From Table E1-6.3, the bearing stress for Service I limit state is 4.66 ksf. Therefore, the settlement will be less than 1.00 in.
STEP 7: EVALUATE INTERNAL STABILITY ANALYSIS OF MSE WALL
7.1 Estimate critical failure surface, variation of Kr and F* for internal stability For the case of inextensible steel bar mats, the profile of the critical failure surface, the variation of internal lateral horizontal stress coefficient, Kr, and the variation of the pullout resistance factor, F*, are as shown in Figure E4-5 wherein other definitions such as measurement of depth, Z, and height, H, are also shown. It should be noted that the variation of Kr and F* are with respect to depth Z that is measured from top of the reinforced soil zone.
The value of Ka is based on the angle of internal friction of the reinforced backfill, r, which
is equal to Ka = 0.283 calculated in Step 4. Thus, the value of Kr varies from 2.5(0.283) = 0.707 at Z=0 to 1.2(0.283) = 0.340 at Z =20 ft. The value of F* is a function of the transverse wire configuration and is calculated later.
Figure E4-5. Geometry definition, location of critical failure surface and variation of Kr and F* parameters for steel bar mats.
Z
z
Z=20 ft
Kr F*Z=0 Z=0 2.5 Ka
1.2 Ka
20(t/St)
Z=20 ft
z
10(t/St)
Note: In this example problem, the backfill is level, i.e., =0. Therefore, the Kr and F* profiles start at Z = 0 where Z is the depth below the top of the reinforced soil zone as shown in the figure.

FHWA NHI-10-025 Example E4 – Level backfill with LL MSE Walls and RSS – Vol II E4 – 11 November 2009
7.2 Establish vertical layout of soil reinforcements Using the definition of depth Z as shown in Figure E4-5 the following vertical layout of the soil reinforcements is chosen. Z = 1.87 ft, 4.37 ft, 6.87 ft, 9.37 ft, 11.87 ft, 14.37 ft, 16.87 ft, 19.37 ft, 21.87 ft, and 24.37 ft The above layout leads to 10 levels of reinforcements. The vertical spacing was chosen based on a typical vertical spacing, Sv, of approximately 2.5 ft that is commonly used in the industry for steel grid (bar mat) reinforcement. The vertical spacing near the top and bottom of the walls are locally adjusted as necessary to fit the height of the wall. For internal stability computations, each layer of reinforcement is assigned a tributary area, Atrib as follows Atrib = (wp)(Svt) where wp is the panel width of the precast facing element and Svt is the vertical tributary spacing of the reinforcements based on the location of the reinforcements above and below the level of the reinforcement under consideration. The computation of Svt is summarized in
Table E4-7.1 wherein zzSvt . Note that wp = 5.00 ft per Step 1.
Table E4-7.1. Summary of computations for Svt
Level Z (ft) Z (ft) Z (ft) Svt (ft)
1 1.87 0 1.87+0.5(4.37–1.87)=3.12 3.12
2 4.37 4.37-0.5(4.37–1.87)=3.12 4.37+0.5(6.87-4.37)=5.62 2.50 3 6.87 6.87-0.5(6.87-4.37)=5.62 6.87+0.5(9.37-6.87)=8.12 2.50 4 9.37 9.37-0.5(9.37-6.87)=8.12 9.37+0.5(11.87-9.37)=10.62 2.50 5 11.87 11.87-0.5(11.87-9.37)=10.62 11.87+0.5(14.37-11.87)=13.12 2.50 6 14.37 14.37-0.5(14.37-11.87)=13.12 14.37+0.5(16.87-14.37)=15.62 2.50 7 16.87 16.87-0.5(16.87-14.37)=15.62 16.87+0.5(19.37-16.87)=18.12 2.50 8 19.37 19.37-0.5(19.37-16.87)=18.12 19.37+0.5(21.87-19.37)=20.62 2.50 9 21.87 21.87-0.5(21.87-19.37)=20.62 21.87+0.5(24.37-21.87)=23.12 2.50 10 24.37 24.37-0.5(24.37-21.87)=23.12 25.64 2.52
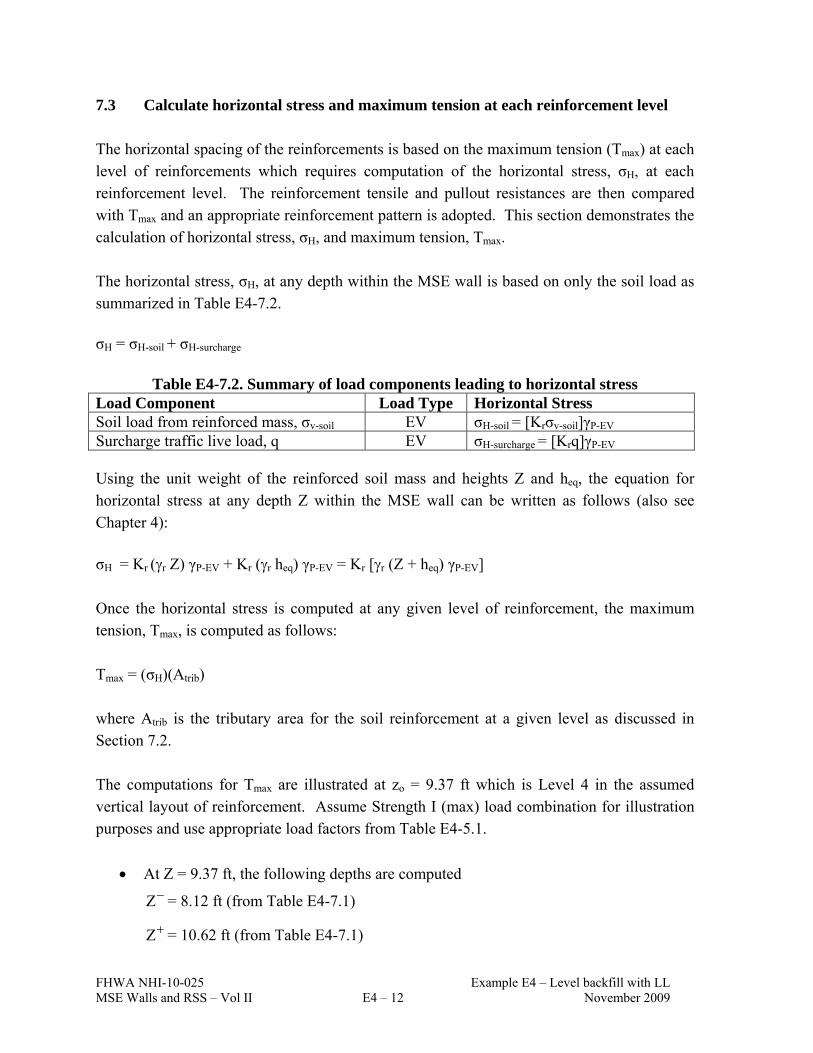
FHWA NHI-10-025 Example E4 – Level backfill with LL MSE Walls and RSS – Vol II E4 – 12 November 2009
7.3 Calculate horizontal stress and maximum tension at each reinforcement level The horizontal spacing of the reinforcements is based on the maximum tension (Tmax) at each level of reinforcements which requires computation of the horizontal stress, σH, at each reinforcement level. The reinforcement tensile and pullout resistances are then compared with Tmax and an appropriate reinforcement pattern is adopted. This section demonstrates the calculation of horizontal stress, σH, and maximum tension, Tmax. The horizontal stress, σH, at any depth within the MSE wall is based on only the soil load as summarized in Table E4-7.2. σH = σH-soil + σH-surcharge
Table E4-7.2. Summary of load components leading to horizontal stress
Load Component Load Type Horizontal Stress Soil load from reinforced mass, σv-soil EV σH-soil = [Krσv-soil]γP-EV Surcharge traffic live load, q EV σH-surcharge = [Krq]γP-EV Using the unit weight of the reinforced soil mass and heights Z and heq, the equation for horizontal stress at any depth Z within the MSE wall can be written as follows (also see Chapter 4): σH = Kr (r Z) γP-EV + Kr (r heq) γP-EV = Kr [r (Z + heq) γP-EV]
Once the horizontal stress is computed at any given level of reinforcement, the maximum tension, Tmax, is computed as follows: Tmax = (σH)(Atrib) where Atrib is the tributary area for the soil reinforcement at a given level as discussed in Section 7.2. The computations for Tmax are illustrated at zo = 9.37 ft which is Level 4 in the assumed vertical layout of reinforcement. Assume Strength I (max) load combination for illustration purposes and use appropriate load factors from Table E4-5.1.
At Z = 9.37 ft, the following depths are computed Z = 8.12 ft (from Table E4-7.1)
Z = 10.62 ft (from Table E4-7.1)

FHWA NHI-10-025 Example E4 – Level backfill with LL MSE Walls and RSS – Vol II E4 – 13 November 2009
Obtain Kr by linear interpolation between 1.7Ka = 0.707 at Z = 0 and 1.2Ka = 0.340 at Z = 20.00 ft as follows:
At Z = 8.12 ft, Kr(z-)= 0.340 + (20.00 ft – 8.12 ft)(0.707-0.340)/20.00 ft = 0.558
At Z = 10.62 ft, Kr(z+)= 0.340 + (20.00 ft – 10.62 ft)(0.707-0.340)/20.00 ft = 0.512
Compute σH-soil = [kr σv-soil]γP-EV as follows: γP-EV = 1.35 from Table E4-5.1
At Z = 8.12 ft,
v-soil(Z-) = (0.125 kcf)(8.12 ft) = 1.02 ksf
σH-soil(Z-) = [Kr(z-)σv-soil(z-)]γP-EV = (0.558)(1.02 ksf)(1.35) = 0.76 ksf
At Z = 10.62 ft,
v-soil(Z+) = (0.125 kcf)(10.62 ft) = 1.33 ksf
σH-soil(Z+) = [Kr(z+)σv-soil(z+)]γP-EV = (0.512)(1.33 ksf)(1.35) = 0.92 ksf σH-soil = 0.5(0.76 ksf + 0.92 ksf) = 0.84 ksf
Compute σH-surcharge = [Kr q] γP-EV as follows: γP-EV = 1.35 from Table E4-5.1 q = (γf)(heq) = (0.125 kcf)(2.00 ft) = 0.25 ksf
At Z = 8.12 ft, σH-surcharge(Z-) = [Kr(Z-) q] γP-EV = (0.558)(0.25 ksf)(1.35) = 0.19 ksf
At Z = 10.62 ft, σH-surcharge(Z+) = [Kr(Z+) q] γP-EV = (0.512)(0.25 ksf)(1.35) = 0.17 ksf
σH-surcharge = 0.5(0.19 ksf + 0.17 ksf) = 0.18 ksf
Compute σH = σH-soil + σH-surcharge as follows: σH = 0.84 ksf + 0.18 ksf = 1.02 ksf
Based on Table E4-7.1, the vertical tributary spacing at Level 4 is Svt = 2.50 ft
The panel width, wp, is 5.00 ft (given in Step 1)
The tributary area, Atrib, is computed as follows: Atrib = (2.50 ft)(5.00 ft) = 12.50 ft2
The maximum tension at Level 4 is computed as follows: Tmax = (σh)(Atrib) = (1.02 ksf)(12.50 ft2) = 12.75 k/panel of 5-ft width

FHWA NHI-10-025 Example E4 – Level backfill with LL MSE Walls and RSS – Vol II E4 – 14 November 2009
Using similar computations, the various quantities can be developed at other levels of reinforcements and load combinations.
7.4 Establish nominal and factored long-term tensile resistance of soil reinforcement The nominal tensile resistance of galvanized steel bar mat soil reinforcement is based on the design life and estimated loss of steel over the design life during corrosion. The nominal diameters, D, of W15 and W11 wires are as follows:
For W15 wires, D = 0.437 in. = 11.10 mm = 11,100 m
For W11 wires, D = 0.374 in. = 9.50 mm = 9,500 m
As per Step 2, the reinforced backfill meets the AASHTO (2007) requirements for electrochemical properties. For this reinforced backfill, the basis for calculating the thickness losses due to corrosion is as follows per Article 11.10.6.4.2a of AASHTO (2007): Zinc loss = 0.58 mil for first 2 years and 0.16 mil per year thereafter Steel loss = 0.16 mil/year/side Based on the above corrosion rates, the following can be calculated:
Life of zinc coating (galvanization) = 2 years + (3.386 – 2*0.58)/0.16 ≈ 16 years As per Step 1, the design life is 75 years. The base carbon steel will lose thickness for 75 years – 16 years = 59 years at a rate of 0.47 mil/year/side. Therefore, the anticipated diameter and area after 75 years for W15 and W11 is calculated as follows: For W15 wires D75 = 0.437 in. – (0.47 mil/year/side) (59 years) (2 sides)/1000 = 0.437 in. – 0.056 in. D75 = 0.381 in. Based on a 0.381 in. diameter wire, the cross-sectional area at the end of 75 years will be
equal to ()(0.381 in.)2/4 = 0.1142 in2/wire
For W11 wires D75 = 0.374 in. – (0.47 mil/year/side) (59 years) (2 sides) = 0.374 in. – 0.056 in. D75 = 0.318 in.

FHWA NHI-10-025 Example E4 – Level backfill with LL MSE Walls and RSS – Vol II E4 – 15 November 2009
Based on a 0.318 in. diameter wire, the cross-sectional area at the end of 75 years will be
equal to ()(0.318 in.)2/4 = 0.0795 in2/wire
For Grade 65 steel with Fy = 65 ksi, the nominal tensile resistance, Tn, and factored tensile resistance, Tr, for the W15 and W11 wires will be as follows: For W15 wires Tn = 65 ksi (0.1142 in2) = 7.42 k/wire.
Using the resistance factor, t = 0.65 as listed in Table E4-5.2, the factored tensile resistance,
Tr = 7.42 k/wire (0.65) = 4.82 k/wire.
For W11 wires Tn = 65 ksi (0.0795 in2) = 5.17 k/wire.
Using the resistance factor, t = 0.65 as listed in Table E4-5.2, the factored tensile resistance,
Tr = 5.14 k/wire (0.65) = 3.36 k/wire.
7.5 Establish nominal and factored pullout resistance of soil reinforcement The nominal pullout resistance, Pr, of galvanized steel bar mat (grid) reinforcement is based on various parameters in the following equation:
Pr = (F*)(2b)(Le)[(σv-soil)(γP-EV)]
In the above equation, the contribution of live load is not included as per Figure E4-2b.
Since the steel bar mat has welded connections, it can be considered inextensible with = 1.
Assume a W11 transverse wire which has a nominal diameter of 0.374 in. The transverse spacing of transverse wires, St, is varied depending on the level of reinforcement to optimize the design from an economical perspective. For this example problem, assume that the spacing of the transverse wires, St = 6 in., 12 in. and 18 in. Based on these spacing, the value of t/St is as follows: For, St = 6 in., t/St = 0.374 in./6 in. = 0.0623 For, St = 12 in., t/St = 0.374 in./12 in. = 0.0312 For, St = 18 in., t/St = 0.374 in./18 in. = 0.0208

FHWA NHI-10-025 Example E4 – Level backfill with LL MSE Walls and RSS – Vol II E4 – 16 November 2009
Based on the value of t/St, the F* parameter varies from 20(t/St) at z = 0 ft to 10(t/St) at z ≥ 20 ft and greater as shown in Figure E4-5. For the three value of t/St the variation of F* is as follows: For t/St = 0.0623, F* = 1.2460 at Z = 0 ft and F* = 0.623 at Z ≥ 20 ft For t/St = 0.0312, F* = 0.623 at Z = 0 ft and F* = 0.312 at Z ≥ 20 ft For t/St = 0.0208, F* = 0.416 at Z = 0 ft and F* = 0.208 at Z ≥ 20 ft Assume bar mat width, b = 1 ft for computing pullout resistance on a per foot width basis. The actual bar mat width will be computed based on comparison of the pullout resistance with Tmax. For this example problem, assume the layout of longitudinal and transverse wires as shown in Table E4-7.3. The number of longitudinal wires and thus the width of the bar mats will be determined in Section 7.6.
Table E4-7.3. Assumed bar mat configuration for internal stability analysis
Level Longitudinal wire Transverse wire Spacing of transverse wires, St
1 to 4 W11 W11 6 in.
5 to 7 W15 W11 12 in.
8 to 10 W15 W11 18 in.
The computations for Pr are illustrated at z = 9.37 ft which is Level 4 as measured from top of the wall. Assume Strength I (max) load combination for illustration purposes and use appropriate load factors from Table E4-5.1.
Obtain F* at z = 9.37 ft by linear interpolation between 1.2460 at Z = 0 and 0.623 at Z = 20 ft as follows: F* = 0.623 + (20.00 ft – 9.37 ft)(1.246 – 0.623)/20 ft = 0.955
Compute effective length Le as follows: Since Z < H/2, Le = L – 0.3(H) Le = 18 ft – 0.3(25.64 ft) = 10.31 ft
Compute (σv-soil)(γP-EV) Per Article 11.10.6.3.2 of AASHTO (2007), use unfactored vertical stress for pullout resistance. Thus, γP-EV = 1.00 (σv-soil)(γP-EV) = (0.125 kcf)(9.37 ft)(1.00) = 1.171 ksf

FHWA NHI-10-025 Example E4 – Level backfill with LL MSE Walls and RSS – Vol II E4 – 17 November 2009
Compute nominal pullout resistance as follows:
Pr = (F*)(2b)(Le)[(σv-soil)(γP-EV)]
Pr = (1.0)(0.955)(2)(1.00 ft)(10.31 ft)(1.171 ksf) = 23.06 k/ft
Compute factored pullout resistance as follows:
Prr = Pr = (0.90)(23.06 k/ft) = 20.75 k/ft
Using similar computations, the various quantities can be developed at other levels of reinforcements and load combinations.
7.6 Establish number of longitudinal wires at each level of reinforcement Based on Tmax, Tr and Prr, the number of longitudinal wires at any given level of reinforcements can be computed as follows:
Assume spacing of the longitudinal wires, Sl = 6 in. = 0.5 ft
Based on tensile resistance considerations, the number of longitudinal, Nt, is computed as follows: Nt = Tmax/Tr
Based on pullout resistance considerations, the number of longitudinal wires, Np, is computed as follows: Np = 1 + (Tmax/Prr)/(Sl)
Using the Level 4 reinforcement at Z = 9.37 ft, the number of W11 longitudinal wires for 5 ft wide panel can be computed as follows:
Tmax = 12.75 k/panel of 5 ft width, Tr = 3.36 k/wire, Prr = 20.75 k/ft
Nt = Tmax/Tr = (12.75 k/panel of 5 ft width)/(3.36 k/wire) = 3.8 longitudinal wires/panel of 5 ft width
Np = 1 + (Tmax/Prr)/(Sl) = 1 + [(12.75 k/panel of 5 ft width)/(20.75 k/ft)]/(0.5 ft) = 2.2 longitudinal wires/panel
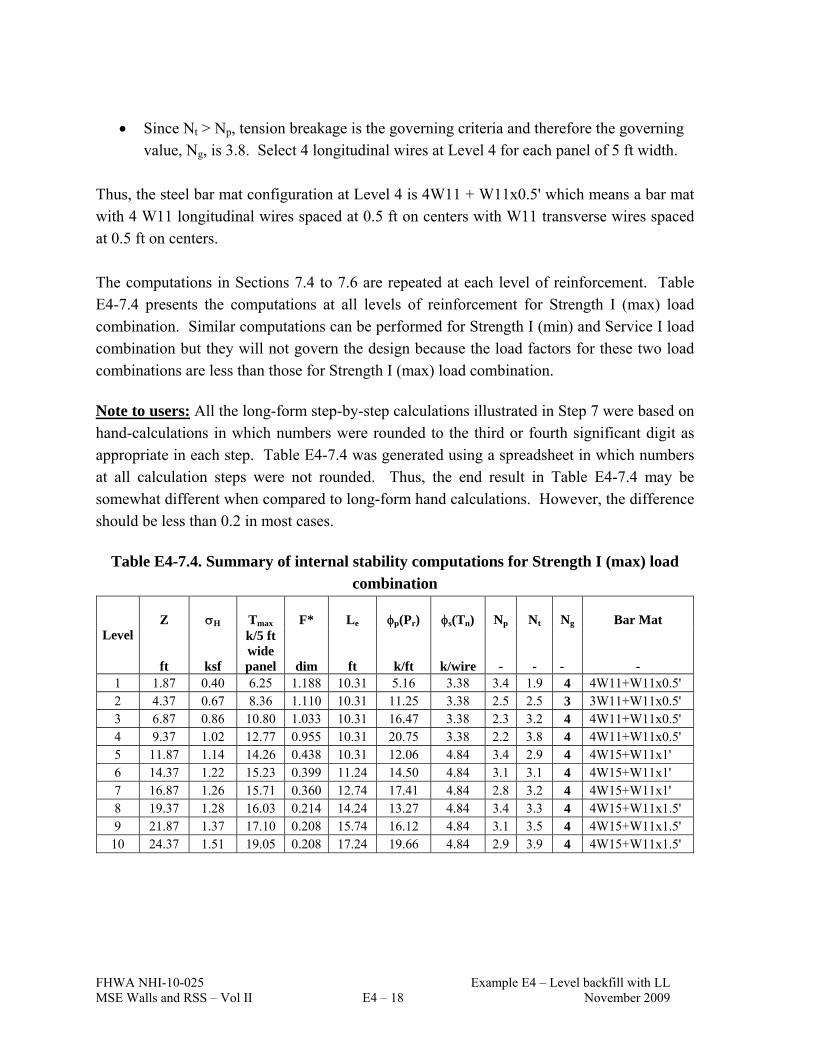
FHWA NHI-10-025 Example E4 – Level backfill with LL MSE Walls and RSS – Vol II E4 – 18 November 2009
Since Nt > Np, tension breakage is the governing criteria and therefore the governing value, Ng, is 3.8. Select 4 longitudinal wires at Level 4 for each panel of 5 ft width.
Thus, the steel bar mat configuration at Level 4 is 4W11 + W11x0.5' which means a bar mat with 4 W11 longitudinal wires spaced at 0.5 ft on centers with W11 transverse wires spaced at 0.5 ft on centers. The computations in Sections 7.4 to 7.6 are repeated at each level of reinforcement. Table E4-7.4 presents the computations at all levels of reinforcement for Strength I (max) load combination. Similar computations can be performed for Strength I (min) and Service I load combination but they will not govern the design because the load factors for these two load combinations are less than those for Strength I (max) load combination. Note to users: All the long-form step-by-step calculations illustrated in Step 7 were based on hand-calculations in which numbers were rounded to the third or fourth significant digit as appropriate in each step. Table E4-7.4 was generated using a spreadsheet in which numbers at all calculation steps were not rounded. Thus, the end result in Table E4-7.4 may be somewhat different when compared to long-form hand calculations. However, the difference should be less than 0.2 in most cases.
Table E4-7.4. Summary of internal stability computations for Strength I (max) load combination
Z H Tmax F* Le p(Pr) s(Tn)
Np
Nt
Ng Bar Mat Level
ft ksf
k/5 ft wide panel dim ft k/ft k/wire - - - -
1 1.87 0.40 6.25 1.188 10.31 5.16 3.38 3.4 1.9 4 4W11+W11x0.5' 2 4.37 0.67 8.36 1.110 10.31 11.25 3.38 2.5 2.5 3 3W11+W11x0.5' 3 6.87 0.86 10.80 1.033 10.31 16.47 3.38 2.3 3.2 4 4W11+W11x0.5' 4 9.37 1.02 12.77 0.955 10.31 20.75 3.38 2.2 3.8 4 4W11+W11x0.5' 5 11.87 1.14 14.26 0.438 10.31 12.06 4.84 3.4 2.9 4 4W15+W11x1' 6 14.37 1.22 15.23 0.399 11.24 14.50 4.84 3.1 3.1 4 4W15+W11x1' 7 16.87 1.26 15.71 0.360 12.74 17.41 4.84 2.8 3.2 4 4W15+W11x1' 8 19.37 1.28 16.03 0.214 14.24 13.27 4.84 3.4 3.3 4 4W15+W11x1.5' 9 21.87 1.37 17.10 0.208 15.74 16.12 4.84 3.1 3.5 4 4W15+W11x1.5'
10 24.37 1.51 19.05 0.208 17.24 19.66 4.84 2.9 3.9 4 4W15+W11x1.5'

FHWA NHI-10-025 Example E4 – Level backfill with LL MSE Walls and RSS – Vol II E4 – 19 November 2009
STEP 8: DESIGN OF FACING ELEMENTS The precast facing elements must be designed as structural elements with appropriate connection strength as discussed in Chapter 4.
STEP 9: CHECK OVERALL AND COMPOUND STABILITY AT SERVICE LIMIT
STATE
From Step 2, it is given that the foundation soil is dense clayey sand that has fd = 30°, fd =
125 pcf. Furthermore, the ground in front of the wall is horizontal and the foundation soil has no water table. Therefore, based on observation, overall stability is adequate. For actual projects, overall stability should be investigated at the Service I load combination and a resistance factor of 0.65.
STEP 10: DESIGN WALL DRAINAGE SYSTESM See Chapter 5 for wall drainage considerations.
E4-2 PRACTICAL CONSIDERATIONS Following is a general list of practical considerations from a geotechnical and structural viewpoint:
Attempt should be made to not vary the bar mat configuration too much because that increases the possibility of inadvertent mixing of bar mats and use of wrong bar mat at a given level.

FHWA NHI-10-025 Example E4 – Level backfill with LL MSE Walls and RSS – Vol II E4 – 20 November 2009

FHWA NHI-10-025 Example E5 – Spread Footing Bridge Abutment MSE Walls and RSS – Vol II E5 – 1 November 2009
EXAMPLE PROBLEM E5 BRIDGE ABUTMENT SUPPORTED ON SPREAD FOOTING ON TOP OF AN MSE
WALL WITH SEGMENTAL PRECAST PANEL FACING E5-1 INTRODUCTION This example problem demonstrates the analysis of a bridge abutment supported on a spread footing on top of an MSE wall with segmental precast panel facing. A typical configuration of such a bridge abutment is shown in Figure E5-1. The analysis of a true bridge abutment is based on various principles that were discussed in Chapters 4 and 5. Table E5-1 presents a summary of steps involved in the analysis of a bridge abutment supported on spread footing. Each of the steps and sub-steps is sequential and if the design is revised at any step or sub-step then all the previous computations need to be re-visited. Each of the steps and the sub-steps in Table E5-1 is explained in detail herein. Practical considerations for implementation of a true abutment system are presented in Section E5-2 after the illustration of the step-by-step procedures.
NOTE: A bridge abutment is a complex structure and should be analyzed very carefully since the performance of the bridge and its approach system will be affected. This example problem presents a typical case that may not be representative of all possible configurations, e.g., skewed bridge abutment, integral abutments, extensible reinforcements or other features may require additional considerations. The example problem is presented herein to demonstrate the formulation of various equations in the LRFD context for complex geometries. The formulations may have to be modified for project-specific bridge abutment configurations.

FHWA NHI-10-025 Example E5 – Spread Footing Bridge Abutment MSE Walls and RSS – Vol II E5 – 2 November 2009
Table E5-1. Summary of steps in analysis of a true bridge abutment
Step Item 1 Establish project requirements 2 Establish project parameters 3 Estimate wall embedment depth and length of reinforcement 4 Estimate unfactored loads 5 Summarize applicable load and resistance factors 6 Evaluate external stability of spread footing
6.1 Evaluation of limiting eccentricity 6.2 Evaluation of sliding resistance 6.3 Evaluation of bearing resistance
7 Evaluate external stability of MSE wall 7.1 Evaluation of limiting eccentricity 7.2 Evaluation of sliding resistance 7.3 Evaluation of bearing resistance 7.4 Settlement analysis
8 Evaluate internal stability of MSE wall 8.1 Estimate critical failure surface, variation of Kr and F* for internal stability 8.2 Establish vertical layout of soil reinforcements 8.3 Calculate horizontal stress and maximum tension at each reinforcement level 8.4 Establish nominal and factored long-term tensile resistance of soil reinforcement 8.5 Establish nominal and factored pullout resistance of soil reinforcement 8.6 Establish number of soil reinforcing strips at each level of reinforcement
9 Design of facing elements 10 Check overall and compound stability at the service limit state. 11 Design wall drainage system

FHWA NHI-10-025 Example E5 – Spread Footing Bridge Abutment MSE Walls and RSS – Vol II E5 – 3 November 2009
Figure E5-1. Configuration showing various parameters for analysis of a bridge abutment supported on spread footing on top of an MSE wall (not-to-scale).
cf bf
b1 b2 b3 b4 b5
Join
t
F2 DL
LL
h2 h
h3
h1
Reinforced backfill '1, γ1
Ha H
L
Bridge Approach
d
Retained backfill '3, γ3
Spread footing backfill above Plane XY '2, γ2
Bridge Superstructure
Bearing Pad
Leveling Pad
X Y
Foundation Soil 'fd, γfd
H'

FHWA NHI-10-025 Example E5 – Spread Footing Bridge Abutment MSE Walls and RSS – Vol II E5 – 4 November 2009
STEP 1. ESTABLISH PROJECT REQUIREMENTS
Abutment wall height, Ha = 23 ft (measured from finished ground to bottom of spread footing as shown in Figure E5-1)
Length of wall at abutment = 120 ft
Design life = 100 years (since the abutment application is considered critical)
Precast panel units: 10 ft wide x 5 ft tall x 0.5 ft thick
Type of reinforcement: Grade 65 (Fy = 65 ksi), 1.969 in. x 0.157 in. (50 mm wide x 4
mm) thick galvanized steel ribbed strips with zinc coating of 3.386 mils (86 m).
Cast-in-place spread footing
No approach slab (therefore, consider live load)
STEP 2. EVALUATE PROJECT PARAMETERS Figure E5-1 shows the typical configuration of a true bridge abutment. Bridge loading parameters (see Figure E5-1):
Nominal (unfactored) Dead Load reaction, DL = 10.60 k/ft
Nominal (unfactored) Live Load reaction, LL = 5.70 k/ft
Nominal (unfactored) lateral friction force, F2, at the bearing level = 0.82 k/ft Spread footing configuration (see Figure E5-1):
Footing base width, bf = 10.75 ft with the following values o b1= 1.50 ft, b2= 1.50 ft, b3= 1.50 ft, b4= 1.00 ft, b5= 5.25 ft
Distance between toe of footing and backface of MSE panels, cf = 0.5 ft
Height of footing, h = 10.35 ft with the following values o h1 = 1.50 ft, h2 = 3.85 ft, h3 = 5.00 ft
Bearing pad height, hb = 0.08 ft included in h3 dimension Soil Properties (see Figure E5-1):
Reinforced backfill, '1 = 34°, 1 = 125 pcf, coefficient of uniformity, Cu = 7.0 and
meeting the AASHTO (2007) requirements for electrochemical properties
Random backfill behind spread footing, '2 = 34°, 2 = 125 pcf
Retained backfill, '3 = 30°, 3 = 125 pcf
Other relevant parameters:
Spread footing concrete, c = 150 pcf
Foundation soil, 'fd = 30°, fd = 120 pcf, clayey sand with no water table
FHWA NHI-10-025 Example E5 – Spread Footing Bridge Abutment MSE Walls and RSS – Vol II E5 – 5 November 2009
Factored Bearing resistance of foundation soil o For service limit consideration, qnf-ser = 7.0 ksf for 1-inch of total settlement o For strength limit consideration, qnf-str = 15.0 ksf
Factored Bearing resistance of MSE wall (for use in analysis of spread footing on top of MSE wall)
o For service limit considerations, qnm-ser = 4.0 ksf for < ½-inch settlement o For strength limit considerations, qnm-str = 7.0 ksf
Live load on bridge approach, heq = 2-ft of soil per Table 3.11.6.4-1 of AASHTO (2007)
No seismic considerations.
STEP 3. ESTIMATE DEPTH OF EMBEDMENT AND LENGTH OF
REINFORCEMENT Based on Table C.11.10.2.2.-1 of AASHTO (2007), the minimum embedment depth = H/10 for abutment walls with horizontal ground in front of wall, i.e., 2.3 ft for abutment height of 23 ft. For this design, assume embedment, d = 2.5 ft. Thus, design height of the wall, H = Ha + d = 23 ft + 2.5 ft = 25.5 ft. Due to the large surcharges the length of the reinforcements for bridge abutment applications will be longer than the minimum value of 0.7H for walls with level backfill without surcharge(s). A good starting point for length of reinforcements for bridge abutment applications is assuming them to be approximately 1.0H rounded to the nearest higher number. Since in this case H=25.5 ft, the length of reinforcement for this example problem is assumed to be 26 ft. This length will be verified as part of the design process. The length of the reinforcement is assumed to be constant throughout the height to limit differential settlements across the reinforced zone because differential settlements could overstress the reinforcements.

FHWA NHI-10-025 Example E5 – Spread Footing Bridge Abutment MSE Walls and RSS – Vol II E5 – 6 November 2009
STEP 4. ESTIMATE UNFACTORED LOADS Tables E5-4.1 and E5-4.2 present the equations for unfactored loads and moment arms about Points A and B shown in Figure E5-2. The moments are a product of the respective forces and moment arms. Each force is assigned a designation representing the applicable load type as per Tables 3.4.1-1 and 3.4.1-2 of AASHTO (2007).
To compute the numerical values of various forces and moments, the parameters provided in Step 2 are used. Using the values of the various friction angles, the coefficients of lateral earth pressure are as follows: Ka1 = (1 - sin34°)/(1 + sin34°) = 0.283 Ka2 = (1 - sin34°)/(1 + sin34°) = 0.283 Ka3 = (1 - sin30°)/(1 + sin30°) = 0.333
For the example problem, Tables E5-4.3 and E5-4.4 summarize the numerical values of unfactored forces and moments, respectively, based on the equations, various dimensions and values of lateral earth pressure coefficients presented above. Refer to Figure E5-2 for notations of various forces. The height of equivalent soil surcharge to represent live load, heq, will be different for analysis of footing and MSE wall block since the height of the footing is less than 20 ft. In subsequent computations, the notation heqF is used for heq for analysis of footing versus heqM for analysis of MSE block. In this example problem, the height of the footing, h, is 10.35 ft. Based on Table 3.11.6.4-1 of AASHTO (2007), heqF = 2.96 ft. For analysis of MSE wall, heqM = 2 ft since the height of MSE wall, H, is greater than 20 ft.
The unfactored forces and moments in Tables E5-4.3 and E5-4.4 form the basis of all computations in this example problem. The unfactored forces and moments should be multiplied by the appropriate load factors based on the load types identified in the second column of the Tables E5-4.1 and E5-4.2 to perform the analysis for various load combinations such as Strength I, Service I, etc. The load factors for various load types relevant to this example problem are discussed in Step 5.
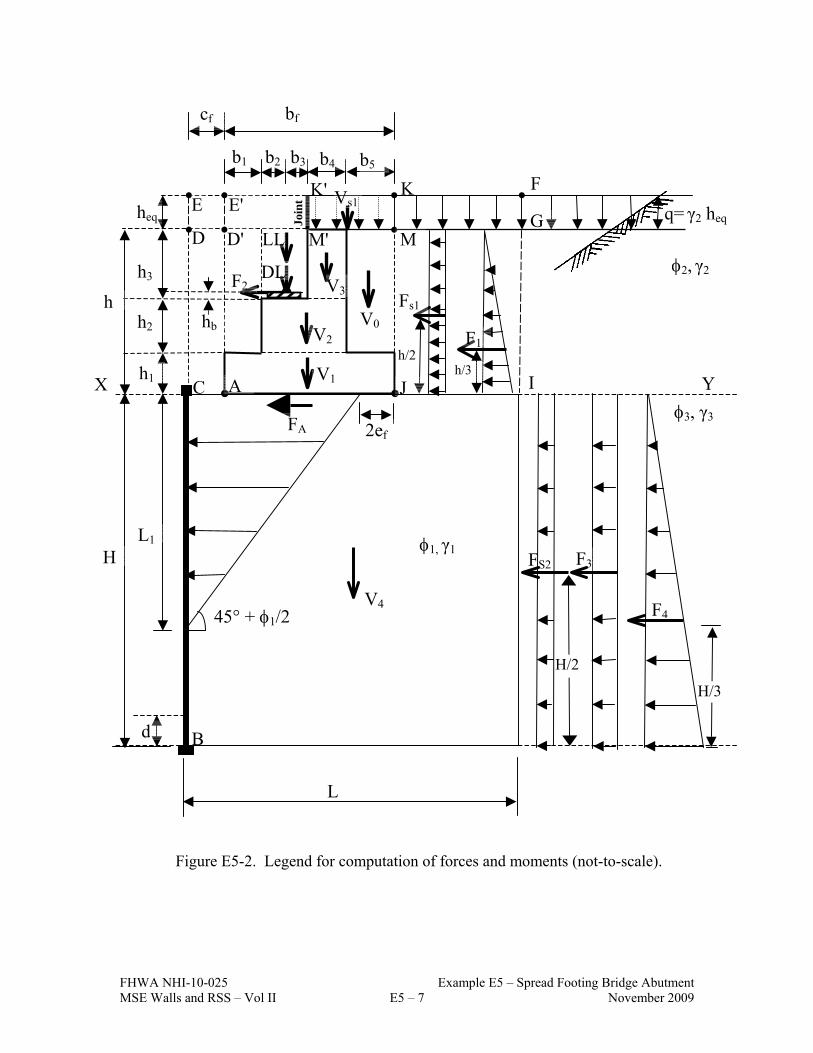
FHWA NHI-10-025 Example E5 – Spread Footing Bridge Abutment MSE Walls and RSS – Vol II E5 – 7 November 2009
Figure E5-2. Legend for computation of forces and moments (not-to-scale).
cf bf
b1 b2 b3 b4 b5
K' K F
G
H/3
D
E heq
MD'
E' Vs1
Join
t F2
DL
LL M'
h2 h
h3 V3
V0
C X h1 V1
V2
A
F4
Fs1
h/2
J I
F1
h/3
2ef 3, γ3
Y
1, γ1 L1
H
V4
L
B
45° + 1/2
F3
H/2
FS2
q= γ2 heq
d
2, γ2
hb
FA

FHWA NHI-10-025 Example E5 – Spread Footing Bridge Abutment MSE Walls and RSS – Vol II E5 – 8 November 2009
Table E5-4.1. Equations of computing unfactored vertical forces and moments
Moment arm (Length units) Vertical Force (Force/length units)
LRFD Load Type @ Point A @ Point B
V0=(γ2)(h2+h3)(b5) EV 5f5 bb
2
b 5ff
5 bcb2
b
V1=(γc)(bf)(h1) DC 2
bf 2
bc f
f
V2=(γc)(b2+b3+b4)(h2) DC 2
bbbb 432
1
2
bbbbc 432
1f
V3=(γc)(b4)(h3) DC 3214 bbb2
b 321
4f bbb
2
bc
V4=(γ1)(H)(L) EV - L/2 V5=(γ2)(h)(L) EV - L/2 VS=(γ2)(heqF)(L) = qL LS - L/2
VS1=(γ2)(heqF)(b4+b5) LS 32154 bbb
2
bb
321
54f bbb
2
bbc
DL DC b1 + b2 cf + b1 + b2 LL LL b1 + b2 cf + b1 + b2 Notes: 1. Forces V5 and VS are needed later (see Figures E5-3 and E5-4). 2. The load DL can include both “DC” and “DW” type of loads. As a simplification, herein
DL is assumed to include both and a “DC” load factor is used.
Table E5-4.2. Equations of computing unfactored horizontal forces and moments Moment arm (Length units) Horizontal Force
(Force/length) LRFD
Load Type @ Point A @ Point B F1 = 1/2 (Ka2)(γ2)h
2 EH h/3 (h/3) + H F2 FR h1 + h2 + hb h1 + h2 + hb + H F3 = (Ka3)[(γ2)(h)](H) EH - H/2 F4 = ½(Ka3)(γ3)H
2 EH - H/3 FS1=(Ka2)[(γ2)(heqF)](h) LS h/2 (h/2) + H FS2=(Ka3)[(γ2)(heqM)](H) LS - H/2
H (for external stability)
FA = F1 + F2 + FS1 Based on
each component
- H – (L1/3)
(for internal stability)

FHWA NHI-10-025 Example E5 – Spread Footing Bridge Abutment MSE Walls and RSS – Vol II E5 – 9 November 2009
Table E5-4.3. Unfactored vertical forces and moments
Force Value k/ft
Moment Arm @
Point A, ft
Moment Arm @
Point B, ft Moment
Moment at Point A, k-ft/ft
Moment at Point B, k-ft/ft
V0 = 5.81 8.13 8.63 MV0 = 47.19 50.09
V1 = 2.42 5.38 5.88 MV1 = 13.00 14.21
V2 = 2.31 3.50 4.00 MV2 = 8.09 9.24
V3 = 0.75 5.00 5.50 MV3 = 3.75 4.13
V4 = 82.88 13.00 MV4 = 1077.38
V5 = 33.64 13.00 MV5 = 437.29
Vs = 9.62 13.00 MVs = 125.06
Vs1 = 2.31 7.63 8.13 MVs1 = 17.63 18.79
DL = 10.60 3.00 3.50 MDL = 31.80 37.10
LL = 5.70 3.00 3.50 MLL = 17.10 19.95Notes: 1. Vs and Vs1 is computed based on heqF = 2.96 ft since h = 10.35 ft
Table E5-4.4. Unfactored horizontal forces and moments
Force Value k/ft
Moment Arm @
Point A, ft
Moment Arm @
Point B, ft Moment
Moment at Point A, k-ft/ft
Moment at Point B, k-ft/ft
F1 = 1.89 3.45 28.95 MF1 = 6.53 54.80
F2 = 0.82 5.43 30.93 MF2 = 4.43 25.21
F3 = 11.00 12.75 MF3 = 140.21
F4 = 13.55 8.50 MF4 = 115.15
FS1 = 1.08 5.18 30.68 MFS1 = 5.60 33.21
FS2 = 2.13 12.75 MFS2 = 27.09
FA = * 25.50 MFA = FA (25.50)
Notes: 1. FA = F1 + F2 + FS1 and each of the components of FA is a different load type and hence
has a different load factor. 2. FS1 is computed based on heqF = 2.96 ft since h = 10.35 ft 3. FS2 is computed based on heqM = 2 ft since H > 20 ft

FHWA NHI-10-025 Example E5 – Spread Footing Bridge Abutment MSE Walls and RSS – Vol II E5 – 10 November 2009
STEP 5. SUMMARIZE APPLICABLE LOAD AND RESISTANCE FACTORS Table E5-5.1 summarizes the load factors for the various LRFD load type shown in the second column of Tables E5-4.1 and E5-4.2. Throughout the computations in this
example problem, the forces and moments in Tables E5-4.1 and E5-4.2 should be multiplied by appropriate load factors. For example, if computations are being done for Strength I (maximum) load combination, the forces and moments corresponding to load V2 should be multiplied by 1.25 which is associated with load type DC assigned to load V2.
Table E5-5.1. Summary of applicable load factors Load Factors
(after AASHTO, 2007 Tables 3.4.1-1 and 3.4.1-2) Load Combination
EV DC LL/LS ES EH FR Strength I (maximum)
1.35 1.25 1.75 1.50 1.50 1.00
Strength I (minimum)
1.00 0.90 1.75 0.75 0.90 1.00
Service I 1.00 1.00 1.00 1.00 1.00 1.00 For computation of factored resistances during evaluation of strength limits states, appropriate resistance factors have to be used. Table E5-5.2 summarizes the applicable resistance factors. For service limit state, all resistance factors are equal to 1.0.
Table E5-5.2. Summary of applicable resistance factors for evaluation of resistances
Item Resistance
Factors AASHTO (2007)
Reference Sliding of cast-in-place spread footing on MSE wall s = 0.80 Table 10.5.5.2.2-1 Sliding of MSE wall on foundation soil s = 1.00 Table 11.5.6-1 Bearing resistance of MSE wall b = 0.65 Table 11.5.6-1 Tensile resistance (for steel strips) t = 0.75 Table 11.5.6-1 Pullout resistance p = 0.90 Table 11.5.6-1

FHWA NHI-10-025 Example E5 – Spread Footing Bridge Abutment MSE Walls and RSS – Vol II E5 – 11 November 2009
STEP 6. EVALUATE EXTERNAL STABILITY OF SPREAD FOOTING
6.1 Limiting Eccentricity at base of Spread Footing Since the computations are related to limiting eccentricity, the beneficial contribution of live load to resisting forces and moments is neglected. Limiting eccentricity is a strength limit state check and therefore only the strength limits state calculations are necessary. However, service limit state calculations are also included since some of the results will be needed later in internal stability analysis. The critical values from strength limit state calculations based on max/min result in the extreme force effect and govern the limiting eccentricity mode of failure.
Table E5-6.1. Computations for evaluation of limiting eccentricity for spread footing
Item Unit Str I
(max) Str I (min)
Ser I
Sum of overturning moments about Point A MOA = MF1+MFs1 +MF2
k-ft/ft 24.03 20.11 16.56
Sum of resisting moments about Point A MRA = MV0+MV1+MV2+MV3+MDL
k-ft/ft 134.50 98.16 103.82
Net moment at Point A, MA = MRA - MOA k-ft/ft 110.47 78.05 87.27Sum of vertical forces from the footing VA =V0+V1+V2+V3+DL
k/ft 27.94 20.28 21.89
Location of resultant from Point A, anl = MA/VA ft 3.95 3.85 3.99Eccentricity from center of footing, ef = 0.5*bf - anl ft 1.42 1.53 1.39Limiting eccentricity, e = bf/4 for Strength limit state and e = bf/6 for service limit state
ft 2.69 2.69 1.79
Is the limiting eccentricity criteria satisfied? - Yes Yes YesCRITICAL VALUES BASED ON MAX/MIN Overturning moments about Point A, MOA-C k-ft/ft 24.03 Resisting moments about Point A, MRA-C k-ft/ft 98.16 Net moment about Point A, MA-C = MRA-C - MOA-C k-ft/ft 74.13 Vertical force, VA-C k/ft 20.28 Location of resultant from Point A, anl = MA-C/VA-C ft 3.66 Eccentricity from center of footing, ef = 0.5*bf - anl ft 1.72 Limiting eccentricity, e = bf/4 ft 2.69 Is the limiting eccentricity criteria satisfied? - Yes
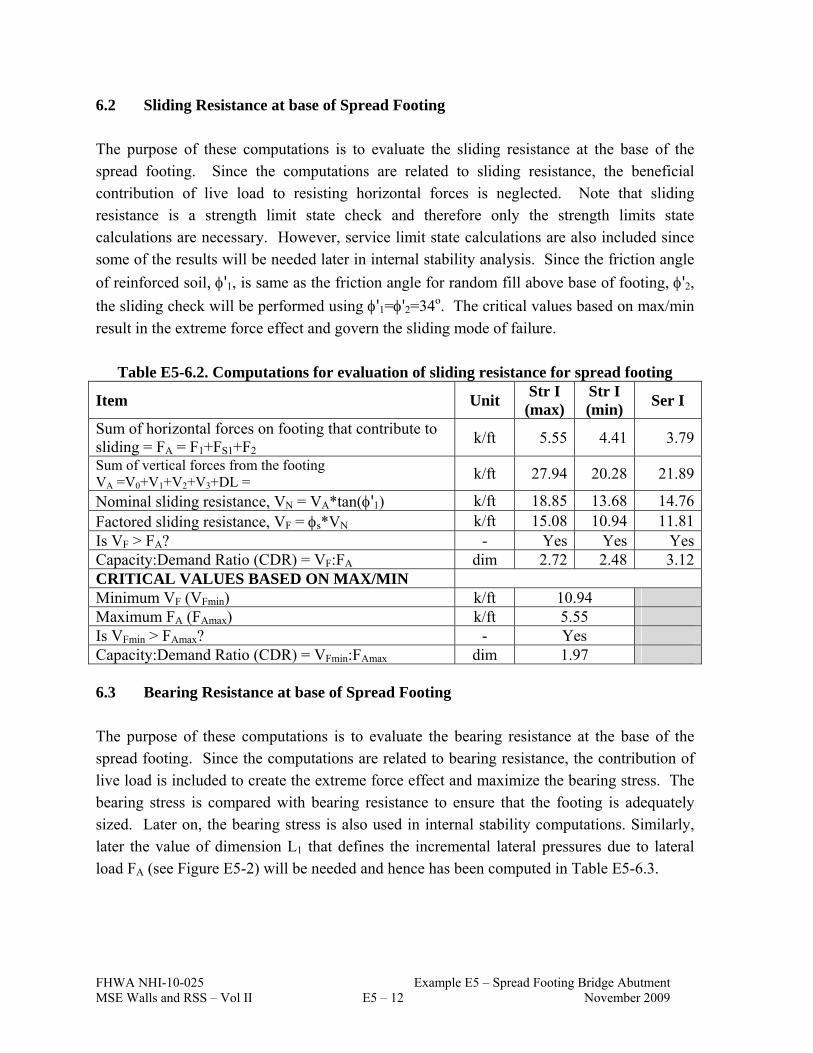
FHWA NHI-10-025 Example E5 – Spread Footing Bridge Abutment MSE Walls and RSS – Vol II E5 – 12 November 2009
6.2 Sliding Resistance at base of Spread Footing The purpose of these computations is to evaluate the sliding resistance at the base of the spread footing. Since the computations are related to sliding resistance, the beneficial contribution of live load to resisting horizontal forces is neglected. Note that sliding resistance is a strength limit state check and therefore only the strength limits state calculations are necessary. However, service limit state calculations are also included since some of the results will be needed later in internal stability analysis. Since the friction angle
of reinforced soil, '1, is same as the friction angle for random fill above base of footing, '2, the sliding check will be performed using '1='2=34o. The critical values based on max/min
result in the extreme force effect and govern the sliding mode of failure.
Table E5-6.2. Computations for evaluation of sliding resistance for spread footing
Item Unit Str I
(max) Str I (min)
Ser I
Sum of horizontal forces on footing that contribute to sliding = FA = F1+FS1+F2
k/ft 5.55 4.41 3.79
Sum of vertical forces from the footing VA =V0+V1+V2+V3+DL = k/ft 27.94 20.28 21.89
Nominal sliding resistance, VN = VA*tan('1) k/ft 18.85 13.68 14.76Factored sliding resistance, VF =s*VN k/ft 15.08 10.94 11.81Is VF > FA? - Yes Yes YesCapacity:Demand Ratio (CDR) = VF:FA dim 2.72 2.48 3.12CRITICAL VALUES BASED ON MAX/MIN Minimum VF (VFmin) k/ft 10.94 Maximum FA (FAmax) k/ft 5.55 Is VFmin > FAmax? - Yes Capacity:Demand Ratio (CDR) = VFmin:FAmax dim 1.97 6.3 Bearing Resistance at base of Spread Footing The purpose of these computations is to evaluate the bearing resistance at the base of the spread footing. Since the computations are related to bearing resistance, the contribution of live load is included to create the extreme force effect and maximize the bearing stress. The bearing stress is compared with bearing resistance to ensure that the footing is adequately sized. Later on, the bearing stress is also used in internal stability computations. Similarly, later the value of dimension L1 that defines the incremental lateral pressures due to lateral load FA (see Figure E5-2) will be needed and hence has been computed in Table E5-6.3.

FHWA NHI-10-025 Example E5 – Spread Footing Bridge Abutment MSE Walls and RSS – Vol II E5 – 13 November 2009
Table E5-6.3. Computations for evaluation of bearing resistance for spread footing
Item Unit Str I
(max) Str I (min)
Ser I
Sum of overturning moments about Point A = MOA =MF1+MFs1 +MF2
k-ft/ft 24.03 20.11 16.56
Sum of resisting moments about Point A = MRA = MV0+MV1+MV2+MV3+MDL+MLL+MVS1
k-ft/ft 195.28 158.94 138.56
Factored net moment at Point A, MA = MRA - MOA = k-ft/ft 171.26 138.84 122.00Sum of vertical forces from the footing for bearing stress analysis=VAb=V0+V1+V2+V3+DL+LL+VS1
k/ft 41.96 34.30 29.90
Location of resultant from Point A for bearing stress analysis, awl = MA/VAb
ft 4.08 4.05 4.08
Eccentricity from center of footing, ef = 0.5*bf - awl ft 1.29 1.33 1.29Limiting eccentricity, e = bf/4 for strength limit states and e= bf/6 for service limit state
ft 2.69 2.69 1.79
Is the resultant within limiting value of ef? - Yes Yes YesEffective width of spread footing, bf'=bf -2ef = ft 8.16 8.10 8.16Bearing stress, σv = VAb / (bf-2ef) ksf 5.14 4.24 3.66Factored bearing resistance, qR (given) ksf 7.00 7.00 4.00Is bearing stress < factored bearing resistance? dim Yes Yes YesCapacity:Demand Ratio (CDR) = qR:σv dim 1.36 1.65 1.09Depth of influence for the lateral force at base of footing, L1 = {cf + (bf - 2ef)} tan(45°+34°/2)
ft 16.29 16.17 16.29
CRITICAL VALUES BASED ON MAX/MIN Overturning moments about Point A, MOA-C k-ft/ft 24.03 Resisting moments about Point A, MRA-C k-ft/ft 158.94 Net moment about Point A, MA-C = MRA-C - MOA-C k-ft/ft 134.91 Vertical force, VAb-C k/ft 34.30 Location of resultant from Point A, awl = MA-C/VA-C ft 3.93 Eccentricity from center of footing, ef = 0.5*bf - anl ft 1.44 Limiting eccentricity, e = bf/4 ft 2.69 Is the limiting eccentricity criteria satisfied? - Yes Effective width of spread footing, bf'=bf - 2ef ft 7.87 Bearing stress, σv-c = VAb-C / (bf-2ef) ksf 4.36 Factored bearing resistance, qR (given) ksf 7.00 Is bearing stress < factored bearing resistance? dim Yes Capacity:Demand Ratio (CDR) = qR:σv-c dim 1.61

FHWA NHI-10-025 Example E5 – Spread Footing Bridge Abutment MSE Walls and RSS – Vol II E5 – 14 November 2009
STEP 7. EVALUATE EXTERNAL STABILITY OF MSE WALL The external stability of MSE wall is a function of the various forces and moments above plane XY in Figure E5-2. In the LRFD context the forces and moments need to be categorized into various load types. The primary load types are soil loads (EV, EH), live load (LL), and permanent loads (DC, DW). The principle of superposition shown in Figure 11.10.10.1-1 of AASHTO (2007) is used in achieving the separation of load types as well as performing external stability computations of the MSE wall. This separation of various load types will also permit a proper evaluation of the internal stability of the MSE wall. The separation of the loads by principle of superposition is primarily achieved by use of uniform loads and concentrated loads. The uniform loads are used to represent soil and live loads while the concentrated loads are used to represent permanent bridge loads due to the bridge superstructure and the concrete spread footing. Since LL is treated differently in the computations of limiting eccentricity, sliding resistance and bearing resistance, Figures E5-3 and E5-4 show separation of various load types without and with live load components, respectively. The equations shown in these figures are for computing unfactored forces and moments. The relevant LRFD load type (e.g., “EV”, “LL”, etc.) are shown in the figures to permit computations of factored forces and moments using the appropriate load factors as identified in Table E5-5.1 in Step 5.
It should be noted that use of principle of superposition results in an approximate representation of a very complex system. A case can conceivably be made for further separation of forces. However, a more refined system of forces is not justified given that the behavior of most elements of the system is designed to be within elastic range. One case where the approximations shown in Figure E5-3 and E5-4 may not be applicable is that of integral bridge abutments. In such specialized cases, additional forces may need to be considered depending on the actual abutment configuration.

FHWA NHI-10-025 Example E5 – Spread Footing Bridge Abutment MSE Walls and RSS – Vol II E5 – 15 November 2009
Figure E5-3. Superposition of load effects without Live Loads on MSE Wall.
Uniform Loads + Permanent Bridge Loads
“EV” h V5
H
AFA
V4 Fs2 F3
F4
cf bf
anL
B B
Summary of relevant equations FA = F1 + F2 + FS1 VA = V0 + V1 + V2 + V3 + DL MRA = MV0 + MV1 + MV2 + MV3 + MDL MOA = MF1 + MF2 + MFS1
MA = MRA – MOA Location of PnL from Point A, anL = MA/VA Eccentricity of PnL from center of footing, ef = 0.5*bf – anl
Note: See Figure E5-2 and Table E5-4.1 and E5-4.2 for additional information related to notations for various forces and moments and associated LRFD load types.
SOIL “EV”
SOIL “EV”
Not-To-Scale
PnL = VA– hγ2(bf+cf)
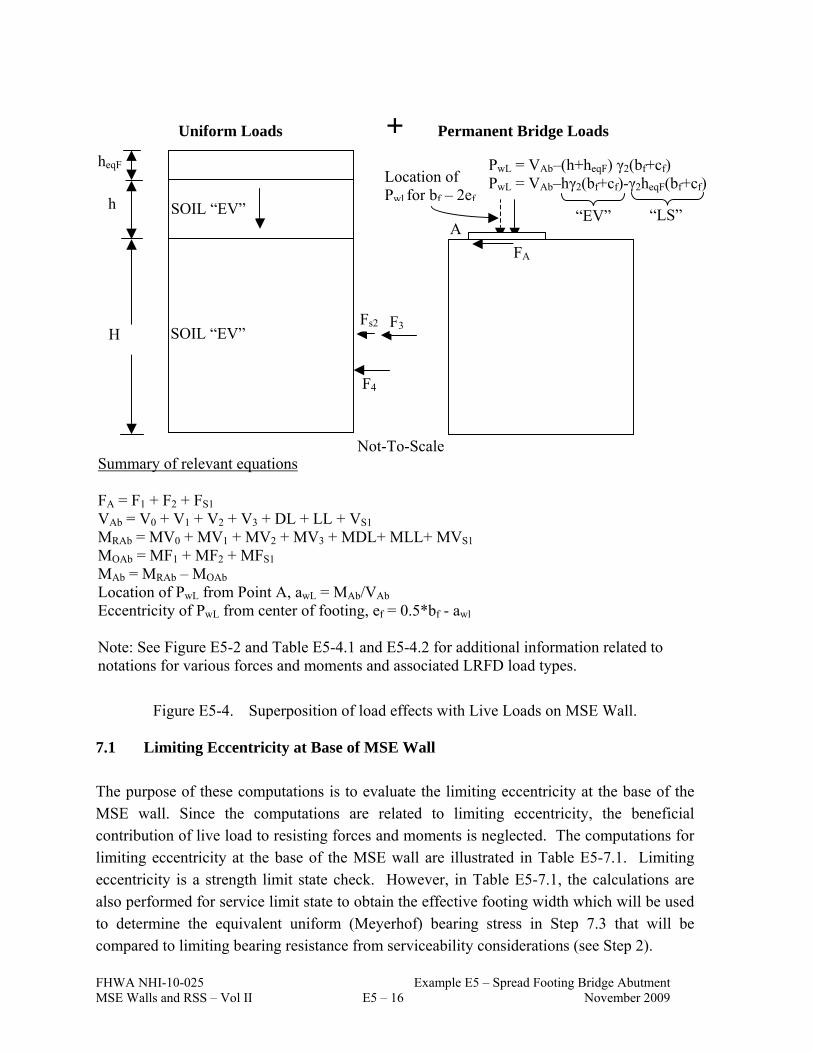
FHWA NHI-10-025 Example E5 – Spread Footing Bridge Abutment MSE Walls and RSS – Vol II E5 – 16 November 2009
Figure E5-4. Superposition of load effects with Live Loads on MSE Wall.
7.1 Limiting Eccentricity at Base of MSE Wall The purpose of these computations is to evaluate the limiting eccentricity at the base of the MSE wall. Since the computations are related to limiting eccentricity, the beneficial contribution of live load to resisting forces and moments is neglected. The computations for limiting eccentricity at the base of the MSE wall are illustrated in Table E5-7.1. Limiting eccentricity is a strength limit state check. However, in Table E5-7.1, the calculations are also performed for service limit state to obtain the effective footing width which will be used to determine the equivalent uniform (Meyerhof) bearing stress in Step 7.3 that will be compared to limiting bearing resistance from serviceability considerations (see Step 2).
Uniform Loads + Permanent Bridge Loads
Location of Pwl for bf – 2ef
A
PwL = VAb–(h+heqF) γ2(bf+cf) PwL = VAb–hγ2(bf+cf)-γ2heqF(bf+cf)
“EV” “LS”
awL
cf bf - 2ef
1H:2V
F3 Fs2
B
F4
B
V4
V5
VS LIVE “LS” heqF
h
H
Summary of relevant equations FA = F1 + F2 + FS1
VAb = V0 + V1 + V2 + V3 + DL + LL + VS1 MRAb = MV0 + MV1 + MV2 + MV3 + MDL+ MLL+ MVS1 MOAb = MF1 + MF2 + MFS1 MAb = MRAb – MOAb Location of PwL from Point A, awL = MAb/VAb Eccentricity of PwL from center of footing, ef = 0.5*bf - awl Note: See Figure E5-2 and Table E5-4.1 and E5-4.2 for additional information related to notations for various forces and moments and associated LRFD load types.
FA
Not-To-Scale
SOIL “EV”
SOIL “EV”

FHWA NHI-10-025 Example E5 – Spread Footing Bridge Abutment MSE Walls and RSS – Vol II E5 – 17 November 2009
Table E5-7.1. Computations for evaluation of limiting eccentricity for MSE wall Item (Refer to Figure E5-2 for block CDMJ). The top 13 rows in this table are related to computation of Pwl, PnL, awL and anL values that will also be used in internal stability calculations.
Unit Str I
(max) Str I (min)
Ser I
Unfactored soil weight in block CDMJ in the abutment footing area = (h)[(bf+cf)*2]
k/ft 14.55 14.55 14.55
Load factor for soil weight in block CDMJ [Load Type "EV"]
dim 1.35 1.00 1.00
Factored soil weight in block CDMJ in the abutment footing area
k/ft 19.65 14.55 14.55
Unfactored LL weight on block CDMJ in the abutment footing area = (bf+cf)*q =(bf+cf)*(γ2)(heqF)
k/ft 4.16 4.16 4.16
Load factor for LL on block CDMJ [Load Type "LS"]
dim 1.75 1.75 1.00
Factored LL weight on block CDMJ in the abutment footing area
k/ft 7.28 7.28 4.16
Vertical weight due to soil weight and LL in block CDMJ
k/ft 26.93 21.84 18.72
Vertical weight from abutment footing including soil on heel and LL = VAb
k/ft 41.96 34.30 29.90
Vertical weight from abutment footing including soil on heel and no LL = VA
k/ft 27.94 20.28 21.89
Net load, P, on base of spread footing from the bridge (with consideration of LL), PwL
k/ft 15.03 12.46 11.18
Net load, P, on base of spread footing from the bridge (no consideration of LL), PnL
k/ft 8.29 5.72 7.33
Moment arm of net load PnL from Point B, Lp = anl + cf
ft 4.45 4.35 4.49
Resisting moment at Point B due to net load P, MPnL = PnL(Lp)
k-ft/ft 36.93 24.89 32.90
Vertical load at base of MSE wall without LL, VB = V4+V5 + PnL
k/ft 165.58 122.24 123.84
Resisting moments about Point B without LL surcharge= MRB =MV4+MV5+MPnL
k-ft/ft 2081.72 1539.56 1547.56
Overturning moments about Point B = MOB = MFS3+MF3+MF4 +MFA (For MFA See Note 1)
k-ft/ft 666.03 454.90 448.67
Location of the resultant force on base of MSE wall from Point B, b =(MRB - MOB)/VB
ft 8.55 8.87 8.87
Eccentricity at base of MSE wall, eL = L/2 – b ft 4.45 4.13 4.13Limiting eccentricity, e = L/4 for strength limit states and e= L/6 for service limit state
ft 6.50 6.50 4.33
Is the resultant within limiting value of eL? - Yes Yes YesCRITICAL VALUES BASED ON MAX/MIN Overturning moments about Point B, MOB-C k-ft/ft 666.03

FHWA NHI-10-025 Example E5 – Spread Footing Bridge Abutment MSE Walls and RSS – Vol II E5 – 18 November 2009
Resisting moments about Point B, MRB-C k-ft/ft 1539.56 Net moment about Point A, MB-C = MRB-C - MOB-C k-ft/ft 873.53 Vertical force, VB-C k/ft 122.24 Location of resultant from Point B, b = MB-C/VB-C ft 7.15 Eccentricity from center of footing, eL = L/2 - b ft 5.85 Limiting eccentricity, e = L/4 ft 6.50 Is the limiting eccentricity criteria satisfied? - Yes Note 1: MFA = (FA)(H) = (F1 + F2 + FS1)(H) and each of the components of FA is a different load type and hence has a different load factor. 7.2 Sliding Resistance at Base of MSE Wall The purpose of these computations is to evaluate the sliding resistance at the base of the MSE wall. Since the computations are related to sliding resistance, the beneficial contribution of live load to resisting forces and moments is neglected. The computations for sliding resistance at the base of the MSE wall are illustrated in Table E5-7.2. Note that sliding resistance is a strength limit state check and therefore service limit state calculations are not
performed. Since the friction angle of foundation soil, ′fd, is less than the friction angle for
reinforced soil, 1, the sliding check will be performed using ′fd.
Table E5-7.2. Computations for evaluation of sliding resistance of MSE wall
Item Unit Str I
(max) Str I (min)
Ser I
Lateral load on the MSE wall, Hm = F1+F2+F3+F4+FS1+FS2
k/ft 46.08 30.22 NA
Vertical load at base of MSE wall without LL surcharge = V4+V5+PnL
k/ft 165.58 122.24 NA
Nominal sliding resistance at base of MSE wall, VNm = tan(′fd)(V4+V5+PnL)
k/ft 95.60 70.57 NA
Factored sliding resistance at base of MSE wall, VFm= s*VNm
k/ft 95.60 70.57 NA
Is VFm > Hm? - Yes Yes NACapacity:Demand Ratio (CDR) = VFm:Hm dim 2.07 2.34 NACRITICAL VALUES BASED ON MAX/MIN Minimum VFm (VFmmin) k/ft 70.57 Maximum Hm (Hmmax) k/ft 46.08 Is VFmmin > Hmmax? - Yes Capacity:Demand Ratio (CDR) = VFmmin:Hmmax dim 1.53 7.3 Bearing Resistance at base of MSE Wall For bearing resistance computations, the effect of live load is included since it creates larger bearing stresses. Figure E5-4 is used for bearing resistance computations. The bearing stress
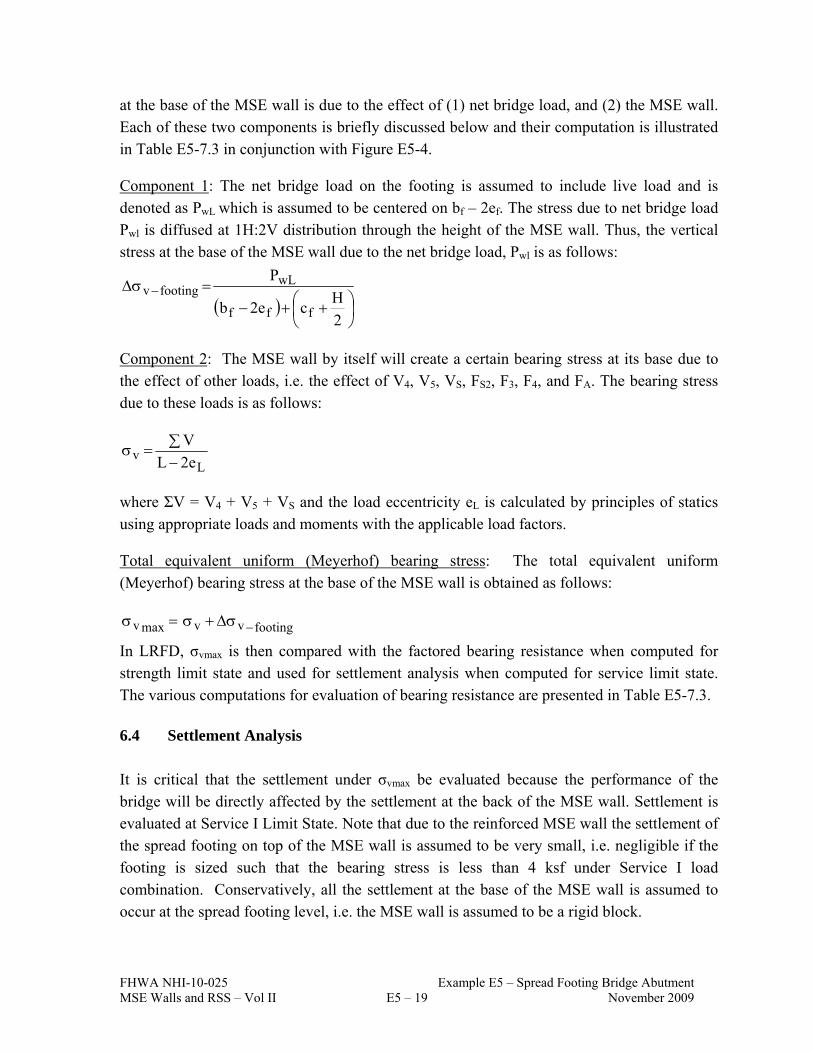
FHWA NHI-10-025 Example E5 – Spread Footing Bridge Abutment MSE Walls and RSS – Vol II E5 – 19 November 2009
at the base of the MSE wall is due to the effect of (1) net bridge load, and (2) the MSE wall. Each of these two components is briefly discussed below and their computation is illustrated in Table E5-7.3 in conjunction with Figure E5-4.
Component 1: The net bridge load on the footing is assumed to include live load and is denoted as PwL which is assumed to be centered on bf – 2ef. The stress due to net bridge load Pwl is diffused at 1H:2V distribution through the height of the MSE wall. Thus, the vertical stress at the base of the MSE wall due to the net bridge load, Pwl is as follows:
2
Hce2b
P
fff
wLfootingv
Component 2: The MSE wall by itself will create a certain bearing stress at its base due to the effect of other loads, i.e. the effect of V4, V5, VS, FS2, F3, F4, and FA. The bearing stress due to these loads is as follows:
Lv e2L
V
where ΣV = V4 + V5 + VS and the load eccentricity eL is calculated by principles of statics using appropriate loads and moments with the applicable load factors.
Total equivalent uniform (Meyerhof) bearing stress: The total equivalent uniform (Meyerhof) bearing stress at the base of the MSE wall is obtained as follows:
footingvvmaxv
In LRFD, σvmax is then compared with the factored bearing resistance when computed for strength limit state and used for settlement analysis when computed for service limit state. The various computations for evaluation of bearing resistance are presented in Table E5-7.3.
6.4 Settlement Analysis It is critical that the settlement under σvmax be evaluated because the performance of the bridge will be directly affected by the settlement at the back of the MSE wall. Settlement is evaluated at Service I Limit State. Note that due to the reinforced MSE wall the settlement of the spread footing on top of the MSE wall is assumed to be very small, i.e. negligible if the footing is sized such that the bearing stress is less than 4 ksf under Service I load combination. Conservatively, all the settlement at the base of the MSE wall is assumed to occur at the spread footing level, i.e. the MSE wall is assumed to be a rigid block.
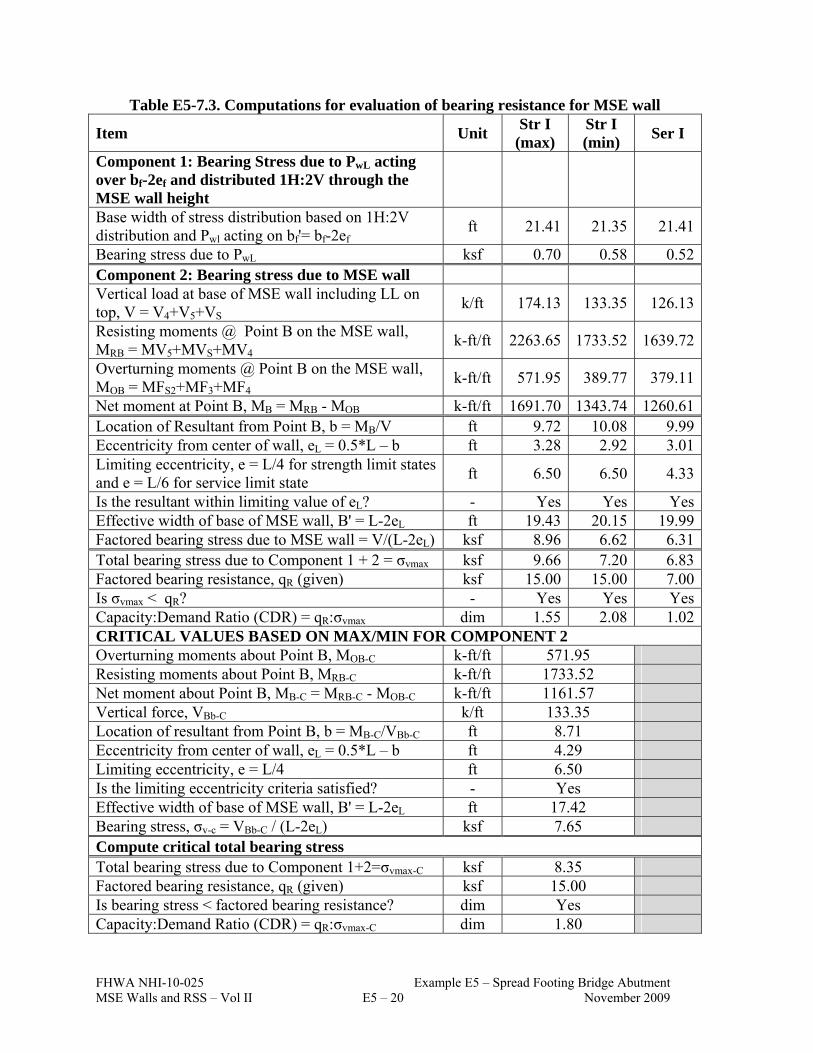
FHWA NHI-10-025 Example E5 – Spread Footing Bridge Abutment MSE Walls and RSS – Vol II E5 – 20 November 2009
Table E5-7.3. Computations for evaluation of bearing resistance for MSE wall
Item Unit Str I
(max) Str I (min)
Ser I
Component 1: Bearing Stress due to PwL acting over bf-2ef and distributed 1H:2V through the MSE wall height
Base width of stress distribution based on 1H:2V distribution and Pwl acting on bf'= bf-2ef
ft 21.41 21.35 21.41
Bearing stress due to PwL ksf 0.70 0.58 0.52Component 2: Bearing stress due to MSE wall Vertical load at base of MSE wall including LL on top, V = V4+V5+VS
k/ft 174.13 133.35 126.13
Resisting moments @ Point B on the MSE wall, MRB = MV5+MVS+MV4
k-ft/ft 2263.65 1733.52 1639.72
Overturning moments @ Point B on the MSE wall, MOB = MFS2+MF3+MF4
k-ft/ft 571.95 389.77 379.11
Net moment at Point B, MB = MRB - MOB k-ft/ft 1691.70 1343.74 1260.61Location of Resultant from Point B, b = MB/V ft 9.72 10.08 9.99Eccentricity from center of wall, eL = 0.5*L – b ft 3.28 2.92 3.01Limiting eccentricity, e = L/4 for strength limit states and e = L/6 for service limit state
ft 6.50 6.50 4.33
Is the resultant within limiting value of eL? - Yes Yes YesEffective width of base of MSE wall, B' = L-2eL ft 19.43 20.15 19.99Factored bearing stress due to MSE wall = V/(L-2eL) ksf 8.96 6.62 6.31Total bearing stress due to Component 1 + 2 = σvmax ksf 9.66 7.20 6.83Factored bearing resistance, qR (given) ksf 15.00 15.00 7.00Is σvmax < qR? - Yes Yes YesCapacity:Demand Ratio (CDR) = qR:σvmax dim 1.55 2.08 1.02CRITICAL VALUES BASED ON MAX/MIN FOR COMPONENT 2 Overturning moments about Point B, MOB-C k-ft/ft 571.95 Resisting moments about Point B, MRB-C k-ft/ft 1733.52 Net moment about Point B, MB-C = MRB-C - MOB-C k-ft/ft 1161.57 Vertical force, VBb-C k/ft 133.35 Location of resultant from Point B, b = MB-C/VBb-C ft 8.71 Eccentricity from center of wall, eL = 0.5*L – b ft 4.29 Limiting eccentricity, e = L/4 ft 6.50 Is the limiting eccentricity criteria satisfied? - Yes Effective width of base of MSE wall, B' = L-2eL ft 17.42 Bearing stress, σv-c = VBb-C / (L-2eL) ksf 7.65 Compute critical total bearing stress Total bearing stress due to Component 1+2=σvmax-C ksf 8.35 Factored bearing resistance, qR (given) ksf 15.00 Is bearing stress < factored bearing resistance? dim Yes Capacity:Demand Ratio (CDR) = qR:σvmax-C dim 1.80

FHWA NHI-10-025 Example E5 – Spread Footing Bridge Abutment MSE Walls and RSS – Vol II E5 – 21 November 2009
H' H
h
H'/2
H'/2
Resistant Zone
Active Zone
0.3H'
1 0.6
z z
z=20 ft
Kr F*z=0 z=0 1.7 Ka
1.2 Ka
2.0
tan (1) = 0.675
z=20 ft
Z
z=H' z=H'
Notes: Z is measured below bottom of footing; z is measured from top of finished grade H is measured from top of leveling pad to bottom of spread footing z = Z + h; z' = H – (cf + bf)/0.6 Within height z' the length of the reinforcement in the active zone is La = cf + bf
z'
L
bf cf Finished grade
STEP 8: EVALUATE INTERNAL STABILITY ANALYSIS OF MSE WALL
8.1 Estimate critical failure surface, variation of Kr and F* for internal stability The quantity cf + bf (=11.25 ft), is greater than H/3 (25.5/3=8.5 ft). Therefore, the modified shape of the maximum tensile force line (i.e., critical failure surface) shown in Figure 5-1 of Chapter 5 has to be used. For the case of inextensible steel ribbed strips, the profile of the critical failure surface, the variation of internal lateral horizontal stress coefficient, Kr, and the variation of the pullout resistance factor, F*, are as shown in Figure E5-5 wherein other definitions such as measurement of depths Z and z are also shown. It should be noted that the variation of Kr and F* are with respect to depth z that is measured from top of the spread footing while the critical failure surface is with respect to depth z that is measured from top of coping. The value of Ka is based on the angle of internal friction of the reinforced
backfill, 1, which is equal to Ka1 = 0.283 calculated in Step 4. Thus, the value of Kr varies
from 1.7(0.283) = 0.481 at z = 0 to 1.2(0.283) = 0.340 at z =20 ft. For steel strips, F*=1.2+log10Cu. Using Cu = 7.0 as given in Step 2, F*= 1.2+log10(7.0) = 2.045 > 2.000. Therefore, use F*=2.000.
Figure E5-5. Geometry definition, location of critical failure surface and variation of Kr and F* parameters for steel ribbed strips.

FHWA NHI-10-025 Example E5 – Spread Footing Bridge Abutment MSE Walls and RSS – Vol II E5 – 22 November 2009
8.2 Establish vertical layout of soil reinforcements and tributary areas Using the definition of depth Z as shown in Figure E5-5 the following vertical layout of the soil reinforcements is chosen. Z = 1.12 ft, 2.35 ft, 4.81 ft, 7.27 ft, 9.73 ft, 12.19 ft, 14.65 ft, 17.11 ft, 19.57 ft, 22.03 ft,
24.49 ft. The above layout leads to 11 levels of reinforcements. The vertical spacing was chosen based on a typical vertical spacing, Sv, of 2.46 ft that is commonly used in the industry for steel ribbed strip reinforcement. The vertical spacing near the top and bottom of the walls are locally adjusted as necessary to fit the height of the wall. For internal stability computations, each layer of reinforcement is assigned a tributary area, Atrib as follows Atrib = (wp)(Svt) where and wp is the panel width of the precast facing element and Svt is the vertical tributary spacing of the reinforcements based on the location of the reinforcements above and below the level of the reinforcement under consideration. The computation of Svt is summarized in
Table E5-8.1 wherein ZZSvt . Note that wp = 10.00 ft per Step 2.
Table E5-8.1. Summary of computations for Svt
Level Z (ft) Z (ft)
Z (ft) Svt (ft)
1 1.12 0 1.12+0.5(2.35–1.12)=1.735 1.735
2 2.35 2.35-0.5(2.35–1.12)=1.735 2.35+0.5(4.81-2.35)=3.58 1.845
3 4.81 4.81-0.5(4.81-2.35)=3.58 4.81+0.5(7.27-4.81)=6.04 2.460
4 7.27 7.27-0.5(7.27-4.81)=6.04 7.27+0.5(9.73-7.27)=8.50 2.460
5 9.73 9.73-0.5(9.73-7.27)=8.50 9.73+0.5(12.19-9.73)=10.96 2.460
6 12.19 12.19-0.5(12.19-9.73)=10.96 12.19+0.5(14.65-12.19)=13.42 2.460
7 14.65 14.65-0.5(14.65-12.19)=13.42 14.65+0.5(17.11-14.65)=15.88 2.460
8 17.11 17.11-0.5(17.11-14.65)=15.88 17.11+0.5(19.57-17.11)=18.34 2.460
9 19.57 19.57-0.5(19.57-17.11)=18.34 19.57+0.5(22.03-19.57)=20.80 2.460
10 22.03 22.03-0.5(22.03-19.57)=20.80 22.03+0.5(24.49-22.03)=23.26 2.460
11 24.49 24.49-0.5(24.49-22.03)=23.26 25.50 2.240

FHWA NHI-10-025 Example E5 – Spread Footing Bridge Abutment MSE Walls and RSS – Vol II E5 – 23 November 2009
8.3 Calculate horizontal stress and maximum tension at each reinforcement level The horizontal spacing of the reinforcements is based on the maximum tension (Tmax) at each level of reinforcements which requires computation of the horizontal stress, σH, at each reinforcement level. The reinforcement tensile and pullout resistances are then compared with Tmax and an appropriate reinforcement pattern is adopted. This section demonstrates the calculation of horizontal stress, σH, and maximum tension, Tmax. The horizontal stress, σH, at any depth within the MSE wall is based on the following components each of which is summarized in Table E5-8.2. σH = σH-soil + σH-surcharge + σH-footing + ΔσH
Table E5-8.2. Summary of load components leading to horizontal stress
Load Component Load Type
Horizontal Stress
Soil load, σv-soil EV σH-soil = [Kr σv-soil]γP-EV Surcharge traffic live load, q EV σH-surcharge = [Krq]γP-EV = [Kr(r heqM)]γP-EV Vertical footing load, Δσv-footing ES* σH-footing = [Kr Δσv-footing]γP-ES Horizontal surcharge, FA ES* ΔσH = (2FA/L1)γP-ES at zo=0 ; ΔσH =0 at zo=L1 *As per Article 3.116 of AASHTO (2007 with 2009 Interims), the value of ES may be 1.50 or 1.00 based on how the horizontal stresses are computed. First, compute horizontal stresses by using factored loads and use ES=1.0 since the horizontal stresses are based on factored loads. Second, compute horizontal stresses by using nominal loads and then apply ES=1.50. Choose horizontal stresses that are larger from the two approaches as per Article 3.116. of AASHTO (2007 with 2009 Interims). Using the unit weight of the reinforced soil mass and heights Z, h, and heqM, the equation for horizontal stress at any depth Z within the MSE wall can be written as follows (also see Chapter 4): σH = Kr (r Z) γP-EV + Kr (r h) γP-EV + Kr (r heqM) γP-EV + Kr (Δσv-footing) γP-ES + (σH) γP-ES
σH = Kr [r (Z + h + heqM) γP-EV + (Δσv-footing) γP-ES] + (σH) γP-ES
Once the horizontal stress is computed at any given level of reinforcement, the maximum tension, Tmax, is computed as follows: Tmax = (σH)(Atrib) where Atrib is the tributary area for the soil reinforcement at a given level as discussed earlier.
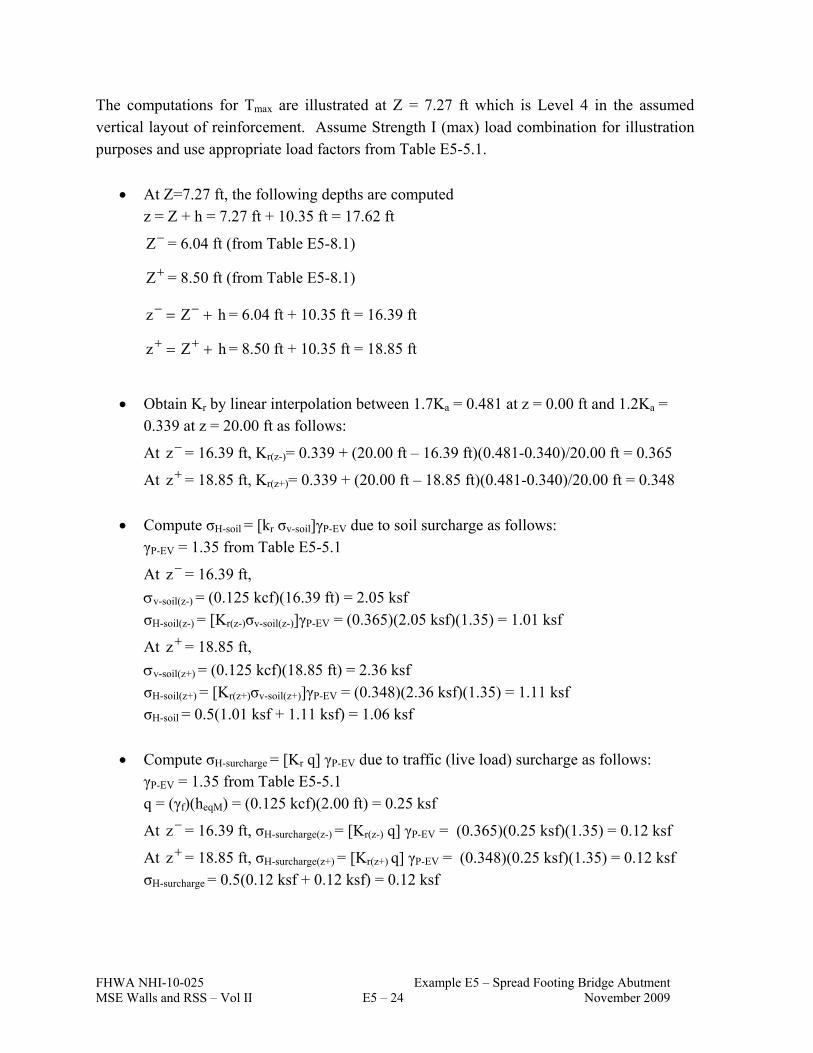
FHWA NHI-10-025 Example E5 – Spread Footing Bridge Abutment MSE Walls and RSS – Vol II E5 – 24 November 2009
The computations for Tmax are illustrated at Z = 7.27 ft which is Level 4 in the assumed vertical layout of reinforcement. Assume Strength I (max) load combination for illustration purposes and use appropriate load factors from Table E5-5.1.
At Z=7.27 ft, the following depths are computed z = Z + h = 7.27 ft + 10.35 ft = 17.62 ft Z = 6.04 ft (from Table E5-8.1)
Z = 8.50 ft (from Table E5-8.1)
hZz = 6.04 ft + 10.35 ft = 16.39 ft
hZz = 8.50 ft + 10.35 ft = 18.85 ft
Obtain Kr by linear interpolation between 1.7Ka = 0.481 at z = 0.00 ft and 1.2Ka = 0.339 at z = 20.00 ft as follows:
At z = 16.39 ft, Kr(z-)= 0.339 + (20.00 ft – 16.39 ft)(0.481-0.340)/20.00 ft = 0.365
At z = 18.85 ft, Kr(z+)= 0.339 + (20.00 ft – 18.85 ft)(0.481-0.340)/20.00 ft = 0.348
Compute σH-soil = [kr σv-soil]γP-EV due to soil surcharge as follows: γP-EV = 1.35 from Table E5-5.1
At z = 16.39 ft,
v-soil(z-) = (0.125 kcf)(16.39 ft) = 2.05 ksf
σH-soil(z-) = [Kr(z-)σv-soil(z-)]γP-EV = (0.365)(2.05 ksf)(1.35) = 1.01 ksf
At z = 18.85 ft,
v-soil(z+) = (0.125 kcf)(18.85 ft) = 2.36 ksf
σH-soil(z+) = [Kr(z+)σv-soil(z+)]γP-EV = (0.348)(2.36 ksf)(1.35) = 1.11 ksf σH-soil = 0.5(1.01 ksf + 1.11 ksf) = 1.06 ksf
Compute σH-surcharge = [Kr q] γP-EV due to traffic (live load) surcharge as follows: γP-EV = 1.35 from Table E5-5.1 q = (γf)(heqM) = (0.125 kcf)(2.00 ft) = 0.25 ksf
At z = 16.39 ft, σH-surcharge(z-) = [Kr(z-) q] γP-EV = (0.365)(0.25 ksf)(1.35) = 0.12 ksf
At z = 18.85 ft, σH-surcharge(z+) = [Kr(z+) q] γP-EV = (0.348)(0.25 ksf)(1.35) = 0.12 ksf σH-surcharge = 0.5(0.12 ksf + 0.12 ksf) = 0.12 ksf
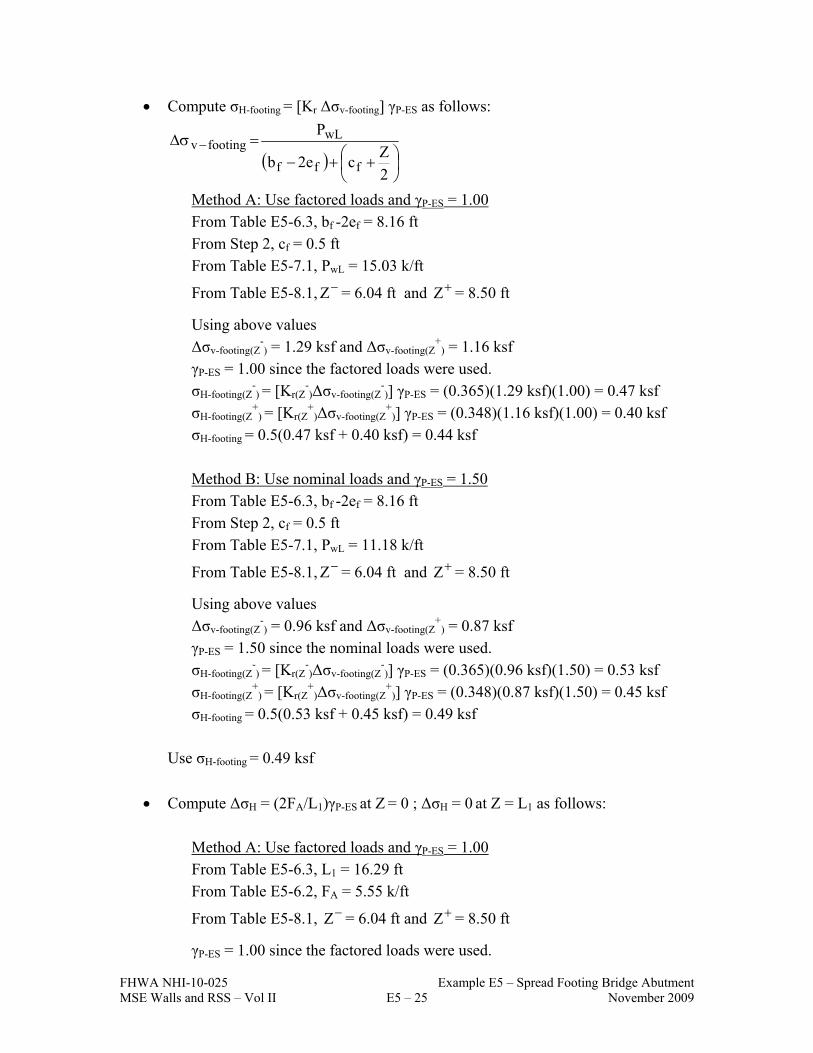
FHWA NHI-10-025 Example E5 – Spread Footing Bridge Abutment MSE Walls and RSS – Vol II E5 – 25 November 2009
Compute σH-footing = [Kr Δσv-footing] γP-ES as follows:
2
Zce2b
P
fff
wLfootingv
Method A: Use factored loads and γP-ES = 1.00 From Table E5-6.3, bf -2ef = 8.16 ft From Step 2, cf = 0.5 ft From Table E5-7.1, PwL = 15.03 k/ft
From Table E5-8.1, Z = 6.04 ft and Z = 8.50 ft
Using above values Δσv-footing(Z
-) = 1.29 ksf and Δσv-footing(Z
+) = 1.16 ksf
γP-ES = 1.00 since the factored loads were used. σH-footing(Z
-) = [Kr(Z
-)Δσv-footing(Z
-)] γP-ES = (0.365)(1.29 ksf)(1.00) = 0.47 ksf
σH-footing(Z+
) = [Kr(Z+
)Δσv-footing(Z+
)] γP-ES = (0.348)(1.16 ksf)(1.00) = 0.40 ksf σH-footing = 0.5(0.47 ksf + 0.40 ksf) = 0.44 ksf
Method B: Use nominal loads and γP-ES = 1.50 From Table E5-6.3, bf -2ef = 8.16 ft
From Step 2, cf = 0.5 ft From Table E5-7.1, PwL = 11.18 k/ft
From Table E5-8.1, Z = 6.04 ft and Z = 8.50 ft
Using above values Δσv-footing(Z
-) = 0.96 ksf and Δσv-footing(Z
+) = 0.87 ksf
γP-ES = 1.50 since the nominal loads were used. σH-footing(Z
-) = [Kr(Z
-)Δσv-footing(Z
-)] γP-ES = (0.365)(0.96 ksf)(1.50) = 0.53 ksf
σH-footing(Z+
) = [Kr(Z+
)Δσv-footing(Z+
)] γP-ES = (0.348)(0.87 ksf)(1.50) = 0.45 ksf σH-footing = 0.5(0.53 ksf + 0.45 ksf) = 0.49 ksf
Use σH-footing = 0.49 ksf
Compute ΔσH = (2FA/L1)γP-ES at Z = 0 ; ΔσH = 0 at Z = L1 as follows:
Method A: Use factored loads and γP-ES = 1.00 From Table E5-6.3, L1 = 16.29 ft From Table E5-6.2, FA = 5.55 k/ft
From Table E5-8.1, Z = 6.04 ft and Z = 8.50 ft
γP-ES = 1.00 since the factored loads were used.

FHWA NHI-10-025 Example E5 – Spread Footing Bridge Abutment MSE Walls and RSS – Vol II E5 – 26 November 2009
At Z = 6.04 ft
ΔσH(Z-) = [(2)(5.55 k/ft)/16.29 ft)][16.29 ft – 6.04 ft)/16.29 ft)] [1.00] = 0.43 ksf
At Z = 8.50 ft
ΔσH(Z+) = [(2)(5.55 k/ft)/16.29 ft)][16.29 ft – 8.50 ft)/16.29 ft)] [1.00] = 0.33 ksf ΔσH = 0.5(0.43 ksf + 0.33 ksf) = 0.38 ksf
Method B: Use nominal loads and γP-ES = 1.50 From Table E5-6.3, L1 = 16.29 ft From Table E5-6.2, FA = 3.79 k/ft
From Table E5-8.1, Z = 6.04 ft and Z = 8.50 ft
γP-ES = 1.50 since the nominal loads were used.
At Z = 6.04 ft
ΔσH(Z-) = [(2)(3.79 k/ft)/16.29 ft)][16.29 ft – 6.04 ft)/16.29 ft)] [1.50] = 0.44 ksf
At Z = 8.50 ft
ΔσH(Z+
) = [(2)(3.79 k/ft)/16.29 ft)][16.29 ft – 8.50 ft)/16.29 ft)] [1.50] = 0.33 ksf ΔσH = 0.5(0.44 ksf + 0.33 ksf) = 0.39 ksf
Use ΔσH = 0.39 ksf
Using values calculated above, compute σH = σH-soil + σH-surcharge + σH-footing + ΔσH as follows: σH = 1.06 ksf + 0.12 ksf + 0.49 ksf + 0.39 ksf = 2.06 ksf
Based on Table E5-8.1, the vertical tributary spacing at Level 4 is Svt = 2.46 ft
The panel width, wp, is 10.00 ft (given in Step 1)
The tributary area, Atrib, is computed as follows: Atrib = (2.46 ft)(10.00 ft) = 24.60 ft2
The maximum tension at Level 4 is computed as follows: Tmax = (σH)(Atrib) = (2.06 ksf)(24.60 ft2) = 50.7 k/panel of 10 ft width
Using similar computations, the various quantities can be developed at other levels of reinforcements and load combinations.

FHWA NHI-10-025 Example E5 – Spread Footing Bridge Abutment MSE Walls and RSS – Vol II E5 – 27 November 2009
8.4 Establish nominal and factored long-term tensile resistance of soil reinforcement The nominal tensile resistance of galvanized steel ribbed strip soil reinforcement is based on the design life and estimated loss of steel over the design life during corrosion. As per Step 1, the soil reinforcement for this example is assumed to be Grade 65 (Fy = 65 ksi), 1.969 in. x 0.157 in. (50 mm wide x 4 mm) thick galvanized steel ribbed strips with zinc
coating of 3.386 mils (86 m). As per Step 2, the reinforced backfill meets the AASHTO
(2007) requirements for electrochemical properties. For this reinforced backfill, the basis for calculating the thickness losses due to corrosion is as follows per Article 11.10.6.4.2a of AASHTO (2007): Zinc loss = 0.58 mil for first 2 years and 0.16 mil per year thereafter Steel loss = 0.47 mil/year/side Based on the above corrosion rates, the following can be calculated:
Life of zinc coating (galvanization) = 2 years + (3.386 – 2*0.58)/0.16 ≈ 16 years As per Step 1, the design life is 100 years. The base carbon steel will lose thickness for 100 years – 16 years = 84 years at a rate of 0.47 mil/year/side. Therefore, the anticipated thickness loss is calculated as follows: ER = (0.47 mil/year/side) (84 years) (2 sides) = 78.96 mils = 0.079 in., and
EC = 0.157 in. – 0.079 in. = 0.078 in. Based on a 1.969 wide strip, the cross-sectional area at the end of 100 years will be equal to (1.969 in.) (0.078 in.) = 0.154 in2. For Grade 65 steel with Fy = 65 ksi, the nominal tensile resistance at end of 100 year design
life will be Tn = 65 ksi (0.154 in2) = 10.00 k/strip. Using the resistance factor, t = 0.75 as
listed in Table E5-5.2, the factored tensile resistance, Tr = 10.00 k/strip (0.75) = 7.50 k/strip.

FHWA NHI-10-025 Example E5 – Spread Footing Bridge Abutment MSE Walls and RSS – Vol II E5 – 28 November 2009
8.5 Establish nominal and factored pullout resistance of soil reinforcement The nominal pullout resistance, Pr, of galvanized steel ribbed strip soil reinforcement is based on various parameters in the following equation: Pr = (F*)(2b)(Le)[(σv-soil)(γP-EV)] For this example problem, the following parameters are constant at levels of reinforcements: b = 50 mm = 1.97 in. = 0.164 ft
= 1.0 for inextensible reinforcement per Table 11.10.6.3.2-1 of AASHTO (2007)
The computations for Pr are illustrated at Z = 7.27 ft which is Level 4 as measured from top of the wall. Assume Strength I (max) load combination for illustration purposes and use appropriate load factors from Table E5-5.1.
At Z = 7.27 ft, z = Z + h = 7.27 ft + 10.35 ft = 17.62 ft
Obtain F* at z =17.62 ft by linear interpolation between 2.000 at z = 0 and 0.675 at z=20 ft as follows: F* = 0.675 + (20.00 ft – 17.62 ft)(2.000 – 0.675)/20 ft = 0.832
Compute effective length Le as follows:
z' = H – (cf + bf)/0.6 = 25.5 ft – (0.5 ft + 10.75 ft)0.6 = 6.75 ft Since Z > z', Le = L – [0.6(H – Z)] Le = 26 ft – 0.6(25.5 ft – 7.27 ft) = 15.06 ft
Per Article 11.10.6.3.2 use unfactored vertical stress for pullout resistance. Thus, γP-EV = 1.00. Thus, compute (σv-soil)(γP-EV) = (0.125 kcf)(17.62 ft) (1.00) = 2.20 ksf
Compute nominal pullout resistance as follows: Pr = (F*)(2b)(Le)[(σv-soil)(γP-EV)] Pr = (1.0)(0.832)(2)(0.164 ft)(15.06 ft)(2.20 ksf) = 9.04 k/strip
Compute factored pullout resistance as follows: Prr = Pr = (0.90)(9.04 k/strip) = 8.14 k/strip
Using similar computations, the various quantities can be developed at other levels of reinforcements and load combinations.
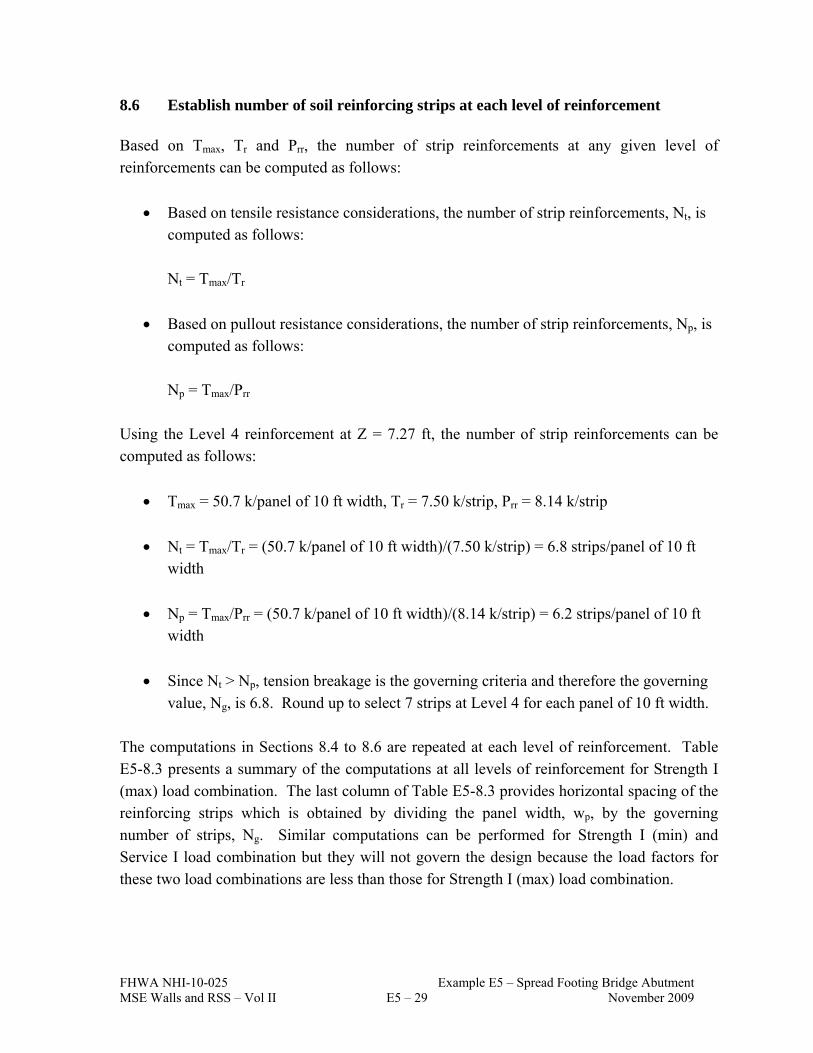
FHWA NHI-10-025 Example E5 – Spread Footing Bridge Abutment MSE Walls and RSS – Vol II E5 – 29 November 2009
8.6 Establish number of soil reinforcing strips at each level of reinforcement Based on Tmax, Tr and Prr, the number of strip reinforcements at any given level of reinforcements can be computed as follows:
Based on tensile resistance considerations, the number of strip reinforcements, Nt, is computed as follows: Nt = Tmax/Tr
Based on pullout resistance considerations, the number of strip reinforcements, Np, is computed as follows: Np = Tmax/Prr
Using the Level 4 reinforcement at Z = 7.27 ft, the number of strip reinforcements can be computed as follows:
Tmax = 50.7 k/panel of 10 ft width, Tr = 7.50 k/strip, Prr = 8.14 k/strip
Nt = Tmax/Tr = (50.7 k/panel of 10 ft width)/(7.50 k/strip) = 6.8 strips/panel of 10 ft width
Np = Tmax/Prr = (50.7 k/panel of 10 ft width)/(8.14 k/strip) = 6.2 strips/panel of 10 ft width
Since Nt > Np, tension breakage is the governing criteria and therefore the governing value, Ng, is 6.8. Round up to select 7 strips at Level 4 for each panel of 10 ft width.
The computations in Sections 8.4 to 8.6 are repeated at each level of reinforcement. Table E5-8.3 presents a summary of the computations at all levels of reinforcement for Strength I (max) load combination. The last column of Table E5-8.3 provides horizontal spacing of the reinforcing strips which is obtained by dividing the panel width, wp, by the governing number of strips, Ng. Similar computations can be performed for Strength I (min) and Service I load combination but they will not govern the design because the load factors for these two load combinations are less than those for Strength I (max) load combination.

FHWA NHI-10-025 Example E5 – Spread Footing Bridge Abutment MSE Walls and RSS – Vol II E5 – 30 November 2009
Note to users: All the long-form step-by-step calculations illustrated in Step 8 were based on hand-calculations in which numbers were rounded to the third or fourth significant digit as appropriate in each step. Table E5-8.3 was generated using a spreadsheet in which numbers at all calculation steps were not rounded. Thus, the end result in Table E5-8.3 may be somewhat different when compared to long-form hand calculations. However, the difference should be less than 0.2 in most cases.
Table E5-8.3. Summary of internal stability computations for Strength I (max) load combination
Z Kr H Tmax F* Le p(Pr) s(Tn)
Np
Nt
Ng Sh
Level ft dim ksf
k/10 ft wide panel dim ft k/strip k/strip ft
1 1.12 0.399 2.30 39.86 1.240 14.75 7.74 7.50 5.1 5.3 6 1.7 2 2.35 0.391 2.22 41.00 1.158 14.75 8.01 7.50 5.1 5.5 6 1.7 3 4.81 0.373 2.14 52.65 0.995 14.75 8.21 7.50 6.4 7.0 8 1.3 4 7.27 0.356 2.05 50.46 0.832 15.06 8.15 7.50 6.2 6.7 7 1.4 5 9.73 0.339 1.99 48.87 0.675 16.54 8.27 7.50 5.9 6.5 7 1.4 6 12.19 0.339 1.97 48.39 0.675 18.01 10.12 7.50 4.8 6.4 7 1.4 7 14.65 0.339 1.97 48.52 0.675 19.49 12.14 7.50 4.0 6.5 7 1.4 8 17.11 0.339 2.02 49.63 0.675 20.97 14.34 7.50 3.5 6.6 7 1.4 9 19.57 0.339 2.14 52.55 0.675 22.44 16.73 7.50 3.1 7.0 8 1.3
10 22.03 0.339 2.26 55.54 0.675 23.92 19.29 7.50 2.9 7.4 8 1.3 11 24.49 0.339 2.38 53.22 0.675 25.39 22.04 7.50 2.4 7.1 8 1.3
STEP 9: DESIGN OF FACING ELEMENTS Facing panels for true bridge abutment applications require special attention and project specific design. As per Article 11.10.11 of AASHTO (2007), due to the relatively high bearing pressures near the panel connections, the adequacy and nominal capacity of panel connections should be determined by conducting pullout and flexural tests on full-sized panels.
STEP 10: CHECK OVERALL AND COMPOUND STABILITY AT SERVICE LIMIT
STATE
From Step 2, it is given that the foundation soil is dense clayey sand that has fd = 30°, fd =
120 pcf. Furthermore, the ground in front of the wall is horizontal and the foundation soil has no water table. Therefore, based on observation, overall stability is adequate. For actual projects, overall stability should be investigated at the Service I load combination and a resistance factor of 0.65.

FHWA NHI-10-025 Example E5 – Spread Footing Bridge Abutment MSE Walls and RSS – Vol II E5 – 31 November 2009
STEP 11: DESIGN WALL DRAINAGE SYSTEMS See Chapters 5 and 6 for wall drainage considerations. For a true bridge abutment, the drainage system for the MSE wall must be carefully integrated with the other bridge drain systems, such as the deck drainage. Often storm drain pipes are placed through the MSE wall backfill in true bridge abutments. Every attempt must be made to relocate these drain features behind the reinforced backfill.
E5-2 PRACTICAL CONSIDERATIONS The design of a true bridge abutment is a complex process. The actual detailing of the abutment is particularly important given that a number of disciplines ranging from geotechnical, structural, hydraulics, roadway, utilities and aesthetics have specific requirements at abutment locations. All relevant input must be sought and incorporated into the project plans and specifications. Following is a general list of practical considerations from a geotechnical and structural viewpoint:
1. As noted in Article 11.10.11 of AASHTO (2007), the governing density, length, and cross-section of the soil reinforcements in Table E-4-8.3 shall be carried on the wingwalls of a minimum horizontal distance equal to 50 percent of the height of the abutment. Since the height of the abutment is 25.5 ft, the minimum horizontal distance along the wing wall is therefore 25.5 ft/2 = 12.5 ft. This dimension is greater than cf + bf = 0.5 ft + 10.75 ft = 11.25 ft. Thus, the 2-way reinforcement is equal in both directions under the full width of the spread footing which provides a consistent bearing resistance across the footing.
2. Use of an approach slab is redundant for a true bridge abutment since the MSE wall and the spread footing above it settle as a unit. However, some agencies require the use of approach slab in which case special details may be necessary. Depending on the design of the approach slab system, live load may be omitted on the bridge approaches.
3. Commonly bridge abutments on spread footings on top of MSE walls are stand alone abutments with wing walls. Assuming that the wing walls are part of the MSE wall system, there will be 2-way reinforcement within the length of reinforcement perpendicular to the abutment face. It is preferable that reinforcement is not placed on top of each other in the zone of 2-way reinforcement. The overlapping reinforcement should be separated by 3 in. to 6 in. of soil or some multiple of

FHWA NHI-10-025 Example E5 – Spread Footing Bridge Abutment MSE Walls and RSS – Vol II E5 – 32 November 2009
compacted fill height. This may be achieved by appropriately stepping of the leveling pad between the abutment face wall and the wing walls.
4. To prevent adverse stress concentrations at the reinforcement connections, the minimum vertical clearance between the bottom of the footing and the top level of reinforcement should be 1 ft.
5. In the height h1 and h2 shown in Figure E5-1, a false panel can be placed to cover the step in the footing. Often the coping is extended up in this area. Styrofoam or similar lightweight material which is fairly impermeable is placed in this area to minimize lateral loads on the coping or MSE panel and prevent migration of moisture into the backfill at the corrosion critical panel-reinforcement connection location.

FHWA NHI-10-025 Example E6 – Traffic Barrier Impact Loading MSE Walls and RSS – Vol II E6 – 1 November 2009
EXAMPLE E6 TRAFFIC BARRIER IMPACT LOADING ON
SEGMENTAL PRECAST PANEL MSE WALL WITH STEEL GRID REINFORCEMENT
E6-1 INTRODUCTION This example problem is an extension of Example Problem E4, and demonstrates the analysis of a MSE wall with a traffic barrier impact load. The MSE wall is assumed to include a segmental precast panel face with steel grid (bar mat) reinforcements. The MSE wall configuration to be analyzed is shown in Figure E4-1. The analysis is based on various principles that were discussed in Section 7.3. Table E6-1 presents a summary of steps involved in this traffic barrier analysis. The analysis uses the reinforcement spacing and sizing developed in Example E4. Practical considerations are presented in Section E6-2 after the illustration of the step-by-step procedures.
Table E6-1. Summary of additional steps for traffic barrier impact load on a MSE wall with level backfill and live load surcharge
Step Item 4 Estimate unfactored loads 5 Summarize applicable load and resistance factors 7 Evaluate internal stability of MSE wall
7.3 Calculate horizontal stress and maximum tension at each reinforcement level 7.4 Establish nominal and factored long-term tensile resistance of soil reinforcement 7.5 Check/eEstablish nominal and factored pullout resistance of soil reinforcement 7.6 Check/establish number of soil reinforcing elements at each level of reinforcement
8 Design of facing elements STEP 4. ESTIMATE UNFACTORED LOADS Traffic barrier impact affects the internal stability of the reinforced soil wall. Therefore, only internal loads are discussed below. See Example E4 for external loads. The coefficients of active lateral earth pressure for internal stability is:
Kar = (1 - sin34°)/(1 + sin34°) = 0.283

FHWA NHI-10-025 Example E6 – Traffic Barrier Impact Loading MSE Walls and RSS – Vol II E6 – 2 November 2009
STEP 5. SUMMARIZE APPLICABLE LOAD AND RESISTANCE FACTORS Table E4-5.1 summarizes the load factors for the various LRFD load type.
Table E6-5.1. Applicable load factors Load Factors
(after Tables 3.4.1-1 and 3.4.1-2 (AASHTO, 2007)) Load Combination
EV LL CT Strength I (maximum) P = 1.35 1.75 –
Extreme II P = 1.35 0.50 1.00 For computation of factored resistances during evaluation of extreme limits states, appropriate resistance factors have to be used. Article 11.5.7 Extreme Event Limit (AASHTO, 2007) states: The applicable load combinations and load factors specified in
Table 3.4.1-1 shall be investigated. Unless otherwise specified, all resistance factors shall be taken as 1.0 when investigating the extreme limit state. Table E6-5.2 summarizes the applicable resistance factors.
Table E6-5.2. Summary of applicable resistance factors for evaluation of extreme limit states
Item Resistance
Factors AASHTO (2007)
Reference Strength Limit State t = 0.65 Table 11.5.6-1 Tensile resistance
(for steel bar mats) Extreme Limit State t = 1.0 Article 11.5.7 Strength Limit State p = 0.90 Table 11.5.6-1 Pullout resistance Extreme Limit State t = 1.0 Article 11.5.7
STEP 7: EVALUATE INTERNAL STABILITY ANALYSIS OF MSE WALL Only the upper two layers of soil reinforcement are examined for the traffic barrier impact. Tensile and pullout resistance are checked.
7.2 Establish vertical layout of soil reinforcements The following vertical layout of the top three soil reinforcements was chosen in Problem E4.
Z = 1.87 ft, 4.37 ft, and 6.87 ft,

FHWA NHI-10-025 Example E6 – Traffic Barrier Impact Loading MSE Walls and RSS – Vol II E6 – 3 November 2009
For internal stability computations, each layer of reinforcement is assigned a tributary area, Atrib as follows: Atrib = (wp)(Svt) where wp is the panel width of the precast facing element and Svt is the vertical tributary spacing of the reinforcements based on the location of the reinforcements above and below the level of the reinforcement under consideration. The computation of Svt is summarized in
Table E6-7.1 wherein zzSvt . Note that wp = 5.00 ft per Step 2.
Table E6-7.1. Summary of computations for Svt
Level Z (ft) Z (ft) Z (ft) Svt (ft)
1 1.87 0 1.87+0.5(4.37–1.87)=3.12 3.12
2 4.37 4.37-0.5(4.37–1.87)=3.12 4.37+0.5(6.87-4.37)=5.62 2.50 3 6.87 6.87-0.5(6.87-4.37)=5.62
7.3 Calculate horizontal stress and maximum tension at each reinforcement level The computations for Tmax are computed for Level 1 and 2 Reinforcements, at zo = 1.87 ft and 4.37 ft, respectively. Extreme Event II load combination is used, with appropriate load factors from Table E6-5.1. The maximum load at a given level is:
)(TγAσT CTCTtribHmax
where Atrib = tributary area for the soil reinforcement at a given level TCT = tensile load for the impact loading The impact loads vary between reinforcement tensile rupture design and pullout design. Therefore, two maximum loads must be computed for traffic barrier impact loading – Tmax-R
and Tmax-PO. For tensile rupture check, the upper layer of soil reinforcement is designed for a rupture impact load of 2,300 lb/lft of wall; and the second layer is designed with a rupture impact load of 600 lb/lft. Pullout is resisted over a greater length of wall than the reinforcement rupture loads. Therefore, for pullout, the upper layer of soil reinforcement is designed for a pullout impact load of 1,300 lb/lft of wall; and the second layer is designed with a pullout impact load of 600 lb/lft.
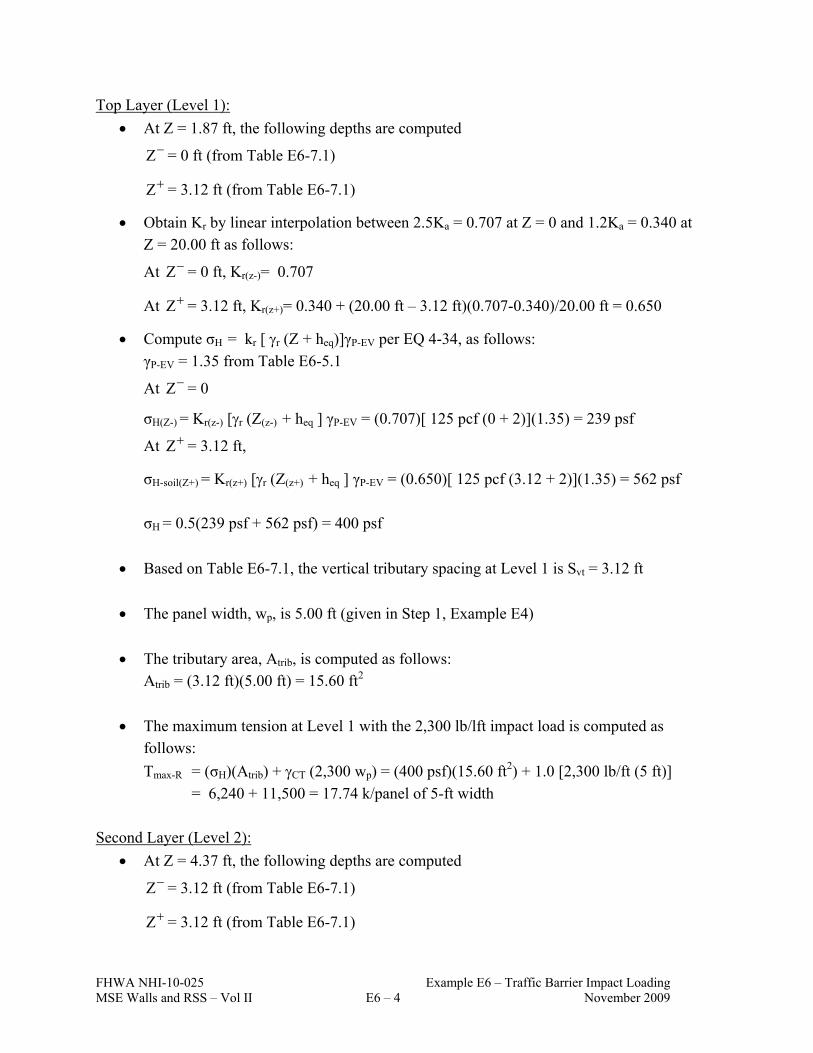
FHWA NHI-10-025 Example E6 – Traffic Barrier Impact Loading MSE Walls and RSS – Vol II E6 – 4 November 2009
Top Layer (Level 1):
At Z = 1.87 ft, the following depths are computed Z = 0 ft (from Table E6-7.1)
Z = 3.12 ft (from Table E6-7.1)
Obtain Kr by linear interpolation between 2.5Ka = 0.707 at Z = 0 and 1.2Ka = 0.340 at Z = 20.00 ft as follows:
At Z = 0 ft, Kr(z-)= 0.707
At Z = 3.12 ft, Kr(z+)= 0.340 + (20.00 ft – 3.12 ft)(0.707-0.340)/20.00 ft = 0.650
Compute σH = kr [ r (Z + heq)]γP-EV per EQ 4-34, as follows:
γP-EV = 1.35 from Table E6-5.1
At Z = 0
σH(Z-) = Kr(z-) [r (Z(z-) + heq ] γP-EV = (0.707)[ 125 pcf (0 + 2)](1.35) = 239 psf
At Z = 3.12 ft,
σH-soil(Z+) = Kr(z+) [r (Z(z+) + heq ] γP-EV = (0.650)[ 125 pcf (3.12 + 2)](1.35) = 562 psf
σH = 0.5(239 psf + 562 psf) = 400 psf
Based on Table E6-7.1, the vertical tributary spacing at Level 1 is Svt = 3.12 ft
The panel width, wp, is 5.00 ft (given in Step 1, Example E4)
The tributary area, Atrib, is computed as follows: Atrib = (3.12 ft)(5.00 ft) = 15.60 ft2
The maximum tension at Level 1 with the 2,300 lb/lft impact load is computed as follows:
Tmax-R = (σH)(Atrib) + CT (2,300 wp) = (400 psf)(15.60 ft2) + 1.0 [2,300 lb/ft (5 ft)]
= 6,240 + 11,500 = 17.74 k/panel of 5-ft width Second Layer (Level 2):
At Z = 4.37 ft, the following depths are computed Z = 3.12 ft (from Table E6-7.1)
Z = 3.12 ft (from Table E6-7.1)

FHWA NHI-10-025 Example E6 – Traffic Barrier Impact Loading MSE Walls and RSS – Vol II E6 – 5 November 2009
Obtain Kr by linear interpolation between 2.5Ka = 0.707 at Z = 0 and 1.2Ka = 0.340 at Z = 20.00 ft as follows:
At Z = 3.12 ft, Kr(z-)= 0.340 + (20.00 ft – 3.12 ft)(0.707-0.340)/20.00 ft = 0.650
At Z = 5.62 ft, Kr(z+)= 0.340 + (20.00 ft – 5.62 ft)(0.707-0.340)/20.00 ft = 0.604
Compute σH = kr [ r (Z + heq)]γP-EV per EQ 4-34, as follows:
γP-EV = 1.35 from Table E6-5.1
At Z = 3.12 ft,
σH(Z-) = Kr(z-) [r (Z(z-) + heq ] γP-EV = (0.650)[ 125 pcf (3.12 + 2)](1.35) = 562 psf
At Z = 5.62 ft,
σH-soil(Z+) = Kr(z+) [r (Z(z+) + heq ] γP-EV = (0.604)[ 125 pcf (5.62 + 2)](1.35) = 777 psf
σH = 0.5(562 psf + 777 psf) = 670 psf
Based on Table E6-7.1, the vertical tributary spacing at Level 2 is Svt = 2.50 ft
The panel width, wp, is 5.00 ft (given in Step 1, Example E4)
The tributary area, Atrib, is computed as follows: Atrib = (2.50 ft)(5.00 ft) = 12.50 ft2
The maximum tension at Level 2 with the 600 lb/lft impact load is computed as follows:
Tmax-R = (σH)(Atrib) + CT (600 wp) = (670 psf)(12.50 ft2) + 1.0 [600 lb/ft (5 ft)]
= 8,375 + 3,000 = 11.38 k/panel of 5-ft width
7.4 Establish factored long-term tensile resistance of soil reinforcement for extreme event
The nominal tensile resistance of galvanized steel bar mat soil reinforcement is based on the design life and estimated loss of steel over the design life during corrosion – see Example E4 for corrosion loss calculations.

FHWA NHI-10-025 Example E6 – Traffic Barrier Impact Loading MSE Walls and RSS – Vol II E6 – 6 November 2009
For W11 wires Tn = 65 ksi (0.0795 in2) = 5.17 k/wire.
Using the extreme event resistance factor, t = 1.0 as listed in Table E6-5.2, the factored
tensile resistance, Tr = 5.17 k/wire (1.0) = 5.17 k/wire.
7.5 Establish nominal and factored pullout resistance of soil reinforcement The nominal pullout resistance, Pr, of galvanized steel bar mat (grid) reinforcement is based on various parameters in the following equation:
Pr = (F*)(2b)(Le)[(σv)(γP-EV)]
Where σv = (Z + heq)
Since the steel bar mat has welded connections, it can be considered inextensible with = 1.
Assume a W11 transverse wire which has a nominal diameter of 0.374 in. The transverse spacing of transverse wires, St, is equal to 6 in. for the top two layers of reinforcement, as determined in Example Problem E4. For, St = 6 in., t/St = 0.3748 in./6 in. = 0.0623 Based on the value of t/St, the F* parameter varies from 20(t/St) at z = 0 ft to 10(t/St) at z ≥ 20 ft and greater. For t/St = 0.0623, F* = 1.247 at Z = 0 ft and F* = 0.623 at Z ≥ 20 ft Assume bar mat width, b = 1 ft for computing pullout resistance on a per foot width basis. The actual bar mat width will be computed based on comparison of the pullout resistance with Tmax. The number of longitudinal wires and thus the width of the bar mats will be determined in Example E4.. The computations for Pr are for the top two layers at z = 1.87 and 4.37, respectively. For pullout, the upper layer of soil reinforcement be designed for a pullout impact load of 1,300 lb/lft (19.0 kN/m) of wall; and the second layer be designed with a pullout impact load of 600 lb/lft (8.8 kN/m).

FHWA NHI-10-025 Example E6 – Traffic Barrier Impact Loading MSE Walls and RSS – Vol II E6 – 7 November 2009
Top Layer (Level 1)
Obtain F* at z = 1.87 ft by linear interpolation between 1.247 at Z = 0 and 0.623 at Z = 20 ft as follows: F* = 0.623 + (20.00 ft – 1.87 ft)(1.247 – 0.623)/20 ft = 1.189
Compute effective length Le as follows: The pullout resistance of the soil reinforcement to the impact load is resisted over the full-length of the reinforcements (i.e., L). Therfore, Le = L = 18 ft
Compute (σv)(γP-EV) Per Article 11.10.6.3.2 of AASHTO (2007), use unfactored vertical stress for pullout resistance. Thus, γP-EV = 1.00 (σv-soil + heq)(γP-EV) = (125 pcf)(1.87 ft + 2 ft)(1.00) = 484 psf
Compute nominal pullout resistance as follows:
Pr = (F*)(2b)(Le)[(σv-soil)(γP-EV)]
Pr = (1.0)(1.189)(2)(1.00 ft)(18 ft)(484 psf) = 20,717 lb/ft
Compute factored pullout resistance as follows:
Prr = Pr = (1.0)(20.72 k/ft) = 20.72 k/ft
The maximum pullout tension at Level 1 with the 600 lb/lft impact load and H from
Step 7.3 is computed as follows:
Tmax-PO = (σH)(Atrib) + CT (1,300 wp) = (400 psf)(15.60 ft2) + 1.0 [1,300 lb/ft (5 ft)]
= 6,240 + 6,500 = 12.74 k/panel of 5-ft width Second Layer (Level 2)
Obtain F* at z = 4.37 ft by linear interpolation between 1.247 at Z = 0 and 0.623 at Z = 20 ft as follows: F* = 0.623 + (20.00 ft – 4.37 ft)(1.247 – 0.623)/20 ft = 1.111
Compute effective length Le as follows: The pullout resistance of the soil reinforcement to the impact load is resisted over the full-length of the reinforcements (i.e., L). Therfore, Le = L = 18 ft

FHWA NHI-10-025 Example E6 – Traffic Barrier Impact Loading MSE Walls and RSS – Vol II E6 – 8 November 2009
Compute (σv)(γP-EV) Per Article 11.10.6.3.2 of AASHTO (2007), use unfactored vertical stress for pullout resistance. Thus, γP-EV = 1.00 (σv-soil + heq)(γP-EV) = (125 pcf)(4.37 ft + 2 ft)(1.00) = 796 psf
Compute nominal pullout resistance as follows:
Pr = (F*)(2b)(Le)[(σv-soil)(γP-EV)]
Pr = (1.0)(1.111)(2)(1.00 ft)(18 ft)(796 psf) = 31,836 lb/ft
Compute factored pullout resistance as follows:
Prr = Pr = (1.0)(31.84 k/ft) = 31.84 k/ft
The maximum pullout tension at Level 2 with the 600 lb/lft impact load and H from
Step 7.3 is computed as follows:
Tmax-PO = (σH)(Atrib) + CT (600 wp) = (670 psf)(12.50 ft2) + 1.0 [600 lb/ft (5 ft)]
= 8,375 + 3,000 = 11.38 k/panel of 5-ft width
7.6 Establish number of longitudinal wires at each level of reinforcement Based on Tmax-R, Tr, Tmax-PO, and Prr, the number of longitudinal wires at any given level of reinforcements can be computed as follows:
Based on tensile resistance considerations, the number of longitudinal, Nt, is computed as follows: Nt = Tmax-R/Tr
Based on pullout resistance considerations, the number of longitudinal wires, Np, is computed as follows: Np = 1 + (Tmax-PO/Prr)/(Sl)
Top Layer (Level 1) Reinforcement at Z = 1.87 ft, the number of W11 longitudinal wires for 5 ft wide panel can be computed as follows:
Tmax-R = 17.74 k/panel of 5-ft width, Tr = 5.17 k/wire
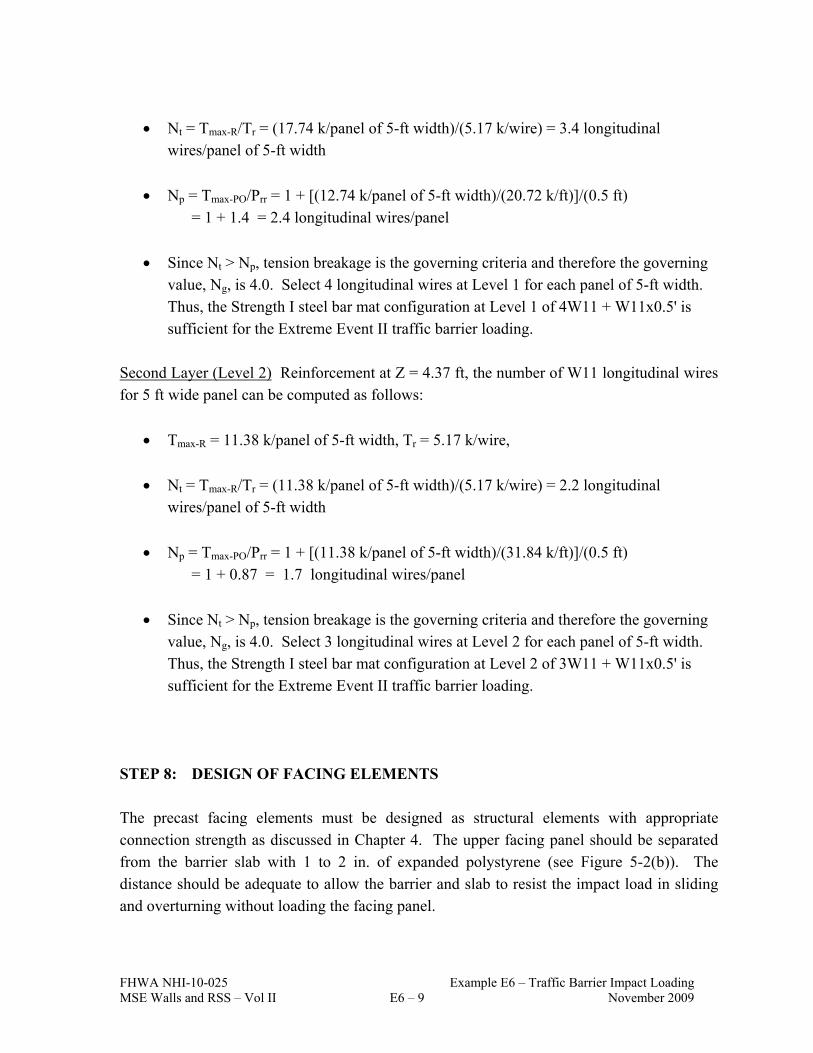
FHWA NHI-10-025 Example E6 – Traffic Barrier Impact Loading MSE Walls and RSS – Vol II E6 – 9 November 2009
Nt = Tmax-R/Tr = (17.74 k/panel of 5-ft width)/(5.17 k/wire) = 3.4 longitudinal wires/panel of 5-ft width
Np = Tmax-PO/Prr = 1 + [(12.74 k/panel of 5-ft width)/(20.72 k/ft)]/(0.5 ft) = 1 + 1.4 = 2.4 longitudinal wires/panel
Since Nt > Np, tension breakage is the governing criteria and therefore the governing value, Ng, is 4.0. Select 4 longitudinal wires at Level 1 for each panel of 5-ft width. Thus, the Strength I steel bar mat configuration at Level 1 of 4W11 + W11x0.5' is sufficient for the Extreme Event II traffic barrier loading.
Second Layer (Level 2) Reinforcement at Z = 4.37 ft, the number of W11 longitudinal wires for 5 ft wide panel can be computed as follows:
Tmax-R = 11.38 k/panel of 5-ft width, Tr = 5.17 k/wire,
Nt = Tmax-R/Tr = (11.38 k/panel of 5-ft width)/(5.17 k/wire) = 2.2 longitudinal wires/panel of 5-ft width
Np = Tmax-PO/Prr = 1 + [(11.38 k/panel of 5-ft width)/(31.84 k/ft)]/(0.5 ft) = 1 + 0.87 = 1.7 longitudinal wires/panel
Since Nt > Np, tension breakage is the governing criteria and therefore the governing value, Ng, is 4.0. Select 3 longitudinal wires at Level 2 for each panel of 5-ft width. Thus, the Strength I steel bar mat configuration at Level 2 of 3W11 + W11x0.5' is sufficient for the Extreme Event II traffic barrier loading.
STEP 8: DESIGN OF FACING ELEMENTS The precast facing elements must be designed as structural elements with appropriate connection strength as discussed in Chapter 4. The upper facing panel should be separated from the barrier slab with 1 to 2 in. of expanded polystyrene (see Figure 5-2(b)). The distance should be adequate to allow the barrier and slab to resist the impact load in sliding and overturning without loading the facing panel.

FHWA NHI-10-025 Example E6 – Traffic Barrier Impact Loading MSE Walls and RSS – Vol II E6 – 10 November 2009

FHWA NHI-10-025 Example E7 – Seismic Loading MSE Walls and RSS – Vol II E7 – 1 November 2009
EXAMPLE E7 SEGMENTAL PRECAST PANEL MSE WALL WITH SEISMIC LOADING
E7-1 INTRODUCTION This example problem demonstrates the analysis of the Example #4 MSE wall for earthquake loading. The MSE wall has a level backfill and live load surcharge, and is assumed to include a segmental precast panel face with steel grid (bar mat) reinforcements. The MSE wall configuration to be analyzed is shown in Figure E4-1. The analysis is based on various principles that were discussed in Chapter 7. Table E7-1 presents a summary of steps involved in the analysis. Each of the steps and sub-steps is sequential and if the design is revised at any step or sub-step then all the previous computations need to be re-visited. Each of the steps and the sub-steps in Table E7-1 is explained in detail herein.
Table E7-1. Summary of steps in analysis of MSE wall with seismic loading
Step Item GENERAL 1 Complete static analysis/design 2 Summarize applicable load and resistance factors EXTERNAL STABILITY 1 Establish initial wall design based on static loading 2 Establish seismic hazard, and estimate peak ground acceleration (PGA) and spectral
acceleration at 1-second, S1. 3 Establish site effects 4 Determine maximum accelerations, kmax, and peak ground velocity (PVG) 5 Obtain an average peak ground acceleration, kav, within the reinforced soil zone 6 Determine the total (static + dynamic) thrust PAE, using one of the following two
methods 1 Mononobe-Okabe (M-O) formulation 2 Generalized Limit Equilibrium (GLE) slope stability
7 Determine the horizontal inertial force, PIR, of the total reinforced wall mass 8 Check sliding stability
if sliding stability is met, go to Step 11 if sliding stability is not met, go to Step 9
9 Determine the wall yield seismic coefficient, ky, where wall sliding is initiated. 10 Determine the wall sliding displacement based on the following relationships between
d, ky/kmax, kmax, PGV, and site location 11 Evaluate the limiting eccentricity and bearing resistance 12 If Step 11 criteria are not met, adjust the wall geometry and repeat Steps 6 to 11, as
needed 13 If Step 11 criteria are met, assess acceptability of amount of sliding displacement

FHWA NHI-10-025 Example E7 – Seismic Loading MSE Walls and RSS – Vol II E7 – 2 November 2009
INTERNAL STABILITY 1 Compute the internal dynamic force, Pi, of the active wedge 2 Compute maximum combined factored loads in the soil reinforcements 3 Check tensile resistance of soil reinforcements 4 Check pullout resistance of the soil reinforcements 5 Check connection resistance GENERAL STEP 1. COMPLETE STATIC ANALYSIS/DESIGN Initial wall design based upon static loading was established in Example E4. STEP 2. SUMMARIZE APPLICABLE LOAD AND RESISTANCE FACTORS Table E7-2 summarizes the load factors for the various LRFD load type, including seismic (extreme event I), shown in second column of Tables E4-4.1 and E4-4.2. Throughout the
computations in this example problem, the forces and moments in Tables E4-4.1 and E4-4.2 should be multiplied by appropriate load factors.
Table E7-2. Summary of applicable load factors Load Factors
(after AASHTO, 2007 Tables 3.4.1-1 and 3.4.1-2) Load Combination EV EH LS EQ
Extreme Event I p p EQ = 1.00 1.00 Strength I (maximum) p = 1.35 p = 1.50 1.75 – Strength I (minimum) p = 1.00 p = 0.90 1.75 – Service I 1.00 1.00 1.00 –
For computation of factored resistances during evaluation of extreme event I limits states, appropriate resistance factors have to be used. Table E7-3 summarizes the applicable resistance factors.
Table E7-3. Summary of applicable combined static/earthquake resistance factors
Item Resistance
Factors AASHTO (2007)
Reference Sliding of MSE wall on foundation soil s = 1.00 Table 11.5.6-1 Bearing resistance b = 1.00 Article 10.5.5.3.3 Tensile resistance (for steel bar mats) t = 0.85 Table 11.5.6-1 Pullout resistance p = 1.20 Table 11.5.6-1
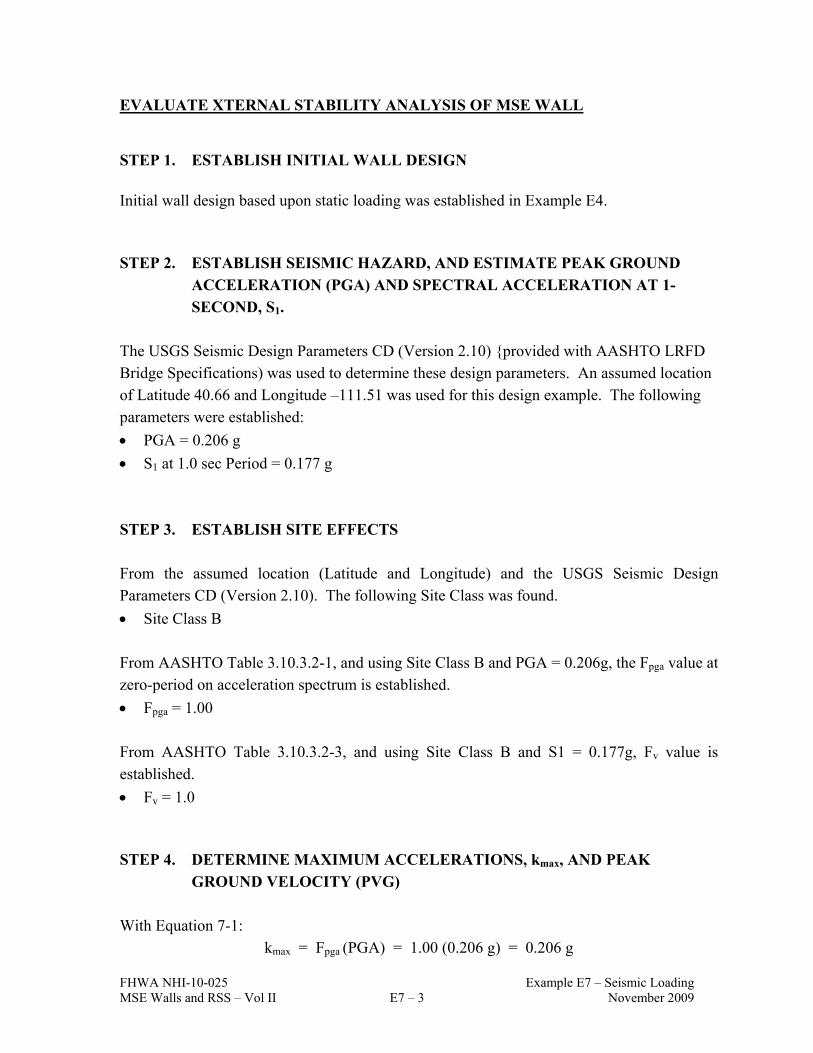
FHWA NHI-10-025 Example E7 – Seismic Loading MSE Walls and RSS – Vol II E7 – 3 November 2009
EVALUATE XTERNAL STABILITY ANALYSIS OF MSE WALL STEP 1. ESTABLISH INITIAL WALL DESIGN Initial wall design based upon static loading was established in Example E4.
STEP 2. ESTABLISH SEISMIC HAZARD, AND ESTIMATE PEAK GROUND
ACCELERATION (PGA) AND SPECTRAL ACCELERATION AT 1-SECOND, S1.
The USGS Seismic Design Parameters CD (Version 2.10) {provided with AASHTO LRFD Bridge Specifications) was used to determine these design parameters. An assumed location of Latitude 40.66 and Longitude –111.51 was used for this design example. The following parameters were established:
PGA = 0.206 g
S1 at 1.0 sec Period = 0.177 g
STEP 3. ESTABLISH SITE EFFECTS From the assumed location (Latitude and Longitude) and the USGS Seismic Design Parameters CD (Version 2.10). The following Site Class was found.
Site Class B From AASHTO Table 3.10.3.2-1, and using Site Class B and PGA = 0.206g, the Fpga value at zero-period on acceleration spectrum is established.
Fpga = 1.00 From AASHTO Table 3.10.3.2-3, and using Site Class B and S1 = 0.177g, Fv value is established.
Fv = 1.0 STEP 4. DETERMINE MAXIMUM ACCELERATIONS, kmax, AND PEAK
GROUND VELOCITY (PVG) With Equation 7-1:
kmax = Fpga (PGA) = 1.00 (0.206 g) = 0.206 g

FHWA NHI-10-025 Example E7 – Seismic Loading MSE Walls and RSS – Vol II E7 – 4 November 2009
With Equation 7-2:
PGV (in/sec) = 38 Fv S1 = 38 (1.0) (0.177 g) = 6.726
STEP 5. OBTAIN AN AVERAGE PEAK GROUND ACCELERATION, kav, WITHIN THE REINFORCED SOIL ZONE
The average peak ground acceleration, using a wall height dependent reduction factor, ,
within the reinforced soil zone, using Equation7-3, is equal to:
kav = kmax
For Site Class B and using Equation 7-4 the wall height factor, , is equal to:
1
0.206g
0.177g1.00.5ft25.640.011120%1
k
SF0.50.01H1120%
max
1v
= 1.0245 Therefore,
kav = kmax = 1.024 (0.206g) = 0.211g
STEP 6. DETERMINE THE TOTAL (STATIC + DYNAMIC) THRUST PAE The total (static + dynamic) thrust PAE, may be determined using one of the following two methods 1 Mononobe-Okabe (M-O) formulation 2 Generalized Limit Equilibrium (GLE) slope stability The M-O formulation is used for this design example. Assumptions:
kv = 0
kh = kmax = 0.206g
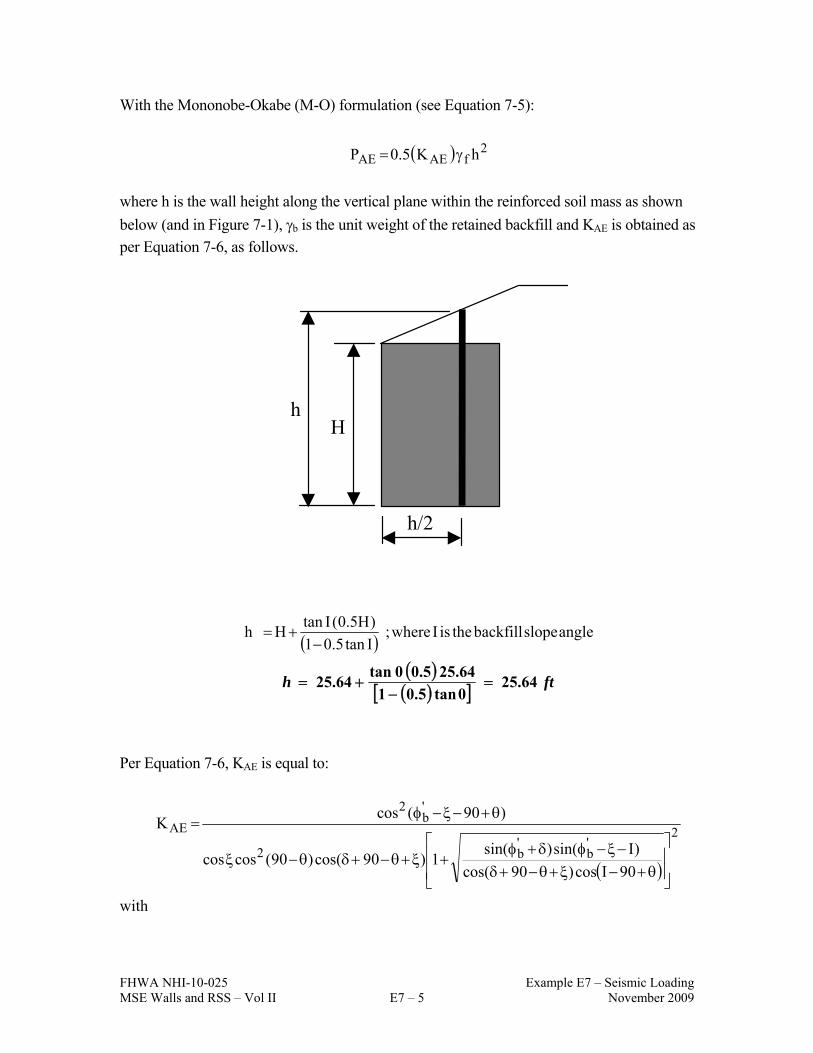
FHWA NHI-10-025 Example E7 – Seismic Loading MSE Walls and RSS – Vol II E7 – 5 November 2009
With the Mononobe-Okabe (M-O) formulation (see Equation 7-5):
2fAEAE hK5.0P
where h is the wall height along the vertical plane within the reinforced soil mass as shown
below (and in Figure 7-1), b is the unit weight of the retained backfill and KAE is obtained as
per Equation 7-6, as follows.
angleslopebackfilltheisIwhere;Itan5.01
)H5.0(ItanHh
fth 64.25
0tan5.01
64.255.00tan64.25
Per Equation 7-6, KAE is equal to:
2'b
'b2
'b
2
AE
90Icos)90cos(
)Isin()sin(1)90cos()90(coscos
)90(cosK
with
h H
h/2

FHWA NHI-10-025 Example E7 – Seismic Loading MSE Walls and RSS – Vol II E7 – 6 November 2009
11.640-1
g0.206tan
k1
ktanξ 1
v
h1
= angle of wall friction = lesser of the angle of friction for the reinforced soil mass ('r)
and the retained backfill ('b) = 30 I = the backfill slope angle = β = 0 'b = angle of internal friction for retained backfill = 30 = the slope angle of the face = 90
2
2
2
90900cos)64.11909030cos(
)064.1130sin()3030sin(1)64.11909030cos()9090(cos64.11cos
)909064.1130(cos
AEK
4782.06042.017320.0
9008.0
)64.41cos(
)36.18sin()60sin(1)64.41cos(64.11cos
)36.18(cos22
2
AEK
Therefore
k/lft65.19ft25.64lb/ft1250.47820.5hγK0.5P 232bAEAE
STEP 7 DETERMINE THE HORIZONTAL INERTIA FORCE, PIR Determine the horizontal inertial force, PIR, of the total reinforced wall mass with Equation 7-7, as follows:
PIR = 0.5(kav)(W)
where W is the weight of the full reinforced soil mass and any overlying permanent slopes and/or permanent surcharges within the limits of the reinforced soil mass. The inertial force is assumed to act at the centroid of the mass used to determine the weight W.
W = 25.64 ft (18 ft) (125 pcf) = 57.68 k/lft

FHWA NHI-10-025 Example E7 – Seismic Loading MSE Walls and RSS – Vol II E7 – 7 November 2009
PIR = 0.5(kav)(W) = 0.5 (0.211 g) (57.68 k/lft) = 6.09 k/lft
STEP 8 CHECK SLIDING STABILITY
From page 7-6, check the sliding stability using a resistance factor, , equal to 1.0 and the full,
nominal weight of the reinforced zone and any overlying permament sucharges. If the sliding stability is met, the design is satisfactory and go to Step 11. If not, go to Step 9. Compute the total horizontal force, THF, for M-O Method as follows:
THF = Horizontal component of PAE + PIR + EQ(qLS)(H)(KAE) + other horizontal nominal
forces due to surcharges (with load factor =1.0)
where, EQ is the load factor for live load in Extreme Event I limit state and qLS is the
intensity of the live load surcharge.
THF = PAE cos+ PIR + EQ(qLS)
= 19.65 k/lft (cos 30) + 6.09 k/lft + 0.5(0.25 ksf)(25.64 ft)(0.4785) =
= 17.02 k/lft + 6.09 k/lft + 1.53 k/lft = 24.64 k/lft
Compute the sliding resistance, R, as follows:
R = V (
where is the minimum of tan'r, tan'f or (for continuous reinforcement) tan (as discussed in
Section 4.5.6.a) and V is the summation of the vertical forces as follows:
V = W + PAEsin + permanent nominal surcharge loads within the limits of the reinforced
soil mass
V = W + PAEsink/lft + 19.65 k/lft (sin 30) = 57.68 + 9.84 = 67.52 k/lft
R = V (k/lft (tan 30) = 38.98 k/lft
The sliding stability capacity to demand (CDR) ratio is calculated as:
CDRsliding = R / THF = 38.98 k/lft / 24.64 k/lft = 1.58 > 1.0 O.K., and go to Step 11

FHWA NHI-10-025 Example E7 – Seismic Loading MSE Walls and RSS – Vol II E7 – 8 November 2009
STEP 11. EVALUATE ECCENTRICITY AND BEARING RESISTANCE Evaluate the limiting eccentricity and bearing resistance. Include all applicable loads for Extreme Event I. For the M-O method, add other applicable forces to PAE. Check the limit states using the following criteria: 1. For limiting eccentricity, for foundations on soil and rock, the location of the resultant of the
applicable forces should be within the middle two-thirds of the wall base for EQ = 0.0 and
within the middle eight-tenths of the wall base for EQ = 1.0. Interpolate linearly between
these values as appropriate. 2. For bearing resistance compare the bearing pressure to the nominal bearing resistance (i.e.,
use a resistance factor of 1.0) based on full width of the reinforced zone. 11.1 Limiting Eccentricity at Base of MSE Wall The purpose of these computations is to evaluate the limiting eccentricity at the base of the MSE wall. Since the computations are related to limiting eccentricity, the beneficial contribution of live load to resisting forces and moments is neglected. The computations for limiting eccentricity at the base of the MSE wall are illustrated in Table E4-6.2. Limiting eccentricity is a strength limit state check and therefore service limit state calculations are not performed. The critical values based on max/min result in the extreme force effect and govern the limiting eccentricity mode of failure.
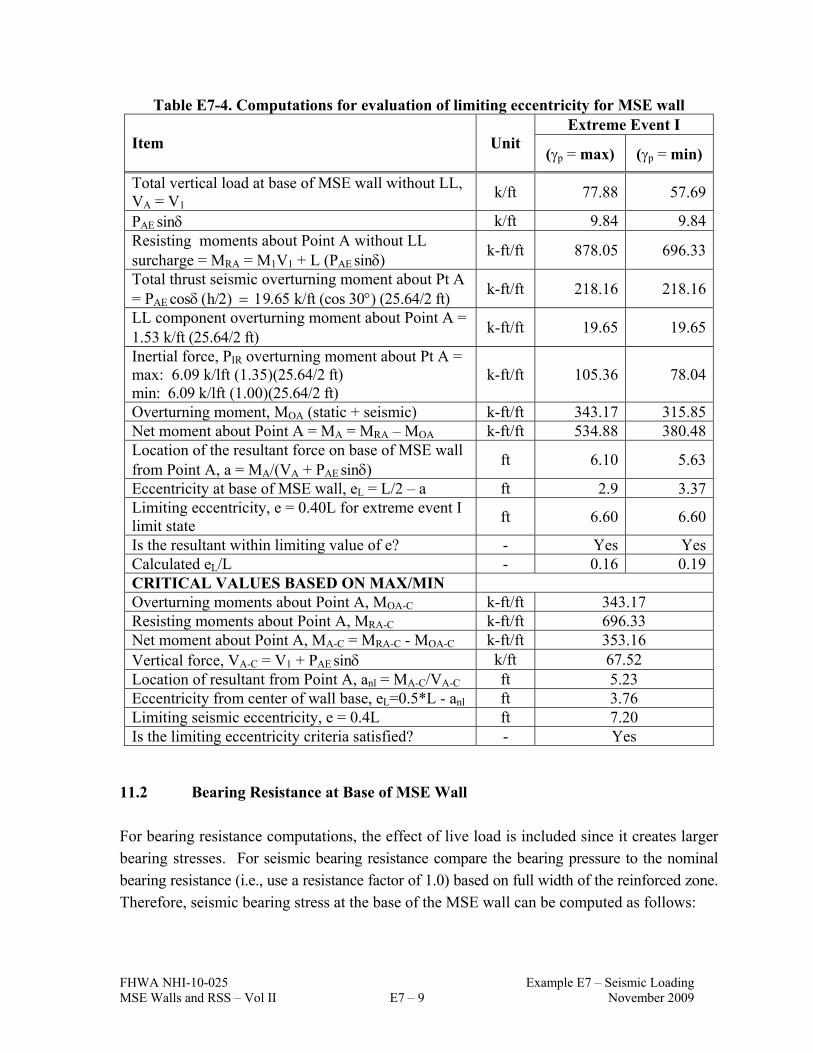
FHWA NHI-10-025 Example E7 – Seismic Loading MSE Walls and RSS – Vol II E7 – 9 November 2009
Table E7-4. Computations for evaluation of limiting eccentricity for MSE wall Extreme Event I
Item Unit (p = max) (p = min)
Total vertical load at base of MSE wall without LL, VA = V1
k/ft 77.88 57.69
PAE sin k/ft 9.84 9.84Resisting moments about Point A without LL surcharge = MRA = M1V1 + L (PAE sin
k-ft/ft 878.05 696.33
Total thrust seismic overturning moment about Pt A = PAE coshk/ft (cos 30) (25.64/2 ft)
k-ft/ft 218.16 218.16
LL component overturning moment about Point A = 1.53k/ft (25.64/2 ft)
k-ft/ft 19.65 19.65
Inertial force, PIR overturning moment about Pt A = max: 6.09 k/lft (1.35)(25.64/2 ft) min: 6.09 k/lft (1.00)(25.64/2 ft)
k-ft/ft 105.36 78.04
Overturning moment, MOA (static + seismic) k-ft/ft 343.17 315.85Net moment about Point A = MA = MRA – MOA k-ft/ft 534.88 380.48Location of the resultant force on base of MSE wall from Point A, a = MA/(VA + PAE sin
ft 6.10 5.63
Eccentricity at base of MSE wall, eL = L/2 – a ft 2.9 3.37Limiting eccentricity, e = 0.40L for extreme event I limit state
ft 6.60 6.60
Is the resultant within limiting value of e? - Yes YesCalculated eL/L - 0.16 0.19CRITICAL VALUES BASED ON MAX/MIN Overturning moments about Point A, MOA-C k-ft/ft 343.17 Resisting moments about Point A, MRA-C k-ft/ft 696.33 Net moment about Point A, MA-C = MRA-C - MOA-C k-ft/ft 353.16 Vertical force, VA-C = V1 + PAE sin k/ft 67.52 Location of resultant from Point A, anl = MA-C/VA-C ft 5.23 Eccentricity from center of wall base, eL=0.5*L - anl ft 3.76 Limiting seismic eccentricity, e = 0.4L ft 7.20 Is the limiting eccentricity criteria satisfied? - Yes
11.2 Bearing Resistance at Base of MSE Wall For bearing resistance computations, the effect of live load is included since it creates larger bearing stresses. For seismic bearing resistance compare the bearing pressure to the nominal bearing resistance (i.e., use a resistance factor of 1.0) based on full width of the reinforced zone. Therefore, seismic bearing stress at the base of the MSE wall can be computed as follows:

FHWA NHI-10-025 Example E7 – Seismic Loading MSE Walls and RSS – Vol II E7 – 10 November 2009
eL
Vv 2
where ΣV = R = V1 + VS + PAE sinis the resultant of vertical.
Table E7-5. Computations for evaluation of seismic bearing resistance (see Table E4-6.3. for static values0
Item Unit Extreme Event I
(p = max)
Static Vertical load at base of MSE wall including LL on top, ΣV = R = V1 + VS
k/ft 80.13
Seismic Vertical load at base of MSE wall, PAE sin k/ft 9.84 Total vertical load at base of MSE wall without LL, VA = R = V1 + VS + PAE sin
k/ft 89.97
Resisting moments about Point A = MRA = MV1 + MV5 + MPV
k-ft/ft 898.03
Overturning moments about Point A = MOA = MF1 + MF2 + MFIR
k-ft/ft 343.17
Net moment at Point A, MA = MRA - MOA k-ft/ft 554.86 Location of the resultant force on MSE block from Point A, a = (MRA – MOA)/VA
ft 6.17
Eccentricity at base of MSE block, eL = L/2 - a ft 2.83 Limiting eL ft 4.50 Is the resultant within limiting value of eL? ft YES Effective width of base of MSE wall, B' = L – 2e ft 12.34 Bearing stress due to MSE wall =ΣV/(B') = v ksf 7.29 Bearing resistance (10.50 ksf given in E4 for static resistance, seismic / static = 1.0/0.65, therefore, seismic resistance = 16.15 ksf)
ksf 16.15
Is bearing stress less than the bearing resistance? – YES

FHWA NHI-10-025 Example E7 – Seismic Loading MSE Walls and RSS – Vol II E7 – 11 November 2009
EVALUATE INTERNAL STABILITY ANALYSIS OF MSE WALL
STEP 1. COMPUTE INTERNAL DYNAMIC FORCE, Pi For internal stability, the active wedge is assumed to develop an internal dynamic force, Pi, that is equal to the product of the mass in the active zone and the wall height dependent average seismic coefficient, kav. Pi is computed as:
Pi = kav Wa
Wa is the soil weight of the active zone as shown by shaded area in Figure E7-1.
Wa = [0.3H(H/2) + 0.5(0.3H)(H/2)] r
Wa = [0.3 (25.64 ft)2(1/2) + 0.5(0.3)(25.64 ft)2(1/2)] 125 pcf Wa = [98.61 ft2 + 49.31 ft2 ] 125 pcf = 18.49 k/lft
Pi = 0.211g (18.49 k) = 3.90 k/lft
The inertial force is distributed to the n number of reinforcement layers equally as follows. From Example E4, n = 10.
widthpanelftklftklftk
n5/95.1/39.0
10
/90.3PT i
md
STEP 2. COMPUTE MAXIMUM FACTORED LOADS IN THE REINFORCEMENTS The load factor for seismic forces is equal to 1.0. The total factored load applied to the reinforcement on a load per unit of wall width basis is determined as follows, with Tmax the factored static load applied to the reinforcements determined using the appropriate equations in Chapters 4 and 6.
mdmaxtotal TTT
Ttotal for each layer of reinforcement is listed in Table E7-6, with Tmax from Table E4-7.4

FHWA NHI-10-025 Example E7 – Seismic Loading MSE Walls and RSS – Vol II E7 – 12 November 2009
Figure E7-1. Seismic internal stability for inextensible reinforcements.
(from Figure 4-9 and Figure 7-5)

FHWA NHI-10-025 Example E7 – Seismic Loading MSE Walls and RSS – Vol II E7 – 13 November 2009
STEP 3. CHECK TENSILE RESISTANCE OF THE SOIL REINFORCEMENTS As listed in Table E7-3, the resistance factor for metallic bar mats while evaluating tensile failure under combined static and earthquake loading is equal to 0.85. Ttotal for each layer of reinforcement is listed in Table E7-6, with Tmax and Ng from Table E4-7.4.
Table E7-6. Summary of tensile resistance computations for Extreme Event I load combination
Z H Tmax Tmd Ttotal Tn
Tn) Ng Level
ft ksf kips/ 5 ft panel k/wire
Bar Mat
Ng
k/5’ panel
CDR
1 1.87 0.40 6.25 1.95 8.20 5.17 0.85 4W11 4 17.58 2.14 2 4.37 0.67 8.36 1.95 10.31 5.17 0.85 3W11 3 13.18 1.28 3 6.87 0.87 10.80 1.95 12.75 5.17 0.85 4W11 4 17.58 1.38 4 9.37 1.03 12.77 1.95 14.72 5.17 0.85 4W11 4 17.58 1.19 5 11.87 1.15 14.26 1.95 16.21 7.42 0.85 4W15 4 25.23 1.56 6 14.37 1.23 15.23 1.95 17.18 7.42 0.85 4W15 4 25.23 1.47 7 16.87 1.26 15.71 1.95 17.66 7.42 0.85 4W15 4 25.23 1.43 8 19.37 1.27 16.03 1.95 17.98 7.42 0.85 4W15 4 25.23 1.40 9 21.87 1.37 17.10 1.95 19.05 7.42 0.85 4W15 4 25.23 1.32
10 24.37 1.51 19.05 1.95 21.00 7.42 0.85 4W15 4 25.23 1.20
Capacity to demand ratios (CDR) are greater than 1.00, therefore, tensile resistance under seismic loading is adequate for all layers of soil reinforcement.

FHWA NHI-10-025 Example E7 – Seismic Loading MSE Walls and RSS – Vol II E7 – 14 November 2009
STEP 4. CHECK PULLOUT RESISTANCE OF THE SOIL REINFORCEMENTS The seismic tensile and total tensile loads are summarized below in Table E7-7. The static factor pullout resistance values listed below, in terms of k/lft, are from Table E4-7.4.
For seismic loading conditions, the value of F*, the pullout resistance factor, is reduced to 80 percent of the value used for static design, unless dynamic pullout tests are performed to directly determine the F* value. Therefore, the static values listed must be reduced by 80% to determine seismic pullout resistance. The pullout resistance factor is equal to 0.9 and to 1.20 for static and for seismic conditions, respectively. Therefore, the factored static values listed must be multiplied by a ratio of 1.20/0.9 to determine factored seismic pullout resistance. Ttotal is presented in terms of kips per 5-foot panel width. Therefore, the static pullout values listed must be multiplied by 5 to go from a per foot to a per panel basis.
Table E7-7. Summary of pullout computations for Extreme Event I load combination
Z H Tmax Tmd Ttotal Static Pr
Seismic Pr Level
ft ksf kips/ 5 ft panel k/ft
x 80%
x 1.20/0.9
x 5 ft
k/5’ panel
CDR
1 1.87 0.44 6.25 1.95 8.20 5.16 0.8 1.33 5 27.52 3.36 2 4.37 0.67 8.36 1.95 10.31 11.25 0.0 1.33 5 60.00 5.82 3 6.87 0.87 10.80 1.95 12.75 16.47 0.8 1.33 5 87.84 6.89 4 9.37 1.03 12.77 1.95 14.72 20.75 0.8 1.33 5 110.7 7.52 5 11.87 1.15 14.26 1.95 16.21 12.06 0.8 1.33 5 64.32 3.97 6 14.37 1.23 15.23 1.95 17.18 14.50 0.8 1.33 5 77.33 4.50 7 16.87 1.26 15.71 1.95 17.66 17.41 0.8 1.33 5 92.85 5.26 8 19.37 1.27 16.03 1.95 17.98 13.27 0.8 1.33 5 70.77 3.94 9 21.87 1.37 17.10 1.95 19.05 16.12 0.8 1.33 5 85.97 4.51
10 24.37 1.51 19.05 1.95 21.00 19.66 0.8 1.33 5 104.8 4.99
Capacity to demand ratios (CDR) are greater than 1.00, therefore, pullout resistance under seismic loading is adequate for all layers of soil reinforcement.

FHWA NHI-10-025 Example E7 – Seismic Loading MSE Walls and RSS – Vol II E7 – 15 November 2009
STEP 5: CHECK CONNECTION RESISTANCE The precast facing elements must be designed as structural elements with appropriate connection strength as discussed in Chapter 4. For the Extreme Event I limit state the connection, at each level, must be designed to resist the total (static + seismic) factored load,
Ttotal. The factored long-term connection strength, Tac, must be greater than Ttotal. The
resistance factor for combined static and seismic loads for steel grid reinforcement is 0.85 (the static resistance factor is 0.65).

FHWA NHI-10-025 Example E7 – Seismic Loading MSE Walls and RSS – Vol II E7 – 16 November 2009

FHWA NHI-10-025 RSS Design Examples MSE Walls and RSS – Vol II E8 – 1 November 2009
EXAMPLE E8 REINFORCED SOIL SLOPE DESIGN – ROAD WIDENING
E8-1 INTRODUCTION A 0.6 mile (1 km) long, 16.5 ft (5 m) high, 2.5H:1V side slope road embankment in a suburban area is to be widened by one lane. At least a 20 ft (6.1 m) width extension is required to allow for the additional lane plus shoulder improvements. A 1H:1V reinforced soil slope up from the toe of the existing slope will provide 25 ft (7.6 m) width to the alignment. The following provides the steps necessary to perform a preliminary design for determining the quantity of reinforcement to evaluate the feasibility and cost of this option. The reader is referred to the design steps in section 9.2 to more clearly follow the meaning of the design sequence.
STEP 1. SLOPE DESCRIPTION a. Geometric and load requirements • H = 16.5 ft (5 m) • β = 45o • q = 200 psf (10 kPa) (for dead weight of pavement section) + 2% road grade b. Performance requirements
• External Stability: Sliding Stability: FSmin = 1.3 Overall slope stability and deep seated: FSmin = 1.3 Dynamic loading: no requirement Settlement: analysis required • Compound Failure: FSmin = 1.3 • Internal Stability: FSmin = 1.3

FHWA NHI-10-025 RSS Design Examples MSE Walls and RSS – Vol II E8 – 2 November 2009
STEP 2. ENGINEERING PROPERTIES OF FOUNDATION SOILS
• Review of soil borings from the original embankment construction indicates foundation soils consisting of stiff to very stiff, low-plasticity, silty clay with interbedded seams of sand and gravel. The soils tend to increase in density and strength with depth.
• γd = 121 lb/ft3 (19 kN/m3), ωopt = 15%, cu = 2000 psf (96 kPa), ´= 28o, and c= 0
• At the time of the borings, dw = 6.6 ft (2 m) below the original ground surface.
STEP 3. PROPERTIES OF REINFORCED AND EMBANKMENT FILL
The existing embankment fill is a clayey sand and gravel. For preliminary evaluation, the properties of the embankment fill are assumed for the reinforced section as follows:
• U.S. Sieve Size Percent passing 4 in. (100 mm) 100 ¾ in. (20 mm) 99 No. 4 (4.75 mm) 63 No. 20 (0.425 mm) 45 No. 200 (0.075 mm) 25 PI (of fines) = 10 Gravel is durable pH = 7.5
• γr = 133 lb/ft3 (21 kN/m3), ωopt = 15 %
• ' = 33o, c' = 0
• Soil is relatively inert, based on neutral pH tests for backfill and geology of area.
STEP 4. DESIGN PARAMETERS FOR REINFORCEMENT For preliminary analysis use default values.
• Long-Term Allowable Strength for Geosynthetic Reinforcement: Tal = TULT/RF
• Pullout Factor of Safety: FSPO = 1.5

FHWA NHI-10-025 RSS Design Examples MSE Walls and RSS – Vol II E8 – 3 November 2009
STEP 5. CHECK UNREINFORCED STABILITY
Using STABL4M, a search was made to find the minimum unreinforced safety factor and to define the critical zone. Both rotational and wedge stability evaluations were performed with Figure E8-1 showing the rotational search. The minimum unreinforced safety factor was 0.68 with the critical zone defined by the target factor of safety FSR as shown in Figure E8-1b. Remember that the critical zone from the unreinforced analysis roughly defines the zone needing reinforcement.
STEP 6. CALCULATE TS FOR THE FSR
From the computer runs, obtain FSU, MD, and R for each failure surface within the critical zone and calculate TS from equation 9-1 as follows. (Note: with minor code modification, this could easily be done as part of the computer analysis.) a. Calculate the total reinforcement tension TS, required:
R
MFST D
Us 3.1
Evaluating all of the surfaces in the critical zone indicates maximum total tension
TS-MAX = 3400 lb/ft (49.6 kN/m) for FSU = 0.89 as shown in Figure 9-11c.
a. Checking TS-MAX by using the design charts in Figure 9-5:
26.51.3
tan33tan
FS
tantan 1
R
r1f
From Figure 9-5, K ≈ 0.14 and,
H = H + q/γr + 0.3 ft (for 2% road grade)
= 16.5 ft + (200 psf ÷ 133 lb/ft3) + 0.3 ft = 18.3 ft (5.6 m) then,
/m)kN(46.5ftlb/3120ft18.3ftlb/1330.140.5H'γK0.5T 232rMAXS
The evaluation using Figure 9-5 appears to be in reasonably good agreement with the computer analysis for this simple problem.
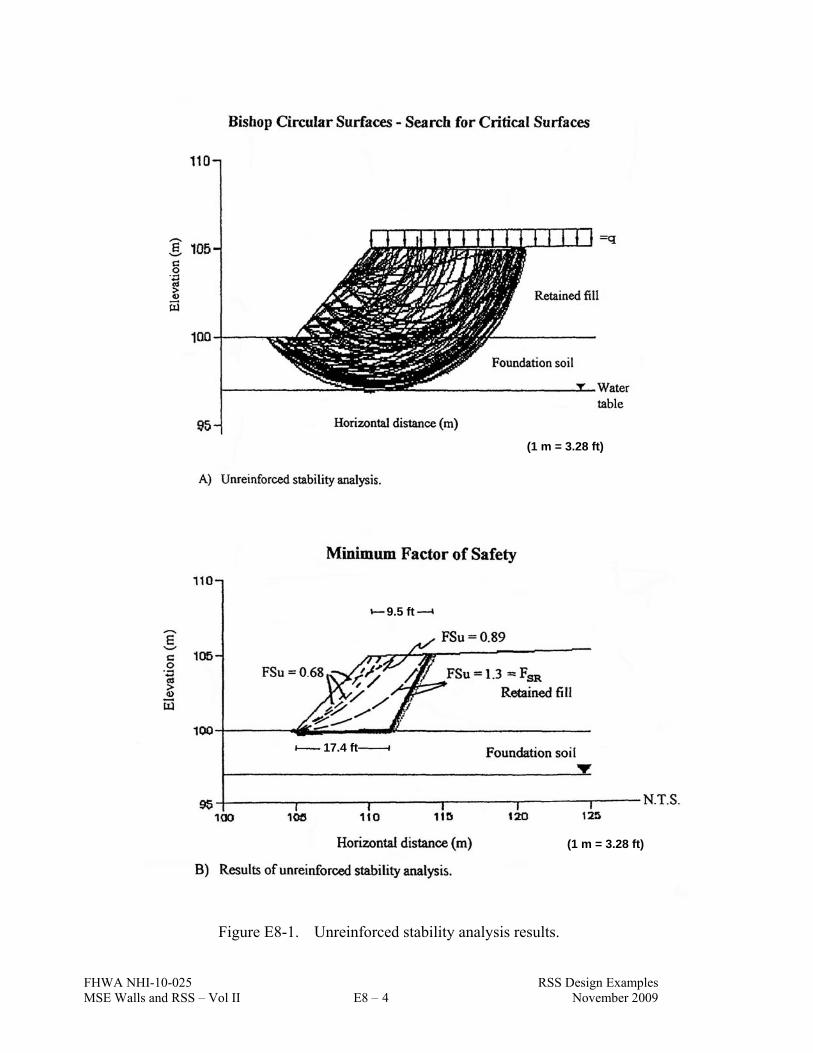
FHWA NHI-10-025 RSS Design Examples MSE Walls and RSS – Vol II E8 – 4 November 2009
Figure E8-1. Unreinforced stability analysis results.
9.5 ft
17.4 ft
(1 m = 3.28 ft)
(1 m = 3.28 ft)

FHWA NHI-10-025 RSS Design Examples MSE Walls and RSS – Vol II E8 – 5 November 2009
Figure E8-1. Unreinforced stability analysis results (continued). c. Determine the distribution of reinforcement.
Since H < 20 ft (6 m), use a uniform spacing. Due to the cohesive nature of the reinforced fill, maximum compaction lifts of 8 in. (200 mm) are recommended.
d. As discussed in the design section, to avoid wrapping the face and surficial stability
issues, use Sv = 16 in. (400 mm) reinforcement spacing; therefore, N = 16.5 ft / 1.33 ft = 12.4, use 12 layers with the bottom layer placed after the first lift of embankment fill.
ftlbftlb
N
TT MAXS /283
12
/3400max
Ts-max = 0.893400 lb/ft (49.6 kN/m)
R = 41 ft (12.5 m)
4.9 ft (1.5 m)
For R = 41 ft, Md = 340 kip-ft/ft
(1 m = 3.28 ft)
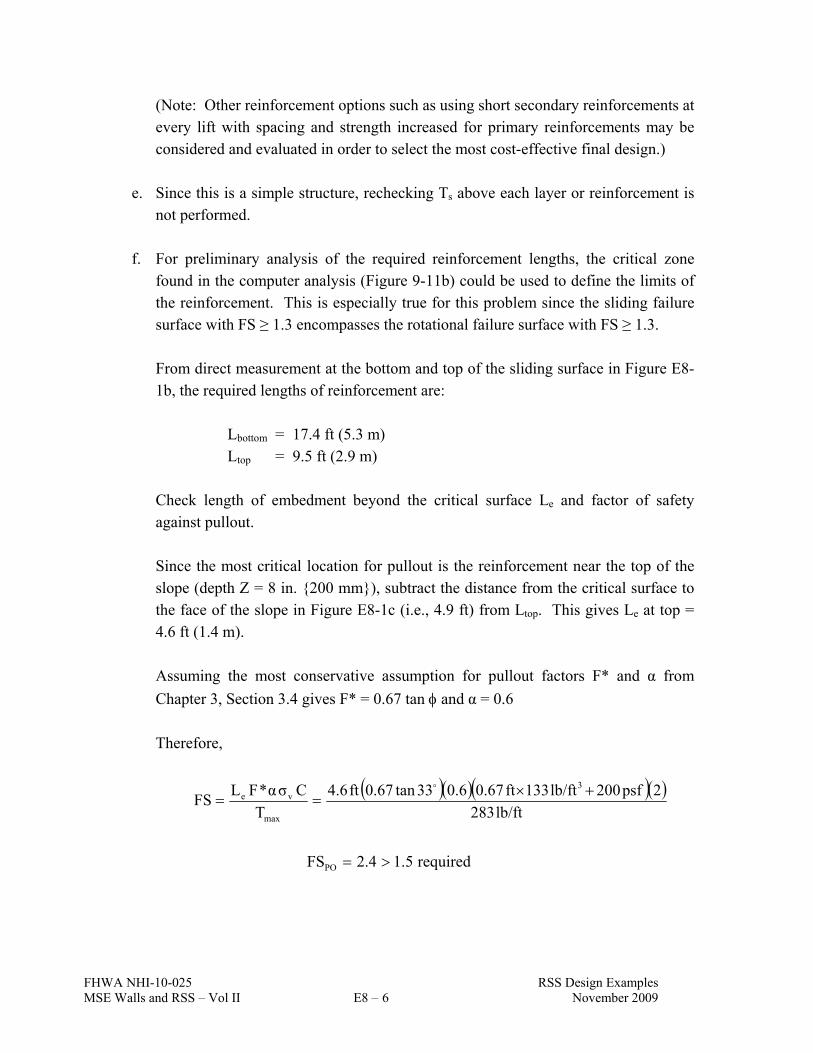
FHWA NHI-10-025 RSS Design Examples MSE Walls and RSS – Vol II E8 – 6 November 2009
(Note: Other reinforcement options such as using short secondary reinforcements at every lift with spacing and strength increased for primary reinforcements may be considered and evaluated in order to select the most cost-effective final design.)
e. Since this is a simple structure, rechecking Ts above each layer or reinforcement is
not performed. f. For preliminary analysis of the required reinforcement lengths, the critical zone
found in the computer analysis (Figure 9-11b) could be used to define the limits of the reinforcement. This is especially true for this problem since the sliding failure surface with FS ≥ 1.3 encompasses the rotational failure surface with FS ≥ 1.3.
From direct measurement at the bottom and top of the sliding surface in Figure E8-1b, the required lengths of reinforcement are:
Lbottom = 17.4 ft (5.3 m) Ltop = 9.5 ft (2.9 m)
Check length of embedment beyond the critical surface Le and factor of safety against pullout.
Since the most critical location for pullout is the reinforcement near the top of the slope (depth Z = 8 in. {200 mm}), subtract the distance from the critical surface to the face of the slope in Figure E8-1c (i.e., 4.9 ft) from Ltop. This gives Le at top = 4.6 ft (1.4 m).
Assuming the most conservative assumption for pullout factors F* and α from
Chapter 3, Section 3.4 gives F* = 0.67 tan and α = 0.6
Therefore,
lb/ft283
2psf200lb/ft133ft0.670.633tan0.67ft4.6
T
Cσα*FLFS
3
max
ve
required1.52.4FSPO
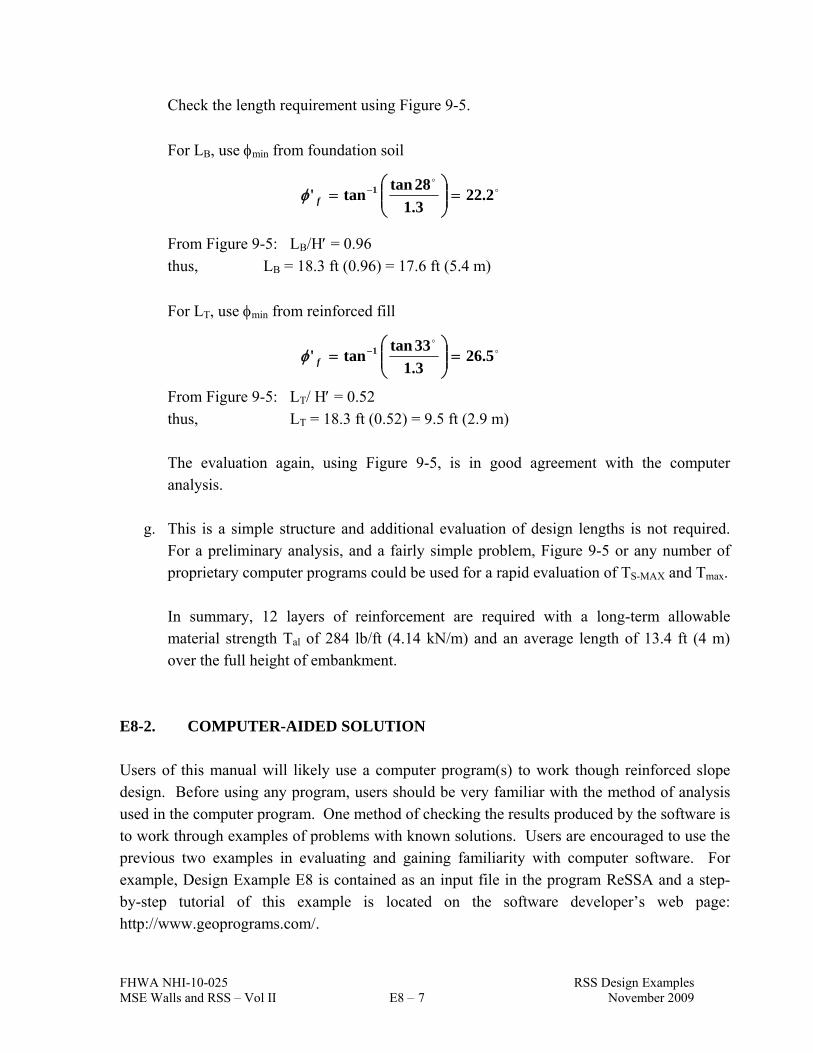
FHWA NHI-10-025 RSS Design Examples MSE Walls and RSS – Vol II E8 – 7 November 2009
Check the length requirement using Figure 9-5.
For LB, use min from foundation soil
2.223.1
28tantan' 1
f
From Figure 9-5: LB/H = 0.96
thus, LB = 18.3 ft (0.96) = 17.6 ft (5.4 m)
For LT, use min from reinforced fill
5.263.1
33tantan' 1
f
From Figure 9-5: LT/ H = 0.52
thus, LT = 18.3 ft (0.52) = 9.5 ft (2.9 m)
The evaluation again, using Figure 9-5, is in good agreement with the computer analysis.
g. This is a simple structure and additional evaluation of design lengths is not required.
For a preliminary analysis, and a fairly simple problem, Figure 9-5 or any number of proprietary computer programs could be used for a rapid evaluation of TS-MAX and Tmax.
In summary, 12 layers of reinforcement are required with a long-term allowable material strength Tal of 284 lb/ft (4.14 kN/m) and an average length of 13.4 ft (4 m) over the full height of embankment.
E8-2. COMPUTER-AIDED SOLUTION Users of this manual will likely use a computer program(s) to work though reinforced slope design. Before using any program, users should be very familiar with the method of analysis used in the computer program. One method of checking the results produced by the software is to work through examples of problems with known solutions. Users are encouraged to use the previous two examples in evaluating and gaining familiarity with computer software. For example, Design Example E8 is contained as an input file in the program ReSSA and a step-by-step tutorial of this example is located on the software developer’s web page: http://www.geoprograms.com/.

FHWA NHI-10-025 RSS Design Examples MSE Walls and RSS – Vol II E8 – 8 November 2009

FHWA NHI-10-025 RSS Design Examples MSE Walls and RSS – Vol II E9 – 1 November 2009
EXAMPLE E9 REINFORCED SOIL SLOPE DESIGN – HIGH SLOPE FOR NEW ROAD
CONSTRUCTION
E9-1 INTRODUCTION
An embankment will be constructed to elevate an existing roadway that currently exists at the toe of a slope with a stable 1.6H: 1V configuration. The maximum height of the proposed embankment will be 62 ft (19 m) and the desired slope of the elevated embankment is 0.84H:1.0V. A geogrid with an ultimate tensile strength of 6,850 lb/ft (100 kN/m) based on ASTM D6637 wide width method is desired for reinforcing the new slope. A uniform surcharge of 250 lb/ft2 (12 kPa) is to be used for the traffic loading condition. Available information indicated that the natural foundation soils have a drained friction angle of 34o and effective cohesion of 250 lb/ft2 (12 kPa). The fill to be used in the reinforced section will have a minimum friction angle of 34o. The reinforced slope design must have a minimum factor of safety of 1.5 for slope stability. The minimum design life of the new embankment is 75 years. Determine the number of layers, vertical spacing, and total length required for the reinforced section.
STEP 1. GEOMETRIC AND LOADING REQUIREMENTS FOR DESIGN
a. Slope description:
• Slope height, H = 62 ft (19 m)
• Reinforced slope angle, θ = tan-1(1.0/0.84) = 50o
• Existing slope angle, β = tan-1(0.61/1.0) = 31.4o
• Surcharge load, q = 250 psf (12.5 kN/m2) b. Performance requirements: • External stability
- Sliding: FS ≥ 1.5
- Deep seated (overall stability): FS ≥ 1.5
- Dynamic loading: no requirement
- Settlement: analysis required

FHWA NHI-10-025 RSS Design Examples MSE Walls and RSS – Vol II E9 – 2 November 2009
• Internal stability Slope stability: FS ≥ 1.5
STEP 2. ENGINEERING PROPERTIES OF THE NATURAL SOILS IN THE SLOPE
For this project, the foundation and existing embankment soils have the following strength parameters:
= 34o, c = 250 psf (12 kPa)
Depth of water table, dw = 1.5 m below base of embankment
STEP 3. PROPERTIES OF AVAILABLE FILL
The fill material to be used in the reinforced section was reported to have the following properties:
γ = 120 pcf (18.8 kN/m3), = 34o, c = 0
STEP 4. REINFORCEMENT PERFORMANCE REQUIREMENT
Allowable tensile force per unit width of reinforcement, Tal, with respect to service life and durability requirements:
Tal = TULT/RF and RF = RFID x RFCR x RFD For the proposed geogrid to be used in the design of the project, the following factors are used:
RFD = durability factor of safety = 1.25. RFID = construction damage factor of safety = 1.2. RFCR = creep reduction factor = 3.0. Note: A FS = 1.5 will be applied to the geogrid reinforcement in stability analysis.
Reduction factors were determined by the owner based on evaluation of project conditions and geogrid tests and field performance data submitted by the manufacturer. Therefore:
kN/m)(22ftlb/1520
31.21.25
ftlb/6850Tal
Pullout Resistance: FS = 1.5 for granular soils with a 3 ft (1 m) minimum length in the
resisting zone.

FHWA NHI-10-025 RSS Design Examples MSE Walls and RSS – Vol II E9 – 3 November 2009
STEP 5. CHECK UNREINFORCED STABILITY
The unreinforced slope stability was checked using the rotational slip surface method, as well as the wedge shaped failure surface method, to determine the limits of the reinforced zone and the required total reinforcement tension to obtain a factor of safety of 1.5. The proposed new slope was first analyzed without reinforcement using a hand solution (e.g., the FHWA Soils and Foundations Reference Manual, {Samtani and Nowatzki, 2006}) or computer programs such as STABL4M, ReSSA, XSTABL, or RSS. The computer program calculates factors of safety (FS) using the Modified Bishop Method for circular failure surface. Failure is considered through the toe of the slope and the crest of the new slope as shown in the design example Figure E9-1a. Note that the minimum factor of safety for the unreinforced slope is less than 1.0. The failure surfaces are forced to exit beyond the crest until a factor of safety of 1.5 or more is obtained. Several failure surfaces should be evaluated using the computer program. Next, the Janbu Method for wedge shaped failure surfaces is used to check sliding of the reinforced section for a factor of safety of 1.5, as shown on the design example Figure E9-1a. Based on the wedge shaped failure surface analysis, the limits of the critical zone to be reinforced are reduced to 46 ft (14 m) at the top and 56 ft (17 m) at the bottom for the required factor of safety.
STEP 6. CALCULATE TS FOR FSR = 1.5 a. The total reinforcement tension TS required to obtain a FSR = 1.5 is then evaluated for
each failure surface. The most critical surface is the surface requiring the maximum reinforced tension TS-MAX. An evaluation of all the surfaces in the critical zone indicated TS-MAX = 66.7 kips/ft (1000 kN/m) and is determined as:
R
MFS1.5
D
MFSFST D
UD
URS
The most critical circle is where the largest TS = TS-MAX. As shown on the design example Figure 9-12a, TS-MAX is obtained for FSU = 0.935.
For this surface, MD = 14,827 kips-ft/ft (67,800 kN-m/m) as determined stability analysis. D = R for geosynthetics = radius of critical circle R = 125.6 ft (38.3 m)
kN/m)(1000ftkips/66.7ft125.6
ftft/k148270.9351.5T MAXS

FHWA NHI-10-025 RSS Design Examples MSE Walls and RSS – Vol II E9 – 4 November 2009
Reinforcement alternatives:
From computer program: Simplified distribution:
TBottom = 67 – 31.3 = 35.7kips/ft TBottom = ½ Ts-max = 33.5 kips/ft
TMiddle = 31.3 - 10 = 21.3 kips/ft TMiddle = 1/3 Ts-max = 22.3 kips/ft
TTop = 10 kips/ft TTop = 1/6 Ts-max = 11.2 kips/ft
Figure E9-1. Unreinforced stability analysis results.
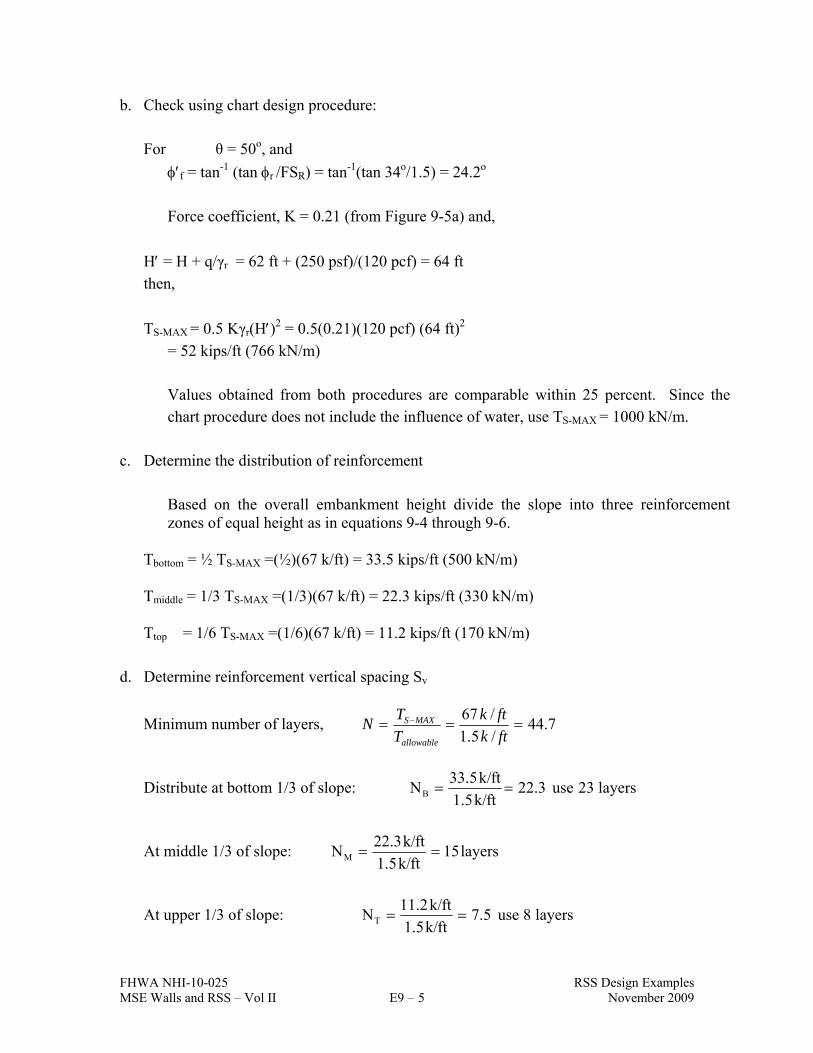
FHWA NHI-10-025 RSS Design Examples MSE Walls and RSS – Vol II E9 – 5 November 2009
b. Check using chart design procedure: For θ = 50o, and
f = tan-1 (tan r /FSR) = tan-1(tan 34o/1.5) = 24.2o
Force coefficient, K = 0.21 (from Figure 9-5a) and,
H = H + q/γr = 62 ft + (250 psf)/(120 pcf) = 64 ft
then,
TS-MAX = 0.5 Kγr(H)2 = 0.5(0.21)(120 pcf) (64 ft)2
= 52 kips/ft (766 kN/m)
Values obtained from both procedures are comparable within 25 percent. Since the chart procedure does not include the influence of water, use TS-MAX = 1000 kN/m.
c. Determine the distribution of reinforcement
Based on the overall embankment height divide the slope into three reinforcement zones of equal height as in equations 9-4 through 9-6.
Tbottom = ½ TS-MAX =(½)(67 k/ft) = 33.5 kips/ft (500 kN/m) Tmiddle = 1/3 TS-MAX =(1/3)(67 k/ft) = 22.3 kips/ft (330 kN/m) Ttop = 1/6 TS-MAX =(1/6)(67 k/ft) = 11.2 kips/ft (170 kN/m) d. Determine reinforcement vertical spacing Sv
Minimum number of layers, 7.44/5.1
/67
ftk
ftk
T
TN
allowable
MAXS
Distribute at bottom 1/3 of slope: layers23use22.3ftk/1.5
ftk/33.5NB
At middle 1/3 of slope: layers15ftk/1.5
ftk/22.3NM
At upper 1/3 of slope: layers8use7.5ftk/1.5
ftk/11.2NT

FHWA NHI-10-025 RSS Design Examples MSE Walls and RSS – Vol II E9 – 6 November 2009
Total number of layers: 46 > 44.7 OK Vertical spacing:
Total height of slope = 62 ft (19 m)
Height for each zone = 62 ft / 3 = 21 ft (6.3 m) Required spacing: At bottom 1/3 of slope:
spacingin.8useft,0.91layers23
ft62Srequired
At middle 1/3 of slope:
spacingin18usein.,1.4layers15
ft62Srequired
At top 1/3 of slope:
spacingin.24useft,2.6layers8
ft62Srequired
Provide 6 ft length of secondary reinforcement layers in the upper 1/3 of the slope, between primary layers (based on primary reinforcement spacing at a 16 in. vertical spacing.
e. The reinforcement tension required within the middle and upper 1/3 of the unreinforced
slope is then calculated using the slope stability program to check that reinforcement provided is adequate as shown in the design example Figure E9-1b.
Top 2/3 of slope: TS-MAX = 31.3 k/ft < N · Tal = 23 layers x 1.5 k/ft = 34.5 kips/ft OK Top 1/3 of slope: TS-MAX = 10 k/ft < N · Ta = 8 layers x 1.5 k/ft = 12 kips /ft OK
f. Determine the reinforcement length required beyond the critical surface for the entire
slope from Figure E9-1a, used to determine Tmax as,
Z
ft
Zpcf
ftk
CF
FSTL
ve
4.26
212066.034tan8.0
5.1/1520
*max

FHWA NHI-10-025 RSS Design Examples MSE Walls and RSS – Vol II E9 – 7 November 2009
At depth Z, from the top of the crest, Le is found and compared to the available length of reinforcement that extends behind the TDESIGN failure surface, as determined by the sliding wedge analysis:
Z = 2 ft, Le = 13.2 ft, available length, Le = 17 ft OK Z = 4 ft, Le = 6.6 ft, available length, Le = 16 ft OK Z = 6 ft, Le = 4.4 ft, available length, Le = 16 ft OK
Z = 8 ft, Le = 3.3 ft, available length, Le = 16 ft OK Z > 8 ft, Le = 3.0 ft, available length, Le = > 16 ft OK
Further checks of Z are unnecessary.
Checking the length using Figure 9-5b for f = 24°
LT/H́ = 0.65 → LT = 42 ft
LB/H́ = 0.80 → LB = 51 ft
Results from both procedures check well against the wedge failure analysis in step 5a. Realizing the chart solution does not account for the water table use top length LT = 46 ft (14 m) and bottom length LB = 56 ft (17 m) as determined by the computer analyses in step 5a.
g. The available reinforcement strength and length were checked using the slope stability
program for failure surfaces extending beyond the TS-MAX failure surface and found to be greater than required.
STEP 7. CHECK EXTERNAL STABILITY a. Sliding Stability.
The external stability was checked using the computer program for wedge shaped failure surfaces. The FS obtained for the failure surface outside the reinforced section, defined with a 46 ft (14 m) length at the top and a 56 ft (17 m) length at the bottom, was 1.5.

FHWA NHI-10-025 RSS Design Examples MSE Walls and RSS – Vol II E9 – 8 November 2009
b. Deep Seated Global Stability.
The overall deep-seated failure analysis indicated that a factor of safety of 1.3 exists for failure surfaces extending outside the reinforced section (as shown in the design example Figure E9-1b). This is due to the grade at the toe of the slope that slopes down into the lake. The factor of safety for deep-seated failure does not meet requirements. Therefore, the reinforcement would have to be extended to a greater length, the toe of the new slope should be regraded, or the slope would have to be constructed at a flatter angle.
For the option of extending the reinforcement length, local bearing must be checked. Local bearing (lateral squeeze) failure does not appear to be a problem as the foundation soils are granular and will increase in shear strength due to confinement. Also, the foundation soil profile is consistent across the embankment such that global bearing and local bearing will essentially result in the same factor of safety. For these conditions, the lower level reinforcements could simply be extended back to an external stability surface that would provide FS = 1.5 as shown in Figure E9-2.
If the foundation soils were cohesive and limited to a depth of less than 2 times the base width of the slope, then local stability should be evaluated. As an example, assume that the foundation soils had an undrained shear strength of 2080 psf (100 kPa) and extended to a depth of 33 ft (10 m), at which point the granular soils were encountered. Then, in accordance with equation 9-15,
γH
c4.14
tanθDγ
c2FS u
s
usqueezing
1.02
pcf 120ft 62
psf10404.14
tan50ft 33pcf120
psf 10402FSsqueezing
Since FSsqueezing is lower than the required 1.3, extending the length of the reinforcement would not be an option without improving the stability conditions. This could be accomplished by either reducing the slope angle or by placing a surcharge at the toe, which effectively reduces the slope angle.
c. Foundation Settlement.
Due to the granular nature of the foundation soils, long-term settlement is not of concern.

FHWA NHI-10-025 RSS Design Examples MSE Walls and RSS – Vol II E9 – 9 November 2009
Figure E9-2. Design Example 2: global stability.

FHWA NHI-10-025 RSS Design Examples MSE Walls and RSS – Vol II E9 – 10 November 2009

FHWA NHI-10-025 RSS Design Examples MSE Walls and RSS – Vol II E10 – 1 November 2009
EXAMPLE E10 REINFORCED SOIL SLOPE DESIGN – FACING STABILITY CALCULATION
E10-1 INTRODUCTION
Economies can sometimes be achieved by using higher strength primary reinforcement at wider spacing combined with short intermediate reinforcement layers to meet maximum spacing requirements, provide compaction aids and face stability. The calculations for face stability evaluation of slopes using intermediate reinforcement will be demonstrated for the slope in Example E8, with modified primary reinforcement. The guidelines for intermediate reinforcement presented under Step 6 of section 9.2 Reinforced Slope Design Guidelines will be followed. To evaluate cost alternatives in Example E8, modify primary reinforcement by doubling strength to 570 lb/ft (8.3 kN/m) and doubling vertical spacing. Intermediate reinforcement will be placed at 24 in. (800 mm) vertical spacing, centered between the primary reinforcement (at 24 in. {800 mm} spacing). The length of intermediate reinforcement will be set at 4 ft (1.2 m)
and minimum long term tensile strength, Tal, of 380 lb/ft (5.5 kN/m) will be used to meet
constructability requirements. Surficial failure planes may extend to a depth of about 3 to 6% of the slope height. Therefore, the stability safety factor will be checked for depths up to 6% of slope height, for dry conditions. Also, checks will be performed at various depths assuming saturation to that depth, to see if project conditions (e.g., local rainfall) need to be further evaluated.
E10-2. CHECK STABILITY SAFETY FACTOR FOR VARIOUS DEPTHS TO
POTENTIAL FAILURE PLANE. Compute depth equal to 6% of slope height.
(0.06) 16.5 ft = 1 ft
Check stability at 6 in., 12 in. and 24 in. depths to potential failure plane. Use Equation 9-8 with the following parameters.
sinβcosβzHγ
'tanβsinsinβcosβF'tanβcoszHγγHc'F.S.
g
2g
2wg

FHWA NHI-10-025 RSS Design Examples MSE Walls and RSS – Vol II E10 – 2 November 2009
where
c = effective cohesion — assume equal to zero, which conservatively neglects
vegetative reinforcement. See Gray and Sotir (1995), for guidance of estimating strength of vegetation, if desired to include in analysis.
= effective friction angle — 33°
γ = unit weight of fill soil — 134 lb/ft3 z = vertical depth to failure plane — ½ ft, 1 ft, 2 ft H = vertical slope height — 16.5 ft β = slope angle — 45° Fg = summation of geosynthetic resisting force — varies by z, as strength at shallow
embedment will likely be controlled by pullout resistance, therefore, compute by failure plane depth
Geosynthetic available reinforcement strength is based on pullout toward the front face of the slope (i.e., the geosynthetic resistance to the outward movement of the wedge of soil above and below the geosynthetic).
Primary reinforcement –
Ta (= Tal) = 570 lb/ft
Strength limited by pullout resistance near the face, with FSPO = 1.0, equals
T = F* α σv C Le Where, F* and α are as assumed for the geogrid in Example 1, and σv = the weight of the triangular wedge of soil over the
geosynthetic = ½γz Le = z / tan 45° = z C = 2
T = (0.8 tan 33°) (0.66) [½ (134 lb/ft3) (z)] (2) (z)
T = 46 z2 lb/ft
Therefore, @ 0.5 ft, T = 11 lb/ft @ 1.0 ft, T = 46 lb/ft @ 2.0 ft, T = 184 lb/ft

FHWA NHI-10-025 RSS Design Examples MSE Walls and RSS – Vol II E10 – 3 November 2009
Intermediate reinforcement –
Ta (= Tal) = 380 lb/ft
Strength limited by pullout resistance, with FSPO = 1.0, equals
T = F* α σv C Le
assuming F* and α parameters equal to those of the primary reinforcement again leads to,
@ 0.5 ft, T = 11 lb/ft @ 1.0 ft, T = 46 lb/ft @ 2.0 ft, T = 184 lb/ft
The slope contains 6 layers of primary reinforcement and 6 layers of intermediate reinforcement. Therefore,
@ 0.5 ft – Fg = 6 (11 lb/ft) + 6 (11 lb/ft) = 132 lb/ft @ 1.0 ft – Fg = 6 (46 lb/ft) + 6 (46 lb/ft) = 552 lb/ft @ 2.0 ft – Fg = 6 (184 lb/ft) + 6 (184 lb/ft) = 2208 lb/ft With c = 0 and dry conditions, equation (9-8) reduces to
βsinβcoszHγ
'tanβsinβsinβcosF'tanβcoszHγF.S.
2g
2
z45sin45cosft16,5lb/ft134
33tan 45sin45sin 45 cosFz33tan 45cosft16.5lb/ft134F.S.
3
2g
23
zlb/ft 1105
0.82Fzlb/ft 717F.S.
2
g2
Therefore,
@ 0.5 ft, FS = 0.84 @ 1.0 ft, FS = 1.1 @ 2.0 ft, FS = 1.5

FHWA NHI-10-025 RSS Design Examples MSE Walls and RSS – Vol II E10 – 4 November 2009
Thus, assuming cohesion equal to zero, it is computed that the slope face is unstable at shallow depths (0.5 ft to 1 ft). A small amount of cohesion may be provided by the soil fill and/or vegetation. Assume a nominal amount of cohesion (e.g., 42 psf {2 kPa}), and recompute factors of safety.
cH = 42 psf (16.4ft) = 688 lb/ft Then, the factor of safety is equal to
zlb/ft 1105
0.82Fzlb/ft 717 lb/ft 688F.S.
2
g22
and
@ 0.5 ft, FS = 2.1 @ 1.0 ft, FS = 1.7 @ 2.0 ft, FS = 1.8
Thus, with only a small amount of cohesion the slope face would be stable.
E10-3. CHECK THE SAFETY FACTOR FOR VARIOUS DEPTHS TO POTENTIAL FAILURE PLANE ASSUMING SATURATION TO THAT DEPTH, TO SEE IF REASONABLE FOR PROJECT CONDITIONS.
With parameters of γg - γw = 72 lb/ft3 and cohesion of 42 psf (implies cohesion is
derived from vegetation, and is retained under saturated conditions) Then, the factor of safety is equal to
zlb/ft 1105
0.82Fzlb/ft 385 lb/ft 688F.S.
2
g22
and @ 0.5 ft, FS = 1.8 @ 1.0 ft, FS = 1.4 @ 2.0 ft, FS = 1.5
Again, the slope is stable provided vegetation is established on the slope face. A geosynthetic erosion mat would also help maintain the face stability.

FHWA NHI-10-025 Appendix F – Other Design Procedures MSE Walls and RSS – Vol II F –1 November 2009
APPENDIX F OTHER DESIGN PROCEDURES AND ANALYSIS MODELS
F.1 Simplified Method and ASD Platform F.2 Coherent Gravity Method F.3 National Concrete Masonry Association Procedure F.4 GRS F.5 FHWA Structure Stiffness Method F.6 K-Stiffness Method F.7 Deep Patch

FHWA NHI-10-025 Appendix F – Other Design Procedures MSE Walls and RSS – Vol II F –2 November 2009
There are several means, other than the Simplified Method analysis model with the LRFD platform, which can be used for the design of MSE walls. Several of these are summarized below. Note that some design methods can be used in either a LRFD or an ASD platform. The use of the Simplified Method analysis model with the LRFD platform is recommended for the design of transportation MSE wall structures.
F.1 Simplified Method and ASD Platform As previously (Section 4.1.1) noted, Engineers have been designing MSE highway walls using an ASD (allowable stress design) procedure since MSE walls were introduced in the early 1970’s. All uncertainty in applied loads and material resistance are combined in a single factor of safety or allowable material stress. The advantages of progressing to a LRFD procedure were summarized in Section 4.4.1. Future MSE walls will be designed with the LRFD procedure. Therefore, current guidance, i.e., AASHTO Standard Specifications for Highway Bridges, 17th Edition (2002) and FHWA NHI-00-043 (Elias et al., 2001), on MSE wall design using ASD procedures will not be updated. Note that the AASHTO (2002) and FHWA (2001) ASD references will not be updated by AASHTO or FHWA, respectively. Any designers engineering MSE walls with the ASD procedures in the future may want to refer to current LRFD procedures for any updates which may also be applicable to ASD procedure designs (e.g., seismic loading for external stability analysis). The Simplified Method of analysis has been used with ASD procedures since 1996. This method was developed using FHWA research (Christopher et al., 1990) and existing design methods (i.e., coherent gravity method, tie-back wedge method) as a starting point to create a single method for agencies and vendors to use (Elias and Christopher, 1997; AASHTO, 1997; Allen et al., 2001). The simplified method uses a variable state of stress for internal stability analysis. This variable state of stress is defined in terms of a multiple of the active lateral earth pressure coefficient, Ka, and is a function of the type of reinforcement used and depth from the top of wall. This single method of design is applicable to all types of soil reinforcement. Thus, the simplified method offers the following advantages over other methods: C Straight forward by avoiding iterative processes to determine the reinforcement
requirements (i.e., it is simple and easy to use). C Justified empirically in comparison to other methods available at the time of its
development based on instrumented full scale structures, and the simplifications do not appear to compromise the Simplified Method’s accuracy (Allen et al., 2001).

FHWA NHI-10-025 Appendix F – Other Design Procedures MSE Walls and RSS – Vol II F –3 November 2009
C Found to be more accurate for upper reinforcements in sloped surcharges (Allen et al., 2001).
C Eliminates variations in method to determine internal lateral stress. C Eliminates variations in assumptions of the critical failure surface. C Accounts for the differences in reinforcement type and is easily adapted to new MSE wall
reinforcement types as they become available. The simplified method has been adapted to LRFD procedures in AASHTO (2007) and in this manual. As noted in the introduction to this section, today, the use of the Simplified Gravity analysis model with the LRFD platform is recommended for the design of transportation MSE wall structures. F.2 Coherent Gravity Method The coherent gravity method, or analysis model, has been used for several decades in the ASD procedure. It can also be used with the LRFD procedure. The 2009 AASHTO Interims note that the maximum reinforcement loads shall be calculated using the Simplified Method or the Coherent Gravity Method. For state and agencies using the Coherent Gravity Method, the load in the reinforcements shall be obtained in the same way as the Simplified Method, except: (i) for steel reinforced wall systems, the lateral earth pressure coefficient used shall be equal to ko at the point of intersection of the theoretical failure surface with the ground surface at or above the wall top, transitioning to a ka at a depth of 20.0 ft below the intersection point, and constant at ka at depths greater than 20.0 ft. and (ii) If used for geosynthetic reinforced systems, ka shall be used throughout the wall height.
AASHTO also states that other widely accepted and published design methods for calculation of reinforcement loads may be used at the discretion of the wall owner or approving agency, provided the designer develops method-specific resistance factors for the method employed. AASHTO recommends that the resistance factors recommended for the Simplified Method should also be used for the Coherent Gravity Method. The primary differences between the coherent gravity method and the simplified method are: (i) the coherent gravity method includes the pressure at each reinforcement elevation in the vertical pressure sum; (ii) the effect of the overturning moment caused by the retained backfill lateral earth pressure is included in the vertical pressure at each reinforcement elevation; and (iii) the lateral pressure varies from Ko at the top of the soil to Ka at a depth of 20 ft (6 m) below, and constant at Ka below the 20 ft (6 m) depth for metallic reinforcements. This is illustrated in Figure F-1. As discussed in Chapter 4 (and illustrated in Figure 4-9), the

FHWA NHI-10-025 Appendix F – Other Design Procedures MSE Walls and RSS – Vol II F –4 November 2009
metallic reinforcement lateral pressure varies from 1.7 Ka (strips) or 2.5 Ka (mats and grids) at top of soil to Ka at a depth of 20 ft (6 m), and constant at Ka thereafter. For comparison
purposes, for a = 34◦ soil, Ko = 1 – sin 34◦ = 0.50; for a = 34◦ soil, Ka = 0.283; thus, Ko
= 1.77 Ka. For geosynthetic reinforcements, the lateral pressure is constant at Ka for both the coherent gravity method and the simplified method. Therefore, the coherent gravity method is typically used only for metallic reinforcements. Previous research (FHWA RD-89-043) focused on defining the state of stress for internal stability, as a function of Ka, type of reinforcement used (geotextile, geogrid, metal strip or metal grid), and depth from the surface. The results from these efforts were synthesized in a simplified method, which can be used for all types of soil reinforcements. The simplified coherent gravity method is a single, logical method that can be used with LRFD or ASD procedure. As previously indicated in the Simplified Method section, there are a number of advantages to agencies. The method has been used for the past 12 years to safely design retaining walls. In comparison studies with field measured data, Allen et al. (2001) found the following:
Overall, the Simplified Method and the FHWA Structure Stiffness Method produce a prediction that is slightly conservative, whereas the Coherent Gravity Method produces a prediction that is slightly nonconservative.
The Coherent Gravity Method has been found to consistently provide lower predicted loads in structures with stiff reinforcement systems and in the upper reinforcements of sloped surcharges than measured field loads, while the Simplified Method more accurately predicts these reinforcement loads (Allen et al., 1993).
The assumption that the reinforcement stress is reduced with increased reinforcement length is questionable and not supported by field measurements.
FHWA supports the use of a single method in order to maintain consistency in design. There are always concerns that designers will be confused and combine aspects of alternate methods that could produce nonconservative results. Agencies should be cognizant of the pending change to the AASHTO LRFD code and evaluate whether or not to allow the use of the Coherent Gravity Method (and/or other methods) in addition to the Simplified Method. Agencies specifications should be updated to reflect use of just the Simplified Method or the acceptance of either method. Again, the use of the Simplified Gravity analysis model with the LRFD platform is recommended for the design of transportation MSE wall structures.
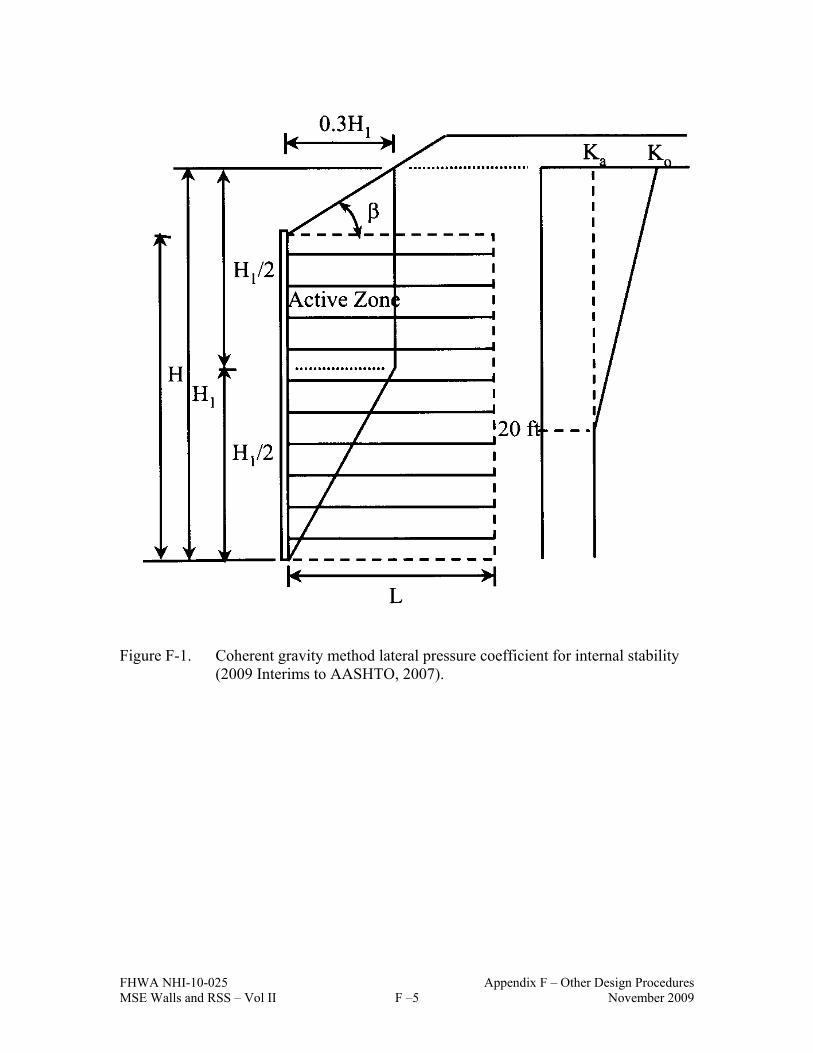
FHWA NHI-10-025 Appendix F – Other Design Procedures MSE Walls and RSS – Vol II F –5 November 2009
Figure F-1. Coherent gravity method lateral pressure coefficient for internal stability
(2009 Interims to AASHTO, 2007).

FHWA NHI-10-025 Appendix F – Other Design Procedures MSE Walls and RSS – Vol II F –6 November 2009
F.3 National Concrete Masonry Association Procedure The National Concrete Masonry Association (NCMA) method and analysis model was developed in 1993 (Simac et al.) specifically for, and is widely used with, modular block faced (a.k.a. segmental blocks), geosynthetic reinforced soil walls. It is an ASD procedure. It was updated in 1997 (NCMA), and a third update is reportedly in-progress. The principal differences between the NCMA method and the ASD Simplified Method are: (i) internal stability lateral pressure is set equal to the Coulomb active earth pressure coefficient, instead of the Rankine coefficient; (ii) assumed failure plane is the Coulomb active pressure wedge, instead of the Rankine active pressure wedge; (iii) the minimum reinforcement length to height ratio is 0.6, versus 0.7; and (iv) the connection strength requirements are based upon short-term testing, instead of being based upon long-term testing, as required by AASHTO.
F.4 GRS The Geosynthetic Reinforced Soil (GRS) analysis model is used with ASD procedure. This method was developed in Colorado specifically for geosynthetic soil reinforcements and wrap-around or block facings. The GRS design method is documented in NCHRP Report 556 (Wu et al., 2006). The GRS design method is a modification of the FHWA ASD Simplified Method (Elias et al., 2001). The soil reinforcement model is based upon closely-spaced vertically adjacent layers of reinforcement and soil arching, versus the FHWA method that this based upon a tied-back wedge model. Addtional principal differences between the GRS method and the ASD Simplified Method are: (i) the default vertical reinforcement spacing is 8 in. (0.2 m), and maximum spacing (for abutments) is 16 in. (0.4 m); (ii) the reinforcement length may be truncated in the bottom portion of the wall where the foundation is competent; (iii) the soil reinforcement is specified on a basis of minimum ultimate tensile strength and a minimum tensile stiffness; and (iv) connection strength is not a design requirement where the maximum reinforcement vertical spacing is 8 in. (0.2 m) and reinforced fill is a compacted select fill.

FHWA NHI-10-025 Appendix F – Other Design Procedures MSE Walls and RSS – Vol II F –7 November 2009
F.5 FHWA Structure Stiffness Method (from Allen et al., 2001; Christopher et al., 1990) The Structure Stiffness Method was developed as the result of a major FHWA research project in which a number of full-scale MSE walls were constructed and monitored. Combined with an extensive review of previous fully instrumented wall case histories (Christopher et al., 1990; Christopher, 1993), small-scale and full-scale model walls were constructed and analytical modeling was conducted (Adib, 1988). This method is similar to the Tieback Wedge Method, but the lateral earth pressure coefficient is determined as a function of depth below the wall top, reinforcement type, and global wall stiffness, rather than using Ka directly. Furthermore, the location of the failure surface is the same as is used for the Coherent Gravity Method (Figure 3) for MSE walls with inextensible soil reinforcement. It is a Rankine failure surface for MSE walls with extensible soil reinforcement. The design methodology is summarized in equations 8, 9, and 10. Note that because the reinforcement stress, and the strength required to handle that stress, varies with the global wall stiffness, some iteration may be necessary to match the reinforcement to the calculated stresses.
Tmax Sv Rc Kr (Z S q)
Kr = KaSrif Z≤ 6 mKr = Ka if Z > 6 m Sr = EA / (H/n)
Where, Kr is the lateral earth pressure coefficient,
Sr is the global reinforcement stiffness for the wall (i.e., the average reinforcement stiffness over the wall face area),
1 is a dimensionless coefficient equal to 1.0 for strip and sheet reinforcements or
equal to 1.5 for grids and welded wire mats,
2 is a dimensionless coefficient equal to 1.0 if Sr is less than or equal to 47880 kPa
or equal to 1 if Sr is greater than 47880 kPa, EA is the reinforcement modulus
times the reinforcement area in units of force per unit width of wall, H/n is the average vertical spacing of the reinforcement, and n is the total number of
reinforcement layers.
This stiffness approach was based on numerous full-scale observations that indicated that a strong relationship between reinforcement stiffness and reinforcement stress levels existed, and it was theoretically verified through model tests and numerical modeling.

FHWA NHI-10-025 Appendix F – Other Design Procedures MSE Walls and RSS – Vol II F –8 November 2009
F.6 K-Stiffness Method The K-Stiffness Method, or analysis model, is relatively new method that may be used with the ASD or LRFD procedure. This method was researched and developed by Allen and Bathurst (2003), Allen et al. (2003), Allen et al. (2004) and was calibrated against measurements of loads and strains from a large database of full-scale geosynthetic and full-scale steel reinforced soil walls. The method is targeted to accurately predict working loads in the soil reinforcement, though wall behavior near failure of some of the walls by excessive deformation or rupture was considered in the development of the design model (see Allen et al., 2003) to insure that such behavior would be precluded if the K-Stiffness Method is properly used and design parameters properly selected. From that research, the K-Stiffness method defined a design limit state that has not been considered in the other design models – a soil failure limit state. This is especially important for geosynthetic walls, since the geosynthetic reinforcement continues to strain and gain tensile load long after the soil has reached its peak strength and begun dropping to a residual value. Therefore, if the strain in the soil is limited to prevent it from going past peak to a residual value, failure by excessive deformation or rupture is prevented and equilibrium is maintained. This is a key design philosophy in the K-Stiffness design model. An analysis of the K-Stiffness predictions relative to the full scale measurements indicate that the K-Stiffness method is a more accurate method for estimating loads in the soil reinforcements than other currently available design models and thereby has the potential to reduce reinforcement requirements and improve the economy of MSE walls (Allen et al., 2003 and 2004). The improvement (i.e., economy) is significant for both geosynthetic and steel reinforcement, though more pronounced for geosynthetic reinforcements. A couple of geosynthetic reinforced walls have been designed using the K-Stiffness Method, built, and fully instrumented by the Washington State Department of Transportation (WSDOT). Because they were designed with the K-Stiffness Method, the amount of soil reinforcement in the wall was reduced by a third to one-half of the reinforcement required by the AASHTO Simplified Method. Results reported by Allen and Bathurst (2006) for the largest wall (36 ft high, 600 ft long) indicate that the K-Stiffness method accurately predicted the strains in the reinforcement, and the wall has performed well since its construction. The other wall has also performed well, and full results for both walls will be available in a forthcoming WSDOT research report. The K-Stiffness Method’s ability to accurately predict reinforcement strains provides promise for having the ability to accurately predict wall deformations for the serviceability limit state. See Allen and Bathurst (2003) for additional details on this issue.

FHWA NHI-10-025 Appendix F – Other Design Procedures MSE Walls and RSS – Vol II F –9 November 2009
The K-Stiffness method has been adapted to LRFD design procedure by the Washington DOT, and load and resistance factors to use with this method are detailed in the WSDOT Geotechnical Design Manual (2006), as well as step-by-step procedures for use of the K-Stiffness Method for design of MSE walls. The method begins with a prediction of the total lateral load to be resisted by the soil reinforcement which is consistent with the approach used by the Simplified Method. The K-Stiffness Method then takes that total lateral load and adjusts it empirically based on the effects of global reinforcement stiffness, local reinforcement stiffness, facing stiffness/toe restraint, facing batter, soil shear strength, and distribution of the total lateral force to the individual layers based on observations from many full scale wall case histories. The formulation of global reinforcement stiffness is consistent with that used in the FHWA Structure Stiffness Method (Christopher et al., 1990; Christopher, 1993). The soil shear strength (the plane strain shear strength is used for this method) is used as an index to correlate to the stiffness of the soil backfill, which is the real property of interest with regard to prediction of soil reinforcement loads at working stress conditions. Note that the methods used in historical practice (e.g., the Simplified Method) calculate the vertical stress resulting from gravity forces within the reinforced backfill at each level, resulting in a linearly increasing gravity force with depth and a lateral stress distribution that continuously increases with depth below the wall top. The K-Stiffness Method instead calculates the maximum gravity force resulting from the gravity forces within the reinforced soil backfill to determine the maximum reinforcement load within the entire wall reinforced backfill, Tmxmx, and then adjusts that maximum reinforcement load with depth for each of the layers using a load distribution factor, Dtmax to determine Tmax. The method is summarized as follows:
VpLLfprpV qSH , and
vHpfsfblocalgtVv SDKST maxmax 5.0
where,
V = the factored pressure due to resultant of gravity forces from soil self weight
within and immediately above the reinforced wall backfill, and any surcharge loads present (KSF)
P = the load factor for vertical earth pressure EV
LL = the load factor for live load surcharge per the AASHTO LRFD Specifications
q = live load surcharge (KSF) H = the total vertical wall height at the wall face (FT) S = average soil surcharge depth above wall top (FT)

FHWA NHI-10-025 Appendix F – Other Design Procedures MSE Walls and RSS – Vol II F –10 November 2009
V = vertical stress increase due to concentrated surcharge load above the wall
(KSF) Sv = tributary area (assumed equivalent to the average vertical spacing of the reinforcement at each layer location when analyses are carried out per unit length of wall), in FT K = is an index lateral earth pressure coefficient for the reinforced backfill, and shall be set equal to K0 as calculated per Article 3.11.5.2 of the AASHTO LRFD Specifications. K shall be no less than 0.3 for steel reinforced systems. Dtmax = distribution factor to estimate Tmax for each layer as a function of its depth below the wall top relative to Tmxmx (the maximum value of Tmax within the wall) Sglobal = global reinforcement stiffness (KSF)
g = global stiffness factor
local = local stiffness factor
fb = facing batter factor
fs = facing stiffness factor
H = horizontal stress increase at reinforcement level resulting from a concentrated
horizontal surcharge load per Article 11.10.10.1 of the AASHTO LRFD Specifications (KSF)
The WSDOT GDM (2006, or most current update) should be consulted for the details on the calculation of Tmax for each layer and how to apply this methodology to MSE wall design. It should be noted that the K-Stiffness Method has been updated to consider a number of additional wall case histories, and additionally to consider the effect of backfill soil cohesion. See Bathurst et al. (2008) for details. While consideration of soil cohesion does help to improve the K-Stiffness Method prediction accuracy for wall backfill soil that contain a significant cohesive component to its soil shear strength, in general, it is not recommended to consider soil cohesion in the soil backfill for design purposes due to unknown long-term effect of moisture infiltration in the backfill and possibly soil creep.

FHWA NHI-10-025 Appendix F – Other Design Procedures MSE Walls and RSS – Vol II F –11 November 2009
F.7 Deep Patch The deep patch is a mitigation technique for sliding roadway sections. It is typically used on roads that suffer from chronic slide movements that are primarily the result of side cast fill construction. One of the main advantages of the deep patch technique is that it is constructed with equipment that works from the roadway and does not require accessing the toe of the failed area. This technique is generally not expected to completely arrest movement seen in the road but rather slow it down to manageable levels. Deep patch repairs consist of reinforcing the top of a failing embankment with several layers of soil reinforcement. This work is typically done with a small construction crew consisting of a laborer, hydraulic excavator, and a dump truck. The design is based on determining the extent of the roadway failure based on visual observations of cracking and then and then using analytical or empirical methods for determining the reinforcement requirements. An empirical design procedure is presented in Highway Deep Patch Road Embankment Repair Application Guide which was produced by the U.S. Department of Agriculture (USDA) Forest Service in partnership with FHWA Federal Lands Highway Division. An analytical approach is summarized as follows:
1. Characterize the existing soil properties, new fill properties if applicable, and establish
the desired slope stability factor of safety after the deep patch mitigation technique is implemented.
2. Generate a cross section of the failed embankment at a location that represents the most
severe movement. 3. Locate the cracks furthest from the edge of the embankment slope break (hinge point) on
the cross section. Similar to the concept of MSE wall internal active and restive mechanisms the active portion of the embankment movement will be considered to be taking place on the outside of the embankment crack limits and the resisting portion on the inside of the crack limits.
4. Determine the distance from the crack limits to the embankment slope hinge. 5. Determining the total reinforcement tension required per unit width as described in
Chapter 9 or using reinforced soil slope software. 6. Based on the site limitations and geometry determine the reinforcement spacing and
corresponding number of reinforcement layers (Typically 2-5 layers). Divide Ts by the

FHWA NHI-10-025 Appendix F – Other Design Procedures MSE Walls and RSS – Vol II F –12 November 2009
number of layers to obtain the required reinforcement tensile strength per layer and per unit width (Treq’d).
7. Determine the minimum required pullout length (Le) by using a factor of safety of 1.5
and setting Treq’d = Tmax. Determine the minimum reinforcement length by adding Le to the distance from the crack to the slope face for each layer.
8. Select a reinforcement in which the long-term allowable strength per unit width (Chapter
3) is greater then Treq’d.