

Design and analysis of complex 3D tolerance · PDF file• B.R. Fischer, Mechanical...
25
Design and analysis of complex 3D tolerance stacks Francesco Leali, Francesco Gherardini, Cristina Renzi, Davide Panari Modena, May 05 th 2017
Transcript of Design and analysis of complex 3D tolerance · PDF file• B.R. Fischer, Mechanical...

Design and analysis of
complex 3D tolerance stacks
Francesco Leali, Francesco Gherardini,
Cristina Renzi, Davide Panari
Modena, May 05th 2017

OUTLINE
• Goals
• State of the art:
• Open issues
• Analysis methods
• Tolerance design method
• Case study:
• Aims
• Input
• Approach
• Output
• Conclusions and future developments
2

GOALS
Development of a method for the analysis and design of 3D tolerance stacks in a gearbox assembly.
The method aims to identify the main sources (contributors) of variation within the tolerance stacks in order to:
• Integrate the tolerance design in the gear analysis and optimization platform (OR 1)
• Evaluate the tolerance contribution in the noise and vibration analysis (OR 2).
Integrated design method
3
Scientific problem
Management of spatial dimensional variations and 3D
tolerance stacks to achieve high performance and
robust solutions

STATE OF THE ART
• Open Issues
1. Integrated design methods for 3D tolerance stacks calculation
a. Lack of integration in the design process
b. Restricted application fields (mainly aerospace and automotive, as in the case of car chassis or frame)
4
• B.M. Colosimo, N. Senin, Geometric tolerances - Impact on Product Design, Quality Inspection and Statistical Process Monitoring, Springer, 2011.
• B.R. Fischer, Mechanical Tolerance Stackup and Analysis, Second Edition, CRC Press, 2011.
• Barbero B.R., Azcona J.P. and Pérez J. G. A tolerance analysis and optimization methodology. The combined use of 3D CAT, a dimensional hierarchization matrix and an optimization algorithm. The International Journal of Advanced Manufacturing Technology, 2015, 81(1-4), 371-385.
• K.W. Chase, A. Parkinson, A survey of research in the application of tolerance analysis to the design of mechanical assemblies, Research in Engineering Design, 1991, Volume 3, Issue 1, pp 23-37.
Experienced in the analysis of tolerance stacks in the automotive assembly field.
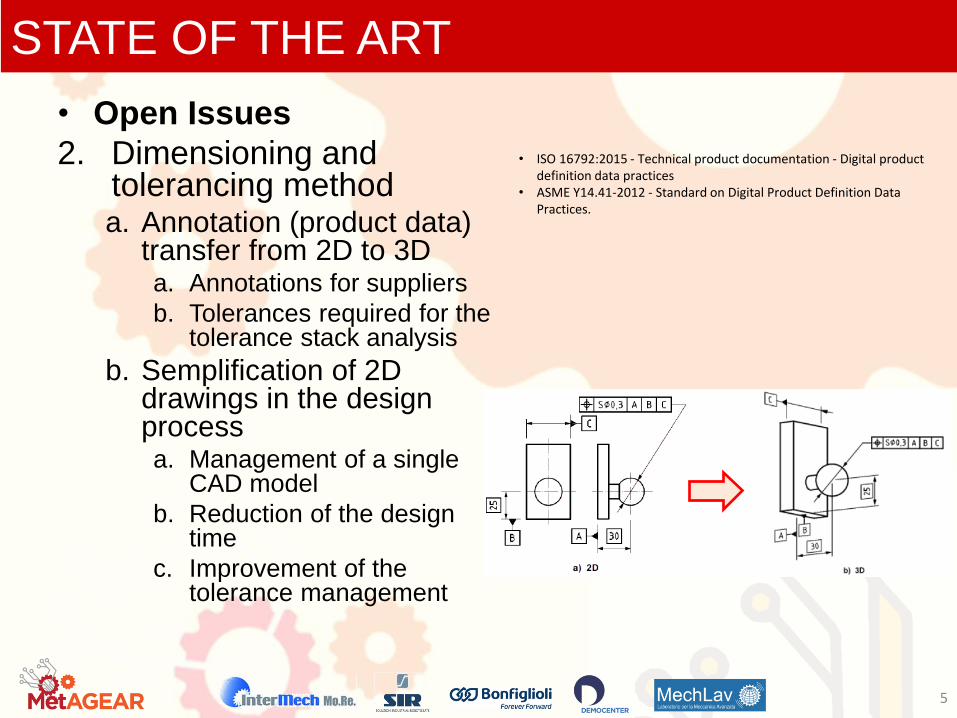
STATE OF THE ART
• Open Issues
2. Dimensioning and tolerancing method a. Annotation (product data)
transfer from 2D to 3D a. Annotations for suppliers
b. Tolerances required for the tolerance stack analysis
b. Semplification of 2D drawings in the design process a. Management of a single
CAD model
b. Reduction of the design time
c. Improvement of the tolerance management
5
• ISO 16792:2015 - Technical product documentation - Digital product definition data practices
• ASME Y14.41-2012 - Standard on Digital Product Definition Data Practices.
STATE OF THE ART
• The main methods employed in Industries for the tolerance stack calculation are «manual» methods, developed by means of spreadsheet:
6
Easy implementation and use by means of spreadsheets
Fast and affordable for easy monodimensional (1D) applications
Unuseful in complex applications, especially when more than one
dimension is considered
Lack of evaluation of 3D effects due to geometrical tolerances
Low integration in the design process
Implemented in the final step of product design
Tolerance values based on technician know-how
Analysis methods
Traditional method
Worst Case (WC)
Statistical method
Root Sum Square (RSS)
Range Range2 Distr. G U
+ 0,10
- 0,10
+ 0,20
- 0,20
+ 0,20
- 0,20
+ 0,35
- 0,35
+ 0,15
- 0,15
+ 0,20
- 0,20
+ 0,40
- 0,40
+ 0,30
- 0,30
+ 0,50
- 0,50
+ 0,30
- 0,30
+ 0,15
- 0,15
+ 0,20
- 0,20
+ 0,75
- 0,75
+ 1,50
- 1,50
+ 0,40
- 0,40
+
-
Tol.Dettaglio catena tolleranze Note
0,20 G 0,04Tolleranza attrezzatura (maschera elemento) 0,04T1
G 0,64
G
T2
0,49 G 0,49
G0,40 0,16Tolleranza posizione + ripetibilità attrezzatura
15,60
2,25Viene dichiarato anche toll.
±0,3
1,97
RANGE
QUADRATIC EQUATION
1,97
3,95
G 9,00
G 0,16
Per Pallet Fissi
FORO Lavorato di
macchina H7
G 1,00
9,00
T11
Tolleranza di SLD (MIG)
0,36
0,64
0,36
2,25 G
T5
T9
G 0,09
0,36 G
0,09
0,16
1,00
0,8
0,6
1,0
1,5Tolleranza forature di macchina post-welding telaio
Tolleranza Gioco perno-foro rif. (da STD 0,13)
T14
0,16
3,0
T12
T13
0,16
Tolleranza SLD (Punti)
Svergolatura su Profilo Estruso (mm/M per largh. 50mm)
0,3Tolleranza Attrezzatura (perno fisso MP telaio)
Tolleranza Perno-Foro MP Telaio
0,40
0,64 Tab. UNI EN755/9T15 Tolleranza Cancavità e Convessità (sp. ≤5mm Largh. Fino a 60mm) 0,8 0,64 G
T3
Tolleranze di Stampaggio
Tolleranza tassello fisso su elemento 0,40
T6
T7
T8
T4 Tolleranza tassello mobile su elemento
Tolleranza di Chiodatura
Tab. UNI EN755/9
T10 Tolleranza Attrezzatura (perno mobile MP telaio) 0,6 0,36 G
0,09 G 0,09
Per Pallet Mobili
0,4
0,16 G 0,16
0,16
0,70
0,30
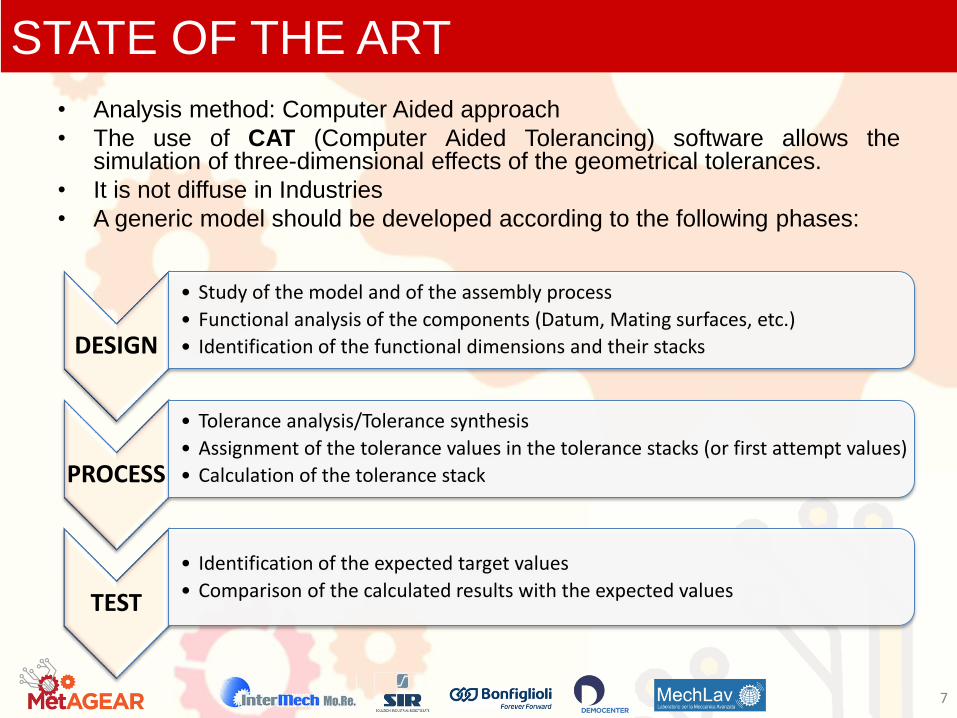
STATE OF THE ART
• Analysis method: Computer Aided approach
• The use of CAT (Computer Aided Tolerancing) software allows the simulation of three-dimensional effects of the geometrical tolerances.
• It is not diffuse in Industries
• A generic model should be developed according to the following phases:
7
DESIGN
• Study of the model and of the assembly process
• Functional analysis of the components (Datum, Mating surfaces, etc.)
• Identification of the functional dimensions and their stacks
PROCESS
• Tolerance analysis/Tolerance synthesis
• Assignment of the tolerance values in the tolerance stacks (or first attempt values)
• Calculation of the tolerance stack
TEST
• Identification of the expected target values
• Comparison of the calculated results with the expected values

TOLERANCE DESIGN METHOD
• Computer-based approach for design and analysis of tolerance stacks, focused on gearbox assembly
• Key features of the method: – Three-dimensional approach –
Variational model
– Monte Carlo Analysis method
– Integrated on the design environment
– Implemented in the early design phases
– Identification of the main contributors
– Simulation of the assembly process
– Identification of tolerancing schemes
8
Import component
Functional analysis
Tolerance specification and/or allocation
Assembly process modeling
Analysis and results
Analysis method steps

TOLERANCE DESIGN METHOD
INPUT STRATEGY OUTPUT
• Part geometry • Design approach: Bottom-up & Top-down
• Statistical analysis
• Assembly sequence • Statistical approach: based on Monte Carlo method
• Sensitivity analysis
• Tolerances (dimensional, geometrical, general)
• Part simulation: as rigid model
• Animation
• Measurements
9
Software: 3DCS – DCS, Inc. Dimensional Control System • Add-in Workbench • Fully integrated in CATIA V5
3D Tolerance stack analysis steps:

CASE STUDY
C41 GEARBOX ASSEMBLY
• An optimal gearing generates a reduction of noise and vibration on the structure
Identification of functional measures to be controlled in the tolerance stack analysis:
1. Centre distance variation
2. Clearance variation between components (shafts, bearings,…)
3. Teeth clearance variation
10

CASE STUDY: 3D Tolerance stack analysis
Centre distance
variation in x and y
directions (output side)
11
x
y
Δx
Δy
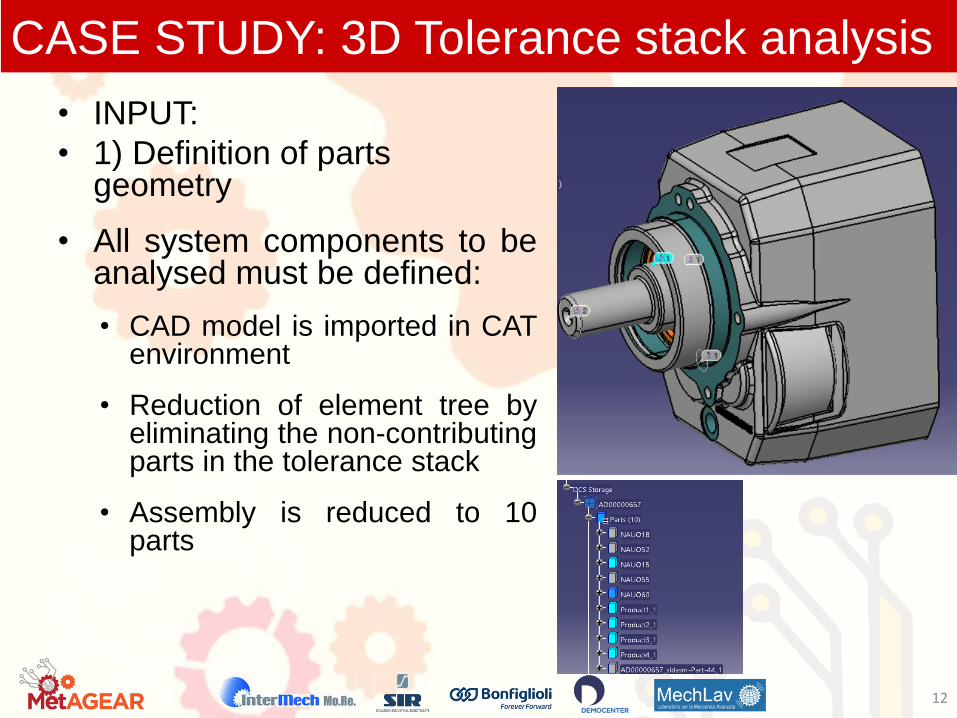
CASE STUDY: 3D Tolerance stack analysis
• INPUT:
• 1) Definition of parts geometry
• All system components to be analysed must be defined:
• CAD model is imported in CAT environment
• Reduction of element tree by eliminating the non-contributing parts in the tolerance stack
• Assembly is reduced to 10 parts
12
CASE STUDY: 3D Tolerance stack analysis
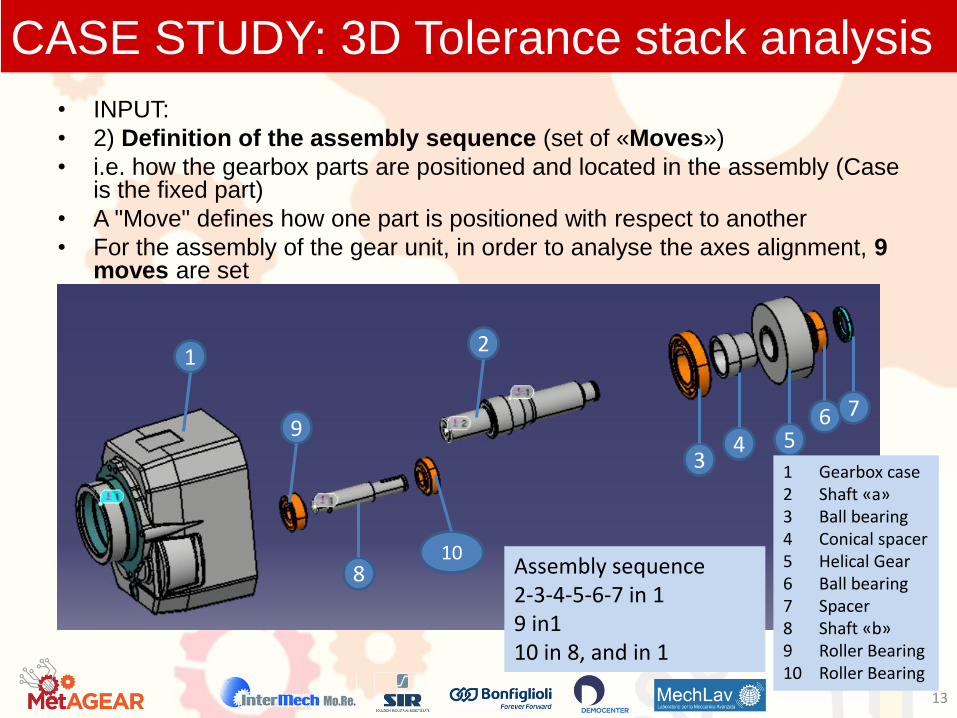
• INPUT:
• 2) Definition of the assembly sequence (set of «Moves»)
• i.e. how the gearbox parts are positioned and located in the assembly (Case is the fixed part)
• A "Move" defines how one part is positioned with respect to another
• For the assembly of the gear unit, in order to analyse the axes alignment, 9 moves are set
13
9
1 2
3 4 5
6 7
8 10
Assembly sequence 2-3-4-5-6-7 in 1 9 in1 10 in 8, and in 1
1 Gearbox case 2 Shaft «a» 3 Ball bearing 4 Conical spacer 5 Helical Gear 6 Ball bearing 7 Spacer 8 Shaft «b» 9 Roller Bearing 10 Roller Bearing

CASE STUDY: 3D Tolerance stack analysis
• INPUT: 2) Definition of the assembly sequence (set of Moves)
14
1st move
Ball bearing to shaft
Spacer to shaft
2nd move
…
Into the case
9th move
CASE STUDY: 3D Tolerance stack analysis
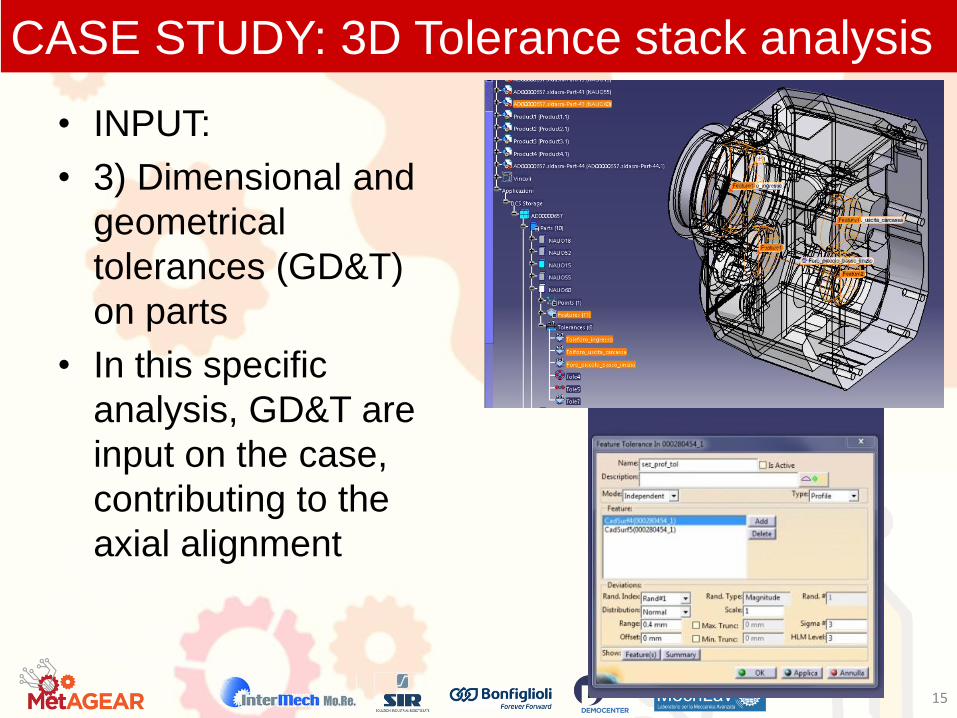
• INPUT:
• 3) Dimensional and
geometrical
tolerances (GD&T)
on parts
• In this specific
analysis, GD&T are
input on the case,
contributing to the
axial alignment
15
CASE STUDY: 3D Tolerance stack analysis
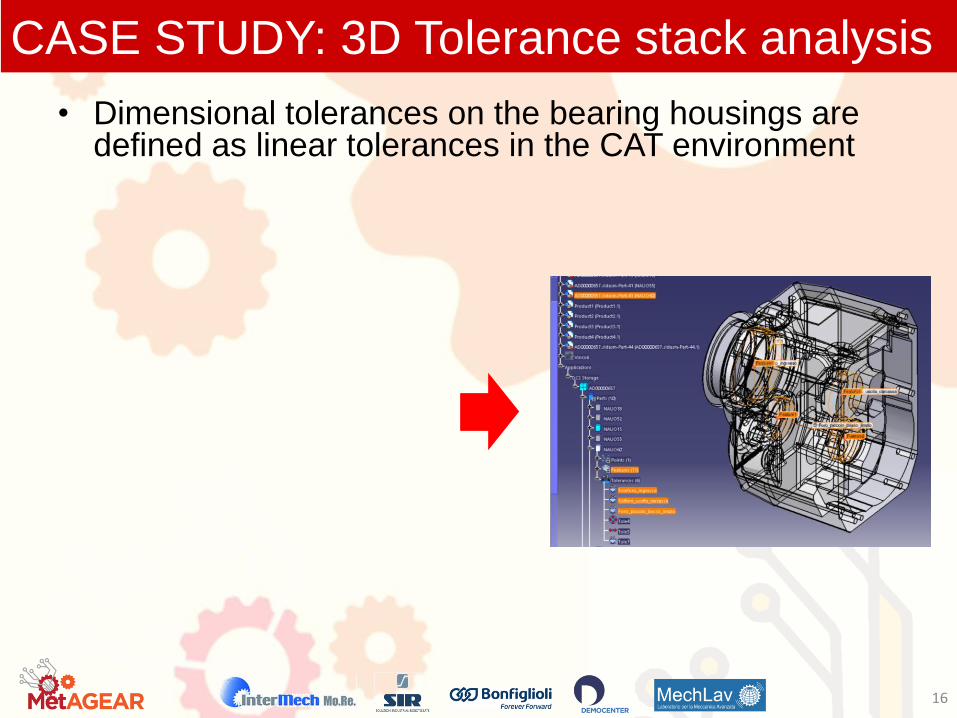
• Dimensional tolerances on the bearing housings are defined as linear tolerances in the CAT environment
16
CASE STUDY: 3D Tolerance stack analysis
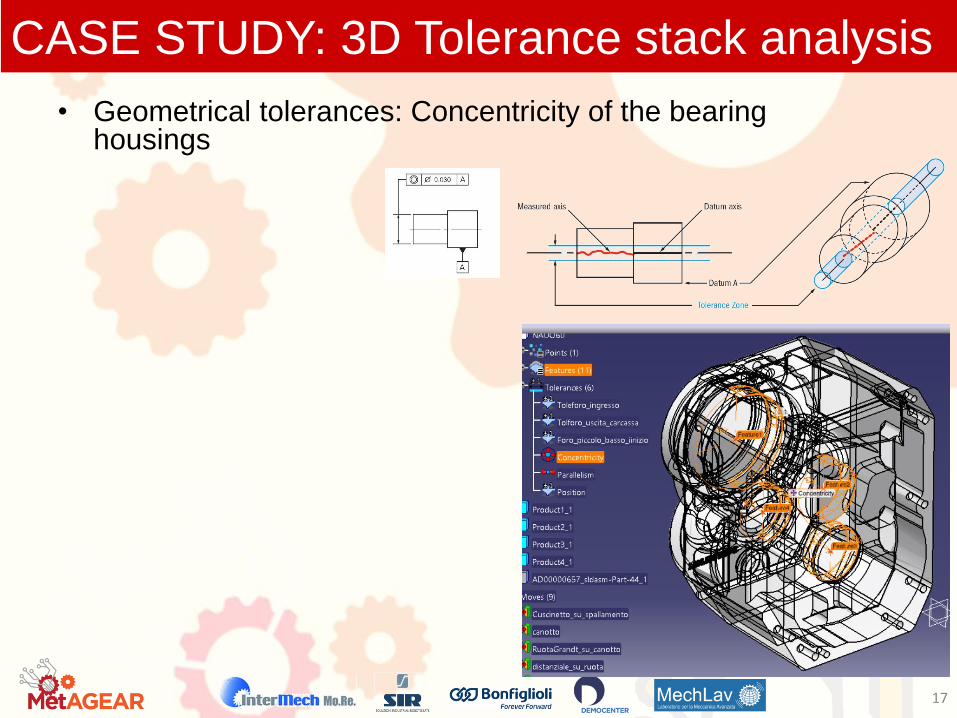
• Geometrical tolerances: Concentricity of the bearing housings
17
CASE STUDY: 3D Tolerance stack analysis
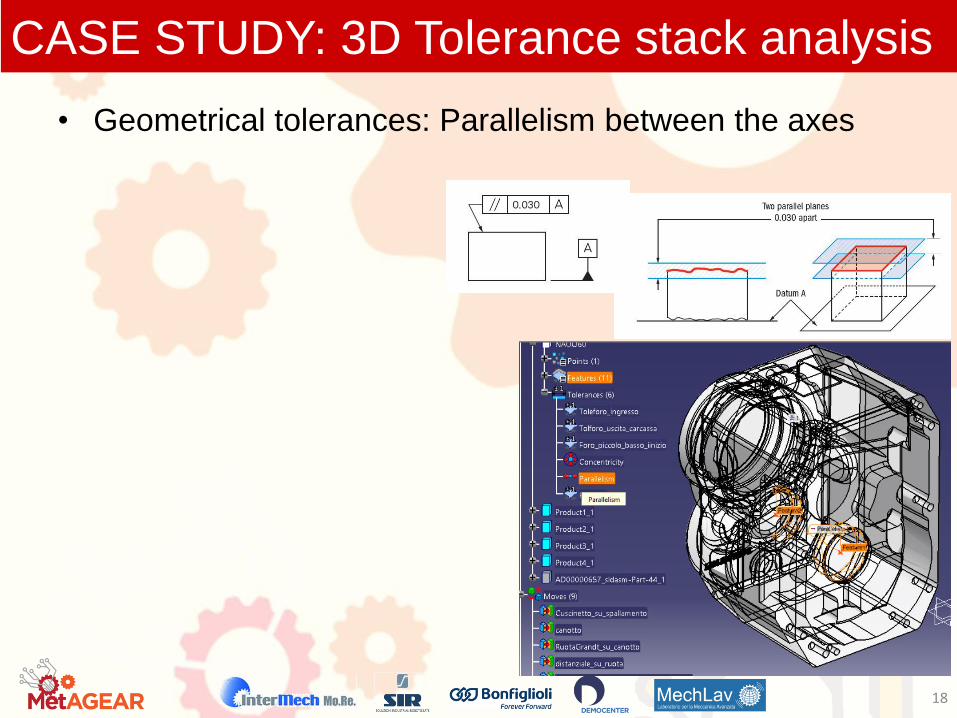
• Geometrical tolerances: Parallelism between the axes
18

CASE STUDY: 3D Tolerance stack analysis
• Geometrical tolerances: Position of the bearing housings
19
CASE STUDY: 3D Tolerance stack analysis
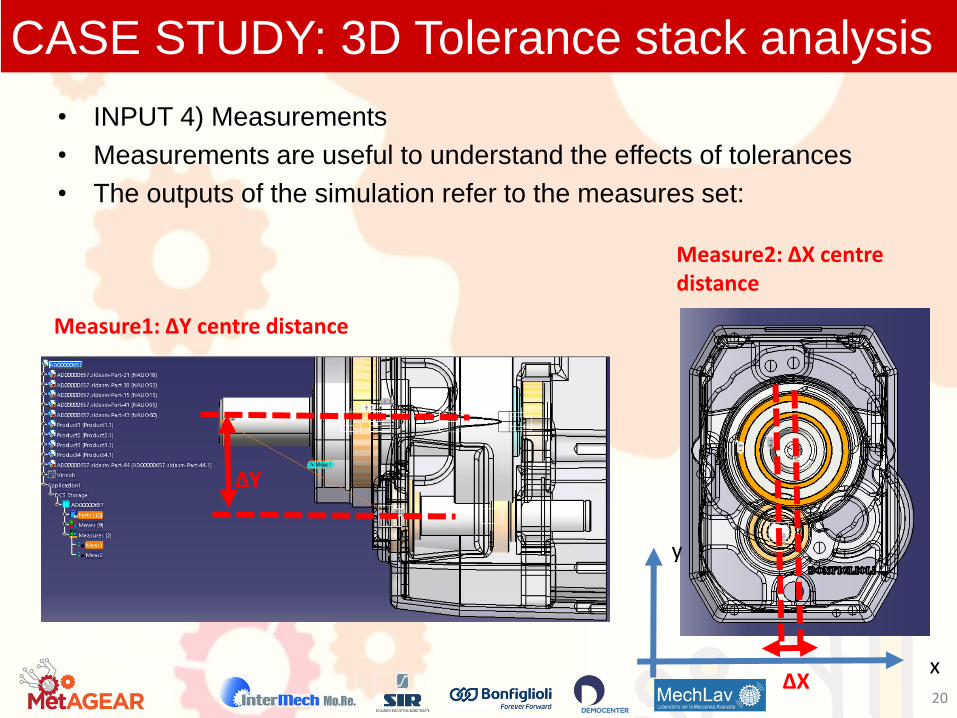
• INPUT 4) Measurements
• Measurements are useful to understand the effects of tolerances
• The outputs of the simulation refer to the measures set:
20
Measure1: ΔY centre distance
Δy
x
y
Measure2: ΔX centre distance
ΔY
ΔX

CASE STUDY: 3D Tolerance stack analysis
• Approach
– The bottom-up approach (in the first phase) is the analytical approach, starting from
the part tolerances up to the assembly tolerances, in order to determine if the objective
of the model is met.
– The top-down approach (in the second phase) is a synthesis approach starting from
the assembly tolerances: the tolerances on single parts have to be allocated in order
to achieve the assembly tolerance.
– In both these approaches, the engineers know where to focus in their design, and the
ability to create “what-if” studies allow them to determine solutions that include both
process and tolerances to keep costs down and quality up.
• Statistical approach based on the Monte Carlo method
– The software simulates the part variations within their tolerance ranges by means of a
Monte Carlo simulation: in each run, each tolerance varies its value according to a
randomized value.
– Each tolerance may assume different statistical distribution (Gaussian, Weibul,
uniform, etc.) in order to simulate different manufacturing conditions.
• Part simulation as rigid model
– Simulate loading parts on fixture system without parts distortion
21

CASE STUDY: 3D Tolerance stack analysis
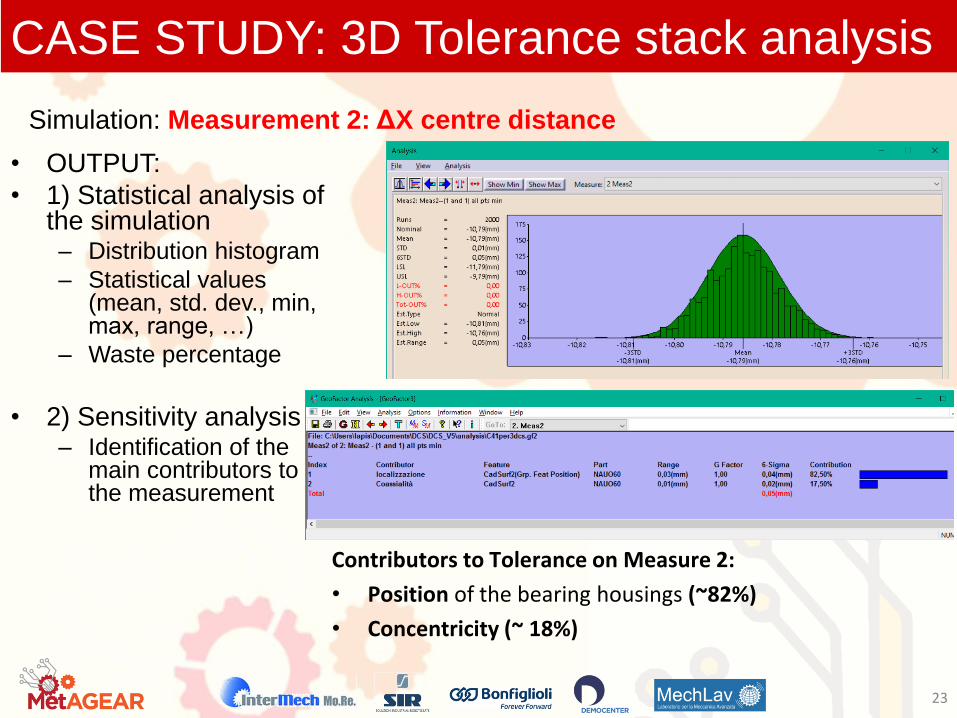
• OUTPUT:
• 1) Statistical analysis of the simulation – Distribution histogram
– Statistical values (mean, std. dev., min, max, range, …)
– Waste percentage
• 2) Sensitivity analysis – Identification of the
main contributors to the measurement
22
Simulation: Measurement 1: ΔY centre distance
Contributors to Tolerance on Measure 1:
• Position of the bearing housings (58,5%)
• Parallelism between the axes (29%)
• Concentricity (12,5%)
CASE STUDY: 3D Tolerance stack analysis
• OUTPUT:
• 1) Statistical analysis of the simulation – Distribution histogram
– Statistical values (mean, std. dev., min, max, range, …)
– Waste percentage
• 2) Sensitivity analysis – Identification of the
main contributors to the measurement
23
Simulation: Measurement 2: ΔX centre distance
Contributors to Tolerance on Measure 2:
• Position of the bearing housings (~82%)
• Concentricity (~ 18%)
CONCLUSIONS
• Conclusions – Identification of the main contributors to variation (which may require
tightening their tolerance values)
– The contributors deemed less critical can be relaxed, increasing tolerances and allowing the use of less expensive manufacturing processes (cost reduction)
– “What-if” studies: in order to test design changes by modifying tolerance values on parts and by assessing how their contributions to variation will change, or by modifying the assembly process
• Future developments – Complete the analysis of the case study (C41)
– Assess the tolerance design method in case studies with different functional and tolerance requirements
– Integrate the tolerance design method in the whole design process (3D Modelling, CAE simulation, Design/manufacturing engineering)
– Define tolerance schemes in order to increase performance and reduce manufacturing and quality control costs
– Develop a Knowledge-based framework (design archetype) to support the designers in the design and optimization of gearboxes
24