Description of the ASEC data, its formats and...
30
Description of the ASEC data, its formats and locations Table of Contents Description of the ASEC data, its formats and locations ................................................................ 2 1. Aragats Solar Neutron Telescope (ASNT) ..................................................................................................... 2 1.1. Structure of the information content from ASNT ....................................................................................... 3 2. Nor-Amberd Multidirectional Muon Monitor (NAMMM) ........................................................................ 10 2.1. Structure of the information content from NAMMM ............................................................................... 11 3. Nor-Amberd and Aragats Neutron Monitors (NANM & ArNM) ............................................................. 18 4. The basic detecting unit of the SEVAN network ......................................................................................... 21 4.1. Structure of the information content from SEVAN detector ..................................................................... 21 5. MAKET-ANI Extensive Air Shower Detector............................................................................................. 23 6. Aragats Multidirectional Muon Monitor (AMMM) ................................................................................... 25 7. References ....................................................................................................................................................... 30
Transcript of Description of the ASEC data, its formats and...
Description of the ASEC data, its formats and locations
Table of Contents
Description of the ASEC data, its formats and locations................................................................ 2
1. Aragats Solar Neutron Telescope (ASNT) .....................................................................................................2 1.1. Structure of the information content from ASNT .......................................................................................3
2. Nor-Amberd Multidirectional Muon Monitor (NAMMM)........................................................................10 2.1. Structure of the information content from NAMMM ...............................................................................11
3. Nor-Amberd and Aragats Neutron Monitors (NANM & ArNM) .............................................................18
4. The basic detecting unit of the SEVAN network .........................................................................................21 4.1. Structure of the information content from SEVAN detector.....................................................................21
5. MAKET-ANI Extensive Air Shower Detector.............................................................................................23
6. Aragats Multidirectional Muon Monitor (AMMM) ...................................................................................25
7. References .......................................................................................................................................................30
2
Description of the ASEC data, its formats and locations
The Aragats Space-Environmental Center (ASEC) provides monitoring of different species of secondary cosmic rays at three altitudes. The ASEC, (Chilingarian, et al., 2003; Chilingarian, et al., 2005) consists of two high altitude stations on Mt. Aragats in Armenia and Yerevan headquarters of Cosmic Ray Division (CRD) of Yerevan Physics Institute (YerPhI). Geographic coordinates for Aragats station is 40°28'N, 44°10'E and for Nor-Amberd station is 40°22'N, 44°15'E, Yerevan - 40°11'N, 44°31'E, cutoff rigidity: ~7.1 GV, altitudes 3250m, 2000m and 1000 m correspondingly. At these 3 destinations different types of particle detectors are continuously measure the intensity of the secondary cosmic ray fluxes and send data to the Internet in real time. In this report we present short description of the ASEC detectors and data acquisition possibilities as well as obtained data structures and Internet links.
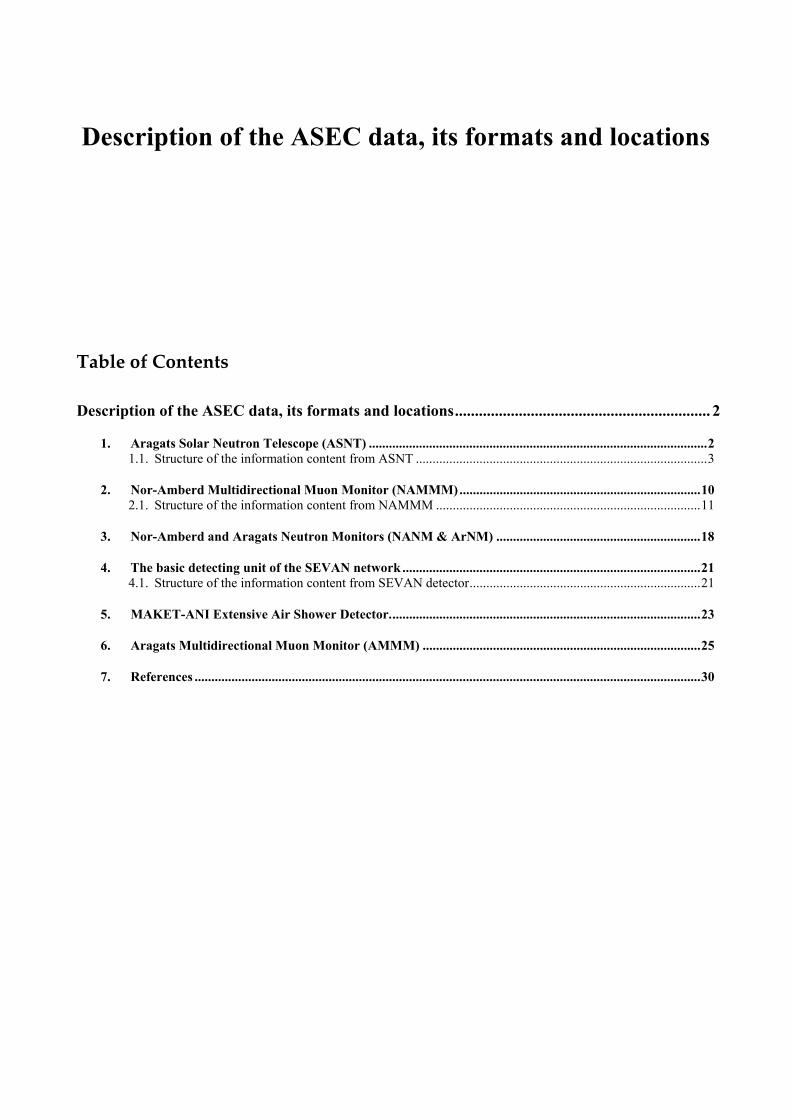
1. Aragats Solar Neutron Telescope (ASNT) Aragats Solar Neutron Telescope (ASNT) located on the slope of the mountain Aragats in
Armenia, 3250m above sea level. Geographical coordinates is 40°28'N, 44°10'E. ASNT is formed from 4 separate identical modules, as shown in Figure 1. Each module consists of standard slabs of 50x50x5 cm3 plastic scintillators stacked vertically on a 100x100x10 cm3 horizontal plastic scintillator slab. Scintillator slabs are fine polished to provide good optical contact of the assembly. The slab assembly (scintillator housing) is covered by white paper from the sides and bottom and firmly kept together with special belts. Total thickness of the assembly is 60 cm. Four detectors of 100x100x5 cm3 size each located above the thick scintillator assembly as is seen in Figure 1, are used to indicate if charged particle traverse near vertically. This information is used for selecting neutral particles and “vetoing” charged particles. A scintillator light capture cones and Photo Multiplier Tubes (large cathode, FEU 49 type) are located on the top of scintillator housing in special iron shielding, where as well the Amplitude-to-digital convertor and other electronics is located.
Figure 1 The assembly of ASNT with enumeration of 8 measuring channels(scintillators) and chart indicating orientation of detector axes relative to direction to the North Pole.
3
1.1. Structure of the information content from ASNT Initial goal of the ASNT was to be a part of the worldwide network aimed to detect neutrons
born in photosphere and reach Earth bringing direct information from its origin. The network is coordinated by the Solar-Terrestrial laboratory of the Nagoya University (Tsuchiya et al., 2001) and consists of seven same type detectors distributed at different longitudes to observe the sun 24 hours daily. In addition to the primary goal of detecting the direct neutron flux from the Sun, the SNT also has the possibility to detect charged fluxes (mostly muons and electrons) and roughly measure the direction of the incident muons. Also ASNT constitutes a central part of the new surface array to be in operation at Aragats in 2009 (see MAKET section below). The main ASNT trigger reads and stores the analog signals (PMT outputs) from all 8 channels if at least one channel reports signal. The frequency of triggers is ~4 KHz due to hit of charged and neutral particles. Big advantage of ASNT is additional, so called, software triggers, exploiting the information from Amplitude-Digital-Converters (ADC) on energy releases in scintillators.
This, additional information, not assessable yet from other particle detectors from world-wide networks, allows as we will see, solving additional physical problems. The software triggers are not fixed in electronics and it is possible to remote add or change them very flexible. The list of available information from modernized ASNT is as follows:
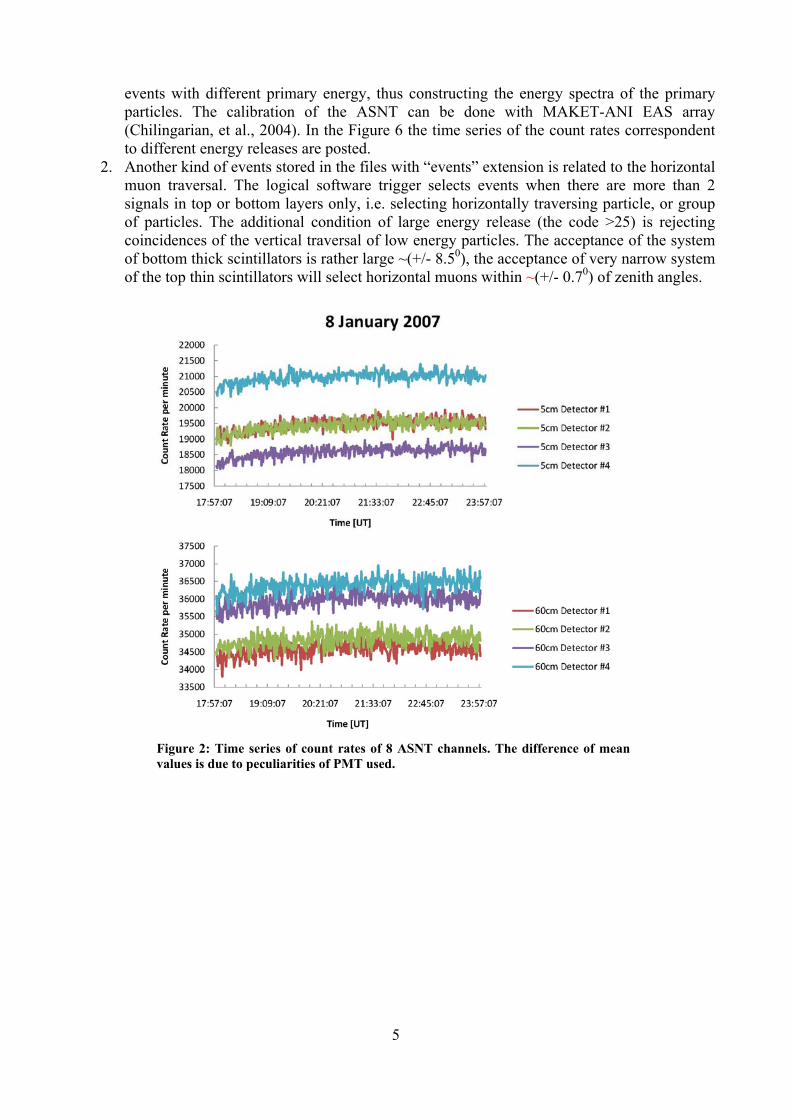
1. 1 minute count rates (easily can be changed to 10 seconds, or to another time span) of all 8 channels of ASNT (see Table 1, Figure 2);
2. Count rates from 3. different incident directions separately, 16 possible coincidences of 4 upper and 4 bottom
scintillators are related to 9 different directions (see Table 2); 4. Count rates of the special coincidences (see details in Table 3, Figure 3); 5. Estimates of the variances of count rates of each ASNT channel, variances are calculated by
12 five-second count rates (see Table 4, Figure 4); 6. 8 x 8 correlation matrix of ASNT channels calculated by five-second count rates in 1
minute (see Table 5); 7. Count rates correspondent to old SNT 4 threshold on the energy release in thick scintillators
(see Table 6); 8. The same as in previous point put only for particles that did not registered in upper layer
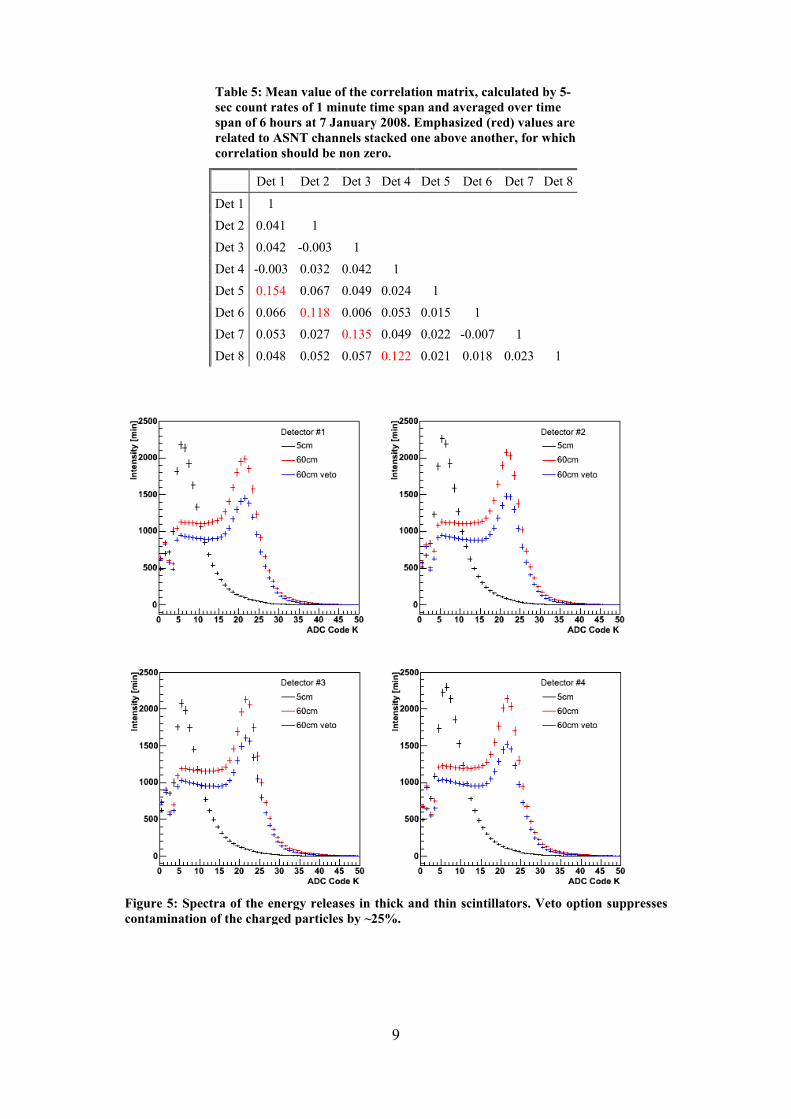
(veto on charged particles to select samples enriched by neutrons) (see Table 6); 9. Histograms of energy releases in all 8 channels of ASNT (see Figure 5); 10. The same as in previous point with invoking veto option; 11. Time and values of energy releases in ASNT channels conditioned on existence of signals
in all 8 scintillators, so called, EAS trigger (accuracy of time stamp is ~50 µsec), (Figure 6); 12. Energy releases in upper or bottom scintillators conditioned on absence of signal in
correspondingly down and upper layers and on minimal energy release, i.e. horizontal muon trigger.
We use XML format of data, allowing metafiles with detailed information about detector location, and operation conditions. After transfer by wireless connections to CRD headquarters in Yerevan the data are archived and stored in MySQL data base. The main data analysis platform, Data Visualization Interactive Network (DVIN (Eghikyan and Chilingarian, 2005)) now is operated with data in XML format and allow us download data also in ASCII format. All raw data in the XML format is available from HTTP server at CRD headquarters in Yerevan from the link.
http://crdlx5.yerphi.am/ASEC_Data/ADAS/asnt/snt In the directory “DEFOULT” following information is stored:
4
1. snt (columns 1-8) - the count rates of all 8 ASNT channels: first 4 columns – from 60 cm scintillators, 5-8 columns – from 5 cm scintillator. The numbering of scintillators is explained in the Figure 1. The count rates are posted in the Table 1;
2. snt (columns 9-24) – the count rates corresponding to the 16 coincidences in upper and bottom ASNT layers, i.e. – corresponding to the traversal of the single charged particle (the probability that neutron will generate energy release in 5 cm scintillator is rather small). The order of the different directions in the file is following: [1-5] [1-6] [1-7] [1-8] [2-5] [2-6] [2-7] [2-8] [3-5] [3-6] [3-7] [3-8] [4-5] [4-6] [4-7] [4-8], where the first number corresponds to the lower layer and the second – to the upper (see Figure 1) Also on the same Figure you can see the orientation of ASNT axes according to direction to the North Pole, thus we can calculate the interval of the horizontal angles of incidence related to each coincidence.
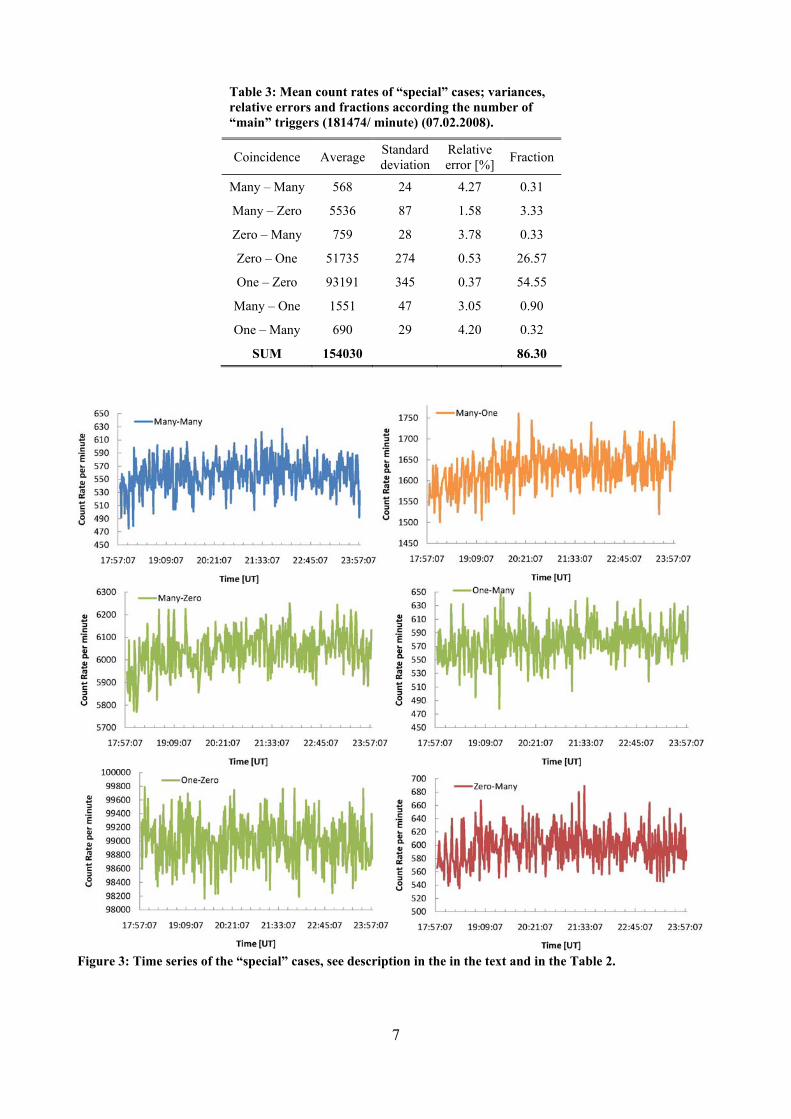
3. snt (columns 25-31) – the count rates of the “special” coincidences different from listed above and forming the “full system” of possible configurations of the channel operation. Conditioned on the existing as minimum 1 signal in 8 ASNT channels there could be the following possibilities of number of counts in top and bottom layers (the first sign in the pair is corresponding to the bottom thick scintillator): many-many [m-m] (more than one count in 4 bottom and 4 top layers), many-zero [m-z] (more than 1 in bottom and nothing in 4 top), zero-many [z-m], zero-one [z-o], one-zero [o-z], many-one [m-o], one-many [o-m]. The fraction of the “special” coincidences relative to the “main” trigger is posted in the Table 3 the time-series of the s “special” triggers are posted in the Figure 3.
4. snt (columns 32) - the number of the “main” triggers – at least one signal in 8 channels in preselected time span (1 minute). If we consider all logical configurations of ASNT operation outcomes, this number will be equal to sum of the columns 9-31. As we mention already the number of triggers is ~ 4 KHz, dependent on the hardware settings: PMT high voltage and threshold of channel “firing”.
5. snt (columns 33-40) - the variances of 8 channels, see Table 4 and Figure 4; 6. snt (columns 41-68) – the correlation matrix, see Table 5. In the directories “spectrum” following information is stored: 1. spectrum1, … spectrum4 the histograms of the energy releases in thick 60 cm scintillator; In files with extension; 2. spectrum5, … spectrum8 the histograms of energy releases in 5 cm thin scintillators; 3. spectrum9,..., spectrum12 histograms of energy releases in 60 cm thick scintillators (with
invoking veto option on the charged particles in the upper “anticoincidence” shielding); By integrating the histograms spectrum1,..., spectrum4 and spectrum9,...,spectrum12 we
calculate the count rates according to 4 predefined thresholds on the value of the energy release (PMT output), to continue time series in the same data format as old version of ASNT started from 1996 (http://crd.aragats.am/DVIN/). As a first (or zero- threshold) we use the sum of all channels of the histogram. To get number of particles with Threshold 1 we must calculate sum of the channels of the histogram from 16 to 127. For the Threshold 2 – sum of the 23-127 channels, Threshold 3 – 27-127 channels and Threshold 4 – 31-127 channels.
To calculate count rate of the particles with thresholds for the detector 1-4 (60cm) we need spectrums 1-4 files. To calculate count rate of the particles with veto for the detector 1-4 we need spectrums 9-12 files (see Table 6).
The CRD “ARSRV” local file server contain files with following information: 1. The detailed information on the many-many case: the time stamp and energy releases in all
8 ASNT cannels. This case is related to the Extensive Air Showers (EAS), when energy of primary particle is high enough to generate particle cascade with numerous secondary particles reaching earth surface. By selecting different subsamples of many-many case according to the number of detected secondary particles (energy releases) we can select
5
events with different primary energy, thus constructing the energy spectra of the primary particles. The calibration of the ASNT can be done with MAKET-ANI EAS array (Chilingarian, et al., 2004). In the Figure 6 the time series of the count rates correspondent to different energy releases are posted.
2. Another kind of events stored in the files with “events” extension is related to the horizontal muon traversal. The logical software trigger selects events when there are more than 2 signals in top or bottom layers only, i.e. selecting horizontally traversing particle, or group of particles. The additional condition of large energy release (the code >25) is rejecting coincidences of the vertical traversal of low energy particles. The acceptance of the system of bottom thick scintillators is rather large ~(+/- 8.50), the acceptance of very narrow system of the top thin scintillators will select horizontal muons within ~(+/- 0.70) of zenith angles.
Figure 2: Time series of count rates of 8 ASNT channels. The difference of mean values is due to peculiarities of PMT used.
6
Table 2: Mean count rates related to the different incident directions, variances, relative errors and fractions according the number of “main” triggers (181474/ minute). φ is true north-based azimuth angle, θ is zenith angle (07.02.2008).
Direction Average Standard deviation
Relative error [%] Fraction
[1-5] 3965 70 1.77 1.66
[2-6] 2899 76 2.66 1.67
[3-7] 3754 68 1.83 1.39 Vertical
Directions
[4-8] 3128 79 2.54 1.86
[1-6] 1278 37 2.92 0.69 φ=730±310 E θ=300±110 [3-8] 1306 38 2.98 0.73
[1-7] 1544 40 2.64 0.67 φ=1630±310 E θ=300±110 [2-8] 1346 40 3.01 0.80
[2-5] 1458 38 2.64 0.74 φ=2530±310 E θ=300±110 [4-7] 1496 39 2.63 0.67
[3-5] 1454 38 2.67 0.68 φ=3430±310 E θ=300±110 [4-6] 1267 38 3.00 0.72
φ=1180±200 E θ=380±100 [1-8] 691 27 4.00 0.39
φ=2080±200 E θ=380±100 [2-7] 672 26 3.86 0.33
φ=280±200 E θ=380±100 [3-6] 591 25 4.27 0.33
φ=2980±200 E θ=380±100 [4-5] 730 27 3.83 0.37
SUM 27579 13.70
Table 1: Count rates of the ASNT channels, variances and relative errors (07.02.2008).
Detector Average Standard deviation
Relative error [%]
60cm Detector 1 34465 244 0.70
60cm Detector 2 33027 238 0.72
60cm Detector 3 34864 238 0.68
60cm Detector 4 35235 252 0.71
SUM 60 cm 141784
5cm Detector 5 22254 178 0.80
5cm Detector 6 19775 201 1.01
5cm Detector 7 22315 178 0.80
5cm Detector 8 20871 209 1.00
SUM 5 cm 78459
7
Figure 3: Time series of the “special” cases, see description in the in the text and in the Table 2.
Table 3: Mean count rates of “special” cases; variances, relative errors and fractions according the number of “main” triggers (181474/ minute) (07.02.2008).
Coincidence Average Standard deviation
Relative error [%] Fraction
Many – Many 568 24 4.27 0.31
Many – Zero 5536 87 1.58 3.33
Zero – Many 759 28 3.78 0.33
Zero – One 51735 274 0.53 26.57
One – Zero 93191 345 0.37 54.55
Many – One 1551 47 3.05 0.90
One – Many 690 29 4.20 0.32
SUM 154030 86.30

8
Table 4: Mean value of the variance, its variance and relative error calculated by 5-sec count rates of 1 minute time span (total 12 5-dec count rates) (07.02.2008).
Detectors Average Standard deviation
Relative error [%]
60cm Detector 1 52 11 21.36
60cm Detector 2 50 10 21.36
60cm Detector 3 51 11 21.71
60cm Detector 4 52 11 21.71
5cm Detector 1 42 9 21.30
5cm Detector 2 39 8 21.00
5cm Detector 3 42 9 21.36
5cm Detector 4 40 9 21.69
Figure 4: Time series of the ASNT channel variances. Despite the mean values of ASNT channels slightly differ, the variances are very close to each-other, thus proving uniformity of ASNT channels.
9
Figure 5: Spectra of the energy releases in thick and thin scintillators. Veto option suppresses contamination of the charged particles by ~25%.
Table 5: Mean value of the correlation matrix, calculated by 5-sec count rates of 1 minute time span and averaged over time span of 6 hours at 7 January 2008. Emphasized (red) values are related to ASNT channels stacked one above another, for which correlation should be non zero.
Det 1 Det 2 Det 3 Det 4 Det 5 Det 6 Det 7 Det 8
Det 1 1 Det 2 0.041 1 Det 3 0.042 -0.003 1 Det 4 -0.003 0.032 0.042 1 Det 5 0.154 0.067 0.049 0.024 1 Det 6 0.066 0.118 0.006 0.053 0.015 1 Det 7 0.053 0.027 0.135 0.049 0.022 -0.007 1 Det 8 0.048 0.052 0.057 0.122 0.021 0.018 0.023 1
10
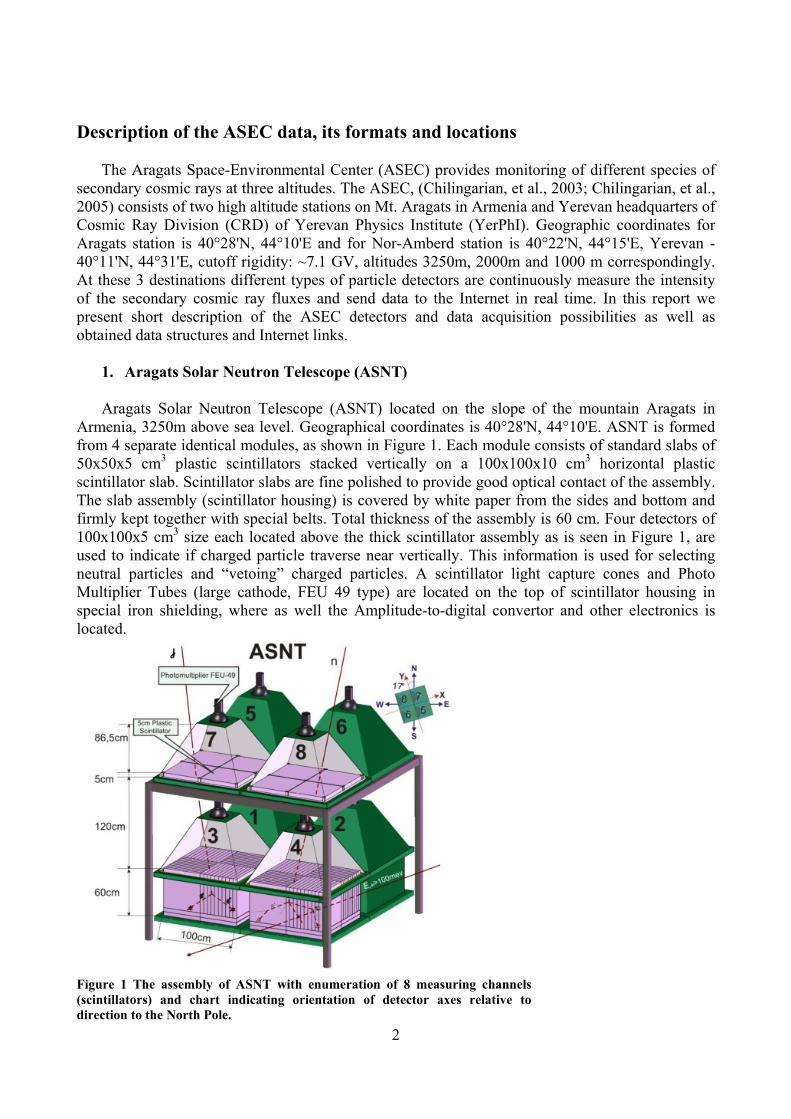
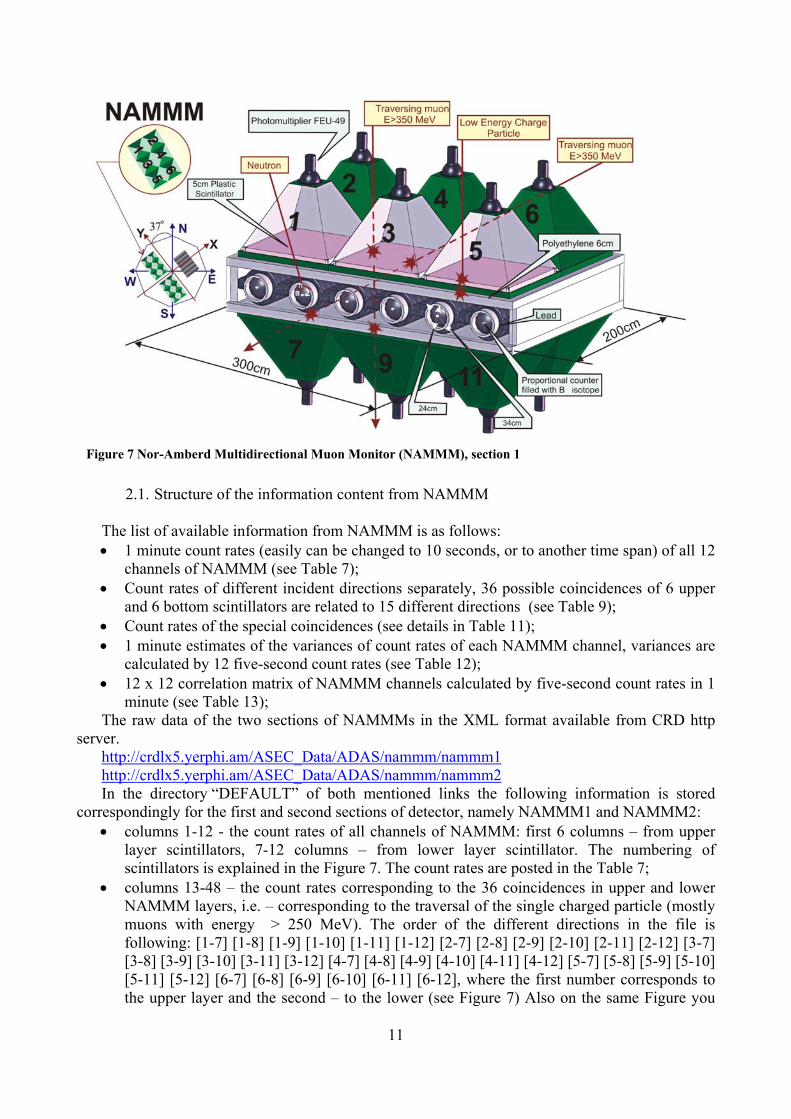
2. Nor-Amberd Multidirectional Muon Monitor (NAMMM) Nor-Amberd Multidirectional Muon Monitor (NAMMM) (Dorman 1975; Beglaryan, et al.,
1989) located on the slope of the mountain Aragats in Armenia, at 2000m above sea level. Geographical coordinates is 40°22'N, 44°15'E. The NAMMM, shown in Figure 7 consists of two layers of plastic scintillators above and below two of the three sections of the Nor Amberd Neutron Monitor (NM). The lead (Pb) filter of the NM absorbs electrons and low energy muons. The threshold energy of the detected muons is estimated to be ~250 MeV. The NAMMM consists of 6 up and 6 down scintillators, each having the area of 0.8 m2. The distance between layers is ~ 1 m., and the interval of zenith angles determined by the paired coincidences of upper and lower scintillators is not greater than 25º. The data acquisition system of the NAMMM, the same as ASNT, can register all coincidences of detector signals from the upper and lower layers, thus, enabling measurements of the arrival of the muons from different directions.
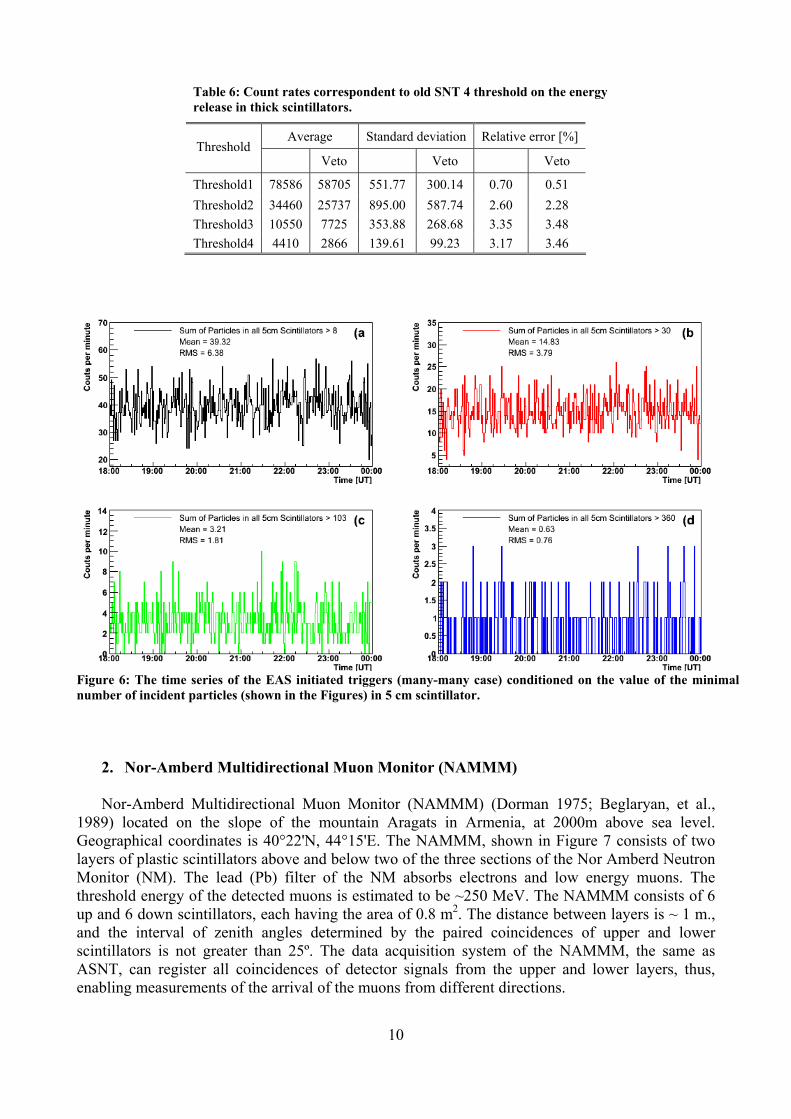
Figure 6: The time series of the EAS initiated triggers (many-many case) conditioned on the value of the minimal number of incident particles (shown in the Figures) in 5 cm scintillator.
Table 6: Count rates correspondent to old SNT 4 threshold on the energy release in thick scintillators.
Average Standard deviation Relative error [%] Threshold
Veto Veto Veto
Threshold1 78586 58705 551.77 300.14 0.70 0.51 Threshold2 34460 25737 895.00 587.74 2.60 2.28 Threshold3 10550 7725 353.88 268.68 3.35 3.48 Threshold4 4410 2866 139.61 99.23 3.17 3.46
11
2.1. Structure of the information content from NAMMM
The list of available information from NAMMM is as follows: • 1 minute count rates (easily can be changed to 10 seconds, or to another time span) of all 12
channels of NAMMM (see Table 7); • Count rates of different incident directions separately, 36 possible coincidences of 6 upper
and 6 bottom scintillators are related to 15 different directions (see Table 9); • Count rates of the special coincidences (see details in Table 11); • 1 minute estimates of the variances of count rates of each NAMMM channel, variances are
calculated by 12 five-second count rates (see Table 12); • 12 x 12 correlation matrix of NAMMM channels calculated by five-second count rates in 1
minute (see Table 13); The raw data of the two sections of NAMMMs in the XML format available from CRD http
server. http://crdlx5.yerphi.am/ASEC_Data/ADAS/nammm/nammm1 http://crdlx5.yerphi.am/ASEC_Data/ADAS/nammm/nammm2 In the directory “DEFAULT” of both mentioned links the following information is stored
correspondingly for the first and second sections of detector, namely NAMMM1 and NAMMM2: • columns 1-12 - the count rates of all channels of NAMMM: first 6 columns – from upper
layer scintillators, 7-12 columns – from lower layer scintillator. The numbering of scintillators is explained in the Figure 7. The count rates are posted in the Table 7;
• columns 13-48 – the count rates corresponding to the 36 coincidences in upper and lower NAMMM layers, i.e. – corresponding to the traversal of the single charged particle (mostly muons with energy > 250 MeV). The order of the different directions in the file is following: [1-7] [1-8] [1-9] [1-10] [1-11] [1-12] [2-7] [2-8] [2-9] [2-10] [2-11] [2-12] [3-7] [3-8] [3-9] [3-10] [3-11] [3-12] [4-7] [4-8] [4-9] [4-10] [4-11] [4-12] [5-7] [5-8] [5-9] [5-10] [5-11] [5-12] [6-7] [6-8] [6-9] [6-10] [6-11] [6-12], where the first number corresponds to the upper layer and the second – to the lower (see Figure 7) Also on the same Figure you
Figure 7 Nor-Amberd Multidirectional Muon Monitor (NAMMM), section 1
12
can see the orientation of NAMMM axes according to direction to the North Pole, thus we can calculate the interval of the horizontal angles of incidence related to each coincidence.
• columns 49-55 – the count rates of the “special” coincidences different from listed above and forming the “full system” of possible configurations of the channel operation. Conditioned on the existing as minimum 1 signal in 12 NAMMM channels there could be the following possibilities of number of counts in top and bottom layers (the first sign in the pair is corresponding to the upper scintillator): many-many (more than one count in 6 top and 6 bottom layers), many-zero (more than 1 in top and nothing in 6 bottom), zero-many, zero-one, one-zero, many-one, one-many. The fraction of the “special” coincidences relative to the “main” trigger is posted in the Table 11.
• columns 56 - the number of the “main” triggers – at least one signal in 12 channels in preselected time span (1 minute). If we consider all logical configurations of NAMM operation outcomes, this number will be equal to sum of the columns 13-55.
• columns 57-68 - the variances of 12 channels, see Table 12; • columns 69-134 – the correlation matrix, see Table 13.
In the directories “spectrum” the 127-channel histograms of the energy releases are stored for each minute, in files with extensions:
• spectrum1 - spectrum6, the histograms of the energy releases in the upper scintillators are stored.
• spectrum7 - spectrum12, the histograms of the energy releases in the lower scintillators are stored;
• spectrum13 - spectrum18, histograms of energy releases, in upper detectors are stored with condition that in lower detectors there was now signal, i.e., the energy releases of electrons and low energy muons filtered in the lead absorber.
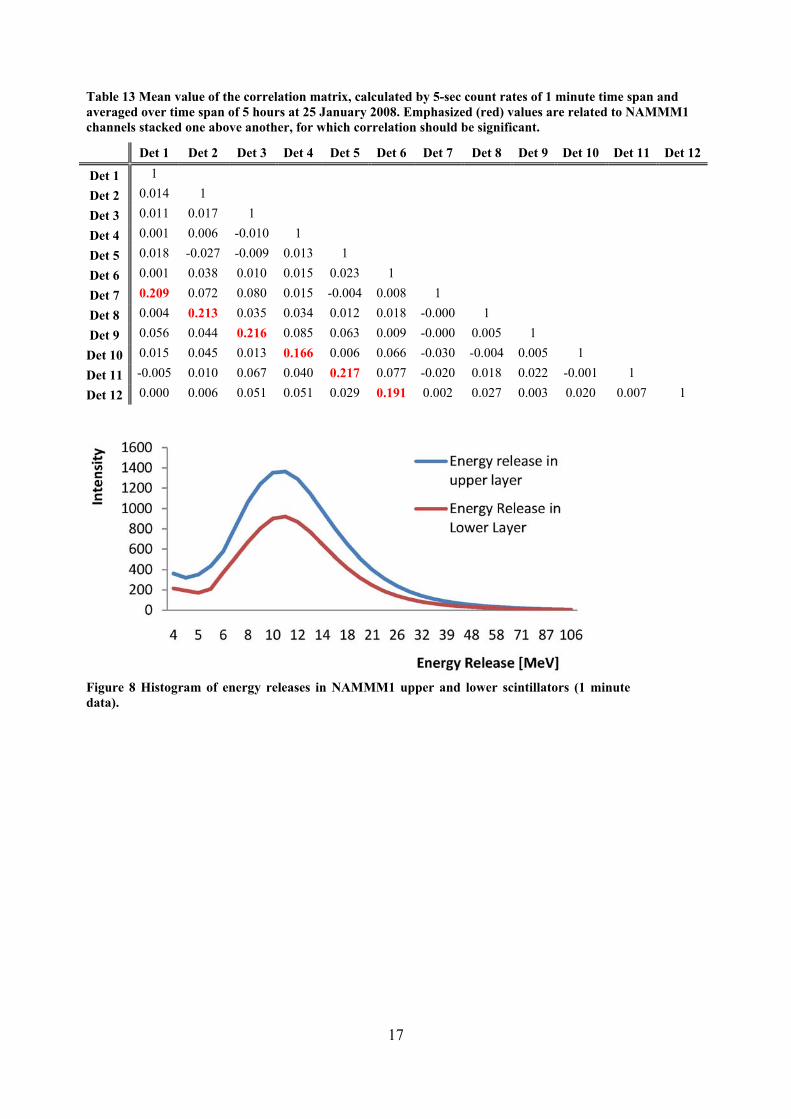
The information on the spectra of energy releases is essential for the continuous calibration of the all measuring channels. As one can see in Figure 8 the maximum of smoothed histograms are in the region 10-11 MeV, and this value should be monitored and kept constant during multiyear detector operation. In Figure 8 are presented 1-minute spectra summed over all four detectors and averaged over several hours. The blue curve is energy releases of the low energy muons and electrons (spectrum13-18) and the red curve is corresponding to high energy muons (subtracting from spectrum 1-6, spectrums 13-18). We can see than high energy muons in average can give much higher energy releases comparing with low energy muons and electrons. This additional information can be useful if Ground Level Enhancements (GLE) was originated by the primary particles having higher energy comparing with the GCR flux. Additionally to enhancement of the count rate we may notice some unusual features in the histograms of energy releases.

13
Table 8 Count Rates of the NAMMM2 channels and variances (25-01-2008; 14:00-23:00).
Detectors Average Standard deviation
Relative Error (%)
Detector 1 14619 100.09 0.68 Detector 2 15526 128.45 0.83 Detector 3 15970 107.3 0.67 Detector 4 15893 103.18 0.65 Detector 5 15887 128.36 0.81 Detector 6 14627 129.3 0.88
SUM of upper layer 92192 Detector 7 9277 108.56 1.17 Detector 8 8823 110.01 1.25 Detector 9 9729 94.06 0.97
Detector 10 10225 132.03 1.29 Detector 11 9090 88.63 0.98 Detector 12 9621 112.76 1.17
SUM of lower layer 55642
Table 7 Count Rates of the NAMMM1 channels and variances (25-01-2008; 14:00-19:00).
Detectors Average Standard deviation
Relative Error (%)
Detector 1 14660 118 0.80 Detector 2 14667 120 0.82 Detector 3 15409 121 0.79 Detector 4 16665 130 0.78 Detector 5 17480 147 0.84 Detector 6 16526 125 0.76
SUM of upper layer 89528 Detector 7 9327 100 1.07 Detector 8 10554 103 0.98 Detector 9 9143 92 1.01
Detector 10 8581 97 1.13 Detector 11 9250 106 1.15 Detector 12 10459 99 0.95
SUM of lower layer 54658

14
Table 9 Mean count rates related to the different incident directions detected by the NAMMM1; variances, relative errors and fractions according the number of the “main” triggers (113109/ minute). Angle φ calculated relative XY axes (see Figure 7); φ is true north-based azimuth angle, θ is zenith angle.
Directions Average Standard deviation
Relative Error (%) SUM
[1-7] 2459 52 2.11 [2-8] 2621 53 2.02 [3-9] 2641 51 1.93 [4-10] 2313 49 2.12 [5-11] 2693 53 1.97
Vertical
[6-12] 2782 49 1.76
15509
[1-8] 504 24 4.76 [3-10] 494 22 4.45 φ=530±280 E
θ=370±130 [5-12] 539 22 4.08
1538
[2-7] 955 29 3.04 [4-9] 1112 36 3.24 φ=2330±280 E
θ=370±130 [6-11] 1003 32 3.19
3070
[3-7] 751 29 3.86 [4-8] 833 28 3.36 [5-9] 753 27 3.59
φ=3230±300 E θ=370±130
[6-10] 755 28 3.71
3092
[1-9] 689 27 3.92 [2-10] 583 25 4.29 [3-11] 724 26 3.59
φ=1430±300 E θ=370±130
[4-12] 699 26 3.72
2694
[1-10] 155 12 7.74 φ=980±250 E θ=490±110 [3-12] 194 14 7.22
349
[4-7] 357 18 5.04 φ=2780±180 E θ=490±100 [6-9] 341 19 5.57
699
[2-9] 321 19 5.92 φ=1880±180 E θ=490±100 [4-11] 326 18 5.52
647
[3-8] 219 14 6.39 φ=80±250 E θ=490±110 [5-10] 201 14 6.97
420
[1-11] 49 6 12.24 φ=1430±130 E θ=610±60 [2-12] 52 7 13.46
101
[5-7] 53 7 13.21 φ=3230±130 E θ=610±60 [6-8] 61 7 11.48
115
φ=1160±120 E θ=640±60 [1-12] 28 6 21.43 28
φ=2960±120 E θ=640±60 [6-7] 34 6 17.65 34
φ=1700±120 E θ=640±60 [2-11] 34 6 17.65 34
φ=3500±120 E θ=640±60 [5-8] 32 5 15.63 32
SUM 28360
15
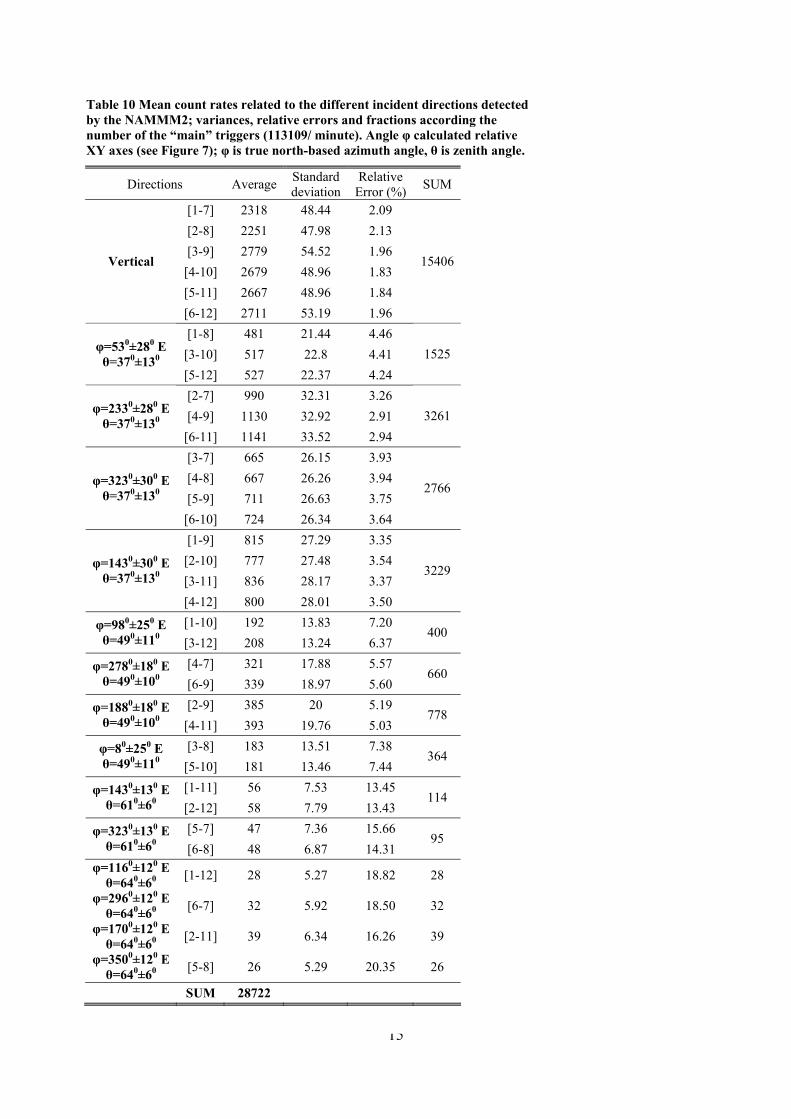
Table 10 Mean count rates related to the different incident directions detected by the NAMMM2; variances, relative errors and fractions according the number of the “main” triggers (113109/ minute). Angle φ calculated relative XY axes (see Figure 7); φ is true north-based azimuth angle, θ is zenith angle.
Directions Average Standard deviation
Relative Error (%) SUM
[1-7] 2318 48.44 2.09 [2-8] 2251 47.98 2.13 [3-9] 2779 54.52 1.96 [4-10] 2679 48.96 1.83 [5-11] 2667 48.96 1.84
Vertical
[6-12] 2711 53.19 1.96
15406
[1-8] 481 21.44 4.46 [3-10] 517 22.8 4.41 φ=530±280 E
θ=370±130 [5-12] 527 22.37 4.24
1525
[2-7] 990 32.31 3.26 [4-9] 1130 32.92 2.91 φ=2330±280 E
θ=370±130 [6-11] 1141 33.52 2.94
3261
[3-7] 665 26.15 3.93 [4-8] 667 26.26 3.94 [5-9] 711 26.63 3.75
φ=3230±300 E θ=370±130
[6-10] 724 26.34 3.64
2766
[1-9] 815 27.29 3.35 [2-10] 777 27.48 3.54 [3-11] 836 28.17 3.37
φ=1430±300 E θ=370±130
[4-12] 800 28.01 3.50
3229
[1-10] 192 13.83 7.20 φ=980±250 E θ=490±110 [3-12] 208 13.24 6.37
400
[4-7] 321 17.88 5.57 φ=2780±180 E θ=490±100 [6-9] 339 18.97 5.60
660
[2-9] 385 20 5.19 φ=1880±180 E θ=490±100 [4-11] 393 19.76 5.03
778
[3-8] 183 13.51 7.38 φ=80±250 E θ=490±110 [5-10] 181 13.46 7.44
364
[1-11] 56 7.53 13.45 φ=1430±130 E θ=610±60 [2-12] 58 7.79 13.43
114
[5-7] 47 7.36 15.66 φ=3230±130 E θ=610±60 [6-8] 48 6.87 14.31
95
φ=1160±120 E θ=640±60 [1-12] 28 5.27 18.82 28
φ=2960±120 E θ=640±60 [6-7] 32 5.92 18.50 32
φ=1700±120 E θ=640±60 [2-11] 39 6.34 16.26 39
φ=3500±120 E θ=640±60 [5-8] 26 5.29 20.35 26
SUM 28722

16
Table 12 Mean values of the count rates and variances, calculated by 5-sec count rates of 1 minute time span (total 12 5-dec count rates) (NAMMM1).
Detectors Mean value of the count rate
Mean value of the variance
Relative error (variance/count rate)
Detector 1 1272 15.95 0.0125
Detector 2 1191 15.34 0.0129
Detector 3 1044 14.40 0.0138
Detector 4 1287 16.02 0.0124
Detector 5 1269 15.87 0.0125
Detector 6 1284 15.94 0.0124
Detector 7 811 12.69 0.0156
Detector 8 923 13.53 0.0147
Detector 9 690 11.63 0.0169
Detector 10 735 12.03 0.0164
Detector 11 749 14.81 0.0197
Detector 12 780 12.43 0.0159
Table 11 Mean count rates of “special” cases (NAMMM1) ; variances, relative errors and fractions according the number of “main” triggers (113109/ minute).
Coincidence Average Standard deviation
Relative Error [%]
Many – Many 39 6.11 15.67 Many – Zero 1790 43.44 2.43 Zero – Many 322 17.55 5.45 Zero – One 27469 168.89 0.61 One – Zero 62117 248.32 0.40 Many – One 376 19.26 5.12 One – Many 170 12.64 7.44
17
Table 13 Mean value of the correlation matrix, calculated by 5-sec count rates of 1 minute time span and averaged over time span of 5 hours at 25 January 2008. Emphasized (red) values are related to NAMMM1 channels stacked one above another, for which correlation should be significant.
Det 1 Det 2 Det 3 Det 4 Det 5 Det 6 Det 7 Det 8 Det 9 Det 10 Det 11 Det 12
Det 1 1
Det 2 0.014 1
Det 3 0.011 0.017 1
Det 4 0.001 0.006 -0.010 1
Det 5 0.018 -0.027 -0.009 0.013 1
Det 6 0.001 0.038 0.010 0.015 0.023 1
Det 7 0.209 0.072 0.080 0.015 -0.004 0.008 1
Det 8 0.004 0.213 0.035 0.034 0.012 0.018 -0.000 1
Det 9 0.056 0.044 0.216 0.085 0.063 0.009 -0.000 0.005 1
Det 10 0.015 0.045 0.013 0.166 0.006 0.066 -0.030 -0.004 0.005 1
Det 11 -0.005 0.010 0.067 0.040 0.217 0.077 -0.020 0.018 0.022 -0.001 1
Det 12 0.000 0.006 0.051 0.051 0.029 0.191 0.002 0.027 0.003 0.020 0.007 1
Figure 8 Histogram of energy releases in NAMMM1 upper and lower scintillators (1 minute data).

18
3. Nor-Amberd and Aragats Neutron Monitors (NANM & ArNM)
Two 18NM-64 neutron monitors (see Figure 9, Figure 10) (Moraal, et al., 2000), are in
operation at Nor-Amberd (40°22'N, 44°15'E, 2000m above sea level), and at Aragats, (40°28'N, 44°10'E, 3250m above sea level) research stations. They called the Nor Amberd Neutron Monitor (NANM), and the Aragats Neutron Monitor (ArNM), respectively. The monitors are equipped with new electronics providing time integration of counts by three dead times. The first dead time equals to 400ns for collecting almost all thermalized neutrons entering the proportional chamber from the lead. The second dead time is equal to the 0.25ms and the third one equal 1.25ms (as most of NM
Figure 10 Aragats Neutron Monitor (ArNM).
Figure 9 Nor-Amberd Neutron Monitor (NANM)
Sections of Neutron
Sections of Neutron

19
from world-wide network). Also 2 proportional chambers without lead coverage are added to NANM.
The raw data of the NANM and ArNM is available from CRD http server by these links: http://crdlx5.yerphi.am/ASEC_Data/ADAS/nanm/nanm/DEFAULT/ http://crdlx5.yerphi.am/ASEC_Data/ADAS/arnm/arnm/DEFAULT/
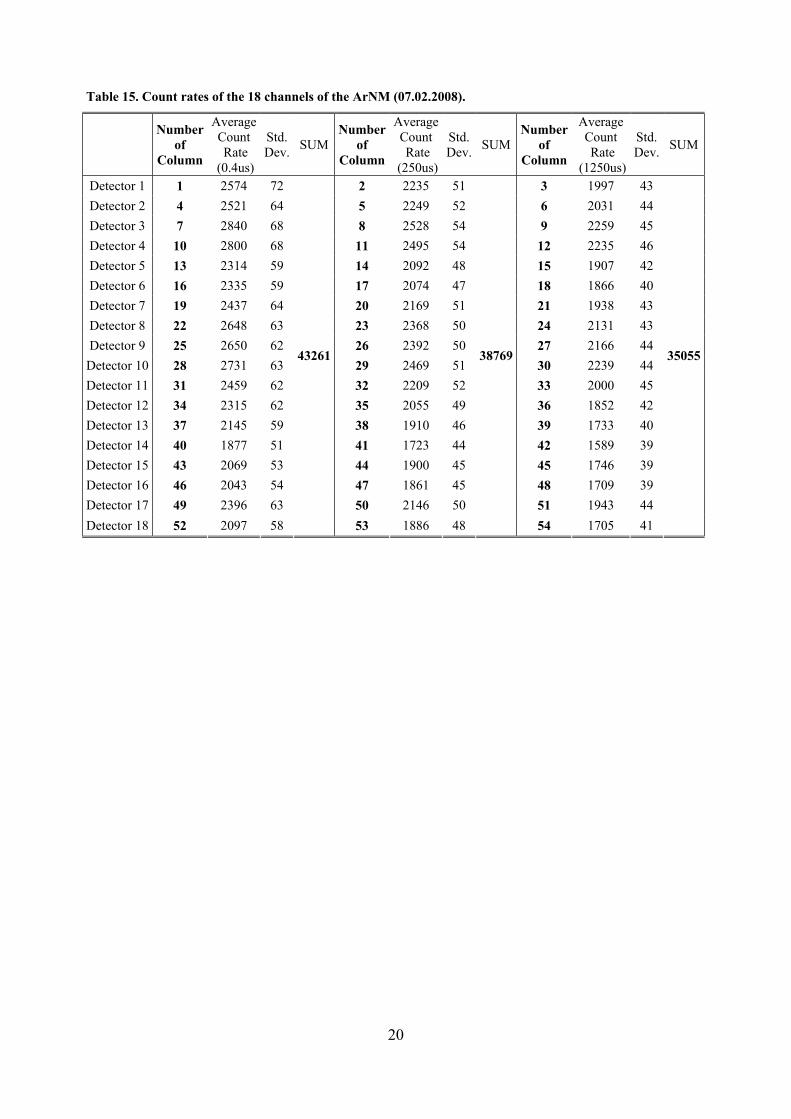
In the data files of the NM following information is stored (Table 14 and Table 15): 1. columns 1+3i (i=0,…,17) - the count rates of all 18 channels of NM with dead time 400ns. 2. columns 2+3i (i=0,…,17) - the count rates of all 18 channels of NM with dead time 0.25ms. 3. columns 3+3i (i=0,…,17) - the count rates of all 18 channels of NM with dead time 1.25ms. 4. column 55 – the pressure coefficient. 5. columns 56 – 60 yet unused channels, additional neutron detectors to be attached soon.
Table 14. Count rates of the 18 channels of the NANM (07.02.2008).
Number
of Column
Average Count Rate
(0.4us)
Std. Dev. SUM
Numberof
Column
AverageCount Rate
(250us)
Std. Dev. SUM
Number of
Column
Average Count Rate
(1250us)
Std. Dev. SUM
Detector 1 1 1530 57 2 1312 39 3 1172 33 Detector 2 4 1375 47 5 1216 37 6 1101 32 Detector 3 7 1608 52 8 1405 40 9 1262 35 Detector 4 10 1628 52 11 1425 39 12 1277 33 Detector 5 13 1580 53 14 1379 41 15 1243 35 Detector 6 16 1391 64 17 1198 37 18 1082 32 Detector 7 19 1676 54 20 1455 41 21 1310 34 Detector 8 22 1608 51 23 1412 41 24 1268 35 Detector 9 25 1539 50 26 1345 38 27 1215 32 Detector 10 28 1553 53 29 1361 41 30 1228 35 Detector 11 31 1592 54 32 1370 41 33 1232 35 Detector 12 34 1417 49 35 1236 38 36 1114 32 Detector 13 37 1471 51 38 1260 39 39 1133 33 Detector 14 40 1369 46 41 1226 37 42 1120 33 Detector 15 43 1561 53 44 1362 41 45 1234 35 Detector 16 46 1620 52 47 1426 41 48 1286 34 Detector 17 49 1581 51 50 1395 40 51 1260 35 Detector 18 52 1374 47
27483
53 1202 36
23993
54 1086 31
21633
20
Table 15. Count rates of the 18 channels of the ArNM (07.02.2008).
Number
of Column
Average Count Rate
(0.4us)
Std. Dev. SUM
Numberof
Column
Average Count Rate
(250us)
Std. Dev. SUM
Number of
Column
Average Count Rate
(1250us)
Std. Dev. SUM
Detector 1 1 2574 72 2 2235 51 3 1997 43 Detector 2 4 2521 64 5 2249 52 6 2031 44 Detector 3 7 2840 68 8 2528 54 9 2259 45 Detector 4 10 2800 68 11 2495 54 12 2235 46 Detector 5 13 2314 59 14 2092 48 15 1907 42 Detector 6 16 2335 59 17 2074 47 18 1866 40 Detector 7 19 2437 64 20 2169 51 21 1938 43 Detector 8 22 2648 63 23 2368 50 24 2131 43 Detector 9 25 2650 62 26 2392 50 27 2166 44 Detector 10 28 2731 63 29 2469 51 30 2239 44 Detector 11 31 2459 62 32 2209 52 33 2000 45 Detector 12 34 2315 62 35 2055 49 36 1852 42 Detector 13 37 2145 59 38 1910 46 39 1733 40 Detector 14 40 1877 51 41 1723 44 42 1589 39 Detector 15 43 2069 53 44 1900 45 45 1746 39 Detector 16 46 2043 54 47 1861 45 48 1709 39 Detector 17 49 2396 63 50 2146 50 51 1943 44 Detector 18 52 2097 58
43261
53 1886 48
38769
54 1705 41
35055
21
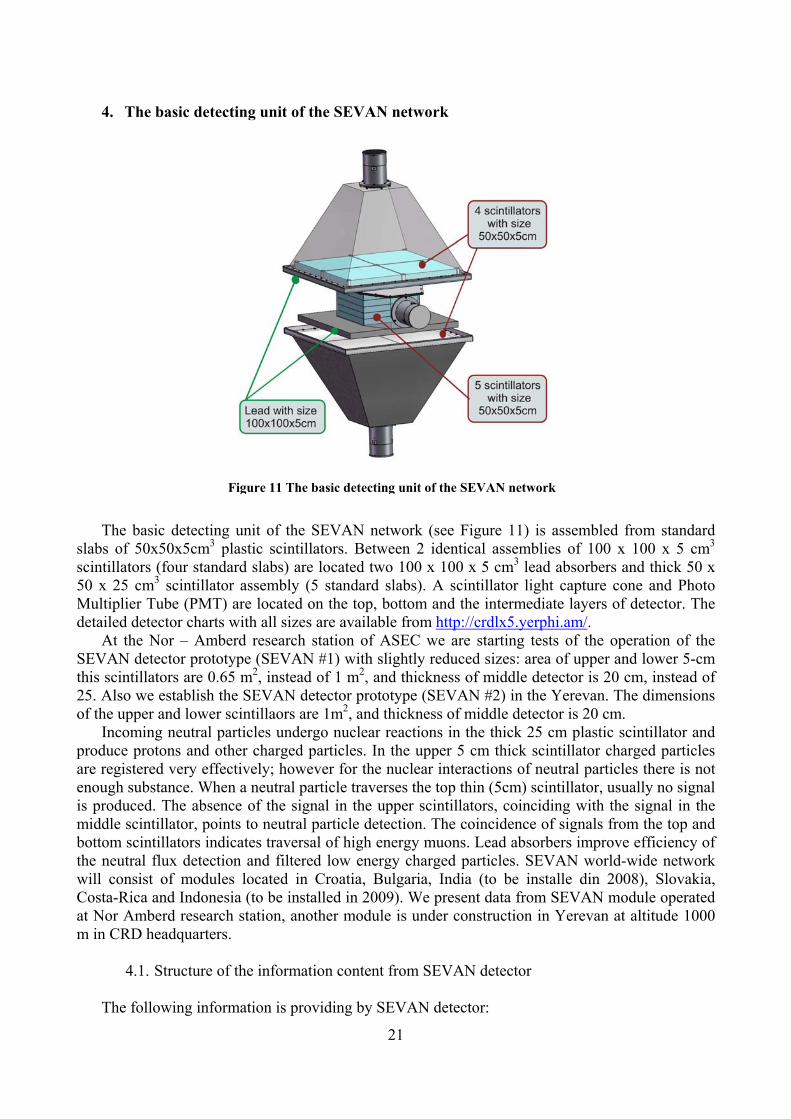
4. The basic detecting unit of the SEVAN network
The basic detecting unit of the SEVAN network (see Figure 11) is assembled from standard slabs of 50x50x5cm3 plastic scintillators. Between 2 identical assemblies of 100 x 100 x 5 cm3 scintillators (four standard slabs) are located two 100 x 100 x 5 cm3 lead absorbers and thick 50 x 50 x 25 cm3 scintillator assembly (5 standard slabs). A scintillator light capture cone and Photo Multiplier Tube (PMT) are located on the top, bottom and the intermediate layers of detector. The detailed detector charts with all sizes are available from http://crdlx5.yerphi.am/.
At the Nor – Amberd research station of ASEC we are starting tests of the operation of the SEVAN detector prototype (SEVAN #1) with slightly reduced sizes: area of upper and lower 5-cm this scintillators are 0.65 m2, instead of 1 m2, and thickness of middle detector is 20 cm, instead of 25. Also we establish the SEVAN detector prototype (SEVAN #2) in the Yerevan. The dimensions of the upper and lower scintillaors are 1m2, and thickness of middle detector is 20 cm.
Incoming neutral particles undergo nuclear reactions in the thick 25 cm plastic scintillator and produce protons and other charged particles. In the upper 5 cm thick scintillator charged particles are registered very effectively; however for the nuclear interactions of neutral particles there is not enough substance. When a neutral particle traverses the top thin (5cm) scintillator, usually no signal is produced. The absence of the signal in the upper scintillators, coinciding with the signal in the middle scintillator, points to neutral particle detection. The coincidence of signals from the top and bottom scintillators indicates traversal of high energy muons. Lead absorbers improve efficiency of the neutral flux detection and filtered low energy charged particles. SEVAN world-wide network will consist of modules located in Croatia, Bulgaria, India (to be installe din 2008), Slovakia, Costa-Rica and Indonesia (to be installed in 2009). We present data from SEVAN module operated at Nor Amberd research station, another module is under construction in Yerevan at altitude 1000 m in CRD headquarters.
4.1. Structure of the information content from SEVAN detector The following information is providing by SEVAN detector:
Figure 11 The basic detecting unit of the SEVAN network
22
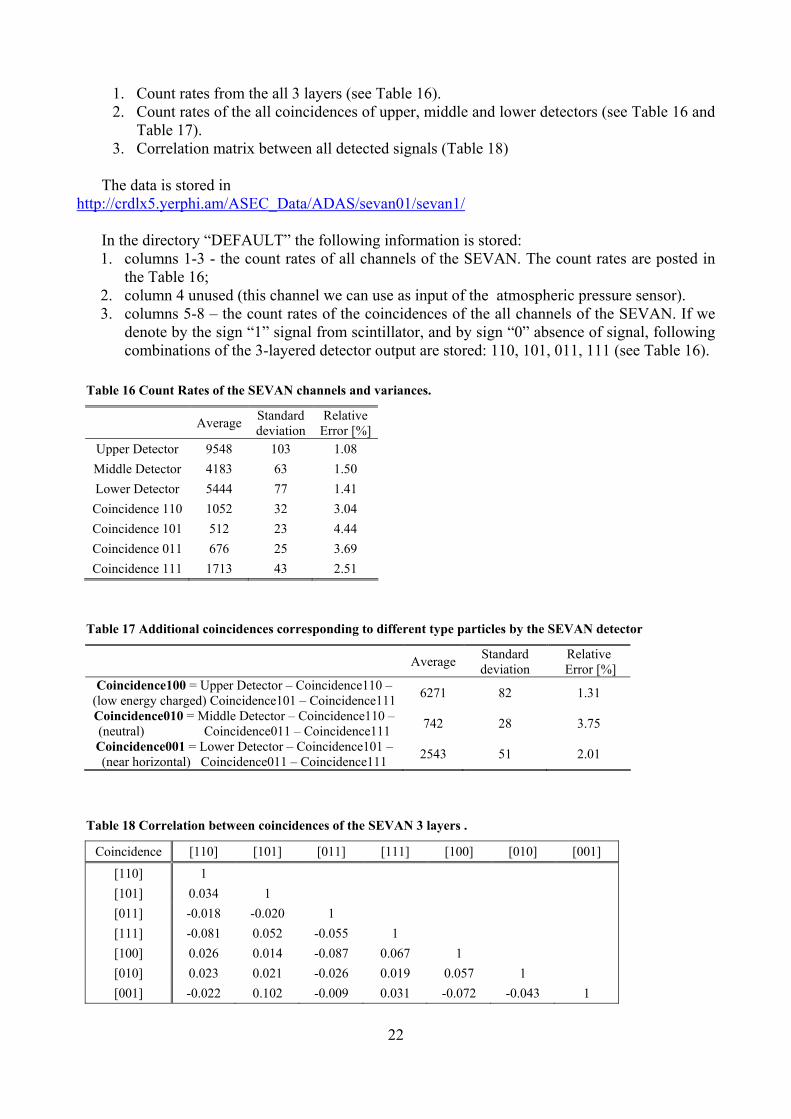
1. Count rates from the all 3 layers (see Table 16). 2. Count rates of the all coincidences of upper, middle and lower detectors (see Table 16 and
Table 17). 3. Correlation matrix between all detected signals (Table 18)
The data is stored in http://crdlx5.yerphi.am/ASEC_Data/ADAS/sevan01/sevan1/
In the directory “DEFAULT” the following information is stored: 1. columns 1-3 - the count rates of all channels of the SEVAN. The count rates are posted in
the Table 16; 2. column 4 unused (this channel we can use as input of the atmospheric pressure sensor). 3. columns 5-8 – the count rates of the coincidences of the all channels of the SEVAN. If we
denote by the sign “1” signal from scintillator, and by sign “0” absence of signal, following combinations of the 3-layered detector output are stored: 110, 101, 011, 111 (see Table 16).
Table 18 Correlation between coincidences of the SEVAN 3 layers .
Coincidence [110] [101] [011] [111] [100] [010] [001]
[110] 1 [101] 0.034 1 [011] -0.018 -0.020 1 [111] -0.081 0.052 -0.055 1 [100] 0.026 0.014 -0.087 0.067 1 [010] 0.023 0.021 -0.026 0.019 0.057 1 [001] -0.022 0.102 -0.009 0.031 -0.072 -0.043 1
Table 16 Count Rates of the SEVAN channels and variances.
Average Standard deviation
Relative Error [%]
Upper Detector 9548 103 1.08 Middle Detector 4183 63 1.50 Lower Detector 5444 77 1.41 Coincidence 110 1052 32 3.04 Coincidence 101 512 23 4.44 Coincidence 011 676 25 3.69 Coincidence 111 1713 43 2.51
Table 17 Additional coincidences corresponding to different type particles by the SEVAN detector
Average Standard deviation
Relative Error [%]
Coincidence100 = Upper Detector – Coincidence110 –(low energy charged) Coincidence101 – Coincidence111 6271 82 1.31
Coincidence010 = Middle Detector – Coincidence110 – (neutral) Coincidence011 – Coincidence111 742 28 3.75
Coincidence001 = Lower Detector – Coincidence101 – (near horizontal) Coincidence011 – Coincidence111 2543 51 2.01
23
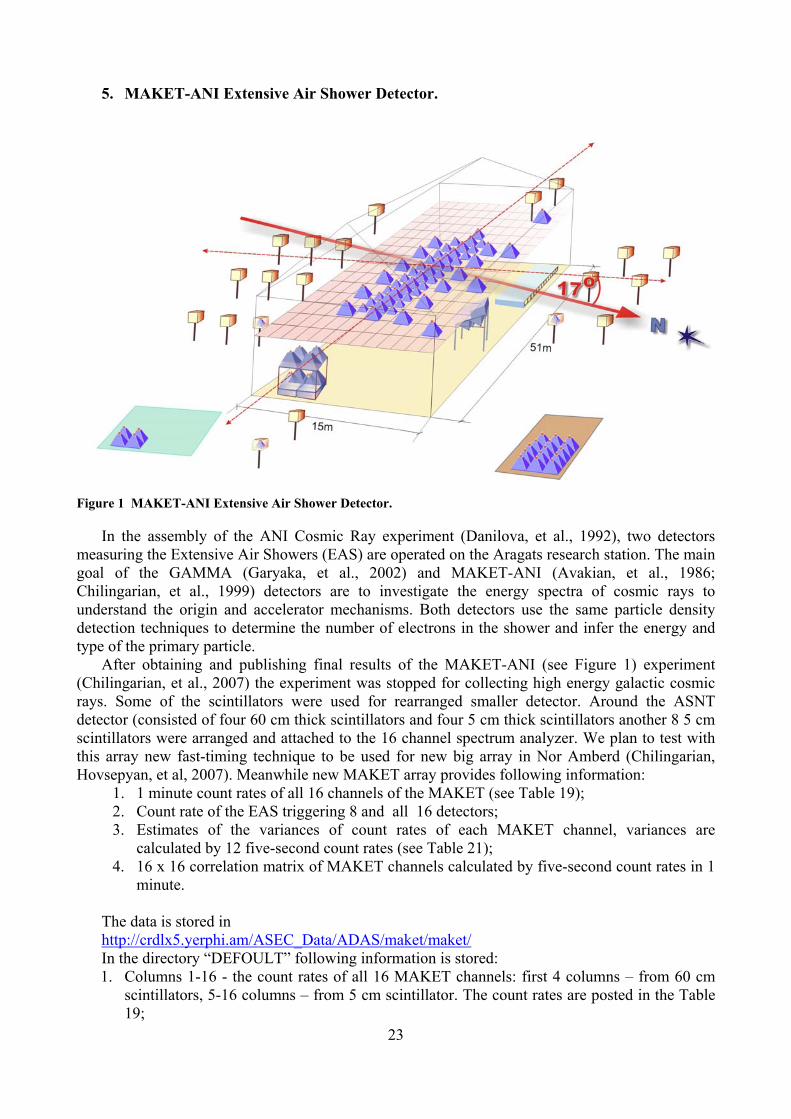
5. MAKET-ANI Extensive Air Shower Detector.
In the assembly of the ANI Cosmic Ray experiment (Danilova, et al., 1992), two detectors measuring the Extensive Air Showers (EAS) are operated on the Aragats research station. The main goal of the GAMMA (Garyaka, et al., 2002) and MAKET-ANI (Avakian, et al., 1986; Chilingarian, et al., 1999) detectors are to investigate the energy spectra of cosmic rays to understand the origin and accelerator mechanisms. Both detectors use the same particle density detection techniques to determine the number of electrons in the shower and infer the energy and type of the primary particle.
After obtaining and publishing final results of the MAKET-ANI (see Figure 1) experiment (Chilingarian, et al., 2007) the experiment was stopped for collecting high energy galactic cosmic rays. Some of the scintillators were used for rearranged smaller detector. Around the ASNT detector (consisted of four 60 cm thick scintillators and four 5 cm thick scintillators another 8 5 cm scintillators were arranged and attached to the 16 channel spectrum analyzer. We plan to test with this array new fast-timing technique to be used for new big array in Nor Amberd (Chilingarian, Hovsepyan, et al, 2007). Meanwhile new MAKET array provides following information:
1. 1 minute count rates of all 16 channels of the MAKET (see Table 19); 2. Count rate of the EAS triggering 8 and all 16 detectors; 3. Estimates of the variances of count rates of each MAKET channel, variances are
calculated by 12 five-second count rates (see Table 21); 4. 16 x 16 correlation matrix of MAKET channels calculated by five-second count rates in 1
minute. The data is stored in http://crdlx5.yerphi.am/ASEC_Data/ADAS/maket/maket/ In the directory “DEFOULT” following information is stored: 1. Columns 1-16 - the count rates of all 16 MAKET channels: first 4 columns – from 60 cm
scintillators, 5-16 columns – from 5 cm scintillator. The count rates are posted in the Table 19;
Figure 1 MAKET-ANI Extensive Air Shower Detector.
24
2. Columns 17-18 – the count rates corresponding to the EAS initiated triggers. 17th column corresponds to the coincidence of the first 8 channels (ASNT scintillators), 18th column corresponding to the coincidence in all 16 channels. The count rates are posted in the Table 20;
3. Columns 19-34 – the variances of 16 channels, see Table 21; 4. Columns 35-154 – the correlation matrix.
In the directories “spectrum” following information is stored: 1. spectrum1, … spectrum4 the histograms of the energy releases in thick 60 cm scintillator
are stored. In files with extension; 2. spectrum5, … spectrum16 the histograms of energy releases in 5 cm thin scintillators are
stored;
In the CRD local server available files with following information: • In the files with “events” extension is related to the Extensive Air Showers (EAS). The
logical software trigger selects events when signals are more than in 8 detectors.
Table 20 Count Rates of the MAKET EAS initiated triggers, variances and relative errors.
Detector Average Standard deviation
Relativeerror [%
Coincidence in thirst 8 channels 20 4 21.02Coincidence in all 16 channels 5 2 41.95
Table 19 Count Rates of the MAKET channels, variances and relative errors.
Detector Average Standard deviation
Relative error [%]
Detector 1 (60cm) 37973 201 0.53 Detector 2 (60cm) 29869 185 0.62 Detector 3 (60cm) 33244 188 0.57 Detector 4 (60cm) 32074 164 0.51
Detector 5 23732 152 0.64 Detector 6 28100 167 0.59 Detector 7 17125 146 0.85 Detector 8 24845 174 0.70 Detector 9 22956 144 0.63 Detector 10 18313 140 0.76 Detector 11 23722 159 0.67 Detector 12 18901 148 0.78 Detector 13 22589 152 0.67 Detector 14 19492 134 0.69 Detector 15 22964 152 0.66 Detector 16 21154 144 0.68
25
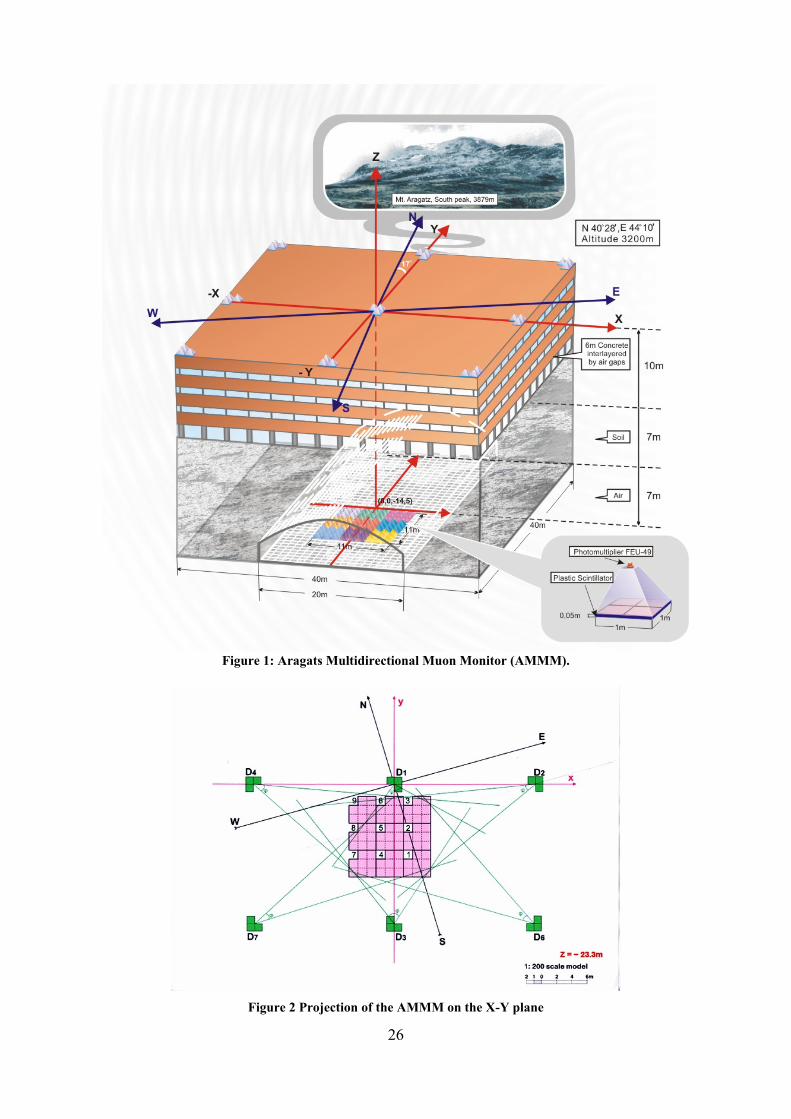
6. Aragats Multidirectional Muon Monitor (AMMM) The Aragats Multidirectional Muon Monitor (AMMM) consists from 2 layers of the
scintillation detectors. 29 scintillation detectors (each detector have 1m2 surface and 5cm thickness), located on top of the top of ANI concrete calorimeter and 100 the same type detectors 14 m below (under 4m concrete and 7m soil), as shown in Figure 13 and 14. Zenith angle between axes of AMMM and direction to South pole is ~-17º. Count rate in the upper detectors is ~28000 counts per minute and variance ~170. Count rate of each of 1 m2 scintillators in the underground hall(high energy muons with energy threshold 5 GeV) is ~3000 counts per minute and variance ~55. The relative accuracy of 1-minute count rates of underground high energy muon detector is ~0.2%, of the low energy muons and electrons on surface ~ 0.12%.
The new electronics will be installed in the summer 2008. The present DAQ consists of scalers attached to on-line PC by COM port.
AMMM data is available from SKYNET local server. Data from first 59 channels of the NAMMM lower layer you can find by this link \\soul\ASEC_data\amet. The last 30 channels of the NAMMM lower layer you can find here \\soul\ASEC_data\arme in the files with extension .ame. The first 30 columns are corresponding to the lower layer AMMM, the second 29 columns corresponding to the upper layer AMMM.
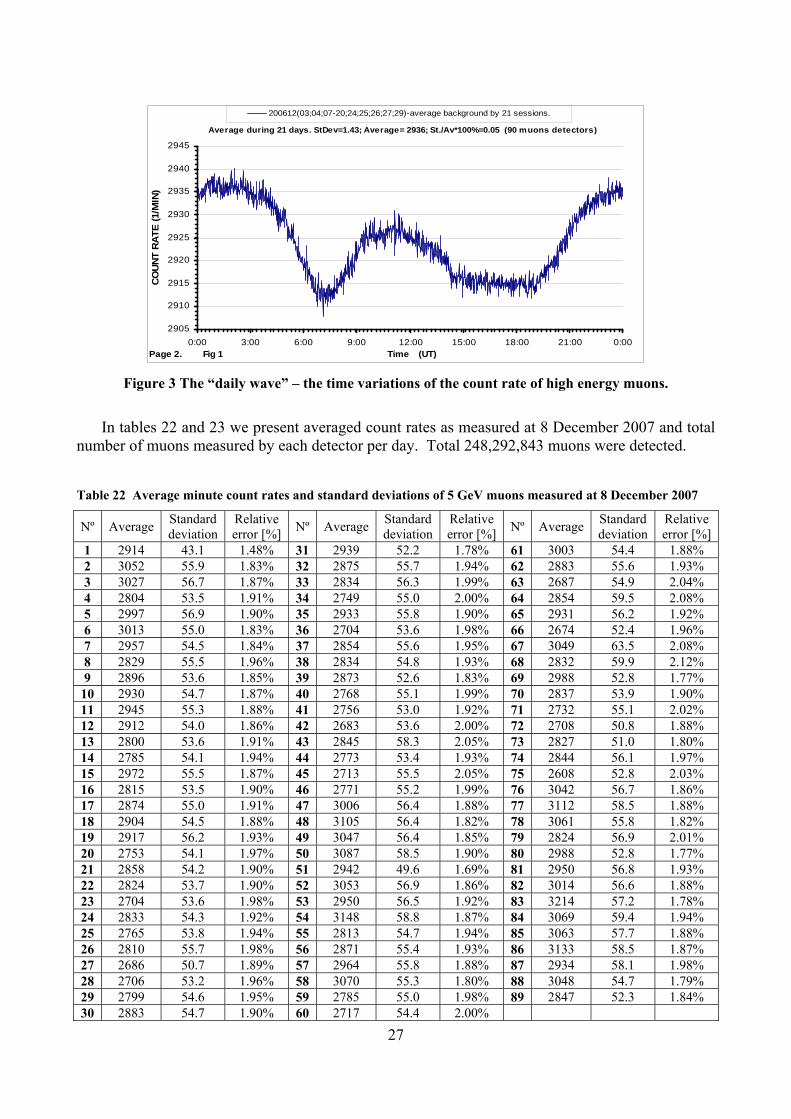
In Figure 15 we present the daily variations of the high energy secondary muons averaged over 21 days.
Table 21 Mean value of the variance, its variance and relative error calculated by 5-sec count rates of 1 minute time span (total 12 5-dec count rates).
Detector Average Standard deviation
Relative error [%]
Detector 1 (60cm) 53 11 21.46 Detector 2 (60cm) 49 10 21.06 Detector 3 (60cm) 52 12 22.63 Detector 4 (60cm) 50 11 21.37
Detector 5 44 10 21.87 Detector 6 47 10 22.18 Detector 7 37 8 20.79 Detector 8 45 11 23.28 Detector 9 43 9 20.85 Detector 10 38 8 21.16 Detector 11 43 9 20.96 Detector 12 39 8 20.66 Detector 13 42 9 20.62 Detector 14 39 8 21.22 Detector 15 43 9 21.68 Detector 16 41 8 20.50
26
Figure 1: Aragats Multidirectional Muon Monitor (AMMM).
Figure 2 Projection of the AMMM on the X-Y plane
27
Average during 21 days. StDev=1.43; Average= 2936; St./Av*100%=0.05 (90 muons detectors)
2905
2910
2915
2920
2925
2930
2935
2940
2945
0:00 3:00 6:00 9:00 12:00 15:00 18:00 21:00 0:00Page 2. Fig 1 Time (UT)
CO
UN
T R
ATE
(1/M
IN)
200612(03;04;07-20;24;25;26;27;29)-average background by 21 sessions.
Figure 3 The “daily wave” – the time variations of the count rate of high energy muons.
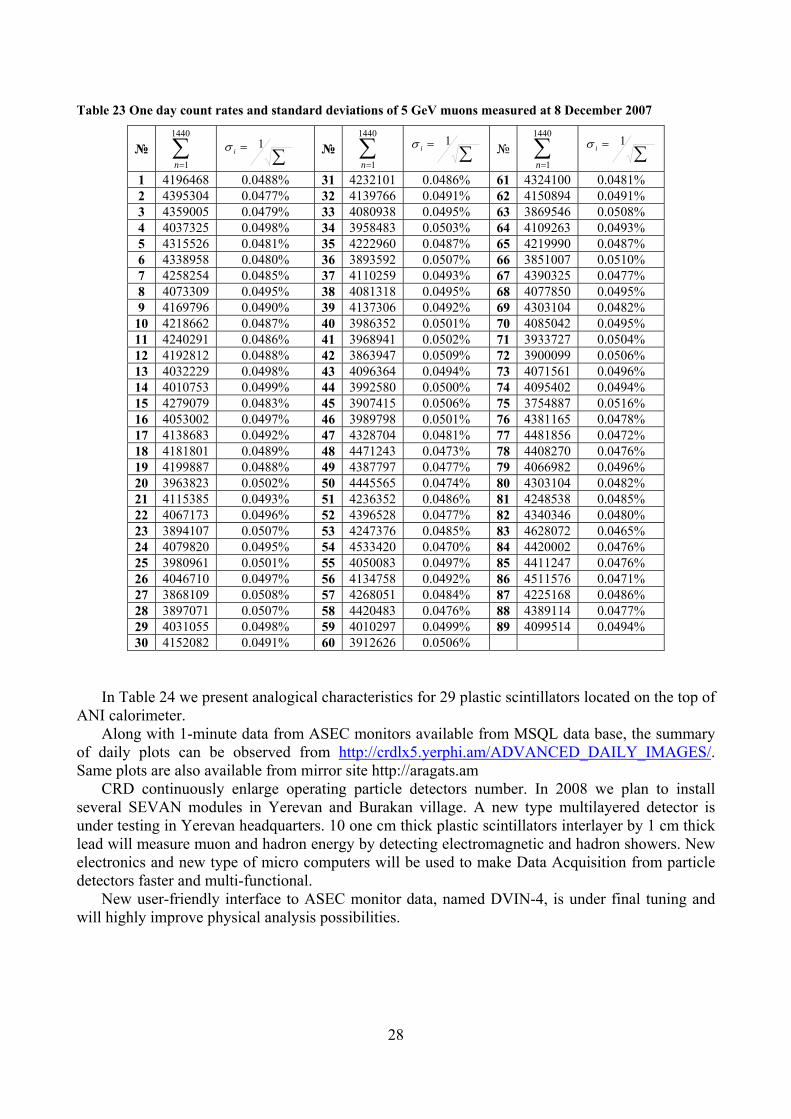
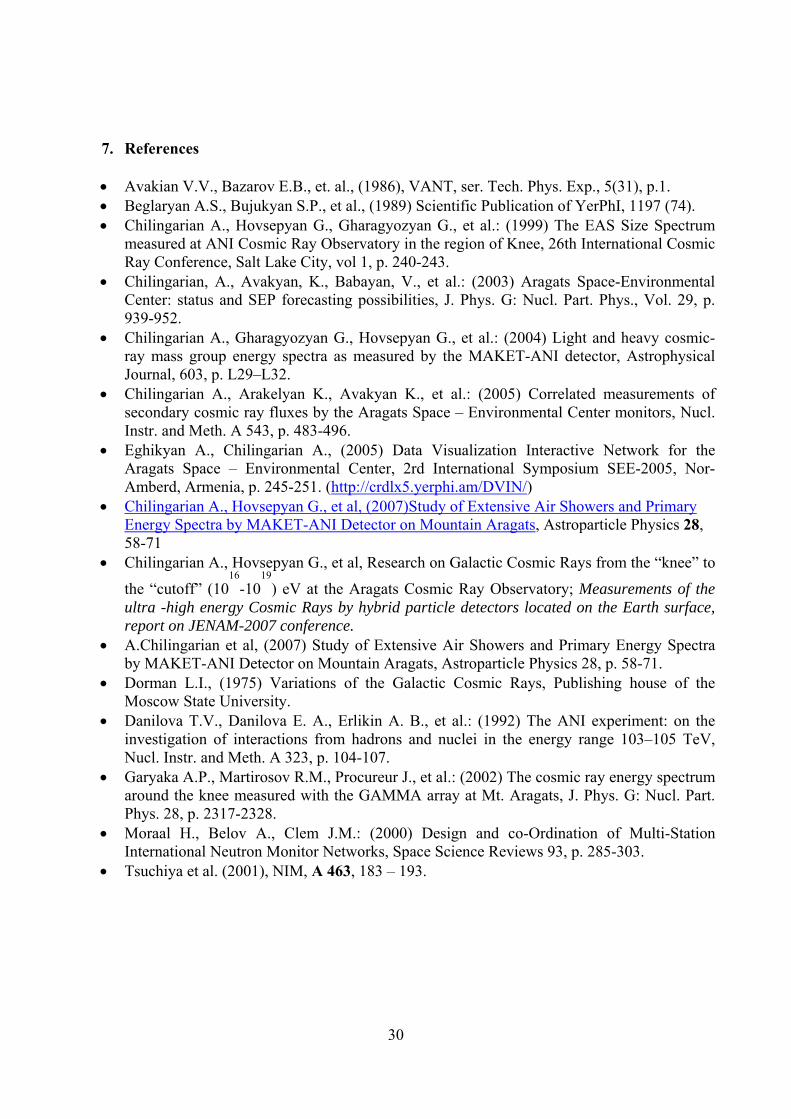
In tables 22 and 23 we present averaged count rates as measured at 8 December 2007 and total
number of muons measured by each detector per day. Total 248,292,843 muons were detected. Table 22 Average minute count rates and standard deviations of 5 GeV muons measured at 8 December 2007
Nº Average Standard deviation
Relative error [%] Nº Average Standard
deviation Relative error [%] Nº Average Standard
deviation Relative error [%]
1 2914 43.1 1.48% 31 2939 52.2 1.78% 61 3003 54.4 1.88% 2 3052 55.9 1.83% 32 2875 55.7 1.94% 62 2883 55.6 1.93% 3 3027 56.7 1.87% 33 2834 56.3 1.99% 63 2687 54.9 2.04% 4 2804 53.5 1.91% 34 2749 55.0 2.00% 64 2854 59.5 2.08% 5 2997 56.9 1.90% 35 2933 55.8 1.90% 65 2931 56.2 1.92% 6 3013 55.0 1.83% 36 2704 53.6 1.98% 66 2674 52.4 1.96% 7 2957 54.5 1.84% 37 2854 55.6 1.95% 67 3049 63.5 2.08% 8 2829 55.5 1.96% 38 2834 54.8 1.93% 68 2832 59.9 2.12% 9 2896 53.6 1.85% 39 2873 52.6 1.83% 69 2988 52.8 1.77%
10 2930 54.7 1.87% 40 2768 55.1 1.99% 70 2837 53.9 1.90% 11 2945 55.3 1.88% 41 2756 53.0 1.92% 71 2732 55.1 2.02% 12 2912 54.0 1.86% 42 2683 53.6 2.00% 72 2708 50.8 1.88% 13 2800 53.6 1.91% 43 2845 58.3 2.05% 73 2827 51.0 1.80% 14 2785 54.1 1.94% 44 2773 53.4 1.93% 74 2844 56.1 1.97% 15 2972 55.5 1.87% 45 2713 55.5 2.05% 75 2608 52.8 2.03% 16 2815 53.5 1.90% 46 2771 55.2 1.99% 76 3042 56.7 1.86% 17 2874 55.0 1.91% 47 3006 56.4 1.88% 77 3112 58.5 1.88% 18 2904 54.5 1.88% 48 3105 56.4 1.82% 78 3061 55.8 1.82% 19 2917 56.2 1.93% 49 3047 56.4 1.85% 79 2824 56.9 2.01% 20 2753 54.1 1.97% 50 3087 58.5 1.90% 80 2988 52.8 1.77% 21 2858 54.2 1.90% 51 2942 49.6 1.69% 81 2950 56.8 1.93% 22 2824 53.7 1.90% 52 3053 56.9 1.86% 82 3014 56.6 1.88% 23 2704 53.6 1.98% 53 2950 56.5 1.92% 83 3214 57.2 1.78% 24 2833 54.3 1.92% 54 3148 58.8 1.87% 84 3069 59.4 1.94% 25 2765 53.8 1.94% 55 2813 54.7 1.94% 85 3063 57.7 1.88% 26 2810 55.7 1.98% 56 2871 55.4 1.93% 86 3133 58.5 1.87% 27 2686 50.7 1.89% 57 2964 55.8 1.88% 87 2934 58.1 1.98% 28 2706 53.2 1.96% 58 3070 55.3 1.80% 88 3048 54.7 1.79% 29 2799 54.6 1.95% 59 2785 55.0 1.98% 89 2847 52.3 1.84% 30 2883 54.7 1.90% 60 2717 54.4 2.00%
28
Table 23 One day count rates and standard deviations of 5 GeV muons measured at 8 December 2007
№ ∑=
1440
1n ∑
= 1iσ № ∑
=
1440
1n ∑
= 1iσ
№ ∑=
1440
1n ∑
= 1iσ
1 4196468 0.0488% 31 4232101 0.0486% 61 4324100 0.0481% 2 4395304 0.0477% 32 4139766 0.0491% 62 4150894 0.0491% 3 4359005 0.0479% 33 4080938 0.0495% 63 3869546 0.0508% 4 4037325 0.0498% 34 3958483 0.0503% 64 4109263 0.0493% 5 4315526 0.0481% 35 4222960 0.0487% 65 4219990 0.0487% 6 4338958 0.0480% 36 3893592 0.0507% 66 3851007 0.0510% 7 4258254 0.0485% 37 4110259 0.0493% 67 4390325 0.0477% 8 4073309 0.0495% 38 4081318 0.0495% 68 4077850 0.0495% 9 4169796 0.0490% 39 4137306 0.0492% 69 4303104 0.0482%
10 4218662 0.0487% 40 3986352 0.0501% 70 4085042 0.0495% 11 4240291 0.0486% 41 3968941 0.0502% 71 3933727 0.0504% 12 4192812 0.0488% 42 3863947 0.0509% 72 3900099 0.0506% 13 4032229 0.0498% 43 4096364 0.0494% 73 4071561 0.0496% 14 4010753 0.0499% 44 3992580 0.0500% 74 4095402 0.0494% 15 4279079 0.0483% 45 3907415 0.0506% 75 3754887 0.0516% 16 4053002 0.0497% 46 3989798 0.0501% 76 4381165 0.0478% 17 4138683 0.0492% 47 4328704 0.0481% 77 4481856 0.0472% 18 4181801 0.0489% 48 4471243 0.0473% 78 4408270 0.0476% 19 4199887 0.0488% 49 4387797 0.0477% 79 4066982 0.0496% 20 3963823 0.0502% 50 4445565 0.0474% 80 4303104 0.0482% 21 4115385 0.0493% 51 4236352 0.0486% 81 4248538 0.0485% 22 4067173 0.0496% 52 4396528 0.0477% 82 4340346 0.0480% 23 3894107 0.0507% 53 4247376 0.0485% 83 4628072 0.0465% 24 4079820 0.0495% 54 4533420 0.0470% 84 4420002 0.0476% 25 3980961 0.0501% 55 4050083 0.0497% 85 4411247 0.0476% 26 4046710 0.0497% 56 4134758 0.0492% 86 4511576 0.0471% 27 3868109 0.0508% 57 4268051 0.0484% 87 4225168 0.0486% 28 3897071 0.0507% 58 4420483 0.0476% 88 4389114 0.0477% 29 4031055 0.0498% 59 4010297 0.0499% 89 4099514 0.0494% 30 4152082 0.0491% 60 3912626 0.0506%
In Table 24 we present analogical characteristics for 29 plastic scintillators located on the top of ANI calorimeter.
Along with 1-minute data from ASEC monitors available from MSQL data base, the summary of daily plots can be observed from http://crdlx5.yerphi.am/ADVANCED_DAILY_IMAGES/. Same plots are also available from mirror site http://aragats.am
CRD continuously enlarge operating particle detectors number. In 2008 we plan to install several SEVAN modules in Yerevan and Burakan village. A new type multilayered detector is under testing in Yerevan headquarters. 10 one cm thick plastic scintillators interlayer by 1 cm thick lead will measure muon and hadron energy by detecting electromagnetic and hadron showers. New electronics and new type of micro computers will be used to make Data Acquisition from particle detectors faster and multi-functional.
New user-friendly interface to ASEC monitor data, named DVIN-4, is under final tuning and will highly improve physical analysis possibilities.

29
Table 24 Averaged 1 minute and dayly count rates of surface low energy charged flux measured at 8 December 2007
№ Average Standard deviation
Relative error [%]
1 29279 180 0.62% 2 28238 249 0.88% 3 28721 261 0.91% 4 29703 223 0.75% 5 29283 181 0.62% 6 28333 256 0.90% 7 29948 247 0.82% 8 28859 301 1.04% 9 29119 244 0.84%
10 29076 178 0.61% 11 28789 282 0.98% 12 28460 166 0.58% 13 29077 178 0.61% 14 29895 229 0.77% 15 28972 250 0.86% 16 28734 245 0.85% 17 29056 240 0.83% 18 27832 248 0.89% 19 29461 230 0.78% 20 29767 236 0.79% 21 28782 229 0.80% 22 27445 247 0.90% 23 29092 238 0.82% 24 29076 177 0.61% 25 28207 281 0.99% 26 29053 224 0.77% 27 28370 257 0.91% 28 28111 175 0.62% 29 28491 248 0.87%
№ ∑=
1440
1n ∑
= 1iσ
1 42161758 0.0154% 2 40662397 0.0157% 3 41357704 0.0155% 4 42772070 0.0153% 5 42167188 0.0154% 6 40799310 0.0157% 7 43124876 0.0152% 8 41557256 0.0155% 9 41931409 0.0154% 10 41870013 0.0155% 11 41455964 0.0155% 12 40982046 0.0156% 13 41871011 0.0155% 14 43049245 0.0152% 15 41719295 0.0155% 16 41377597 0.0155% 17 41840189 0.0155% 18 40078730 0.0158% 19 42423917 0.0154% 20 42864930 0.0153% 21 41446634 0.0155% 22 39520922 0.0159% 23 41891844 0.0155% 24 41868918 0.0155% 25 40618066 0.0157% 26 41835649 0.0155% 27 40853231 0.0156% 28 40480268 0.0157% 29 41026404 0.0156%
30
7. References
• Avakian V.V., Bazarov E.B., et. al., (1986), VANT, ser. Tech. Phys. Exp., 5(31), p.1. • Beglaryan A.S., Bujukyan S.P., et al., (1989) Scientific Publication of YerPhI, 1197 (74). • Chilingarian A., Hovsepyan G., Gharagyozyan G., et al.: (1999) The EAS Size Spectrum
measured at ANI Cosmic Ray Observatory in the region of Knee, 26th International Cosmic Ray Conference, Salt Lake City, vol 1, p. 240-243.
• Chilingarian, A., Avakyan, K., Babayan, V., et al.: (2003) Aragats Space-Environmental Center: status and SEP forecasting possibilities, J. Phys. G: Nucl. Part. Phys., Vol. 29, p. 939-952.
• Chilingarian A., Gharagyozyan G., Hovsepyan G., et al.: (2004) Light and heavy cosmic-ray mass group energy spectra as measured by the MAKET-ANI detector, Astrophysical Journal, 603, p. L29–L32.
• Chilingarian A., Arakelyan K., Avakyan K., et al.: (2005) Correlated measurements of secondary cosmic ray fluxes by the Aragats Space – Environmental Center monitors, Nucl. Instr. and Meth. A 543, p. 483-496.
• Eghikyan A., Chilingarian A., (2005) Data Visualization Interactive Network for the Aragats Space – Environmental Center, 2rd International Symposium SEE-2005, Nor-Amberd, Armenia, p. 245-251. (http://crdlx5.yerphi.am/DVIN/)
• Chilingarian A., Hovsepyan G., et al, (2007)Study of Extensive Air Showers and Primary Energy Spectra by MAKET-ANI Detector on Mountain Aragats, Astroparticle Physics 28, 58-71
• Chilingarian A., Hovsepyan G., et al, Research on Galactic Cosmic Rays from the “knee” to
the “cutoff” (1016
-1019
) eV at the Aragats Cosmic Ray Observatory; Measurements of the ultra -high energy Cosmic Rays by hybrid particle detectors located on the Earth surface, report on JENAM-2007 conference.
• A.Chilingarian et al, (2007) Study of Extensive Air Showers and Primary Energy Spectra by MAKET-ANI Detector on Mountain Aragats, Astroparticle Physics 28, p. 58-71.
• Dorman L.I., (1975) Variations of the Galactic Cosmic Rays, Publishing house of the Moscow State University.
• Danilova T.V., Danilova E. A., Erlikin A. B., et al.: (1992) The ANI experiment: on the investigation of interactions from hadrons and nuclei in the energy range 103–105 TeV, Nucl. Instr. and Meth. A 323, p. 104-107.
• Garyaka A.P., Martirosov R.M., Procureur J., et al.: (2002) The cosmic ray energy spectrum around the knee measured with the GAMMA array at Mt. Aragats, J. Phys. G: Nucl. Part. Phys. 28, p. 2317-2328.
• Moraal H., Belov A., Clem J.M.: (2000) Design and co-Ordination of Multi-Station International Neutron Monitor Networks, Space Science Reviews 93, p. 285-303.
• Tsuchiya et al. (2001), NIM, A 463, 183 – 193.