Derwent London plc Results 2008 · • Secured loans only have two financial covenants • Covenant...
68
Derwent London plc Results 2008
Transcript of Derwent London plc Results 2008 · • Secured loans only have two financial covenants • Covenant...

Derwent London plcResults 2008

Page
Achievements 01
Results review 02
Debt and financing 11
Market summary 16
Valuation 20
Portfolio statistics 25
Portfolio management 33
Acquisitions and disposals 37
Projects update 39
Summary 49
Appendices 51• Debt facilities 53• Financial detail 54• Capital expenditure 55 • Portfolio summary 56• Portfolio statistics by village 57• Principal lettings 2008 58• Annualised contracted rental income 59• Projects completed in 2008 60• Appraisal studies 63• Building cost trends 64• Management structure - executive team 65
Disclaimer 66
Presentation: John Burns, Chris Odom, Simon Silver, Paul Williams, Nigel George, David Silverman
Con
tent
sContents

• 488,000 sq ft of letting activity in 2008 generating an annual rental income of £16.3m
• Low vacancy rate maintained, representing 3.8% at the year end – down from 4.5% a year earlier
• Development completions at Horseferry House and Arup II – both pre-let – new projects on hold
• Disposal of non-core assets of £72.6m to show a profit of £1.2m
• An annual property return of -18.9% – outperforming the IPD Quarterly Property Index for Central London offices which was -23.5%
AchievementsA
chie
vem
ents
01 A year focused on income management

Res
ults
revi
ew
Results review31 December 2008
02

Headline numbers
• Adjusted net asset value per share 1,226p (31 December 2007: 1,801p)
• Recurring profit before tax £m Unadjusted recurring profit before tax 23.3 Reverse surrender premium paid 8.3 Foreign exchange translation loss 8.3 Adjusted recurring profit before tax 39.9 (2007: £37.6m)
• Diluted recurring earnings per share 22.73p (2007: 34.99p)
• Total dividend per share for 2008 up 8.9% to 24.5p (2007: 22.5p)
• Recommended final dividend 16.35p per share
03
Res
ults
revi
ew

• Summarised format
31.12.08 31.12.07 £m £m Investment property 2,068.1 2,654.6 Other non-current assets 38.8 33.8 2,106.9 2,688.4
Assets held for sale 25.0 12.8 Other current (liabilities)/assets (9.1) 12.5 Cash 10.5 10.3 Bank overdrafts and loans (106.6) (120.6) Corporation tax liability (7.1) (75.4) (87.3) (160.4) Financial liabilities (769.3) (672.5) Other liabilities (35.3) (13.6) (804.6) (686.1) Total net assets 1,215.0 1841.9 Minority interests (35.4) (59.9) Attributable to equity holders 1,179.6 1,782.0
Res
ults
revi
ew
04
Group balance sheet

Res
ults
revi
ew
05
Net asset value per share
• Reconciliation 31.12.08 31.12.07 £m p £m p Net assets attributable to equity shareholders 1,179.6 1,170 1,782.0 1,770 Deferred tax on revaluation surplus 8.4 11.4 Fair value of derivatives 26.9 (1.2) Fair value adjustment to bond on acquisition 20.9 21.6
1,235.8 1,226 1,813.8 1,801
• Movement in adjusted net assets £m Recurring profit before taxation 23.3 Foreign exchange loss 8.3 31.6 Revaluation deficit (602.1) Revaluation deficit in joint venture (1.3) Taxation 5.1 Dividends paid (23.3) Other 0.7 (589.3) Minority interest 11.3 (578.0)

• Summarised format
2008 2007 £m £m Gross property income 119.0 111.7 Other income 0.9 - Property outgoings (14.6) (9.9) 105.3 101.8 Development income 0.5 2.0 Reverse surrender premium (8.3) - Trading stock write down (2.0) - 95.5 103.8 Administrative expenses (16.7) (17.9) Revaluation (deficit)/surplus (602.1) 90.3 Profit on disposals 1.2 130.8 Finance costs (47.2) (48.5) Foreign exchange (loss)/profit (8.3) 0.4 Joint venture results (0.8) (0.3) Derivatives fair value adjustment (28.1) (5.1) (606.5) 253.5 Goodwill impairment - (353.3) IFRS loss before tax (606.5) (99.8)Res
ults
revi
ew
06
Group income statement

• Reconciliation of recurring profit before tax to IFRS loss before tax
2008 2007 £m £m Loss before tax (606.5) (99.8) Revaluation deficit/(surplus) 602.1 (90.3) Joint venture revaluation deficit 1.3 - Profit on disposal of properties (1.2) (129.8) Loss on joint venture disposal - 0.7 Profit on disposal of investments - (1.0) Development income (0.5) (2.0) Fair value movement in derivatives 28.1 5.1 2007 acquisitions/debenture redemption adjustments - 355.1 23.3 38.0
Res
ults
revi
ew
07
Group income statement

• Gross property income increased £7.3m from 2007 to £119.0m • Growth driven by letting activity (£12.3m), with more still to come (eg Angel Building, Qube) • Main contributions were from Horseferry House (£3.1m), Qube (£1.5m), Tower House (£1.0m) • Extra month from LMS added £4.1m • Lost rent from disposals relates mainly to H2 2007 disposals • Year on year reconciliation in Appendix 2
• Property outgoings rose £4.7m to £14.6m partly due to letting activity in 2008 • Voids rose £2.3m and transaction costs £2.1m • Breakdown of costs in Appendix 2
• Administrative expenses, excluding valuation movement on cash settled options • Reduction on 2007 of £1.2m to £18.3m • Reduction of about £1.9m on combined pre acquisition expenses (no allowance for inflation) • Breakdown of costs in Appendix 2
Res
ults
revi
ew
08
Group income statement

• Net finance costs 2008 2007 £m £m Bank interest and loan notes 37.0 37.9 Secured bond 10.8 9.9 Other 1.1 1.3 48.9 49.1 Foreign exchange loss 8.3 (0.4) Finance income (1.7) (2.4) 55.5 46.3
Res
ults
revi
ew
09
Group income statement
• Increased interest in 2008 due to LMS extra month, estimated at £2m • Foreign exchange translation loss on intercompany loan from LMS Inc • Accounting standards split this adjustment – debit to income statement of £8.3m (2007: credit £0.4m); credit to reserves £8.2m (2007: debit £0.6m) • Sterling/dollar rate was 0.55 cents lower at 31 December 2008
• Other items • Development income • Trading property write down • Result of property disposals
• Tax credit • 2008 tax charge £1.4m • Prior year tax credit from utilisation of ex LMS tax losses following agreement with HMRC and over-provision relating to 2007 disposals • Net write back of deferred tax is due to revaluation deficit

Res
ults
revi
ew
10
Cash flow
• Cash outflow for 2008 was £83.7m (2007: inflow £116.9m) after payment of dividends 2008 2007 £m £m Operating activities 38.3 28.4 Dividends (23.5) (13.2) 14.8 15.2 REIT conversion charge (53.6) - Investing activities (44.9) 101.7 (83.7) 116.9
• Dividends increased due to • New shares issued as a result of LMS acquisition not entitled to 2006 final dividend • Dividend policy adopted on acquisition of LMS • Effect of REIT status which enabled distribution of part of the tax charge saved
• REIT conversion charge is a one off payment
• Net investment in portfolio 2008 2007 £m £m Acquisitions 31.9 140.7 Capex 72.9 68.3 Disposals - property (72.6) (343.3) - investments - (9.1) 32.2 (143.4)

11
Debt and financing
Deb
t and
fina
ncin
g

• Net debt 31.12.08 31.12.07 £m £m Bank overdraft and loans 106.6 120.6 Financial liabilities 769.3 672.5 Cash and cash requirements (10.5) (10.3) Net debt 865.4 782.8 Acquired fair value of bond less costs (19.3) (19.9) Leasehold liabilities (8.6) (9.0) Drawn facilities 837.5 753.9
• Gearing 31.12.08 31.12.07 Balance sheet 71.2% 42.5% LTV 39.7% 28.2% Interest - current definition 1.88 1.81 - future definition 2.47 2.24
Deb
t and
fina
ncin
g
12
Net debt and gearing ratios

• Debt facilities total £1.145 billion. Full list of facilities is provided in Appendix 1
• £125m facility maturing in November 2009 has been refinanced. It is fully credit approved by existing lender and only subject to completion of documentation
• New facility • 5 year term • Small reduction in LTV • ICR unchanged • Margin increased in line with current rates
• Next maturity is now in December 2011
• Unutilised committed facilities at 31 December 2008 were £290m
• Current forecasts show a £65m net cash outflow through to end 2010
• Current cash flow forecast to 31 December 2010 predicts unutilised committed facilities of about £235m
Deb
t and
fina
ncin
g
13
Debt facilities and utilisation

• Leasehold liabilities and fair value amounts are excluded from covenant testing
• Covenant position • Structure of bank facilities gives maximum flexibility • Secured loans only have two financial covenants • Covenant ranges LTV ICR Documented 50-80% 120-150% Actual (27.2.09) 40-56% 177-1,136%
• At current interest rates, headroom under ICR covenants is substantial • There are no breaches of LTV covenants • All facilities have security values in excess of covenant requirements (based on 31 December 2008) • Extent of excess security is such that it allows full drawdown of all but £2m of total facilities • Additionally, value of unsecured properties was in excess of £400m at 31 December 2008 • Security values to support Headroom basedon31.12.08 £bn valuation Debt at 31.12.08 1.18 44% Predicted 31.12.10 drawings 1.26 40% Full draw down of facilities 1.58 25%
Portfolio fair value at 31.12.08 was £2.11bn
Deb
t and
fina
ncin
g
14
Debt covenants

• 66% of drawn facilities was either fixed or hedged at 31 December 2008
• Current figure is 70%
• Maturity profile of fixed and hedged debt at 27 February 2009 is shown in the bar chart
• Average weighted LIBOR of hedging is 4.84%
• Fair value adjustment for the secured bond is not included in the results. At 31 December 2008, this would have been a gain of £18.7m (31 December 2007: loss £15.0m)
• Spot weighted average cost of drawn facilities at • 31 December 2008 5.47% • 27 February 2008 4.50%
Fixed and hedged debt at 31 December 2008
Floating 34%
Fixed 21%
Capped1%
Swaps 44%
Deb
t and
fina
ncin
g
15
Liability risk management
Maturity profile of fixed and hedged debt at 27 February 2009
30
50
20
200
30
40
40
175
0 25 50 75 100 125 150 175 200
2009
2010
2011
2012
2013
2014
2015
2016
2017
2018
2026
£ million

Mar
ket s
umm
ary
Market summary
16

WestEnd
• Take-up of 3.6m sq ft in 2008 – down 28% on 2007 and 13% lower than the long term average
• First half take-up of 2.0m sq ft, declining to 1.6m sq ft in the second half as demand weakened
• Over the year, the vacancy rate increased from 2.3% to 5.1% – just below the long-term average of 5.4% and representing just over 6m sq ft (1)
• During the year, the prime rental growth index (2) decreased by • 16% West End • 18% City
Mar
ket s
umm
ary
17
Our market Occupational market
Central London office vacancy rates
0
2
4
6
8
10
12
14
16
18
19
84
19
86
19
88
19
90
19
92
19
94
19
96
19
98
20
00
20
02
20
04
20
06
20
08
Vacan
cy r
ate
(%
)
Central LondonCityWest EndCity averageWest End average
Source: CB Richard Eliis
1
Central London prime office rental growth
-30
-20
-10
0
10
20
30
40
1995
1996
1997
1998
1999
2000
2001
2002
2003
2004
2005
2006
2007
2008
Ren
tal g
row
th (
% p
a)
Central LondonCityWest End
Source: CB Richard Ellis
2

Mar
ket s
umm
ary
• £7.4bn of central London office investment transactions in 2008 – down 58% on 2007 and 20% lower than the ten-year average (1)
• However, transactions in the final quarter were £2.2bn – only 6% lower than the ten-year quarterly average
• West End transactions in 2008 were down 44% on the previous year
• Overseas investors accounted for 57% of central London investments in 2008 – similar to 2007
• During the year, West End prime yields moved out 75 basis points to 5.50% and City yields by 140 basis points to 6.65%
• The 5-year swap rate fell from 5.2% to 3.2% in 2008 – the main constraint is the availability of debt rather than the cost of borrowing (2)
• There is interest from equity buyers for circa £20m lot sizes (+10 year leases, good cash flow – yields circa 6%)
18
Our marketInvestment summary
Central London investment transactions
0
1
2
3
4
5
6
2000 Q
2
2000 Q
4
2001 Q
2
2001 Q
4
2002 Q
2
2002 Q
4
2003 Q
2
2003 Q
4
2004 Q
2
2004 Q
4
2005 Q
2
2005 Q
4
2006 Q
2
2006 Q
4
2007 Q
2
2007 Q
4
2008 Q
2
2008 Q
4
£ b
illio
n
Total4 quarter average
Source: CB Richard Ellis
1
Prime yields vs swap rates
3%
4%
5%
6%
7%
8%
20
00
Q2
20
00
Q4
20
01
Q2
20
01
Q4
20
02
Q2
20
02
Q4
20
03
Q2
20
03
Q4
20
04
Q2
20
04
Q4
20
05
Q2
20
05
Q4
20
06
Q2
20
06
Q4
20
07
Q2
20
07
Q4
20
08
Q2
20
08
Q4
5 Year Swap Rate City West End
Source: CB Richard Ellis
2

Mar
ket s
umm
ary
19
Our marketDevelopment pipeline
West End development pipeline - December 2007
-
0.5
1.0
1.5
2.0
2.5
3.0
3.5
4.0
19
85
19
87
19
89
19
91
19
93
19
95
19
97
19
99
20
01
20
03
20
05
20
07
20
09
20
11
Flo
ors
pa
ce
(m
illi
on
sq
ft)
Completions Pre-let Speculative
Source: Savills
1
West End development pipeline - December 2008
-
0.5
1.0
1.5
2.0
2.5
3.0
3.5
4.0
19
85
19
87
19
89
19
91
19
93
19
95
19
97
19
99
20
01
20
03
20
05
20
07
20
09
20
11
Flo
ors
pa
ce
(m
illi
on
sq
ft)
Completions Pre-let Speculative
Source: Savills
1
2
• Market response to the economic conditions – West End development completions, 2008 to 2011, cut by
1.9m sq ft (1)
• 4.5m sq ft of new office space is due to be delivered between 2009 and 2011 (8% pre-let)
• The pipeline is considerably smaller than in the early 1990s recession when completions totalled 8.8m sq ft between 1990 and 1992 (2)
• It is not anticipated that the West End vacancy rate will rise to the 12% levels seen in the early 1990s
• Of key importance will be the amount of tenant controlled space that is released to the market

Valu
atio
n
20
Valuation

21
Valuation performance Key points
Valu
atio
n
Our low rents provided some resilience to the valuation decline
• An outperformance against the IPD3 office capital value growth figures • Central London -27.0% • West End -25.4% • City -28.7%
• Underlying rental value movement -3.4% • H1 +1.3% • H2 -4.6%
1 Prior to the adjustment for lease incentives of £5.0m2 Angel Building, Arup III, Gresse Street/Rathbone Place, Leonard Street3 Quarterly Index
• Investment portfolio valuation 31 December 2008
Portfolio Valuation Valuation valuation movement movement £m £m1 %
Investment properties 1,975.9 -543.6 -21.6 Development properties2 107.0 -46.9 -30.5
Underlying 2,082.9 -590.5 -22.1 Acquisitions 25.1 -6.6 -20.8
2,108.0 -597.1 -22.1
• Valuation movement
H1 H2 2008 % % % West End -5.3 -17.8 -22.1 City Borders -7.8 -17.5 -23.9 Central London -5.8 -17.8 -22.5 Provincial -8.6 -7.7 -15.6Underlying -6.0 -17.2 -22.1

Valu
atio
nValuation performance By location
22
Valuation Valuation Portfolio movement movement valuation Weighting 20081 20082 Comment £m % % £m
WestEnd Paddington 38.7 2 -7.6 -3.2 Planning permission at North Wharf Road Belgravia 118.7 6 -15.0 -21.0 Long term development potential Victoria 235.7 11 -19.2 -55.8 Letting activity at Gordon House Soho/Covent Garden 213.8 10 -21.2 -57.6 Noho 138.7 7 -22.9 -41.0 Baker Street/Marylebone 116.8 5 -23.2 -35.3 Fitzrovia/Euston 522.5 25 -24.2 -166.3 Camden/Islington 97.7 5 -25.0 -32.6 Mayfair 44.7 2 -30.2 -19.4 11% rental value decline Other3 20.1 1 -25.0 -6.7
1,547.4 74 -22.1 -438.9CityBorders Shoreditch 63.6 3 -9.5 -6.6 Continued letting activity at Tea Building Clerkenwell 127.7 6 -23.7 -39.7 Holborn/Midtown 100.7 5 -25.2 -33.9 Old Street 126.2 6 -26.8 -46.3 Southbank 7.0 - -49.1 -6.7 Short term letting at low rent Other 0.3 - - -
425.5 20 -23.9 -133.2
CentralLondon 1,972.9 94 -22.5 -572.1
Provincial 135.1 6 -15.6 -25.0 Relatively long leases
Investmentportfolio 2,108.0 100 -22.1 -597.11 Underlying - properties held throughout the period 2 Including acquisitions 3 Principally Portobello Dock
23
Valuation performance True equivalent yields
Valu
atio
n
Portfolio yields
3%
4%
5%
6%
7%
8%
9%
Dec-02 Dec-03 Dec-04 Dec-05 Dec-06 Dec-07 Dec-08
Initial yield True equivalent yield Reversionary yield
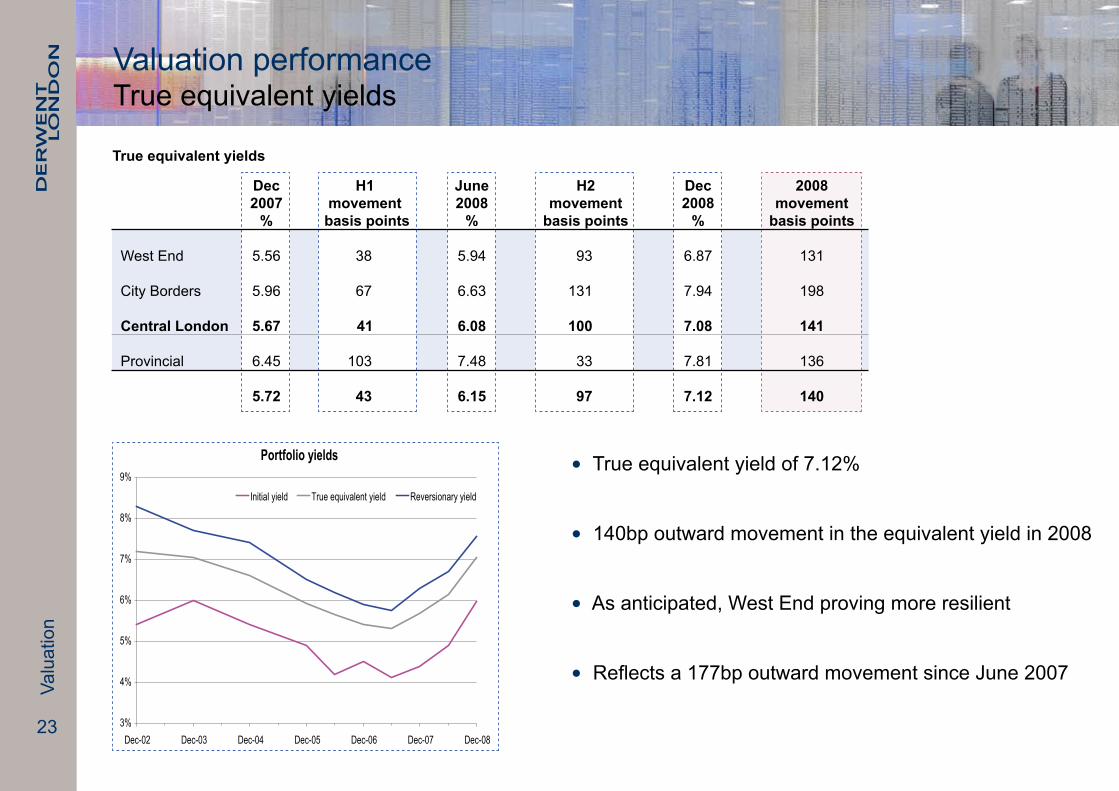
• True equivalent yield of 7.12%
• 140bp outward movement in the equivalent yield in 2008
• As anticipated, West End proving more resilient
• Reflects a 177bp outward movement since June 2007
Trueequivalentyields
Dec H1 June H2 Dec 2008 2007 movement 2008 movement 2008 movement % basispoints % basispoints % basispoints
West End 5.56 38 5.94 93 6.87 131
City Borders 5.96 67 6.63 131 7.94 198 CentralLondon 5.67 41 6.08 100 7.08 141 Provincial 6.45 103 7.48 33 7.81 136
5.72 43 6.15 97 7.12 140

Valuation performance Yields and lease length
1 Yield to Derwent London at 31 December 2008 based upon an annualised contracted net rental income, including pre-lets, of £126.4m pa and an estimated rental value of £167.8m pa. Adjusted for costs to complete for commenced projects
Valu
atio
n
Average unexpired lease length 2
3
4
5
6
7
8
9
10
11
12
2003 2004 2005 2006 2007 2008
Years
West End City Borders Central London
2 Lease length weighted by rental income and assuming tenants' break at first opportunity24
Yield profile1
Initial Reversionary Yield yield yield spread % % %
West End 5.6 7.4 1.8
City borders 7.1 8.3 1.2
CentralLondon 5.9 7.6 1.7
Provincial 6.4 6.9 0.5 6.0 7.6 1.6
• Initial yield based upon £126.4m annualised contracted rental income at 31 December – Appendix 7 • Includes rent frees – principally Burberry, expires later this year • Pre-run off initial yield of 5.5%
• 160bp increase in the initial yield over 2008
• Reversion concentrated in the West End
• Weighted average unexpired lease length of 8.3 years • Central London 8.1 years • Provincial 11.9 years

Por
tfolio
sta
tistic
s
25
Portfolio statistics

26
Portfolio summary Rental income profile
Por
tfolio
sta
tistic
s
• Core portfolio £2,001m, including acquisitions
• Development properties £107m – Arup III, Angel Building, 16-19 Gresse Street/7-8 Rathbone Place and Leonard Street • £5.3m pa of income during construction – principally BT at Angel Building • £2.4m pa uplift from pre-let on completion of Arup III in 2009
• 33% reversionary potential at £41.4m – down from 47% in 2007 (£55.0m)
• Of the £18.6m rent review/lease reversion, £3.1m is contracted fixed uplifts
1 Existing income from Angel Building (£4.2m) and Arup III (£1.2m) less ground rent for 16-19 Gresse Street and 7-8 Rathbone Place (£0.1m) 2 Yield based upon the valuation of £2,108m and adjusted for cost to complete for commenced schemes and developments
Income profile CorepropertiesDevelopmentsTotal Rental Rental Rental Rental Rental Rental uplift perannum uplift perannum uplift perannum Yield2
£m £m £m £m £m £m %
Contracted rental income, net of ground rents 121.1 5.31 126.4 6.0 Letting vacant accommodation - available 6.4 - 6.4 6.3 Completion and letting of current schemes 5.0 2.8 7.8 6.6 Contracted Arup III additional rental increase at project completion - 2.4 2.4 6.7 Angel additional rental income upon letting the development - 6.2 6.2 6.7 Contractual lease rental increases across the portfolio 3.1 - 3.1 6.9
Anticipated rent review and lease renewal reversions 14.6 0.9 15.5 7.6
Portfolio reversion 29.1 12.3 41.4 150.2 17.6 167.8

27
• Year end vacancy level of available space • 3.8% of portfolio rental value • 4.0% of portfolio floor area
• Good progress on lettings since year end1 The Angel development is currently let to BT under their existing lease. On expiry of this lease in March 2010, 139,500 sq ft will be taken by Cancer Research at £5.6m pa. The balance will be available with a rental value of £4.8m pa2 Forms part of the Saatchi masterplan, Fitzrovia
Por
tfolio
sta
tistic
sPortfolio summary Vacant accommodation
Vacantaccommodation Floor Rental
at31December2008 area perannum Comment 000sqft £mAvailable Qube, W1 46 2.5 41,000 sq ft under offer/let post year end Strathkelvin, Scotland 60 1.0 Encouraging interest following M&S letting in December 2008 Portobello Dock, W10 33 0.8 Now targeting smaller suites 1-3 Grosvenor Place, SW1 9 0.5 Under offer Other 76 224 1.6 6.4 Refurbishments Totfield House, W12 14 0.5 Refurbishment in progress. Completion Q2 2009 Bishops Bridge Road, W2 8 0.5 Restaurant short term lettings pending development 4 Grosvenor Place, SW1 8 0.4 Part office floor 45-51 Whitfield Street, W12 10 0.4 Refurbishment in progress. Completion Q2 2009 Victory House, W1 11 0.4 Change of use under consideration Greencoat & Gordon House, SW1 4 0.2 Rolling refurbishment Other 114 169 2.6 5.0 Development1
Gresse Street/Rathbone Place 59 2.8 Completion autumn 2009 452 14.2

28
Portfolio summaryTenant profile
Por
tfolio
sta
tistic
s
Profile of tenants' business sectors
40
22
16
7 74
2 20
5
10
15
20
25
30
35
40
45
Professional& business
services
Media, TV,marketing &advertising
Retail sales,restaurants &
leisure
Financial Government& public
administration
Manufacturing,construction
& utilities
Computer &related
activities
Other
Co
ntr
ac
ted
re
nta
l in
co
me
%• Our occupier base covers a wide variety of business sectors
• Reflects the general composition of the West End
• Income collection in 2008 – averaged 97% within two weeks of the quarter day
• Tenant income profile • Ten principal tenants represent 35% of income • 23 tenants paying over £1m – 50% of income • 26 tenants paying £0.5m-£1m – 14% of income
1 Based upon the annualised contracted net rental income of £126.4m
Net Net income1 income Keyexpirydates % £m Arup 7.8 10.0 2023 (£4.5m), 2031 (£3.6m) Government 6.8 8.7 2011 (£2.3m), 2021 (£1.45m), 2022 (£1.72m) Burberry 4.1 5.2 2033 with break in 2023 (£5.2m) Saatchi & Saatchi 3.7 4.7 All 2013 BT 3.3 4.2 All 2010 Thomson Reuters 2.1 2.7 2016 with break in 2011 (£1.2m), 2022 with break in 2017 (£1.5m) Pinsent Masons 1.9 2.4 All 2015 MWB Business Exchange 1.7 2.2 2018 (£1.6m), 2026 (£0.6m) British Broadcasting Corporation 1.7 2.2 All 2059 Jupiter Investment 1.7 2.1 2024 with various breaks from 2009 (£1.4m) 34.8 44.4

29
• Lease expiries by income over the next five years
• No lease breaks exercised 33%
• All lease breaks exercised 48%
• Costly for tenants to relocate – currently paying undemanding rents
• 2009 - 2010 expiry profile
• 3% are rolling breaks, mainly our development properties – flexible leases
• 3% Angel expiry in March 2010 – £4.2m pa
Portfolio summaryLease expiries
Por
tfolio
sta
tistic
s
Profile of rental income expiry
3331
20
6
10
48
28
15
630%
10%
20%
30%
40%
50%
Up to 5 5-10 10-15 15-20 Over 20
Years to expiry
Co
ntr
acte
d r
en
tal in
co
me
No lease breaks exercised
Lease breaks exercised at first opportunity
Portfolioincome1
2009 2010 2011 2012 2013 Total % % % % % % Expiries 4 4 6 2 8 24 Angel expiry - 3 - - - 3 Single breaks 2 4 3 4 4 17 Rolling breaks 3 - - - - 3 Holding over 1 - - - - 1 10 11 9 6 12 48
1 Based upon the annualised contracted rental income of £126.4m at 31 December 2008

30
Portfolio summary2008 lease expiries and breaks
Por
tfolio
sta
tistic
s
Lease expiries
• 103 expiries in 2008 – £7m • Included 37 holding over • Represented 5.5% of rental income • 55% of income retained
• 35 vacated – 140,000 sq ft • 34% of space vacated was re-let (Wedge House 35,000 sq ft) • The balance represents 1.6% of rental income – £2m • Totfield House and 45-51 Whitfield Street, W1 – £0.9m
Lease breaks
• 96 possible tenant breaks during 2008 – £6.0m • Represented 4.7% of rental income • 88% of income retained
• 16 tenants exercised their break (£0.7m pa) – 40,000 sq ft • 48% of space vacated was re-let at £0.4m pa
Combined 2008 • Exposure at 10% of rental income • 70% retained, 11% re-let, 19% vacant (102,000 sq ft)
Active management is a key part of the business
Expiry analysis
55%
15%
30%
Renewed / in negotiation Vacated and re-let
Vacated and un-let
Break analysis
88%
6% 6%
Break not exercised Break exercised and re-let
Break exercised and vacant

• Our low office rents should offer defensive qualities
• 63% of our office rents are between £20 – £40 psf
• West End average office rents
• Passing £28 psf • Estimated rental value £36 psf
• City Borders average office rents
• Passing rent £24 psf • Estimated rental value £26 psf
Portfolio summaryPortfolio office rents
Por
tfolio
sta
tistic
s
Average office rents
0
5
10
15
20
25
30
35
40
nodnoL lartneC y BorderstiCdnE tseW
Ren
t (£
psf)
Average rent Estimated Rental Value
3131
Rentbanding West City End Borders Total % % % £0 - £20 psf 7 6 13 £20 - £30 psf 15 7 22 £30 - £40 psf 26 15 41 £40 - £50 psf 15 1 16 £50 - £60 psf 4 - 4 £60+ psf 4 - 4 71 29 100
Portfolio summaryOffice ERV movements
Por
tfolio
sta
tistic
s
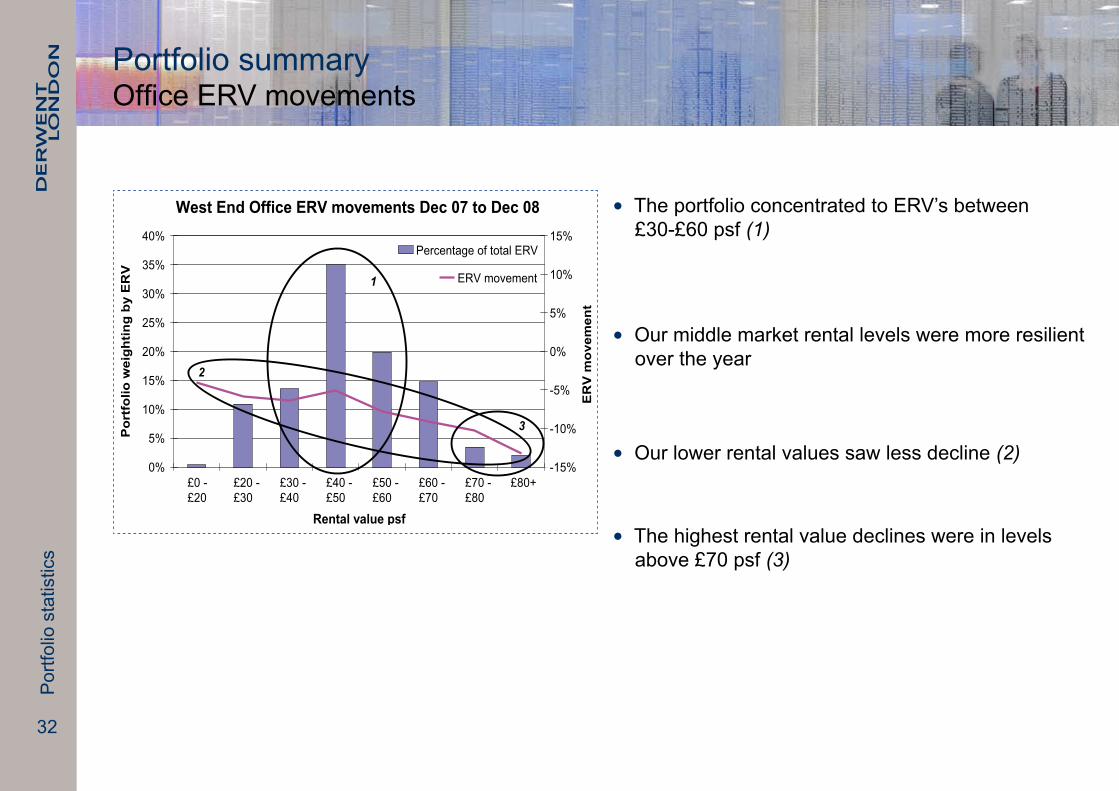
• The portfolio concentrated to ERV’s between £30-£60 psf (1)
• Our middle market rental levels were more resilient over the year
• Our lower rental values saw less decline (2)
• The highest rental value declines were in levels above £70 psf (3)
West End Office ERV movements Dec 07 to Dec 08
0%
5%
10%
15%
20%
25%
30%
35%
40%
£0 - £20
£20 - £30
£30 - £40
£40 - £50
£50 - £60
£60 - £70
£70 - £80
£80+
Rental value psf
Por
tfol
io w
eigh
ting
by E
RV
-15%
-10%
-5%
0%
5%
10%
15%
ER
V m
ovem
ent
Percentage of total ERV
ERV movement1
3
2
32

Por
tfolio
man
agem
ent
33
Portfolio management

34
Lettings and activityKey points
Por
tfolio
man
agem
ent
• Our market – mid range rents of £37-£55 psf
• £16.3m pa of lettings in 2008 totalling 488,000 sq ft (82 transactions) – Appendix 6
• 29% of the letting activity was in the last quarter of 2008 – 141,000 sq ft
• £9.3m of the £16.3m pa was new income – space that was not income producing at the start of 2008
• Lettings were 6.6% below the valuer’s estimated rental values at December 2007 • +2.3% if short term development lettings are excluded - Wedge House
An active year in a difficult letting market

35
Lettings and activity Asset management initiatives
Por
tfolio
man
agem
ent
• 139,500 sq ft pre-let to Cancer Research UK• £5.6m pa (£41 psf)• 20 year lease with a break at year 15• Rent free 24 months• Completion 2010
Angel Building, EC1
• 19,500 sq ft pre-let to Momentum Activating Demand• £0.73m pa (£40 psf)• 15 year lease, with tenant break at year 10• Rent free 15 months
151 Rosebery Avenue, EC1
A focus on attractive design across the portfolio
• 26,100 sq ft let - £1.3m pa • Includes 15,900 sq ft pre-let to The Benefit Express £0.86m pa (£57.50 psf)• New rental level achieved
Greencoat & Gordon House, SW1
• 44,400 sq ft let - £2.32m pa• Offices: HOK £1.3m pa (£56psf) Tribal £0.71m pa (£58 psf) Retail: Space NK, Tossed• Leases 10-15 years
Qube, W1

Lettings and activity Asset management initiatives
Por
tfolio
man
agem
ent
• 10,000 sq ft, 25 room boutique hotel, pre-let to Soho House• £0.28m pa, 12 months rent free• 23 year lease
Tea Building, E1
• 32,700 sq ft - £0.68m pa • Includes new lettings to Living Design, Oakley and BD Networks• 5 year leases
Tea Building, E1
Interesting contemporary spaces created
• 4th floor penthouse - 3,200 sq ft • Pre-let at £0.29m pa (£85 psf)• 5 months rent free
100 George Street, W1
• 20,400 sq ft - £0.41m - £20 psf• Includes short term lettings to Photobox and DA Cheltenham• Retained flexibility for future development aspirations
North Wharf Road, W2
36

Acq
uisi
tions
and
dis
posa
ls
37
Acquisitions and disposals

38
Acquisitions and disposalsKey points
Acq
uisi
tions
and
dis
posa
ls
• 2008 disposals – net proceeds £72.6m • Income £3.2m pa – disposal yield 4.4% • Profit £1.2m – included £1.6m of surplus from the sale of residential lease extensions • 29 properties sold – Bournemouth and Southampton retail, Portobello Dock residential
• 2008 acquisitions – £31.9m, after costs • Strategic acquisitions – adjacent to existing holdings • 53-65 Whitfield Street, W1 – adjacent to Saatchi Building, Fitzrovia • Land at Back Church Lane, E1 – consolidates Commercial Road holdings • Vauxhall Bridge Road, SW1 – residential potential, planning swap • 9-10 Rathbone Place, W1 – adjacent to Gresse Street development • Income £1.5m pa • Net initial yield 4.7%
• Post year end, 157-165 Charing Cross Road and 17 Oxford Street have been subject to compulsory purchase by Crossrail • Interim payment of £14.4m received – final payment subject to formal valuation • Income £1.0m pa • An opportunity for us to be involved in a major project
• Potential sales 2009 of £75-£100m
Non-core disposals and selective acquisitions

Pro
ject
s up
date
39
Projects update

40
Projects updateKey points
Pro
ject
s up
date
Pre-letting activity and scheme implementation flexibility
• Current projects – 57% pre-let • Angel Building, Arup III, Gresse Street • Creating exciting and vibrant spaces that represent good value • £99m of capex required to complete • Valuation movement of all development properties -30.5% • Outward yield movement and increased letting risks on the vacant space – 218,000 sq ft
• Planning consents totalled 866,000 sq ft – six future projects • 154% increase in floor area – 525,000 sq ft of additional space • Current income of £4.2m pa • 86% occupancy rate
• To continue selective appraisal studies – (Appendix 9) including • Charing Cross Road Crossrail application progressing

41
16-19 Gresse Street, W1
Pro
ject
s up
date
Projects updateCurrent projects
1 Post 31 December 20082 Comprising latest book value, capex to complete, fees and notional interest
Angel Building, St John Street, EC1Arup III, Fitzroy Street, W1
Property Estcapital Est Est Est Anticipated Floor expenditure Total Headline rental Est end surplus completion area tocomplete1 cost2 ERV value yield value tocome date 000’ssqft £m £m £psf £mpa % £m £m
Developments 1. Gresse Street/Rathbone Place, W1 59 10.3 32.2 50 2.7 6.50 39.1 6.9 Q3 2009 2. Arup III, W1 - 100% pre-let 85 14.0 48.7 42 3.6 6.25 54.5 5.8 Q4 2009 3. Angel Building, EC1 - 53% pre-let 263 75.0 135.0 40 10.4 6.75 151.9 16.9 Q3 2010
407 99.3 215.9 16.7 245.5 29.6

42
• Pre-2008 • 162,500 sq ft building • Let at £4.2m pa to BT until March 2010
Projects updateAngel Building, St John Street, EC1
A transformation taking place
• Today • 263,000 sq ft refurbishment • Demolition works completed • Building taken back to frame • Main works to the expanded building envelope and atrium underway • 139,500 sq ft pre-let to Cancer Research UK
• Summer 2010 • Project delivery
Pro
ject
s up
date

43
Projects updateAngel Building, St John Street, EC1
A close attention to detail to create a new landmark building
• Exciting new identity with triple span entrance
• Spectacular atrium
• Flexible floor plates (10,000 - 50,000 sq ft)
• New ground floor life • Cafe/retail, lounges, public artPro
ject
s up
date

44
Projects update16-19 Gresse Street, W1
Creating a location in the West End
• 47,000 sq ft of offices – completion autumn 2009
• A courtyard environment
• Exciting new facade • Aluminium with fritted and opaque glass panels
• 5th and 6th floor roof terracesPro
ject
s up
date

• Existing buildings – 107,000 sq ft mix of offices and retail producing £3.4m pa ( )
• February 2009 – The Astoria and 17 Oxford Street compulsory purchased – 45,000 sq ft – income £1m pa (A)
• Interim proceeds of £14.4m - subject to valuation
• 135-155 Charing Cross Road ultimately to be part of the site (B)
• Other Derwent London holdings to benefit: Holden House, Oxford Street (C) 16-19 Gresse Street (D)
Appraisal studiesCharing Cross Road, WC2
Pro
ject
s up
date
An important regeneration strategy45
A
B
A
Oxford Street
Tottenham Court Road
Centre Point
Soho Square Charing Cross Road
C
D

46
Appraisal studiesCharing Cross Road, WC2
Pro
ject
s up
date
• A major Crossrail transport interchange proposed at the corner of Oxford Street and Charing Cross Road
• Revitalising the eastern end of Oxford Street
• Derwent London masterplanning the above ground commercial space
• Current studies include • 200,000 sq ft offices • 40,000 sq ft retail • 40,000 sq ft multi-purpose performance venue
• Creating new public realm to reveal Soho Square and St Patrick’s Church
• A pre-emption option to acquire the site upon completion of Crossrail – circa 2016
A unique opportunity to be involved in this major West End project

47
Project pipeline Planning consents
Pro
ject
s up
date
Chancery Lane, WC2The Turnmill, EC1Leonard Street, EC2 Wedge House, SE1
North Wharf Road, W2 City Road Estate, EC1
Property Current rental Existing Consented income pa floor area floor area Uplift Comments £m 000’ssqft 000’ssqft %
1. Leonard Street, EC21 n/a n/a 55 n/a Offices/residential site 2. Wedge House, SE11 0.3 39 81 108 Re-let 5 year term with breaks 3. The Turnmill, EC11 0.3 45 65 44 Improving planning consent 4. 40 Chancery Lane, WC21,2 1.1 71 98 38 Lease breaks between 2010 and 2012 5. North Wharf Road, W22 1.7 84 316 276 Lease breaks from 2010 6. City Road Estate, EC11 0.8 102 251 147 Residential/offices
4.2 341 866 154
• Images of proposed schemes
1Freehold 2Leasehold

48
Pro
ject
s up
date
Project pipeline Summary
• To complete and let current projects
• New projects on hold - a number of exciting opportunities for when the market recovers • North Wharf Road, Paddington • Chancery Lane, Holborn
• Maximise income and flexibility • Traditionally a core part of our business
• To continue selective appraisal studies • Charing Cross Road, Soho 2016 • Charlotte Street, Fitzrovia 2013 • Hampstead Road, Euston 2012
A focus on completing current projects

Sum
mar
y
49
Summary

50
• A difficult year for the property sector but relative success was achieved • Property outperformance • Our brand of space continues to attract tenants • Low passing rents – defensive qualities • Managing voids actively – low vacancy rate of 3.8% • Experienced asset management team
• For the immediate future, a concentration on • Cash flow generation and cost management • Minimising voids – close tenant liaison • Balance sheet management • Conservative financing and stringent risk management • Selective disposals
• Prepared to re-enter the market when clear opportunities identified for value creation
Sum
mar
ySummary

App
endi
ces
51
Appendices

52
App
endi
ces
1. Debt facilities
2. Finance detail
3. Capital expenditure
4. Portfolio summary
5. Portfolio statistics by village
6. Principal lettings 2008
7. Annualised contracted rental income
8. Projects completed in 2008
• Arup II, W1
• Horseferry House, SW1
• Portobello Dock, W10
9. Appraisal studies
10. Building cost trends
11. Management structure - executive team
Appendices

App
endi
ces
53
Nominal Maturity £m £m6.5% secured bond 175.0 March 2026Floating rate guaranteed unsecured loan note 3.2 February 2012Committed bank facilities Term1 28.0 June 2018 Term/revolving credit2 125.0 [March] 2014 Revolving credit 100.0 November 2013 Revolving credit 100.0 April 2013 Term/revolving credit 375.0 March 2013 Term unsecured 29.2 June 2012 Revolving credit 200.0 December 2011 957.2Overdraft 10.0 On demand 1,145.4
1 subject to credit review in 20132 credit approved; documentation to be completed
All facilities are secured unless noted otherwise
Appendix 1Debt facilities

App
endi
ces
54
Increase in gross property income 2008
12.3
3.9
-5.2
3.4
4.1
-4.2
-7.0
-10 -5 0 5 10 15
Lettings
Rent reviews
Voids
Acquisitions
LMS acquisition
Disposals
Surrender premium
Group property income (£ million)
Appendix 2Financial detail
Administrative expenses 2008
Legal and professional £2.5m
(2007: £2.3m)
Establishment costs £0.9m
(2007: £0.9m)
Employment costs £11.4m
(2007: £11.7m)
Bank charges £1.7m
(2007: £1.9m)
Overheads£1.8m
(2007: £2.7m)
Total£18.3m
Property expenditure 2008
Void costs£6.9m
(2007: £4.6m)Transaction costs£5.7m
(2007: £3.6m)
Other£2.0m
(2007: £1.7m)
Lighter colours in each of the three sections show increase on previous year
Total£14.6m

App
endi
ces
55
Appendix 3Capital expenditure
Summarybyproperty 2008 2009 2010 2011 actual budget budget &beyond1
budget £m £m £m £m
Angel Building 12.0 46.3 25.1 3.6
Arup III 3.9 14.0 - - 16-19 Gresse St & 7-8 Rathbone Place 7.8 10.1 0.2 - Tea Building 0.8 4.3 - - Arup II 12.4 2.7 - - Castle House, 75 Wells Street 0.4 1.5 0.2 - Qube 2.1 1.1 - - Portobello Dock 3.3 1.1 - - City Road Estate 1.5 0.8 1.0 - 9 & 10 Rathbone Place - 0.8 0.6 - The Turnmill 0.7 0.5 - - Gordon House 4.0 0.5 - - 1-5 Grosvenor Place 0.6 0.4 0.3 - Horseferry House 10.4 0.3 - - 151 Rosebery Avenue 3.5 0.3 - - 100 George Street 1.8 0.3 - - Suffolk House - 0.3 2.9 - 55-65 North Wharf Road 0.9 0.2 0.3 - Wedge House 1.1 0.2 - - Other 5.8 6.5 5.7 0.5
73.0 92.2 36.3 4.1
1 Does not include schemes that may commence in 2011 and beyond

App
endi
ces
56
Appendix 4 Portfolio summary
App
endi
ces
Net Vacant Rentreview contracted floor area and lease Total Estimated rentalincome Average rentalvalue reversions reversion rentalvalue Valuation perannum rentalincome perannum perannum perannum perannum £m £m £psf £m £m £m £m
WestEnd Central 1,429.6 79.2 28.14 10.0 17.5 27.5 106.7 Borders 117.8 8.0 15.00 1.7 6.4 8.1 16.1
1,547.4 87.2 26.07 11.7 23.9 35.6 122.8City Borders 425.5 30.6 24.25 1.5 3.6 5.1 35.7
CentralLondon 1,972.9 117.8 25.58 13.2 27.5 40.7 158.5
Provincial Scotland 94.4 5.3 15.84 1.0 0.1 1.1 6.4 Other 40.7 3.3 19.63 - (0.4) (0.4) 2.9
135.1 8.6 17.12 1.0 (0.3) 0.7 9.3
Investmentportfolio 2,108.0 126.4 24.75 14.2 27.2 41.4 167.8
WestEndCentral: Belgravia, Mayfair, Soho, Covent Garden, Victoria, Fitzrovia, Euston, Noho, Paddington, Baker Street, MaryleboneBorders: Camden, Islington, Ladbroke GroveCityBorders: Clerkenwell, Holborn, Shoreditch, Southbank, Old Street

App
endi
ces
57
Appendix 5 Portfolio statistics by village
Vacant Net Average Vacant Rentreview/ Total Estimated Floor floor contracted rental accommodation lease renewal reversion rental Valuation Weighting area area rentalincome income rentalvalue reversion2 value £m % sqft000’s sqft000’s £mpa £psf £mpa £mpa £mpa £mpa
WestEnd:Central Fitzrovia/Euston 522.5 25 1,339 97 28.4 22.91 4.2 6.9 11.1 39.5 Victoria 235.7 11 484 4 14.8 30.79 0.2 3.3 3.5 18.3 Soho/Covent Garden 213.8 10 423 1 11.4 27.95 - 2.8 2.8 14.2 Noho 138.7 7 276 75 7.2 36.93 3.5 0.5 4.0 11.2 Belgravia 118.7 6 167 21 6.6 46.04 1.2 1.1 2.3 8.9 Marylebone/Baker Street 116.8 5 246 8 7.1 29.78 0.4 2.0 2.4 9.5 Mayfair 44.7 2 42 - 2.0 48.52 - 0.9 0.9 2.9 Paddington 38.7 2 86 9 1.7 23.72 0.5 - 0.5 2.2
WestEnd:Borders
Islington/Camden 97.7 5 535 39 7.2 14.53 0.6 6.4 7.0 14.2 Other1 20.1 1 85 50 0.8 21.50 1.1 - 1.1 1.9
WestEnd 1,547.4 74 3,683 304 87.2 26.07 11.7 23.9 35.6 122.8
City:Borders Clerkenwell 127.7 6 385 32 9.3 26.72 0.7 1.2 1.9 11.2 Old Street 126.2 6 389 33 8.9 25.02 0.4 (0.1) 0.3 9.2 Holborn 100.7 5 266 3 7.8 29.65 0.1 1.1 1.2 9.0 Shoreditch 63.6 3 272 16 4.3 16.60 0.3 1.4 1.7 6.0 Southbank 7.0 - 39 - 0.3 8.51 - - - 0.3 Other 0.3 - 2 2 - - - - - -
CityBorders 425.5 20 1,353 86 30.6 24.25 1.5 3.6 5.1 35.7
CentralLondon 1,972.9 94 5,036 390 117.8 25.58 13.2 27.5 40.7 158.5Provincial Scotland 94.4 4 395 62 5.3 15.84 1.0 0.1 1.1 6.4 Other 40.7 2 170 - 3.3 19.63 - (0.4) (0.4) 2.9
Provincial 135.1 6 565 62 8.6 17.12 1.0 (0.3) 0.7 9.3
Investmentportfolio 2,108.0 100 5,601 452 126.4 24.75 14.2 27.2 41.4 167.8
1 Principally Portobello Dock2 Includes reversion on Angel Building (£6.3m) and Arup III (£2.4m)

App
endi
ces
58
Appendix 6Principal lettings 2008
Approximate Rental Headline netarea perannum rental Timing Comment sqft £m £psf 2008
Angel Building, EC1 139,500 5.60 41 Q3 Pre-let to Cancer Research UK
Qube, W1 44,400 2.32 56/58 Q3-Q4 Office floors to HOK and Tribal; retail units to Space NK and Tossed Greencoat & Gordon House, SW1 26,100 1.32 57 Q3-Q4 British Wind Energy Association, Sucre Export and The Benefit Express
Tea Building, E1 42,700 0.96 25 Q1-Q4 Eleven lettings including a pre-let to Soho House to provide a 25 bedroom boutique hotel
151 Rosebery Avenue, EC1 19,500 0.73 40 Q3 Momentum Activating Demand
163-170 Tottenham Court Road, W1 22,300 0.70 31 Q1 Short-term letting to Arup
Oliver’s Yard, EC2 19,500 0.62 32 Q3 Expansion space for existing tenant; Morningstar UK
Davidson Building, WC2 6,400 0.43 67 Q3 Expansion space for existing tenant; LECG
North Wharf Road, W2 20,400 0.41 20 Q2-Q4 Various short-term lettings
1-3 Grosvenor Place, SW1 7,700 0.36 47 Q4 Richmond Park Capital
City Road Estate, EC1 34,300 0.34 10 Q1-Q4 Various short-term lettings
100 George Street, W1 3,200 0.29 85 Q2 New penthouse floor let to Argent Construction
Wedge House, SE1 34,800 0.29 8 Q4 Short-term letting to Kids Company
Strathkelvin, Scotland 15,000 0.22 15 Q4 Retail letting to M&S Simply Foods
4-5 Grosvenor Place, SW1 3,200 0.18 54 Q3 Triple Point Management
19-26 Floral Street, WC2 2,900 0.13 n/a Q2 Residential
6-7 St Cross Street, EC1 2,400 0.10 40 Q2 Boyce Recruitment
Other 43,700 1.30 - Q1-Q4 Various lettings
488,000 16.30

App
endi
ces
59
Appendix 7Annualised contracted rental income
Reconciliation of contracted income Dec 07 to Dec 08
+1.5+10.6
117.6
-3.3
126.4
100
105
110
115
120
125
130
135
Annualisedcontracted
income at 31December 2007
Portfoliomanagement
Acquisitions Disposals Annualisedcontracted
income at 31December 2008
Co
ntr
acte
d in
co
me £
m
Annualised contracted rental income at 31 December 2008
• Includes • Annualised rents under committed leases
• Pre-lets – eg Soho House Hotel at £0.3m pa. However, excludes Cancer Research UK pre-let (£5.6m pa) at Angel Building as there is an existing lease to BT on the building and this income (£4.2m pa) is recognised
• Rent frees – eg Burberry at Horseferry House, rent free expiry 2009
• Excludes • Any future contracted stepped rent changes – eg Arup III rent rises from £1.2m pa to £3.6m pa upon building completion
• Future rent review increases where there is a contracted minimum level

App
endi
ces
60
Appendix 8Projects completed in 2008 - Arup II, W1
Impressive offices around a central atrium
112
• Completed April 2008
• 57,000 sq ft offices
• Pre-let to Arup – 25 years, no breaks
• Rent £2.4m pa (£42 psf)
• Occupancy rate 100%

App
endi
ces
61
Appendix 8Projects completed in 2008 - Horseferry House, SW1
A new home for an iconic British clothing brand
112
• Completed May 2008
• 163,000 sq ft offices
• Pre-let to Burberry - 25 year lease, break at 15
• Rent £5.3m pa (£38 psf)
• Occupancy rate 100%

62
Appendix 8 Projects completed in 2008 - Portobello Dock, W10
An attractive waterside campus location
112
• Completed May 2008
• 69,000 sq ft mixed use scheme
• New and refurbished offices
• Residential units - sold
• Occupancy rate 8.0%
App
endi
ces

63
Appendix 9Appraisal studies
Cha
rlotte
Stre
et A major redevelopment opportunity on our Fitzrovia Estate, which is part of a masterplan to revitalise this West End location. Occupied by Saatchi & Saatchi on leases that expire in 2013.
Recent extension of our ownership in Back Church Lane has opened up the opportunity for a sizeable development near Aldgate East, City Borders.
Tenants: Government and Thames Reach Housing. Leases expire in 2012.
A prime riverside location overlooking the Thames in Victoria. Potential to substantially increase the site density through redevelopment.
Tenant: Government lease expires in 2011.
App
endi
ces
Ham
pste
ad R
oad
Com
mer
cial
Roa
d G
rosv
enor
Pla
ceR
iver
wal
k H
ouse
Property
Adjacent to Euston Station. There is potential to improve the current consent, that was in place at acquisition.
Tenants: British Home Stores, NHS and BP. Leases expire in 2011 and 2012.
Various options under consideration for this landmark Belgravia location. The studies are in conjunction with our freeholder, the Grosvenor Estate.
Cha
ring
Cro
ss R
d Crossrail Bill received Royal Assent in July 2008, which is a major step forward in unlocking this important West End holding. The location is to become a strategic Crossrail transport interchange. We are masterplanning the commercial element.
Current Existing Potential Appraisal income area area studies/planning Comment £mpa 000’ssqft 000’ssqft evaluation
4.7 200 300
2.0 230 300
3.4 107 280
6.5 166 270
2.3 75 200
0.5 30 120
19.4 808 1,470

Building inflationary trends
200
300
400
500
600
700
800
900
19
88
19
90
19
92
19
94
19
96
19
98
20
00
20
02
20
04
20
06
20
08
20
10
Ind
ex (
1976
= 1
00)
Tender Price Index Retail Price Index Building Cost Index
2
1
Source: Davis Langdon, HM Treasury
App
endi
ces
• Prices rose by 2% in first half and fell 10% in the second half of 2008 (1)
• Davis Langdon Tender Price forecast • 2009 -5% to -8% • 2010 -4% to -6% • 2011 0% to +2% • 2012 +4% to +6%
• Prices are expected to fall by 20% peak to trough with the trough likely to reach 2004 levels
• The early 1990s recession saw 13 quarters of falling prices (2)
64
Appendix 10Building cost trends

App
endi
ces
65
• John Burns Chief Executive
• Simon Silver Head of Development
• Chris Odom Finance Director
• Nigel George Director
• Paul Williams Director
• David Silverman Director
• Tim Kite Company Secretary
• Nick Groves Senior Investment Manager
• Russell Durling Group Surveyor
• Gary Preston Financial Controller
• Celine Thompson Head of Leasing
• Simon Taylor Head of Asset Management
Appendix 11Management structure - executive team

66
This presentation includes statements that are forward-looking in nature. Forward-looking statements involve known and unknown risks, uncertainties and other factors which may cause the actual results, performance or achievements of Derwent London plc to be materially different from any future results, performance or achievements expressed or implied by such forward-looking statements.
Any information contained in this presentation on the price at which shares or other securities in Derwent London plc have been bought or sold in the past, or in the yield on such shares or other securities, should not be relied upon as a guide to future performance.
DisclaimerD
iscl
aim
er