Derivatives and collateral at U.S. life insurers;/media/publications/economic... · Federal Reserve...
17
21 Federal Reserve Bank of Chicago Derivatives and collateral at U.S. life insurers Kyal Berends and Thomas B. King Introduction and summary Insurance companies serve the important economic role of helping businesses and households to insulate themselves against risks. But these risks do not disap- pear from the economy—they remain on insurers’ books, necessitating careful risk management among insurers themselves. Over the past two decades, one way that insurers have managed risk is through the use of derivative contracts, 1 which derive their value from the performance of an underlying entity. This underlying entity can be an asset, index, or interest rate. Some of the more common derivatives include forwards, futures, options, and swaps. Most deriva- tives, including interest rate swaps (IRS), have histor- ically been traded over the counter (OTC) rather than on centralized exchanges. The use of derivatives comes with its own set of costs related to the transaction, management, and collat- eralization of positions. With the implementation of the Dodd–Frank Act of 2010, those costs seem certain to rise. Among other provisions, the law requires the cen- tral clearing of certain types of OTC derivatives and mandates that those transactions must satisfy margin re- quirements that will in most cases require counterparties to post more collateral than was previously the case. 2 Forthcoming rules will impose additional collateral re- quirements on derivatives positions for which the cen- tral clearing mandate does not apply. Thus, the new rules for both cleared and noncleared derivatives could generate new costs for insurers or require changes in their business practices. In this article, we review life insurers’ use of OTC derivatives and discuss the possible implications of these new rules for their financial condition. 3 Although insurers represent a relatively small part of the deriva- tives markets, they are an interesting case study, in part because they report very detailed information about their derivatives positions and associated collateral in quarterly regulatory filings. We exploit these data to study how derivatives are used by insurers and to get a quantitative sense of what the new regulations are likely to imply for their business models. The new regime poses several potential costs for insurers. For example, like many market participants, insurers will face a short-term fixed cost of adjusting operations and corporate structure to meet the new clearing and collateralization requirements, as well as ongoing expenses associated with trading, collateral optimization, and back-office functions; and insurers may also face some regulatory capital consequences. Kyal Berends is a former senior associate economist and Thomas King is a senior financial economist in the Economic Research Department at the Federal Reserve Bank of Chicago. The authors thank Anna Paulson, Rich Rosen, and other members of the Chicago Insurance Initiative for helpful feedback. © 2015 Federal Reserve Bank of Chicago Economic Perspectives is published by the Economic Research Department of the Federal Reserve Bank of Chicago. The views expressed are the authors’ and do not necessarily reflect the views of the Federal Reserve Bank of Chicago or the Federal Reserve System. Charles L. Evans, President; Daniel G. Sullivan, Executive Vice President and Director of Research; David Marshall, Senior Vice President and Associate Director of Research; Spencer Krane, Senior Vice President and Senior Research Advisor; Daniel Aaronson, Vice President, microeconomic policy research; Jonas D. M. Fisher, Vice President, macroeconomic policy research; Anna L. Paulson, Vice President, finance team; William A. Testa, Vice President, regional programs; Lisa Barrow, Senior Economist and Economics Editor; Helen Koshy and Han Y. Choi, Editors; Julia Baker, Production Editor; Sheila A. Mangler, Editorial Assistant. Economic Perspectives articles may be reproduced in whole or in part, provided the articles are not reproduced or distributed for commercial gain and provided the source is appropriately credited. Prior written permission must be obtained for any other reproduc- tion, distribution, republication, or creation of derivative works of Economic Perspectives articles. To request permission, please contact Helen Koshy, senior editor, at 312-322-5830 or email [email protected]. ISSN 0164-0682
-
Upload
nguyenhanh -
Category
Documents
-
view
215 -
download
0
Transcript of Derivatives and collateral at U.S. life insurers;/media/publications/economic... · Federal Reserve...
21Federal Reserve Bank of Chicago
Derivatives and collateral at U.S. life insurers
Kyal Berends and Thomas B. King
Introduction and summary
Insurance companies serve the important economic role of helping businesses and households to insulate themselves against risks. But these risks do not disap-pear from the economy—they remain on insurers’ books, necessitating careful risk management among insurers themselves. Over the past two decades, one way that insurers have managed risk is through the use of derivative contracts,1 which derive their value from the performance of an underlying entity. This underlying entity can be an asset, index, or interest rate. Some of the more common derivatives include forwards, futures, options, and swaps. Most deriva-tives, including interest rate swaps (IRS), have histor-ically been traded over the counter (OTC) rather than on centralized exchanges.
The use of derivatives comes with its own set of costs related to the transaction, management, and collat-eralization of positions. With the implementation of the Dodd–Frank Act of 2010, those costs seem certain to rise. Among other provisions, the law requires the cen-tral clearing of certain types of OTC derivatives and mandates that those transactions must satisfy margin re-quirements that will in most cases require counterparties to post more collateral than was previously the case.2 Forthcoming rules will impose additional collateral re-quirements on derivatives positions for which the cen-tral clearing mandate does not apply. Thus, the new rules for both cleared and noncleared derivatives could generate new costs for insurers or require changes in their business practices.
In this article, we review life insurers’ use of OTC derivatives and discuss the possible implications of these new rules for their financial condition.3 Although insurers represent a relatively small part of the deriva-tives markets, they are an interesting case study, in part because they report very detailed information about their derivatives positions and associated collateral in
quarterly regulatory filings. We exploit these data to study how derivatives are used by insurers and to get a quantitative sense of what the new regulations are likely to imply for their business models.
The new regime poses several potential costs for insurers. For example, like many market participants, insurers will face a short-term fixed cost of adjusting operations and corporate structure to meet the new clearing and collateralization requirements, as well as ongoing expenses associated with trading, collateral optimization, and back-office functions; and insurers may also face some regulatory capital consequences.
Kyal Berends is a former senior associate economist and Thomas King is a senior financial economist in the Economic Research Department at the Federal Reserve Bank of Chicago. The authors thank Anna Paulson, Rich Rosen, and other members of the Chicago Insurance Initiative for helpful feedback. © 2015 Federal Reserve Bank of Chicago Economic Perspectives is published by the Economic Research Department of the Federal Reserve Bank of Chicago. The views expressed are the authors’ and do not necessarily reflect the views of the Federal Reserve Bank of Chicago or the Federal Reserve System.Charles L. Evans, President; Daniel G. Sullivan, Executive Vice President and Director of Research; David Marshall, Senior Vice President and Associate Director of Research; Spencer Krane, Senior Vice President and Senior Research Advisor; Daniel Aaronson, Vice President, microeconomic policy research; Jonas D. M. Fisher, Vice President, macroeconomic policy research; Anna L. Paulson, Vice President, finance team; William A. Testa, Vice President, regional programs; Lisa Barrow, Senior Economist and Economics Editor; Helen Koshy and Han Y. Choi, Editors; Julia Baker, Production Editor; Sheila A. Mangler, Editorial Assistant.Economic Perspectives articles may be reproduced in whole or in part, provided the articles are not reproduced or distributed for commercial gain and provided the source is appropriately credited. Prior written permission must be obtained for any other reproduc-tion, distribution, republication, or creation of derivative works of Economic Perspectives articles. To request permission, please contact Helen Koshy, senior editor, at 312-322-5830 or email [email protected].
ISSN 0164-0682
22 1Q/2015, Economic Perspectives
In this article, however, we focus on one particular set of costs that has received attention, namely, costs related to reallocating insurers’ portfolios to high-quality—and therefore low-yielding—assets in order to meet margin requirements.4 We find that, overall, the requirements are unlikely to generate large costs for the industry as a whole through this channel— although there are some low-probability tail scenarios in which they could result in substantial forgone invest-ment income for a few larger insurers. This finding is largely due to the fact that insurance companies already hold large amounts of high-quality unencumbered securities that could be pledged for this purpose, and indeed they may be natural collateral providers to other market participants.5
After reviewing insurers’ use of derivatives and collateral in the following section, we develop a Monte Carlo exercise to attempt to quantify the amount of margin posted and revenue lost due to required margin under different scenarios for interest rates and insurer portfolio evolution. Then, we consider some ways that insurers may adjust their business practices in light of the new regulations. Two likely responses are to reduce the need for hedging by shifting more interest rate risk onto consumers or markets and to build up new sources
TABLE 1
Notional OTC Statutory derivatives assets
( - - - - dollars in billions - - - - )MetLife Inc. 188 603 Manulife Financial Corp. 151 267 Massachusetts Mutual Life Insurance Co. 137 202 New York Life Insurance Group 104 261 Nationwide Mutual Group 72 132 Voya Financial Inc. 71 193 Ameriprise Financial Inc. 65 110 AEGON 57 202 Lincoln National Corp. 52 222 Prudential Financial Inc. 44 545 Jackson National Life Group 29 186 Principal Financial Group Inc. 24 149 Allianz Group 21 116 Genworth Financial Inc. 19 70 AXA 16 166 Hartford Financial Services 12 179 American International Group 11 269 Aflac Inc. 7 111 Delaware Life Partners LLC 6 42 Sun Life Financial Inc. 5 19
Life insurers with the largest OTC derivatives portfolios
Notes: OTC indicates over the counter. Includes interest rate swaps, caps, floors, collars, and swaptions; credit default swaps; total return swaps; and inflation-linked products. Data as of 2014:Q3.Source: Statutory filings via SNL Financial.
of liquidity to cover cash needs. Depending on how these adjustments play out, they could expose insurers and their counterparties to new risks, especially in a crisis environment in which liquidity is constrained.
Life insurers’ use of OTC derivatives
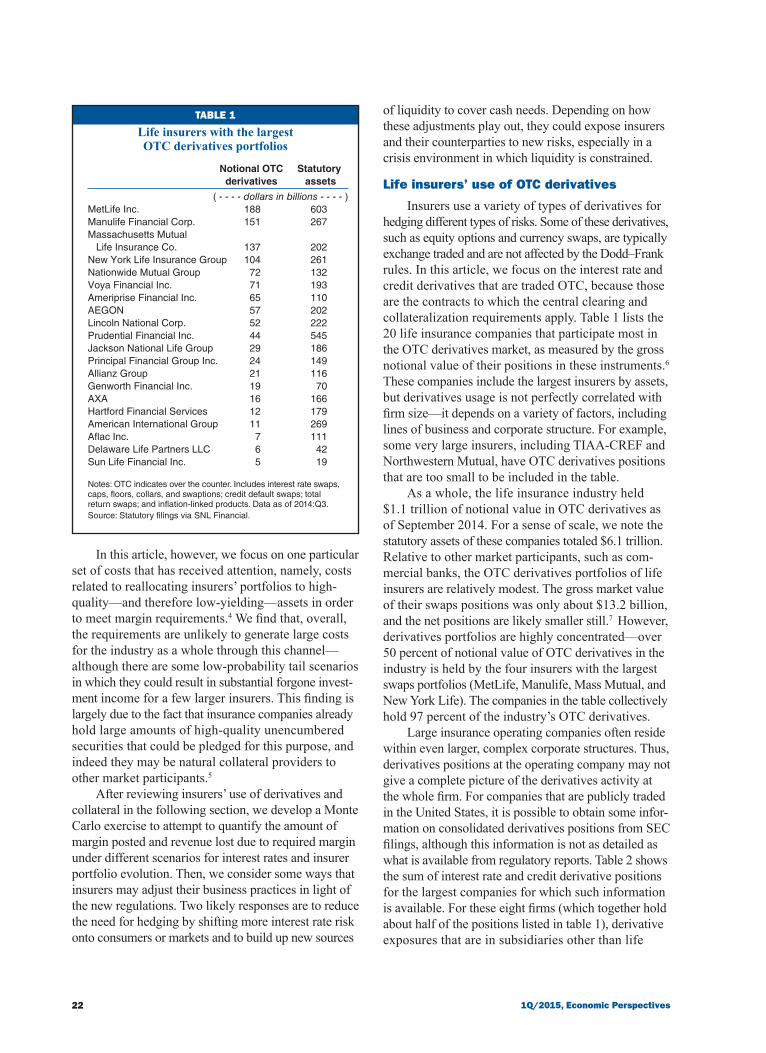
Insurers use a variety of types of derivatives for hedging different types of risks. Some of these derivatives, such as equity options and currency swaps, are typically exchange traded and are not affected by the Dodd–Frank rules. In this article, we focus on the interest rate and credit derivatives that are traded OTC, because those are the contracts to which the central clearing and collateralization requirements apply. Table 1 lists the 20 life insurance companies that participate most in the OTC derivatives market, as measured by the gross notional value of their positions in these instruments.6 These companies include the largest insurers by assets, but derivatives usage is not perfectly correlated with firm size—it depends on a variety of factors, including lines of business and corporate structure. For example, some very large insurers, including TIAA-CREF and Northwestern Mutual, have OTC derivatives positions that are too small to be included in the table.
As a whole, the life insurance industry held $1.1 trillion of notional value in OTC derivatives as of September 2014. For a sense of scale, we note the statutory assets of these companies totaled $6.1 trillion. Relative to other market participants, such as com-mercial banks, the OTC derivatives portfolios of life insurers are relatively modest. The gross market value of their swaps positions was only about $13.2 billion, and the net positions are likely smaller still.7 However, derivatives portfolios are highly concentrated—over 50 percent of notional value of OTC derivatives in the industry is held by the four insurers with the largest swaps portfolios (MetLife, Manulife, Mass Mutual, and New York Life). The companies in the table collectively hold 97 percent of the industry’s OTC derivatives.
Large insurance operating companies often reside within even larger, complex corporate structures. Thus, derivatives positions at the operating company may not give a complete picture of the derivatives activity at the whole firm. For companies that are publicly traded in the United States, it is possible to obtain some infor-mation on consolidated derivatives positions from SEC filings, although this information is not as detailed as what is available from regulatory reports. Table 2 shows the sum of interest rate and credit derivative positions for the largest companies for which such information is available. For these eight firms (which together hold about half of the positions listed in table 1), derivative exposures that are in subsidiaries other than life

23Federal Reserve Bank of Chicago
TABLE 2
Operating company Consolidated
( - - - - - - - - - dollars in millions - - - - - - - - - )Prudential 50,179 316,283MetLife 189,881 267,155Manulife 169,550 209,486AIG 17,685 90,446Voya 69,773 73,614Lincoln 60,009 56,864Hartford 11,645 30,715Principal 24,063 25,426
Selected operating company versus consolidated derivatives positions
Notes: Data as of 2014:Q3. Includes all interest rate and credit derivatives. Operating company amounts may not match those in table 1 due to imperfect overlap between these categories and OTC derivatives.Sources: Statutory filings and 10K reports via SNL Financial.
insurance operating companies constitute 55 percent of the holding companies’ notional positions.
As shown in table 3, insurers’ interest rate swaps positions at the industry level are roughly equally balanced between paying and receiving fixed rates.8 This pattern also holds at the individual insurer level: A typical firm both receives and pays fixed rates. How-ever, as we discuss later, the simultaneous positions in opposite directions reflect the hedging of different types of risk and, consequently, typically differ by maturity. Insurers also hold fairly large positions—about $327 billion in notional value—in other types of interest rate derivatives, especially caps and call swaptions, which hedge against rising rates. They also hold small amounts of total return and credit default swaps, which are used for asset replication purposes as well as hedging, and a smattering of miscellaneous products.
To understand the potential impact of the new collateral rules on the insurance industry, it is useful to review how these derivative positions function within insurers’ business models. Insurers take very few directional positions using derivatives, relying on them almost entirely for hedging purposes. In particular, they hedge four broad types of risk.9 First, they hedge the interest rate risk of their fixed-income portfolios. As of September 2014, the insurers in table 1 collec-tively held nearly $1 trillion in various types of bonds, exposing them to rising interest rates.10 They use pay-fixed interest rate swaps and other interest rate deriva-tives to hedge against this risk. Statutory data on hedging purpose (not shown) indicate that about half of OTC derivatives positions serve this function.
Second, insurers hedge the risks of deposit-like liabilities, including funding agreements and guaran-teed interest contracts (GICs). These may pay fixed
or floating rates and span a spectrum of maturities, although they are typically much shorter than insur-ers’ other liabilities. These contracts may also have option-like features that require more complex hedg-ing strategies. Some of these strategies may involve relatively exotic derivatives for which central clear-ing is not available.
Third, insurers attempt to match the duration of their long-term insurance and annuity liabilities. For the simplest contracts, hedging these exposures in-volves receiving interest payments to match the pay-ments that the firm is required to make. But, for most insurance and annuity products, cash flows are uncer-tain. Thus, unlike the security-specific hedging on the asset side, liability hedging can only be done imper-fectly in an economic sense, since there is significant uncertainty about the timing and duration of future insurance claims. As shown in table 3, insurers are, on net, receivers of fixed payments in swaps, imply-ing that on balance they are using swaps to add dura-tion to their portfolios. This makes sense as many life insurance liabilities are very long duration—indeed, in some cases longer than can be achieved by buying fixed-income products in the cash market.
Finally, insurers hedge the optionality of their lia-bilities. This optionality can take a variety of implicit and explicit forms. For example, it is common for in-surance companies to offer minimum-return guarantees on variable annuities, which they in turn hedge with a combination of OTC and exchange-traded derivatives. Furthermore, most annuities may be surrendered at the option of the beneficiary. Fixed-rate annuities are more likely to be surrendered when interest rates rise, precisely when they are most attractive from the issu-er’s point of view. Most of the caps, floors, and swap-tions reported in the table are also used to hedge these types of risk, and interest rate swaps may be used as part of the strategy. Many of the nonoperating-company positions shown in table 2 are likely held by captive reinsurers, which also principally use them for this type of hedging.
It is important to recognize that derivatives port-folios reflect a mix of risk mitigation, accounting, and regulatory considerations. In particular, under FAS 133, insurers can receive hedge accounting treatment for derivatives positions that are deemed “effective hedges,” and a similar treatment applies in statutory accounting. For example, insurers discount the value of future claims on insurance policies using an assumed matu-rity structure and discount rate, and they can receive hedge accounting treatment by entering into (usually long-dated) swaps that match these terms. Although long-term bonds might be able to match the duration

24 1Q/2015, Economic Perspectives
TABLE 3
Maturity (% of notional)
Notional amount Fair < 1 1–3 3–7 7–15 >15 (millions of dollars) value year years years years years
Interest rate swaps 705,229 11,121 6 15 19 27 33 Receive-fixed 346,373 19,411 3 12 17 29 39 Pay-fixed 296,358 –9,570 9 20 22 23 25 Type not reported 62,498 1,279 7 10 16 35 32Other rate products 326,961 1,696 27 30 27 12 3 Floors and puts 87,675 796 53 30 3 13 1 Caps and calls 184,603 716 16 33 39 11 1 Other 54,683 184 26 20 26 12 15Credit default swaps 25,896 209 17 21 56 3 3 Bought protection 3,638 –33 33 27 31 2 7 Sold protection 16,871 183 19 19 55 4 2 Type not reported 5,386 59 0 24 73 2 0Miscellaneous 32,957 –28 73 4 3 7 13
Notes: Includes data as of 2014:Q3 from the 20 life insurance operating companies with the largest OTC derivatives portfolios, as measured by notional value. Other rate products include interest rate collars and swaptions classified as “other.” Miscellaneous includes total return swaps and inflation swaps.Source: Statutory filings via SNL Financial.
Characteristics of insurer OTC derivatives portfolios
of those same positions reasonably well and thus hedge them in an economic sense, such a strategy would not qualify for hedge accounting treatment. Insurers may have incentives to engage in offsetting swaps contracts to hedge both sides of the balance sheet to recognize accounting benefits.
One should also bear in mind that insurers’ deriv-atives use takes place against a backdrop of regulatory controls. Some states require insurers to maintain a strict “derivatives use plan” that must meet with the approval of supervisors, and they also set limits on the quantity of derivatives activity. For example, New York prohibits swaps holdings with potential exposure in excess of 3 percent of admitted assets. (“Potential ex-posure” is a regulatory measure of the total amount of risk posed by an insurer’s derivatives book.) Insurers must therefore choose carefully which risks to hedge and how best to use their limited derivatives capacity.
Margin requirements and Dodd–Frank
Because participants in derivatives contracts have risk exposures to their counterparties, they are typically required to post some form of collateral to each other. The Dodd–Frank Act standardizes these requirements for OTC derivatives transactions. Collateral require-ments associated with derivatives trades are of two types. Variation margin captures the marked-to-market change in the value of positions on a daily or, in excep-tionally volatile periods, intraday basis. This is meant to ensure that in the event of a default by one counter-party, the other counterparty can recover the fair value
of the position. Initial margin is intended to cover possible losses incurred by the remaining counterparty after default, as it goes about liquidating or replacing the defaulted position. Thus, initial margin is typically calculated by assuming a certain amount of time for liquidation and using the data to estimate a worst-case scenario for the price moves of the position.
Even prior to the Dodd–Frank rules, it was stan-dard for OTC derivatives counterparties to post some form of variation margin, and the exchange of initial margin was also common.11 However, derivatives counterparties typically had a fair amount of leeway in how these requirements were satisfied. For exam-ple, they may have been able to post a variety of col-lateral types as margin or, depending on their bilateral agreements, post margin only when the change in the fair value of the position exceeded some threshold. Figure 1, panel A, shows margin posted by insurance companies in support of derivatives since 2013:Q1, when these data were first collected.12 Figure 1, panel B, shows the collateral breakdown as of 2014:Q3. Note that, although variation margin constitutes the bulk of insurers’ collateral positions, very little of this collateral consists of cash. This reflects the fact that most derivatives on insurers’ books, if they require collateral at all, allow variation margin to be posted in the form of a range of securities.
Since June 10, 2013, new plain vanilla IRS and CDS index positions covered under Dodd–Frank have had to be cleared by a central counterparty (CCP) and collateralized accordingly. In particular, CCPs must

25Federal Reserve Bank of Chicago
FIGURE 1
Fair value of collateral pledged by life insurance companies
Other6%
Treasury43%
Corporate16%
Agency andagency MBS
22%
Cash13%
A. Collateral posted over time
B. Securities posted as margin
Notes: Data for 20 largest OTC derivatives users. Panel B as of September 2013. MBS indicates mortgage-backed securities.Source: Statutory filings via SNL Financial.
16,000
14,000
12,000
10,000
8,000
6,000
4,000
2,000
Mar 2013 Jun ’13 Sep ’13 Dec ’13 Mar ’14 Jun ’14 Sep ’14
Not specified Variation margin Initial margin
millions of dollars

26 1Q/2015, Economic Perspectives
require counterparties to post initial margin sufficient to cover a hypothetical five-day liquidation period with at least a 99 percent level of confidence and variation margin to cover daily fluctuations in the market value of positions. Forthcoming rules on un-cleared trades are likely to impose a similar require-ment for variation margin and a more stringent ten-day liquidation period for initial margin.
As shown in figure 1, margin posted by insur-ance companies to cover derivatives positions has in-deed risen notably since the first quarter of 2013. In the 18 months surrounding the implementation date, insurers increased the collateral posted with deriva-tives counterparties by 45 percent, from $7.2 billion to $10.4 billion. Although both initial margin and variation margin have increased significantly, varia-tion margin has fluctuated more. This is because vari-ation margin is heavily influenced by external factors, such as interest rates. This volatility is suggestive of one type of risk that insurers now face—large move-ments in interest rates can require the transfer of large quantities of securities and, especially, cash into mar-gin accounts. The following section discusses the scope of this risk in greater detail.
The types of collateral that can be posted to cover margin for cleared contracts, and the haircuts that apply, vary across CCPs. Initial margin is most often satisfied by high-quality securities, such as U.S. Treasury securities, although at least one major CCP has begun accepting investment-grade corporate bonds (within certain limits and subject to steep haircuts). In contrast, variation margin must be covered by cash. Moreover, the time frame within which clearing members must post variation margin after receiving a margin call is typically very short, often a matter of hours. (For uncleared trades, proposed rules would require most insurance companies—as “low-risk end-users”—only to update variation margin once per week and when the values involved rise above some de minimus amount.)
The burden of initial margin requirements is reduced to a degree by the possibility of netting po-tential moves in negatively correlated positions against each other. For example, if an insurer engages in a receive-fixed swap and a pay-fixed swap on similar terms with the same counterparty, that counterparty should expect price movements in the two contracts to offset exactly. Consequently, the margin needed to cover the position as a whole should be minimal, even though the margin needed to cover each swap indi-vidually might not be. For cleared trades, the extent to which such gains are available depends on the CCP’s rules and models. For uncleared trades, the potential
for margin offsets depends on the extent and terms of master netting agreements. In both cases, it also depends on the degree to which positions are concentrated at particular counterparties, since it is generally not possible to recognize portfolio-margining benefits from offsetting positions at different counterparties.13
The potential costs of the new collateral and clearing requirements span a variety of operational and economic considerations and are discussed more fully in a later section. It is clear, however, that the incidence of these costs—and, therefore, the nature of the industry’s response—will depend greatly on the quantity of collateral that insurers end up having to post. We turn to this question next.
Collateral needs under alternative scenarios
In this section, we attempt to quantify the amount of collateral that may be necessary for life insurers to provide in support of cleared swaps positions in coming years. The results are essentially the product of three inputs: 1) a distribution for the possible path of interest rates; 2) calculations of how the value of each deriva-tive contract type responds to the various interest rate configurations; and 3) an assumption regarding how insurers’ derivative positions will evolve over time. Given institutional shifts in the industry and limited historical data, the last item is the most difficult of the three to ascertain. Therefore, we consider two different scenarios for the changes in the industry’s derivatives mix that likely bracket the possibilities.
We summarize the methodology briefly here and describe it in detail in the appendix.
Model setupFor each of the 20 firms with the largest OTC
derivatives holdings, as measured by notional value, we break down the interest rate swaps portfolio based on derivative type (pay- versus receive-fixed), maturity, and time since the contract was originated. We take the granularity of maturity buckets and contract ages to be annual, and we assume that the maximum maturity is 30 years.14 For each type, we approximate each firm’s notional holdings using a beta distribution over maturities, based on the 2014:Q3 data that were summarized at an aggregate level in table 1 (p. 22). Our assumptions about how this distribution evolves generate flows of derivatives originations and termi-nations in each year in our simulations for each firm in each type/maturity bin. Knowing the flows allows us to back out the distribution of contract ages for each swap bin. Since swaps valuation depends on the contract’s remaining maturity and the fixed rate that applies to it, we can track the distribution of

27Federal Reserve Bank of Chicago
TABLE 4
Remaining maturity (years)Fixed rate (%) 1 3 7 15 30
2 – 0.2 – 0.9 –2.0 –3.2 –3.9 4 – 0.2 – 0.9 –2.2 –3.6 –5.1 6 – 0.2 – 0.9 –2.2 – 4.1 –5.9 8 – 0.2 – 0.9 –2.5 – 4.8 –7.6 10 – 0.2 – 0.9 –2.5 – 4.9 –8.7
Five-day, 1 percentile fair-value changes for interest rate swaps of various terms
Notes: Considers rate changes from the average 2014:Q4 level of interest rates. Distribution of rate changes is based on daily data, April 1, 2004–September 30, 2014.Source: Authors’ calculations based on interest rate data provided by the Board of Governors of the Federal Reserve System.
swap rates within each bin, given a path of historical interest rates.
We assume that all swaps held by insurers are “plain vanilla” interest rate swaps (meaning standard contracts that exchange fixed and floating payments based on commonly used benchmarks and schedules). This assumption allows us to calculate the net present values of these contracts analytically, given an inter-est rate path. Furthermore, this assumption implies that the collateral requirements associated with cen-tral clearing apply to all of those contracts that are originated going forward.15 We do not consider con-tracts originated prior to 2013:Q2 because, although many such contracts do involve margin agreements between the counterparties, the Dodd–Frank rules only require insurance companies to clear and post margin on plain vanilla swaps originated after June 2013.
Dodd–Frank mandates initial margin sufficient to cover a five-day liquidation period on cleared trades. To give a sense of the magnitudes involved, we calcu-late the range of initial margin values that could apply to swaps of various maturities and rates. Specifically, we calculate the distribution of five-day changes in value by drawing random five-day yield curve changes from the last ten years of data, and we apply these changes to rates that start at their 2014:Q1 level. Table 4 shows the resulting 99.7 percent quantiles, corresponding roughly to the levels of confidence used by CCPs.16 In the absence of netting, the total initial margin required on a particular portfolio in the current interest rate environment would simply be given by the margin rates listed in the table, weighted by the amount of the portfolio in each corresponding bin. However, when calculating initial margin, CCPs and other counterparties generally allow for possible neg-ative correlations between value changes for different derivatives positions in the same portfolio. This implies that one needs to evaluate the distribution of outcomes
at the portfolio level. Our simulations of initial margin do this for each firm, at each date, for each simulated path of interest rates, based on our projections for how the distribution of swaps to which Dodd–Frank applies evolves over time.
Calculating variation margin, given a path of interest rates, is somewhat easier, since variation margin is simply equal to the net fair value of the swaps positions. Thus, for each firm, at each date, for each simulated path of rates, we calculate the net present value of swaps of each age in each type/maturity bin. Total variation margin is the sum of these values across swaps originated after 2013:Q2, weighted by the respective portfolio shares.
Interest rate simulationsWe begin our computations in 2013:Q2. For the
calculations through 2014:Q3, we use actual data on the yield curve to price the swaps portfolios. For pro-jections beyond that date, we estimate a vector autore-gression on Treasury forward rates, the Moody’s Baa corporate bond yield, gross domestic product (GDP), and PCE inflation (based on the Personal Consumption Expenditures Price Index). We then take 10,000 draws from the estimated residual distribution and simulate forward ten years beginning with 2014 data. Any time a simulation results in a nonpositive rate in any quarter, we discard it and draw again. Figure 2 shows the distribution of simulated rate paths.
Portfolio scenariosThe amount of margin that will need to be posted
against derivatives positions will depend crucially on how insurers adjust their derivatives portfolios going forward. The most natural assumption about this be-havior may be simply that they keep the distribution across contract types and maturities unchanged at its current level, and this is indeed the first scenario that we consider. However, market participants generally anticipate that the net duration of the portfolio will lengthen going forward. This is also the situation in which margin is potentially greatest in the rising-interest-rate environment that we consider, and so it is worth modeling from a stress-testing point of view. Our second scenario is a variant of this outcome, in which insurers take new long positions by passively rolling over their maturing derivatives.
Specifically, in our “constant maturity distribu-tion” scenario, we assume that the distribution of the stock of derivatives (that is, the percentage of the total in each type/maturity bin) is static. This means that the flows—that is, the amount of contracts originated or extinguished in each quarter—must generally be nonzero. We assume that the gross flows (the amount of notional value originated and canceled) are the

28 1Q/2015, Economic Perspectives
minimum possible to achieve the net flow that keeps the stock distribution unchanged. In our “duration extension” scenario, we assume that insurers do not terminate any swaps going forward, but all contracts (either long or short) that mature are rolled into new 30-year receive-fixed swaps. Given the initial maturity distribution of swaps, this implies that by the end of the projection period, about 40 percent of the pay-fixed and 60 percent of the receive-fixed portfolio have rolled into new long swaps positions that are subject to Dodd–Frank.
Importantly, both scenarios assume that the overall size of insurers’ derivatives portfolios stays constant. This assumption is simply for ease of com-parison to current balance-sheet values. If, as seems nearly certain, the notional value of swaps positions continues to increase over time, the dollar values of posted margin—and the corresponding costs—will be proportionally higher.
Estimated marginFor each firm, we calculate the margin that would
be required in each year under each scenario, given the distribution of interest rate paths shown in figure 2. As shown in figure 3, initial margin is forecast to rise steadily over the projection period in both scenarios. The smoothness and relative precision of the projected paths of initial margin reflect the fact that initial mar-gin is largely driven by portfolio turnover, which is (by assumption) independent of the interest rate envi-ronment. However, the size of the increase depends crucially on the extent of the portfolio lengthening. In the constant-maturity case, it climbs about $2 billion between 2013:Q2 and 2014:Q3, reflecting portfolio changes that we have already observed, but then stays approximately constant for the remainder of the projection period. This outcome reflects the strong negative correlation between changes in receive- and pay-fixed values, which insulates the value of the overall
FIGURE 2
Distribution of simulated interest rate paths
Notes: The figures show selected interest rate forecasts from the VAR model, with the zero lower bound imposed, based on 10,000 Monte Carlo draws. Solid black lines are means; shaded regions are 10–90% and 1–99% confidence bounds.Sources: Board of Governors of the Federal Reserve System and authors’ calculations.
1985 ’90 ’95 2000 ’05 ’10 ’15 ’20 ’250
2
4
6
8
10
A. Instantaneous
1985 ’90 ’95 2000 ’05 ’10 ’15 ’20 ’250
2
4
6
8
10
12
B. Ten-year
1985 ’90 ’95 2000 ’05 ’10 ’15 ’20 ’250
2
4
6
8
10
12
C. 30-year
1985 ’90 ’95 2000 ’05 ’10 ’15 ’20 ’250
2
4
6
8
10
12
D. Corporate Baa

29Federal Reserve Bank of Chicago
portfolio from interest rate shocks. In the duration-extension case, in which this offset gradually disap-pears, the required amount of initial margin climbs to about $8 billion by 2024.17
Under the constant-maturity scenario, the mean level of variation margin peaks at a level of about $4 billion after eight years, as shown in figure 4. Under the duration-extension scenario, this amount is consider-ably larger, at about $18 billion. Furthermore, the amount is very sensitive to the path of interest rates, with the 90 percent confidence interval in the duration-extension scenarios spanning a range of nearly $100 billion. Thus, the amount of variation margin that will be required from the industry in coming years is quite uncertain.
Potential costs of margin requirements
Initial marginTable 5 reports sample firms’ securities holdings
that could, in principle, be used to meet initial margin requirements. In practice, two reasons that these total amounts of securities may not be able to be used for margin are that they are already pledged for some other purpose or that the CCP imposes a limit on how much may be used. As shown in column 2, encumbered assets generally represent a small portion of insurers’ overall securities portfolios. To address the question of collateral limits imposed by CCPs, we apply the margining rules for cleared swaps adopted by the CME (Chicago Mercantile Exchange).18 In particular, we assume that for margining purposes, each type of
security is discounted by the amount shown in col-umn 3, reflecting a typical haircut applied to that asset class by the CME. Furthermore, we apply the CME’s rule that the sum of agency debt and agency mortgage-backed securities (MBS) used as collateral cannot exceed 40 percent of total collateral for any given customer and that corporate and foreign sovereign bonds cannot exceed the lesser of 40 percent of total collateral or $5 billion. The portfolio limits at the CME apply at the level of the futures commissions merchant (FCM), not the client, so an insurer effectively competes with the other clients of an FCM when trying to post corporate bonds. However, large insurers also have accounts at multiple FCMs; thus, it is not clear whether the effective limits on insurers should be considered to be greater or less than the limits imposed by the CCP. The table therefore considers both a case in which the CME rules are passed through one-for-one to insurers and a more conservative calculation in which insurers are not able to post any securities at all other than cash and Treasury securities. The results of these calculations, reflecting the approximate amount available for initial margin, are shown in columns 5 and 6, with the actual amount of margin (both initial and variation) currently posted shown for comparison in the final column. As the available securities exceed those being used by a factor of 6, even under the conservative assumptions, there is clearly a significant amount of spare capacity at present.
Furthermore, the amount of securities available to pledge is large compared with the amount of collateral
FIGURE 3
Required initial margin under alternative portfolio scenarios
Notes: The figure shows the range of initial margin posted by the top 20 OTC derivatives users under the static-portfolio (blue) and duration-extension (red) scenarios. Solid lines represent means; shaded regions are 10–90% confidence bounds, based on the distribution of forecasted interest rates depicted in figure 2.Source: Authors’ calculations.
$billions
2014 ’16 ’18 ’20 ’22 ’240
2
4
6
8
10
FIGURE 4
Required variation margin under alternative portfolio scenarios
Notes: The figure shows the range of variation margin posted by the top 20 OTC derivatives users under the static-portfolio (blue) and duration-extension (red) scenarios. Solid lines represent means; shaded regions are 10–90% confidence bounds, based on the distribution of forecasted interest rates depicted in figure 2.Source: Authors’ calculations.
$billions
2014 ’16 ’18 ’20 ’22 ’24−40
−20
0
20
40
60
80

30 1Q/2015, Economic Perspectives
that was projected to be needed for initial margin in the previous section. Thus, it appears unlikely that collateral availability for initial margin will be a bind-ing constraint for most insurers in the foreseeable future.19 This is in contrast to the situation for many other types of derivatives market participants, which may have large OTC derivatives positions but do not necessarily hold large volumes of high-quality securi-ties, giving rise to increased demand for collateral-transformation services.20
Although insurers have little incentive to engage in collateral transformation (apart, perhaps, from increased repo activity, as discussed later), the requirement to post initial margin will still involve some ongoing costs. CCPs typically charge fees of 10 to 25 basis points to service collateral (in addition to the other fees associated with central clearing). This is on top of any collateral admin-istration fees charged by the insurer’s clearing member.
Variation marginThe potentially costly scenario for insurers with
respect to variation margin is one in which long-term interest rates rise significantly and spreads between the yields on their assets and overnight rates widen, even if these moves were to occur over a relatively long period. This is because such a scenario could in-volve having to sell bonds to meet variation margin on long-dated receive-fixed swaps; and the return on that margin would be low relative to that on bonds, representing an opportunity cost for the firm. Accord-ingly, we assume that variation margin on cleared swaps is posted in cash that is raised by selling corporate bonds and that it pays the effective federal funds rate.21
Thus, the cost of variation margin is driven by the spread between the corporate bond rate and the fed funds rate in each of our Monte Carlo scenarios.22 Figure 5 shows the corresponding distribution of losses (more precisely, forgone revenue), relative to what would obtain if there were no margin requirements.
For the constant-maturity scenario, the amount of projected variation margin was relatively small, and consequently the forgone revenue associated with variation margin is also small—$180 million per year by the end of the projection period in the mean case. While this amount is not trivial, it would not represent insurmountable costs for the industry. For example, profits at the firms in our sample were $24 billion in 2013,23 so that even for extreme interest rate paths, margin-related costs would amount to less than 1 per-cent of earnings. In large part, this modest outcome has to do with the factors noted in the previous section that keep margin small when the distribution of swaps stays fixed.
Again, the scenario in which insurers extend the duration of their portfolios results in much larger me-dian outcomes and a much wider range of possibili-ties. The mean cost of posting variation margin rises to about $760 million per year; and, for adverse inter-est rate outcomes (a steeply rising yield curve and a widening of the spread between corporate yields and the PAI), the cost could be over $2.5 billion per year.
Other costsIn addition to the opportunity cost of variation margin,
there are other costs for insurers to consider. In particu-lar, organizational and operational details may introduce
TABLE 5
Potential collateralized positions
Cash and Margin Fair value of Less: = Available Assumed CME-like Treasury currently securities encumbered collateral haircuts (%) limitsa securities pledged
Cash and equivalents 16 0 16 2.5 15 15 1Treasury securities 84 33 50 4.5 48 48 5Agencies 25 4 22 6.0 20 b – 0Agency MBS 85 22 63 11.0 56 b – 2Foreign government 63 28 35 8.5 32 c – 0Public corporates 700 117 583 20.0 61 c – 2Total 972 204 768 232 63 10
a Uses portfolio limits for each insurer on each asset class based on those currently imposed on clearing members by the CME.b Sum of agency debt and agency mortgage-backed securities (MBS) must be less than 40 percent of total portfolio.c Sum of foreign government and corporate bonds must be less than 40 percent of total portfolio and $5 billion per insurer under CME-like limits.
Notes: Amounts in billions of dollars. Data as of 2014:Q3.
Sources: Statutory filings via SNL Financial and authors’ calculations.
Estimated collateral available for initial margin at top 20 swaps users

31Federal Reserve Bank of Chicago
complications, especially in the short run. For exam-ple, it may be that the subsidiaries of an insurance company that currently hold its swaps positions are not the same subsidiaries that hold its high-quality collateral. Insurers could respond by consolidating or rearranging the corporate structure or by transferring exposures and assets across entities.
Though relatively minor, there are also capital issues involved with collateral management. For ex-ample, collateral pledged for derivatives positions continues to be counted as an asset of the pledging insurance company, but it receives an additional risk-based capital charge, reflecting the risk that it may not be available to pay policyholder claims in the event of default.
The cost of derivatives trading may also increase. CCPs charge maintenance and transaction fees for swap clearing, although these are on the order of fractions of basis points. Perhaps more significantly, clearing members face significant new costs associated with account administration, default fund contributions to CCPs, and clearing. It is likely that they will pass on most of these costs to clients in the form of increased fees. The costs of trading uncleared derivatives are likely to increase by even more as liquidity deterio-rates for such products.
Furthermore, in order to ensure that they can meet variation margin on an ongoing basis, insurers will have to maintain buffers of cash, highly liquid securities, or access to liquidity from other providers
beyond the amount of margin that is required of them at each point in time. Using a similar calculation as we did earlier, we note that insurers would require an increment of about $2 billion in our constant-maturity scenario and $8 billion in our duration-extension scenario to keep cash on hand to satisfy, say, 99 percent of five-day movements in swaps positions—assuming that margin could be friction-lessly netted across all contracts and accounts. This compares with their current cash balances of about $16 billion.
Implications for the industry
Although we find it unlikely that the direct costs of posting margin will be unbearable for the life in-surance industry, these costs could nonetheless amount to billions of dollars per year, and the bulk of this amount would fall disproportionately on a handful of larger firms. These firms thus have incentives to try to minimize their margin burden.
One obvious way to reduce collateral needs is simply to reduce derivatives positions. Since most in-surer derivative use reflects hedging, rather than spec-ulative activity, this could result in greater exposure to risk. However, much of insurers’ derivatives-based hedging activity reflects accounting and regulatory considerations, not necessarily economic ones. For example, some of insurers’ receive-fixed swaps are matched to specific bonds held on their balance sheets or otherwise qualify as highly effective hedges under GAAP. (This explains why they maintain large portfo-lios of both pay- and receive-fixed swaps.) Reducing hedging of this purely accounting sort would not necessarily increase overall risk. Indeed, the extent to which insurers are able to leave economic risks un-hedged will be mitigated by regulatory pressure. It could mean an increase in GAAP earnings volatility or in regulatory capital requirements, but insurers would have to weigh those costs against the costs of holding margin.
On balance, however, insurers may move toward hedging strategies that require less collateral—partic-ularly those that involve only cleared derivatives. As shown in table 3 (p. 24), insurers maintain sizable portfolios of caps, floors, and other derivatives that are not, for the moment, subject to central clearing. As noted earlier, many of these positions are intended to hedge the optionality embedded in various annuity and insurance products. If the cost of trading in these products rises significantly—or if liquidity deteriorates—insurers may find it advantageous to try to hedge some of these risks using swaps or exchange-traded products, which could introduce basis risk.
FIGURE 5
Forgone revenue from required margin under alternative scenarios
Notes: The figure shows the range of the opportunity cost of holding cash variation margin for the top 20 OTC derivatives users under the static-portfolio (blue) and duration-extension (red) scenarios. Solid lines represent means; shaded regions are 10–90% confidence bounds, based on the distribution of forecasted interest rates depicted in figure 2.Source: Authors’ calculations.
$billions
2014 ’16 ’18 ’20 ’22 ’240.0
0.5
1.0
1.5
2.0
2.5
3.0

32 1Q/2015, Economic Perspectives
Another way for insurers to reduce the need for derivatives activity—or to cover the potentially higher costs of that activity—would be to shift some risk that is currently hedged using derivatives to other parties. For example, some companies may find it attractive to offer insurance or annuity products that offload some interest rate risk onto consumers. Indeed, insurance companies report that, as a result of the new rules, they are beginning to shift their mix of products by offering relatively less attractive pricing on products that provide long-term guaranteed payments and more aggressively marketing products with customer participation fea-tures, such as certain whole life policies. If insurers find it too expensive to hedge certain types of insur-ance products and pull back from offering them, sig-nificantly raise their prices, or modify them to pass through risks to customers, this could reduce the eco-nomic function they serve in providing risk-sharing services to the economy. The rules could also hasten the exit of insurance companies from variable annuities—which have proven expensive in the low-rate environ-ment—as the costs of hedging guarantees on these products will increase. Many companies have already attempted to reduce their exposures to these products either by ceding them to captive reinsurers or by sell-ing them outright.
Insurers will also increasingly need to maintain access to ready sources of liquidity to cover variation margin. Without such a liquidity buffer, insurers might have to make relatively large and rapid adjustments to variation margin during episodes of market volatil-ity, perhaps contributing to fire-sale dynamics. One likely source of this liquidity is advances from Federal Home Loan Banks (FHLBs). Insurers maintain sizable portfolios of mortgage-related assets that qualify them for FHLB membership (Paulson et al., 2014). And, indeed, many insurers have begun to tap FHLBs for funds in recent years. Insurers may also turn to the broker-dealer sector to offer term repos against their securities portfolios or other collateral-transformation services. However, since term repos are not available to match the duration of long-dated swaps contracts, this strategy would be subject to rollover risk. Partic-ularly for riskier collateral, insurers could find their liquidity sources evaporating during a crisis, perhaps at the same time that variation margin is rising due to volatile market conditions. Insurers could also look to sources of cash from elsewhere in their own corporate structures. Securities lending operations, for example, could potentially be scaled up to provide a source of cash for variation margin. Alternatively, firms may look for new ways to hold liquid assets without occupying balance-sheet space.24
With respect to the impact on capital, insurers may have an incentive to move derivatives activity outside of the insurance operating company, where they will not be subject to regulatory capital require-ments. One way this could be done is through captive reinsurance. However, as noted earlier, captive rein-surers themselves may not maintain reserves of cash or high-quality securities adequate to meet margin requirements. Thus, insurers face conflicting incentives for corporate structure when it comes to swaps margin. On the one hand, they may wish to move derivatives transactions to nonoperating subsidiaries that face less-binding capital constraints. On the other hand, these subsidiaries themselves will be forced to hold high-quality collateral, reducing their profitability.
To the extent that insurers need to shift their assets into cash or liquid securities, they may look to offset the effect on returns by taking additional risks else-where. This activity could be similar to behavior that has been observed as insurers have faced weak in-vestment returns in the persistently low-interest rate environment (Becker and Ivashina, 2013). While, in principle, larger cash positions and larger risky-asset positions may leave the aggregate risk of their assets unchanged, such a shift may well result in reduced liquidity for the industry, since the higher-quality assets would now be tied up as collateral.
Conclusion
Like other market participants, insurers that rely on OTC derivatives face challenges from the new Dodd–Frank regulations requiring the central clearing and collateralization of most of those positions. We have used Monte Carlo simulations to study the amount and type of collateral that insurers may have to hold against their interest rate swaps portfolios over the next decade. While we find that the industry-wide costs of collateralizing positions are likely to be modest, there are some low-probability tail scenarios in which they could be substantial for some large insurers, primarily because collateral must be posted in the form of low-yielding cash assets. We have discussed a variety of ways in which the industry might respond to these and the other costs associated with clearing and collater-alizing derivatives positions.

33Federal Reserve Bank of Chicago
1Other risk-management techniques employed by insurance com-panies include insuring a large and diversified portfolio of risks (which reduces uncertainty), writing insurance on lines of business that act as natural hedges (for example, the mortality risk insurers face from life insurance contracts can partially offset the longevity risk associated with annuities), and sharing risk with other compa-nies through reinsurance.
2The portion of the Dodd–Frank Act applying to most large life insurance companies took effect in June 2013. Title VII of Dodd–Frank mandates central clearing of certain types of swaps contracts, and in May 2013 the Commodity Futures Trading Commission (CFTC) finalized its rule indicating the specific classes of swaps for which central clearing will be required. These include all “plain vanilla” interest rate swaps, basis swaps, forward-rate agreements, and overnight index swaps (OIS) written in major currencies against the standard short-term interest rate benchmarks (the London inter-bank offered rate or LIBOR, the Euro interbank offered rate or EURIBOR, and, in the case of OIS, the fed funds rate). Credit default swaps are also covered under title VII, and the CFTC rule applies to CDS indexes on corporate debt. The Securities and Exchange Commission (SEC), which has yet to publish final rules, is responsible for single-name CDS contracts. The U.S. Department of the Treasury has determined that physically settled foreign exchange (FX) swaps are not subject to the Dodd–Frank central clearing requirements.
3Among insurance companies, the impact of the rules is only likely to be material for life insurers, not for property and casualty insurers, as the latter maintain substantially smaller OTC derivatives posi-tions, both relative to their assets and in absolute terms. Unless otherwise stated, the terms “insurers” and “insurance companies” refer to life insurance companies in this article.
4See, for example, Festa (2013). Others have analyzed similar ques-tions for other types of market participants. For example, Heller and Vause (2012) examine the collateral that swaps clearing requires from broker-dealers.
5While market commentary suggests that forgone revenue from in-vestments likely represents one of the largest potential costs to the industry associated with Dodd–Frank OTC derivatives rules, our calculations do not include other possible costs associated with un-cleared derivatives or operational and organizational costs that may result from the new clearing regime.
6These data come from quarterly statutory filings and cover only insurance-operating subsidiaries.
7We also note that although notional value is a convenient way of summarizing the size of a derivatives position, it is not a good measure of the potential loss or gain associated with that position, which is typically an order of magnitude smaller. For this reason, the importance of derivatives may be better captured by their “fair value,” which reflects their economic worth based on current mar-ket conditions—see table 3 (p. 24).
8Interest rate swaps are an agreement between two parties in which one stream of future interest payments is exchanged for another, based on specific notional principal amounts. In a pay-fixed (or “receive-float”) interest rate swap, a company makes fixed payments and in return receives a floating payment linked to an interest rate. In a pay-float (or “receive-fixed”) interest rate swap, a company makes a floating payment linked to an interest rate and in return receives a fixed payment. In both cases, the fixed payment is agreed upon by both parties at the inception of the contract.
9Cummins, Phillips, and Smith (2001), Shiu (2007), and González, López, and Cunill (2011) investigate the factors that determine in-surance companies’ use of derivatives.
10See Berends et al. (2013) for a broader discussion of insurers’ sen-sitivity to interest rates.
11For example, in the Bank of New York Mellon Corporation and Insurance Risk’s Collateral Management Survey 2013, 7 percent of respondents (including a global sample of large insurers) indicated that they did not typically post variation margin, while 32 percent indicated that they did not post initial margin (available at https://www.bnymellon.com/_global-assets/pdf/solutions-index/collateral-management-survey-2013.pdf).
12Note that these data include collateral for both OTC and listed de-rivatives, but the amount associated with the latter is very small as insurers generally do not engage in much futures activity or write options.
13The move to central clearing could actually reduce netting oppor-tunities in some situations by forcing insurers to clear some trades that could previously have been netted against other trades that will remain uncleared (and thus with non-CCP counterparties).
14Experiments using quarterly data did not yield substantially different results.
15Most fixed-to-floating swap contracts on insurers’ books already satisfy the conditions for central clearing. Those that do not likely differ from clearing-eligible contracts in only relatively minor ways, such as the timing of interest payments or the day-count convention. As noted, we essentially assume away the other types of interest rate derivatives. Evaluating collateral that would have to be held against nonswap contracts would be a more challenging problem because of the diversity of such contracts and the complexity in-volved in computing their fair values. Most of these positions will not, at least initially, be centrally cleared. Margin requirements for uncleared derivatives have yet to be finalized but are certain to be more punitive than those for cleared positions. Given the harsher rules that will apply to these trades, insurers have an incentive to move away from such nonstandard contracts going forward, so that our assumption may not be much of an exaggeration. Furthermore, the framework developed by the Committee on Payment and Settlement Systems and the Technical Committee of the International Organization of Securities Commissions (CPSS-IOSCO, 2013) proposes exempting uncleared derivatives from initial margin re-quirements until 2019 for end-users with less than €3 trillion in notional value. Thus, initial margin on uncleared OTC contracts will likely not be collected from insurance companies until at least the middle of the projection period considered here. While most CDS contracts will be centrally cleared sooner and could in principle be incorporated into this analysis, those positions are a fairly small fraction of insurers’ overall portfolios and do not seem likely to significantly affect the results.
16Dodd–Frank mandates a 99 percent level of confidence, but the CME (Chicago Mercantile Exchange), for example, uses 99.7 percent. As we do here, CCPs typically assess the distributions of derivative gains and losses for the purposes of calculating initial margin using a five- or ten-year look-back period. Indeed, the results are roughly in line with industry estimates, which have suggested that the initial margin requirements will amount to anywhere from 1 percent to 10 percent of the notional value of a single (one-way) swap contract. See, for example, Heller and Vause (2012).
NOTES

34 1Q/2015, Economic Perspectives
17The calculations here assume that potential efficiencies from net-ting are completely exhausted—that is, that 100 percent of the fair-value gains in contracts is netted against the fair-value losses of contracts when determining potential portfolio losses for the pur-poses of calculating initial margin. In reality, these efficiencies may be smaller, either because contracts are cleared through multiple, separate accounts or because CCPs do not fully incorporate all net-ting possibilities into their initial margin calculations. The CME has recently begun offering cross-margining between futures and swaps positions, possibly allowing initial margin requirements to be reduced further for insurers with futures exposure.
18See http://www.cmegroup.com/clearing/financial-and-collateral-management/collateral-types-accepted-irs.html.
19This conclusion applies only to insurance operating companies. As noted earlier, several large insurance organizations have signifi-cant derivatives portfolios elsewhere in their corporate structure, and the legal entities that hold them do not necessarily maintain securities portfolios that would be adequate to cover initial margin under these assumptions.
20Indeed, the demand for high-quality collateral due to OTC deriv-atives requirements, bank regulatory requirements, and other sources could create potential opportunities for insurance companies them-selves to expand their collateral-transformation services.
21Cash collateral for OTC variation margin receives price align-ment interest (PAI) at a short-term interest rate in the correspond-ing currency. For dollar-denominated contracts, CME and LCH.Clearnet pay PAI at the federal funds rate.
22The federal funds rate is not a variable in our VAR, but it is nearly perfectly correlated with the instantaneous Treasury rate. In our simulations, we derive the fed funds rate path from the projections for this rate, as explained in the appendix.
23This amount reflects net income for domestic life insurance oper-ating companies only. Earnings at the consolidated parent level are higher. For the ten firms in our sample that are publicly traded in the United States (and thus have easily available consolidated financial statements computed under generally accepted accounting principles [GAAP]), net income was $19.7 billion (relative to $16.46 billion in net income at the operating company level for these same firms).
24For example, although not explicitly tied to the Dodd–Frank rules, Prudential created an off-balance-sheet entity (a special-purpose vehicle or SPV) in November 2013 to hold Treasury securities. This structure enables the firm to source Treasury securities as “contingent liquidity” in exchange for notes issued to the SPV. The Treasury securities could be sold quickly to meet variation margin. See Prudential Financial Inc. Annual Report, 2013 (p. 91).

35Federal Reserve Bank of Chicago
APPENDIX: TECHNICAL DETAIL ON THE MONTE CARLO EXERCISE
We assume that all fixed-for-floating swaps are plain vanilla and that they are therefore subject to central clearing and initial margins reflecting a 99.7 percent confidence threshold for five-day losses. To calculate the change in the value of insurers’ swaps positions under the simulated rate paths, slot each firm’s portfolio into 60 buckets, reflecting receive-fixed versus pay-fixed positions and maturities of one through 30 years. We approximate the proportion of swaps in each of these buckets for each insurer by a beta distribution over the range 0–30 years with the parameters chosen to match the mean and standard deviation of each in-surer’s actual swaps portfolio, based on Schedule DB of their regulatory filings, as of September 2014.
For the “constant maturity distribution” scenario, we assume that the distribution of the stock of swaps held by each firm is fixed over time. This implies that the net flow in each maturity bucket must be nonzero in each quarter in order to keep the portfolio stable as contracts mature. In particular, the net amount of receive-fixed swaps originated by firm i at maturity m in each period must be
∆
Β Β
x m fixed
m mi
ifixed
ifixed
ifixed
ifixed
,
[ , , ] [ , , ],
( )= − +α β α β1
where B[…] is the probability density function of the beta distribution, and αi
fixed and βifixed are the shape
parameters for the receive-fixed swap distribution at firm i.1 An analogous equation holds for the pay-fixed portfolio. In principle, this net amount could be obtained in a variety of ways. In particular, if the amount is positive, one could terminate y notional value each quarter and originate Δx+y in new contracts, for any arbitrary number y. We assume that, within any type/maturity bin, a firm never terminates and originates contracts at the same time. Thus, if xi(m) is the desired notional value for the stock of swaps in bucket m and xi(m+1) swaps are rolling down into that bucket from maturity m+1, the firm will either (if xi(m+1) < xi(m) ) originate swaps with xi(m) – xi(m+1) notional value without terminating any of the existing ones or (if xi(m+1) > xi(m)) terminate swaps with xi(m+1) – xi(m) notional value without originating any new ones. In the cases in which firms terminate swaps, we assume that they do so without regard to the contract’s age or original maturity. New swaps are assumed to be orig-inated at zero fair value.
For the “duration extension” scenario, we assume that the legacy swaps portfolio gradually matures
over time. The amounts that mature are rolled into new 30-year receive-fixed swaps.
For pricing purposes, we assume that all swaps have quarterly payments, are indexed to the instanta-neous risk-free rate, and are priced off of the same discount curve as Treasury bonds. The m-maturity swap rate at time t is given approximately by
R mm
nt
t t
tn
m( ) ≈ ( ) − ( )
( )=∑
δ δ
δ
0
0.
,
where δt(n) is the time-t n-period discount rate. This formula is an approximation because the numerator is only strictly correct in continuous time and the denom-inator ignores intraquarter discounting. (If swap pay-ments were made continuously, rather than quarterly, the formula would be exact.) The fair value (as a frac-tion of notional value) of a receive-fixed swap contract with remaining maturity m that was originated s periods ago, is given by the formulaFV m s m R m s nt t t t s t
n
m
, ..
( ) ≈ ( ) − ( ) + +( ) ( )−=∑δ δ δ00
Consequently, to value the swaps portfolio, one must know both the distribution of remaining maturities and the distribution of origination dates conditional on the current remaining maturity.
To measure δt(n), we use zero-coupon Treasury rates through 2014:Q3 and projections for those rates from a vector autoregression (VAR) for subsequent dates. For the m-maturity yield yt(m), by definition,
δt tm my m( ) exp .= − ( )
The data are the zero- (instantaneous), one-, three-, seven-, 15-, and 30-year yields computed by Gürkaynak, Sack, and Wright (2007) over the period 1986:Q1–2014:Q3. The Moody’s Baa corporate yield, real gross domestic product growth, and Personal Consumption Expenditures Price Index inflation are also included in the VAR. We begin the sample in 1986 because that is the first date at which 30-year yields become available.
Data are simulated from the VAR by drawing both from the distribution of parameter estimates and the distribution of error terms, assuming normality for both, and simulating forward 20 quarters from 2014:Q3. The zero lower bound is imposed by rejecting any draw for which any interest rate would be below zero at any time; in this case, the whole vector of shocks for that period is resampled. In addition, to reflect current forward guidance about the level of short-term rates (as well as current market expectations), we im-pose through rejection sampling that the fed funds rate cannot rise above 25 basis points until at least 2015:Q2.2

36 1Q/2015, Economic Perspectives
For each simulated value of the six Treasury yields that are included in the VAR, the entire yield curve is interpolated using a quadratic spline. This allows for the calculation of the swap rate associated with each of the 30 possible maturities at each point in time.
To calculate the opportunity cost of holding vari-ation margin, we assume that variation margin must be posted in cash and is remunerated at the fed funds rate, consistent with current practice at the major clearinghouses. We approximate the federal funds rate in each simulation by the equation
ffrt ≈ 1.072yt (0),where the coefficient was estimated from an ordinary least squares regression, with an R2 of 0.998. We assume that, under normal circumstances, the opportunity cost of holding cash is the Baa corporate bond yield. Since a significant portion of insurers’ securities portfolios consist of bonds that are generally safer and thus typi-cally pay lower yields than Baa corporates, this is a conservative assumption. However, occasionally in our simulations some Treasury rates (or the fed funds rate itself) may rise above the corporate bond rate, and in that case we use the higher rate. Specifically, the quarterly opportunity cost is then calculated as
VMt × (max[rt] – ffrt)/4,where rt is the time-t vector of yields simulated from the VAR.
To calculate initial margin, we first estimate the covariance matrix of five-day changes in swap fair values between 2004:Q1 and 2014:Q3, across a 10 x 10 grid of maturities spanning zero to 30 years and swap rates spanning 0 percent to 10 percent. In each of the same 10,000 simulations used to calculate variation margin, we calculate the amount of each firm’s receive- and pay-fixed portfolio that falls within each of the 100 bins in the grid. Multiplying these weights by the covariance matrix of swap value changes allows us to approximate the five-day variance of each portfolio.3 The initial margin is assumed to be the 0.3 percent quantile of a normal distribution with this variance and a mean of zero.
NOTES
1The amount of 30-year swaps originated each period is simply equal to the stock of swaps maintained in the 30-year bin (that is, the normal PDF evaluated at that point).
2Since some parameter draws can imply nonstationary dynamics that lead to explosive behavior, we also impose restrictions to ensure that no projected rate exceeds its historical maximum. In addition, we impose that the spread of the corporate bond to the seven-year Treasury yield cannot be negative.
3This calculation assumes that the initial margin that applies to a given portfolio remains constant over time. In practice, central counter-party clearinghouses are likely to adjust margin requirements with the level of rates, as the conditional covariance matrix of swap values changes is not constant. Our calculation likely errs on the conser-vative side—estimating too much initial margin—because we fore-cast interest rates to rise, and the volatility of a given swap’s value is generally decreasing in the level of rates.
37Federal Reserve Bank of Chicago
Bank for International Settlements, Basel Committee on Banking Supervision, and Board of the Inter-national Organization of Securities Commissions, 2013, “Margin requirements for non-centrally cleared derivatives,” Basel, Switzerland, September, available at http://www.bis.org/publ/bcbs261.pdf.
Becker, B., and V. Ivashina, 2013, “Reaching for yield in the bond market,” working paper, October.
Berends, K., R. McMenamin, T. Plestis, and R. J. Rosen, 2013, “The sensitivity of life insurance firms to interest rate changes,” Economic Perspectives, Federal Reserve Bank of Chicago, Vol. 37, Second Quarter, pp. 47–78, available at https://www.chicagofed.org/publications/economic-perspectives/2013/2q-berends-mcmenamin-plestis-rosen.
Cummins, J. D., R. D. Phillips, and S. D. Smith, 2001, “Derivatives and corporate risk management: Participation and volume decisions in the insurance industry,” Journal of Risk and Insurance, Vol. 68, No. 1, March, pp. 51–91.
Festa, Elizabeth D., 2013, “New derivatives rules raise life insurers’ collateral needs,” LifeHealthPro.com, June 27, available at http://www.lifehealthpro.com/2013/06/27/new-derivatives-rules-raise-life-insurers-collater?page_all=1 .
González, L. O., S. F. López, and O. M. Cunill, 2011, “Hedging with derivatives and value creation: An empirical examination in the insurance industry,” Frontiers in Economics and Finance, Vol. 8, No. 1, pp. 17–42.
Gürkaynak, R. S., B. Sack, and J. H. Wright, 2007, “The U.S. Treasury yield curve: 1961 to the present,” Journal of Monetary Economics, Vol. 54, No. 8, November, pp. 2291–2304.
Heller, D., and N. Vause, 2012, “Collateral require-ments for mandatory central clearing of over-the-counter derivatives,” Bank for International Settlements, working paper, No. 373, March.
Paulson, A., R. J. Rosen, K. Berends, and R. McMenamin, 2014, “Understanding the relationship between life insurers and the Federal Home Loan Banks,” Chicago Fed Letter, Federal Reserve Bank of Chicago, No. 318, January, available at https://www.chicagofed.org/publications/chicago-fed-letter/2014/january-318.
Prudential Financial Inc., 2014, Prudential Financial, Inc. Annual Report 2013, Newark, NJ, available at http://www.prudential.com/media/managed/Prudential-AR2013.pdf .
Shiu, Y-M., 2007, “An empirical investigation on de-rivatives usage: Evidence from the United Kingdom general insurance industry,” Applied Economics Letters, Vol. 14, No. 5, pp. 353–360.
REFERENCES