Depressurization and Two-Phase Flow, of Water Containing. High · Depressurization ,I and Two-Phase...
47
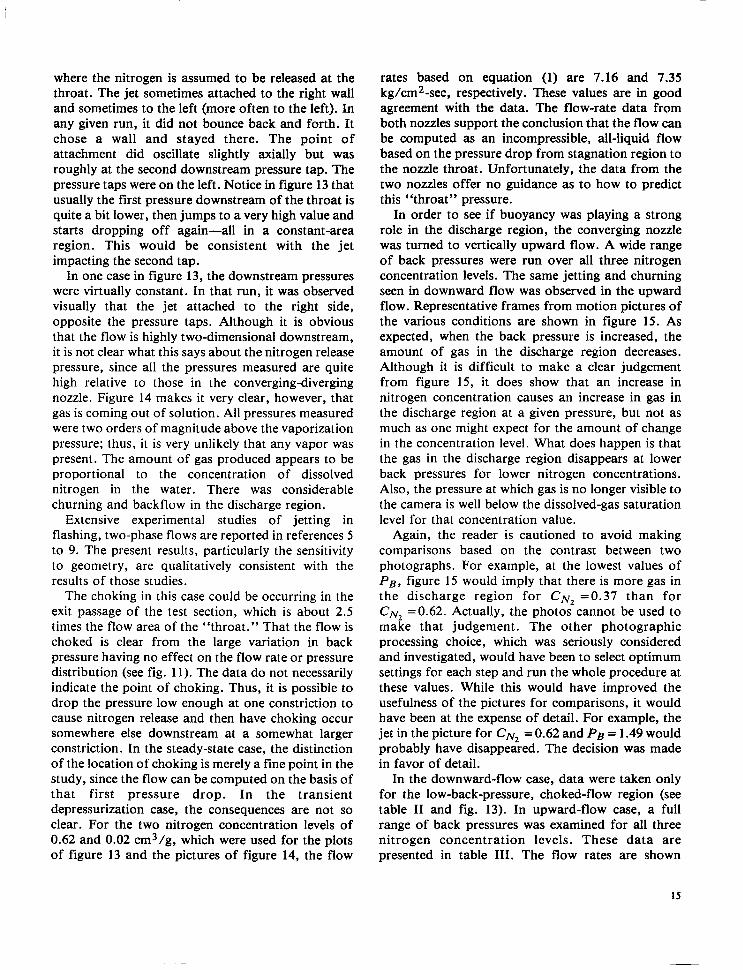
NASA Technical Paper 1839 .. ,. Depressurization , I and Two-Phase Flow, of Water . . Containing. High - Leyels .of Dissolved Nitrogen Gas ' . , . , LOAN COPY: RETURN TO AFWL TECHNICAL LIBRARY - KIRTLANC RrB, 'N.M. ,. , Robert- J. 'Sirnoneau .. . https://ntrs.nasa.gov/search.jsp?R=19810019851 2018-07-05T12:45:20+00:00Z
Transcript of Depressurization and Two-Phase Flow, of Water Containing. High · Depressurization ,I and Two-Phase...

NASA Technical Paper 1839
. . , .
Depressurization , I and Two-Phase Flow, of Water . . Containing. High
- Leyels .of Dissolved Nitrogen Gas '
. ,
. ,
LOAN COPY: RETURN TO AFWL TECHNICAL LIBRARY
- KIRTLANC RrB, 'N.M. ,. , Robert- J . 'Sirnoneau .. .
https://ntrs.nasa.gov/search.jsp?R=19810019851 2018-07-05T12:45:20+00:00Z

TECH LIBRARY KAFB, NM
NASA Technical Paper 1839
Depressurization and Two-Phase Flow of Water Containing High Levels of Dissolved Nitrogen Gas
Robert J . Simoneau Lewis Research Center Cleveland, Ohio
National Aeronautics and Space Administration
Scientific and Technical Information Branch
1981

Summary Exper iments were conducted to s tudy
depressurization of water containing various concentrations of dissolved nitrogen gas, the primary case being room-temperature water saturated with nitrogen at 4 megapascals (MPa). In a nonflow depressurization experiment, water with very high nitrogen content was depressurized at rates from 0.09 to 0.50 MPa per second and was filmed with a high- speed motion-picture camera. The pictures showed a metastable behavior which was a strong function of the depressurization rate. The nitrogen bubbles rarely appeared before the pressure reached half of the initial pressure. Flow experiments were performed in an axisymmetric, converging-diverging nozzle, a two-dimensional, converging nozzle with glass sidewalls, and a sharp-edged orifice. Depressurization gradients were roughly 5 0 0 to 1200 MPa per second. The converging-diverging nozzle exhibited choked flow behavior even at nitrogen concentration levels as low as 4 percent of the saturation level. The flow rates were independent of concentration level. Flow in the two-dimensional converging nozzle appeared to have a sufficient pressure drop at the throat to cause nitrogen to come out of solution, but choking occurred further downstream. The orifice-flow motion pictures showed considerable oscillation downstream of the orifice and parallel to the flow. Nitrogen bubbles appeared in the flow at back pressures as high as 3.28 MPa, and the level at which bubbles were no longer visible was a function of nitrogen concentration. In most cases, the flow could be computed by using a standard incompressible equation with appropriate flow coefficient, if the throat pressure were known. Capacitance measurements indicated that at low back pressure the flow actually overexpanded and recollapsed, which was consistent with visually observed oscillations.
Introduction Many liquids contain sizable quantities of gases
dissolved under pressure. Soft drinks and champagne are common examples. Of more current technical
significance, the water in the emergency core cooling system (ECCS) of a pressurized water reactor (PWR) is stored under nitrogen pressure. During storage, the nitrogen slowly dissolves into the water, and in time the ECCS water becomes fully saturated with nitrogen at the storage temperature and pressure. The question of technical interest then is what would happen to the nitrogen should the system be called to action and the nitrogen laden water start depressurizing while flowing into the main flow loop to the core. Published solubility data (ref. 1) show, for instance, that 1 gram of water at room temperature and 4.24 megapascals (MPa) pressure can contain up to 0.62 cubic centimeter (cm3) of nitrogen measured at room temperature and 1 atmosphere pressure. This much nitrogen could produce a void fraction of 38 percent during depressurization of fully saturated water from 4.24 to 0.1 MPa. (Note: At 1 atm pressure, 1 g of saturated water contains only 0.015 cm3 of nitrogen.)
Several experiments were conducted at the NASA Lewis Research Center to study the depressurization behavior of water containing various concentrations of dissolved nitrogen gas. The information obtained in these experiments included high-speed motion pictures and corresponding pressure and flow data.
A static (more accurately, a nonflow) depressurization test was conducted in a small, 5-liter vessel with viewing ports to observe the bubble evolution from the water during the depressurization transient. This experiment was reported in reference 2 and is highlighted herein for completeness.
Flow tests were conducted by discharging a steady flow of water containing dissolved nitrogen gas through various nozzles and orifices. Although depressurization is usually a transient event, it is normal procedure to perform steady-flow experiments and then to analyze the transient as a series of quasi-steady events. Preliminary results from these flow experiments also were reported in reference 2; however, extensive additional data are presented in this report.
The static depressurization results give some insight about bubble growth. The nozzle flow results focus on the question of choking. The orifice flow data provide visual detail and capacitance measurements of bubble population.

Symbols
B C D
CN2
c G P T t CY
P
Nitrogen gas 1 -
discharge chamber discharge coefficient, dimensionless nitrogen concentration in the water
(referenced to 1 atm pressure and 25 C), cm3 /g
electrical capacitance, pF flow rate, kg/cm2-sec pressure, MPa temperature, K time, sec void fraction, dimensionless density, g/cm3
Subscripts: a, b, c
B max
0
or T t W
reference positions for capacitance
discharge-chamber conditions maximum stagnation conditions in flow experiments;
initial pool conditions in static depressurization experiments
conditions at orifice flowmeter water storage tank conditions throat conditions all-water (no voids) reference conditions
measurements
1,2, ..., n static pressure locations along flow test sections
Pressure transducer
A Metering Vent
Figure 1. - Schematic of staticdepressurization system.
2

Experimental Apparatus
Static Depressurization Rig
The static depressurization rig was a nonflow system in which water containing dissolved nitrogen gas could be depressurized at a controlled rate and observed visually. It is shown schematically in fig- ure 1. The two major components were a 30-liter, high-pressure, storage tank and a Sliter, high- pressure, viewing vessel. The system could be operated up to 4.0 MPa. Nitrogen was dissolved into the water, while in the storage tank, by bubbling nitrogen gas through the tank from the bottom under pressure. The flow was controlled by a metering needle valve, and the pressure was controlled by a back-pressure regulator. The flow rate was set at a level to assure a continuous flow-through of gas. After some desired bubbling time, the water containing dissolved nitrogen was transferred to the viewing vessel by using a small pressure differential, of the order of 0.07 MPa or less. During the transfer, the water passed through a removable bottle of approximately 11.8 cm3 capacity. This allowed drawing a high-pressure sample for nitrogen-content analysis.
Internally, the viewing vessel was approximately 15 centimeters in diameter and 29 centimeters high. The measured volume, including the window penetrations, was close to 5.0 liters. The viewing window was 6.5 centimeters in diameter and was located approximately three-fourths of the distance from the bottom. The pool was illuminated through a similar window in the top of the vessel. The internal components are shown in figure 2. The wire-mesh cylinder was used to promote gas nucleation sites. The probe to the far right was a Chromel-constantan thermocouple. The L-shaped probe was used to mark liquid level. The pointed tip was located at the 90-percent-full level. The ladder-shaped device was used for dimensional reference. The rungs alternated in diameter, with the top one being 0.25 millimeter, and the next one 0.51 millimeter, and so on down. They were spaced 0.50 centimeter apart.
Flow Rig and Test Sections
The flow rig was a modification of a facility used extensively for experiments in two-phase choked flow of subcooled cryogens (ref. 3). A schematic of the
s,
Figure 2 - Internal Components of viewing vessel for static- depressurization rig.
essential features is shown in figure 3. The main flow setup consisted of a 110-liter pressure vessel capable of pressures up to 10 MPa; an orifice flowmeter; the test section; a back-pressure control valve; and a weigh tank, Nitrogen gas was bubbled in through the bottom of the vessel and was controlled with a back- pressure regulator. During flow, nitrogen gas pressure was maintained on the top of the vessel from a high-pressure bottle farm. Because the main vessel was small, a 375-liter storage tank, in which additional water could be saturated with nitrogen gas, was added to the system. In the latter stages of the work, in order to achieve longer run times, the smaller vessel was bypassed, and the flow was directly from the 375-liter tank to the test section.
The test sections used in the present experiment are shown in figures 4 to 7. They include two nozzles, which were used primarily to examine choking, and two orifices, which were used to visualize the bubble population. Figure 4 shows a conical, axisymmetric, converging-diverging nozzle used extensively in cryogenic experiments (ref. 3). Nine of the 15 pressure taps were used in the present experiment.
3

Nitrogen gas,
Tap water
Figure 3. - Flow sytem schematic.
Figure 4. - Conical, axisymmetric. converging-diverging nozzle. Convergence half angle, 7’; divergence half angle, 3.5O; throat cross-sectional area, 0.0993 cm2. ( A l l dimensions are in cm.
The throat region had a constant-area section which the centerbody with the one illustrated in figure 5 . In was 3.2 diameters long. Figure 5 shows a visual, addition to its visual characteristics, the essential converging-nozzle test section of rectangular cross features of this test section were the linear converging section which was designed for use in this pressure gradient and the abrupt area change at the experiment. It was made by taking a conventional, exit of the minimum area region. The minimum-area, commercial, high-pressure sight gage and replacing or “throat,” region had a length of constant cross-
4

-4 1.60 I-
View A-A
s-sectional area)
0 (Nozzle throat)
Figure 5. - Visual, converging-nozzle test section. Throat cross-sectional area, 0.202 crn2. (All dimensions are in crn. )
sectional area which was 1 channel height long. The gasket sealing the glass sidewalls to the centerbody was trimmed slightly to achieve a better view of the edge. This gave the throat region a slight I-shape. There were nine pressure taps located axially along the nozzle as shown in figure 5 .
Figure 6 shows a channel made of Lexan plastic to allow maximum viewing. The test section was capable of operating at 4.2 MPa. A circular, sharp- edged orifice, 2.09 millimeters in diameter, was located near the inlet as indicated in figure 6 . The flow discharged through the orifice into a long, unobstructed, square-cross-section channel with internal dimensions of 1.27 by 1.27 by 70.0 centimeters. Pressure was measured upstream of the orifice plate and at the exit of the chamel. Prior to its entering the test section, the water was passed through a venturi flow meter shown in the photograph. After a few runs, the Lexan test section began to craze and was abandoned. A new test section was made which also had a circular, sharp-
I
Venturi nozzle /
. "
I - Orifice -' plate
edged orifice, 2.09 millimeters in diameter, Figure 6. - Orifice in long visual-channel test section with Lexan discharging into a long, rectangular channel. The sidewalls.
5

Pressure tap (typical) -
channel was formed by welding two commercial sight gages together into two chambers. The orifice plate was located near the entrance to the first chamber. This test section was used for two separate sets of tests, and the channel dimensions were different for each.
For the first set of tests, the channel cross-section was 1.60 by 3.00 centimeters. Water containing dissolved nitrogen gas was discharged through the orifice into the channel, and pressure measurements and motion pictures were made.
For the second set of tests, the channel cross- section was 0.96 by 3.00 centimeters. Capacitance plates set in Bakelite strips were inserted along the sidewalls of the channel to measure void distribution. This test section is shown in figure 7. The six capacitance plates were each 3.00 centimeters square, and are clearly visible in the photograph. The average distance between plates was 0.96 centimeter. The fittings with the small wire sticking out are the center points of the capacitance plates. The other fittings are pressure taps. The transition between the two chambers was a circular hole. The test section was capable of withstanding pressure well above the 4.2-MPa operating pressure.
Instrumentation
Pressures throughout were measured by strain- gage transducers. In the flow rig, the mass flow rate was measured with a calibrated orifice in the single- phase region just upstream of the test section, and it was verified periodically by weighing the flow discharge. A n exception to this method was in the tests with the Lexan test section (fig. 6), where the calibrated orifice was replaced by a venturi. The venturi was not calibrated, and ideal calculations were used.
The photographic records were obtained with m o t i o n - p i c t u r e c a m e r a s . I n t h e s t a t i c - depressurization facility, two cameras were used simultaneously-one running at a real-time speed of 24 pictures per second bps), and the other running at 200 or 400 pps, depending on the rate of the transient. Throughout the transient, the pressure was monitored continuously by placement of an LED
Figure 7. - Orif ice in sight-gage test section with capacitance gages along readout from a strain-gage pressure transducer in the sidewalls. field of view of the camera. Figure 8 is a camera’s-eye
view of the test section and the readout. In addition to the film record of the pressure readout, a pressure- versus-time trace was made on an X-Y recorder for
6

Figure 8. - Carnera's-eye view of test section and pressure readout.
each test run. The light was 90" to the viewing port. As the transient progressed, the bubble population significantly changed the lighting. Both cameras were equipped with automatic exposure controls.
In the flow facility, the pictures were taken with several different cameras, depending on the situation. In the converging nozzle of figure 5 , a high-speed camera operating at 9ooo pps with an exposure time of 1/27,000 of a second was used. The lighting was from the rear, through the test section. With the Lexan test section (fig. 6) , a 100-pps camera that could be started and stopped was used, so that a variety of back-pressure conditions could be photographed without reloading the camera. A 10" shutter was used to give an exposure time of 1/3,600 of a second. The lighting was also from the rear in this experiment.
Finally, in the experiments with the orifice in the sight-gage test section (fig. 7), the camera speed was 400 pps with a 10" shutter to yield an exposure time of 1/14,000 of a second. Because of the very deep field and large bubble population, it was found to be impossible to get sufficient light through from the rear. Thus, for these pictures, the lighting was from
the front. Also, to capture more detail, the camera was brought close to the subject so that only a small portion of the vertical height was photographed at any one time. The camera was mounted on an adjustable tripod and was traversed manually in the vertical direction with the flow while the camera was running. A typical traverse took 10 to 12 seconds. The lights were also mounted on the tripod and traversed with the camera.
A collage of still pictures was assembled from the motion pictures for presentation, and it is important to discuss the process from which the collage evolved. First, each picture in the collage is from a different roll of motion-picture film. The films were taken on several different days and represent several separate setups. The camera and lighting were set up to yield maximum information for a given run; thus each setup was slightly different. Of course, the film was developed on separate days. Subsequently, selected single pictures from each roll were transferred from 16- to 35-millimeter film with the use of a special attachment to a 35-millimeter still camera. This is a very efficient way to transfer information from thousands of frames of motion-
I

picture film to a manageable set of still pictures. The 35-millimeter still camera had automatic exposure control, which was used to optimize the detail on the still pictures. Finally, when the prints were made, the processor attempted to get the best print possible. All of these steps tend to enhance detail but make side- by-side comparisons impossible.
In addition to the pressure and flow-rate data and the motion pictures acquired throughout these experiments, capacitance measurements were made with the orifice flow in the sight-gage test section (fig. 7) to estimate the void fraction. The average capacitance with the test section full of water was 70 picofarads (pF), and full of nitrogen gas, it was less than 1 pF. A circuit was built which would switch through three pairs of plates at a controlled rate. The signals were measured with a precision capacitance meter and were recorded on an oscillograph. Each set of data required two runs; one with plates 1, 3, and 5 connected, and another with plates 2, 4, and 6 connected. This configuration avoided any problem of cross communication between adjacent plate pairs. An all-liquid record for each capacitor was taken at the beginning of each run.
Gas-Content Analysis
The nitrogen content of the water was determined as follows. First, the high-pressure sample was drawn into a 11.8 cm3 bottle which was an integral part of each rig (figs. 1 and 2). Then, the sample was discharged into a known volume which had been evacuated, as shown in figure 9. The chambers were sized so that the final equilibrium pressure would be near atmospheric pressure. The volume of nitrogen discharged was computed from the final pressure by the ideal gas law. A correction was made for the partial pressure of the water vapor. The sample was then sent to the chemical analysis laboratory to measure the residual nitrogen content. The final result was expressed as cubic centimeters of nitrogen per gram of water at 25" C and 1 atmosphere.
Results
Range of Experiments
The work reported herein covered a variety of experiments. In order to help keep the results clear, the range of experiments will be outlined brieflv.
8
Pressure transducer 10 to 23 psia)
Vacuum c
Sample bottle (approx. 11.8 cm3)
Figure 9. - Gas-sample depressurization system.
First, experiments were conducted in which a high- pressure pool of water at room temperature containing a high concentration of dissolved nitrogen gas was depressurized at controlled rates. The nitrogen concentration levels were saturated, and 93-percent saturated. The times required to depressurize to one third the initial pressure ranged from 5 to 30 seconds.
Second, experiments were conducted in various flow geometries in which high-pressure water at room temperature containing various concentrations of dissolved nitrogen gas was discharged through various flow constrictions. The geometries were ( I ) a converging-diverging nozzle; (2) a converging nozzle; (3) a sharp-edged orifice with two different downstream channels; and (4) a sharp-edged orifice and channel with capacitance-measuring side walls. The concentrations of nitrogen gas were saturated, 50-percent saturated, and 2-percent saturated. Stagnation pressures were normally about 4.2 MPa. Back pressures ranged from 0.1 to 3.9 MPa.
Time Scale of the Experiments
The two experiments had significantly different
. .. .

time scales. In the static-depressurization experiment, the average depressurization rates ranged from about 0.1 to 0.5 MPa per second. In the flow tests, the combination of steep pressure gradients and short residence times produced average depressurization rates of the order of 500 to 1200 MPa per second. The depressurization gradients in the flow experiments are more in line with the rate one might expect in a typical emergency core cooling system (ECCS) of a pressurized water reactor (PWR). Typically, the ECCS water, presumably saturated with nitrogen, discharges through about 8 meters of 23-centimeter-diameter pipe before joining the large, 76-centimeter-diameter, cold-leg pipe. A rough estimate of the maximum depressurization rate in the ECCS pipe is 7000 MPa per second.
The flow data presented herein should be used to make a more realistic interpretation of the nitrogen release phenomena. On the other hand, because of the very short time scale, it was very difficult to obtain detailed mechanism information from the flow tests. The static depressurization tests were useful in qualitatively evaluating the variables.
Static Depressurization
The static-depressurization tests reported herein were all conducted with distilled water at room temperature (approx. 22" C) and an initial pool pressure of 3.86 MPa. A parametric array of gas bubbling times (i.e., gas concentrations) and depressurization rates were examined.
Nitrogen gas was bubbled through the water prior to depressurization for six different periods ranging from 1 to 28 days. It was clear from the gas-content measurements that it was not necessary to bubble the nitrogen through the water for such long periods to achieve high concentration values. Bubbling times of 3 to 6 days seemed more than adequate to bring the water to near-saturated gas-content levels.
On the other hand, as one might expect, there was a general trend of increased gas content with increased bubbling time. For example, after 12 days, the nitrogen content was 0.57 cm3/g, and at 28 days it was 0.61 cm3/g. Unfortunately, the data scatter in the gasconcentration measurements was comparable to this 7-percent trend. Since the measured nitrogen concentrations for both bubbling times were at or above the published saturation value of 0.57 cm3/g, it was felt that the 28day soak represented a fully saturated pool of water.
In addition to the nitrogen content, the variable of main interest is the rate of depressurization of the pool of water which has been saturated with nitrogen gas. The depressurization rates were nonlinear (nearly exponential) and are reported herein as the time it took the system to depressurize to Po /3. (The average rate in this process is approximately - 2P0/3t.) This time to Po/3 ranged from 5 to 30 seconds in these tests. In figure 10, single frames from the depressurization motion pictures are arranged in arrays to show the influence of depressurization times on bubble population. Figure lO(a) shows the results for room-temperature water saturated with nitrogen at 0.61 cm3/g (28-day bubbling time) which was depressurized from an initial pressure of 3.86 MPa. The figure shows the bubble population at five pressure levels during transients at four different depressurization rates (i.e., times to depressurize to P0/3). Figure lo@) is an identical array of photographs for water with a nitrogen concentration of 0.57 cm3/g (12-day bubbling time), which is 93 percent of the maximum average value.
It is clear from both figures that the depressurization rate has a strong influence on the bubble population. The general trend of bubble population increasing as depressurization rate decreases is obvious. The reader is cautioned to avoid drawing conclusions based on photographic contrast, since the pictures were always processed to maximize detail, as previously explained in the Instrumentation section. It should be noted that in both figures the pressure in the top row is already down to P0/2. Thus, even though the water was saturated or nearly saturated with nitrogen at P o , there is very little bubble evolution when the pressure has dropped to half of its original value. By this time the water is highly supersaturated with nitrogen. Recall that these depressurization rates are very slow by reactor standards. When the bubbles do begin to come out, they do not explode out.
If the nitrogen content is somewhat less than saturated (fig. lo@)), the delay in initial bubble evolution is fairly strong. Of course, since the total nitrogen content is only slightly lower, the final bubble populations are similar (see both figures at
The majority of the bubbles which appear in figure 10 are fully matured in growth for that pressure level. They were formed in the lower half of the vessel and rose into view. They are quite small, ranging from about 0.1 to 1 .O millimeter in diameter, with the vast
PO/1O).
9

5.1 9.8 19.8
Time to depressurize to P0/3, sec
(a) Nitrogen concentration, CN 2’ 0.61 cm3/g (saturation).
Figure 10. . Influence of depressurization rate on bubble population a t various pressure levels.
10

.5
5.1 9.8 19.8
Time to depressurize to Po/& sec
(b) Nitrogen concentration, CN 0.57 cm3/g.
Figure 10. - Concluded.
2'
28.6

majority more uniformly grouped around 0.2 to 0.5 mill imeter. These estimates are based on comparisons with the reference wire diameters on the ladder-shaped device (see fig. 2). At lower pressures, such as P/P, = 0.1, for instance, it was'very difficult to see the reference wires because of the high bubble population. Some large bubbles of 2- to 3-millimeter size did appear, but they were a small percentage of the total population. Generally the bubbles in view were roughly the same size, independent of the pressure level. Since the bubbles are rising past the window, the time between being formed and being seen should be roughly constant. This suggests that the bubbles, which could be seen, formed at about the same size, independent of the water pressure at the time of formation. Thus, at the end of the transient there should be a spectrum of bubble sizes, with the bubbles formed early having grown large, and the newly formed bubbles remaining small. There was very l i t t le-almost no-bubble coalescence even at low pressure when the bubble population was very high. The only place where some would coalesce was at stagnation points, such as the window rim.
Flow Through Nozzles
Visual, pressure, and flow-rate data were acquired for two nozzles-a conical, axisymmetric, converging-diverging, stainless-steel nozzle (fig. 4), and a two-dimensional, converging, visual nozzle (fig. 5) . All the data taken with these nozzle test sections are presented in tables I to IV.
The fluid was de-ionized tap water at room temperature (approx. 22" C). Three concentration levels of dissolved nitrogen gas in water were examined: (1) a concentration of 0.62 cm3/g, which is the saturation or near-saturatuion level at a stagnation pressure of 4.2 MPa; (2) a concentration of 0.31 cm3/g, which is a 50-percent saturation level at 4.2 MPa, or the saturation level at 2.2 MPa; and (3) a concentration of 0.02 cm3/g, which was the level contained in the water as drawn from the tap, through the de-ionizer. All significant parameters other than the nitrogen concentration levels were nominally constant.
The pressure distributions through the converging- diverging nozzle for the three concentrations of nitrogen gas are listed in table I and plotted in fig- ure 11. All the data in figure 11 meet the classic criteria for choking. A significant change in back pressure (up to 1 MPa) produces no change in flow
Nitrogen Flow Stagnation Stagnation Readings concentration rate. pressure, temperature, in water, G. PO, TO,
'Nz kg/cm2-sec MPa K cm3b
0 0.62 Isat) 8.64 4. 18 298 A .31
49 to 52 8.74 4.25 294 93 to 95
.02 8.64 4.08 291 102 to 104
4 0 5L I t 0
0
2 - Region of constant
1 - 7 r cross-sectional area 0 I ' c b b l I I I I 5 r
Region of constant r cross-sectional area
3t 0 0
:I1 Jt-& , , , ; Region of constant cross-sectional area
0 -6 -4 -2 0 2 4 6 8 10 12 14 16 18
Axial position, cm
Figure 11. - Pressure distributions for flow of water containing dissolved nitrogen gas through a conical, axisymmetric, converging-diverging nozzle.
rate or throat pressure for any of the three sets of data in figure 11. Furthermore, the pressure profiles are absolutely identical for all three concentration levels. If the fluid is not compressible, one is at a loss to explain the ability to significantly raise the back pressure without reducing the flow. In one case (not shown), the back pressure was raised to P , / 2 with no effect. It would appear that for the cases studied, water containing dissolved nitrogen can choke and that the choking flow rate and pressure profiles are independent of the nitrogen concentration level. It is possible that the fluid pressure at the throat was so low as to flash some of the liquid to vapor. However, at these temperatures, this would have to be a very low pressure, such as 0.002 to 0.003 MPa. It should be noted that the actual throat pressure readings of 0.02 to 0.05 MPa are beyond the accuracy of the 6.90-MPa (1000-psig) transducers. Thus, the

numbers can only be reported as very low, and the throat pressures could be as low as 0.002 to 0.003 MPa, thereby permitting vaporization.
The flow-rate results are shown in figure 12. The independence of flow rate from nitrogen concentration level is obvious. The choked flow rates can be compared to those computed by the equation for a discharge of an incompressible fluid:
Since Pt is so low for the data of figure 12, the computat ion can be s implif ied by set t ing (Po - P t ) =Po. The nozzle was calibrated in a flow- calibration laboratory, and the asymptotic CD was found to be 0.946. The agreement between the maximum flow rates and the above approximation is excellent. Thus, although the flow was choked, the flow rate can still be computed in the above situation by treating it as a discharge of all liquid into a 1-atmosphere reservoir. This is consistent with the results of Cha and Henry (ref. 4), who found little difference in depressurization times whether the water was saturated or not. This result, however, should be treated as highly empirical and applicable only to situations comparable to the experimental conditions of figure 12. Equation (1) should apply (i) if the minimum flow areas occur early in the flow passage; (ii) if the depressurization gradient to the minimum flow area is quite steep; and, particularly, (iii) if the minimum area is substantially smaller than
Nitrogen concentration
in water, CN2-
cm35 0 0.62 A .31 0 .02
u- 1 2 3 4 5 6
Stagnation pressure, P, MPa
Figure 12. -Maximum f l o w rates for f l o w of water containing dissolved nitrogen gas through a conica’. axisymmetric. converging-diverging nozzle.
any other cross-sectional area. The data taken in the two-dimensional, visual
nozzle, and listed in table 11, present a more complex picture. The physical constraints of the visual channel made it necessary to provide fairly small entrance and exit passages to the test section. The flow area in these passages was only of the order of 2.5 times the minimum (throat) area of the nozzle. The small passage at the entrance caused a large pressure drop between the tank and the test section (approx. 1.0 MPa at the 4.2 MPa level). Thus, the fluid pressure entering the test section was already 25 percent below saturation. At no time did any bubbles appear in this test section entrance region. This is consistent with the supersaturated metastability observed in no-flow depressurization experiments.
The pressure profiles for the visual nozzle in vertically downward flow are displayed in figure 13 in the same manner as those shown in figure 11 for the converging-diverging nozzle. In general, the same remarks and conclusions apply here. The flow acts choked. Significant back-pressure changes can be
Nitrogen Flow Stagnation Stagnation Readings
in water, G . PO, TO. concentration rate, pressure, temperature,
kg/cm2-sec MPa K
cm35 0 0.62kat ) 1. 18 3.21 301 38 and 39 0 .02 7.01 3.23 290 118 to 120
4r 3 1 O o 0
Region of constant cross-sectional o o
1 area-.. m ‘. 0
2 I A A u - :
E-
Region of constant cross-sectional ,Q, area---_
““p I , I A“ g &
-6 -4 -2 0 2 4 6 B Axial position, cm
Figure 13. - Pressure distr ibutions for flow of water containing dissolved nitrogen gas through a linear, two-dimensional, visual, converging nozzle.
13

made with no upstream effect. The profiles and flow rates seem independent of nitrogen concentration. However, some significant differences exist. First, the “throat” pressures are approximately an order of magnitude higher, and they are a little bit different from run to run (~0.53 MPa in the C N ~ = 0.02 cm3/g case, and ~ 0 . 6 5 MPa in the saturated case). Second, a liquid core jets into the abrupt area change region downstream of the “throat.” Third, the flow downstream of the “throat” is clearly not one-dimensional. These latter two effects can be seen
in the motion pictures of the flow. Figure 14 shows selected frames from motion
pictures, taken at about 9ooo pps, of the flow discharging downward through this nozzle. The liquid jets are seen beyond the throat, in the expansion region, and gas begins to appear along the edges of the jet (fig. 14(b)). Thus, in this case with the abrupt area change, it may be incorrect to interpret the pressure measured at the nozzle “throat” as being related to the pressure of nitrogen release. This is in contrast to the converging-diverging nozzle,
la) Nitrogen concentration, CN , 0.62 cm3/g 2
Figure 14. - Flow of water containing dissolved nitrogen gas the test section.
(b) Nitrogen concentration, CN 0.02 cm3/g 2’
through a converging nozzle. Lighting from the rear, through
14
where the nitrogen is assumed to be released at the throat. The jet sometimes attached to the right wall and sometimes to the left (more often to the left). In any given run, it did not bounce back and forth. It chose a wall and stayed there. The point of attachment did oscillate slightly axially but was roughly at the second downstream pressure tap. The pressure taps were on the left. Notice in figure 13 that usually the first pressure downstream of the throat is quite a bit lower, then jumps to a very high value and starts dropping off again-all in a constant-area region. This would be consistent with the jet impacting the second tap.
In one case in figure 13, the downstream pressures were virtually constant. In that run, it was observed visually that the jet attached to the right side, opposite the pressure taps. Although it is obvious that the flow is highly two-dimensional downstream, it is not clear what this says about the nitrogen release pressure, since all the pressures measured are quite high relative to those in the converging-diverging nozzle. Figure 14 makes it very clear, however, that gas is coming out of solution. All pressures measured were two orders of magnitude above the vaporization pressure; thus, it is very unlikely that any vapor was present. The amount of gas produced appears to be proportional to the concentration of dissolved nitrogen in the water. There was considerable churning and backflow in the discharge region.
Extensive experimental studies of jetting in flashing, two-phase flows are reported in references 5 to 9. The present results, particularly the sensitivity to geometry, are qualitatively consistent with the results of those studies.
The choking in this case could be occurring in the exit passage of the test section, which is about 2.5 times the flow area of the “throat.” That the flow is choked is clear from the large variation in back pressure having no effect on the flow rate or pressure distribution (see fig. 11). The data do not necessarily indicate the point of choking. Thus, it is possible to drop the pressure low enough at one constriction to cause nitrogen release and then have choking occur somewhere else downstream at a somewhat larger constriction. In the steady-state case, the distinction of the location of choking is merely a fine point in the study, since the flow can be computed on the basis of that first pressure drop. In the transient depressurization case, the consequences are not so clear. For the two nitrogen concentration levels of 0.62 and 0.02 cm3/g, which were used for the plots of figure 13 and the pictures of figure 14, the flow
rates based on equation (1) are 7.16 and 7.35 kg/cm2-sec, respectively. These values are in good agreement with the data. The flow-rate data from both nozzles support the conclusion that the flow can be computed as an incompressible, all-liquid flow based on the pressure drop from stagnation region to the nozzle throat. Unfortunately, the data from the two nozzles offer no guidance as to how to predict this “throat” pressure.
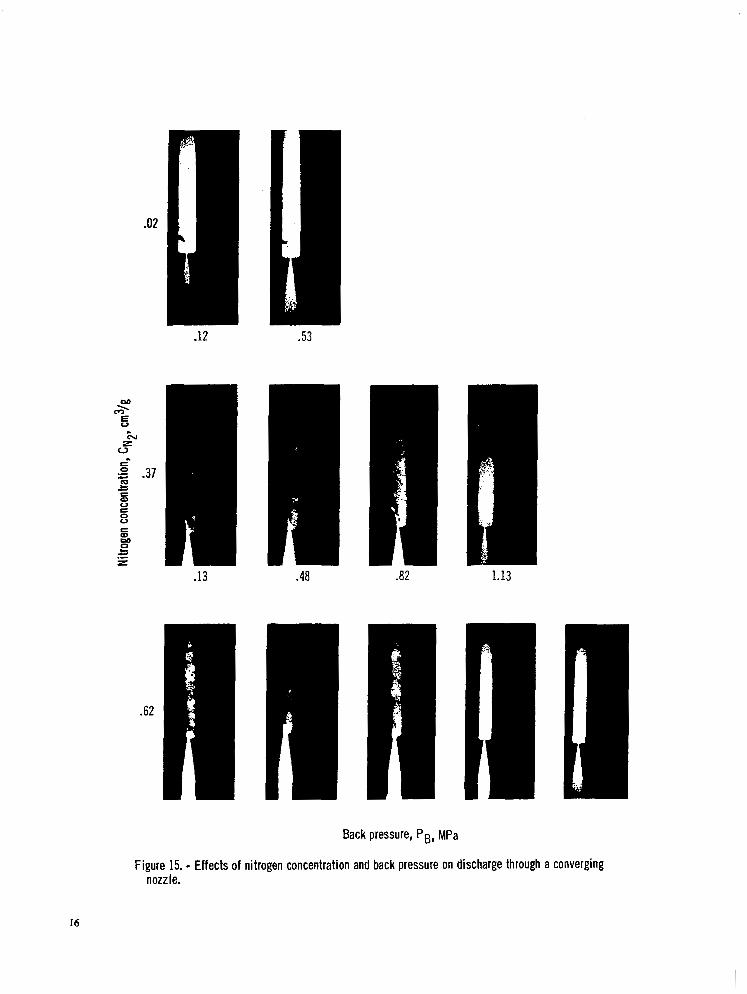
In order to see if buoyancy was playing a strong role in the discharge region, the converging nozzle was turned to vertically upward flow. A wide range of back pressures were run over all three nitrogen concentration levels. The same jetting and churning seen in downward flow was observed in the upward flow. Representative frames from motion pictures of the various conditions are shown in figure 15. As expected, when the back pressure is increased, the amount of gas in the discharge region decreases. Although it is difficult to make a clear judgement from figure 15, it does show that an increase in nitrogen concentration causes an increase in gas in the discharge region at a given pressure, but not as much as one might expect for the amount of change in the concentration level. What does happen is that the gas in the discharge region disappears at lower back pressures for lower nitrogen concentrations. Also, the pressure at which gas is no longer visible to the camera is well below the dissolved-gas saturation level for that concentration value.
Again, the reader is cautioned to avoid making comparisons based on the contrast between two photographs. For example, at the lowest values of P g , figure 15 would imply that there is more gas in the discharge region for C N ~ =0.37 than for CN, =0.62. Actually, the photos cannot be used to make that judgement. The other photographic processing choice, which was seriously considered and investigated, would have been to select optimum settings for each step and run the whole procedure at these values. While this would have improved the usefulness of the pictures for comparisons, it would have been at the expense of detail. For example, the jet in the picture for C N ~ = 0.62 and PB = 1.49 would probably have disappeared. The decision was made in favor of detail.
In the downward-flow case, data were taken only for the low-back-pressure, choked-flow region (see table I1 and fig. 13). In upward-flow case, a full range of back pressures was examined for all three nitrogen concentration levels. These data are presented in table 111. The flow rates are shown
1s
.02
.53
.13 -48 ~
.82 1.13
Back pressure, Pg, MPa
Figure 15. - Effects of nitrogen concentration and back pressure on discharge through a converging nozzle.
16

plotted against back pressure in figure 16. The supply tank pressure was held constant at 4.25 to 4.30 MPa. For back pressures below about 0.55 MPa, the throat pressure and flow rate appear to be constant at about 0.6 to 0.7 MPa and 7.0 to 7.1 kg/cm*-sec, respectively. There appears to be a small effect of nitrogen concentration. Above PB = O S 5 MPa, the flow rate drops off with back pressure and the “throat” pressure is nearly the same as the back pressure. Note also from table I11 that, although the supply tank pressure is nearly constant, the first station in the nozzle, the “stagnation point,” varies with flow. The flow is unchoked above PB =0.55 MPa. The flow can be calculated with equation (l), where P1 = P o , P6 = P I , and CD = 1 .O. Note .that above PB = O S 5 MPa, the back pressure and throat pressure are almost equal. If PB is substituted for Pt in equation (l), the apparent choking at low back pressure is even more obvious (see fig. 16). This “good agreement” may be a coincidence, as will be seen in the following discussion. The picture is really quite complex.
Because of concern about the small exit from the test section to the back-pressure plenum chamber, the exit was enlarged from 2.5 times the throat area to almost 10 times the throat area. This was done by replacing the glass sidewalls with inserting a 1.10-centimeter inside
Nitrogen Storage-tank concentration pressure,
in water, PT* ‘N2, M Pa
cm34 0 0.62 4.30 A .36 4.25 0 .02 4.25
steel blanks and diameter tube in
2o . 5 LO 1.5 2.0 2.5 3.0 3.5 4.0 I I I. I I -1”
Back pressure, PB, MPa
Figure 16. - Effect of nitrogen concentration and fluid back pressure on flow of water and dissolved nitrogen upward through a converging nozzle. Stagnation temperature, To, = 20’ C.
each plate near the exit. The results, listed in table IV and plotted as flow rate versus back pressure in figure 17, were a little surprising.
Figures 16 and 17 are almost identical except the flow rate does not level off as much at low back pressure with the larger exit. In fact, the flow rates associated with the larger exit were actually slightly less. The major difference was in the pressures. With the larger exit, the “throat” pressures were much lower, and equation (1) substantially overpredicted the flow. Substituting PB for PI in equation (1) produced the same curves as in figure 16; however, the deviation of the data begins at very high back pressure and steadily increases as back pressure is decreased. The characteristic signs of choking are not apparent in the large-exit data set.
It would appear from these two sets of data that choking did indeed occur in the first case, but that it may have occurred across the small exit to the test section rather than at the throat. In the small exit case, as the back pressure is steadily decreased, the flow rate decreases, until, at P s = 0.55 MPa, the flow rate remains constant with further decreases in back pressure. This is typical choking behavior. In the second case, when the exit restriction is enlarged, this choking behavior is not obvious, although the flow does seem to approach a maximum. This change when the exit restriction is removed would imply that the choking occurred in the exit restriction and not
Nitrogen Storage-tank concentration pressure,
in water, PT. CN2, M Pa
cm34 0 0.58 4.26
0 .02 4 18 A .29 4.28
0 .5 1.0 1.5 2.0 2.5 7.0 3.5 4.0 Back pressure, PB, MPa
Figure 17. - Effect of nitrogen concentration and fluid back pressure on flow of water and dissolved nitrogen upvard through a converging nozzle with an enlarged exit passage. Stagnation temperature, T,, =: 20° C.
17

the throat, even though the area was 2.5 times the throat area. It would appear that the pressure drop through the throat is sufficient for the gas to come out of solution and then the gas-liquid mixture chokes at the exit. The question then remains as to why equation (1) describes this flow accurately in one case and not the other. Some insight may be gained from examining the pressure distributions (fig. 18) for the two geometries.
First, it should be pointed out that equation (1) should be expected to calculate the flow accurately. Equation (1) describes a one-dimensional, incompressible, frictionless flow. What would change it from a flow-field description to a predictive corre!ation would be the ability to predict P,. The fact that equation (1) accurately describes the data of figure 16 suggests that the measured throat pressure is accurate and that the flow coefficient is near unity (i.e., friction and two-dimensional effects are small). If this is true, it would also imply that the flow is single-phase to the throat, an observation supported by the motion pictures (see fig. 15). Of course, there could be compensating combinations of effects, but this seems unlikely because of the good agreement at high pressure. The inability of equation (1) to describe the flow for the data in figure 17 (enlarged exit) suggests a change in the flow. From the pressure distribution in figure 18 it would seem that the flow is separating at the nozzle throat and jetting downstream into the sudden expansion zone. The sudden pressure rise at the third downstream pressure
concentration pressure, pressure, pressure. in discharge rate. Nitrogen Storage-tank Stagnation Throat Back pressure Flow
in water, PP p,. Pt, chamber, G. cNp* MPa MPa MPa PB, kg/cm2-sec
cm3/9 o 0.62 4.28 3.24 0.70 0.70 6.98
.% 4.27 3.22 .21 .21 7 .10 A . 6 2 4.32 3.68 2.14 A .% 4.28 3.69 1. 98 2. 15 5.21
2.13 5.41
Open symbols denote small exit area Solid symbols denote large exit area
& t 0
0 0 0 0
-6 -4 -2 0 2 4 6 B Axial position, cm
Figure 18. - Comparison of axial pressure distributions in the converging nozzle with two different exit areas.
station would indicate that the jet has re-attached to the wall at this point. This departure from one- dimensional flow would appear to persist for all back pressures, as exhibited by the high pressure profiles in figure 18 and the flow-rate data of figure 17.
Finally, the results obtained with the two nozzles (the conical, converging-diverging nozzle, and the two-dimensional, converging nozzle) exhibit a delicate balance in the location of choking. The converging-diverging nozzle exhibited all the classic signs of choking, and it appears that all of the flow behavior is determined in the nozzle. On the other hand, with the converging nozzle, it appears that the gas release began in the nozzle but the flow was determined external to it.
Flow Through Orifices
For several reasons it was decided to examine the flow through orifices, as well as nozzles. Orifices present a stronger pressure gradient and a freely expanding jet, and they represent more realistic physical situations, such as va!ves, pipe breaks, etc. Mechanically, they can be made more precisely, and the size of the flow chamber need not be related to the size of the orifice. They offer a sharp demarcation between the high- and low-pressure regions of the flow.
The first set of orifice-flow data were taken in the Lexan test section shown in figure 6 and discussed earlier. The flow was vertically downward. The orifice was located near the entrance of the test section and was followed by a squarecross-section channe! with a length-to-diameter ratio of 55 . The channel had Lexan plastic sidewalls along 80 percent of its length. Data were acquired for nitrogen concentrations of 0.62 and 0.02 cm3/g (saturated water and tap water, respectively) over a range of back pressures. The flow data are presented in table V. Selected frames from the motion pictures taken of these conditions are shown in figure 19. The motion pictures were a view of the entire channel length with lighting from the rear. This view does not offer much detail but does yield a good overview. For the water saturated with nitrogen, gas appeared in the flow discharging through the orifice at back pressures up through at least 1.41 MPa. At a back pressure of 3.10 MPa, there was no gas visible in the flow. Recall, the water was saturated with dissolved nitrogen at 4.2 MPa. The tap water, with only 2 percent by volume nitrogen, exhibited small amounts of gas in the discharge up through a back pressure of 0.55 MPa.
18

.17 2 9 .50 .73 .98 , 1.41.- 3.10
Back pressure, PB, MPa
Figure 19. - Effects of nitrogen concentration and back pressure on discharge through an orifice into a long channel in downward flow.
c W

Although it is not obvious in the single-frame photographs, the motion pictures showed considerable churning and oscillation parallel to the flow. The alternating light and dark spots are indicative of this oscillation. It was not clear from the films whether this was a buoyancy effect or an alternating compression and expansion of the flow.
The flow rates for these data are plotted in figure 20. In general, little comment can be made, because no pressures were measured in the downstream channel. The flow increases steadily as the back pressure is decreased, which is typical of subcooled liquids flashing through an orifice. The flow rates appear to be somewhat higher than one would normally expect. Using equation (1) with PB =Pt yields a flow coefficient CD ranging from 0.73 to 0.90, much higher than the usual 0.61. This will be discussed more with regard to the next set of data.
It would have been very difficult to turn the Lexan test section to flow vertically upward in order to assess the buoyancy. Also, the Lexan began to craze, and it was not certain whether it could continue to sustain the high pressure. Thus, an orifice of the same diameter as the one in the Lexan test section was installed in the sight-gage arrangement shown in figure 7. This test section was oriented so as to flow vertically upward. The motion-picture camera was moved in close for detail and traversed the length of the test section, as previously described in the Instrumentation section of this report. Extensive photographic and flow data were acquired for three
Nitrogen Storage-tank concentration Pressure,
in water, PT* N2' M Pa
cm? g 0 0.62 4.29 0 .@ 4.09
7 ,
3 I " L " L ". u u 0 . 5 1.0 1.5 2.0 2.5 3.0 3.5 4.0
Back pressure, PB, MPa
Figure 20. - Effects of nitrogen concentration and fluid back pressure on flow of water and dissolved nitrogen downward through a sharp-edged orifice discharging into a long, square channel. Stagnation temperature, To, zz 20' C.
nitrogen concentrations in upward flow. The flow data are presented in table VI.
A summary montage of the flow discharging through the orifice for the full range of conditions is presented in figure 21. The heavy, black, horizontal line is a gasket. The light !ine immediately above it is the downstream edge of the orifice plate (see fig. 7). In figure 21, the jet is visible only in the pictures of the flow with a nitrogen concentration of 0.02 cm3/g (tap water). In the other cases, the amount of gas and the churning obscure the jet. (For these pictures, the lighting was from the .front.) The size of the gas bubbles immediately downstream of the orifice seems to be independent of back pressure and nitrogen concentration. The back pressure at which the bubbles disappear is higher for higher concentration levels.
A complete view of the test section for each concentration level at various back pressures is shown in figures 22 to 24. Recall, the camera was traversed the length of the test section and the elapsed time was 10 to 12 seconds. The vertical composites in figures 22 to 24 represent about 50 percent of the total length. That is, every other picture has been omitted from each strip. The saturated case (fig. 22) shows bubbles up to a back pressure of 3.28 MPa. In general, the bubble population is clearly a function of back pressure. However, the bubble size does not appear to be nearly as affected by back pressure as one would expect. The motion-picture film showed considerable churning and, most important, strong vertical oscillations. This was a function of back pressure. The oscillations were strongest at the atmospheric back pressure. Most of the oscillation occurred near the orifice, say in the first 10 channel widths. By the time the flow reached the second chamber, everything was pretty calm. At low back pressure, the pictures for the case where the nitrogen concentration was half of saturated (fig. 23) were remarkably similar to the saturated case (fig. 22). However, at this intermediate concentration, the bubbles begin to disappear at about half the back pressure of the saturated case. The tap-water case (fig. 24) looks quite different. There is no appreciable amount of gas above a back pressure of 0.51 MPa. The water in the lines was usually at about 0.51 MPa. The water was saturated with air in the lines, and above the line pressure, no gas would come out of solution. At the higher pressures, what does come out appears to redissolve.
The flow data associated with these pictures are
20

3.28
1.49
.91
(D
.75 r n
2 a
.n =I _. L
v) W
n x 0
m" .53
1.48 . . ._
-93
.12
.51 .51
.11
.60
.23
.29
Nitrogen concentration, CN 2 , cm3/g
.11
.02
Figure 21. - Closeup view of discharge of water and dissolved nitrogen immediately downstream of the orif ice plate.
21

.11 .28 .53 .91 1.49 3.28
Back pressure, PB, MPa
Figure 22. - Traverse of channel downstream of orifice at various back pressures. Nitrogen concentration in water, CN 0.60 cm3/g (saturation level). 2’
22

.10 -23 .51 .93 1.48
Back pressure, Pg, !Pa
Figure 23. - Traverse of channel downstream of orifice at various back pressures. Nitrogen concentration, CN , 0.29 c d / g (50 percent of saturation level).
2

.i1 .B .51 .93
Back pressure, PB, MPa
Figure 24. - Traverse of channel downstream of orifice at various back pressures. Nitrogen concen- tration, CN 0.02 cmVg (tap water).
2'
24

shown in figure 25. Note that the data for all three nitrogen concentrations coincide. The flow does not appear choked, and it follows the standard equation for orifice flow of an incompressible fluid (eq. (l), with a C, =0.61). Curiously, when this test section was modified to incorporate the capacitance plates (see fig. 7), the flow rates changed, as shown in figure 26. The flow no longer followed the standard orifice- flow equation either in level or in trend. The flow rates were 25 to 30 percent higher than in the previous experiment. The flow coefficients ranged from about 0.75 at high back pressure to about 0.79 at low back pressure. Apparently, the downstream walls, being closer together, are affecting the discharging jet. Thus, even though the channel height was almost five times the orifice diameter, the walls appear to have channeled the flow slightly, reducing the amount of loss. This is similar to the flow-rate results observed in the Lexan channel (fig. 20).
Void-Fraction Measurements
As shown in figure 7, the walls of the orifice-in- sight-gage test section were modified to accommodate capacitance plates in an effort to get a picture of the void-fraction distribution. The capacitance data are presented in table VI1 and figure 27. As was pointed out earlier, the switching circuit
Nlrrogen Storage-tank concentration pressure,
in water. PT, 'N2, M Pa
cm34 0 0.60 4. 32 A .29 4.31 0 -02 4.28
Back pressure, PB, MPa
Figure 25. - Effect of nitrogen concentration and f luid back pressure on flow of water and dissolved nitrogen upward through a sharp-edged ori f ice discharging into a large, rectangular channel. Stagnation temperature, T, = 20° C.
8r
3 r 0 .5 1.0 1.5 2.0 2.5
Back pressure, PB, MPa
Figure 26. - Effect of nitrogen concentration and f luid back pressure on flow Jf water and dissolved nitrogen upward through 3 sharp-edged orif ice discharging into a rectangular channel with capacitance p!ates on the sidewalls. Nitrogen concentration, CN 0.64 cm3/p
storage-tank pressure, PT, 4.33 M P q stagnation temperature, To, =2@ C.
2'
Capacitance Location plate downstream
from ori f ice plate,
cm 1 2.8 2 6.8 3 13. 8 4 17.8 5 32. 6 6 45. 6
6 7
"
. .. -._ "3 ._ -1 -- 2
. 2 . 4 .6 .8 1.0 1.2 1.4 1.6 1.8 2.0 2.2 1 I 1 1 .I I . ~ L ~ I 1- "LJ
Back pressure, PB, MPa
Figure 27. - Capacitance level at various stations along channel as function of system back pressure for room- temperature water saturated with nitrogen gas at 4.36 MPa. Storage-tank pressure, PT: 4.30 to 4.36 MPa; ori f ice diameter, 0.209 cm; capacltance-plate size, 3 cm square.
could only switch three plates at a time, and there was a small cross-communication between adjacent plates. Thus, each condition was run twice-one with plates 1, 3, and 5 connected, the other with plates 2, 4, and 6. The significant dimensions appear on figure 27.
25

The results are presented in terms of capacitance level c/cw rather than void fraction a. Void fraction requires some knowledge of the flow regime. Cimorelli and Evangelisti (ref. 10) present curves of void fraction versus capacitance for various flow regimes, and there is a large variation from one regime to another. For bubbly, homogeneous flow, the relationship is only about 10-percent nonlinear. Since the motion pictures indicate a predominantly bubbly, homogeneous flow, it is probably a good first approximation for discussion purposes to assume that CY= 1 - (c/c,). This assumption is probably the least valid for the first plate location, which is immediately downstream of the orifice, where the jet has not yet broken up. On the other hand, if the data are presented in terms of c/c,, the reader is free to apply whatever model seems most appropriate. The reference-value c, was obtained by a daily, in-situ calibration of each plate with all-water (no voids) in the channel. The all-water condition was for water fully saturated with nitrogen at the system pressure (4.36 MPa). The variation in c, from day to day was negligible and from plate to plate was as much as 10 percent, probably representing variations in connections.
The results are quite interesting and appear to be consistent with the visual observations. At high back pressure, the results shown in figure 27 are consistent with expectations. The “void fractions’’ are low and steadily increase down the channel. The void fraction increases as the back pressure is decreased. This trend persists down to a back pressure of about 0.6 MPa, where the capacitances begin to fold over. At low back pressure, the reverse happens. The void appears to increase as the flow passes from plate 1 to 2; but then, as the flow goes from 2 to 3 and on down the channel, the void begins to decrease. Because of the jet, the void at plate 1 may not be linearly related to the capacitance. Thus, the true relationship from plates 1 to 2 is uncertain. However, as the flow progresses down the channel, it becomes more homogeneous, and the trend of decreasing void is probably valid. Thus, after a rather large initial evolution of gas, the bubbles appear to redissolve (or at least collapse). This is consistent with the pictures. This collapse is not accompanied by a rise in pressure. Since the gas must eventually come out of solution, these results suggest that at low back pressure there is an initial overexpansion, followed by a collapse of bubbles, and finally a second, probably slower, evolution of bubbles.
Nucleation These experiments do not yield details on the gas
nucleation mechanisms. However, some general remarks can be made from the results of the two experiments. While it is not obvious from single frames, such as in figure 10, the static- depressurization motion pictures indicate that the bubbles originated from the metal surfaces, especially the cylindrical screen. The bubbles maintain a cylindrical pattern as they rise in the pool. From some of the frames in figure 10 it appears that bubbles are also originating on the ladder shaped device and on the walls. Frequently in the depressurization transient, just before identifiable bubbles would appear, the window would get cloudy, like a film forming on the window. It is not clear whether this was related to nucleation, since bubbles never grew from the windows, but it did seem to signal a change.
Similarly, in the flow experiments, the bubbles appear to be nucleating from the edge of the nozzle throat walls (fig. 14(b)). Again, watching the motion pictures is much more informative than viewing a single frame. Unfortunately, even at 9OOO pps, the action could not be adequately stopped to identify individual bubbles.
The literature is not very helpful in this area. Most of the work on dissolved gases has focused on the influence of the gas on vaporization of the liquid, and generally the concentrations are low (refs. 11 to 13). Solutions for bubble growth rate which cover a wide concentration range, such as the work of Epstein and Plesset (ref. 14), assume the gas concentration stays constant relative to saturation, which is not the case in the depressurization experiment. The equations will have to be reformulated to include the growth rate due to pressure change as well as diffusion. This in turn will require a way of estimating the initial gas volume of the nuclei. The present experiments offer only end- point checks on these eventual calculations. The analysis will also have to agree with the fact that in the flow experiments the nozzle throat pressure was independent of gas concentration.
Summary of Results Static Depressurization
The static (or nonflow) test results, despite a relatively slow transient, yield some interesting
26

information on the process. Starting from the same initial pressure, it can generally be said that at any given pressure level in the transient there will be more bubbles present the lower the depressurization rate and the longer the bubbling time. Over the range of pressures investigated, the effect of depressurization rate is fairly strong. At the highest rate (0.50 MPa/sec), it was possible in some cases to reach P/P, =0.20 without the appearance of any bubbles; while at the slowest rate (0.09 MPa/sec), bubbles were routinely present at PIP, =0.30. Although the concentration measurements did show fairly short times to near saturation, it was possible to continue to add small quantities of dissolved gas to the water by bubbling over long periods. If the nitrogen concentration was slightly below saturation, the initial bubble evolution pressure was substantially lower.
The static tests also yielded some detail on bubble size. In general, the mature nitrogen bubbles are quite small, of the order of 0.1 to 1.0 millimeter in diameter; the majority of the bubble population was 0.25 to 0.50 millimeter in diameter. Bubbles formed early in the transient could grow to 2 to 3 millimeters. Bubbles tended to remain distinct and did not easily coalesce, even when the bubble density was very high.
Flow Through Nozzles
The flow of water containing dissolved nitrogen gas in a converging-diverging nozzle can be clearly shown to choke. In fact, it is not even necessary for the water to be saturated. Choking appeared to occur with concentrations as low as 4 percent of the saturation level. It was possible to vary the back pressure in the nozzle by a factor of 10 without affecting the flow rate or pressure profile upstream of the throat. In the converging-diverging nozzle, the throat pressure was very low, less than 1 atmosphere. A side result of this was that it was possible to compute the flow rate assuming all-water (no voids) flow through a nozzle with the pressure difference approximately equal to the stagnation pressure
In another nozzle, however, the results were somewhat different. This nozzle was a converging nozzle with an abrupt area change at the “throat,” and had glass sidewalls for visual capability. With the water saturated with nitrogen, no gas appeared ahead of the throat of the nozzle, but a significant volume of gas appeared downstream in the sudden expansion
(AP= Po).
region. The throat pressure (about 0.65 MPa) was much higher than with the converging-diverging nozzle. With a nitrogen concentration of only 0.02 cm3 /g (tap water), the flow rate and pressure profile were the same as with the nitrogen-saturated water, but the region downstream of the throat had only a small amount of gas. Also, the throat pressure (about 0.53 MPa) was slightly lower. In both cases, however, this nozzle also acted choked, and the flow rate could be computed on the basis of AP=Po -Pt. However, it appeared that the choking did not occur at the nozzle throat. Enlarging a downstream constriction in the flow passage changed the results such that the flow no longer appeared choked and could no longer be computed by @=Po -PI. It appears possible to have a sufficient pressure drop at one point to cause the gas to evolve and then have choking at a second point. This makes prediction of flow rate almost impossible.
Flow Through Orifices
Experiments were conducted with the water containing dissolved nitrogen gas discharging through a sharp-edged orifice into a long, visual channel. The results showed strong oscillations parallel to the flow in both vertically upward and downward flow. Detailed pictures were obtained by traversing the full length of the discharge chamber. The pictures indicate that bubble population is a direct function of back pressure, but bubble size is not strongly affected by back pressure. When the water was saturated with nitrogen at 4.2 MPa, bubbles appeared at back pressures up to 3.28 MPa. When the nitrogen concentration was cut in half the bubbles began to disappear at about half the back pressure.
The flow rates for the water and dissolved nitrogen discharging through a sharp-edged orifice into the largest channel (approx. 8 orifice diameters) could be calculated with the standard incompressible-fluid equation and a discharge coefficient of 0.61. When the downstream channel was narrowed to about 5 orifice diameters, the flow increased about 25 to 30 percent, and the discharge coefficient was no longer constant.
Finally, some capacitance measurements were made in the downstream channel of one of the orifice test sections. The results show that at high back pressure there is a steady and constantly increasing void fraction as the flow proceeds down the channel. At low back pressure, the reverse happens.
27

Immediately downstream of the orifice, the void appears to increase then decrease as the flow proceeds downstream. This overexpansion and subsequent collapse is consistent with oscillations seen in the motion pictures.
Lewis Research Center National Aeronautics and Space Administration Cleveland, Ohio, August 8, 1980
References 1. Linke, William F.: Solubilities, Inorganic and Metal-Organic
Compounds. Vol. 11. Fourth ed. American Chemical Society,
2. Simoneau, R. J.: Release of Dissolved Nitrogen from Water During Depressurization. NASA TM-73822, 1978.
3. Simoneau, R. J.: Pressure Distribution in a Converging- Diverging Nozzle During Two-Phase Choked Flow of Subcooled Nitrogen. Non-Equilibrium Two-Phase Flows, R. T. Lahey, Jr. and G. B. Wallis, eds., American Society of Mechanical Engineers, 1975, pp. 37-45.
4. Cha, Y. S.; and Henry, R. E.: Effects of Dissolved Ga$ and Downstream Geometry During Blowdown of a Subcooled Liquid. Fluid Transients and Acoustics in the Power Industry, C. Papadakis and H. Scarton, eds., American Society of Mechanical Engineers, 1978, pp. 95-104.
1958-1964.
5. Hendricks, R. C. and Simoneau, R. J.: Some Flow Phenomena in a Constant Area Duct with a Borda Type Inlet Including the Critical Region, ASME Paper 78-WA/HT-37, Dec. 1978.
6. Hendricks, R. C.: Some Aspects of a Free Jet Phenomena to 105 LID in a Constant Area Duct. NASA TM-79050. 1979.
7. Hendricks, R. C.: A Free Jet Phenomena in a 90-Sharp Edge Inlet Geometry. NASA TM-79229. 1979.
8. Hendricks, R. C.; and Poolos, N.: Critical Mass Flux Through Short Borda Type Inlets of Various Cross-Sections. NASA
9. Hendricks, R. C.; and Stetz, T. Trent: Some Flow Phenomena Associated with Alined Sequential Aperatures with Borda Type Inlets. NASA TP- , 1980.
10. Cimorelli, L.; and Evangelisti, R.: The Application of the Capacitance Method for Void Fraction Measurement in Bulk Boiling Conditions. Int. J . Heat Mass Transfer, vol. 10. Mar.
11. Cole, R.: Boiling Nucleation. Advances in Heat Transfer, Vol. 10, James P. Hartnett and Thomas F. Irvine, Jr.. eds., Academic Press, 1974, pp. 85-166.
12. Holl, J . W.: Nuclei and Cavitation. J . Basic Eng., vol. 92. no. 4, Dec. 1970, pp. 681-688.
13. Ward, C. A.; Balakrishnan, A.; and Hooper, F. C.: On the Thermodynamics of Nucleation in Weak Gas-Liquid Solutions. J. Basic Eng., vol. 92, no. 4, Dec. 1970, pp.
14. Epstein, P. S.; and Plesset, M. S.: On the Stability of Gas Bubbles in Liquid-Gas Solutions. J . Chem. Phys., vol. 18, no. 11, Nov. 1950, pp. 1505-1509.
TM-79017. 1979.
1967, pp. 277-288.
695-704.
28

TABLE I . - TWO-PHASE FLOW OF WATER A’ND DISSOLVED NITROGEN IN CONVERGING-DIVERGING NOZZLE IN DOWNWARD FLOW
Nitrogen :oncentration
in water, C
N2’
cm3/g
Flow rate,
:g/cm2-sec G,
Storage - tank
pressure,
pT’ M Pa
Stagnation pressure,
M Pa
Axial pressure distribution in test section, MPa Back pressure in discharge
chamber,
PB’ MPa
Reading
- 49 50 51 52 53 54 55 59 60 61 62 63 64 65 66
69 70 73 74 75 77
- p9
- 0.97
.66
.36
.05 1.40
.54
.06
.04
.06
.04
.26 1.12
,04 .33 -85
0.66 .06 .85 .06 .05 .66
-
-
- ’6
- 0.02
1 I .03 .02
.03
.02
I - 0.02
1 -
- p7
- ””
”“
””
””
””
””
””
0.02
1 .03 .02 .02 .02
0.02 -
1 -
- P8
- 3.03 .02 .02 .02 .05 .03 .02 .03 .02 .03 .07
1.11 .03 .07 .80
3.66 .04 .85 .04 .03 .62
-
-
- p1
- I . 02
t 5.02 j.02 4.64 I . 63 t . 63 i. 24 I . 24 i. 23
2.01 2.01 2.66 1.66 3.32 3.31
-
-
- p2
- 3.40
1 4.24 4.24 3.93 3.92 3.91 3.58 3.58 3.58 - 1.69 1.69 4.24 1.24 1.80 2.79 -
- p3
- 2.78
v 3.48 3.48 3.22 3.21 3.21 2.94 2.93 2.93
1.39 1.39 1.84 1.83 2.29 2.28
-
-
- p4
- 0.05
1 .06 .06 .07 .07 .07 .05 .05 .05
0.05 .05 .02 .02 .04 .02
-
-
P = P t 5 (T%roat
pressure)
0.62 (Saturated
at 4.24 MPa)
8.61 8.62 8.64 8.62 8.61 8.60 8.64 9.65 9.64 9.26 9.23 9.24 8.85 8.82 8.83
4.34
1 4.35 4.35 4.35 5.42 5.42 5.02 5.01 5.00 4.58 4.57 4.57
0.07
I .16 .ll .09 .10 .10 .09 .09 .09 .08 .08 .08
0.98 .67 .40 .13
1.41 .56 .13 .13 .18 .13 .36
1.14 .13 .39 .86
4.18
I 4.19 5.22 5.22 4.83 4.82 4.82 4.41 4.41 4.40
2.08 2.08 2.76 2.76 3.45 3.44
0.31 6.18 6.17 7.07 7.07 7.92 7.90
2.17 2.16 2.87 2.87 3.58 3.57
0.05
I .06 .05
0.66 .12 .86 .13 .13 .67

w 0
TABLE I. - Concluded.
Nitrogen zoncentration
in water,
%2’ cm3/g
0.31
0.02
Flow rate,
G , rg/cm -sec 2
7.25 7.26 8.21 8.19 9.37 9.39 8.53 8.51 8.77 8.75 8.71 6.60 6.59
7.21 7 .23 8.67 8 .65 8.61 5.78 5.75
Storage- tank
pressure,
PT’ MPa
3.05 3.05 3.94 3.94 5.06 5.05 4.21 4.19 4.45 4.41 4.39 2.57 2.57
2.94 2.92 4.24 4.23 4.23 1.82 1.82
Stagnation pressure,
M Pa
2.94 2.94 3.80 3.79 4.87 4.86 4.05 4.03 4.28 4.25 4.23 2.47 2.47
2.82 2.81 4.08 4.08 4.07 1.75 1.75
p1
- 2.83 2.83 3.65 3.65 4.68 4.68 3.89 3.88 4.12 4.08 4.06 2.38 2.38 - 2.72 2.71 3.92 3.92 3.91 1.69 1.68 -
Axial pressure distribution in test section, MPa
p2
- 2.38 2.38 3.08 3.07 3.95 3.94 3.28 3.27 3.47 3.44 3.43 2.01 2.00
2.28 2.26 3.29 3.29 3.28 1.40 1.40
-
-
- p3
- 1.95 1.95 2.52 2.52 3.23 3.22 2.68 2.67 2.84 2.81 2.80 1.65 1.64 - 1.85 1.83 2.68 2.67 2.66 1 . 1 2 1.1: -
- p4
- D.02
.02
.04
.02
.05
.03
.03
.02
.05
.04
.03
.07
.07 - 0.06
.02
I .01 .01 -
P = P 5 t (Throat
pressure)
0.05 .05 .07 .06 .08 .06 .06 -06 .09 .07 .07 .10 .09
0.08 .09 .09 .08 .07 .04 .04
’6
- 0.02
V - 0.02
V -
p7
- 1.02
V .03 .02 .02 .02 . O l .03
0.01 .02 . O l . O l . O l .36 .Ol
-
-
’8
- 3.17
.04
.03
.69
.03
.05
.04 1.06
.03
.04
.39
.03
.78 - 0.03
.63
. 0 3
.06
.65
.90
.03 -
p9
- 3.36
.05
.04
.73
.04
.22
.22 1.07
.04
.14
.59
.06
.79
0.04 .65 .04 .27 .71 .90 .07
-
-
r Back pressure in discharge chamber,
PB’ MPa
0.37 .13 .13 a73 .13 .34 .30
1.07 .13 .26 .60 .12 .79
0.11 .65 .ll .33 .71 .91 .10
Reading
79 80 81 83 85 86 90 92 93 94 95 96 98
99 101 102 10 3 104 108 109

TABLE JI. - TWO-PHASE FLOW OF WATER AND DISSOLVED NITROGEN IN VISUAL. CONVERGING NOZZLE IN DOWNWARD FLOW
Axial pressure distribution in test section, MPa
i 0.62 ~ 7.19 1 3.22 13.20 3.11 i (Saturated I 7.23 4.29 1 3.26 1 3.22 3.14 ~ a t4 .24 MPa) ~ 7.18 1 4.24 ' 3.21 ~ 3.18 13.09 I
I 7.19 11 4.23 i 3.21 i 3.18 7.01 6.78
4.23 ,' 3.26 1 3.23
; 3.21 4.22 1 3.24 7.04 ' 3.30 4.24 : 3.33
0.02 7.01 4.19 3.21
3.18 3.21 4.19 7.01 3.20 3.23 4.19 6.96 3.27 3.31 4.31 7.07 3.28 3.31 4.31 7.08 3.30 3.33 4.34 7.12 3.20 3.23 4.20 7.03 3.20 3.23 4.21 7 .OO 3.21 3.24 4.22 7.01 3.18 3.20 4.18 6.98 3.19
3.10 3.15 3.22 3.12 - 3.10 3.09 3.12 3.12 3.11 3.21 3.19 3.19 3.12 3.10 -
- 2.87 2.89 2.85 2.85 2.92 3.01 2.89 - 2.86 2.85 2.88 2.87 2.87 2.96 2.94 2.94 2.88 2.85 -
I. "
L
-r---r-i in discharge 1 I
y f i i '7 1 '8 '9 1 chamber, ~ I 1 (Throat I , I I
~ pressure) ~ I , PB' i ! MPa
1.46 0.64 0.48 1.47 1 .65 I .48 1.45 1 .66 i .49 1.45 j .65 ~ .49
1.59 I .83 ~
1.75 1.56 - 1.39 1.38 1.40 1.39 1.39 1.44 1.42 1.42 1.43 1.39 -
1.05 .82
0.54 .54 .55 .50 .50 .52 .52 .52 .56 .50
.67
.89
.92 - 0.64
.63
.65
.32
.32
.33 -33 .33 .37 .31 -
I I
- 1.45 1.46 1.46 1.45 1.61 1.77
.91
0.63 .63 .63
1.33 1.33 1.37 1.36 1.36 1.38 1.32
-
-
-r O.:; 1 . , .20 .87 .05 .87 I .45
1.04 1 .79 1.25 1.03
.90 .75
0.63 0 .11 .63 .22 .64 .10 .72 .35 .72 .46 .74 .09 .74 .74
.25
.46 .72
.57 .78
.39
I
36 37 38 39 40 41 42
116 117 118 119 120 121 122 123 124 125

TABLE III. - TWO-PHASE FLOW OF WATER AND DISSOLVED NITROGEN IN VISUAL, CONVERGING NOZZLE IN UPWARD FLOW
r Nitrogen :oncentration
in water,
CN2*
cm3/g
Orifice nowmeter pressure,
'or 9
MPa
Axial pressure distribution in test section, MPa Reading Back pressure in discharge
chamber,
PB' M Pa
0.12 1.49 2.11
.78
.20
.28
.38 3.52 3.77 2.76 2.13 1 .81
.51
.61 1 .24
.23
.17
0 .13 1.13
.35
.48
.82
Storage - tank
pressure,
PT' MPa
4.29 4 .31 4.32 4.30 4.28 4.27 4.27 4.30 4.36 4.34 4.32 4.31 4.27 4.28 4 .29 4.27 4.28
4.27 4.27 4.25 4.25 4.25
Flow rate,
G , kg/cm -sec 2
7 . 0 3 6.19 5.48 6.90 6.98 7.02 7.01 3.22 2.78 4.59 5.41 5.78 6.96 6.93 6.37 6.99 6.96
- p2
- 3.20 3.46 3.65 3.24 3.21 3.20 3.20 4.06 4.18 3.86 3.66 3.56 3.19 3.20 3.37 3.18 3.18
P = P t 6 (Throat
l ressure)
0.69 1 .51 2.10
.86
.70
.69
.69 3.50 3.76 2.76 2.14 1 .83
.68
.72 1.26
.68
.68
0.65 1.17
.64
.64
.87
P = P 1 0
Stagnation pressure)
3.23 3.48 3.67 3.28 3.24 3.23 3.23 4.07 4.19 3.88 3.68 3.58 3.22 3.23 3.40 3.21 3.21
3.22 3.37 3.20 3.19 3.26
4.22 4.25 4.27 4.22 4.22 4.21 4.21 4.28 4.34 4.30 4.27 4.26 4.20 4.20 4.21 4.19 4.19
3.12 3.39 3.59 3.16 3.12 3.11 3.11 4.03 4.15 3.82 3.60 3.50 3.10 3.12 3.30 3.10 3.10
2.90 3.23 3.47 2.96 2.90 2.89 2.89 3.98 4.13 3.73 3.47 3.35 2.88 2.89 3.11 2.87 2.87
1.46 2.11 2.60 1 .59 1.47 1.47 1.47 3.67 3.89 3.10 2.61 2.36 1.45 1.49 1.92 1.45 1.45
0.80 1.60 1.99
.96
.80
.80
.80 3.53 3.78 2.82 2.21 1.91
.79
.8? 1.36
.79
.78
3.78 1.59 2.61
.95
.79
.79
.79 3.53 3.78 2.82 2.20 1.90
. 7 7
.81 1.35
. 7 7
.77
3 . 7 7 1.57 2.22
.94
. 7 7
. 7 7
.77 3.52 3.77 2.80 2.19 1.90
.76
.80 1.3:
. 7 f
.7f
0.72 1.24
.7:
.7:
.9d
-
248 249 250 251 259 261 262 290 291 292 293 294 295 296 297 298 299
0.62 (Saturated
at 4.24 MPa)
0.37 7.12 6.57 7 -07 7.09 6.88
4.22 4.23 4.20 4.19 4.20
3.20 3.34 3.16 3.16 3.2:
3. l a 3.27 3. 08 3.08 3.1: -
2.86 3.06 2.83 2.89 2.92
1.4: 1.84 1.42 1.42 1.59
0.75 1 . 2 7
.7E
.7 :
.97
0.74 1.26
.74
.74
.96
25 3 254 255 256 257

TABLE 111. - Concluded.
T T Nitrogen Flow
pressure, pressure, in water, 1 G, flowmeter tank :oncentration rate,
Orifice Storage-
cN2 ,
MPa M Pa ’or’
2 PT, kg/crn -sec
cm3/g
Axial pressure distribution in test section, MPa Back pressure in discharge
chamber,
pB’ MPa
Reading
265 266 267 268 269 270 271 27 3 274
27 5 276 277 278 27 9 280 282 28 3 284 285 28 6 287 289
! I ‘ I
PI = P 0 (Stagnation pressure)
p2
- 3.17
I 3.16 3.20 3.19 3.22 3.61 - 3.18 3.17 3.16 3.14 3.14 3.17 3.27 3.32 3.44 3.68 3.81 4.09 3.72 -
p3
- 3.09 3.08 3.09 3.09 3.07 3.12 3.11 3.14 3.55
3.09 3.08 3.07 3.05 3.05 3.09 3.19 3.24 3.37 3.63 3.76 4.05 3.66
-
p5
- 1.42
I + 1.41 1.50 1.50 1.56 2.56 - 1.40 1.39 1.39 1.38 1.39 1.48 1.61 1.81 2.14 2.73 3.05 3.64 2.78
P = P (Throat 6 t
pressure)
p7 p9
-. 1.73 0.72
.72
.85
.90 . 9 2 ,
.82 .84
.83
I” 0.64 .I 0.74
- 2.85 2.85 2.85 2.84 2.84 2.88 2.88 2.91 3.41 - 2.86 2.85 2.84 2.82 2.83 2.87 2.97 3.05 3.21 3.51 3.69 4.01 3.55
3.20
1 3.19 3.23 3.23 3.25 3.63
0.12 .23 .30 .43 -52 .69 .69 .78
2.08
0.12 .21 .31 .40 .53 .67 .84
1.11 1.54 2.31 2.71 3.45 2.36
0.35
0.02
7.07 7.03
4.24
7.05
4.27 5.47 4.24 6.85 4.24 6.94
6.95 I 4.24 4.23 7.05 I 7.05
7.07 4.27 7.05 4.25 7.04 4.24 7.04 4.22 7 :04 4.22 6.91 4.22 6.83 4.26 6.52 4.24 6.05 4.24 5.14
4.27 4.62 4.26
4.30 5.09 4.37 3.54
4.20 4.20 4.19 4.19 4.18 4.19 4.18 4.19 4.23
4.21 4.19 4.18 4.16 4.15 4.16 4.23 4.19 4.19 4.22 4.24 4.35 4.26
1 .75 .74 .82
2.09
0.61 .60 .60 .60 .61 .72 .87
1.13 1.56 2.31 2.71 3.43 2.36
.75
.86
.85
.93 2.17
0.72 .71 .71 .71 .72 .82 .98
1.23 1.65 2.38 2.76 3.47 2.43
-
i “
(
L
3.21 3.20 3.19 3.17 3.17 3.20 3.30 3.35 3.46 3.69 3.82 4.10 3.73
W W

w P
TABLE JY. - TWO-PHASE FLOW OF WATER AND DISSOLVED NITROGEN IN CONVERGING NOZZLE WITH ENLARGED EXIT IN UPWARD FLOW
r l- Nitrogen
:oncentration in water,
si cm /g
3
Flow rate,
G, rg/cm2-sec
Storage- tank
r e s s u r e ,
PT' M Pa
Orifice Zowmeter pressure,
'or * MPa
Axial pressure distribution in test section, MPa leading 3ack pressure in discharge
chamber,
PB' MPa
0.11 .21 .35 .54 .86
1.37 3.29 2.15
.13
.18
.25
.59
.42
.32
0.13 .30 .46
1.56 1.96 3.86
-
- 3.21 3.20 3.20 3.23 3.33 3.47 4.06 3.69 3.25
1 3.23 3.2t
3.1: 3.U 3. l! 3.4! 3.62 4.U
-
P1 = Po Stagnation pressure)
P = P t 6 (Throat
r e s su re )
0.14 .13 .22 .28 .61
1 .15 3.21 1.98
.18
.16
.16
.32
.24
.20
0.17 .23 .19
1 .35 . 1.76 3.80
0.58 4.27 4.25 4.23 4.24 4.25 4.26 4.31 4.28
I 4.23 4.21 4.21
3.12 3.11 3.11 3.13 3.23 3.39 4.01 3.64 3.17 3.17 3.18 3.18 3.14 3.12
3.07 3.1C 3.11 3.4: 3.5f 4. l'i
-
2.85 2.84 2.84 2.88 3.00 3.19 3.94 3.49 2.89 2.90 2.90 2.91 2.87 2.86
2.80 2.83 2.85 3.24 3.40 4. If
-
1.15 1.14 1.17 1.24 1.49 1.91 3.52 2.55 1.15 1.15 1.16 1.26 1.18 1.1E - 1 . l a 1 . 1 2 1 . 1 6 2.05 2.37 3.94
0.04 .04 .25 .37 .71
1.24 3.24 2.06
.04
.04
.o:
.If
. OE
. O f
0.1: .04 .OE
1.4: 1.8: 3.8:
-
0.04 .04 .24 .35 .69
1.24 3.25 2.05 ""
""
""
""
""
- ""
0.14 .06 .07
1.43 1.83 3.83
).50 .58 .23 .34 .67
1.22 3.23 2.05
.49
.56
.59
.50
.50
.56
0.13 .57 .47
1.41 1 .83 3.82
-
419 420 421 422 42 3 424 425 426 440 441 442 445 446 447
7.16 7.10 7.07 6.99 6.68 6.16 3.68 5.27 7.04 7.02 7.01 6.84 6.90 6.94
7.06 7.07 7.03 5.94 5.51 2.44
4.28 4.27 4.25 4.25 4.26 4.26 4.30 4.28
I 4.24 4.23 4.22
4.25 4.28 4.29 4.28 4.29 4.32
3.23 3.22 3.21 3.23 3.33 3.48 4,04 3.69 3.28 3.29 3.29 3.29 3.25 3.24
3.18 3.22 3.23 3.52 3.64 4.19
0.29 4.20 4.24 4.24 4.23 4.25 4.32
429 430 431 432 433 434

TABLE IV , - Concluded.
T T Storage-
tank pressure,
pT' M Pa
Orifice flowmeter pressure,
'or* MPa
Axial pressure distribution in test section, MPa Reading Flow rate, G ,
kg/crn -sec 2
3.83 6.56 6.91 6.81
Back pressure - chamber, '9
in discharge
PB' MPa
3.12
.69 .47
.58 .34
.96 .78 3.18
0.09 0.12 .12 .26 .16 .37 .21 .44 .32
.84 .66
.65 .45
.55
2.45 2.57 1.58 1.72 1.11 1.27
Nitrogen concentration
in water, p4 p7 '8 P = Po P3 P2 1 (Stagnation pressure)
P5 P = Pt 6 (Throat
pressure)
3.39
.42 1.33
.32 1.25
.71 1.55 3.09
1.09 0.18 1.08 .12 1.10 .14 1.13 .22 1.22
1.03 1.80 1.51 2.17 2.42 2.87 .59 1.45 .38 1.29 .28
CN2' 3 cm /g
4.31 4.28 4.27 4.2'7
4.30 4.23 4.20 4.21
3.87 3.02 2.87 2.91
3.13 .80 .37 .51
3.13 .79 .36 .49
435 436 437 4 38
I 0.29
4.00
3.17 3.23 3.27 3.13 3.20 3.24 3.25 3.33 3.35 3.96 3.98
3.21
3.34 3.41 3.45 3.50 3.55 3.56 3.77 3.80 3.83 3.20 3.27 3.30 3.15 3.21 3.25 3.10 3.18 3.21 3.08 3.16 3.19 3.08 3.16 3.20 3.08 3.16 3.19 3.09 3.17 6.99
6.96 6.96 6.87 6.81 6.70 6.51 4.65 5.66 6.12
4.20 4.17 4.17 4.16
4.20 4.17 4.16 4.16 4.15 4.15 4.15 4.26 4.22 4.20
2.82 2.81 2.81 2.81 2.55 2.89 2.96 3.64 3.32 3.14
0.10 .13 .17 .23 .36 .48 .69 2.48 1.60 1.13
""
""
""
""
""
""
""
"_ ""
""
448 450 451 452 45 3 454 455 456 457 458 L I
f 4.24 4.22 4.21
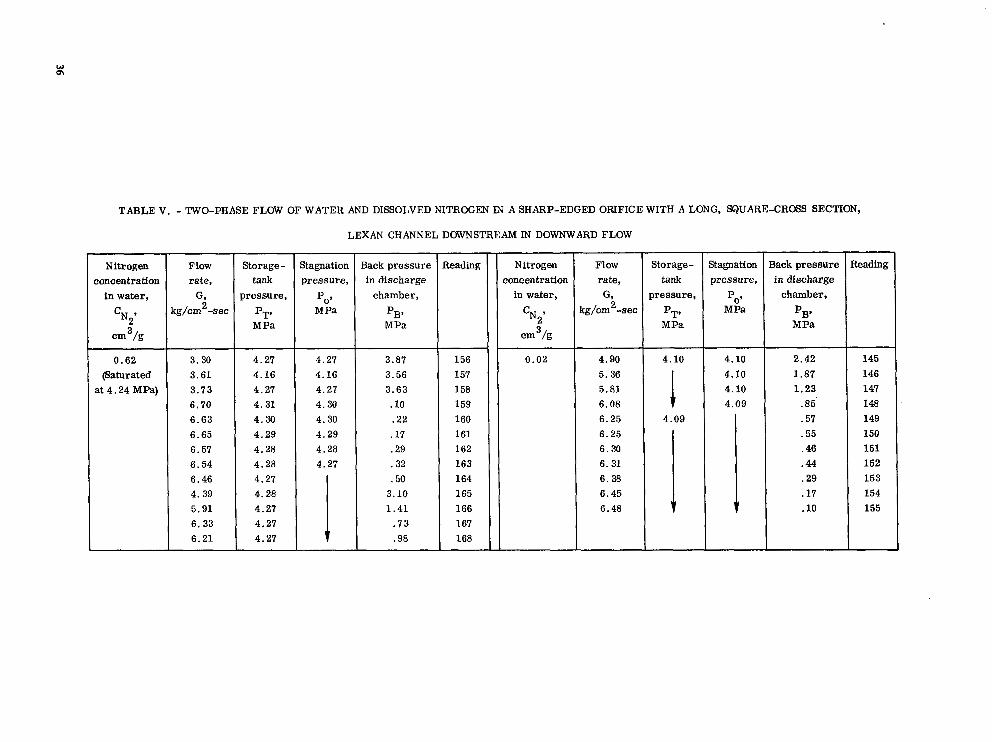
TABLE V. - TWO-PHASE FLOW OF WATER AND DISSOLVED NITROGEN IN A SHARP-EDGED ORIFICE WITH A LONG, SQUARE-CROSS SECTION,
Nitrogen concentration
in water,
CN2’
em 3/g
0.62 @Saturated
at 4.24 M a )
Flow tank rate,
Storage-
G, pressure, rg/cm -sec
M Pa PT,
2
3.30 4.16 3.61 4.27
4.27 6.21 4.27 6. 33 4.27 5.91 4.28 4.39 4.27 6.46 4.28 6.54 4.28 6.57 4.29 6.65 4.30 6.63 4.31 6.70 4.27 3.73
LEXAN CHANNEL DOWNSTREAM I 3 DOWNWARD FLOW
Stagnation pressure,
MPa
4.27 4.16 4.27 4.30 4.30 4.29 4.28 4.27
1
Back pressure in discharge
chamber,
PB’ M Pa
3.87 3.56 3.63 .IO .22 . 17 .29 .32 .50 3.10 1.41 .73 .98
Reading
156 157 158 159 160 161 162 163 164 165 166 167 168
Nitrogen concentration
in water,
%2’ cm3/g
0.02
Flow tank rate,
Storage-
G, pressure, cg/cm -see
M Pa PT,
2
4.90 5.36
4.10
5.81 1 6.08
6.38 6.31 6.30 6.25
4.09 6.25
1 6.48 6.45
Stagnation pressure,
MPa
4.10 4.10 4.10 4.09
v
Back pressure in discharge
chamber,
PB’ MPa
2.42 1.87 1 . 2 3 .85 .57 .55 .46 .44 .29 .17 .10
Zeadlng
145 146 147 148 149 150 151 152 153 154 155

TABLE VI. - TWO-PHASE FLOW OF WATER ANDDISSOLVED NITROGEN IN A SHARP-EDGED ORIFICE DISCHARGING
INTO A LARGE, RECTANGULAR CHANNEL WITH GLASS SIDEWALLS
Nitrogen concentration
in water,
0.60
Flow rate,
G, kg/cm -sec 2
5.62 5.64 5.57 5.55 5.49 5.41 5.36 5.27 5.24 5.15 4.96 4.68 4.33 4.04 3.66 3.28 2.84 3.34 2.35 1.74
Storage- tank
Iressure,
pT' M Pa
4.33 4.30 4.30 4.34
1 4.32
/ 4.31 4.31 4.32 4.32
Orifice flowmeter pressure,
'or 9
MPa
TI
4.31 4.28 4.27 4.32 4.32 4.31
1 4.29
1 4.28 4.29 4.28 4.28 4.28 4.29
3xial pressure distribution in test section, MPa -L P1 = Po
(Stagnation pressure)
4.30 4.26 4.26 4.30 4.30 4.30 4.29 4.29 4.29 4.27 4.27 4.28
I 4.27 4.27 4.28 4.28
P2 = Pt (Throat
pressure)
0.09 .09 .15 .25 .40 .50 .58 .72 .78 .87
1.12 1.46 1.80 2.14 2.53 2.86 3.19 2.79 3.54 3.85
p3
- 0.11 .ll .18 .29 .43 .54 .61 .75 .81 .90
1.15 1.49 1 .83 2.16 2.55 2.87 3.20 2.80 3.54 3.85 -
p4
0.12 .12 .19 .29 .44 .54 .62 .76 .82 .91
1.15 1.49 1 .83 2.17 2.55 2.88 3.21 2.81 3.55 3.87 -
3.12 .12 .18 .28 .43 .53 .61 .75 .81 .90
1.14 1.48 1 .83 2.16 2.54 2.87 3.20 2.80 3.54 3.85 -
Back pressure ~ Reading I
in discharge chamber, ~
I
pB' MPa
0.11 .ll .18 .28 .43 .53 .61 .75 .81 .91
1.16 1.49 1.84 2.18 2.56 2.89 3.21 2.82 3.56 3.87
323 324 325 328 329 330 331 332 333 334 335 336 337 338 3 39 340 341 342 .
343 344

TABLE VI. - Continued.
r- Nitrogen concentration
in water,
I cm cNg' 3/g
t 0.29
L
Flow rate,
G, rg/cm -sec 2
5.54 5.56 5.62 5.77 5.75 5.58 5.60 5.77 5.73 5.58 5.54
5.73 5.64 5.62 5.54 5.62 5.60 5.48 5.42
Storage- tank
pressure,
PT' M Pa
4.31 4.31 4.31 4.34 4.34 4.33 4.33 4.30
I 4.32 4.32 4.31 4.31 4.30 4.30 4.32 4.32
Orifice flowmeter pressure,
Po,* M Pa
4.28 4.28 4.28 4.35 4.35 4.34 4.33 4.31 4.31 4.30 4.30
4.31 4.30 4.30 4.29 4.29 4.28 4.30 4.30
~~~~~ ~ ~~~
Axial pressure distribution in test section, MPa
PI = Po (Stagnation pressure)
4.26 4.26 4.26 4.33 4.33 4.32 4.32 4.29
4.29 4.29 4.28 4.28 4.27 4.2'7 4.29 4.28
P = P t 2 (Throat
pressure)
0.28 .14 .ll .08 .08 .43 .43 .08 .08 .42 .43
0.08 .18 .22 .41 .15 .20 .47 .59
- p3
- 0.31
.17
.14
.10
.10
.46
.46
.10
.10
.45
.46
0.11 .22 .26 .45 .18 .23 .51 .63
-
-
- p4
- 0.32
.17
.15 ""
""
""
""
""
""
""
""
- 0.11
.22
.26
.45
.18
.24
.51
.63 -
0.31 .17 .15 . 11 . 11 .46 .45 .ll .ll .44 .46
0.11 .21 .25 .44 .18 .23 .50 .62
3ack pressure in discharge
chamber,
PB' MPa
0.30 .16 .14 .10 . l o .46 .45 .ll .10 .44 .46
0.10 .21 .25 .45 .17 .23 .51 .63
leading
347 349 350 400 40 1 40 2 40 3 404 40 5 40 6 407
351 352 353 354 355 356 357 358

TABLE VI. - Continued.
Nitrogen concentration
in water,
2’
cm3/g
0.29
Flow rate,
Gl kg/cm -sec 2
5.37 5.31 5.23 5.08 5.07 4.76 4.46 4.11 3.80 3.42 3.01 2.54 1.83 5.59 5.67 5.72
Storage- tank
pressure,
PT’ MPa
4.32
1 I
4.31 4.31 4.31 4.32
4.31 4.31 4.31
Orifice tlowmeter pressure,
’or 9
MPa
4.30
1 4.29
I 4.30 4.29 4.29 4.29
T ,Axial pressure distribution in test section, MPa
P1 = Po (Stagnation pressure)
4.28 4.28 4.28 4.29 4.28
I 4.29 4.29 4.27 4.27 4.27
P = P t 2 (Throat
pressure)
0.68 .78 .89
1.09 1.10 1.45 1.80 2.16 2.48 2.82 3.18 3.51 3.88
.28
.ll
.08
p3
- 0.72
.82
.92 1.13 1.13 1.48 1.83 2.18 2.50 2.84 3.19 3.52 3.88
.32
.15
.ll -
p4
- 0.72
.82
.93 1.13 1.14 1.48 1.83 2.18 2.50 2.85 3.20 3.52 3.89
.32
.15
.ll -
p5
0.71 .81 .92
1.12 1.13 1.47 1.83 2.17 2.50 2.84 3.19 3.51 3.88
.32
.15
. 11
Back pressure Reading in discharge
chamber,
PB’ MPa
0.72
361 .93 360 .82 359
1.13 362 1.14 36 3 1.48 364 1.84
368 2.85 367 2.51 366 2.19 365
37 1 3.90 370 3.53 369 3.21
.32 37 2
.14 37 3
.10 37 4

TABLE VI. - Concluded.
Nitrogen concentration
in water,
CN2*
cm 3 / g
0.02
~
Flow rate,
G , cg/cm -sec 2
5.57 5.03 4.74 4.44 4.14 3. a2 3.39 2.95 2.49 1.89 5.74 5.60 5.51 5.48 5.34 5.31 5.20 5.58 5.65 5.65 5.58 5.69
Storage- tank
pressure,
pT' MPa
4.28
1 4.29 4.28 4.29 4.29 4.29 4.28 4.28 4.28 4.28 4.27
I I
4.26
Orifice flowmeter pressure,
'or, MPa
4.29
v 4.28 4.27 4.27 4.27 4.26
I 4.25 4.25 4.24 4.24
3xial pressure distribution in test section, MPa
P = P 1 0
(Stagnation pressure)
4.27 4.27 4.27 4.28 4.28 4.28
4.28 4.28 4.28
4.27
4.26 4.26 4.26 4.26 4.25
I 4.24 4.23 4.23 4.23
P = P 2 t (Throat
pressure)
0.35 1.09 1.44 1.79 2.13 2.49 2. a4 3.19 3.53 3. €36
.07
.25
.36
.47
.67
.67
.89
.23
. oa
. 18
. oa
.12
p3
0.39 1 . 1 3 1.47 1.82 2.16 2.51 2.86 3.21 3.54 3. a7
.2a
.10
.39
.51
.71
.71
.92
.27
.10
.15
.21
.10
p4
""
""
""
""
""
""
""
""
""
""
""
0.28 .39 .50 .71 .71 .92 .26 .10 .15 .21 .10
p5
3.37 1.11 1.46 1 .81 2.15 2.50 2. a4 3.19 3.53 3. 86
.10
.27
.39
.50
.70
. 7 0
.91
.26
.10
.15
.21
.10
Back pressure in discharge
chamber,
PB' M Pa
0.38 1.12 1.47 1 .81 2.16 2.51 2.86 3.21 3.54 3.88
.10
.29
.40
.51
.72
.72
.93
.28
.ll
.16
.22
.ll
ieading
384
38 6 387 388
385
389 390 391 392 393 394 408 409 410 411 412 41 3 414 415 416 417 418

TABLE VII. - TWO-PHASE FLOW OF WATER AND DISSOLVED NITROGEN IN A SHARP-EDGED ORIFICE DISCHARGING INTO A RECTANGULAR CHANNEL
WITH CAPACITANCE PLATES ON THE SIDEWALLS
concentration in water,
j CN2, kg/cm2-sec
(Saturated
. 6.38
6.95 6.78 6.70 6.32 6.89 6.77 6.06 5.32 4.90 5.37 5.83 6.21 6.32 6.63 6.69 6.83 6.91 7.12
aSignal noisy.
tank pressure,
pT'
'1 I 4.34
M Pa
4.32 4.32 4.32 4.31 4.31 4.31 4.30
4.31
4.36
flowmeter
i
Capacitance level, c/cw I Reading I
i I
4.31 4.31 4.31
4.28 4.29 4.28 .64 4.28
4.27 1 4.27 .90 .90 .98 .96 4.28
.31 .34 .20 .19
.56 .58
.12 .14 .31 .30
.40 .40 .53 .50
.48 .49 .61 .58
.62 .62 .73 .70
.75 .76 .85 .83 4.34 4.35 1.01 1 .01 1 .09 1 .06 1.11 1.11 1.18 1.16 1.50 1.50 1.54 1.53 1.86 1.86 1.88 1.87 2.20 2.21 2.22 2.21 4.36 4.36 1.82 1 .83 1 .86 1.85 4.29 4'. 29 1.20 1.20 1.27 1 .25 4.28
.47 .48
I 1
0 .11 .33 .55 .90 . l l .36 .56 .91 .20 .48
1 . 2 1 1.84 2.21 1.86 1.50 1.20 1.01
.75
.62
.48
.39
. ll
1, 3, 5
1, 3, 5
0.51 .77 .89 .96 .29 .79 .88 .94 .60 .85 .97
1.00 1.00
.99
.99
.97 , .96 1 . 93 ~ .90
.85
.82 ~ .52
0.44 .82 .90 .96 .53 .84 .89 .95 .71 .88 .97
1.00 1.00
-99 .99 .97 .96 .93 .92 ,87 .85
a. 48
0.58 1 465 i .82 466 ,: .go ~ 467 i .96 468 '
.58 469
.83 470
.89 471
.94 472
.72
475 .97 474 .88 473
1.00 476 .99 502 .99 503 .97 504 .96 505 .95 506 .92 507 .90 508 .88 .85
509
511 .59 510

R
TABLE VII. - Continued.
Flow rate,
G , ig/cm -sec 2
itorage- tank
ressure,
pT' M Pa
Orifice lowmeter pressure,
'or' MPa
bial pressure distribution in test section, MPa Zapacitance level, c/cw leading 3ack pressure in discharge
chamber,
PE' M Pa
0.16 .31 .25 .26 .21 .ll
.17
.29
.31
.45
.56
.ll 2.22 1.50 1 .01
.79
.46
.16
.22
.ll
Eapacitance plates used
Nitrogen :oncentration
in water,
%2' cm 3/9
0 .64 (Saturated
at 4.36 MPa)
p3
- 0.35
.46
.41
.43
.40
.32
.36
.44
.46
.59
.69
.32 2.24 1.55 1 .10
.90
.60
.36
.41
.32 -
p4 Plate 1 or 2
Plate or 4
- 0.63
.80 .75 .77 .72
a. 48 .64 .80 .82 .88 .91 .53
1.00 .99 .96 . 9 3 .88 .66 .75
a. 53 -
Plate , or 6
P = P o 1 (Stagnation pressure)
P = P (Throat
2 t
Iressure)
0 .31 .44 .36 .41 .37 .32 .33 .42 .45 .58 .68 .32
2.23 1.54 1.09
.88
.59
.34
.38
.33
7.17 6 .99 7 .05 7 .03 7.12 7 .11 7 .13 7.06 7 .03 6.88 6 .82 7.15 4.94 5.81 6.36 6.61 6.86 7.11 7.04 7.18
4.34 4.34 4 .33
I 4.34 4 .33 4.34 4.33 4.33 4 .33 4.34 4.33
1 4.33
) .18 .32 .27 .28
.23 .14 .17 .30 .33 .47 .57 .14
2.21 1.50 1 .02
.79
.48
.18
.24
.14 -
0.16 .32 .25 ,277 .22 .12 .19 .29 .32 .46 .56 .12
2.21 1.50 1.01
.79
.47
.17
.23
.12 -
0.59 .75 .70 .72 .66 .54 . 5 1 .75 .78 .85 .88 .29
1.00 .99 .96 .94 .85 .51 .66 .29 -
4.36
'I 4.37
4.35 4.35 4.35 4.34 4.34 4.34 4.35
1 4.34 4.34 4.35 4.34
t
0.68 .81 .77 .78 .75 .59 .68 .79 .81 .86 .88 .56 .99 .97 .95 .92 .86 .67 .74 .58
512 513 514 515 516 517 518 519 520 521 522 523 524 525 526 527 528 529 530 531

TABLE VII. - Concluded.
Nitrogen :oncentration
in water,
CNZ'
cm3/g
Flow rate, G,
cg/cm2-sec
Storage- tank
pressure,
pT' MPa
Orifice tlowmeter pressure,
'or' MPa
bial pressure distribution in test section, MPa Capacitance plates used
Zapacitance level, c/cw Back pressure in discharge
chamber,
PB9 M Pa
0.86 .65 .18 .14 . 22 .41 .35 .28
.42
. 72
.66
.24
.14
. I 3
.41
.I8
.24
.32
.31
Reading
532 533 534 535 536 537 5 38 539 540 541 542 543 544 545 546 548 549 550 551
- Plate 1 or 2
- 1.96 .92 .62 .58 .69 .83 .79 .75 .83 . .93 .91 .69 .41 .38 .84 .54 .68 .76 .76 -
- Plate j or 6
- Plate 3 or 4
- 0.94
.92 '. 66 a. 58
.75
.06
.83 a. 80
.86
.93
.91
'. 62 a. 75
a. 59 .86 .68 .75 .82 .82 -
P1 = Po (Stagnation pressure)
P2 = P (Throat
t
pressure)
0.91 .71 .31 .30 .35 .52 .46 .40 .53 .80 .76 . 38 .32 .32 .54 .35 .38 .46 .45
0.64 (Saturated
at 4.36 MPa)
6.36 6.60 7.00 7.05 6.96 6.80 6.88 6.97 6.78 6.58 6.63 7.09 7.14 7.16 6.87 7.08 7.07 6.98 6.99
0.96 .77 .37 .36 .40 .57 .52 .46 .58 .85 .80 .43 .37 .37 .58 .40
.43
.50
.49
0.86 .65 .19 .15 .24 .42 .36 .29 .43 . 7 2 .67 .26 .16 .15 .42 .20 . 25 .34 .32
3.86 .65 .I8 .15 .23 .41 .35 .28 .42 .72 .66 .25 .15 .14 .41 .18 .24 . 32 .31
0 .94 .92 .71 .67 .76 .88 .83 .81 .88 .92 .92 .76 .64
'. 63 .85 .69 .76 .82 .a2
4.32
I I
4.31
4.30
v
4.34 4.34 4.33 4.33 4.32 4.32 4.31
1 4.30
t
4.33 4.32 4.32 4.31 4.31 4.30
1 4.29
I 4.28
1, 3, 5
v 2, h, 6
v 'Signal noisy.
w P

1. Report No. 2. Government Accession No. 3. Recipient's Catalog No.
NASA TP-1839 I I 4. Title and Subtitle I 5. Report Date
DEPRESSURIZATION AND TWO- PHASE FLOW OF WATER CONTAINING HIGH LEVELS OF DISSOLVED NITROGEN GAS 506-24 -16
7. Authods) I 8. Performing Organization Report No.
Robert J. Simoneau E- 216 10. Work Unit No.
9. Performing Organization Name and Address
National Aeronautics and Space Administration Lewis Research Center
11. Contract or Grant No.
Cleveland, Ohio 44135 13. Type of Report and Period Covered
12. Sponsoring Agency Name and Address
National Aeronautics and Space Administration Washington, D. C. 20546
I Technical Paper
I 14. Sponsoring Agency Code
I 15. Supplementary Notes
16. Abstract
Experiments were conducted to study depressurization of water containing various concentrations of dissolved nitrogen gas, the primary case being room-temperature water saturated with nitrogen at 4 MPa. In a nonflow depressurization experiment, water with very high nitrogen content was depressurized at rates from 0.09 to 0.50 MPa per second and was filmed with a high-speed motion-picture camera. The pictures showed a metastable behavior which was a strong function of the depressurization rate. The nitrogen bubbles rarely appeared before the pressure reached half of the initial pressure. Flow experiments were performed in an axisymmetric, converging-diverging nozzle, a two-dimensional, converging nozzle with glass sidewalls, and a sharp-edge orifice. Depressurization gradients were roughly 500 to 1200 MPa p e r second. The converging-diverging nozzIe exhibited choked flow behavior even at nitrogen concentration levels as low as 4 percent of the saturation level. The flow rates were independent of concentration level. Flow in the two-dimensional, converging, visual nozzle appeared to have a sufficient pressure drop at the throat to cause nitrogen to come out of solution, but choking occurred further downstream. The orifice- flow motion pictures showed considerable oscillation downstream of the orifice and parallel to the flow. Nitrogen bubbles appeared in the flow at back pressures as high as 3.28 MPa, and the level at which bubbles were no longer visible was a function of nitrogen concentration. In most cases, the flow rate could be computed by using a standard incompressible equation with appropriate flow coefficient, if the throat pressure were known. Capacitance measurements indicated that at low back pressure, the flow actually overexpanded and recollapsed, which was consistent with visually observed oscillations.
7. Key Words (Suggested by Author(s1I 18. Distribution Statement
Two-phase flow; Choked flow; Critical flow; STAR Category 34 Dissolved nitrogen; Dissolved gases; Nozzles; Unclassified - unlimited
Orifices; Depressurization; Water
9. Security Classif. (of this report) 22. Price' 21. NO. of Pages 20. Security Classif. (of this page)
Unclassified A03 45 Unclassified
* For sale by the National Technical information Service, Springfield, Virginia 22161
NASA-Langley, 1981

National Aeronautics and Space Administration
Washington, D.C. 20546
THIRD-CLASS BULK RATE Postage and Fees Paid National Aeronautics and Space Administration NASA451
Official Business Penalty for Private Use, $300
. .". ." .~ . . - .. .. . . . . . ~ . . . .
2 1 1 U , D , 070881 S00903DS CEP? OF THE AIR FORCE AF WEAPONS LABORATORY ATTN: TECt INICAL L A B B A B Y (SUL)
~. KIRTLANC A F B N M 87177
POSTMASTER: If Undeliverable (Section 1 5 8 Postal Manual) Do Not Return