Dependence and Independence in Responding to Double ... · Dependence and Independence in...
15
Journal of Experimental Psychology: Human Perception and Performance 1986, Vol. 12, No. 4, 549-563 Copyright 1986 by the American Psychological Association, Inc. 0096-1523/86/100.75 Dependence and Independence in Responding to Double Stimulation: A Comparison of Stop, Change, and Dual-Task Paradigms Gordon D. Logan Purdue University Jacqueline Burkell University of Western Ontario, London, Ontario, Canada When a letter and a tone are presented in rapid succession, there is substantial interference if both require an overt response (the dual-task paradigm), but there is very little interference if the tone is a signal to inhibit the response to the letter (the slopping paradigm). These effects were replicated under common stimulus conditions in two experiments, and they were compared with effects in a change paradigm, in which the tone required an overt response, like the dual-task paradigm, but was also a signal to inhibit the response to the letter, like the stopping paradigm. In the change paradigm, the overt response to the tone suffered interference only if subjects failed to inhibit the concurrent response to the letter; inhibiting the response to the letter virtually eliminated the inter- ference. The results suggest that differences in response competition are primarily responsible for differences in interference between the dual-task and stopping paradigms. More generally, the results support response-competition interpretations of dual-task interference. In a typical dual-task experiment, people are presented with two stimuli in rapid succession and are required to respond to each stimulus as quickly as possible. Typically, there is substan- tial interference between the two tasks, particularly when the delay is short (see, e.g., Kahneman, 1973; Kantowitz, 1974; Welford, 1952). The interference is typically explained by models that assume strong dependence between tasks, due to competition for common resources or access to common pro- cessing mechanisms (e.g., Navon & Gopher, 1979; Schwiekert &Boggs, 1984;Wickens, 1984). However, much of the interfer- ence can be removed by simply changing the instructions: A stop-signal experiment can involve the same stimuli and the same delays as a dual-task experiment, but the second stimulus tells the subject to inhibit the response to the first stimulus. As in the dual-task paradigm, each stimulus requires a distinct re- sponse, but there is virtually no interference between the two tasks (see, e.g., Logan, Cowan, & Davis, 1984). Performance in the stop-signal paradigm can be modeled accurately by assum- ing complete independence between the processes that respond to the go signal and those that respond to the stop signal (Logan & Cowan, 1984; Oilman, 1973). The purpose of this article is to explore this remarkable difference in interference in more detail. First, an attempt will be made to account for the difference in interference in terms of response competition, and response competition effects will be contrasted with the effects of competition for more central resources. Then the dual-task paradigm will be compared with the stopping paradigm directly, to replicate the differences in interference while using exactly the same stimuli and delays and using subjects from the same population. This has not been done in previous experiments, and the difference in interference would be less remarkable if it were due to subtle differences in the procedures of typical dual-task and stop-signal experi- ments. Finally, dual-task and stop-signal performance will be compared with performance in a change paradigm, in which there are two stimuli presented in rapid succession, and the sec- ond stimulus requires subjects to inhibit their responses to the first stimulus, like the stop-signal paradigm, and it also requires an overt response, like the dual-task paradigm. Thus, the change paradigm shares some features with the stop-signal par- adigm and other features with the dual-task paradigm. It repre- sents a procedural "bridge" that allows us to assess more di- rectly the contrasting roles that response competition plays in the two paradigms. Portions of the data were reported at the annual meeting of the Psy- chonomic Society, San Antonio, Texas, November, 1984. This research was supported by Grant U0053 from the Natural Sci- ences and Engineering Research Council of Canada and Grant BNS 8510365 from the National Science Foundation to Gordon Logan. We would like to thank Richard Schweikert for help with the curve fitting and Greg Riegler for help with the data analysis. We are grateful to Bill Banks, Steve Keele, and Chris Wickens for comments on the article. Correspondence concerning this article should be addressed to Gor- don D. Logan, who is now at the Department of Psychology, University of Illinois, 603 East Daniel Street, Champaign, Illinois, 61820. Response Competition in Dual-Task and Stopping Paradigms In general, response competition theories claim that the ma- jor bottleneck in processing occurs at the stage of selecting and executing responses. The basic idea underlies late-selection the- ories of attention (e.g., Deutsch & Deutsch, 1963; Keele & Neill, 1978; Norman, 1968) and has been applied to a wide vari- ety of specific problems, including multiple-choice reaction time (Berlyne, 1957), Stroop interference (Keele, 1973), and dual-task interference (Herman & Kantowitz, 1970; Reynolds, 1964). In the dual-task literature, several lines of evidence point 549
Transcript of Dependence and Independence in Responding to Double ... · Dependence and Independence in...
Journal of Experimental Psychology:Human Perception and Performance1986, Vol. 12, No. 4, 549-563
Copyright 1986 by the American Psychological Association, Inc.0096-1523/86/100.75
Dependence and Independence in Responding to Double Stimulation:A Comparison of Stop, Change, and Dual-Task Paradigms
Gordon D. LoganPurdue University
Jacqueline BurkellUniversity of Western Ontario, London, Ontario, Canada
When a letter and a tone are presented in rapid succession, there is substantial interference if both
require an overt response (the dual-task paradigm), but there is very little interference if the tone is
a signal to inhibit the response to the letter (the slopping paradigm). These effects were replicated
under common stimulus conditions in two experiments, and they were compared with effects in a
change paradigm, in which the tone required an overt response, like the dual-task paradigm, but
was also a signal to inhibit the response to the letter, like the stopping paradigm. In the change
paradigm, the overt response to the tone suffered interference only if subjects failed to inhibit the
concurrent response to the letter; inhibiting the response to the letter virtually eliminated the inter-
ference. The results suggest that differences in response competition are primarily responsible for
differences in interference between the dual-task and stopping paradigms. More generally, the results
support response-competition interpretations of dual-task interference.
In a typical dual-task experiment, people are presented withtwo stimuli in rapid succession and are required to respond toeach stimulus as quickly as possible. Typically, there is substan-tial interference between the two tasks, particularly when thedelay is short (see, e.g., Kahneman, 1973; Kantowitz, 1974;Welford, 1952). The interference is typically explained bymodels that assume strong dependence between tasks, due tocompetition for common resources or access to common pro-cessing mechanisms (e.g., Navon & Gopher, 1979; Schwiekert&Boggs, 1984;Wickens, 1984). However, much of the interfer-ence can be removed by simply changing the instructions: Astop-signal experiment can involve the same stimuli and thesame delays as a dual-task experiment, but the second stimulustells the subject to inhibit the response to the first stimulus. Asin the dual-task paradigm, each stimulus requires a distinct re-sponse, but there is virtually no interference between the twotasks (see, e.g., Logan, Cowan, & Davis, 1984). Performance inthe stop-signal paradigm can be modeled accurately by assum-ing complete independence between the processes that respondto the go signal and those that respond to the stop signal (Logan& Cowan, 1984; Oilman, 1973).
The purpose of this article is to explore this remarkable
difference in interference in more detail. First, an attempt willbe made to account for the difference in interference in termsof response competition, and response competition effects willbe contrasted with the effects of competition for more centralresources. Then the dual-task paradigm will be compared withthe stopping paradigm directly, to replicate the differences ininterference while using exactly the same stimuli and delays andusing subjects from the same population. This has not beendone in previous experiments, and the difference in interferencewould be less remarkable if it were due to subtle differences inthe procedures of typical dual-task and stop-signal experi-ments. Finally, dual-task and stop-signal performance will becompared with performance in a change paradigm, in whichthere are two stimuli presented in rapid succession, and the sec-ond stimulus requires subjects to inhibit their responses to thefirst stimulus, like the stop-signal paradigm, and it also requiresan overt response, like the dual-task paradigm. Thus, thechange paradigm shares some features with the stop-signal par-adigm and other features with the dual-task paradigm. It repre-sents a procedural "bridge" that allows us to assess more di-rectly the contrasting roles that response competition plays inthe two paradigms.
Portions of the data were reported at the annual meeting of the Psy-
chonomic Society, San Antonio, Texas, November, 1984.
This research was supported by Grant U0053 from the Natural Sci-
ences and Engineering Research Council of Canada and Grant BNS
8510365 from the National Science Foundation to Gordon Logan.
We would like to thank Richard Schweikert for help with the curve
fitting and Greg Riegler for help with the data analysis. We are grateful
to Bill Banks, Steve Keele, and Chris Wickens for comments on the
article.
Correspondence concerning this article should be addressed to Gor-don D. Logan, who is now at the Department of Psychology, University
of Illinois, 603 East Daniel Street, Champaign, Illinois, 61820.
Response Competition in Dual-Task
and Stopping Paradigms
In general, response competition theories claim that the ma-jor bottleneck in processing occurs at the stage of selecting andexecuting responses. The basic idea underlies late-selection the-ories of attention (e.g., Deutsch & Deutsch, 1963; Keele &Neill, 1978; Norman, 1968) and has been applied to a wide vari-ety of specific problems, including multiple-choice reactiontime (Berlyne, 1957), Stroop interference (Keele, 1973), anddual-task interference (Herman & Kantowitz, 1970; Reynolds,1964). In the dual-task literature, several lines of evidence point
549
550 GORDON D. LOGAN AND JACQUELINE BURKELL
to the importance of response competition. First, there is muchmore interference when two tasks require similar motor re-sponses (e.g., both vocal or both manual) than when they re-quire dissimilar responses (e.g., one vocal and one manual; seeLogan, ZbrodorT, & Fostey, 1983; McLeod, 1978). Second, therefractory effect of a first task on a second is much stronger forresponse-related processes than for preresponse processes (Kar-lin & Kestenbaum, 1968; Pashler, 1984). Third, in many cases,dual-task interference is better predicted by the interval be-tween the response to the first task and the stimulus for the sec-ond than by the interval between the first and second stimulus
(Ninio, 1975).There are a number of theoretical alternatives to response
competition that assume that major bottlenecks in processingcan occur before response selection and execution. Early-selec-tion (Broadbent, 1958), single-capacity (Kahneman, 1973), andmultiple-resource (Navon & Gopher, 1979;Wickens, 1984)the-
ories of attention all share the assumption of a central bottle-neck. Specific versions of these central-bottleneck theories havebeen developed to account for many of the phenomena that re-
sponse competition accounts for, including dual-task interfer-ence. Several lines of evidence point to a central bottleneck inthe dual-task paradigm. First, dual-task interference can beproduced when the two tasks involve different response modal-ities (Davis, 1957). Second, dual-task interference is greaterwhen the two tasks use the same input modality (e.g., two visualstimuli or two auditory stimuli) than when they use differentinput modalities (e.g., one visual stimulus and one auditorystimulus; see Proctor & Proctor, 1979; Treisman & Davies,
1973). Third, dual-task interference can be produced evenwhen the stimuli and responses are widely separated in time
(Logan, 1979).Given the evidence for response competition and for a more
central bottleneck, the best interpretation may be that both fac-tors are responsible for dual-task interference. Thus, the appro-priate question is which one is more important in a given situa-tion. From this perspective, response competition may providea better explanation of the difference in interference betweenthe dual-task and the stop-signal paradigms. In the dual-taskparadigm, the first and second stimulus both require overt re-sponses, and the two responses may compete with each other foraccess to the motor system, producing interference. However, inthe stop-signal paradigm, only the first stimulus requires anovert response; the response to the second stimulus (the stopsignal) is covert. Thus, there is no response competition and nointerference. A central-bottleneck theory could account for thedifference by assuming that the dual-task paradigm was moredemanding than the stop-signal paradigm, but the difference indemand would have to be substantial. It is difficult to see howthe theory could argue for a large difference in demand on an apriori basis without admitting that the requirement to executetwo responses versus one was primarily responsible for thedifference in demand. It may be possible to argue for a differ-ence in concurrence cost or for a difference in the demands ofpreparing for a dual-task trial versus a stop-signal trial, andthereby mimic the predictions of response competition theory.
The change paradigm is very interesting in this context be-cause it allows us to distinguish clearly between response com-
petition and central bottleneck interpretations. When subjectsfail to inhibit their response to the first stimulus (i.e., on signal-respond trials), the change paradigm is like the dual-task para-digm in that there are two stimuli and two overt responses.However, when subjects succeed in inhibiting their response tothe first stimulus (i.e., on signal-inhibit trials), the change para-digm is like the stop-signal paradigm in that there are two stim-uli but only one overt response. If response competition is themajor factor contributing to the difference in interference be-tween the dual-task and stopping paradigms, then signal-re-spond trials should produce exactly the same interference as thedual-task paradigm, and signal-inhibit trials should produce nointerference.
A central bottleneck theory would predict interference on
signal-respond trials, because they are like dual-task trials, butit should also predict some interference on signal-inhibit trials.It would be hard to argue that signal-respond and signal-inhibittrials differed in concurrence cost or in preparation because
subjects cannot tell in advance whether they would inhibit theresponse to the first stimulus.
Response competition and a central bottleneck may bothcontribute to the difference in interference between the dual-task and stop-signal paradigms. In that case, the change para-digm will allow us to determine which contributes more. If sig-nal-respond trials suffer substantially more interference thansignal-inhibit trials do, then response competition will be themore important factor. However, if signal-respond and signal-inhibit trials suffer about the same amount of interference, thena central bottleneck will be the more important factor. Anydifference in interference between signal-respond and signal-in-hibit trials will reflect the contribution of response competition;any interference at all in the signal-inhibit condition will reflectthe contribution of a central bottleneck.
The Experiments
Two experiments were conducted. In both experiments, the
first stimulus was a single letter, and the second stimulus was atone. In all conditions of both experiments, the letter was drawnfrom one of two pairs, and the task was to indicate which set itcame from. The response to the tone distinguished the differentparadigms: In the dual-task paradigm, subjects made a separateovert response to the tone while concurrently responding to theletter. In the stopping paradigm, subjects tried to inhibit theirresponse to the letter when they heard the tone. In the changeparadigm, when the tone was presented, subjects tried to inhibittheir responses to the letter and made a separate overt response
to the tone.In both experiments, the tone occurred at one of six delays
after the onset of the letter (80, 160, 240, 320, 400, and 480ms). In the dual-task paradigm and in those trials in the changeparadigm on which subjects failed to inhibit their response tothe letter, interference with the response to the tone should begreatest the shorter the delay between the letter and the tone(e.g., Kantowitz, 1974). In the stopping paradigm and in thosetrials in the change paradigm on which subjects succeeded ininhibiting their response to the letter, there should be no inter-ference at any tone delay.
STOP, CHANGE, AND DUAL-TASK PARADIGMS 551
In addition to tone delay, the major manipulation in Experi-
ment 1 was tone probability: Letter-only trials were mixed ran-
domly with letter-plus-tone trials, and the relative frequency of
letter-plus-tone trials was varied (20%, 50%, or 80% of the trials
were letter-plus-tone trials). Tone probability was varied be-
cause it is an aspect of the procedure that is typically different
in stop-signal and dual-task studies. In stop-signal studies, tone
probability is usually low (10%-30%) so that subjects cannot
easily anticipate the tone (see, e.g., Logan, 1981). However, du-
al-task studies often include blocks of trials that consist entirely
of letter-plus-tone trials with letter-only trials run as a control
condition in separate blocks of trials. When letter-plus-tone tri-
als are mixed together with letter-only trials, tone probability
is usually high (50% or more). In order to determine whether
differences in tone probability were responsible for the differ-
ences in interference that are typically observed, the tasks were
compared under the same tone probability conditions.
In Experiment 2 we manipulated tone delay and fixed tone
probability at 50%. Its major manipulation was practice; sub-
jects performed a total of 4,320 letter-only and letter-plus-tone
trials over a period of 6 days. Dual-task interference can change
dramatically with practice (e.g., Logan, 1979), whereas perfor-
mance in the stop-signal paradigm seems relatively stable over
practice (see Logan et al.. 1984). Thus, it was important to com-
pare the paradigms at several different stages of practice.
The two experiments shared common methods, so they will
be described in a single Method section. For clarity of presenta-
tion, the description and discussion of the results will be orga-
nized around the various dependent measures (i.e., reaction
time to the letter, reaction time for the overt response to the
tone, internal reaction time to the stop signal) instead of by ex-
periments.
General Method
Subjects
In Experiment 1 there were four different groups of 12 subjects, onegroup in the dual-task paradigm, one in the stopping paradigm, one in
the change paradigm, and one that responded only to the tones as a
single-task control. Each subject served for one 1-hr session. In Experi-ment 2 there were three different groups of 6 subjects, a dual-task group,
a stopping group, and a change group. Each subject served for six 1-hrsessions. Subjects were undergraduate and graduate students and re-search assistants. Some subjects in Experiment 1 served to fulfill course
requirements; others were paid $4 per hour for participating. All sub-jects in Experiment 2 were paid.
Apparatus and Stimuli
The stimuli for the letter task were the letters A, B, C, and D, displayed
in upper case in the center of a point-plot cathode-ray tube (CRT; Tech-tronix Model 604 equipped with P31 phosphor) under the control of
a PDP 11/03 computer. Each letter was preceded by a fixation point
displayed in the center of the screen for 500 ms. The fixation point wasextinguished and replaced immediately by the letter for that trial, whichwas exposed for 500 ms. After the letter was extinguished, the screen
remained blank for a 2,500-ms intertrial interval. Viewed at a distanceof 60 cm, each letter subtended 0.43° X 0.57° of visual angle.
The tone was played at 900 Hz for 500 ms through a speaker located
behind the CRT. When the tone occurred, it began 80, 160, 240, 320,400, or 480 ms after the letter began.
Subjects in all groups responded to the letter by pressing the right-
most or the next-to-rightmost of a panel of eight telegraph keys
mounted on a movable board. Subjects in the dual-task and changegroups responded to the tone by pressing the leftmost key in the panel
of eight.
Procedure
Each session involved 720 trials divided into six blocks of 120. Each
letter occurred equally often in each block. Tones occurred equafly of-ten at each delay in each block, and each letter appeared equally oftenat each tone delay. In Experiment 1, tones were presented on 20%, 50%,
or 80% of the trials in each block, which corresponds to 24,60, and 96trials, respectively. Subjects received two blocks at each tone probability
before moving on to the next tone probability. The onier of tone-proba-
bility conditions was varied between subjects; two subjects in eachgroup received each of the six possible orders. In Experiment 2, tones
were presented on 50% of the trials in each block (60 trials). A differentrandom order of trials was prepared for each subject in each session of
each experiment.
All subjects in each group of each experiment pressed the next-to-rightmost key in the panel of eight with the index fingers of their right
hands to indicate that the letter was an A or a B, and they pressed the
rightmost key with the middle fingers of their right hand to indicate thatthe letter was a C or a D. Subjects in the dual-task and change groups in
each experiment and subjects in the tone-only group of Experiment 1pressed the leftmost key in the panel of eight with the index fingeis of
their left hands to indicate that the tone occurred.
Dual-task group. Subjects in the dual-task group were first told aboutthe events in the letter task and the responses that were appropriate to
the different letters. Then the tone was described, and the response thatwas appropriate to it was described. They were told to respond to theletter and the tone as quickly and accurately as possible.
Slopping group. Subjects in the stopping group were first told aboutthe letter task and the responses appropriate to it, and then the stopping
task was introduced. They were told to respond to the letters as quickly
and accurately as possible but to try to inhibit their responses to theletters if they heard the tone. They were told not to wait for the tone
before responding to the letter, that tone delays had been selected insuch a way that some of the time they would be able to inhibit their
responses to the letter and some of the time they would not.
Change group. Subjects in the change group were first told about theletter task and the responses appropriate to it, with encouragement torespond as quickly and accurately as possible. Then they were told to
try to inhibit their responses to the letter if they heard the tone but notto wait for the tone before responding to the letter. Finally, they were
told to respond overtly to the tone as quickly as possible, whenever itoccurred, whether or not they were able to inhibit their response to theletter.
Tone-only group. In Experiment 1, twelve subjects served as a single-task control for the dual-task and change groups. They received the
same set of stimuli as the other groups (i.e., letters and tones with tonedelay and tone probabih'ty varied), but they were told to ignore the let-ters and respond only to the tones, making their responses to the tones
as quickly as possible.
Results and Discussion
Reaction Time to the Letter
The dual-task and stopping paradigms typically produce
different reaction times to the first stimulus, in this case, the
552 GORDON D. LOGAN AND JACQUELINE BURKELL
STOPPING 800
600
- CHANGE
50 SO 20 50 80
TONE PROBABILITY
20 50 80
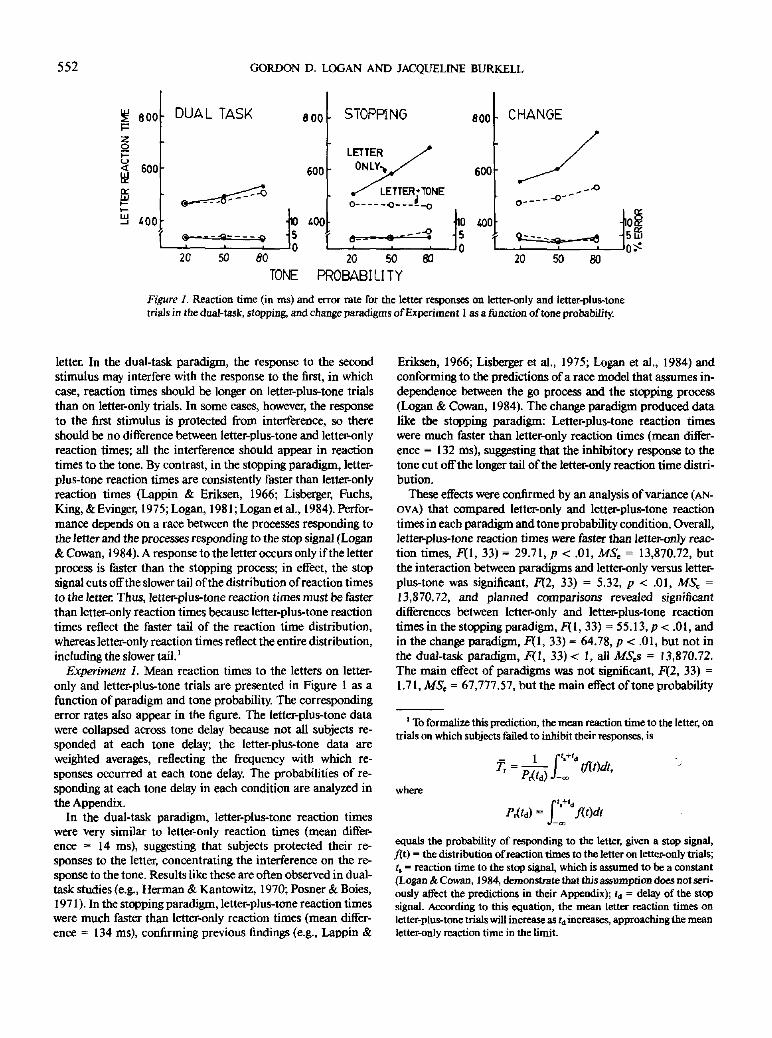
Figure 1. Reaction time (in ms) and error rate for the letter responses on letter-only and letter-plus-tonetrials in the dual-task, stopping, and change paradigms of Experiment 1 as a junction of tone probability.
letter. In the dual-task paradigm, the response to the second
stimulus may interfere with the response to the first, in which
case, reaction times should be longer on letter-plus-tone trials
than on letter-only trials. In some cases, however, the response
to the first stimulus is protected from interference, so there
should be no difference between letter-plus-tone and letter-only
reaction times; all the interference should appear in reaction
times to the tone. By contrast, in the stopping paradigm, letter-
plus-tone reaction times are consistently faster than letter-only
reaction times (Lappin & Eriksen, 1966; Lisberger, Fuchs,
King,&Evinger, 1975;Logan, 1981; Logan etal., 1984). Perfor-
mance depends on a race between the processes responding to
the letter and the processes responding to the stop signal (Logan
& Cowan, 1984). A response to the letter occurs only if the letter
process is faster than the stopping process; in effect, the stop
signal cuts off the slower tail of the distribution of reaction times
to the letter. Thus, letter-plus-tone reaction times must be faster
than letter-only reaction times because letter-plus-tone reaction
times reflect the faster tail of the reaction time distribution,
whereas letter-only reaction times reflect the entire distribution,
including the slower tail.'
Experiment 1. Mean reaction times to the letters on letter-
only and letter-plus-tone trials are presented in Figure 1 as a
function of paradigm and tone probability. The corresponding
error rates also appear in the figure. The letter-plus-tone data
were collapsed across tone delay because not all subjects re-
sponded at each tone delay; the letter-plus-tone data are
weighted averages, reflecting the frequency with which re-
sponses occurred at each tone delay. The probabilities of re-
sponding at each tone delay in each condition are analyzed in
the Appendix.
In the dual-task paradigm, letter-plus-tone reaction times
were very similar to letter-only reaction times (mean differ-
ence = 14 ms), suggesting that subjects protected their re-
sponses to the letter, concentrating the interference on the re-
sponse to the tone. Results like these are often observed in dual-
task studies (e.g., Herman & Kantowitz, 1970; Posner & Boies,
1971). In the stopping paradigm, letter-plus-tone reaction times
were much faster than letter-only reaction times (mean differ-
ence = 134 ms), confirming previous findings (e.g., Lappin &
Eriksen, 1966; Lisberger et al., 1975; Logan et al., 1984) and
conforming to the predictions of a race model that assumes in-
dependence between the go process and the stopping process
(Logan & Cowan, 1984). The change paradigm produced data
like the stopping paradigm: Letter-plus-tone reaction times
were much faster than letter-only reaction times (mean differ-
ence = 132 ms), suggesting that the inhibitory response to the
tone cut off the longer tail of the letter-only reaction time distri-
bution.
These effects were confirmed by an analysis of variance (AN-
OVA) that compared letter-only and letter-plus-tone reaction
times in each paradigm and tone probability condition. Overall,
letter-plus-tone reaction times were faster than letter-only reac-
tion times, F(l, 33) = 29.71, p < .01, MS, = 13,870.72, but
the interaction between paradigms and letter-only versus letter-
plus-tone was significant, F(2, 33) = 5.32, p < .01, MS, =
13,870.72, and planned comparisons revealed significant
differences between letter-only and letter-plus-tone reaction
times in the stopping paradigm, P(l, 33) = 55.13, p < .01, and
in the change paradigm, F(l, 33) = 64.78, p < .01, but not in
the dual-task paradigm, F(l, 33) < 1, all MSj = 13,870.72.
The main effect of paradigms was not significant, F(2, 33) =
1.71, MS, = 67,777.57, but the main effect of tone probability
' To formalize this prediction, the mean reaction time to the letter, ontrials on which subjects failed to inhibit their responses, is
where
tf(t)dt,
* f(t)dt
equals the probability of responding to the letter, given a stop signal,flfi = the distribution of reaction times to the letter on letter-only trials;(, = reaction time to the stop signal, which is assumed to be a constant(Logan & Cowan, 1984, demonstrate that this assumption does not seri-ously affect the predictions in their Appendix); td = delay of the stopsignal. According to this equation, the mean letter reaction times onletter-plus-tone trials will increase as t& increases, approaching the meanletter-only reaction time in the limit.
STOP, CHANGE, AND DUAL-TASK PARADIGMS 553
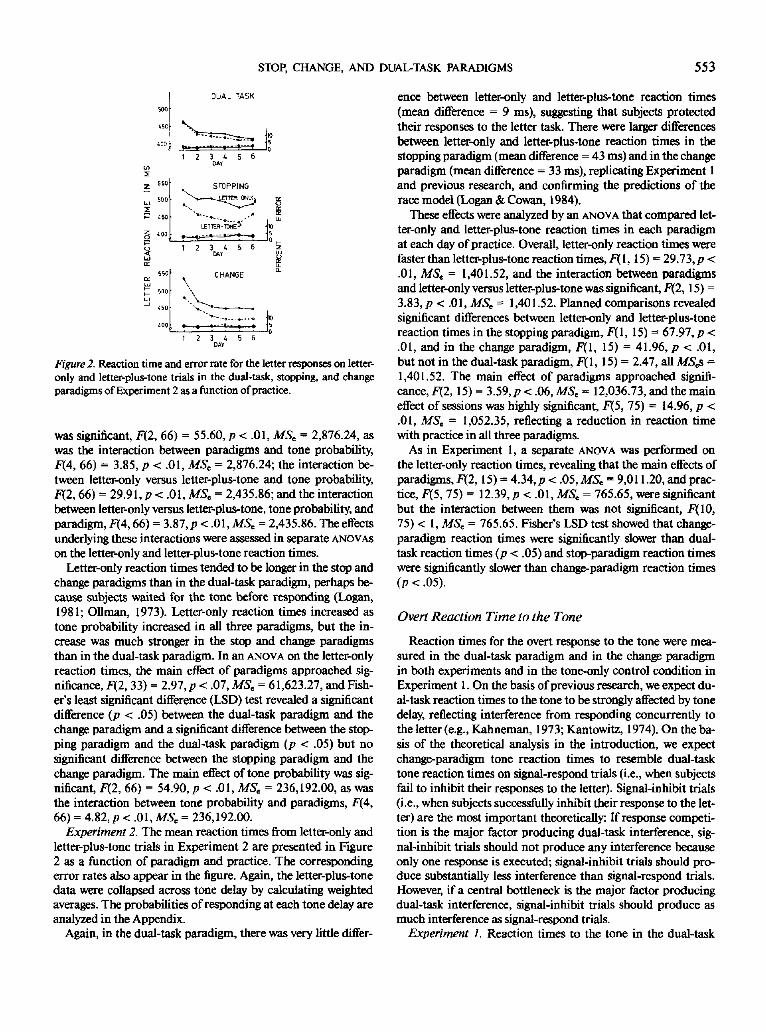
Figure 2. Reaction time and error rate for the letter responses on letter-only and letter-plus-tone trials in the dual-task, stopping, and change
paradigms of Experiment 2 as a function of practice.
was significant, F(2, 66) = 55.60, p < .01, MS, = 2,876.24, as
was the interaction between paradigms and tone probability,
F(4, 66) = 3.85, p < .01, MS, = 2,876.24; the interaction be-
tween letter-only versus letter-plus-tone and tone probability,
F(2,66) = 29.91, p < .01, MSe = 2,435.86; and the interaction
between letter-only versus letter-plus-tone, tone probability, and
paradigm, F(4,66) = 3.87, p < .01, MS, = 2,435.86. The effects
underlying these interactions were assessed in separate ANOVAS
on the letter-only and letter-plus-tone reaction times.
Letter-only reaction times tended to be longer in the stop and
change paradigms than in the dual-task paradigm, perhaps be-
cause subjects waited for the tone before responding (Logan,
1981; Oilman, 1973). Letter-only reaction times increased as
tone probability increased in all three paradigms, but the in-
crease was much stronger in the stop and change paradigms
than in the dual-task paradigm. In an ANOVA on the letter-only
reaction times, the main effect of paradigms approached sig-
nificance, f\2, 33) = 2.97, p < .07, MS, = 61,623.27, and Fish-
er's least significant difference (LSD) test revealed a significant
difference (p < .05) between the dual-task paradigm and the
change paradigm and a significant difference between the stop-
ping paradigm and the dual-task paradigm (p < .05) but no
significant difference between the stopping paradigm and the
change paradigm. The main effect of tone probability was sig-
nificant, F(2, 66) = 54.90, p < .01, MSC = 236,192.00, as was
the interaction between tone probability and paradigms, F(4,
66) = 4.82,p < .01, MS,= 236,192.00.
Experiment 2. The mean reaction times from letter-only and
letter-plus-tone trials in Experiment 2 are presented in Figure
2 as a function of paradigm and practice. The corresponding
error rates also appear in the figure. Again, the letter-plus-tone
data were collapsed across tone delay by calculating weighted
averages. The probabilities of responding at each tone delay are
analyzed in the Appendix.
Again, in the dual-task paradigm, there was very little differ-
ence between letter-only and letter-plus-tone reaction times
(mean difference = 9 ms), suggesting that subjects protected
their responses to the letter task. There were larger differences
between letter-only and letter-plus-tone reaction times in the
stopping paradigm (mean difference = 43 ms) and in the change
paradigm (mean difference = 33 ms), replicating Experiment 1
and previous research, and confirming the predictions of the
race model (Logan & Cowan, 1984).
These effects were analyzed by an ANOVA that compared let-
ter-only and letter-plus-tone reaction times in each paradigm
at each day of practice. Overall, letter-only reaction times were
faster than letter-plus-tone reaction times, F( 1,15) = 29.73, p <
.01, MS, - 1,401.52, and the interaction between paradigms
and letter-only versus letter-plus-tone was significant, F(2,15) =
3.83, p < .01, MS, = 1,401.52. Planned comparisons revealed
significant differences between letter-only and letter-plus-tone
reaction times in the stopping paradigm, F\ 1, 15) = 67.97, p <
.01, and in the change paradigm, F(l, 15) = 41.96, p < .01,
but not in the dual-task paradigm, F(l, 15) = 2.47, all MS^s =
1,401.52. The main effect of paradigms approached signifi-
cance,^, 15) = 3.59,p<.06,M5e= 12,036.73, and the main
effect of sessions was highly significant, F\5, 75) = 14.96, p <
.01, MS, — 1,052.35, reflecting a reduction in reaction time
with practice in all three paradigms.
As in Experiment 1, a separate ANOVA was performed on
the letter-only reaction times, revealing that the main effects of
paradigms, F(2,15) = 4.34, p < .05, MS, = 9,011.20, and prac-
tice, F{5, 75) = 12.39, p < .01, MS, = 765.65, were significant
but the interaction between them was not significant, F(10,
75) < 1, MS, = 765.65. Fisher's LSD test showed that change-
paradigm reaction times were significantly slower than dual-
task reaction times (p < .05) and stop-paradigm reaction times
were significantly slower than change-paradigm reaction times
(p < .05).
Overt Reaction Time to the Tone
Reaction times for the overt response to the tone were mea-
sured in the dual-task paradigm and in the change paradigm
in both experiments and in the tone-only control condition in
Experiment 1. On the basis of previous research, we expect du-
al-task reaction times to the tone to be strongly affected by tone
delay, reflecting interference from responding concurrently to
the letter (e.g., Kahneman, 1973; Kantowitz, 1974). On the ba-
sis of the theoretical analysis in the introduction, we expect
change-paradigm tone reaction times to resemble dual-task
tone reaction times on signal-respond trials (i.e., when subjects
fail to inhibit their responses to the letter). Signal-inhibit trials
(i.e., when subjects successfully inhibit their response to the let-
ter) are the most important theoretically: If response competi-
tion is the major factor producing dual-task interference, sig-
nal-inhibit trials should not produce any interference because
only one response is executed; signal-inhibit trials should pro-
duce substantially less interference than signal-respond trials.
However, if a central bottleneck is the major factor producing
dual-task interference, signal-inhibit trials should produce as
much interference as signal-respond trials.
Experiment 1. Reaction times to the tone in the dual-task
554 GORDON D. LOGAN AND JACQUELINE BURKELL
DUAL TASKSIGNAL RESPONDSIGNAL INHIBITTONE ONLY
800
600
400
200
-r
P(SIGNAL) = .2
80 160 240 320 400 480
800
600
400
200
T
P (SIGNAL) = .5
80 160 240 320 400 480
TONE DELAY (MS)
800
600
400
200
P(SIGNAL) = .
80 160 240 320 400 480
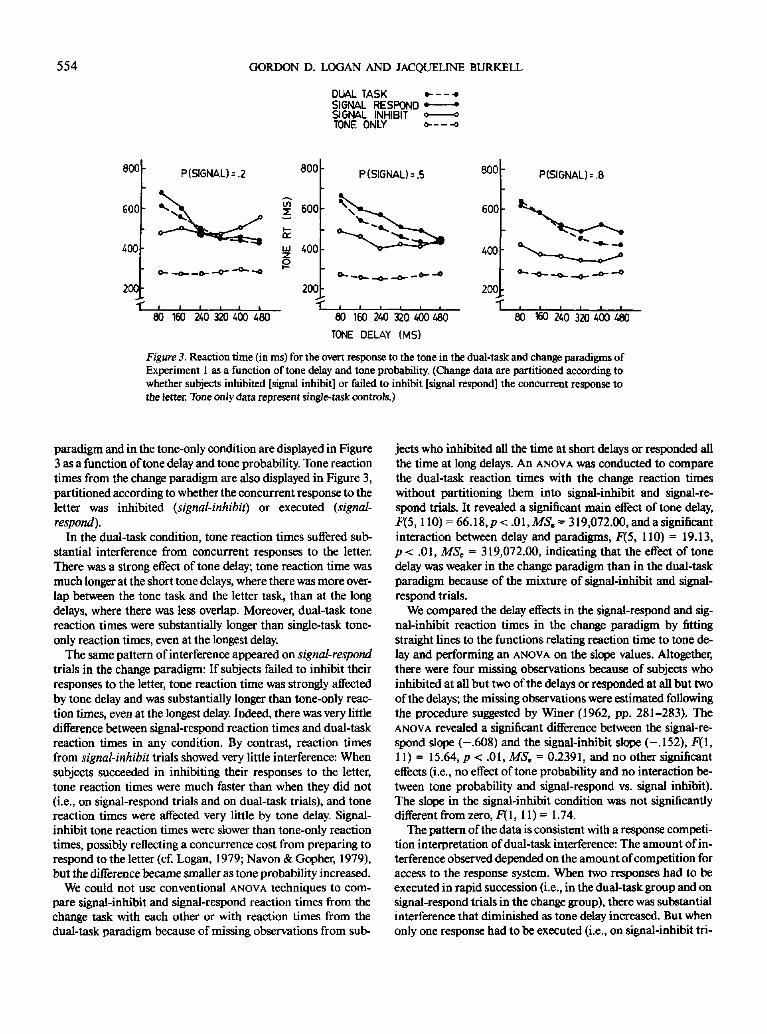
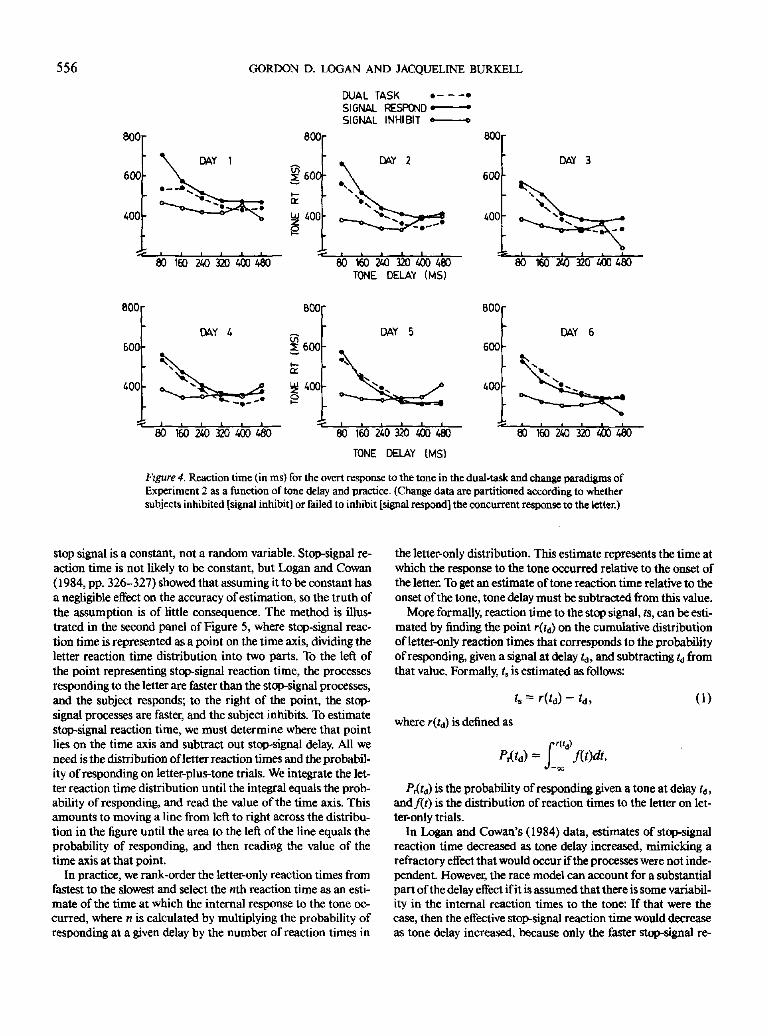
Figure 3. Reaction time (in ms) for the overt response to the tone in the dual-task and change paradigms of
Experiment 1 as a function of tone delay and tone probability. (Change data are partitioned according to
whether subjects inhibited [signal inhibit] or failed to inhibit [signal respond] the concurrent response to
the letter. Tone only data represent single-task controls.)
paradigm and in the tone-only condition are displayed in Figure3 as a function of tone delay and tone probability. Tone reactiontimes from the change paradigm are also displayed in Figure 3,partitioned according to whether the concurrent response to theletter was inhibited (signal-inhibit) or executed (signal-
respond).In the dual-task condition, tone reaction times suffered sub-
stantial interference from concurrent responses to the letter.There was a strong effect of tone delay; tone reaction time wasmuch longer at the short tone delays, where there was more over-lap between the tone task and the letter task, than at the longdelays, where there was less overlap. Moreover, dual-task tonereaction times were substantially longer than single-task tone-
only reaction times, even at the longest delay.The same pattern of interference appeared on signal-respond
trials in the change paradigm: If subjects failed to inhibit theirresponses to the letter, tone reaction time was strongly affectedby tone delay and was substantially longer than tone-only reac-tion times, even at the longest delay. Indeed, there was very littledifference between signal-respond reaction times and dual-taskreaction times in any condition. By contrast, reaction timesfrom signal-inhibit trials showed very little interference: Whensubjects succeeded in inhibiting their responses to the letter,tone reaction times were much faster than when they did not(i.e., on signal-respond trials and on dual-task trials), and tonereaction times were affected very little by tone delay. Signal-inhibit tone reaction times were slower than tone-only reactiontimes, possibly reflecting a concurrence cost from preparing torespond to the letter (cf. Logan, 1979; Navon & Gopher, 1979),but the difference became smaller as tone probability increased.
We could not use conventional ANOVA techniques to com-pare signal-inhibit and signal-respond reaction times from thechange task with each other or with reaction times from thedual-task paradigm because of missing observations from sub-
jects who inhibited all the time at short delays or responded allthe time at long delays. An ANOVA was conducted to comparethe dual-task reaction times with the change reaction timeswithout partitioning them into signal-inhibit and signal-re-spond trials. It revealed a significant main effect of tone delay,F(5,110) = 66.18,p<. 01, MS. = 319,072.00, and a significantinteraction between delay and paradigms, F(5, 110) = 19.13,p < .01, MS, = 319,072.00, indicating that the effect of tonedelay was weaker in the change paradigm than in the dual-taskparadigm because of the mixture of signal-inhibit and signal-respond trials.
We compared the delay effects in the signal-respond and sig-nal-inhibit reaction times in the change paradigm by fittingstraight lines to the functions relating reaction time to tone de-lay and performing an ANOVA on the slope values. Altogether,there were four missing observations because of subjects whoinhibited at all but two of the delays or responded at all but twoof the delays; the missing observations were estimated followingthe procedure suggested by Winer (1962, pp. 281-283). TheANOVA revealed a significant difference between the signal-re-spond slope (-.608) and the signal-inhibit slope (-.152), F(\,11)= 15.64, p < .01, MS, = 0.2391, and no other significanteffects (i.e., no effect of tone probability and no interaction be-
tween tone probability and signal-respond vs. signal inhibit).The slope in the signal-inhibit condition was not significantlydifferent from zero, F( 1, 11) = 1.74.
The pattern of the data is consistent with a response competi-tion interpretation of dual-task interference: The amount of in-terference observed depended on the amount of competition foraccess to the response system. When two responses had to beexecuted in rapid succession (i.e., in the dual-task group and onsignal-respond trials in the change group), there was substantialinterference that diminished as tone delay increased. But whenonly one response had to be executed (i.e., on signal-inhibit tri-
STOP, CHANGE, AND DUAL-TASK PARADIGMS 555
als in the change group), there was very little interference. The
lack of interference on signal-inhibit trials suggests that a cen-
tral bottleneck plays a minor role in the present versions of the
dual-task and change paradigms.
Experiment 2. The tone reaction times in the dual-task para-
digm are displayed in Figure 4 as a function of tone delay and
practice. Tone reaction times from the change paradigm are
also plotted in the figure, divided into signal-respond and sig-
nal-inhibit trials. As in Experiment 1, there was substantial in-
terference in the dual-task paradigm, with tone reaction times
strongly affected by tone delay. Also as in Experiment 1, reac-
tion times from signal-respond trials in the change paradigm
showed the same interference as the dual-task condition, being
strongly affected by tone delay and very similar in magnitude
to the dual-task reaction times. Again, the signal-inhibit trials
showed a different pattern of performance: Successfully inhibit-
ing the response to the letter eliminated interference, producing
reaction times that were not affected much by tone delay and
were much faster than signal-respond and dual-task reaction
times.
Again, missing observations made it impossible to compare
signal-inhibit, signal-respond, and dual-task reaction times
with ANOVA. An ANOVA that compared the two paradigms
without dividing the change-paradigm data into signal-respond
and signal-inhibit conditions yielded a significant main effect of
practice, F(5, 50) = 13.86, p < .01, MSC = 7,678.72, a signifi-
cant main effect of delay, F(5, 50) = 78.58, p < .01, MSC -
3,085.76, and a significant interaction between delay and para-
digms, F(5, 50) = 15.98, p < .01, MS, = 3,085.76, reflecting
the effects of mixing together signal-respond and signal-inhibit
reaction times. Notably, there was no interaction between delay
and practice; the delay effect was relatively stable.
Again, we assessed the delay effects in the signal-inhibit and
signal-respond conditions by fitting straight lines to the func-
tions relating reaction time to delay and performing an ANOVA
on the slopes. The ANOVA revealed a significant difference be-
tween the signal-respond slope (—.511) and the signal-inhibit
slope (-.172), F(\, 5) = 4.41, p < .05, MS, = 0.4689, and no
other significant effects (i.e., no effect of practice and no interac-
tion between practice and signal-respond vs. signal inhibit). The
slope in the signal-inhibit condition was not significantly
different from zero, 7*1(1, 5) = 1.14.
As in Experiment 1, the lack of interference on signal-inhibit
trials, contrasted with the large amount of interference on sig-
nal-respond trials, supports response competition interpre-
tations of dual-task interference (e.g., Herman & Kantowitz,
1970;Keele&Neill, 1978; Reynolds, 1964), and fails to support
interpretations based on competition for more central re-
sources (e.g., Kahneman, 1973; Posner& Boies, 1971).
The absence of an interaction between tone delay and ses-
sions is remarkable, because it suggests there was no reduction
in dual-task interference with practice. Typically, under consis-
tent mapping conditions there is a substantial reduction in dual-
task interference with practice, reflecting the development of
automaticity (e.g., Logan, 1979). The present experiment may
not have produced a practice effect because the major source of
dual-task interference was response competition; subjects had
two responses to make on each letter-plus-tone trial, and this
requirement did not change over practice. Possibly, reductions
in dual-task interference occur only when subjects can change
the way they do the task over practice to eliminate sources of
interference. Indeed, Broadbent (1956) found that practice re-
duced dual-task interference only when subjects did not have
to respond to the two tasks simultaneously; practice had no
effect on dual-task interference when subjects had to respond
to the two tasks simultaneously.
Internal Reaction Time to the Stop Signal
This article is intended to account for the difference in inter-
ference between the dual-task and the stop-signal paradigms.
The preceding section addressed the interference in the dual-
task paradigm; this section addresses the lack of interference in
the stop-signal paradigm. The lack of interference is an infer-
ence derived from the assumption that the processes responding
to the stop signal are independent of the processes responding
to the go signal, in this case, the letter. The assumption that the
underlying processes are independent has been tested in two
ways: First, reaction times to the letter on letter-only trials are
typically slower than reaction times to the letter on letter-plus-
tone trials, just as we observed here. Logan and Cowan (1984)
used their model to estimate letter reaction times on letter-plus-
tone trials and found close agreement with the observed values,
which supports the independence assumption. Second, esti-
mates of the latency of the internal response to the stop signal
derived from the model suggest that reaction times to the stop
signal were very fast (about 200 ms) and not affected much by
stop-signal delay (see Logan, 1981; Logan & Cowan, 1984; Lo-
gan et al., 1984), which supports the independence assumption
at least qualitatively. Our purpose here was to test the indepen-
dence assumption quantitatively in order to provide a more
stringent test of the lack of interference in the stop-signal para-
digm. First, we used Logan and Cowan's (1984) model to esti-
mate stop-signal reaction time, and then we tested the idea that
the effect of stop-signal delay on stop-signal reaction time was
due to variability in the stop-signal reaction times, as Logan
and Cowan (1984) suggested, by extending their model further.
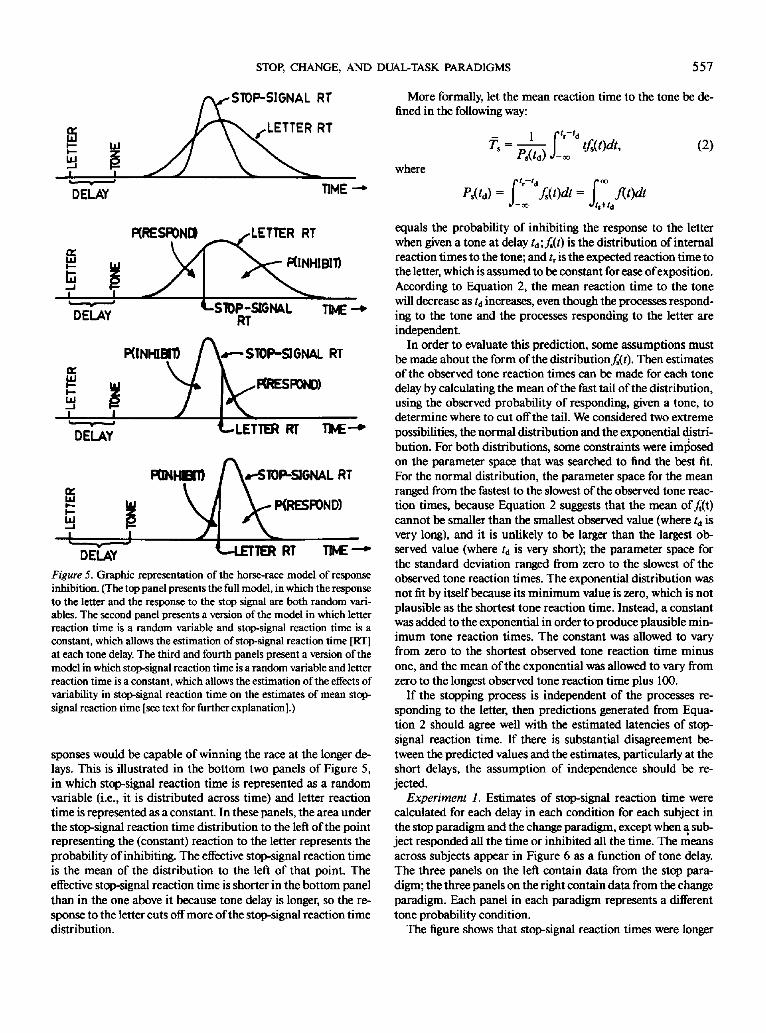
According to Logan and Cowan's (1984) model, the stop-sig-
nal paradigm involves a race between the processes responding
to the letter and the processes responding to the stop signal. If
the processes responding to the letter win the race, the subject
responds to the letter; if the processes responding to the stop
signal win the race, the subject inhibits the response to the letter.
Letter reaction time and stop-signal reaction time are assumed
to be independent random variables, so the race is a stochastic
process. The race model is depicted in the top panel of Figure
5, in which there is a distribution of finishing times for the pro-
cesses responding to the letter and a distribution of finishing
times for the processes responding to the stop signal. This ver-
sion of the model allows us to estimate the mean stop-signal
reaction time (see Logan & Cowan, 1984, pp. 311-313), but it
does not allow separate estimates at each stop-signal delay,
which we need to assess refractoriness in a way that we can com-
pare to the refractoriness of the overt response to the tone.
The model provides another way of estimating stop-signal re-
action time if we are willing to assume that the response to the
556 GORDON D. LOGAN AND JACQUELINE BURKELL
DUAL TASK • •
SIGNAL RESPOND* •
SIGNAL INHIBIT « o
DAY 2 DAY 3
80 160 240 320 400 480 80 160 240 320 400 480
TONE DELAY (MS)
80 160 240 320 400 480
80 160 240 320 400 480
DAY 5
800
600
400
DAY 6
80 160 240 320 400 480
TONE DELAY (MS)
80 160 240 320 400 480
Figure 4. Reaction time (in ms) for the overt response to the tone in the dual-task and change paradigms of
Experiment 2 as a function of tone delay and practice. (Change data are partitioned according to whethersubjects inhibited [signal inhibit] or failed to inhibit [signal respond] the concurrent response to the letter.)
stop signal is a constant, not a random variable. Stop-signal re-
action time is not likely to be constant, but Logan and Cowan
(1984, pp. 326-327) showed that assuming it to be constant has
a negligible effect on the accuracy of estimation, so the truth of
the assumption is of little consequence. The method is illus-
trated in the second panel of Figure 5, where stop-signal reac-
tion time is represented as a point on the time axis, dividing the
letter reaction time distribution into two parts. To the left of
the point representing stop-signal reaction time, the processes
responding to the letter are faster than the stop-signal processes,
and the subject responds; to the right of the point, the stop-
signal processes are faster, and the subject inhibits. To estimate
stop-signal reaction time, we must determine where that point
lies on the time axis and subtract out stop-signal delay. All we
need is the distribution of letter reaction times and the probabil-
ity of responding on letter-plus-tone trials. We integrate the let-
ter reaction time distribution until the integral equals the prob-
ability of responding, and read the value of the time axis. This
amounts to moving a line from left to right across the distribu-
tion in the figure until the area to the left of the line equals the
probability of responding, and then reading the value of the
time axis at that point.
In practice, we rank-order the letter-only reaction times from
fastest to the slowest and select the nth reaction time as an esti-
mate of the time at which the internal response to the tone oc-
curred, where n is calculated by multiplying the probability of
responding at a given delay by the number of reaction times in
the letter-only distribution. This estimate represents the time at
which the response to the tone occurred relative to the onset of
the letter. To get an estimate of tone reaction time relative to the
onset of the tone, tone delay must be subtracted from this value.
More formally, reaction time to the stop signal, ts, can be esti-
mated by finding the point r(t&) on the cumulative distribution
of letter-only reaction times that corresponds to the probability
of responding, given a signal at delay 2d, and subtracting ta from
that value. Formally, t, is estimated as follows:
(D
where r(ta) is defined as
~LPfa) is the probability of responding given a tone at delay fd ,
and f{t) is the distribution of reaction times to the letter on let-
ter-only trials.
In Logan and Cowan's (1984) data, estimates of stop-signal
reaction time decreased as tone delay increased, mimicking a
refractory effect that would occur if the processes were not inde-
pendent. However, the race model can account for a substantial
part of the delay effect if it is assumed that there is some variabil-
ity in the internal reaction times to the tone: If that were the
case, then the effective stop-signal reaction time would decrease
as tone delay increased, because only the faster stop-signal re-
STOP, CHANGE, AND DUAL-TASK PARADIGMS
STOP-SIGNAL RT
RT
a
557
More formally, let the mean reaction time to the tone be de-fined in the following way:
DELAY TIME-*
PtRESPONO LETTER RT
PdNHIBlfl
DELAY<-STOP-SIGNAL
RTTIME-
KINWHT) /y—STOP-SIGNAL RT
[ ^A V^PfcESPOND)
! J <
DELAYt_ LETTER RT TWE-
-̂STOP-SIGNAL RT
DELAY *—LETTER RT TIME-*
Figure S. Graphic representation of the horse-race model of response
inhibition. (The top panel presents the full model, in which the responseto the letter and the response to the stop signal are both random vari-ables. The second panel presents a version of the model in which letterreaction time is a random variable and stop-signal reaction time is a
constant, which allows the estimation of stop-signal reaction time [RT]
at each tone delay. The third and fourth panels present a version of themodel in which stop-signal reaction time is a random variable and letterreaction time is a constant, which allows the estimation of the effects of
variability in stop-signal reaction time on the estimates of mean stop-signal reaction time [see text for further explanation].)
sponses would be capable of winning the race at the longer de-lays. This is illustrated in the bottom two panels of Figure 5,in which stop-signal reaction time is represented as a randomvariable (i.e., it is distributed across time) and letter reactiontime is represented as a constant. In these panels, the area underthe stop-signal reaction time distribution to the left of the pointrepresenting the (constant) reaction to the letter represents theprobability of inhibiting. The effective stop-signal reaction timeis the mean of the distribution to the left of that point. Theeffective stop-signal reaction time is shorter in the bottom panelthan in the one above it because tone delay is longer, so the re-sponse to the letter cuts off more of the stop-signal reaction timedistribution.
r'r'i
•'-TO
(2)
where
equals the probability of inhibiting the response to the letterwhen given a tone at delay tA;f,(t) is the distribution of internalreaction times to the tone; and t, is the expected reaction time tothe letter, which is assumed to be constant for ease of exposition.According to Equation 2, the mean reaction time to the tonewill decrease as (4 increases, even though the processes respond-ing to the tone and the processes responding to the letter areindependent.
In order to evaluate this prediction, some assumptions mustbe made about the form of the distribution f,(t). Then estimatesof the observed tone reaction times can be made for each tonedelay by calculating the mean of the fast tail of the distribution,using the observed probability of responding, given a tone, todetermine where to cut off the tail. We considered two extremepossibilities, the normal distribution and the exponential distri-bution. For both distributions, some constraints were imposedon the parameter space that was searched to find the best fit.For the normal distribution, the parameter space for the meanranged from the fastest to the slowest of the observed tone reac-tion times, because Equation 2 suggests that the mean ot'/,(t)cannot be smaller than the smallest observed value (where ta isvery long), and it is unlikely to be larger than the largest ob-served value (where rd is very short); the parameter space forthe standard deviation ranged from zero to the slowest of theobserved tone reaction times. The exponential distribution wasnot fit by itself because its minimum value is zero, which is notplausible as the shortest tone reaction time. Instead, a constantwas added to the exponential in order to produce plausible min-imum tone reaction times. The constant was allowed to varyfrom zero to the shortest observed tone reaction time minusone, and the mean of the exponential was allowed to vary fromzero to the longest observed tone reaction time plus 100.
If the stopping process is independent of the processes re-sponding to the letter, then predictions generated from Equa-tion 2 should agree well with the estimated latencies of stop-signal reaction time. If there is substantial disagreement be-tween the predicted values and the estimates, particularly at theshort delays, the assumption of independence should be re-jected.
Experiment 1. Estimates of stop-signal reaction time werecalculated for each delay in each condition for each subject inthe stop paradigm and the change paradigm, except when a sub-ject responded all the time or inhibited all the time. The meansacross subjects appear in Figure 6 as a function of tone delay.The three panels on the left contain data from the stop para-digm; the three panels on the right contain data from the changeparadigm. Each panel in each paradigm represents a differenttone probability condition.
The figure shows that stop-signal reaction times were longer
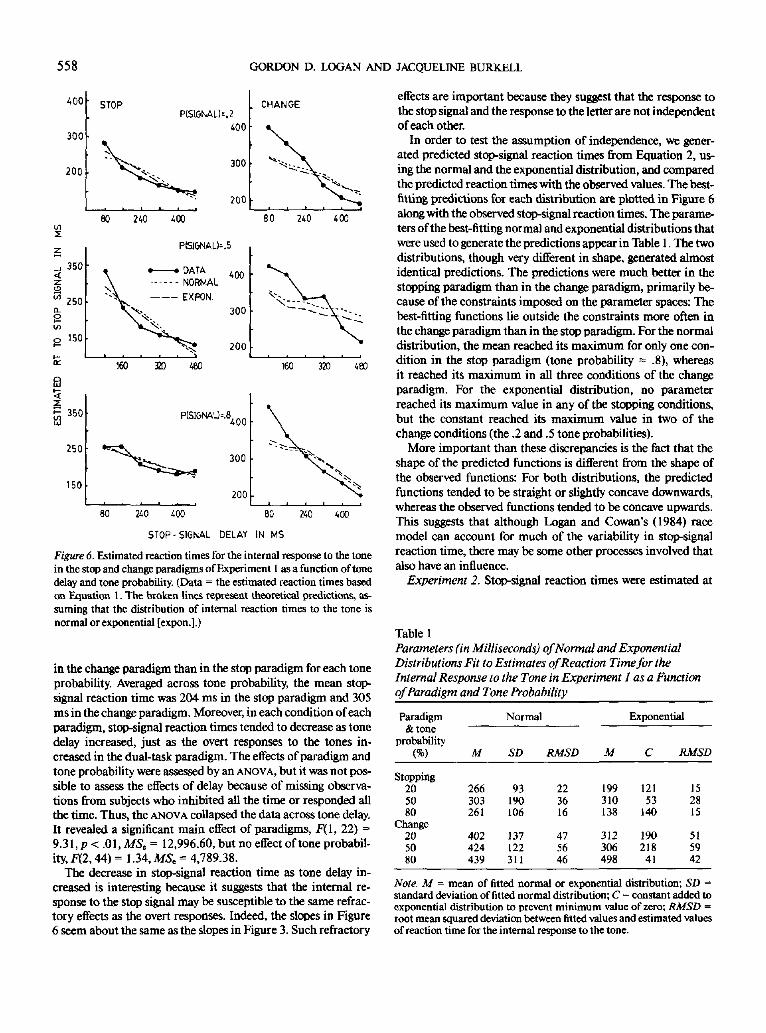
558 GORDON D. LOGAN AND JACQUELINE BURKELL
A 00
300
200
STOPP(SffiNAL)=,2
400
300
200
CHANGE
80 240 400 80 240 400
200
160 320 480 160 320 480
I350
250
150
PK16NALK8,
300
200
80 240 400 80 240 400
STOP-SIGNAL DELAY IN MS
Figure 6. Estimated reaction times for the internal response to the tonein the stop and change paradigms ofExperiment 1 as a function of tone
delay and tone probability. (Data = the estimated reaction times basedon Equation 1. The broken lines represent theoretical predictions, as-
suming that the distribution of internal reaction times to the tone is
normal or exponential [expon.].)
in the change paradigm than in the stop paradigm for each tone
probability. Averaged across tone probability, the mean stop-
signal reaction time was 204 ms in the stop paradigm and 305
ms in the change paradigm. Moreover, in each condition of each
paradigm, stop-signal reaction times tended to decrease as tone
delay increased, just as the overt responses to the tones in-
creased in the dual-task paradigm. The effects of paradigm and
tone probability were assessed by an ANOVA, but it was not pos-
sible to assess the effects of delay because of missing observa-
tions from subjects who inhibited all the time or responded all
the time. Thus, the ANOVA collapsed the data across tone delay.
It revealed a significant main effect of paradigms, F(l, 22) =
9.31,p< .Ol,MSt = 12,996.60, but no effect of tone probabil-
ity, F{2,44) = 1.34, MS, = 4,789.38.
The decrease in stop-signal reaction time as tone delay in-
creased is interesting because it suggests that the internal re-
sponse to the stop signal may be susceptible to the same refrac-
tory effects as the overt responses. Indeed, the slopes in Figure
6 seem about the same as the slopes in Figure 3. Such refractory
effects are important because they suggest that the response to
the stop signal and the response to the letter are not independent
of each other.
In order to test the assumption of independence, we gener-
ated predicted stop-signal reaction times from Equation 2, us-
ing the normal and the exponential distribution, and compared
the predicted reaction times with the observed values. The best-
fitting predictions for each distribution are plotted in Figure 6
along with the observed stop-signal reaction times. The parame-
ters of the best-fitting normal and exponential distributions that
were used to generate the predictions appear in Table 1. The two
distributions, though very different in shape, generated almost
identical predictions. The predictions were much better in the
stopping paradigm than in the change paradigm, primarily be-
cause of the constraints imposed on the parameter spaces: The
best-fitting functions lie outside the constraints more often in
the change paradigm than in the stop paradigm. For the normal
distribution, the mean reached its maximum for only one con-
dition in the stop paradigm (tone probability = .8), whereas
it reached its maximum in all three conditions of the change
paradigm. For the exponential distribution, no parameter
reached its maximum value in any of the stopping conditions,
but the constant reached its maximum value in two of the
change conditions (the .2 and .5 tone probabilities).
More important than these discrepancies is the fact that the
shape of the predicted functions is different from the shape of
the observed functions: For both distributions, the predicted
functions tended to be straight or slightly concave downwards,
whereas the observed functions tended to be concave upwards.
This suggests that although Logan and Cowan's (1984) race
model can account for much of the variability in stop-signal
reaction time, there may be some other processes involved that
also have an influence.
Experiment 2. Stop-signal reaction times were estimated at
Table 1
Parameters (in Milliseconds) of Normal and Exponential
Distributions Fit to Estimates of Reaction Time for the
Internal Response to the Tone in Experiment 1 as a Function
of Paradigm and Tone Probability
Paradigm&tone
probability(%)
Stopping205080
Change205080
Normal
M
266303261
402424439
SD
93190106
137122311
RMSD
223616
475646
M
199310138
312306498
Exponential
C
12153
140
19021841
RMSD
152815
515942
Note. M = mean of fitted normal or exponential distribution; SD =standard deviation of fitted normal distribution; C = constant added toexponential distribution to prevent minimum value of zero; RMSD =root mean squared deviation between fitted values and estimated valuesof reaction time for the internal response to the tone.

STOP, CHANGE, AND DUAL-TASK PARADIGMS 559
350
250
150
STOP
240 400
P 150
OL
S5 '
g 350i/iUJ
250
150
EXPOH.
160 320 480
350
250
150
350
250
150
350
250
150
DAY 2
80 240 400
DAY 4
160 320 480
DAY 6
80 240 400 80 240 400
STOP-SIGNAL DELAY IN MS
Figure 7. Estimated reaction times for the internal response to the tonein the stop paradigm of Experiment 2 as a function of tone delay and
practice. (Data = the estimated reaction times based on Equation 1.The broken lines represent theoretical predictions, assuming that the
distribution of internal reaction times to the tone is normal or exponen-
tial [expon.].)
each delay for each subject in each condition each day by using
the same method as in Experiment 1. The means across subjects
in the stop paradigm are displayed in Figure 7, and the means
across subjects in the change paradigm are displayed in Fig-
ure 8.
Stop-signal reaction times tended to be higher in the change
paradigm than in the stop paradigm (averaging 250 ms vs. 206
ms, respectively), and they tended to decrease as tone delay in-
creased in both paradigms. Again, the effects of paradigm and
tone probability were assessed by an AND v A, collapsing the data
across tone delay. It revealed a significant main effect of para-
digms, F(l, 10) = 5.24,p < .05, MS, = 20,654.65; a significant
main effect of sessions, P(5, 50) = 3.92, p < .01, MS, = 894.26;
and a marginal interaction between paradigms and sessions,
F(5, 50) = 2.25, p < .07, MS, = 894.26.
As before, Equation 2 was fit to the data, using the normal
and the exponential distribution, and the best-fitting predic-
tions are plotted in Figures 7 and 8 along with the observed tone
reaction times. The best-fitting parameters for the normal and
exponential distributions that were used to generate the predic-
tions appear in Table 2. This time, the predictions appeared to
be about as good in the change paradigm as they were in the stop
paradigm. However, neither of the parameters of the normal
distribution reached their limits in the stop paradigm, whereas
the mean reached its upper limit on Days 2, 3, and 4 of the
change paradigm. For the exponential distribution, the constant
reached its limit on one session in the stop paradigm (Day 5),
yet it reached its limit on every session in the change paradigm.
Again, the predicted functions were shaped differently from
the observed functions, tending to be straight, whereas the ob-
served functions tended to be concave upwards. Though the
race model can predict a range of variation in stop-signal reac-
tion time that is about as large as the observed variation, the
difference in pattern suggests that the race model may not be
the only process contributing to the variation.
General Discussion
The results of the two experiments were consistent with pre-
vious findings in the literature on dual-task and stopping para-
digms, demonstrating interference in the former and a general
lack of interference in the latter, under identical stimulus condi-
350
CHANGEDAY1 350
250
150
DAY 2
80 240 400
< 36°o
o. 250o
e isoDC
OUJ
<p 350i/jUJ
250
150
NORMAL
EXPON.250
160 320 480 160 320 480
350
250
150
80 240 400 80 240 400
STOP-SIGNAL DELAY IN MS
Figure 8. Estimated reaction times for the internal response to the tonein the change paradigm of Experiment 2 as a function of tone delay andpractice. (Data = the estimated reaction times based on Equation 1.The broken lines represent theoretical predictions, assuming that thedistribution of internal reaction times to the tone is normal or exponen-tial [expon.].)
560 GORDON D. LOGAN AND JACQUELINE BURKELL
Table 2
Parameters (in Milliseconds) of Normal and Exponential
Distributions Fit to Estimates of Reaction Time for the
Internal Response to the Tone in Experiment 2 as a
Function of Paradigm and Practice
Paradigm &practice
StoppingDay 1Day 2Day 3Day 4Day 5Day 6
ChangeDaylDay 2Day 3Day 4Day 5Day 6
Normal
M
297264250260255256
341320318330306274
SD
1138347643877
346656734236
RMSD
404640355128
271819222731
M
258215152179161205
169248226283192144
Exponential
C
114114156141165118
259172192147214199
RMSD
343631274418
242624472127
Note. M = mean of fitted normal or exponential distribution; SD =standard deviation of fitted normal distribution; C - constant added toexponential distribution to prevent minimum value of zero; RMSD =root mean squared deviation between fitted values and estimated valuesof reaction time for the internal response to the tone.
tions. The results from the change task provide some insight
into the different amounts of interference in the dual-task and
stopping paradigms, suggesting that response competition was
the major source of interference. The evidence supporting these
conclusions will be summarized, and some implications will be
discussed.
Dual-Task Paradigm
In the dual-task paradigm, subjects had to complete two re-
sponses, and there was substantial interference between them.
The shorter the delay between the tone and the letter, the longer
the tone reaction times—a finding that reflects the refractory
effect observed in many other studies (e.g., Kahneman, 1973;
Kantowitz, 1974). The response to the letter was apparently
protected from interference, because there was very little
difference between letter-plus-tone reaction times and letter-
only reaction times.
Stopping Paradigm
In the stopping paradigm, there was very little evidence of
interference between the response to the letter and the (internal)
response to the tone (i.e., the stop signal). As predicted by Lo-
gan and Cowan's (1984) race model, on the assumption that the
response to the letter and the response to the stop signal were
independent, letter reaction times for responses that escaped in-
hibition (signal-respond trials) were considerably faster than let-
ter reaction times from no-signal trials. Moreover, estimates of
reaction time to the stop signal were very fast, and most of the
effect of stop-signal delay could be accounted for in terms of
variation in stop-signal reaction times, which is consistent with
the assumption of independence. However, three effects sug-
gested nonindependence;
First, letter-only reaction times were substantially longer in
the stopping paradigm than in the dual-task paradigm, and they
were affected much more by tone probability. These effects sug-
gest that the stopping task suffered more interference than the
dual task did, but that seems unlikely. For one thing, most theo-
retical analyses would suggest that the dual task is more de-
manding, because it involves the production of two motor re-
sponses in addition to the stimulus processing that is required
for the stopping task. For another, the largest differences be-
tween paradigms occurred on letter-only trials, in which there
was no other task to produce interference. None of the current
interpretations of dual-task interference would predict more in-
terference in single-task (i.e., letter-only) conditions than in du-
al-task (i.e., letter-plus-tone) conditions (e.g., Kahneman, 1973;
Keele & Neill, 1978; Navon & Gopher, 1979; Schweikert &
Boggs, 1984; Wickens, 1984).
We suspect that the stop-paradigm letter-only reaction times
were slower because subjects waited for the tone before respond-
ing. The stopping task and the go task impose opposite demands
on the subject—slow responses in the go task increase the prob-
ability of stopping, whereas fast responses to the go task de-
crease the probability of stopping. Thus it would not be surpris-
ing if subjects traded speed in the go task for success in the stop-
ping task. Indeed, previous stopping studies indicate that
subjects tend to wait for the stop signal (e.g., Lappin & Eriksen,
1966; Oilman, 1973), and they wait longer the higher the proba-
bility that the stop signal will occur (Logan, 1981). The large
differences in the present study probably reflect the rather high
tone probabilities (50%-80%); previous studies used much
lower tone probabilities (typically less than 30%).
The second effect that suggested nonindependence was the
difference in shape between the stop-signal reaction times pre-
dicted from Equation 2 and the "observed" values estimated
from Equation 1. The upward concavity in the observed values
suggests a refractory effect that could not be accounted for by
variance in stop-signal reaction times. However, if a refractory
effect occurred, it was rather small, averaging 42 ms in the stop-
ping conditions and 59 ms in the change condition (comparing
predicted with observed values at the 80-ms delay in Figures 6,
7, and 8). By contrast, the refractory effect produced by re-
sponding overtly to the tone averaged 202 ms, if dual-task reac-
tion times from the shortest delay are compared with reaction
times from the longest delay (see Figures 3 and 4), or 341 ms if
dual-task reaction times are compared with tone-only (single-
task) reaction times at the shortest delay (see Figure 3).
The third effect that suggested nonindependence between the
stop and go tasks was the difference in stop-signal reaction times
in the stopping and change paradigms; stop-signal reaction
times were longer in the change paradigm than in the stopping
paradigm in both experiments. The response to the tone was
more complex in the change paradigm than in the stopping par-
adigm, and the difference in complexity may have resulted in
more competition for resources between tasks in the change
paradigm than in the stopping paradigm. Alternatively, subjects

STOP, CHANGE, AND DUAL-TASK PARADIGMS 561
in the change paradigm may have "grouped" the internal (stop-ping) and overt responses to the tone, and this may have slowedstop-signal reaction time without demanding more resources.We know very little about factors that affect reaction time to thestop signal; that is an important question for future research.
On the balance, the data do not deviate much from whatwould be expected if the processes responding to the stop signalwere independent of the processes responding to the letter. Inthe stopping paradigm, at least, the interference between theprocesses was small, relative to the large amount of interferenceobserved in the dual-task paradigm. One could be impressedby the fact that there was any interference at all in the stoppingparadigm, or by the fact that there was substantially more inter-ference in the dual-task paradigm. The latter is what we soughtto explain.
Change Paradigm
The change paradigm was intended to provide some insightinto the differences in interference observed in the dual-taskand stopping paradigms. When the tone sounded, change-para-digm subjects had to inhibit their response to the letter, likestop-paradigm subjects, and they also had to respond overtly tothe tone, like dual-task subjects. The most revealing results werereaction times to the tone partitioned according to whether ornot subjects inhibited the response to the letter. When theyfailed to inhibit the response to the letter (i.e., on signal-respondtrials), tone reaction times should suffer interference producedby a central bottleneck as well as interference produced by re-sponse competition, resulting from the requirement to maketwo overt responses. However, when subjects succeeded in in-hibiting the response to the letter (i.e., on signal-inhibit trials),tone reaction times should suffer only the interference pro-duced by a central bottleneck; there should be no response com-petition. By comparing the magnitude of the interference in sig-nal-respond and signal-inhibit conditions, we should be able toassess the relative importance of response competition and cen-tral bottlenecks as sources ofdual-task interference.
The results of both experiments were very clear: Signal-re-spond trials produced the same amount of interference as thedual-task trials, whereas signal-inhibit trials produced virtuallyno interference. This suggests that response competition wasthe most important source of interference in the dual-task para-digm, and it suggests that central bottlenecks produced verylittle dual-task interference. It also suggests that differences inresponse competition are primarily responsible for the largedifferences in interference observed in dual-task paradigms andstop-signal paradigms.
The point that response competition may produce more in-terference than competition for central resources was madeeven more clearly in a change-paradigm study by Logan (1985),in which the primary task was to make category or rhyme judg-ments about word pairs. As in the present experiments, overtreaction times to the tone were no different from dual-task con-trols if subjects failed to inhibit their responses to the word pair,but again, like the present experiments, overt reaction times tothe tone showed no interference if subjects succeeded in inhibit-ing their response to the word pair. However, another aspect of
Logan's (1985) experiments suggested that the preresponse pro-cessing was the same whether or not subjects inhibited their re-sponses, and thus, whether or not there was interference withthe overt response to the tone: The word pairs were presentedfor a second time in a block in which no tones were presented,and those word pairs whose responses were inhibited on the firstpresentation produced almost the same benefit from repetitionas word pairs whose responses had not been inhibited on thefirst presentation (also see Logan, 1983, Experiments 3 and 4).Apparently, inhibiting the response did not inhibit the prere-sponse processing that produced the benefit from repetition.The important point in the present context is that preresponse(i.e., central) processing did not interfere with the overt re-sponse to the tone.
The results from the change paradigm also have importantimplications for studies that use responses to auditory probesto assess the resource demands of visual tasks (e.g., Britton &Tesser, 1982; Posner& Boies, 1971), especially when probe re-action times are compared with control conditions in whichthere is no overt response to the visual task (e.g., the no-letter"control" of Johnson, Forester, Calderwood, & Weisgerber,1983, and of Ogden, Martin, & Paap, 1980). The present exper-iments suggest that those results may reflect response competi-tion more than competition for more central resources, con-trary to what the authors of those studies concluded. It wouldseem prudent to replicate the previous research with some othersecondary task and a more appropriate control condition beforeconclusions about resource demands can be made confidently(cf. McLeod, 1978).
References
Berlyne, D. E. (1957). Uncertainty and conflict: A point of contact be-
tween information-theory and behavior-theory concepts. Psychologi-
cal Review. 64, 329-339.
Britton, B. J., & Tesser, A. (1982). Effects of prior knowledge on use of
cognitive capacity in three complex cognitive tasks. Journal of Verbal
Learningand Verbal Behavior, 21,421-436.
Broadbent, D. E. (1956). Listening between and during practiced audi-
tory distractions. British Journal of Psychology, 47, 51-60.
Broadbent, D. E. (1958). Perception and communication. New York:
Pergamon Press.
Davis, R. (1957). The human operator as a single channel information
system. Quarterly Journal of Experimental Psychology, 9, 119-129.
Deutsch, J. A., & Deutsch, D. (1963). Attention: Some theoretical con-
siderations. Psychological Review, 70, 80-90.
Herman, L. M., & Kantowitz, B. H. (1970). The psychological refrac-
tory period effect: Only half the double-stimulation story? Psycholog-
ical Bulletin, 73. 74-88.
Johnson, P. J., Forester, J. A., Calderwood, R., & Weisgerber, S. A.
(1983). Resource allocation and the attentional demands of letter en-
coding. Journal of Experimental Psychology: (ieneral, 112, 616-638.
Kahneman, D. (197 3). A ttention and effort. Englewood Cliffs, NJ: Pren-
tice-Hall.
Kantowitz, B. H. (1974). Double stimulation. In B. H. Kantowitz (Ed.),
Human information processing: Tutorials in performance and cogni-
tion (pp. 83-131). Hillsdale, NJ: Erlbaum.Karlin, L., & Kestenbaum, R. (1968). Effects of number of alternatives
on the psychological refractory period. Quarterly Journal of Experi-mental Psychology, 20, 167-178.
562 GORDON D. LOGAN AND JACQUELINE BURKELL
Keele, S. W. (1973). Attention and human performance. Pacific Pali-
sades, CA: Goodyear.
Keele, S. W., & Neill, W. T. (1978). Mechanisms of attention. In E. C.
Carterette & P. Friedman (Eds.), Handbook of perception (Vol. 9, pp.
3-47). New York: Academic Press.
Lappin, J. S., & Eriksen, C. W. (1966). Use of a delayed signal to stop a
visual reaction time response. Journal of Experimental Psychology,
72,805-811.
Lisberger, S. G., Fuchs, A. E, King, W. M., & Evinger, L. C. (1975).
Effect of mean reaction time on saccadic responses to two-step stimuli
with horizontal and vertical components. Vision Research, 15, 1021-
1025.
Logan, G. D. (1979). On the use of a concurrent memory load to mea-
sure attention and automaticity. Journal of Experimental Psychology:
Human Perception and Performance, 5, 189-207.
Logan, G. D. (1981). Attention, automaticity, and the ability to stop a
speeded choice response. In J. Long & A. D. Baddeley (Eds.), Atten-
tion and performance IX (pp. 205-222). Hillsdale, NJ: Erlbaum.
Logan, G. D. (1983). On the ability to inhibit simple thoughts and ac-
tions: I. Stop-signal studies of decision and memory. Journal of Ex-
perimental Psychology: Learning, Memory, and Cognition, 9, 585-
606.
Logan, G. D. (1985). On the ability to inhibit simple thoughts and ac-
tions: II. Stop-signal studies of repetition priming. Journal of Experi-
mental Psychology: Learning, Memory, and Cognition, 11.675-691.
Logan, G. D., & Cowan, W. B. (1984). On the ability to inhibit thought
and action: A theory of an act of control. Psychological-Review, 91,
295-327.
Logan, G. D., Cowan, W. B., & Davis, K. A. (1984). On the ability to
inhibit simple and choice reaction time responses: A model and a
method. Journal of Experimental Psychology: Human Perception and
Performance, 10, 276-291.
Logan, G. D., Zbrodoff, N. J., & Fostey, A. R. (1983). Costs and benefits
of strategy construction in a speeded discrimination task. Memory &
Cognition. 11, 485-493.
McLeod, P. D. (1978). Does probe RT measure central processing de-
mand? Quarterly Journal of Experimental Psychology, SO, 83-89.
Navon, D., & Gopher, D. (1979). On the economy of the human pro-
cessing system. Psychological Review, 86, 214-255.
Ninio, A. (1975). The effect of first response complexity on the psycho-
logical refractory period: A reanalysis. Memory & Cognition, 3, 160-
166.
Norman, D. A. (1968). Toward a theory of memory and attention. Psy-
chological Review, 75, 522-536.
Ogden, W. C., Martin, D. W., &Paap, K. R. (1980). Processing demands
of encoding: What does secondary task performance reflect? Journal
of Experimental Psychology: Human Perception and Performance, 6,
355-367.
Oilman, R. T. (1973). Simple reactions with random countermanding
of the "go" signal. In S. Korablum (Ed.), Attention and performance
JF(pp. 571-581). New York: Academic Press.
Pashler, H. (1984). Processing stages in overlapping tasks: Evidence for
a central bottleneck. Journal of Experimental Psychology: Human
Perception and Performance, 10, 358-377.
Posner, M. I., & Boies, S. J. (1971). Components of attention. Psycholog-
ical Review, 78, 391-408.
Proctor, R. W., & Proctor, J. D. (1979). Secondary task modality, expec-
tancy, and the measurement of attentional capacity. Journal of Exper-
imental Psychology: Human Perception and Performance, 5, 610-
624.
Reynolds, D. (1964). Effects of double stimulation: Temporary inhibi-
tion of response. Psychological Bulletin, 62, 333-347.
Schweikert, R., & Boggs, G. J. (1984). Models of central capacity and
concurrency. Journal of Mathematical Psychology, 28, 223-281.
Treisman, A. M., & Davies, A. (1973). Divided attention to ear and to
eye. In S. Korablum (Ed.), Attention and performance /K(pp. 101-
117). New York: Academic Press.
Welford, A. T. (1952). The 'psychological refractory period' and the
timing of high-speed performance: A review and a theory. British
Journal of Psychology, 43, 2-19.
Wickens, C. D. (1984). Processing resources in attention. In R. Para-
suraman, R. Davies, & J. Beatty (Eds.), Varieties of attention (pp. 63-
102). New York: Academic Press.
Winer, B. J. (1962). Statistical principles in experimental design. New
York: McGraw-Hill.
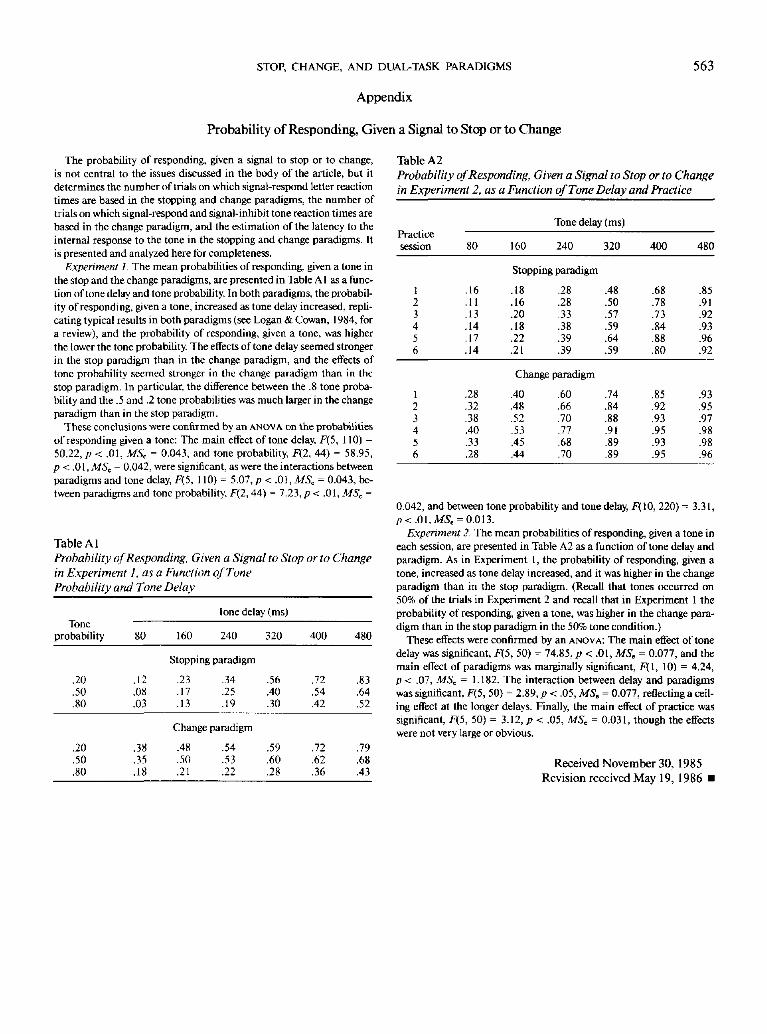
STOP, CHANGE, AND DUAL-TASK PARADIGMS 563
Appendix
Probability of Responding, Given a Signal to Stop or to Change
The probability of responding, given a signal to stop or to change,is not central to the issues discussed in the body of the article, but itdetermines the number of trials on which signal-respond letter reaction
times are based in the stopping and change paradigms, the number oftrials on which signal-respond and signal-inhibit tone reaction times arebased in the change paradigm, and the estimation of the latency to the
internal response to the tone in the stopping and change paradigms. Itis presented and analyzed here for completeness.
Experiment 1. The mean probabilities of responding, given a tone in
the stop and the change paradigms, are presented in Table AI as a func-tion of tone delay and tone probability. In both paradigms, the probabil-
ity of responding, given a tone, increased as tone delay increased, repli-
cating typical results in both paradigms (see Logan & Cowan, 1984, fora review), and the probability of responding, given a tone, was higher
the lower the tone probability. The effects of tone delay seemed stronger
in the stop paradigm than in the change paradigm, and the effects oftone probability seemed stronger in the change paradigm than in the
stop paradigm. In particular, the difference between the .8 tone proba-bility and the .5 and .2 tone probabilities was much larger in the change
paradigm than in the stop paradigm.These conclusions were confirmed by an ANOVA on the probabilities
of responding given a tone: The main effect of tone delay, F(5, 110) =50.22, p < .01, MS, = 0.043, and tone probability, F(2, 44) = 58.95,
p < .01, MS, = 0.042, were significant, as were the interactions betweenparadigms and tone delay, F(5, 110) = 5.07, p < .01, MS, = 0.043, be-tween paradigms and tone probability, F(2, 44) = 7.23, p < .01, MS, =
Table A1
Probability of Responding, Given a Signal to Stop or to Change
in Experiment I, as a Function of Tone
Probability and Tone Delay
Toneprobability
Tone delay (ms)
80 160 240 320 400 480
Stopping paradigm
.20
.50
.80
.12
.08
.03
.23
.17
.13
.34
.25
.19
.56
.40
.30
.72
.54
.42
.83
.64
.52
Change paradigm
.20
.50
.80
.38
.35
.18
.48
.50
.21
.54
.53
.22
.59
.60
.28
.72
.62
.36
.79
.68
.43
Table A2
Probability o/Responding, Given a Signal to Stop or to Change
in Experiment 2, as a Function of Tone Delay and Practice
Practicesession
Tone delay (ms)
80 160 240 320 400 480
Stopping paradigm
123456
.16
.11
.13
.14
.17
.14
.18
.16
.20
.18
.22
.21
.28
.28
.33
.38
.39
.39
.48
.50
.57
.59
.64
.59
.68
.78
.73
.84
.88
.80
.85
.91
.92
.93
.96
.92
Change paradigm
123456
.28
.32
.38
.40
.33
.28
.40
.48
.52
.53
.45
.44
.60
.66
.70
.77
.68
.70
.74
.84
.88
.91
.89
.89
.85
.92
.93
.95
.93
.95
.93
.95
.97
.98
.98
.96
0.042, and between tone probability and tone delay, F( 10, 220) = 3.31,p<. Ol,MS,= 0.013.
Experiment 2, The mean probabilities of responding, given a tone ineach session, are presented in Table A2 as a function of tone delay and
paradigm. As in Experiment 1, the probability of responding, given a
tone, increased as tone delay increased, and it was higher in the changeparadigm than in the stop paradigm. (Recall that tones occurred on
50% of the trials in Experiment 2 and recall that in Experiment 1 the
probability of responding, given a tone, was higher in the change para-digm than in the stop paradigm in the 50% tone condition.)
These effects were confirmed by an ANOVA: The main effect of tonedelay was significant, F(5, 50) = 74.85, p < .01, MS, = 0.077, and themain effect of paradigms was marginally significant, F(l, 10) = 4.24,
p < .07, MS, = 1.182. The interaction between delay and paradigmswas significant, F(5, 50) = 2.89, p < .05, MS, = 0.077, reflecting a ceil-ing effect at the longer delays. Finally, the main effect of practice was
significant, f\5, 50) = 3.12, p < .05, MS, = 0.031, though the effectswere not very large or obvious.
Received November 30, 1985
Revision received May 19, 1986 •