Transporation Improvement Program for the Oshkosh Urbanized Area 2013

1 | P a g e
DEPARTMENT OF TRANSPORATION
STATE OF GEORGIA
OFFICE OF MATERIALS AND TESTING
Testing Management
RTT Roadway Testing Technician
2017 Study Guide

2 | P a g e
Testing Management
Bureau Chief: Rick Douds
Branch Chief: Al Casteel
Branch Supervisor: Torrey Wall
Branch Supervisor: Tad Hardeman
Testing Management Operation Supervisors
Branch Lab I: Kris York
Branch Lab II: Tommy Gunn
Branch Lab III: Brent Johnson
Branch Lab IV: Larry Warren Jr.
Branch Lab V: David Graham
Branch Lab VI: Brian Hammond
Branch Lab VII: Reggie Lemaster

3 | P a g e
Table of Content
Roadway Testing Technician Study Guide
Page Titles
4 INTRODUCTION
6 GDOT/RTT CERTIFICATION PROCESS
9 SAMPLING AND TESTING REQUIREMENTS
10 Section 207-Excavation and backfill for minor Structures
16 Section 208-Embankment
25 Section 209-Subgrade construction
32 Section 211-Bridge Excavation and Backfill
37 Section 310-Graded Aggregate Construction
42 Section 400- Asphaltic concrete
Note: The GDT’s have been inserted into the study guide but it is strongly recommended that you use the
links located on page 151 to use these most current versions from the source since they are updated from
time to time
GDT’s
82 GDT-7
112 GDT-21
115 GDT-39
118 GDT-59
121 GDT-67
167 GDT-73
173 SAMPLING, TESTING AND INSPECTION COMPACTION
REQUIREMENTS
174 GENERAL INFORMATION FOR ROADWAY SAMPLING AND
TESTING
192 INTERDEPARTMENTAL CORRESPONDENCE (Sampling and Testing)
193 REFERENCES
194 ROADWAY TESTING TECHNICIAN EQUIPMENT CHECKLIST

4 | P a g e
INTRODUCTION
I. PURPOSE
The purpose of this study guide is to provide information that is required to learn the necessary
procedures and standards established by the Department to become qualified in the field of
Sampling, Testing and Inspection responsibilities. The Sampling and Testing procedures and
Standards Specifications were established to insure that high quality materials that meet
Specifications are incorporated into the work and that construction achieves the specified end. The
evidence of testing is an “approved” test report.
The purpose and necessity for evidence of tests completed should be understood by all Contractors,
Engineers and Technicians of the Department. It should not be thought that the purpose and only
result of testing are pieces of paper (test reports). However, this evidence of testing is needed and
important, for it is the record of performed tasks. A test report must give complete, clear and precise
results.
It is the Contractor’s responsibility to control the materials and construction in such a manner that the
specifications are met. It is the Materials Technician and Engineer’s responsibility to evaluate
materials and construction to verify that Specifications are met.
All information included within this guide will aid in the success of Roadway Testing Technicians
becoming proficient performing the essential tasks for Sampling, Testing and Inspection of materials
used in roadway construction.
II. TYPES OF SAMPLES AN TESTS
A. Preliminary Samples
Preliminary samples provide design data and serve to evaluate material sources. Soil
survey samples, pit exploration samples, source approval samples, and trial asphalt
concrete mix samples are examples of preliminary samples. These samples are taken by
personnel of the Department of Transportation, by Materials Producers, or by Contractors,
and are tested in the Central Laboratory or Branch Laboratories. Preliminary samples are
not used for acceptance of materials on construction.
B. ACCEPTANCE SAMPLES AND TESTS
Acceptance samples and tests determine acceptability of materials used in construction.
Generally, for materials other than those pre-inspected, samples are taken by field testing
personnel and are tested either in a field laboratory or submitted to a Branch or Central
Laboratory. When it is appropriate, acceptance testing can be done in field laboratories.
There are a few tests, not well suited to field testing, which must be performed in the
Branch or Central Laboratory, and these are outlined within the Sampling & Testing
Manual under the construction item for which specified.
Acceptance samples and tests are taken or performed by Department of Transportation
personnel.

5 | P a g e
C. INDEPENDENT ASSURANCE SAMPLES AND TESTS
Independent Assurance is a system based program that evaluates certified technicians at a
minimum of 1 per every three years for any certifications that you may hold.
D. QUALITY ASSURANCE SAMPLES AND TESTS
These samples and tests are taken or performed by Office of Materials and Testing
personnel to verify the quality of materials certified under approved supplier Quality
Control Programs. In addition, they serve to insure uniformity of testing between the
Department and the Producer.
E. COOPERATIVE SAMPLES
These are prepared samples which are tested in each of the Branch Laboratories and the
Central Laboratory. A program is operated through which samples of various materials
are split, assigned by random selection and tested in these seven Laboratories semi-
monthly. Results are tabulated and reviewed to insure that all laboratories are testing
uniformly.
The Central Laboratory participates in a comparison test program with the National
Reference Laboratories - AMRL and CCRL. Branch Laboratories receive AMRL
samples. In addition, the Office of Materials and Research maintains a Quality Control
Testing System, whereby this office verifies accuracy and precision measurements of
testing. This includes a program of equipment calibration and/or standardization,
personnel inspection and proficiency reviews performed at least once a year

6 | P a g e
GDOT/RTT CERTIFICATION PROCESS
The process for the Roadway Testing Technician to become certified through the Department to
perform Acceptance Testing for GDOT projects is as follows:
RTT – The RTT written exam will be administered by the Technical College System of Georgia.
Available dates and times for exams can be requested through the Technical Colleges in Georgia.
GDOT OMAT/TM Branch will administer the performance exam. The locations for the written
exams are located on GDOT website. For more information go to: http://www.dot.ga.gov/PartnerSmart/Training/technician/Documents/
RTT_QCT_Certificationexams.pdf
The respective Testing Management Operations Supervisor (TMOS) will manage the performance
exam and will be available to provide assistance to the RTT in attaining his or her certification. The
following is a list of the districts and the respective TMOS and their telephone numbers.
District 1 Gainesville, GA Kris York 770-531-5871
District 2 Tennille, GA Tommy Gunn 478-553-3464
District 3 Thomaston, GA Brent Johnson 706-646-6614
District 4 Tifton, GA Larry Warren Jr. 229-391-5561
District 5 Jesup, GA David Graham 912-530-4471
District 6 Cartersville, GA Brian Hammond 678-721-5366
District 7 Forest Park, GA Reggie Lemaster 404-608-4836
Questions in relation to the RTT certification process or re-certification of a technician should be
directed to:
Rick Douds 404-608-4805 Al Casteel 404-608-4811
Torrey Wall 706-646-6614 Tad Hardeman 706-646-6614

7 | P a g e
GDOT/RTT RE-CERTIFICATION PROCESS

8 | P a g e

9 | P a g e
SAMPLING AND TESTING REQUIREMENTS
SECTION I
This section of the study guide covers the requirements for sampling and testing of the materials
being used in the construction work. It is the responsibility of the Testing Management personnel
technical services (on certain items I. A. can take acceptance) to sample and test all materials as
frequently as necessary to assure that all materials being used conform to the specifications. The
requirements set forth in this section are not arrived at for the purpose of producing voluminous files,
but have been determined from experience and/or research which have shown that generally
materials with normal uniformity can be sampled at the rates shown with the assurance that the
materials being used are represented by tests. Where materials exhibit non-uniformity, as shown by
either, it is expected that the frequency of testing will be increased.
The Technician must use judgment in completing the sample card for the item “quantity
represented.” Whereas minor deviations in quantity represented and used is not of great importance
from a total tested - total used standpoint, the important item is proper testing of all materials being
used. This must be reflected in reasonably accurate estimates of the quantity of materials the sample
is taken from. Where materials from a stockpile, plant, etc., are being used on more than one
contract, any sample may represent material for all contracts simply by including separate sample
cards for each contract. If a sample is taken to represent more than one contract, the total quantity
represented on the separate cards should not exceed the allowed quantity represented by any sample
as shown in this Section. A reasonably accurate estimate should be made of the quantities being used
at that time on each project and the total quantity shown for the sample should be reduced
percentage-wise for each card. As an example, if woven wire fabric for fence is being used from the
same stockpile for three contracts, a single sample may be submitted with sample cards for all three
contracts including with the sample. If about 40 percent of the woven wire fabric was going to
Project A and the other 60 percent about equally divided between Project B and C, and since Section
643 allows a sample to represent 50 rolls; then the card for Project A would show the sample
representing 20 rolls; Project B and C sample cards would show the sample representing 15 rolls
each. Where more than one project is let in the same contract, one sample card showing all the
projects of that contract that the material is being used on will be sufficient. Therefore, when
separate projects are let under a single contract, one card listing all the applicable projects is
sufficient and when separate projects are let under separate contracts, a card for each project must be
submitted with the sample.
Proper evaluation of test results is dependent upon usage of the materials in many instances.
Therefore, the sample card submitted with each sample should identify under “to be tested for,” the
materials by construction specification number or pay item number and the materials reference
number. As an example, No. 89 stone being used in bituminous seal should be identified on the
sample card as “Section 424, Article 800.01” and if this same material was used in asphaltic
concrete, it would be identified as “Section 400, Article 802.02.” This same scheme should be used
on project control test reports filled out in the field.

10 | P a g e
This additional identification should minimize problems in evaluating the test results and in the final
materials audit required for submission of the “Materials Certificate.”
Certain materials are pretested by inspectors from the Central Laboratory or by our authorized
inspection agency and stamped or tagged with the “GDT” or inspection agency inspection number.
Sampling requirements for these materials are specified in the Manual. Occasionally, additional
materials, not mentioned in the Manual as such, may be pretested. Any pretested materials may be
used without further testing provided they are satisfactory from a visual inspection and information
sufficient to identify the shipment is submitted to the Central Laboratory. Any pretested material
may be sampled and tested at the option of the Field Engineer.
In order that all material used in the work conform to the Specifications, any material not field tested
should be submitted to the Laboratory sufficiently in advance to be tested and reported prior to use.
Any samples specified in this Section to be submitted to the Branch Laboratory may be submitted to
the Central Laboratory.
This Section outlines the minimum sampling and testing requirements by Construction Section. All
Materials set forth for use in each construction section are described separately. Where the materials
are being used at the same time for more than one construction item, notation should be made in the
project materials records and on the sample cards.
Material which fails according to the specification should not be resampled for compliance unless
there is evidence of faulty sampling or testing. By continual resampling, it is obvious that passing
samples could be obtained. All resampling should be approved by the Testing Management
Supervisor.
11 | P a g e
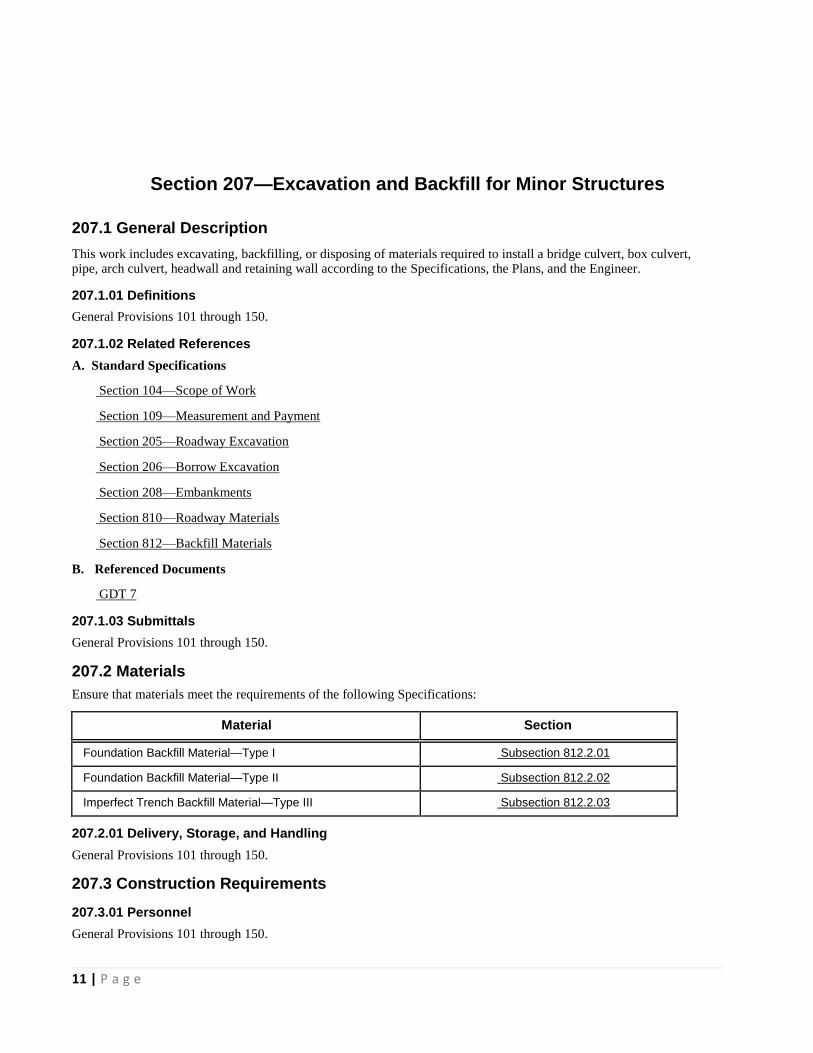
Section 207—Excavation and Backfill for Minor Structures
207.1 General Description This work includes excavating, backfilling, or disposing of materials required to install a bridge culvert, box culvert, pipe, arch culvert, headwall and retaining wall according to the Specifications, the Plans, and the Engineer. 207.1.01 Definitions General Provisions 101 through 150. 207.1.02 Related References A. Standard Specifications
Section 104—Scope of Work
Section 109—Measurement and Payment
Section 205—Roadway Excavation
Section 206—Borrow Excavation
Section 208—Embankments
Section 810—Roadway Materials
Section 812—Backfill Materials B. Referenced Documents
GDT 7 207.1.03 Submittals General Provisions 101 through 150. 207.2 Materials Ensure that materials meet the requirements of the following Specifications:
Material Section
Foundation Backfill Material—Type I Subsection 812.2.01
Foundation Backfill Material—Type II Subsection 812.2.02
Imperfect Trench Backfill Material—Type III Subsection 812.2.03
207.2.01 Delivery, Storage, and Handling
General Provisions 101 through 150.
207.3 Construction Requirements
207.3.01 Personnel
General Provisions 101 through 150.

12 | P a g e
207.3.02 Equipment
General Provisions 101 through 150.
207.3.03 Preparation
General Provisions 101 through 150.

13 | P a g e
Section 207—Excavation and Backfill for Minor Structures
207.3.04 Fabrication General Provisions 101 through 150. 207.3.05 Construction A. Locations and Elevations
The Engineer will determine final locations and elevations of the structure. The locations and elevations shown on the Plans are approximate.
B. Excavation
The Engineer will determine the minimum requirements for length and depth of excavation for each structure. Assume the responsibility for the cost of installing necessary sheeting and bracing.
When excavating, follow these requirements:
Excavate through rock or boulder formations to at least 1 ft (300 mm) below the bottom of the structure, except for where the entire concrete or masonry structure rests on solid rock.
Backfill with Type I or Type II material to the proper subgrade elevation.
As the embankment is constructed, excavate and place pipe on the new embankment. Pipe may be placed incrementally on steep gradients.
Cut surfaces at structure trenches to prevent damage to the adjacent pavement when existing paved areas will be retained.
Saw pavements deep enough to cause the edges to break in straight lines.
Ensure that the width, depth, and vertical walls of an excavated imperfect trench conform to Plan details and dimensions within 2 in (50 mm).
Dispose of surplus and unsuitable materials as directed by the Engineer.
Consider excavated material as unclassified excavation according to Section 205, except that the Department will not pay for excavation for minor structures.
Include the cost of fulfilling these requirements in the price bid for the pipe.
C. Backfill
Obtain backfill materials that meet the Specifications from sources approved by the Engineer.
1. Foundation Backfill Materials, Types I and II
Use the following materials as shown on the Plans or as directed by the Engineer:
a. Use Type I material in dry structure trenches and Type II material in wet trenches.
b. Use Type I material as a finishing course for Type II material when permitted by the Engineer.
c. Backfill excavations beyond the specified limits with the same type of material required for the adjacent area; however, the Department will not measure excess backfill material for payment.
d. Place Type I and Type II backfill material in layers of no more than 6 in (150 mm) loose.
e. Compact each layer as follows:
1) Type I Backfill Material: Compact to 95 percent of the theoretical dry density determined by GDT 7.
2) Type II Backfill Material: Compact to a satisfactory uniform density as directed by the Engineer.
2. Imperfect Trench Backfill Material, Type III
Place this material as loose uncompacted backfill over pipe structures as shown on the Plans where imperfect trench backfill is specified.
3. Normal Backfill

14 | P a g e
Section 207—Excavation and Backfill for Minor Structures
Ensure that normal backfill material meets the requirements of Subsection 810.2.01, Class I or II. Place and compact according to Section 208 except as follows:
a. Do not place rock more than 4 inches (100 mm) in diameter within 2 ft (600 mm) of any drainage structure.
b. For backfill behind retaining walls, use a pervious material that meets the requirements of Case I or Case II as
follows:
1) Case I. Case I refers to backfills for retaining walls that support roadbeds and parking areas.
Ensure that the backfill conforms to Section 208. Do not place rock more than 4 in (100 mm) in diameter within 2 ft (600 mm) of the retaining wall or finished surface.
2) Case II. Case II refers to backfills for retaining walls that do not support roadbeds or parking areas.
Ensure that the backfill conforms to the requirements of Case I above, except compact the backfill to the density of the adjacent soil.
D. Pavement Replaced
Replace pavement removed at structure trenches in kind where adjacent pavements will be retained. An equal or better material may be used when approved by the Engineer.
Backfill and maintain a smooth riding surface until repaving is complete.
207.3.06 Quality Acceptance General Provisions 101 through 150. 207.3.07 Contractor Warranty and Maintenance General Provisions 101 through 150. 207.4 Measurement A. Excavation
The following considerations are not measured for payment:
Excavation for minor structures, including undercut for backfill materials as shown on the Plans
Excavation for an imperfect trench which is required at locations specified in the Plans but which is not measured for payment
Removal of water
Removal of material from any area required to be reexcavated
Excavation and backfill of temporary drainage ditches B. Extra Depth Excavation
The following extra depth excavations are not measured for payment:
1. Extra depth excavation because of Contractor negligence
2. Extra depth excavation (required by the Engineer) below the original Plan elevation of the bottom of the footing or the flow line of a culvert pipe that does not exceed 3 ft (1 m)
If the Engineer relocates the structure or orders the elevation of the bottom of the footing or the flow line of the pipe to
be lowered or undercut more than 3 ft (1 m), the Contractor will be compensated for the extra depth excavated below
the 3 ft (1 m) limit according to Subsection 104.04 and Subsection 109.05.
Calculate the width of extra depth excavation using the diameter of the pipe or the width of the footing plus 2 ft (600 mm).
The length of extra depth excavation is equal to the length of that portion of the structure that is lowered more than 3 ft (1 m) below Plan elevation.

15 | P a g e
C. Backfill Materials Types I, II, and III
1. Types I and II
These materials (in place and accepted) are measured in
cubic yards (meters) compacted.
Lateral measurements are confined to an area bounded by vertical planes lying not more than 1 ft (300 mm) outside of and parallel to the limits of the structure.
Length and depth measurements are confined to the dimensions of compacted material in place as specified by the Engineer. Materials placed outside the above limitations are not measured for payment.
2. Type III
The Department measures Type III material (complete, in
place, and accepted) in cubic yards (meters).
Lateral measurements of Type III material are confined to an area bounded by vertical planes lying directly above the outside walls of the structure.
Longitudinal measurements are confined to the length of treatment installed as specified. Measurements of depth are the dimensions shown on the Plans or as directed.
D. Normal Backfill
This Item is not measured separately, but is included in the measurement of the Items of excavation from which normal backfill materials are obtained.
207.4.01 Limits General Provisions 101 through 150. 207.5 Payment A. Excavation for Minor Structures
This Item will not be paid for separately except as provided in
Subsection 207.4.B. B. Sheeting and Bracing
Sheeting and bracing will not be paid for separately unless these materials are left in place at the written direction of the Engineer. In this case, the Contractor will be paid at invoice cost plus 10 percent.
C. Backfill Materials
Backfill material Type I, (measured as shown in Subsection 207.4.C.1) will be paid for according to Section 205 or Section 206.
The Department will pay for Types II and III separately at the
Contract Unit Price per cubic yard (meter). This payment is
full compensation for furnishing the materials from sources
inside or outside the right-of-way, loading, unloading,
hauling, handling, placing, and compacting the material. D. Normal Backfill
This Item will not be paid for directly but will be paid at the

16 | P a g e
Unit Price for the applicable excavation item from which the normal backfill materials are obtained.
Payment will be made under:
Item No. 207 Foundation backfill material, type II Per cubic yard (meter)
Item No. 207 Imperfect trench backfill material, type III Per cubic yard (meter)
207.5.01 Adjustments General Provisions 101 through 150.

17 | P a g e
Section 208—Embankments
208.1 General Description This work includes placing embankments, backfilling structures, and constructing earth berms and surcharges with suitable material excavated under Section 204, Section 205, Section 206, and Section 207. Complete the work according to the lines, grades, and typical cross- sections shown on the Plans or established by the Engineer. The work also includes preparing areas by backfilling stump holes and correcting surface irregularities where the
embankment is to be constructed. This includes forming, compacting, and maintaining the embankment and placing
and compacting approved material where unsuitable material has been removed. Payment for this work is included in other appropriate Pay Items unless a specific Pay Item is set up in the Contract. Apply all provisions of Section 161 to the work in this Section. Perform Shoulder Construction according to Section 216. 208.1.01 Definitions General Provisions 101 through 150. 208.1.02 Related References C. Standard Specifications
Section 161—Control of Soil Erosion and
Sedimentation Section 201—Clearing and Grubbing
Right-of-Way Section 204—Channel Excavation
Section 205—Roadway Excavation
Section 206—Borrow Excavation
Section 207—Excavation and Backfill for Minor
Structures Section 209—Subgrade Construction
Section 216—Unpaved Shoulders
Section 810—Roadway Materials
Section 811—Rock Embankment
Section 813—Pond Sand

18 | P a g e
D. Referenced Documents
GDT 7
GDT 20
GDT 21
GDT 24a
GDT 24b
GDT 59
GDT 67 208.1.03 Submittals General Provisions 101 through 150. 208.2 Materials Embankment material classes are defined in Section 810, Section 811, and Section 813. The material incorporated into the roadway will be subject to the following limitations: A. Embankment Material
Use embankment material classified as Class I, II, III, V, or VI except as noted below:
1. Inundated Embankments
A Special Provision in the Proposal will contain required gradation and other characteristics of materials for constructing embankments through reservoirs.
2. Intermittently Inundated Embankments
Build intermittently inundated embankments using any material suitable for embankment.
3. Embankments at Structures
Use Class I or II embankment materials within 10 ft (3 m) of any bridge structure. Class IIIC1 material may be used
in Districts 6 and 7. Class IIIC2 or IIIC3 material may only be used in Districts 6 and 7 if approved by the Office of
Materials and Research, Geotechnical Engineering Bureau. Ensure that materials do not contain rock larger than 3
in (75 mm) for any dimensions.
B. Rock Embankment
Ensure that rock embankment placed as indicated on the Plans meets the requirements of Section 811 unless specified otherwise in the Plans or in the Special Provisions.
C. In-Place Embankment
Construct in-place embankment with Class I, II, III, V, or VI material. D. Backfill Material
Use Class I or Class II backfill material furnished and stockpiled as defined in Subsection 810.2.01.A. Class
IIIC1 material may be used in Districts 6 and 7. Class IIIC2 or IIIC3 material may only be used in Districts 6 and
7 if approved by the Office of Materials and Research, Geotechnical Engineering Bureau. A Pond Sand Embankment
Use pond sand that meets the requirements of Section 813 as embankment material. Material is subject to the following approval limitations:

19 | P a g e
d. Pond sand will be approved on a stockpile basis only.
e. Pond Sand will not be approved for Type I or normal backfill materials or for backfill for mechanically stabilized walls.
f. Pond sand shall be encapsulated, when used as fill, with 2 ft (600 mm) of soil on the slopes and 3 ft (1 m) of soil
on top.
g. Pond sand shall not be used on sidehill fills or fill widenings where any of the following conditions exist:
1) The proposed fill slope is steeper than 2:1.
2) The thickness of the proposed fill at its thinnest point, as measured perpendicularly from the new fill line to the existing ground slope/fill slope, is less than 7 ft (2.1 m), including 2 ft (600 mm) of soil cover.
3) The fill height exceeds 30 ft (9 m).
208.2.01 Delivery, Storage, and Handling General Provisions 101 through 150. 208.3 Construction Requirements 208.3.01 Personnel General Provisions 101 through 150. 208.3.02 Equipment General Provisions 101 through 150. 208.3.03 Preparation General Provisions 101 through 150. 208.3.04 Fabrication General Provisions 101 through 150. 208.3.05 Construction 1 Benching Excavation for Embankment
This work includes excavating material forming benches in the existing ground beneath proposed embankments. Form benches to increase the bond between the existing ground and the proposed embankment.
This work is required where embankments are placed on hillsides or against existing embankments, which will be indicated on the Plans.
Construct the benches approximately 12 ft (3.7 m) wide unless otherwise shown on the Plans. Use material removed in the excavation in the embankments. The Department will make no additional payment for this work.
2 Embankments
Follow these requirements when constructing embankments:
a Preparation for Embankments
Before starting embankment construction, clear and grub the embankment area according to Section 201 and install Drainage Structures according to Section 550.
2) Depressions and Undercut Areas
Fill depressions below the ground surface and undercut areas with suitable material. Remove unsuitable
or unstable material and compact according to Subsection 208.3.05.B.1.c before beginning embankment
construction.
3) Scarification and Other Preparation

20 | P a g e
Plow and scarify the entire area upon which the embankment is to be placed (except inundated areas) at least 6 in (150 mm) deep.
Before placing the embankment, recompact loosened soil to the approximate density of the underlying soil. Cut benches as specified in Subsection 208.3.05.A.
C. Compaction Under Shallow Fills
When the depth of fill and surfacing is 3 ft (1 m) or less, compact the original ground compact at least 1 ft (300
mm) deep to at least 95 percent of the maximum laboratory dry density as determined from representative
samples of the compacted material using, GDT 7, GDT 24a, GDT 24b, or GDT 67whichever applies.
The in-place density of the compacted fill will be determined according to GDT 20, GDT 21, or GDT 59, whichever applies.
a. Embankments Over Existing Roads, Parking Areas, and Floors
Thoroughly plow or scarify all portions of existing unpaved roads and flexible pavements. Destroy cleavage planes before placing the embankment.
Remove the old pavement with rigid surfaces if the new embankment is not more than 3 ft (1 m) high.
Break remaining rigid pavements that are within 10 ft (3 m) of the finished grade so that no section
larger than 10 ft² (1 m²) remains intact. E. Embankment Formation
Use the following requirements when constructing the embankment formation:
Layer Construction
Except as noted in Subsection 208.3.05.B.2.d, construct the embankments in parallel layers. Deposit the
material and spread in horizontal layers not more than 8 in (200 mm) thick, loose measurement, for the full
width of the cross-section. Use motor graders, bulldozers, or other approved equipment to keep layers uniform.
Compact the layers using a sheepsfoot roller. The Engineer may permit the use of vibratory rollers whenever
the embankment soils consist of Class IA1, IA2, or IA3 materials.
Moisture Content
Compact each layer within the range of optimum moisture content to achieve the compaction specified below.
Do not construct successive layers on previous layers that exhibit excessive pumping under construction equipment regardless of compaction.
Dry material if it contains too much moisture. Ensure the moisture content is sufficient for stability and compaction.
Add water if the material is too dry and uniformly mix it with the soil for stability and compaction. The
Department will not measure water added to the material under this requirement for payment. It is considered
incidental to the satisfactory completion of the work.
Degree of Compaction
Compact the embankment at bridge structures to at least 100 percent of the maximum laboratory dry
density. Compact for the full depth of the embankment, beginning at the toe of the slope and extending 100
ft (30 m) from the end of the bridge.
Compact embankment other than at bridge structures to at least 95 percent of the maximum laboratory
dry density to within 1 ft (300 mm) of the top of the embankment. Compact the top 1 ft (300 mm) of the
embankment to at least 100 percent of the maximum laboratory dry density.
If grading and paving are let in separate contracts, the paving Contractor shall recompact the top 6 in (150 mm) to at least 100 percent of the maximum laboratory density.

21 | P a g e
The maximum laboratory dry density will be determined from representative samples of the compacted
material using GDT 7, GDT 24a, GDT 24b, or GDT 67, whichever applies. The in-place density of the
compacted fill will be determined according to GDT 20, GDT 21, or GDT 59, whichever is applicable. A Special Conditions
Follow these special requirements:
5. Build layers as parallel as possible. In certain cases the Engineer may permit steeper slopes at ends of the embankments.
6. In swamp or inundated areas that will not support the equipment, build the lower part of the fill by
dumping successive loads in layers no thicker than necessary to support the hauling equipment.
7. Build and compact the remainder of fills in layers as specified above. B Embankments at Structures
Use Class I or II material when constructing embankments over and around pipes, culverts, arches, and bridges according to Subsection 810.2.01.A.1. Class IIIC1 material may be used in Districts 6 and 7. 5. Compact the material as specified in Subsection 208.3.05.B.2.c.
6. Place the specified material on both sides of bridge structures for a distance of at least 10 ft (3 m).
NOTE: Do not place rock larger than 4 in (100 mm) diameter within 2 ft (600 mm) of any drainage structure.
Before any traffic is allowed over any structure, provide a sufficient depth of material over and around the structure to protect it from damage or displacement.
C Method of Handling Classes of Soils
Handle the different classes of soils using the following methods:
5. Class IIB3and Better Soils
Distribute and compact these soils in 8 in ( 200 mm) uniform layers over the entire width of the
embankment. Use these soils (when available in sufficient quantities) in the top 1 ft (300 mm) of
the roadbed. Reserve these soils for this purpose when directed by the Engineer.
6. Class IIB4 Soils
Distribute and compact these soils in 8 in (200 mm) layers over the entire width of the embankment. If Class IIB3 or better soils are available in borrow pits, use these soils in the top 12 inch (300 mm) of subgrade. Class IIB4 soils may be used in the top 12 inch (300 mm) of subgrade if approved by the Office of Materials and Research, Geotechnical Engineering Bureau.
7. Class III Soils
Class IIIC1 soils may be used in Districts 6 and 7 within the top 12 inch (300 mm) of subgrade if approved by the Office of Materials and Research, Geotechnical Engineering Bureau. Do not use Class IIIC2, IIIC3 or IIIC4 soils within the top 12 inch (300 mm) of subgrade unless a stabilizing agent approved by the Engineer is added, or if approved by the Office of Materials and Research, Geotechnical Engineering Bureau. Class IIIC4, chert clay soils in District 6 with less than 55 percent passing the No. 10 (2 mm) sieve may be used for subgrade.
8. Class IV Soils
Do not use these soils in embankments. Waste these soils or (when designated in the Plans or directed by the Engineer) stockpile them and use them for blanketing fill slopes.
9. Class V Soils
Place these soils in the same manner as Class IIB4 soils. Pulverize large particles to obtain the proper compaction.
10. Class VI Rock

22 | P a g e
Place rock in uniform layers not over 3 ft (1 m) thick and distribute it over the embankments to avoid pockets. Fill voids with finer material.
Do not place rock larger than 6 in (150 mm) in diameter within 3 ft (1 m) of the finished surface of the embankment.
Do not place rock larger than 6 in (150 mm) in diameter within 2 ft (600 mm) of the outer limits of proposed posts or utility poles.
Do not place rock at bridge end bents within 10 ft (3 m) of pile locations.
All Classes
Place mixtures of the above classes together with random material such as rock, gravel, sand, cinders,
slag, and broken-up pavement so that coarse particles are dumped near the outer slopes and finer particles
near the center of the roadway.
Produce a gradual transition from the center to the outside. If material is too large to place in 8 in ( 200 mm) layers, treat it as rock or break it down and place it in 8 in ( 200 mm) layers.
a. Embankment Consolidation at Bridge Ends
When consolidating embankments at bridge ends, use the following specifications:
a When a waiting period is required in the Plans or by Special Provision, place end fills at bridges in time for
consolidation readings to indicate that both the fill and the natural ground have reached the desired degree
of stability.
b Delay constructing bridge portions during the period of consolidation as shown on the Plans or as required by a Special Provision.
The Plans or the Special Provisions will indicate the estimated time required to reach consolidation.
The Engineer may extend or shorten this waiting period based on settlement readings taken on points placed in the fills. The longer or shorter waiting period will not constitute a valid claim for additional compensation.
Follow these specifications when extending a waiting period:
1) Extending an estimated waiting period may lead to increasing the Contract time. If the Contract is on a
calendar day or completion date basis, the Department may increase the calendar days equal to the
maximum number of calendar days involved in the extension.
2) When a time extension causes additional delay due to seasonal changes, the Engineer may recompute the time extension on an available day basis.
When the Contract is on an available day basis, the time increase will be equal to the greatest number of available days involved in the extension.
3) When time charges on separate Bridge Contracts are controlled by Special Provisions that set forth the
availability of bridge sites, extending an estimated waiting period controls the availability of that bridge site
only; time charges will be adjusted according to the Special Provision.
c Construct the embankment at bridge ends full-depth to the subgrade template (except for the stage
construction providing a bench for the end bent) unless otherwise stated in the Plans and compact thoroughly
before driving a piling at bridge ends.
The minimum acceptable length of completed full-depth embankment is equal to the maximum width of fill
between slope stakes at the end of the bridge. The Department will measure the minimum length of full-
depth embankment along the roadway centerline away from the end-of-bridge Station. 1) In-Place Embankment
Construct embankments designated on the Plans and in the Proposal as “In-Place Embankment” using either a hydraulic
or conventional dry land construction method and using materials obtained from within the construction limits of the
Right-of -Way or from borrow pits, whichever is appropriate.

23 | P a g e
Regardless of the method of construction, the Department will measure the entire embankment for payment as in-place embankment.
b) Construction
Build embankments according to this Section when hydraulic or conventional dry land construction methods are used.
Furnish equipment suitable for the method chosen to complete the work. Equipment is subject to the Engineer’s approval.
When using a hydraulic method is used, conform to these additional requirements:
a. Using baffles for construction is permitted as long as the embankment slopes are not steeper than
indicated on the Plans.
b. Use of excess material placed outside the prescribed slopes to raise the fill is permitted.
c. Leave openings in the embankments at the bridge site as indicated on the Plans.
Dredge material that invades the openings or existing channels at no additional expense to the Department.
Provide the same depth of channel at mean low water as existed before the construction of the
embankment.
d. Do not excavate or dredge material within 500 ft (150 m) of the toe of the embankment or existing structures, unless otherwise shown on the Plans.
e. Place in-place embankment in areas previously excavated below the ground line in a uniform mass
beginning at one end of the excavated area and continuing to the other end of the operation. Avoid
forming of muck cores in the embankment.
f. Construct the embankment at the farthest points along the roadway from the bridge ends and progress to the end of the excavation area beyond the toe of the slope of endrolls at bridge ends.
g. Remove timber used for temporary bulkheads or baffles from the embankment.
h. Fill and thoroughly compact the holes.
Maintenance
Maintain the embankment at grade until it has been completed and accepted. Assume responsibility
for slides, washouts, settlement, subsidence, or mishaps to the work while under construction.
Keep constructed embankment stable and replace displaced portions before Final Acceptance of the entire Contract.
Remove and dispose of excess materials, including fill, detours, and erosion deposits placed outside
the prescribed slopes in wetland areas.
Permits
Obtain (at no additional expense to the Department) necessary permits or licenses from the appropriate authorities
to operate dredges and other floating equipment in waters under their jurisdiction, unless otherwise provided for in
the Contract.
Erosion Control
In addition to the provisions of Section 161, follow additional erosion, siltation, and pollution control measures specified in the Plans or Special Provisions.
Rock Embankment
This work includes furnishing materials either from the roadway excavation or other sources and hauling and the
placing of rock embankment. Use materials that meet the requirements of Subsection 208.2.B, as shown on the Plans or
directed by the Engineer.
Place the rock in uniform layers not over 3 ft (1 m) thick. Distribute rock over the embankment to avoid pockets.

24 | P a g e
a. Fill voids with rock fines. Do not use rock larger than 6 in (150 mm) for any diameter within 3 ft (1 m) of the finished grade of the embankment, or within 2 ft (600 m) of any structure.
b. Do not place rock at bridge end bents within 10 ft (3 m) of pile locations. Construct rock embankment and adjoining earth
embankment concurrently. Ensure that neither is larger than 4 ft (1.2 m) higher than the other at any time. b. Final Finishing
After constructing the entire embankment, shape the surface of the roadbed and the slopes to reasonably true grade and cross-sections as shown on the Plans or established by the Engineer.
Open ditches, channels, and drainage structures (both existing and those constructed or extended) to effectively drain the roadway. Maintain the embankment areas until Final Acceptance of the Project.
208.3.06 Quality Acceptance General Provisions 101 through 150. 208.3.07 Contractor Warranty and Maintenance General Provisions 101 through 150. 208.4 Measurement The following section details measurement for payment for the work described in this Section: 400.4.0 Except as provided herein, there will be no measurement for payment for the work covered by this Section. 400.4.1 The Department will compute the quantity of in-place embankment or rock embankment using the average end
area method, or other acceptable methods, when embankment is in place and accepted.
The quantity will be calculated as the neat volume, above the original ground surface, between the template line shown on the Plans or authorized changes by the Engineer, and the original ground surface.
The original ground surface is determined by conventional field, photogrammetric, or other methods. The Department will not deduct for the volume of culverts and manholes.
In-place embankment necessary for the construction of temporary detours will not be measured for payment and is considered incidental to the completion of the work unless specifically stated otherwise on the Plans.
Where work includes excavating of unstable materials below the ground line, the volume of embankment required for
backfill below the ground line is calculated based on the neat line measurement for the cross-section shown on the
Plans or established by the Engineer by the average end area method or other acceptable methods.
Where permitted by the Engineer or required by the Plans, material removed from the existing roadbed, special
ditches, berm ditches, or dry land borrow pits and used in making embankment will be paid for as in-place
embankment regardless of the method of excavation. 208.4.01 Limits General Provisions 101 through 150. 208.5 Payment Except as provided for herein, the Department will not make separate payment for placing embankments, backfilling structures, and constructing earth berms, including surcharges. Payment will be included at the Contract Unit Price for the items covered by Section 204, Section 205, and Section 206. Prices are full compensation for The Work covered by this Section. The Unit Prices bid per cubic yard (meter) for in-place and rock embankments (when included as Contract bid Items) are
full compensation for furnishing suitable material, hauling, placing, compacting, finishing, and dressing according to these
Specifications or as directed by the Engineer.

25 | P a g e
Payment will be made under:
Item No. 208 In-place embankment Per cubic yard (meter)
Item No. 208 Rock embankment Per cubic yard (meter)
208.5.01 Adjustments General Provisions 101 through 150.

26 | P a g e
Section 209—Subgrade Construction
209.1 General Description This work includes placing, mixing, compacting, and shaping the top 6 in (150 mm) or the Plan-indicated thickness of the roadbed in both excavation and embankment areas. This work also includes subgrade stabilization, select material subgrade, and shoulder stabilization. 209.1.01 Definitions General Provisions 101 through 150. 209.1.02 Related References D. Standard Specifications
Section 109—Measurement and Payment
Section 412—Bituminous Prime
Section 803—Stabilizer Aggregate
Section 810—Roadway Materials
Section 815—Graded Aggregate E. Referenced Documents
GDT 7
GDT 20
GDT 21
GDT 24a
GDT 24b
GDT 59
GDT 67
209.1.03 Submittals General Provisions 101 through 150. 209.2 Materials A. Subgrade Materials
If the Plans do not show the source of material for subgrade, the Engineer will direct the Contractor according to the Specifications, or implement a Supplemental Agreement to ensure a satisfactory subgrade.
If the existing roadway excavation or borrow materials are not suitable or available for stabilizing the subgrade, use the quantity of stabilizer materials defined below in Subsection 209.2.B.
B. Subgrade Stabilizer Materials
Material Section
Type I Stabilizer Aggregate 803.2.01
Type II Stabilizer Aggregate 803.2.02

27 | P a g e
Section 209—Subgrade Construction
Material Section
Class IIB3 or Better Soil 810.2.01.A.1
Type III Stabilizer Aggregate 803.2.03
Type IV Stabilizer Sand 803.2.04
C. Select Material Subgrade
Material Section
Class IIB3 or Better Soil 810.2.01.A.1
Graded Aggregate 815
D. Shoulder Stabilization
Material Section
Shoulder Stabilization 803.2.02, Type II
209.2.01 Delivery, Storage, and Handling
General Provisions 101 through 150. 209.3 Construction Requirements 209.3.01 Personnel General Provisions 101 through 150. 209.3.02 Equipment General Provisions 101 through 150. 209.3.03 Preparation General Provisions 101 through 150. 209.3.04 Fabrication General Provisions 101 through 150. 209.3.05 Construction A. Subgrade Construction
Construct subgrade as follows:
1. Plow, harrow, and mix the entire surface of the in-place subgrade to a depth of at least 6 in (150 mm).
2. After thoroughly mixing the material, bring the subgrade to Plan line and grade and compact it to 100 percent of the maximum laboratory dry density.
3. If the subgrade needs to be stabilized, or if a subsequent contract provides for base construction, do not
apply density requirement at this stage.
If a subsequent Contract provides for base construction, eliminate mixing and compact the in-place subgrade to 95 percent of the laboratory maximum dry density.
4. Ensure that the subgrade can firmly support construction equipment before placing subsequent layers of base and
paving materials. The subgrade must support construction equipment without excessive movement regardless of
compaction.

28 | P a g e
Section 209—Subgrade Construction
5. Rework unstable areas of subgrade to a moisture content that will provide stability and compaction. The
Engineer may direct the Contractor to proof roll the subgrade with a loaded dump truck.
6. Compact the subgrade using a sheepsfoot roller.
Where the subgrade soils are predominantly sands, the Engineer may permit the use of vibratory rollers. B. Subgrade Stabilization
Construct a stabilized subgrade according to Plans or as directed:
a Undercut and dispose of the amount of subgrade material that will be displaced with the aggregate or selected material according to the Engineer’s direction.
b Leave material off the subgrade in fill sections requiring stabilization.
c Place the amount of material specified in Subsection 209.2.B. on the subgrade as specified on the Plans
or established by the Engineer.
d Thoroughly incorporate the material into the existing subgrade to a depth of 6 in (150 mm), or as indicated on
the Plans. Plow, disk, harrow, blade, and then mix with rotary tillers until the mixture is uniform and
homogeneous throughout the depth to be stabilized.
e Finish the stabilized subgrade to the Plan line, grade, and cross-section. Compact it to 100 percent of the maximum laboratory dry density as defined in Subsection 209.3.06.
Plant mixing is permitted as an alternative to the mixed-in-place method.
f Eliminate the mixing and scarifying method before compaction in undercut areas where Type III Stabilizer
Aggregates are specified, unless otherwise specified by the Engineer. C. Select Materials Subgrade
Place select materials as follows:
a Place a uniform blanket of select material consisting of Class I or II soil or graded aggregate on the prepared subgrade (according to Plan dimensions or as directed by the Engineer).
b Use the select material reserved from the grading or borrow operations. If material is not available through this
source, obtain it from other sources.
c Finish and compact the material according to Subsection 209.3.05.A. D. Shoulder Stabilization
Stabilize the shoulder as follows:
a Spread the stabilizer aggregate at the rate and to the dimensions indicated on the Plans.
b Mix the aggregate with the in-place shoulder material thoroughly to the Plan depth.
c Compact the area thoroughly and finish it to Plan dimensions.
d Prime the stabilized area according to Section 412 when a paving course is required on the shoulders. E. Finishing Subgrade
When finishing subgrade use the following procedure:
a Leave the underlying subgrade in cuts and fills low enough to accommodate the additional material when the work requires either subgrade stabilization, select material subgrade, or stabilization for shoulders.
b Test short sections in curb and gutter areas might be necessary to obtain the proper elevation.
c Blade the surface of the completed subgrade to a smooth and uniform texture.

29 | P a g e
Section 209—Subgrade Construction
209.3.06 Quality Acceptance The Department will test representative samples of compacted material to determine the laboratory maximum dry density using GDT 7, GDT 24a, or GDT 67 as applicable. The Department will determine in-place density of the compacted subgrade according to GDT 20, GDT 21, or GDT 59, as applicable. Ensure that the centerline profile conforms to the established elevations with an acceptable tolerance of ±0.5 in (±13 mm). The acceptable tolerance under a template conforming to the designated cross section shall be ±0.25 in (±6 mm). Have the Department test the maximum dry density using methods according to Subsection 209.3.05.A. When base construction is not in the same Contract, the tolerances may be 1 in (25 mm), 0.5 in (13 mm), and 95 percent respectively. 209.3.07 Contractor Warranty and Maintenance General Provisions 101 through 150. 209.4 Measurement A. Subgrade Construction and Finishing Subgrade
The Department will make no separate measurement or payment for the work described in this Section. B. Subgrade Stabilization
Subgrade stabilization materials, as defined in Subsection 209.3.05.B is measured by the ton (megagram), cubic
yard (meter), or square yard (meter) of the specified thickness if none of the existing Roadway Excavation and/or
Borrow Materials are suitable and available for stabilizing the subgrade. C. Select Material Subgrade
Select materials, conforming to Subsection 209.3.05.C are measured by the cubic yard (meter) in the hauling vehicle,
per ton (megagram) according to Subsection 109.01, or by the square yard (meter) of the specified thickness when
roadway excavation and/or borrow materials are not available or suitable for this Item. D. Shoulder Stabilization
Shoulder stabilization is measured by the cubic yard (meter) or ton (megagram) as specified in Subsection 209.4.B. 209.4.01 Limits General Provisions 101 through 150. 209.5 Payment A. Subgrade Construction
The Department will make no separate payment for subgrade construction or for finishing subgrade. B. Subgrade Stabilization
Subgrade stabilization complete and accepted according to Subsection 209.3.05.B will be paid for at the Contract
Unit Price per cubic yard (meter), per ton (megagram), or per square yard (meter). This price is full compensation for
furnishing the materials, hauling, placing, mixing, compacting, and finishing the stabilized subgrade. C. Select Material Subgrade
Select material complete, accepted, and measured according to Subsection 209.4.C will be paid for at the Contract Unit Price
per cubic yard (meter), per ton (megagram), or per square yard (meter). This price is full compensation for furnishing the
material where required, hauling, placing, mixing, compacting and finishing the select material subgrade

30 | P a g e
Section 210—Grading Complete
210.1 General Description This work includes:
Excavating of all materials including ditches, undesirable material (including removal and replacement), and borrow (if required) Hauling
Forming embankments Constructing shoulders and subgrades Finishing, dressing, and disposing of undesirable or surplus material
Clearing and grubbing according to Section 201 and Section 202 unless these items are established as Pay Items in the Contract
Removing and disposing of miscellaneous roadway items, including but not limited to curbs, drainage structures, and pavements (unless established as separate contract items)
Ensure that the completed grading work conforms to the horizontal and vertical alignment and typical cross- sections shown on the Plans or as directed by the Engineer. 210.1.01 Definitions General Provisions 101 through 150. 210.1.02 Related References F. Standard Specifications
Section 109—Measurement and Payment
Section 201—Clearing and Grubbing Right-of-
Way Section 202—Random Clearing and
Grubbing Section 204—Channel Excavation
Section 205—Roadway
Excavation Section 206—Borrow
Excavation
Section 207—Excavation and Backfill for Minor
Structures Section 208—Embankments
Section 209—Subgrade Construction G. Referenced Documents
General Provisions 101 through 150. 210.1.03 Submittals General Provisions 101 through 150.
210.2 Materials Use materials required for grading construction that conform to the requirements of Section 204, Section 205, Section 206, Section 207, Section 208, and Section 209. 210.2.01 Delivery, Storage, and Handling General Provisions 101 through 150.

31 | P a g e
210.3 Construction Requirements 210.3.01 Personnel General Provisions 101 through 150. 210.3.02 Equipment Use equipment approved by the Engineer that will not damage base, pavement, or other appurtenances to be retained. 210.3.03 Preparation Before placing base material, finish the subgrade according to Subsection 209.3.05.E. 210.3.04 Fabrication General Provisions 101 through 150. 210.3.05 Construction Perform The Work according to the appropriate portions of Section 201, Section 202, Section 204, Section 205, Section 206, Section 207, Section 208, and Section 209 of the Specifications. Measurement and payment shall be according to the provisions of this Section. See Subsection 210.4 and Subsection 210.5, below. 210.3.06 Quality Acceptance When the Engineer determines that the existing material in areas where fills are to be placed is undesirable, the Engineer may require the Contractor to remove the undesirable material and replace it with suitable material.
Compact the replacement materials according to the applicable portions of Section 208.
In cut areas, where the material below the template line is undesirable for subgrade or shoulders, undercut it to a depth established by the Engineer and replace it with suitable material. Compact the replacement materials as specified herein.
210.3.07 Contractor Warranty and Maintenance General Provisions 101 through 150. 210.4 Measurement C. Grading Complete
The Work under this Item is not measured separately for payment. D. Grading Per Mile (Kilometer)
This Item is measured in linear miles (kilometers) along the centerline of the road or the median, including ramps where shown on the Plans.
E. Undercut Excavation
The amount of undercut excavation (when directed by the Engineer and not addressed in the Plans) measured for payment is the product of the length, width, and depth of excavation. Replacement material for undercut excavation is not measured for payment. There will be no separate payment for undercut excavation required by the Plans or rock excavation required under Subsection 205.3.
210.4.01 Limits General Provisions 101 through 150.
210.5 Payment B. Grading Complete
This Item completed and accepted will be paid for at the Lump Sum Price bid. Payment is full compensation for all work and materials specified in this Section.
C. Grading Per Mile (Kilometer)
This Item will be paid for at the Contract Unit Price per linear mile (kilometer) complete in place and accepted. This price is full compensation for furnishing the materials and performing the work specified in this Section.

32 | P a g e
D. Undercut Excavation
Undercutting areas not shown in the Plans when directed by the Engineer will be paid for at the rate of $7.50 per cubic yard ($9.80 per cubic meter) for quantities up to 750 yd³ (575 m³).
Quantities exceeding 750 yd³ (575 m³) will be considered Extra Work as defined in Subsection 109.05, and will be paid for accordingly. Payment is full compensation for excavating and disposing of undesirable material and supplying, placing, and compacting replacement material.
Payment will be made under:
Item No. 210 Grading complete Per lump sum
Item No. 210 Grading per mile (kilometer) Per mile (kilometer)
Item No. 210 Undercut excavation Per cubic yard (meter)
210.5.01 Adjustments General Provisions 101 through 150.

33 | P a g e
Section 211—Bridge Excavation and Backfill
211.1 General Description This work includes the following responsibilities:
Removing materials necessary for the construction of bridge footings and substructures
Disposing of excess materials and required backfilling, including porous backfill
Constructing and removing work bridges, cribs, cofferdams, and caissons
Dewatering, draining, sheeting, and exploratory boring of foundations necessary to complete the work
Excavate and backfill concrete box culverts as specified in Section 207. 211.1.01 Definitions Foundation: Material on which the footing of the substructure or seal rests. 211.1.02 Related References H. Standard Specifications
Section 201—Clearing and Grubbing Right-of-Way
Section 207—Excavation and Backfill for Minor Structures
Section 500—Concrete Structures
Section 525—Cofferdams
Section 540—Removal of Existing Bridge I. Referenced Documents
General Provisions 101 through 150. 211.2 Materials 211.2.01 Delivery, Storage, and Handling F. Surplus Materials
Dispose of surplus, stockpiled, and excavated materials as directed by the Engineer. Materials may be spread neatly and
smoothly on the right-of-way so as not to obstruct the channel of any existing or proposed waterway. Dispose of wasted
materials according to Subsection 201.3.05.E. 211.3 Construction Requirements 211.3.01 Personnel General Provisions 101 through 150. 211.3.02 Equipment A. Cofferdams and Sheeting
Use necessary protection such as cofferdams and sheeting when working in or near excavations where the surrounding earth could fail and endanger personnel or damage the work.
Use cofferdams or sheeting to prevent undesirable changes in channels and slopes.
Construct, remove, and dispose of cofferdams according to Section 525, regardless of whether they are measured separately for payment.

34 | P a g e
Section 211—Bridge Excavation and Backfill
211.3.03 Preparation A Preparation of Foundations
Prepare and maintain foundations as follows:
a. Do not subject concrete to the action of water before final setting, except as provided for seal concrete in Subsection 500.3.05.V.
b. Where footings are placed on a slightly sloped foundation of rock or hardpan, key the center of the foundation
approximately 1 ft (300 mm) deep throughout an area approximately equal to the dimensions of the column to be
placed (unless the Plans require entire footing to be keyed).
c. When the Engineer requires, step the foundation and remove all loose fragments and clean and fill seams as directed.
d. Do not disturb the top of the foundation to ensure that footings are placed on undisturbed material when they are
not resting on rock or hardpan foundations.
211.3.04 Fabrication General Provisions 101 through 150. 211.3.05 Construction a. Foundations and Footings
The sizes and elevations shown on the Plans are approximate, and are subject to change when directed. b. Inspection
Provide the Engineer ample opportunity and safe conditions (as determined by the Engineer) to inspect foundations and
measure removed materials. Do not place concrete or close foundation areas from view until the area has been
inspected and approved. c. Boring of Foundations and Seals
Bore foundations as requested and in an approved manner so that the foundation’s adequacy can be determined by the
Engineer. Borings are usually required only for foundations and seals with no piles. All borings shall be made in the Engineer’s presence.
Bore to at least 6 ft (1.8 m) deep in rock and 10 ft (3 m) deep in other material, excluding seals. The entire depth of the seal will usually be bored in only one location.
d. Backfill Construction
Follow these requirements when backfilling:
1) General
Backfilling is a part of the work of excavation, except as noted.
Place the backfill in layers not exceeding 1 ft (300 mm) of loose material. Compact the layer before placing the next layer.
Backfill around all substructures except those located within the banks of a stream at normal water level.
Do not jet backfills.
Place backfill material to apply only balanced horizontal loads to a newly placed structure or portion
of structure.
Do not backfill portions of structures that do not have backfill on all sides until the concrete has reached the required strength (as determined by the Engineer) to withstand the earth pressures.
2) Intermediate Bents and Piers

35 | P a g e
Section 211—Bridge Excavation and Backfill
Compact backfill for intermediate bents and piers to the approximate density of the surrounding soil.
Begin and complete backfilling around substructures not supported by piling the next workday after placing
the lift, if possible. Backfill at least within three calendar days after placement.
Backfill footings before beginning form work on the columns.
Begin backfilling around pile-supported footings and columns after removing forms. Complete as soon as possible but within five calendar days after placing concrete.
C. End Bents and Abutments
Compact backfill for end bents and abutments (including their wingwalls) to the density shown on the Standard Plans or Special Plans.
1. Begin and complete the work no later than five calendar days after placing concrete, unless other time limits are
indicated on the Plans.
If other time limits are indicated, this work may be second stage construction or second stage backfill construction.
2. Step slopes behind abutments, unless otherwise shown, and take precautions to prevent the backfill
from wedging against the abutment.
3. Provide drainage behind abutments and their wingwalls as shown on the Plans.
4. Place backfill for abutment footings and portions of walls having fill on both sides of the wall according to Subsection 211.3.05.D.4.
D. Backfill Material
Backfill around intermediate bents and piers with material removed from the excavation, unless the material is unsatisfactory to the Engineer.
1. Ensure that material for end bents and abutments meets the requirements shown on the Standard Plans or
Special Plans.
When suitable material is not available within the immediate vicinity of the bridge within the right-of-way, locate a source acceptable to the Engineer and haul the material to the site.
2. Obtain and place backfill material necessary for end bent and abutment construction— including
special backfill material used in constructing mechanically stabilized earth wall abutments.
3. Ensure that material located and hauled to the bridge site meets the requirements of Class I, Class II, or as shown in Subsection 810.2.01.A.1, unless otherwise noted.
4. Ensure that porous backfill (when specified) consists of coarse aggregate size No. 57 as specified
in Subsection 800.2.01, or crushed stone drainage material as specified in Subsection 806.2.02.A. 211.3.06 Quality Acceptance General Provisions 101 through 150. 211.3.07 Contractor Warranty and Maintenance General Provisions 101 through 150. 211.4 Measurement A. Bridge Excavation
Bridge excavation is measured for payment as follows:
Bridge excavation is measured in cubic yards (meters) of bridge excavation acceptably removed.
No payment is made for materials removed outside the area bounded by vertical planes a maximum of 18 in (450 mm) outside of and parallel to the neat lines of the footings, unless otherwise shown on the Plans.

36 | P a g e
Section 211—Bridge Excavation and Backfill
No separate measurement is made under the Item of bridge excavation for excavation necessary for end bent construction unless otherwise shown on the Plans.
Portions of structures removed under Section 540 that fall within the excavation limits are not included in the measurements for bridge excavation.
The vertical pay dimension is measured from the original ground line. However, for grade separation structures,
the vertical pay dimension is measured from the subgrade template of the roadway passing underneath, unless
otherwise shown on the Plans.
The vertical pay dimension for excavation at an intermediate bent (constructed within the limits of a previously placed end roll) includes the portion of the end roll that falls within the excavation limits.
Each portion of a stepped footing is considered a separate footing (for measurement purposes).
The bottom of each footing or step will be cross-sectioned by the Engineer (to obtain the elevation of the completed excavation).
B. Bridge Backfill
Bridge backfill is measured for payment as follows:
No separate measurement is made for bridge backfill.
Backfill material hauled to intermediate substructure locations according to Subsection 211.3.05.D.4. is not
measured as bridge backfill, but is considered a Specification Allowance as set forth in Subsection 211.5.B.
No allowance is made for material hauled in for use at bridge ends. 211.4.01 Limits General Provisions 101 through 150. 211.5 Payment 1. Bridge Excavation
This work will be paid for at the Contract Price per cubic yard (meter) complete, or at the Contract Price modified as specified below:
a. The Department will pay for all eligible excavation down to 2 ft (600 mm) below the Plan foundation elevation
at the Contract Price for bridge excavation.
b. The amount of payment for excavating lower than 2 ft (600 mm) below the Plan elevation is determined by increasing the Contract Price for bridge excavation as follows:
1 If excavations extend 6 ft (1.8 m) or less below the Plan foundation elevation, payment for excavating the
material from 2 ft (600 mm) below the Plan foundation elevation is at the Contract Price plus 50 percent.
2 If excavations extend more than 6 ft (1.8 m) but not more than 10 ft (3 m), payment for excavating the material from 2 ft (600 mm) below the Plan Foundation elevation is at the Contract Price plus 75 percent.
3 If excavations extend more than 10 ft (3 m) below the Plan foundation elevation, payment for excavating the
material from 2 ft (600 mm) below the Plan foundation is at the Contract Price plus 100 percent. 2. Bridge Backfill
The Department will not pay for this work separately. Include the cost in other pay items included in the Bridge Contract.
The Department will pay 125 percent of the Contract Price for bridge excavation when the Contractor furnishes and
hauls material used as replacement for unsuitable material excavated at intermediate substructure locations. Maximum
dimensions and deductions are specified in Subsection 211.4.B. Payment will be made under:

37 | P a g e
Item No. 211 Bridge excavation Per cubic yard (meter)
Item No. 211 Bridge excavation grade separation Per cubic yard (meter)
Item No. 211 Bridge excavation, stream crossing— no.___ Per cubic yard (meter)
Item No. 211 Porous backfill Per cubic yard (meter)
211.5.01 Adjustments General Provisions 101 through 150.

38 | P a g e
Section 310—Graded Aggregate Construction
310.1 General Description This work includes constructing a base, subbase or shoulder course composed of mineral aggregates. Construct according
to these Specifications and to the lines, grades, thickness, and typical cross-sections shown on the Plans or established by
the Engineer. The provisions of Section 300 apply to this work. 310.1.01 Definitions General Provisions 101 through 150. 310.1.02 Related References A. Standard Specifications
Section 105—Control of Work
Section 300—General Specifications for Base and Subbase Courses
Section 412—Bituminous Prime
Section 815—Graded Aggregate
Section 821—Cutback Asphalt
Section 823—Cutback Asphalt Emulsion B. Referenced Documents
AASHTO T 180
GDT 21
GDT 59 310.1.03 Submittals General Provisions 101 through 150. 310.2 Materials Ensure that materials meet the requirements of the following Specifications:
Material Section
Graded aggregate 815
Cutback asphalt, RC-30, RC-70, RC-250 or MC-30, MC-70, MC-250 821.2.01
Cutback Asphalt Emulsion, CBAE-2 823.2.01
Blotter material (sand) 412.3.05.G.3
310.2.01 Delivery, Storage, and Handling General Provisions 101 through 150. 310.3 Construction Requirements 310.3.01 Personnel General Provisions 101 through 150.

39 | P a g e
Section 310—Graded Aggregate Construction
310.3.02 Equipment Provide equipment in satisfactory condition for proper construction of the base, subbase or shoulder course. Use any applicable equipment specified in Subsection 412.3.02, “Equipment” for Bituminous Prime. 310.3.03 Preparation Prepare the subgrade or subbase as specified in Subsection 300.3.03.C, “Preparing the Subgrade” or Subsection 300.3.03.D, “Preparing the Subbase.” Place graded aggregate materials only on dry, thawed subgrade or subbase. 310.3.04 Fabrication General Provisions 101 through 150. 310.3.05 Construction A. Placing Material
Use the central plant mix method unless producing aggregates (from an approved source or deposit) that conform to the requirements of Section 815.
Use the following steps to mix base and spread subbase or shoulder course.
Mixing
When blending two sizes of aggregate, proportion the aggregate and water, if needed, into the central plant. Mix until producing a homogeneous and uniform mixture.
Spreading
To obtain the specified thickness, uniformly spread materials to the proper depth with a mixture spreader. Do not use materials containing frost or frozen particles.
One-Course Construction
Lay one course to a maximum thickness of 8 in (200 mm) compacted.
Multiple-Course Construction
If the thickness of the base, subbase or shoulder course exceeds 8 in (200 mm), construct it in 2 or more courses of equal thickness.
B. Compacting Material
Use the following steps to compact and finish a base, subbase, or shoulder course.
Moisture Content
Ensure that the moisture content of materials is uniformly distributed and allows compaction to the specified density.
Unless approved by the Office of Materials and Research, no graded aggregate will be shipped to a project when the moisture content of the material exceeds two percent of optimum moisture.
Compaction
After shaping the spread material to line, grade, and cross-section, roll to uniformly compact the course. If using
Group 1 aggregate, roll to at least 98 percent of maximum dry density. If using Group 2 aggregate, roll to at
least 100 percent of the maximum dry density.
If using graded aggregate mixtures composed of either group as base for paved shoulders 6 ft (1.8 m) wide or less, compact to at least 96 percent of the maximum dry density.
Regardless of compaction, ensure that the compacted base is sufficiently stable to support construction equipment
without pumping. If the base material is unstable from too much moisture, dry and rework the base material. Dry
and rework the underlying subgrade, if necessary.
One-Course Construction

40 | P a g e
Section 310—Graded Aggregate Construction
a After compaction, shape to the required grade, line, and cross- section.
b Add water as necessary to develop the proper moisture content.
c Roll until the surface is smooth, closely knit, and free of cracks.
d Correct all defects according to Subsection 300.3.06.B, “Repairing Defects.”
2. Multiple-Course Construction
After compacting the first course, shape the surface again to line, grade, and cross section.
Add water as necessary to develop the proper moisture content.
Spread and compact the second and any succeeding courses without rolling the first course again.
Finish the surface according to the procedure specified for one-course construction.
3. Irregular Areas
In places inaccessible to the roller, obtain the required compaction with mechanical tampers approved by the Engineer. Apply the same density requirements as stated above in Subsection 310.3.05.B.
c. Finishing
Finish the surface of the subbase for Portland cement concrete pavement or the base of asphaltic concrete pavement
with automatically controlled screed equipment when required by Subsection 300.3.02.H, “Fine Grading Machine” of
the Specifications. Furnish, install, and maintain the sensing wires needed to control the finish operation as a part of the
Pay Item. When automatically controlled screed equipment is not required, fine grading with motor graders is permitted.
Finish immediately after the placing and compacting operations. After finishing, compact the subbase again, according to Subsection 310.3.05.B, “Compacting Material.”
d. Protecting the Base, Subbase or Shoulders
Maintain the course until the Engineer determines that it has cured sufficiently and is ready to prime. Maintain by
additional wetting, rolling, and blading as necessary. Repair any defects according to Subsection 300.3.06.B,
“Repairing Defects.”
These protection measures do not relieve the Contractor of maintaining the Work until final acceptance as specified in Section 105.
e. Priming the Base
Apply bituminous prime according to Section 412 unless using:
Graded aggregate base under Portland cement concrete pavement
Graded aggregate base under asphaltic concrete 5 in (125 mm) or more in total thickness 310.3.06 Quality Acceptance 1. Compaction Tests
a. Determine the maximum dry density from representative samples of compacted material, according to AASHTO T180, Method D.
b. Determine the in-place density of finished courses according to GDT 21 or GDT 59 , where applicable.
2. Finished Surface
Check the finished surface of the base, subbase, or shoulder course as follows:
a. Check the longitudinal surface using a 15 ft (4.5 m) straightedge parallel to the centerline.
b. Check the transverse surface by using one of the following tools:
A template, cut true to the required cross-section and set with a spirit level on non-superelevated sections

41 | P a g e
Section 310—Graded Aggregate Construction
A system of ordinates, measured from a stringline
A surveyor’s level
Ensure that ordinates measured from the bottom of the template, stringline, or straightedge, to the surface do not
exceed 1/4 in (6 mm) at any point. Rod readings shall not deviate more than 0.02 ft (6 mm) from required readings.
Correct any variations from these requirements immediately according to Subsection 300.3.06.B, “Repairing Defects.”
C. Thickness Tolerances
Thickness Measurements
Thickness requirements apply to shoulder construction where the Plans specify a uniform thickness, or where the shoulders will be surfaced.
Determine the thickness of the base, subbase, or shoulder course, by making as many checks as necessary
to determine the average thickness.
Deficient Thickness
If any measurement is deficient in thickness more than 1/2 in (13 mm), make additional measurements to determine the deficient area.
Correct any area deficient between 1/2 in (13 mm) and 1 in (25 mm) to the design thickness by using one of the
following methods according to these Specifications:
Add additional quantities of the same materials and reconstruct to the required thickness
Leave in place and accept payment for the materials and area at ½ the Contract Unit Price for the deficient area.
3 Correct any area deficient in thickness by more than 1 inch (25 mm) by adding additional quantities of the same
material and reconstructing to the required thickness in accordance with these Specifications.
4 If payment is made by the ton (megagram), payment for additional material to correct deficiencies will be made at
the Contract Unit Price with no additional cost to the Department for scarification, mixing or compaction.
5 If payment is made by the square yard (meter), no payment will be made for additional material required to correct deficiencies or for reconstructing deficient work.
3. Average Thickness
The average thickness per linear mile (kilometer) is determined from all measurements within the mile (kilometer) increments except the areas deficient by more than 1/2 in (13 mm) and not corrected. The average thickness shall not exceed the specified thickness by more than 1/2 in (13 mm). If the basis of payment is per ton (megagram), and the average thickness for any mile (kilometer) increment exceeds
the allowable 1/2 in (13 mm) tolerance, the excess quantity in that increment will be deducted from the Contractor’s payments.
The excess quantity is calculated by multiplying the average thickness that exceeds the allowable 1/2 in (13 mm) tolerance by the surface area of the base, subbase, or shoulder. If the basis of payment is per square yard (meter), no deduction will be made for excess thickness. 310.3.07 Contractor Warranty and Maintenance General Provisions 101 through 150.

42 | P a g e
Section 310—Graded Aggregate Construction
310.4 Measurement A. Graded Aggregate
Where specified for payment by the ton (megagram), graded aggregate base, subbase or shoulder materials are
measured in tons (megagrams), mixed and accepted. When hauling material to the roadway, the actual weight of each
loaded vehicle is determined with an approved motor truck scale.
Where specified for payment by the square yard (meter) for a certain thickness, the surface length is measured along
the centerline, and the width is specified on the Plans. Measure irregular areas, such as turnouts and intersections, by
the square yard (meter). B. Bituminous Prime
Bituminous prime is not measured for separate payment. 310.4.01 Limits General Provisions 101 through 150. 310.5 Payment 1. Graded Aggregate
Graded aggregate base, subbase, or shoulder course will be paid for at the Contract Unit Price per ton (megagram) or per square yard (meter), complete, in place, and accepted. This payment shall be full compensation for:
Materials
Shaping and compacting the existing roadbed
Loading, hauling, and unloading
Crushing and processing
Mixing
Spreading
Watering
Compacting and shaping
Maintenance
Priming, when required
All incidentals necessary to complete The Work
Payment will be made under:
Item No. 310 Graded aggregate (base, subbase, shoulder course)—including material Per ton (megagram) or square yard (meter)
Item No. 310 Graded aggregate base and shoulder course— including material Per ton (megagram) or square yard (meter)
310.5.01 Adjustments General Provisions 101 through 150.

43 | P a g e
Section 400—Hot Mix Asphaltic Concrete Construction
400.1 General Description This work includes constructing one or more courses of bituminous plant mixture on the prepared foundation or existing
roadway surface. Ensure the mixture conforms with lines, grades, thicknesses, and typical cross sections shown on the
Plans or established by the Engineer. This section includes the requirements for all bituminous plant mixtures regardless of the gradation of the aggregates, type and amount of bituminous material, or pavement use. Acceptance of work is on a lot-to-lot basis according to the requirements of this Section and Section 106. 400.1.01 Definitions Segregated Mixture: Mixture lacking homogeneity in HMA constituents of such magnitude there is a reasonable expectation
of accelerated pavement distress or performance problems. May be quantified by measurable changes in temperature,
gradation, asphalt content, air voids, or surface texture. New Construction: A roadway section more than 0.5 mile (800 m) long that is not longitudinally adjacent to the existing
roadway. If one or more lanes are added longitudinally adjacent to the existing lane, the lane(s) shall be tested under the
criteria for a resurfacing project. If work is performed on the existing roadway including leveling, grade changes,
widening and/or resurfacing then that lane shall be tested under the criteria for a resurfacing project. Trench Widening: Widening no more than 4 ft. (1.2 m) in width. Comparison sample: Opposite quarters of material sampled by the Contractor. Independent Sample (Quality Assurance Sample): A sample taken by the Department to verify an acceptance decision without regard to any other sample that may also have been taken to represent the material in question. Referee sample: A sample of the material retained during the quartering process which is used for evaluation if a comparison of Contractor and Departmental split sample test results is outside allowable tolerances. 400.1.02 Related References C. Standard Specifications
Section 106—Control of Materials Section
109—Measurement and Payment Section
152—Field Laboratory Building

44 | P a g e
Section 400—Hot Mix Asphaltic Concrete Construction
Section 413—Bituminous Tack Coat
Section 424—Bituminous Surface Treatment
Section 802—Coarse Aggregate for Asphaltic Concrete
Section 828—Hot Mix Asphaltic Concrete Mixtures
A Referenced Documents
AASHTO T 315
AASHTO T 209
AASHTO T 202
AASHTO T 49
Department of Transportation Standard Operating Procedure (SOP) 15
Department of Transportation Standard Operating Procedure (SOP) 27
Department of Transportation Standard Operating Procedure (SOP) 40
GDT 38
GDT 73
GDT 78
GDT 83
GDT 119
GDT 125
GDT 126
GDT 134
GSP 15
GSP 21
QPL 1
QPL 2
QPL 7
QPL 26
QPL 30
QPL 39
QPL 41
QPL 45
QPL 65
QPL 67
QPL 70
QPL 77

45 | P a g e
Section 400—Hot Mix Asphaltic Concrete Construction
400.1.03 Submittals A Invoices
Furnish formal written invoices from a supplier for all materials used in production of HMA when requested by the Department. Show the following on the Bill of Lading:
Date shipped
Quantity in tons (megagrams)
Included with or without additives (for asphalt cement)
Purchase asphaltic cement directly from a supplier listed on Qualified Products List 7 and provide copies of Bill of Lading at the Department’s request.
G. Paving Plan
Before starting asphaltic concrete construction, submit a written paving plan to the Engineer for approval. Include the following on the paving plan:
Proposed starting date
Location of plant(s)
Rate of production
Average haul distance(s)
Number of haul trucks
Paver speed feet (meter)/minute for each placement operation
Mat width for each placement operation
Number and type of rollers for each placement operation
Sketch of the typical section showing the paving sequence for each placement operation
Electronic controls used for each placement operation
Temporary pavement marking plan
If staged construction is designated in the Plans or contract, provide a paving plan for each construction stage.
If segregation is detected, submit a written plan of measures and actions to prevent segregation. Work will not continue until the plan is submitted to and approved by the Department.
C. Job Mix Formula
Submit to the Engineer a written job mix formula proposed for each mixture type to be used based on an approved mix design. Furnish the following information for each mix:
Specific project for which the mixture will be used
Source and description of the materials to be used
Mixture I.D. Number
Proportions of the raw materials to be combined in the paving mixture
Single percentage of the combined mineral aggregates passing each specified sieve
Single percentage of asphalt by weight of the total mix to be incorporated in the completed mixture
Single temperature at which to discharge the mixture from the plant
Theoretical specific gravity of the mixture at the designated asphalt content
Name of the person or agency responsible for quality control of the mixture during production

46 | P a g e
Section 400—Hot Mix Asphaltic Concrete Construction
Do the following to have the formulas approved in accordance with SOP 40 “Approval of Contractor Job Mix Formulas” and to ensure their quality:
2. Submit proposed job mix formulas for review at least two weeks before beginning the mixing operations.
3. Do not start hot mix asphaltic concrete work until the Engineer has approved a job mix formula for the mixture to
be used. No mixture will be accepted until the Engineer has given approval.
4. Provide mix designs for all SMA, Superpave and 4.75 mm mixes to be used. The Department will provide mix design results for other mixes to be used.
5. After a job mix formula has been approved, assume responsibility for the quality control of the mixtures supplied
to the Department according to Subsection 106.01, “Source of Supply and Quantity of Materials.” B. Quality Control Program
Submit a Quality Control Plan to the Office of Materials and Testing for approval. The Quality Control Program will be
included as part of the certification in the annual plant inspection report. 400.2 Materials Ensure materials comply with the specifications listed in Table 1.
Table 1—Materials Specifications
Material Subsection
Asphalt Cement, Grade Specified 820.2
Coarse Aggregates for Asphaltic Concrete 802.2.02
Fine Aggregates for Asphaltic Concrete 802.2.01
Mineral Filler 883.1
Heat Stable Anti-Stripping Additive 831.2.04
Hydrated Lime 882.2.03
Silicone Fluid (When approved by the Office of Materials and Testing) 831.2.05
Bituminous Tack Coat: PG 58-22, PG 64-22, PG 67-22 820.2
Hot Mix Asphaltic Concrete Mixtures 828
Fiber Stabilizing Additives 819 When approved by the Office of Materials and Testing and required in the Contract, provide Uintaite material, hereafter
referred to by the common trade name Gilsonite, as a reinforcing agent for bituminous mixtures. Supply a
manufacturer’s certification that the Gilsonite is a granular solid which meets the following requirements:
Softening Point (AASHTO: T-53) 300-350 F (150-175 C)
Specific Gravity, 77 F (25 oC) (AASHTO: T-228) 1.04 ± 0.02
Flash Point, COC (AASHTO: T-48) 550 F (290 C) Min.
Ash Content (AASHTO: T-111) 1.0% Max.
Penetration, 77 F (25
oC), 100 gm., 5 sec. (AASHTO: T-49) 0

47 | P a g e
Section 400—Hot Mix Asphaltic Concrete Construction
400.2.01 Delivery, Storage, and Handling Storage of material is allowed in a properly sealed and insulated system for up to 24 hours. Ensure Stone Matrix Asphalt
(SMA), Open-Graded Friction Course (OGFC), or Porous European Mix (PEM) mixtures are not stored more than 12 hours.
Mixtures other than SMA, OGFC, or PEM may be stored up to 72 hours in a sealed and insulated system, equipped with an
auxiliary inert gas system, with the Engineer’s approval. Segregation, lumpiness, drain-down, or stiffness of stored mixture
is cause for rejection of the mixture. The Engineer will not approve using a storage or surge bin if the mixture segregates,
loses excessive heat, or oxidizes during storage. The Engineer may obtain mixture samples or recover asphalt cement according to GDT 119. AASHTO T315, AASHTO T
202 and AASHTO T 49 will be used to perform viscosity and penetration tests to determine how much asphalt hardening
has occurred. 1 Vehicles for Transporting and Delivering Mixtures
Ensure trucks used for hauling bituminous mixtures have tight, clean, smooth beds.
Follow these guidelines when preparing vehicles to transport bituminous mixtures:
c. Use an approved releasing agent from QPL 39 in the transporting vehicle beds, if necessary, to prevent the mixture
from sticking to the bed. Ensure the releasing agent is not detrimental to the mixture. When applying the agent,
drain the excess agent from the bed before loading. Remove from the project any transporting vehicles determined
to contain unapproved releasing agents.
d. Protect the mixture with a waterproof cover large enough to extend over the sides and ends of the bed. Securely fasten the waterproof cover before the vehicle begins moving.
e. Insulate the front end and sides of each bed with an insulating material with the following specifications:
Consists of builders insulating board or equivalent
Has a minimum “R” value of 4.0
Can withstand approximately 400 °F (200 C) temperatures
Install the insulating material so it is protected from loss and contamination. A “Heat Dump Body” may be used in
lieu of insulation of the bed. “Heat Dump Body” refers to any approved transport vehicle is capable of diverting
engine exhaust and transmitting heat evenly throughout the dump body to keep asphalt at required temperature.
Mark the “Heat Dump Body” clearly with “OPEN” and “CLOSE” position at the exhaust diverter. Install a padlock and lock it in the “OPEN” position when the “Heat Dump Body” is used to transport bituminous mixtures.
A. Mark each transporting vehicle with a clearly visible identification number.
B. Create a hole in each side of the bed so the temperature of the loaded mixture can be checked. Ensure the placement of
these holes are located to assure the thermometer is being placed in the hot mix asphaltic concrete mixtures.
Ensure the mixture is delivered to the roadway at a temperature within ± 20 °F (± 11 °C) of the temperature on the job mix formula.
If the Engineer determines a truck may be hazardous to the Project or adversely affect the quality of the work, remove the truck from the project.
B Containers for Transporting, Conveying, and Storing Bituminous Material
To transport, convey, and store bituminous material, use containers free of foreign material and equipped
with sample valves. Bituminous material will not be accepted from conveying vehicles if material has
leaked or spilled from the containers.

48 | P a g e
Section 400—Hot Mix Asphaltic Concrete Construction
400.3 Construction Requirements 400.3. 01 Personnel General Provisions 101 through 150. 400.3.02 Equipment Hot mix asphaltic concrete plants producing mix for Department use are governed by Quality Assurance for Hot Mix Asphaltic Concrete Plants in Georgia, Laboratory Standard Operating Procedure No. 27. The Engineer will approve the equipment used to transport and construct hot mix asphaltic concrete. Ensure the equipment is
in satisfactory mechanical condition and can function properly during production and placement operations. Place the
following equipment at the plant or project site: B Field Laboratory
Provide a field laboratory according to Section 152. C Plant Equipment
5. Scales
Provide scales as follows:
Furnish (at the Contractor’s expense) scales to weigh bituminous plant mixtures, regardless of the measurement method for payment.
Ensure the weight measuring devices provide documentation complying with
Subsection 109.01, “Measurement and Quantities.”
Provide weight devices recording the mixture net weights delivered to the truck when not using platform scales. A net weight system will include, but is not limited to:
Hopper or batcher-type weight systems delivering asphaltic mixture directly to the truck
Fully automatic batching equipment with a digital recording device
Use a net weight printing system only with automatic batching and mixing systems approved by the Engineer.
Ensure the net weight scale mechanism or device manufacturer, installation, performance, and operation
meets the requirements in Subsection 109.01, “Measurement and Quantities”
Provide information on the Project tickets according to Department of Transportation SOP-15.
6. Time-Locking Devices
Furnish batch type asphalt plants with automatic time-locking devices controlling the mixing time automatically.
Construct these devices to ensure the operator cannot shorten or eliminate any portion of the mixing cycle.
7. Surge- and Storage-Systems
Provide surge and storage bins as follows:
Ensure bins for mixture storage are insulated and have a working seal, top and bottom, to prevent outside air
infiltration and to maintain an inert atmosphere during storage. Bins not intended as storage bins may be used
as surge bins to hold hot mixtures for part of the working day. However, empty these surge bins completely
at the end of the working day.
Ensure surge and storage bins can retain a predetermined minimum level of mixture in the bin when the trucks are loaded.
Ensure surge and storage systems do not contribute to mix segregation, lumpiness, drain-down, or stiffness.
Ensure the scale mechanism or device manufacture, installation, performance, and operation meets
the requirements in Subsection 109.01”Measurement and Quantities”.

49 | P a g e
Section 400—Hot Mix Asphaltic Concrete Construction
4. Controls for Dust Collector Fines
Control dust collection as follows:
a. When collecting airborne aggregate particles and returning them to the mixture, have the return system
meter all or part of the collected dust uniformly into the aggregate mixture and waste the excess. The
collected dust percentage returned to the mixture is subject to the Engineer’s approval.
b. When the collected dust is returned directly to the hot aggregate flow, interlock the dust feeder with the hot aggregate flow and meter the flow to maintain a constant, proportioned and uniform flow.
5. Mineral Filler Supply System
When mineral filler is required as a mixture ingredient:
a. Use a separate bin and feed system to store and proportion the required quantity into the mixture with uniform distribution.
b. Control the feeder system with a proportioning device meeting these specifications:
Is accurate to within ± 10 percent of the filler required
Has a convenient and accurate means of calibration
Interlocks with the aggregate feed or weigh system to maintain the correct proportions for all rates
of production and batch sizes
c. Provide flow indicators or sensing devices for the mineral filler system and interlock them with the plant
controls to interrupt the mixture production if mineral filler introduction fails to meet the required target
value after no longer than 60 seconds.
d. Add mineral filler to the mixture as follows, according to the plant type:
Batch Type Asphalt Plant. Add mineral filler to the mixture in the weigh hopper.
Continuous Plant Using Pugmill Mixers. Feed the mineral filler into the hot aggregate before it is introduced
into the mixer to ensure dry mixing is accomplished before the bituminous material is added.
Continuous Plants Using the Drier-Drum Mixers. Add the mineral filler to ensure dry mixing is
accomplished before the bituminous material is added and ensure the filler does not become entrained into
the air stream of the drier.6. Hydrated Lime Treatment System
When hydrated lime is required as a mixture ingredient:
a. Use a separate bin and feed system to store and proportion the required quantity into the mixture.
b. Ensure the aggregate is uniformly coated with hydrated lime aggregate before adding the bituminous
material to the mixture. Ensure the addition of hydrated lime will not become entrained in the exhaust system
of the drier or plant.
c. Control the feeder system with a proportioning device meeting these specifications:
Is accurate to within ± 10 percent of the amount required
Has a convenient and accurate means of calibration
Interlocks with the aggregate feed or weigh system to maintain the correct proportions for all rates of production and batch sizes and to ensure mixture produced is properly treated with lime
d. Provide flow indicators or sensing devices for the hydrated lime system and interlock them with the plant
controls to interrupt mixture production if hydrated lime introduction fails to meet the required target
value after no longer than 60 seconds. 7. Net Weight Weighing Mechanisms

50 | P a g e
Section 400—Hot Mix Asphaltic Concrete Construction
Certify the accuracy of the net weight weighing mechanisms by an approved registered scale serviceperson at least
once every 6 months. Check the accuracy of net weight weighing mechanisms at the beginning of Project
production and thereafter as directed by the Engineer. Check mechanism accuracy as follows:
a. Weigh a load on a set of certified commercial truck scales. Ensure the difference between the printed total net
weight and weight obtained from the commercial scales is no greater than 4 lbs/1,000 lbs (4 kg/Mg) of load.
Check the accuracy of the bitumen scales as follows:
Use standard test weights.
If the checks indicate printed weights are out of tolerance, have a registered scale serviceperson check the batch scales and certify the accuracy of the printer.
While the printer system is out of tolerance and before its adjustment, continue production only if using
a set of certified truck scales to determine the truck weights.
Ensure plants using batch scales maintain ten 50 lb (25 kg) standard test weights at the plant site to check batching scale accuracy.
Ensure plant scales used only to proportion mixture ingredients, and not to determine pay quantities, are
within two percent throughout the range. F. Fiber Supply System
When stabilizing fiber is required as a mixture ingredient:
a Use a separate feed system to store and proportion by weight the required quantity into the mixture with uniform distribution.
b Control the feeder system with a proportioning device meeting these Specifications:
Is accurate to within ± 10 percent of the amount required. Automatically adjusts the feed rate to maintain
the material within this tolerance at all times
Has a convenient and accurate means of calibration
Provide in-process monitoring, consisting of either a digital display of output or a printout of feed rate, in pounds (kg) per minute, to verify feed rate
Interlocks with the aggregate feed or weigh system to maintain the correct proportions for all rates
of production and batch sizes
c Provide flow indicators or sensing devices for the fiber system and interlock them with the plant controls to
interrupt the mixture production if fiber introduction fails or if the output rate is not within the tolerances
given above.
d Introduce the fiber as follows:
When a batch type plant is used, add the fiber to the aggregate in the weigh hopper. Increase the batch dry
mixing time by 8 to 12 seconds from the time the aggregate is completely emptied into the mixer to
ensure the fibers are uniformly distributed prior to the injection of asphalt cement into the mixer.
When a continuous or drier-drum type plant is used, add the fiber to the aggregate and uniformly disperse
prior to the injection of asphalt cement. Ensure the fibers will not become entrained in the exhaust system
of the drier or plant.G. Crumb Rubber Modifier Supply System
When specified, crumb rubber modifier may be substituted at the Contractor’s discretion to produce a PG 76-22 asphaltic cement at the production facility in accordance with Section 820:
f. Use a separate feed system to store and proportion by weight of the total asphaltic cement, the required
percentage of crumb rubber into the mixture.
g. Control the feeder system with a proportioning device meeting these Specifications:

51 | P a g e
Section 400—Hot Mix Asphaltic Concrete Construction
Is accurate to within ± 6 percent of the amount required. Automatically adjusts the feed rate to maintain the material within this tolerance at all times.
Has a convenient and accurate means of calibration.
Provide in-process monitoring, consisting of either a digital display of output or a printout of feed rate, in
pounds per minute, to verify feed rate. Ensure the supply system reports the feed in 1 lb (454 gr.)
increments using load cells enabling the user to monitor the depletion of the modifier. Monitoring the
system volumetrically will not be allowed.
Interlocks with the aggregate weigh system and asphaltic cement pump to maintain the correct proportions for all rates of production and batch sizes.
c. Provide flow indicators or sensing devices for the system and interlock them with the plant controls to interrupt
the mixture production if the crumb rubber introduction output rate is not within the ± 6 percent tolerance given
above. This interlock will immediately notify the operator if the targeted rate exceeds introduction tolerances.
All plant production will cease if the introduction rate is not brought back within tolerance after 30 seconds.
When the interlock system interrupts production and the plant has to be restarted, upon restarting operations;
ensure the modifier system runs until a uniform feed can be observed on the output display. Ensure all mix
produced prior to obtaining a uniform feed is rejected.
d. Introduce the crumb rubber modifier as follows:
When a batch type plant is used, add the rubber to the aggregate in the weigh hopper. Increase the batch
dry mixing time by 15 to 20 seconds from the time the aggregate is completely emptied into the mixer to
ensure the modifiers are uniformly distributed prior to the injection of asphalt cement into the mixer.
Increase the batch wet mix time by 15 to 20 seconds to ensure the crumb rubber modifier is uniformly
blended with the asphaltic cement.
When a continuous or drier-drum type plant is used, add the rubber to the aggregate and uniformly
disperse prior to the injection of asphalt cement. The point of introduction in the drum mixer will be
approved by the Engineer prior to production. Ensure the crumb rubber modifier will not become
entrained in the exhaust system of the drier or plant and will not be exposed to the drier flame at any point
after induction.
e. No separate measurement and payment will be made if Contractor elects to utilize crumb rubber.
C. Equipment at Project Site
b Cleaning Equipment
Provide sufficient hand tools and power equipment to clean the roadway surface before placing the bituminous tack coat. Use power equipment compling with Subsection 424.3.02.F, “Power Broom and Power Blower.”
c Pressure Distributor
To apply the bituminous tack coat, use a pressure distributor complying with Subsection 424.3.02.B, “Pressure Distributor.”
d Bituminous Pavers
To place hot mix asphaltic concrete, use bituminous pavers
that can spread and finish courses that are:
As wide and deep as indicated on the Plans
True to line, grade, and cross section
Smooth
Uniform in density and texture

52 | P a g e
Section 400—Hot Mix Asphaltic Concrete Construction
E. Continuous Line and Grade Reference Control. Furnish, place, and maintain the supports, wires, devices, and
materials required to provide continuous line and grade reference control to the automatic paver control system.
F. Automatic Screed Control System. Equip the bituminous pavers with an automatic screed control system
actuated from sensor-directed mechanisms or devices that will maintain the paver screed at a pre-determined
transverse slope and elevation to obtain the required surface.
G. Transverse Slope Controller. Use a transverse slope controller capable of maintaining the screed at the desired
slope within ± 0.1 percent. Do not use continuous paving set-ups resulting in unbalanced screed widths or off-
center breaks in the main screed cross section unless approved by the Engineer.
H. Screed Control. Equip the paver to permit the following four modes of screed control. Ensure the method used is approved by the Engineer.
Automatic grade sensing and slope control
Automatic dual grade sensing
Combination automatic and manual control
Total manual control
Ensure the controls are referenced with a taut string or wire set to grade, or with a ski-type device or mobile
reference at least 30 ft (9 m) long when using a conventional ski. Approved non-contacting laser or sonar-type skis
listed on QPL 91 “Georgia’s List of Approved Non-contacting Laser and Sonar-type Electronic Grade and
Slope Controls” may be used in lieu of conventional 30 ft (9m) skis. Under limited conditions, a short ski or
shoe may be substituted for a long ski on the second paver operating in tandem, or when the reference plane is
a newly placed adjacent lane.
Automatic screed control is required on all Projects; however, when the Engineer determines that
Project conditions prohibit the use of such controls, the Engineer may waive the grade control, or slope
control requirements, or both.
B. Paver Screed Extension. When the laydown width requires a paver screed extension, use bolt-on screed
extensions to extend the screeds, or use an approved mechanical screed extension device. When the screed is
extended, add auger extensions to assure a length of no more than 18 inches (0.5 m) from the auger to the end
gate of the paver. Auger extensions may be omitted when paving variable widths. Ensure the paver is
equipped with tunnel extensions when the screed and augers are extended.
NOTE: Do not use extendible strike-off devices instead of approved screed extensions.
Only use a strike-off device in areas that would normally be luted in by hand labor.
3. Compaction Equipment
Ensure that the compaction equipment is in good mechanical condition and can compact the mixture to the
required density. The compaction equipment number, type, size, operation, and condition is subject to the
Engineer’s approval 4. Materials Transfer Vehicle (MTV)
a. Use a Materials Transfer Vehicle (MTV) when placing asphaltic concrete mixtures on Projects on the state route
system with the following conditions. If a project fails to meet any one of the following conditions, the
MTV’s use is not required other than during the placement of SMA, PEM and OGFC mixtures. MTVs
are required during the placement of SMA, PEM and OGFC mixtures regardless of ADT, project length
and mixture tonnage unless waived at the discretion of the Office of Materials and Testing.
1) When to use:
The ADT is equal to or greater than 6000

53 | P a g e
Section 400—Hot Mix Asphaltic Concrete Construction
The project length is equal to or greater than 3000 linear feet (915 linear meters)
The total tonnage (megagrams) of all asphaltic concrete mixtures is greater than 2000 tons (1815 Mg)
Where to use:
Mainline of the traveled way
Collector/distributor (C/D) lanes on Interstates and limited access roadways
Leveling courses at the Engineer’s discretion
Do not use the MTV for the following conditions:
A resurfacing project that only 9.5 mm mix is required.
A project with lane width that is equal or less than 11 feet (3.4 m).
A passing lane only project.
When noted on the plans.
5. Ensure the MTV and conventional paving equipment meet the following requirements:
MTV
Has a truck unloading system which receives mixture from the hauling equipment and
independently deliver mixtures from the hauling equipment to the paving equipment.
Has mixture remixing capability approved by the Office of Materials and Testing and is listed on QPL88 “Georgia’s List of Approved Materials Transfer Vehicles”.
Provides to the paver a homogeneous, non-segregated mixture of uniform temperature with no more
than 20 °F(11 oC) difference between the highest and lowest temperatures when measured
transversely across the width of the mat in a straight line at a distance of one foot to twenty-five feet
(0.3 m to 7.6 m) from the screed while the paver is operating. Ensure that the MTV is capable of
providing the paver a consistent material flow that is sufficient to prevent the paver from stopping
between truck exchanges.
Conventional Paving Equipment
Has a paver hopper insert with a minimum capacity of 14 tons (13 Mg) installed in the hopper of conventional paving equipment when an MTV is used.
6. If the MTV malfunctions during spreading operations, discontinue placement of hot mix asphaltic concrete after there
is sufficient mix placed to maintain traffic in a safe manner. However, placement of hot mix asphaltic concrete in a
lift not exceeding 2 in. (50 mm) may continue until any additional hot mix in transit at the time of the malfunction
has been placed. Cease spreading operations thereafter until the MTV is operational.
7. Ensure the MTV is empty when crossing a bridge and is moved across without any other Contractor vehicles
or equipment on the bridge. Move the MTV across a bridge in a travel lane and not on the shoulder. Ensure the
speed of the MTV is no greater than 5 mph (8 kph) without any acceleration or deceleration while crossing a
bridge.
400.3.3 Preparation B. Prepare Existing Surface
Prepare the existing surface as follows:
Clean the Existing Surface. Before applying hot mix asphaltic concrete pavement, clean the existing surface to the Engineer’s satisfaction.
Patch and Repair Minor Defects
Before placing leveling course:
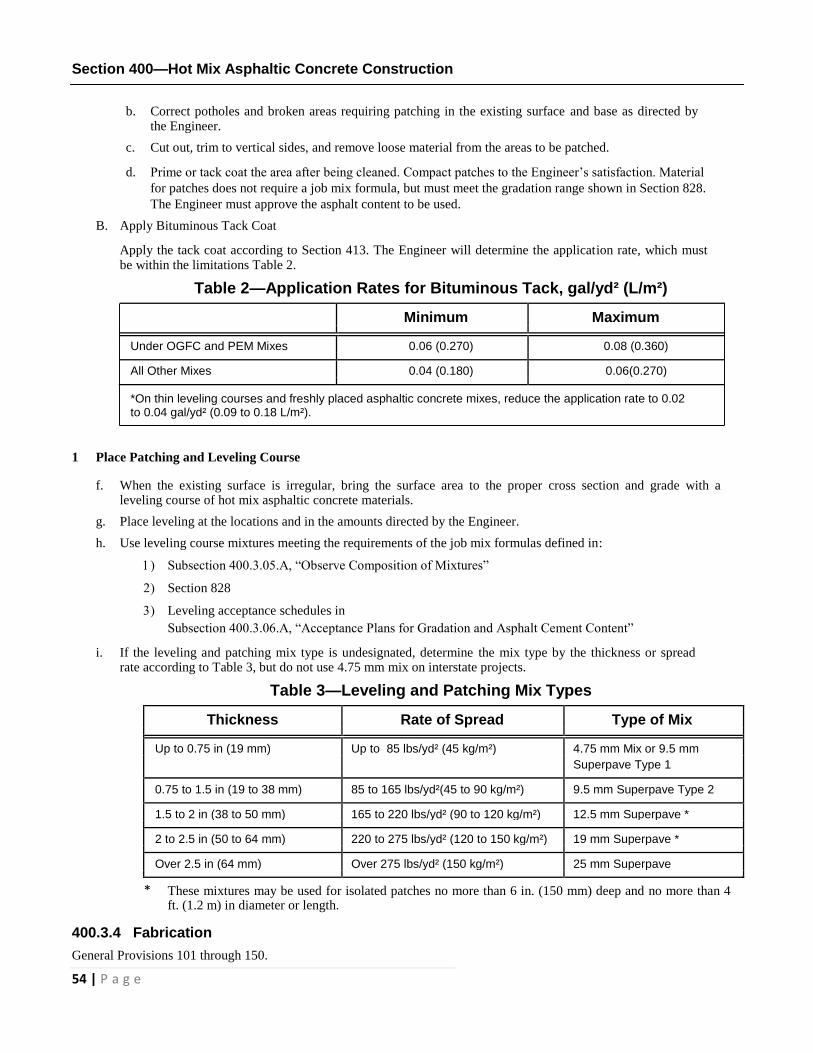
54 | P a g e
Section 400—Hot Mix Asphaltic Concrete Construction
b. Correct potholes and broken areas requiring patching in the existing surface and base as directed by
the Engineer.
c. Cut out, trim to vertical sides, and remove loose material from the areas to be patched.
d. Prime or tack coat the area after being cleaned. Compact patches to the Engineer’s satisfaction. Material
for patches does not require a job mix formula, but must meet the gradation range shown in Section 828.
The Engineer must approve the asphalt content to be used.
B. Apply Bituminous Tack Coat
Apply the tack coat according to Section 413. The Engineer will determine the application rate, which must be within the limitations Table 2.
Table 2—Application Rates for Bituminous Tack, gal/yd² (L/m²)
Minimum Maximum
Under OGFC and PEM Mixes 0.06 (0.270) 0.08 (0.360)
All Other Mixes 0.04 (0.180) 0.06(0.270)
*On thin leveling courses and freshly placed asphaltic concrete mixes, reduce the application rate to 0.02 to 0.04 gal/yd² (0.09 to 0.18 L/m²).
1 Place Patching and Leveling Course
f. When the existing surface is irregular, bring the surface area to the proper cross section and grade with a leveling course of hot mix asphaltic concrete materials.
g. Place leveling at the locations and in the amounts directed by the Engineer.
h. Use leveling course mixtures meeting the requirements of the job mix formulas defined in:
Subsection 400.3.05.A, “Observe Composition of Mixtures”
Section 828
Leveling acceptance schedules in
Subsection 400.3.06.A, “Acceptance Plans for Gradation and Asphalt Cement Content”
i. If the leveling and patching mix type is undesignated, determine the mix type by the thickness or spread rate according to Table 3, but do not use 4.75 mm mix on interstate projects.
Table 3—Leveling and Patching Mix Types
Thickness Rate of Spread Type of Mix
Up to 0.75 in (19 mm) Up to 85 lbs/yd² (45 kg/m²) 4.75 mm Mix or 9.5 mm Superpave Type 1
0.75 to 1.5 in (19 to 38 mm) 85 to 165 lbs/yd²(45 to 90 kg/m²) 9.5 mm Superpave Type 2
1.5 to 2 in (38 to 50 mm) 165 to 220 lbs/yd² (90 to 120 kg/m²) 12.5 mm Superpave *
2 to 2.5 in (50 to 64 mm) 220 to 275 lbs/yd² (120 to 150 kg/m²) 19 mm Superpave *
Over 2.5 in (64 mm) Over 275 lbs/yd² (150 kg/m²) 25 mm Superpave * These mixtures may be used for isolated patches no more than 6 in. (150 mm) deep and no more than 4
ft. (1.2 m) in diameter or length. 400.3.4 Fabrication General Provisions 101 through 150.

55 | P a g e
Section 400—Hot Mix Asphaltic Concrete Construction
400.3.05 Construction Provide the Engineer at least one day’s notice prior to beginning construction, or prior to resuming production if operations have been temporarily suspended. C. Observe Composition of Mixtures
Calibration of plant equipment
If the material changes, or if a component affecting the ingredient proportions has been repaired, replaced, or adjusted, check and recalibrate the proportions.
Calibrate as follows:
Before producing mixture for the Project, calibrate by scale weight the electronic sensors or settings
for proportioning mixture ingredients.
Calibrate ingredient proportioning for all rates of production.
Mixture control
Compose hot mix asphaltic concrete from a uniform mixture of aggregates, bituminous material, and if required, hydrated lime, mineral filler, or other approved additive.
Ensure the constituents proportional to produce mixtures meeting the requirements in Section 828. The
general composition limits prescribed are extreme ranges within which the job mix formula must be
established. Base mixtures on a design analysis that meets the requirements of Section 828.
Ensure the field performance of the in-place mixtures meet the requirements of Subsection 828.2B for Permeability,
Moisture Susceptibility, Rutting Susceptibility and Fatigue. In-place mix may be evaluated for compliance with
Subsection 828.2.B at the discretion of the State Bituminous Construction Engineer under the following conditions:
Deviates greater than 10 percent on gradation for mixture control sieves from the approved Job Mix Formula based on Acceptance or Independent Samples.
Deviates greater than 0.7 percent in asphalt cement content from the approved Job Mix Formula based
on Acceptance or Independent Samples.
The calculated mean pavement air voids result in an adjusted pay factor less than 0.80 or any single sub lot result in mean pavement air voids exceeding 10.5 percent.
Mix produced not using an approved mix design and/or job mix formula.
Remove and replace any material determined to not meet the requirements established in Section 828.2.B at the Contractor’s expense.
If control test results show the characteristic tested does not conform to the job mix formula control tolerances given in Section 828, take immediate action to ensure that the quality control methods are effective.
Control the materials to ensure extreme variations do not occur. Maintain the gradation within the composition limits in Section 828.
F. Prepare Bituminous Material
Uniformly heat the bituminous material to the temperature specified in the job mix formula with a tolerance of ± 20 °F (± 11 °C).
G. Prepare the Aggregate
Prepare the aggregate as follows:

56 | P a g e
Section 400—Hot Mix Asphaltic Concrete Construction
1. Heat the aggregate for the mixture, and ensure a mix temperature within the limits of the job mix formula.
2. Do not contaminate the aggregate with fuel during heating.
3. Reduce the absorbed moisture in the aggregate until the asphalt does not separate from the aggregate in the
prepared mixture. If this problem occurs, the Engineer will establish a maximum limit for moisture content in the
aggregates. When this limit is established, maintain the moisture content below this limit. 3. Prepare the Mixture
Proportion the mixture ingredients as necessary to meet the required job mix formula. Mix until a homogenous mixture is produced.
a. Add Mineral Filler
When mineral filler is used, introduce it in the proper proportions and as specified in Subsection 400.3.02.B.5, “Mineral Filler Supply System.”
b. Add Hydrated Lime
When hydrated lime is included in the mixture, add it at a rate specified in Section 828 and the job mix formula. Use methods and equipment for adding hydrated lime according to Subsection 400.3.02.B.6, “Hydrated Lime Treatment System.”
Add hydrated lime to the aggregate by using Method A or B as follows:
Method A—Dry Form—Add hydrated lime in its dry form to the mixture as follows, according to the type of plant:
1 Batch Type Asphalt Plant: Add hydrated lime to the mixture in the weigh hopper or as approved and
directed by the Engineer.
2 Continuous Plant Using Pugmill Mixer: Feed hydrated lime into the hot aggregate before it is introduced into the mixer to ensure dry mixing is complete before the bituminous material is added.
3 Continuous Plant Using Drier-Drum Mixer: Add hydrated lime so to ensure the lime will not become
entrained into the air stream of the drier and to ensure thorough dry mixing will be complete before the
bituminous material is added.
Method B—Lime/Water Slurry—Add the required quantity of hydrated lime (based on dry weight) in lime/water
slurry form to the aggregate. This solution consists of lime and water in concentrations as directed by the Engineer.
Equip the plant to blend and maintain the hydrated lime in suspension and to mix the hydrated lime with the aggregates uniformly in the proportions specified.
3. Add Stabilizing Fiber
When stabilizing fiber is included in the mixture, add stabilizing fiber at a rate specified in Section 819 and the Job Mix Formula. Introduce it as specified in Subsection 400.3.02.B.8, “Fiber Supply System.”
4. Add Gilsonite Modifier
When approved by the Office of Materials and Testing and required by the Contract, add the Gilsonite modifier to
the mixture at a rate to ensure eight percent by weight of the asphalt cement is replaced by Gilsonite. Use either
PG 64-22 or PG 67-22 asphalt cement as specified in Subsection 820.2.01. Provide suitable means to calibrate and
check the rate of Gilsonite being added. Introduce Gilsonite modifier by either of the following methods.
a. For batch type plants, incorporate Gilsonite into the pugmill at the beginning of the dry mixing cycle.
Increase the dry mix cycle by a minimum of 10 seconds after the Gilsonite is added and prior to introduction
of the asphalt cement. For this method, supply Gilsonite in plastic bags to protect the material during
shipment and handling and store the modifier in a waterproof environment. Ensure the bags are capable of
being completely melted and uniformly blended into the combined mixture.

57 | P a g e
Section 400—Hot Mix Asphaltic Concrete Construction
Gilsonite may also be added through a mineral filler supply system as described in Subsection 400.3.02.B.5,
“Mineral Filler Supply System.” Ensure the system is capable of injecting the modifier into the weigh hopper
near the center of the aggregate batching cycle so the material can be accurately weighed.
. For drum drier plants, add Gilsonite through the recycle ring or through an acceptable means which will
introduce the Gilsonite prior to the asphalt cement injection point. The modifier must proportionately feed into
the drum mixer at the required rate by a proportioning device which shall be accurate within 10 percent of the
amount required. Ensure the entry point is away from flames and the Gilsonite will not be caught up in the air
stream and exhaust system.
11. Materials from Different Sources
Do not use mixtures prepared from aggregates from different sources intermittently. This will cause the color of the finished pavement to vary.
E. Observe Weather Limitations
Do not mix and place asphaltic concrete if the existing surface is wet or frozen. Do not lay asphaltic
concrete OGFC mix or PEM at air temperatures below 60 ºF (16 ºC). When using a MTV, OGFC mix or PEM
may be placed at 55 ºF (13 ºC) when approved by the Engineer. For other courses, follow the temperature
guidelines in the following table:
Table 4—Lift Thickness Table
Lift Thickness Minimum Temperature
1 in (25 mm) or less 55 °F (13 °C)
1.1 to 2 in (26 mm to 50 mm) 45 °F (8 °C)
2.1 to 3 in (51 mm to 75 mm) 40 °F (4 °C)
3.1 to 4 in (76 mm to 100 mm) 35 °F (2 °C)
4.1 to 8 in (101 mm to 200 mm) 32 °F (0 °C) and rising. Base Material must not be frozen.
A Perform Spreading and Finishing
Spread and finish the course as follows:
1. Determine the course’s maximum compacted layer thickness by the type mix being used according to Table 5.
Table 5—Maximum Layer Thickness
Mix Type Minimum Layer Maximum Layer Maximum Total
Thickness Thickness Thickness
25 mm Superpave 2 1/2 in (64 mm) 4 in (100 mm) * —
19 mm Superpave 1 3/4 in (44 mm) 3 in (75 mm) * —
12.5 mm Superpave 1 3/8 in (35 mm) 2 1/2 in (64 mm)** 8 in (200 mm)
9.5 mm Superpave Type 2 1 1/8 in.(28 mm) 1 1/2 in (38 mm)** 4 in (100 mm)
9.5 mm Superpave Type 1 7/8 in (22 mm) 1 1/4 in (32 mm) 4 in (100 mm)
4.75 mm Mix 3/4 in (19 mm) 1 1/8 in (28 mm) 2 in (50 mm)
9.5 mm OGFC 55 lbs/yd² (30 kg/m²) 65 lbs/yd² (36 kg/m²) —

58 | P a g e
Section 400—Hot Mix Asphaltic Concrete Construction
Mix Type Minimum Layer Maximum Layer Maximum Total
Thickness Thickness Thickness
12.5 mm OGFC 85 lbs/yd² (47 kg/m²) 95 lbs/yd² (53 kg/m²) —
12.5 mm PEM 110 lbs/yd² (80 kg/m²) 165 lbs/yd² (90 kg/m²) —
9.5 mm SMA 1 1/8 in (28 mm) 1 1/2 in (38 mm) 4 in (100 mm)
12.5 mm SMA 1 3/8 in (35 mm) 3 in (75 mm) 6 in (150 mm)
19 mm SMA 1 3/4 in (44 mm) 3 in (75 mm) —
* Allow up to 6 in (150 mm) per lift on trench widening. **Place 9.5 mm Superpave and 12.5 mm Superpave up to 4 in (100 mm) thick for driveway and side road transition.
4. Unload the mixture into the paver hopper or into a device designed to receive the mixture from delivery vehicles.
5. Except for leveling courses, spread the mixture to the loose depth for the compacted thickness or the spread
rate. Use a mechanical spreader true to the line, grade, and cross section specified. 6. For leveling courses, use a motor grader equipped with a spreader box and smooth tires to spread the material or
use a mechanical spreader meeting the requirements in Subsection 400.3.02.C, “Equipment at Project Site.” 7. Obtain the Engineer’s approval for the sequence of paving operations, including paving the adjoining lanes.
Minimize tracking tack onto surrounding surfaces. 8. Ensure the outside edges of the pavement being laid are aligned and parallel to the roadway center line.
9. For New Construction or Resurfacing Contracts containing multiple lifts or courses, arrange the width of the
individual lifts so the longitudinal joints of each successive lift are offset from the previous lift at least 1 ft
(300 mm). This requirement does not apply to the lift immediately over thin lift leveling courses.
Ensure the longitudinal joint(s) in the surface course and the mix immediately underneath asphaltic concrete OGFC or PEM are at the lane line(s).
NOTE: Perform night work with artificial light provided by the Contractor and approved by the Engineer.
10. Where mechanical equipment cannot be used, spread and rake the mixture by hand. Obtain the Engineer’s approval of the operation sequence, including compactive methods, in these areas.
11. Keep small hand raking tools clean and free from asphalt build up. Do not use fuel oil or other harmful solvents
to clean tools during the work. 11. Do not use mixture with any of these characteristics:
Segregated
Nonconforming temperature
Deficient or excessive asphalt cement content
Otherwise unsuitable to place on the roadway in the work12. Remove and replace mixture placed on the roadway that the Engineer determines has unacceptable blemish levels
from segregation, raveling, streaking, pulling and tearing, or other deficient characteristics. Replace with acceptable
mixture at the Contractor’s expense. Do not continually place mixtures with deficiencies.
Do not place subsequent course lifts over another lift or course placed on the same day while the temperature of the previously placed mix is 140 °F (60 °C) or greater.
13. Obtain the Engineer’s approval of the material compaction equipment. Perform the rolling as follows:

59 | P a g e
Section 400—Hot Mix Asphaltic Concrete Construction
a. Begin the rolling as close behind the spreader as possible without causing excessive distortion of the
asphaltic concrete surface.
b. Continue rolling until roller marks are no longer visible.
c. Use pneumatic-tired rollers with breakdown rollers on all courses except asphaltic concrete OGFC, PEM and SMA or other mixes designated by the Engineer.
13. If applicable, taper or “feather” asphaltic concrete from full depth to a depth no greater than 0.5 in (13 mm)
along curbs, gutters, raised pavement edges, and areas where drainage characteristics of the road must be
retained. The Engineer will determine the location and extent of tapering. C. Maintain Continuity of Operations
Coordinate plant production, transportation, and paving operations to maintain a continuous operation. If the
spreading operations are interrupted, construct a transverse joint if the mixture immediately behind the paver screed
cools to less than 250 ºF (120 ºC). D. Construct the Joints
A Construct Transverse Joints
1 Construct transverse joints to facilitate full depth exposure of the course before resuming placement of the affected course.
2 Properly clean and tack the vertical face of the transverse joint before placing additional material.
NOTE: Never burn or heat the joint by applying fuel oil or other volatile materials.
c. Straightedge transverse joints immediately after forming the joint.
d. Immediately correct any irregularity that exceeds 3/16 in. in 10 ft (5 mm in 3 m).
2. Construct Longitudinal Joints
Clean and tack the vertical face of the longitudinal joint before placing adjoining material. Construct longitudinal joints so that the joint is smooth, well sealed, and bonded.
3. Construction Joint Detail for OGFC and PEM Mixtures
In addition to meeting joint requirements described above, construct joints and transition areas for 12.5 mm OGFC and 12.5 mm PEM mixtures as follows:
a. For projects which do not have milling included as a pay item:
1) Place OGFC mixture meeting gradation requirements of 9.5 mm OGFC as specified in Section 828 on
entrance and exit ramp gore areas and end of project construction joints.
Taper mixture from 3/8 in (10 mm) at end of project to full plan depth within maximum distance of spread for one load of mixture
Taper mixture placed on gore areas from thickness of the edge of the mainline to 3/8 in (10 mm)
at the point of the ramp transverse joint.
2) Construct the ramp transverse joint at the point specified in the plans or as directed by the Engineer.
3) Mixture placed in the transition and gore areas will be paid for at the contract unit price for 12.5 mm OGFC or 12.5 mm PEM as applicable.
b. For projects which have milling included as a pay item:
1) Taper milling for a distance of no less than 50 ft (15 m) to a depth of 2 1/4 in (59 mm) at the point of
the transverse joint
2) Taper thickness, if needed, of the dense-graded surface mix within the 50 ft (15 m) distance to 1 1/2 in (40 mm) at the point of the transverse joint

60 | P a g e
Section 400—Hot Mix Asphaltic Concrete Construction
3) Taper thickness of the 12.5 mm OGFC or 12.5 mm PEM to 3/4 in (19 mm) to ensure the material ties in
at grade level with the existing surface at the point of the transverse joint I. Protect the Pavement
Protect sections of the newly finished pavement from traffic until the traffic will not mar the surface or alter the
surface texture. If directed by the Engineer, use artificial methods to cool the newly finished pavement to open the
pavement to traffic more quickly. J. Modify the Job Mix Formula
If the Engineer determines that undesirable mixture or mat characteristics are being obtained, the job mix formula may require immediate adjustment.
400.3.06 Quality Acceptance A. Acceptance Plans for Gradation and Asphalt Cement Content
The Contractor will randomly sample and test mixtures for acceptance on a lot basis. The Department will monitor
the Contractor testing program and perform comparison and quality assurance testing. The Contractor’s Quality
Control Technicians shall participate in the Department’s Independent Assurance Systems Basis Program.
1. Determine Lot Amount
A lot consists of the tons (megagrams) of asphaltic concrete produced and placed each production day. If this
production is less than 500 tons (500 Mg), or its square yard (meter) equivalent, production may be
incorporated into the next working day. The Engineer may terminate a lot when a pay adjustment is imminent if
a plant or materials adjustment resulting in a probable correction has been made. Terminate all open lots at the
end of the month, except for materials produced and placed during the adjustment period. The lot will be
terminated as described in Subsection 400.5.01,”Adjustments”.
If the final day’s production does not constitute a lot, the production may be included in the lot for the previous day’s
run; or, the Engineer may treat the production as a separate lot with a corresponding lower number of tests.
2. Determine Lot Acceptance
Determine lot acceptance as found in Subsection 400.5.01, “Adjustments.”
The Department will perform the following task:
Determine the pay factor by using the mean of the deviations from the job mix formula of the tests in each lot and
apply it to Table 10 Mixture Acceptance Schedule for Surface Mixes or Table 11 Mixture Acceptance Schedule for
Subsurface Mixes, whichever is appropriate. This mean will be determined by averaging the actual numeric value of
the individual deviations from the job mix formula, disregarding whether the deviations are positive or negative
amounts. Do not calculate lot acceptance using test results for materials not used in the Work. Determine the pay
factor for each lot by multiplying the contract unit price by the appropriate pay factor from the Mixture Acceptance
Schedule - Table 10 or Table 11. When two or more pay factors for a specific lot are less than 1.0, determine the
adjusted payment by multiplying the contract unit price by the lowest pay factor.
If the mean of the deviations from the job mix formula of the lot acceptance tests for a control sieve or for
asphalt cement content exceeds the tolerances established in the appropriate Mixture Acceptance Schedule,
and if the Engineer determines that the material need not be removed and replaced, the lot may be accepted at
an adjusted unit price as determined by the Engineer. If the Engineer determines that the material is not
acceptable to leave in place, the materials shall be removed and replaced at the Contractor's expense.
C. Provide Quality Control Program
Provide a Quality Control Program as established in SOP 27 which includes:
Assignment of quality control responsibilities to specifically named individuals who have been certified by the Office of Materials and Testing

61 | P a g e
Section 400—Hot Mix Asphaltic Concrete Construction
Provisions for prompt implementation of control and corrective measures
Provisions for communication with Project Manager, Bituminous Technical Services Engineer, and
Testing Management Operations Supervisor at all times
Provisions for reporting all test results daily through the Office of Materials and Testing computerized
Field Data Collection System; other checks, calibrations and records will be reported on a form
developed by the Contractor and will be included as part of the project records
Notification in writing of any change in quality control personnela. Certification Requirements:
Use laboratory and testing equipment certified by the Department. (Laboratories which participate in
and maintain AASHTO accreditation for testing asphaltic concrete mixtures will be acceptable in
lieu of Departmental certification.)
Provide certified quality control personnel to perform the sampling and testing. A Quality Control Technician (QCT) may be certified at three levels:
1) Temporary Certification – must be a technician trainee who shall be given direct oversight by a
certified Level 1 or Level 2 QCT while performing acceptance testing duties during the first 5
days of training. The trainee must complete qualification requirements within 30 Georgia
Department of Transportation funded production days after being granted temporary certification.
A trainee who does not become qualified within 30 Georgia Department of Transportation funded
production days will not be re-eligible for temporary certification. A certified Level 1 or Level 2
QCT shall be at the plant at all times during production and shipment of mixture to monitor work
of the temporarily certified technician.
2) Level 1 – must demonstrate they are competent in performing the process control and acceptance
tests and procedures related to hot mix asphalt production and successfully pass a written exam.
3) Level 2 – must meet Level 1 requirements and must be capable of and responsible for making process control adjustments, and successfully pass a written exam.
Technician certification is valid for 3 years from the date on the technician’s certificate unless
revoked or suspended. Eligible technicians may become certified through special training and
testing approved by the Office of Materials and Testing. Technicians who lose their
certification due to falsification of test data will not be eligible for recertification in the future
unless approved by the State Materials and Testing Engineer.b. Quality Control Management
2) Designate at least one Level 2 QCT as manager of the quality control operation. Ensure the Quality Control Manager meets the following requirements:
Be accountable for actions of other QCT personnel
Ensure all applicable sampling requirements and frequencies, test procedures, and Standard
Operating Procedures are adhered to
Ensure all reports, charts, and other documentation is completed as required
3) Provide QCT personnel at the plant as follows:
If daily production for all mix types is to be greater than 250 tons (megagrams), have a
QCT person at the plant at all times during production and shipment of mixture until all
required acceptance tests have been completed
If daily production for all mix types will not be greater than 250 tons (megagrams) a QCT may be responsible for conducting tests at up to two plants, subject to random number sample selection

62 | P a g e
Section 400—Hot Mix Asphaltic Concrete Construction
Have available at the plant or within immediate contact by phone or radio a Level 2 QCT
responsible for making prompt process control adjustments as necessary to correct the mix3) Sampling, Testing, and Inspection Requirements.
Provide all sample containers, extractants, forms, diaries, and other supplies subject to approval of the Engineer.
Perform daily sampling, testing, and inspection of mixture production that meets the following requirements:
(a) Randomly sample mixtures according to GSP 15, and GDT 73 (Method C) and test on a lot basis.
In the event less than the specified number of samples are taken, obtain representative 6 in (150
mm) cores from the roadway at a location where the load not sampled was placed. Take enough
cores to ensure minimum sample size requirements are met for each sample needed.
(b) Maintain a printed copy of the computer generated random sampling data as a part of the project records.
(c) Perform sampling, testing, and inspection duties of GSP 21.
(d) Perform extraction or ignition test (GDT 83 or GDT 125) and extraction analysis (GDT 38). If the
ignition oven is used, a printout of sample data including weights becomes a part of the project
records. For asphalt cement content only, digital printouts of liquid asphalt cement weights may be
substituted in lieu of an extraction test for plants with digital recorders. Calculate the asphalt
content from the ticket representing the mixture tested for gradation.
(e) Save extracted aggregate, opposite quarters, and remaining material (for possible referee testing) of each sample as follows:
Store in properly labeled, suitable containers
Secure in a protected environment
Store for three working days. If not obtained by the Department, within three days they may
be discarded in accordance with GSP 21.
(f) Add the following information on load tickets from which a sample or temperature check is taken:
Mixture temperature
Signature of the QCT person performing the testing
(g) Calibrate the lime system when hydrated lime is included in the mixture:
Perform a minimum of twice weekly during production
Post results at the plant for review
Provide records of materials invoices upon request (including asphalt cement, aggregate, hydrated lime, etc.)
(h) Take action if acceptance test results are outside Mixture Control Tolerances of Section 828.
One sample out of tolerance
(1) Contact Level 2 - QCT to determine if a plant adjustment is needed
(2) Immediately run a process control sample. Make immediate plant adjustments if
this sample is also out of tolerance
NOTE: Determine mixture temperature at least once per hour of production for

63 | P a g e
Section 400—Hot Mix Asphaltic Concrete Construction
(3) Test additional process control samples as needed to ensure corrective action taken
appropriately controls the mixture
Two consecutive acceptance samples of the same mix type out of tolerance regardless of Lot
or mix design level, or three consecutive acceptance samples out of tolerance regardless of
mix type
(1) Stop plant production immediately
(2) Reject any mixture in storage:
Deviating more than 10 percent in gradation from the job mix formula based on the acceptance sample
Deviating more than 0.7 percent in asphalt content from the job mix formula
based on the acceptance sample
(3) Make a plant correction to any mix type out of tolerance prior to resuming production
Do not send any mixture to the project before test results of a process control sample meets Mixture Control Tolerances
Reject any mixture produced at initial restarting that does not meet Mixture Control
Tolerancesa. Comparison Testing and Quality Assurance Program
Periodic comparison testing by the Department will be required of each QCT to monitor consistency of
equipment and test procedures. The Department will take independent samples to monitor the
Contractor's quality control program.
Comparison Sampling and Testing
Retain samples for comparison testing and referee testing if needed as described in Subsection
400.3.06.A.3.b.3. Discard these samples only if the Contractor's acceptance test results meet a 1.00
pay factor and the Department does not procure the samples within three working days.
The Department will test comparison samples on a random basis. Results will be compared to the respective contractor acceptance tests and the maximum difference is as follows:
Table 6—Allowable Percent Difference Between Department and Contractor Acceptance Tests
SIEVE SIZE SURFACE SUB-SURFACE
1/2 in. (12.5 mm) 4.0%
3/8 in. (9.5 mm) 3.5% 4.0%
No. 4 (4.75 mm) 3.5% 3.5%
No. 8 (2.36 mm) 2.5% 3.0%
No. 200 (75 m) 2.0% 2.0%
A.C. 0.4% 0.5%

64 | P a g e
Section 400—Hot Mix Asphaltic Concrete Construction
(1) If test comparisons are within these tolerances:
Continue production
Use the Contractor's tests for acceptance of the lot
(2) If test comparisons are not within these tolerances:
Another Departmental technician will test the corresponding referee sample
Results of the referee sample will be compared to the respective contractor and
Departmental tests using the tolerance for comparison samples given above.
(a) If referee test results are within the above tolerances when compared to the
Contractor acceptance test, use the Contractor's test for acceptance of the
effected lot.
(b) If referee test results are not within the above tolerances when compared to the
Contractor acceptance test, the Department will review the Contractor's
quality control methods and determine if a thorough investigation is needed.
c) Independent Verification Sampling and Testing
(1) Randomly take a minimum of two independent samples from the lesser of five days or five lots of production regardless of mix type or number of projects.
(2) Compare test deviation from job mix formula to Mixture Control Tolerances in Section 828.
If results are outside these tolerances, another sample from the respective mix may be taken.
NOTE: For leveling courses less than 110 lb/yd² (60 kg/m²) having quality assurance
test results outside the Mixture Control Tolerances of Section 828, use the
Department's test results only and applicable pay factors will apply.
If test results of the additional sample are not within Mixture Control Tolerances, the
Department will take the following action:
Take random samples from throughout the subject lot(s) as established in Subsection
400.3.06.A.3.b.3 and use these test results for acceptance and in calculations for the monthly
plant rating. Applicable pay factors will apply and the contractor QCT test results will not
be included in pay factor calculations nor in the monthly plant rating.
Determine if the Contractor's quality control program is satisfactory and require prompt corrective action by the Contractor if specification requirements are not being met.
Determine if the QCT has not followed Departmental procedures or has provided erroneous information.
Take samples of any in-place mixture represented by unacceptable QCT tests and use the
additional sample results for acceptance and in calculations for the monthly plant rating and
apply applicable pay factors. The Contractor QCT tests will not be included in the pay factor
calculations nor in the monthly plant rating. B. Compaction
Determine the mixture compaction using either GDT 39 , GDT 59 or AASHTO T 331. The method of GDT 39 for “Uncoated Specimens, Dense Graded Mixtures Only” shall not apply when the water absorption of a sample exceeds

65 | P a g e
Section 400—Hot Mix Asphaltic Concrete Construction
2.0 percent, as measured according to AASHTO T 166. In this case, either AASHTO T 331 or the paraffin method of
GDT 39 shall apply. The compaction is accepted in lots defined in Subsection 400.3.06. A “Acceptance Plans for
Gradation and Asphalt Cement Content” and is within the same lot boundaries as the mixture acceptance. 2. Calculate Pavement Mean Air Voids
The Department is responsible for pavement mean air void acceptance testing. The Contractor is responsible for
establishing all roller patterns and any quality control testing. Upon written request by the Contractor, the Office of
Materials and Testing will provide nuclear gauge testing assistance for compaction related issues.
The Department will calculate the pavement air voids placed within each lot as follows:
a. One test per sub-lot.
Lots > 400 ton (400 Mg) of mix are divided into 5 sub-lots of equal distance
Lots ≤ 400 tons (400 Mg) of mix are divided into a sub-lot or sub-lots of equal distance at a rate of one per
100 tons (100 Mg) mix each. (Example: 299 tons of mix require 3 sublots and 301 tons of mix require 4
sublots) There will be less than 5 sub-lots.
b. Average the results of all tests run on randomly selected sites in that lot.
c. Select representative sites randomly using GDT 73.
Density tests are not required for asphaltic concrete placed at 90 lbs/yd2 (50 kg/m
2) or less, 4.75 mm mix, and
asphaltic concrete OGFC, PEM and mixes placed as variable depth or width leveling. Compact these courses to
the Engineer’s satisfaction. Density tests will not be performed on turn-outs and driveways.
The targeted maximum Pavement Mean Air Void content for all Superpave and Stone Matrix Asphalt mixtures is
5.0 percent. Ensure that the maximum Pavement Mean Air Voids for all Superpave and Stone Matrix Asphalt
mixtures does not exceed 7.0 percent. The maximum Pavement Mean Air Voids for 2 foot shoulder widening is
9.0 percent. The adjustment period for density is four lots or four production days, whichever is less, in order for
the contractor to ensure maximum compactive effort has been achieved which will yield no more than the specified
maximum allowed Mean Air Voids. One additional lot or production day of adjustment may be given for a
reduction in asphalt cement content on the JMF made by the Office of Materials and Testing for mix designs
incorporating the Corrected Optimum Asphalt Content COAC.
If the contractor needs to adjust the mixture to improve density results, a change in the job mix formula may be requested for approval during the adjustment period so long as the following values are not exceeded:
Coarse pay sieve 4%
No. 8 (2.36 mm) sieve 2%
No. 200 (75 m) sieve 1%
Asphalt Content 0.2%
All value changes must still be within specification limits
If the Office of Materials and Testing is satisfied that the contractor has exerted the maximum compactive effort and
is not able to maintain Pavement Mean Air Voids at no more than 7.0%, the Engineer may establish a maximum
target for Pavement Mean Air Voids.
Ensure mixture placed during the adjustment period for density meets the requirements for a 0.90 pay factor in Table
13 of Subsection 400.5.01.C, “Calculate Mean Pavement Air Voids.” Mixture not meeting these density
requirements is paid for using the applicable pay factor.
If the mean air voids of the pavement placed within a lot exceeds 100% of the maximum target air voids, if
established and the Engineer determines that the material need not be removed and replaced, the lot may be
accepted at an adjusted unit price as determined by the Engineer. 2. Obtain Uniform Compaction

66 | P a g e
Section 400—Hot Mix Asphaltic Concrete Construction
For a lot to receive a pay factor of 1.00 for compaction acceptance, the air void range cannot exceed 5 percent for
new construction or resurfacing projects. The range is the difference between the highest and lowest acceptance
test results within the affected lot. If the air void range exceeds these tolerances, apply a Pay Factor of 95%.
The 5% reduced pay factor for the compaction range does not apply in these instances:
The mixture is placed during the adjustment period as defined in Subsection 400.5.01.A, “Materials Produced and Placed During the Adjustment Period.”
All air void results within a given lot are less than 7.0%.
A lot containing two sublot or less.
C On two foot trench widening.
D For sub-surfaces mixes including 19 mm and 25 mm Superpave mixes if all air void results within a given lot are >2.5 % <8 %.
When lots are reevaluated for range penalty, as shown in Subsection 106.03, “Samples, Tests, Cited
Specifications,” sampling and testing is according to GDT 73. Request for reevaluation must be made within 5
working days of notification of the lot results. The following procedures apply:
The Department will reevaluate the lot through additional testing by obtaining and testing three additional cores
acquired in representative sites selected randomly throughout each sub-lot representing the high and low in-place air
voids as detailed in GDT 73. The additional six cores (three cores from each sub-lot will be averaged) will replace
the original five core results for range specified requirements only. The original five cores results will be reported
for Pavement Mean Air Voids for the lot. This will be the final evaluation for compaction range for the lot. Lots
will not be re-evaluated for range when the Pavement Mean Air Voids result in a lower than 95% pay factor. Ensure
requests for reevaluation are made within 5 working days of notification of the lot results.
The Department will determine the payment for each lot by multiplying the Contract Unit Price by the adjusted pay factor shown in the Table 7 Average Air Voids Range Acceptance Schedule:
Table 7—Average Air Voids Range For Acceptance Schedule
Pay Range between High and Re-evaluated Range between High and Low Air Void Cores Factor Low Air Void 6 New Cores obtained from High (3 cores) and Low location (3 cores)
Original 5 cores
100 ≤ 5 % < 4.50 %
0.95 > 5 % > 4.50 %
C. Surface Tolerance
In this Specification, pavement courses to be overlaid with an Open-Graded Friction Course or PEM are considered
surface courses. All Open-Graded Friction Courses or PEM are to be evaluated after the roadway has been opened to
traffic for a minimum of 5 days and a maximum of 15 days. Asphalt paving is subject to straightedge and visual
inspection and irregularity correction as shown below:
1. Visual and Straightedge Inspection
Paving is subject to visual and straightedge inspection during and after construction operations until Final Acceptance. Locate surface irregularities as follows:
a. Keep a 10 ft (3 m) straightedge near the paving operation to measure surface irregularities on courses.
Provide the straightedge and the labor for its use.
b. Inspect the base, intermediate, and surface course surfaces with the straightedge to detect irregularities.
c. Correct irregularities that exceed 3/16 in. in 10 ft (5 mm in 3 m) for base and intermediate courses, and 1/8 in. in 10 ft (3 mm in 3 m) for surface courses.

67 | P a g e
Section 400—Hot Mix Asphaltic Concrete Construction
Mixture or operating techniques will be stopped if irregularities such as rippling, tearing, or pulling occur and
the Engineer suspects a continuing equipment problem. Stop the paving operation and correct the problem.
Correct surface course evaluations on individual Laser Road Profiler test sections, normally 1mile (1 km) long.
3. Target Surface Smoothness
The Department will use the Laser Road Profiler method to conduct acceptance testing for surface course tolerance according to GDT 126. This testing will be performed only on:
Surface courses on Projects with mainline traveled way measuring a minimum distance of 1 mile (1600 m)
Ramps more than 0.5 mile (800 m) long
Combine partial sections measuring less than 0.5 mile (800 m) with the previous full mile for acceptance.
Achieve the smoothest possible ride during construction. Do not exceed the target Laser Road Profiler smoothness index as shown below:
Table 8— Pavement Smoothness Target Requirements
Construction Description Smoothness Index
All Asphaltic Concrete OGFC and PEM on interstate including resurfacing and 750 new construction. Asphaltic Concrete OGFC and PEM placed on state routes as
new construction.
Asphaltic Concrete SMA or dense-graded surface mixtures placed directly 825 beneath the Asphaltic Concrete OGFC or PEM on interstates. Asphaltic Concrete
OGFC and PEM placed on state routes as resurfacing. All new construction on
state routes with exception of OGFC and PEM as stated above.
All other resurfacing on state routes (excluding LARP, PR, airports, etc.) 900
All Urban new construction and resurfacing on state routes within curb and gutter 1175 sections located in posted 35 miles per hour (MPH) or less speed zones.
If the target values are not achieved, immediately adjust the operations to meet the target values. Placement
operations may be suspended until a remedial plan to comply with target smoothness requirements is submitted and
approved by the Engineer if adjustments do not satisfy target smoothness values.
Table 9— Pavement Smoothness Corrective Work Requirement
Construction Description Smoothness Index
All Asphaltic Concrete OGFC and PEM placed on interstate including resurfacing 825 and new construction. Asphaltic Concrete OGFC and PEM placed on state routes
as new construction.
Asphaltic Concrete SMA or dense-graded surface mixtures placed directly 900 beneath the Asphaltic Concrete OGFC or PEM on interstates. Asphaltic Concrete
OGFC and PEM placed on state routes as resurfacing. All new construction on
state routes with exception of OGFC and PEM as stated above.
All other resurfacing on state routes (excluding LARP, PR, airports, etc.) 1025
All Urban new construction and resurfacing on state routes within curb and gutter 1250

68 | P a g e
Section 400—Hot Mix Asphaltic Concrete Construction
sections located in posted 35 miles per hour (MPH) or less speed zones.
If surface tolerance deficiencies need correction, obtain the Engineer’s approval of the methods and type mix used.
3. Bridge Approach Ride Quality
The following are subject to a ride quality test of roadway approaching each end of a bridge using the Laser Road Profiler, Rainhart Profiler or Lightweight Profiler:
A state road with 4 lanes or more
A 2-lane state road with a current traffic count of 2,000 vpd or more
Locations designated on the Plans
All other bridge approaches not meeting the above criteria shall meet the 1/8 in. in 10 ft (3 mm in 3 m) straightedge
requirement. When the distance between the ends of two bridges is less than 200 ft (60 m), the bridge approaches
will meet the straightedge requirements.
Test ride quality as follows:
For Resurfacing Projects:
a. The Department will determine a profile index value using the laser road profiler in accordance with test method GDT 126.
b. The Department will determine the Half Car Simulation (HCS) IRI for each HMA asphalt 1/10th
of mile (0.16 km) segments adjacent to each bridge joint for each lane. The HCS IRI will be reported in
1/20th
of mile (0.08 km) segment readings in accordance with GDT 126. Keep the Target profile index value under 825 mm/km and correct profile locations exceeding 900
mm/km using the Laser Road Profiler. Correct individual bumps or depression exceeding 1/8 in. in
10 ft (3 mm in 3 m) straightedge requirement as directed by the Engineer.
E. Ensure Resurfacing projects meet the profile index value for the specified 1/10th
mile (0.16 km) segment of roadway up to the bridge joint.
For All New Construction Projects:
a. The Department will determine a profile index value according to test method GDT 78 or GDT 134.
b. The Department will average the profile index value from the right and left wheelpath for each 100 ft (30 m) section for each lane.
Keep the profile index value under 30 in/mile (475 mm/km), correct individual bumps or
depressions exceeding 0.2 in. (5 mm) from blanking band on the profilograph trace.
c. Ensure New Construction projects meet the profile index value for the specified 100 ft (30 m) section of roadway up to the bridge joint.
d. Schedule the ride quality testing on All New Construction projects 5 days before needed by contacting the Office of Materials and Testing. Clean and clear obstructions from the test area.
Correct the sections that do not meet the ride quality criteria of this Specification. After correction, these
sections are subject to retesting with the Lightweight Profiler. The Engineer directs the type of correction
method, which may include:
Milling
Grinding
Removing and replacing the roadway
No additional compensation will be made.
In accordance with Section 106.3.A.3, the Contractor may request reevaluation(s) for Lightweight Profiler Test results
on newly construction bridge projects, Laser Road Profiler Test results on resurfacing bridge projects and straightedge
measurement(s) on either that fail to meet specified requirements. Request for reevaluation shall be made to the
Engineer within 5 working days of notification of failing results. At the Engineer’s approval,

69 | P a g e
Section 400—Hot Mix Asphaltic Concrete Construction
reevaluation of failing results using the Lightweight Profiler Test, Laser Road Profiler Test and straightedge
measurement(s) shall be conducted by representatives from the Office of Materials and Testing in accordance
with GDT 134.
The Department will perform ride quality testing up to two times on the bridge approaches at no cost to the Contractor. Additional testing will be charged to the Contractor in accordance with GDT 134.
4. Surface Smoothness Acceptance
When recommended by the Office of Materials and Testing, a pay reduction may be accepted in lieu of correction for
roadways and bridge approaches that fail to achieve specified smoothness indexes. The Office of Materials and Testing may
recommend a waiver of profile smoothness requirements when improvement over pre-construction smoothness profile
exceeds 25 percent for urban roadways, as defined in Table 9, and 15 percent for bridge approaches. D. Reevaluation of Lots
When lots are reevaluated as shown in Subsection 106.03, “Samples, Tests, Cited Specifications,” sampling and testing
is according to GDT 73. Ensure request for reevaluation are made within 5 working days of notification of the lot
results. The following procedures apply:
1. Mixture Acceptance
The Department will take the same number of new tests on cores taken at the locations where the loads sampled
were placed and will use only those cores results for acceptance. If the location of the sampled loads cannot be
isolated and documented to the approval of the Engineer, the lot will not be re-evaluated and the original test results
will be used for acceptance. The Department will use the absolute average deviations from the job mix formula for
these tests to determine acceptance based on the appropriate column in the Asphalt Cement Content and Aggregate
Gradation of Asphalt Concrete Mixture Acceptance Schedule—Table 10 or 11.
2. Compaction Acceptance
The Department will reevaluate the lot through additional testing by cutting the same number of cores originally
obtained and averaging these results with the results from the original density tests. The Department will use the
average to determine acceptance according to the Compaction Acceptance Schedule in Subsection 400.5.01.C, “Calculate Pavement Mean Air Voids”.

70 | P a g e
Table 10—Mixture Acceptance Schedule—Surface Mixes
Mixture Characteristics Pay Mean of the Deviations from the Job Mix Formula
Factor
1 Test 2 Tests 3 Tests 4 Tests 5 Tests 6 Tests 7 Tests 8 Tests
Asphalt Cement Content 1.00 0.00 - 0.70 0.00 - 0.54 0.00 - 0.46 0.00 - 0.41 0.00 - 0.38 0.00 - 0.35 0.00 - 0.32 0.00 - 0.30
(Extraction, Ignition)
0.95 0.71 - 0.80 0.55 - 0.61 0.47 - 0.52 0.42 - 0.46 0.39 - 0.43 0.36 - 0.39 0.33 - 0.36 0.31 - 0.34
0.90 0.81 - 0.90 0.62 - 0.68 0.53 - 0.58 0.47 - 0.51 0.44 - 0.47 0.40 - 0.45 0.37 - 0.40 0.35 - 0.37
0.80 0.91 - 1.00 0.69 - 0.75 0.59 - 0.64 0.52 - 0.56 0.48 - 0.52 0.44 - 0.47 0.41 - 0.44 0.38 - 0.41
0.70 1.01 - 1.19 0.76 - 0.82 0.65 - 0.69 0.57 - 0.61 0.53 - 0.56 0.48 - 0.51 0.45 - 0.47 0.42 - 0.44
0.50 1.20 - 1.40 0.83 - 0.85 0.70 - 0.72 0.62 - 0.64 0.57 - 0.59 0.52 - 0.55 0.48 - 0.51 0.45 - 0.48
3/8 in. (9.5 mm) Sieve 1.00 0.00 – 9.0 0.00 - 6.6 0.00 - 5.6 0.00 - 5.0 0.00 - 4.6 0.00 - 4.2 0.00 - 3.9 0.00 - 3.6
(12.5 mm OGFC, 12.5 mm
0.98 9.1 - 10.0 6.7 - 7.5 5.7 - 6.3 5.1 - 5.6 4.7 - 5.2 4.3 - 4.7 4.0 - 4.4 3.7 - 4.1
PEM, 12.5 mm Superpave)
0.95 10.1 - 11.9 7.6 - 8.4
6.4 - 7.0 5.7 - 6.3 5.3 - 5.8 4.8 - 5.3
4.5 - 5.0 4.2 - 4.6
0.90 12.0 - 13.0 8.5 - 9.3 7.1 - 7.7 6.4 - 6.9 5.9 - 6.3 5.4 - 5.8 5.1 - 5.4 4.7 - 5.0
0.85 13.1 - 14.0 9.4 - 10.2 7.8 - 8.6 7.0 - 7.6 6.4 - 6.9 5.9 - 6.3 5.5 - 5.9 5.1 - 5.5
0.80 14.1 - 14.5 10.3 - 10.5 8.7 - 8.9 7.7 - 8.0 7.0 - 7.5 6.4 - 6.8 6.0 - 6.4 5.6 - 6.0
3/8 in. (9.5 mm) Sieve 1.00 0.0 - 6.8 0.00 - 5.0 0.00 - 4.2 0.00 - 3.8 0.00 - 3.4 0.00 - 3.2 0.00 - 2.9 0.00 - 2.7
(12.5 mm SMA)
0.98 6.9 - 7.5 5.1 - 5.6 4.3 - 4.7 3.9 - 4.2 3.5 - 3.9 3.3 - 3.5 3.0 - 3.3 2.8 - 3.1
0.95 7.6 - 8.9 5.7 - 6.3 4.8 - 5.2 4.3 - 4.7 4.0 - 4.4 3.6 - 4.0 3.4 - 3.8 3.2 - 3.4
0.90 9.0 - 9.8 6.4 - 7.0 5.3 - 5.8 4.8 - 5.2 4.5 - 4.8 4.1 - 4.4 3.9 - 4.1 3.5 - 3.8
0.85 9.9 - 10.5 7.1 - 7.6 5.9 - 6.4 5.3 - 5.7 4.9 - 5.2 4.5 - 4.7 4.2 - 4.4 3.9 - 4.1
0.80 10.6 - 10.9 7.7 - 7.9 6.5 - 6.7 5.8 - 6.0 5.3 - 5.6 4.8 - 5.1 4.5 - 4.8 4.2 - 4.5
No. 4 (4.75 mm) Sieve 1.00 0.00 - 9.0 0.00 - 6.7 0.00 - 5.7 0.00 - 5.2 0.00 - 4.8 0.00 - 4.4 0.00 - 4.1 0.00 - 3.8
(9.5 mm OGFC, 9.5 mm
0.98 9.1 - 10.0 6.8 - 7.6 5.8 - 6.3 5.3 - 5.8 4.9 - 5.4 4.5 - 4.9 4.2 - 4.6 3.9 - 4.3
Superpave)
0.95 10.1 - 11.9 7.7 - 8.5
6.4 - 6.9 5.9 - 6.4 5.5 - 5.9 5.0 - 5.4
4.7 - 5.0 4.4 - 4.7

71 | P a g e
Section 400—Hot Mix Asphaltic Concrete Construction
Mixture Characteristics Pay Mean of the Deviations from the Job Mix Formula
Factor
1 Test 2 Tests 3 Tests 4 Tests 5 Tests 6 Tests 7 Tests 8 Tests
0.90 12.0 - 13.0 8.6 - 9.4 7.0 - 7.5 6.5 - 7.0 6.0 - 6.5 5.5 - 5.9 5.1 - 5.5 4.8 - 5.1
0.85 13.1 - 14.0 9.5 - 10.2 7.6 - 8.0 7.1 - 7.6 6.6 - 7.0 6.0 - 6.4 5.6 - 5.9 5.2 - 5.5
0.80 14.1 - 14.5 10.3 - 10.5 8.1 - 8.3 7.7 - 8.0 7.1 - 7.5 6.5 - 6.9 6.0 - 6.4 5.6 - 5.9
No. 4 (4.75 mm) Sieve 1.00 0.00 - 6.8 0.00 - 5.0 0.00 - 4.3 0.00 - 3.9 0.00 - 3.6 0.00 - 3.3 0.00 - 3.1 0.00 - 2.8
(9.5 mm SMA)
0.98 6.9 - 7.5 5.1 - 5.7 4.4 - 4.7 4.0 - 4.4 3.7 - 4.0 3.4 - 3.7 3.2 - 3.4 2.9 - 3.2
0.95 7.6 - 8.9 5.8 - 6.4 4.8 - 5.2 4.5 - 4.8 4.1 - 4.4 3.8 - 4.0 3.5 - 3.8 3.3 - 3.5
0.90 9.0 - 9.8 6.5 - 7.0 5.3 - 5.6 4.9 - 5.2 4.5 - 4.9 4.1 - 4.4 3.9 - 4.1 3.6 - 3.8
0.85 9.9 - 10.5 7.1 - 7.7 5.7 - 6.0 5.3 - 5.7 5.0 - 5.2 4.3 - 4.8 4.2 - 4.4 3.9 - 4.1
0.80 10.6 - 10.9 7.8 - 7.9 6.1 - 6.2 5.8 - 6.0 5.3 - 5.6 4.9 - 5.2 4.5 - 4.8 4.2 - 4.4
No. 8 (2.36 mm) Sieve 1.00 0.00 - 7.0 0.00 - 5.6 0.00 - 4.8 0.00 - 4.3 0.00 - 4.0 0.00 - 3.6 0.00 - 3.4 0.00 - 3.2
(OGFC, PEM, Superpave
0.98 7.1 - 8.0 5.7 - 6.3 4.9 - 5.4 4.4 - 4.8 4.1 - 4.5 3.7 - 4.1 3.5 - 3.8 3.3 - 3.6
and 4.75 mm mixes)
0.95 8.1 - 9.0 6.4 - 7.0
5.5 - 6.0 4.9 - 5.3 4.6 - 4.9 4.2 - 4.5
3.9 - 4.2 3.7 - 3.9
0.90 9.1 - 10.9 7.1 - 7.7 6.1 - 6.6 5.4 - 5.8 5.0 - 5.4 4.6 - 4.9 4.3 - 4.6 4.0 - 4.3
0.85 11.0 - 12.0 7.8 - 8.5 6.7 - 7.2 5.9 - 6.4 5.5 - 5.8 5.0 - 5.3 4.7 - 5.0 4.4 - 4.6
0.75 12.1 - 12.5 8.6 - 8.8 7.3 - 7.5 6.5 - 6.8 5.9 - 6.3 5.4 - 5.7 5.1 - 5.3 4.7 - 4.9
No. 8 (2.36 mm) Sieve 1.00 0.00 - 5.3 0.00 - 4.2 0.00 - 3.6 0.00 - 3.2 0.00 - 3.0 0.00 - 2.7 0.00 - 2.6 0.00 - 2.4
(12.5 mm SMA, 9.5 mm
0.98 5.4 - 6.0 4.3 - 4.7 3.7 - 4.0 3.3 - 3.6 3.1 - 3.4 2.8 - 3.1 2.7 - 2.9 2.5 - 2.7
SMA)
0.95 6.1 - 6.8 4.8 - 5.3
4.1 - 4.5 3.7 - 4.0 3.5 - 3.7 3.2 - 3.4
3.0 - 3.2 2.8 - 2.9
0.90 6.9 - 8.2 5.4 - 5.8 4.6 - 5.0 4.1 - 4.5 3.8 - 4.0 3.5 - 3.7 3.3 - 3.5 3.0 - 3.2
0.85 8.3 - 9.0 5.9 - 6.4 5.1 - 5.4 4.6 - 4.8 4.1 - 4.4 3.8 - 4.0 3.6 - 3.8 3.3 - 3.4
0.75 9.1 - 9.4 6.5 - 6.6 5.5 - 5.0 4.9 - 5.1 4.5 - 4.7 4.1 - 4.3 3.9 - 4.0 3.5 - 3.7
No. 8 (2.36 mm) Sieve for OGFC and PEM mixes: When the mean of the deviations from the Job Mix Formula for a particular lot exceeds the tolerance for a 1.00 pay

72 | P a g e
Section 400—Hot Mix Asphaltic Concrete Construction
Mixture Characteristics Pay Mean of the Deviations from the Job Mix Formula
Factor
1 Test 2 Tests 3 Tests 4 Tests 5 Tests 6 Tests 7 Tests 8 Tests
factor in the appropriate column, the lot will be paid for at 0.50 of the Contract Price.

73 | P a g e
Table 11—Mixture Acceptance Schedule—Subsurface Mixes
Mixture Characteristics Pay Mean of the Deviations from the Job Mix Formula
Factor
1 Test 2 Tests 3 Tests 4 Tests 5 Tests 6 Tests 7 Tests 8 Tests
Asphalt Cement Content 1.00 0.00 - 0.80 0.00 - 0.61 0.00 - 0.52 0.00 - 0.46 0.00 - 0.43 0.00 - 0.39 0.00 - 0.36 0.00 - 0.34
(Extraction, Ignition)
0.95 0.81 - 0.90 0.62 - 0.68 0.53 - 0.58 0.47 - 0.51 0.44 - 0.47 0.40 - 0.43 0.37 - 0.40 0.35 - 0.37
0.90 0.91 - 1.00 0.69 - 0.75 0.59 - 0.64 0.52 - 0.56 0.48 - 0.52 0.44 - 0.47 0.41 - 0.44 0.38 - 0.41
0.80 1.01 - 1.19 0.76 - 0.82 0.65 - 0.69 0.57 - 0.61 0.53 - 0.56 0.48 - 0.51 0.45 - 0.47 0.42 - 0.44
0.70 1.20 - 1.40 0.83 - 0.85 0.70 - 0.72 0.62 - 0.64 0.57 - 0.59 0.52 - 0.55 0.48 - 0.51 0.45 - 0.48
0.50 1.41 - 1.60 0.86 - 0.88 0.73 - 0.75 0.65 - 0.67 0.60 - 0.63 0.56 - 0.60 0.52 - 0.56 0.49 - 0.52
1/2 in. (12.5 mm) Sieve 1.00 0.00 - 12.9 0.00 - 8.1 0.00 - 6.9 0.00 - 6.1 0.00 - 5.5 0.00 - 5.0 0.00 - 4.7 0.00 - 4.4
(25 mm Superpave)
0.98 13.0 - 14.0 8.2 - 9.1 7.0 - 7.7 6.2 - 6.8 5.6 - 6.1 5.1 - 5.6 4.8 - 5.2 4.5 - 4.9
0.95 14.1 - 15.0 9.2 - 10.1 7.8 - 8.5 6.9 - 7.5 6.2 - 6.7 5.7 - 6.1 5.3 - 5.7 5.0 - 5.4
0.90 15.1 - 16.0 10.2 - 11.1 8.6 - 9.3 7.6 - 8.2 6.8 - 7.4 6.2 - 6.7 5.8 - 6.3 5.5 - 5.9
0.85 16.1 - 17.0 11.2 - 11.5 9.4 - 9.6 8.3 - 8.6 7.5 - 7.8 6.8 - 7.0 6.4 - 6.5 6.0 - 6.1
0.80 17.1 - 18.0 11.6 - 11.9 9.7 - 9.9 8.7 - 9.0 7.9 - 8.1 7.1 - 7.3 6.6 - 6.8 6.2 - 6.4
1/2 in. (12.5 mm) Sieve 1.00 0.00 - 9.7 0.00 - 6.0 0.00 - 5.2 0.00 - 4.6 0.00 - 4.1 0.00 - 3.8 0.00 - 3.5 0.00 - 3.3
(19 mm SMA)
0.98 9.8 - 10.5 6.2 - 6.8 5.3 - 5.8 4.7 - 5.1 4.2 - 4.6 3.9 - 4.2 3.6 - 3.9 3.4 - 3.7
0.95 10.6 - 11.2 6.9 - 7.8 5.9 - 6.4 5.2 - 5.6 4.7 - 5.0 4.3 - 4.6 4.0 - 4.3 3.8 - 4.0
0.90 11.3 - 12.0 7.9 - 8.3 6.5 - 7.0 5.7 - 6.1 5.1 - 5.6 4.7 - 5.0 4.4 - 4.7 4.1 - 4.4
0.85 12.1 - 12.8 8.4 - 8.6 7.1 - 7.2 6.2 - 6.5 5.7 - 5.9 5.1 - 5.3 4.8 - 4.9 4.5 - 5.6
0.80 12.9 - 13.5 8.7 - 8.9 7.3 - 7.4 6.6 - 6.8 6.0 - 6.1 5.4 - 5.5 5.0 - 5.1 4.7 - 4.8
3/8 in. (9.5 mm) Sieve 1.00 0.00 - 10.0 0.00 - 7.5 0.00 - 6.3 0.00 - 5.6 0.00 - 5.2 0.00 - 4.7 0.00 - 4.4 0.00 - 4.1
(19 mm Superpave, 12.5
0.98 10.1 - 11.9 7.6 - 8.4 6.4 - 7.0 5.7 - 6.3 5.3 - 5.8 4.8 - 5.3 4.5 - 5.0 4.2 - 4.6
mm Superpave)
0.95 12.0 - 13.0 8.5 - 9.3
7.1 - 7.7 6.4 - 6.9 5.9 - 6.3 5.4 - 5.8
5.1 - 5.4 4.7 - 5.0

74 | P a g e
Section 400—Hot Mix Asphaltic Concrete Construction
Mixture Characteristics Pay Mean of the Deviations from the Job Mix Formula
Factor
1 Test 2 Tests 3 Tests 4 Tests 5 Tests 6 Tests 7 Tests 8 Tests
0.90 13.1 - 14.0 9.4 - 10.2 7.8 - 8.6 7.0 - 7.6 6.4 - 6.9 5.9 - 6.3 5.5 - 5.9 5.1 - 5.5
0.85 14.1 - 14.5 10.3 - 10.5 8.7 - 8.9 7.7 - 8.0 7.0 - 7.5 6.4 - 6.8 6.0 - 6.4 5.6 - 6.0
0.80 14.6 - 15.0 10.6 - 10.8 9.0 - 9.2 8.1 - 8.4 7.6 - 7.8 6.9 - 7.3 6.5 - 6.8 6.1 - 6.5
No. 4 (4.75 mm) Sieve 1.00 0.00 - 10.0 0.00 - 7.6 0.00 - 6.3 0.00 - 5.8 0.00 - 5.4 0.00 - 4.9 0.00 - 4.6 0.00 - 4.3
(9.5 mm Superpave)
0.98 10.1 - 11.9 7.7 - 8.5 6.4 - 6.9 5.9 - 6.4 5.5 - 5.9 5.0 - 5.4 4.7 - 5.0 4.4 - 4.7
0.95 12.0 - 13.0 8.6 - 9.4 7.0 - 7.5 6.5 - 7.0 6.0 - 6.5 5.5 - 5.9 5.1 - 5.5 4.8 - 5.1
0.90 13.1 - 14.0 9.5 - 10.2 7.6 - 8.0 7.1 - 7.6 6.6 - 7.0 6.0 - 6.4 5.6 - 5.9 5.2 - 5.5
0.85 14.1 - 14.5 10.3 - 10.5 8.1 - 8.3 7.7 - 8.0 7.1 - 7.5 6.5 - 6.9 6.0 - 6.4 5.6 - 5.9
0.80 14.6 - 15.0 10.6 - 10.8 8.4 - 8.6 8.1 - 8.4 7.6 - 8.0 7.0 - 7.4 6.5 - 6.8 6.0 - 6.3
No. 8 (2.36 mm) Sieve 1.00 0.00 - 8.0 0.00 - 6.3 0.00 - 5.4 0.00 - 4.8 0.00 - 4.5 0.00 - 4.1 0.00 - 3.8 0.00 - 3.6
(All mixes except SMA)
0.98 8.1 - 9.0 6.4 - 7.0 5.5 - 6.0 4.9 - 5.3 4.6 - 4.9 4.2 - 4.5 3.9 - 4.2 3.7 - 3.9
0.95 9.1 - 10.0 7.1 - 7.7 6.1 - 6.6 5.4 - 5.8 5.0 - 5.4 4.6 - 4.9 4.3 - 4.6 4.0 - 4.3
0.90 10.1 - 11.9 7.8 - 8.5 6.7 - 7.2 5.9 - 6.4 5.5 - 5.8 5.0 - 5.3 4.7 - 5.0 4.4 - 4.6
0.85 12.0 - 13.0 8.6 - 8.8 7.3 - 7.5 6.5 - 6.8 5.9 - 6.3 5.4 - 5.7 5.1 - 5.3 4.7 - 4.9
0.75 13.1 - 14.0 8.9 - 9.1 7.6 - 7.8 6.9 - 7.2 6.4 - 6.6 5.8 - 6.1 5.4 - 5.7 5.0 - 5.3
No. 8 (2.36 mm) Sieve 1.00 0.00 - 6.0 0.00 - 4.7 0.00 - 4.1 0.00 - 3.6 0.00 - 3.4 0.00 - 3.1 0.00 - 2.9 0.00 - 2.4
(19 mm SMA)
0.98 6.1 - 6.8 4.8 - 5.2 4.2 - 4.5 3.7 - 4.0 3.5 - 3.7 3.2 - 3.4 3.0 - 3.2 2.8 - 2.9
0.95 6.9 - 7.5 5.3 - 5.8 4.6 - 5.0 4.1 - 4.4 3.8 - 4.0 3.5 - 3.7 3.3 - 3.5 3.0 - 3.2
0.90 7.6 - 8.9 5.9 - 6.4 5.1 - 5.4 4.5 - 4.8 4.1 - 4.4 3.8 - 4.0 3.6 - 3.8 3.3 - 3.5
0.85 9.0 - 9.8 6.5 - 6.6 5.5 - 5.6 4.9 - 5.1 4.5 - 4.7 4.1 - 4.3 3.9 - 4.0 3.6 - 3.7
0.75 9.9 - 10.5 6.7 - 6.8 5.7 - 5.9 5.2 - 5.4 4.8 - 5.0 4.4 - 4.6 4.1 - 4.3 3.8 - 4..0

75 | P a g e
E. Segregated Mixture
Prevent mixture placement yielding a segregated mat by following
production, storage, loading, placing, and handling procedures.
Ensure needed plant modifications and provide necessary auxiliary
equipment. (See Subsection 400.1.01, “Definitions.”)
If the mixture is segregated in the finished mat, the Department will take actions based on the degree of segregation. The actions are described below.
A. Unquestionably Unacceptable Segregation
When the Engineer determines the segregation in the finished mat is unquestionably unacceptable, follow these measures:
Suspend Work and require the Contractor to take
positive corrective action. The Department will evaluate the segregated areas to determine the extent of the corrective work to the in-place mat as follows:
Perform extraction and gradation
analysis by taking 6 in (150 mm) cores from typical, visually unacceptable segregated areas.
Determine the corrective work according to
Subsection 400.3.06.E.3.
Require the Contractor to submit a written plan of measures and actions to prevent further segregation. Work will not continue until the plan is submitted to and approved by the Department.
When work resumes, place a test section not to
exceed 500 tons (500 Mg) of the affected mixture
for the Department to evaluate. If a few loads show
that corrective actions were not adequate, follow the
measures above beginning with step 1.a. above. If
the problem is solved, Work may continue.
B. Unacceptable Segregation Suspected
When the Engineer observes segregation in the finished mat and and the work may be unacceptable, follow these measures:
Allow work to continue at Contractor’s risk.
d. Require Contractor to immediately and continually
adjust operation until the visually apparent
segregated areas are eliminated from the finished
mat. The Department will immediately investigate
to determine the severity of the apparent
segregation as follows:
Take 6 in (150 mm) cores from typical areas of
suspect segregation.
Test the cores for compliance with the mixture
control tolerances in Section 828.
When these tolerances are exceeded, suspend work for
corrective action as outlined in Subsection 400.3.06.E.3.

76 | P a g e
4. Corrective Work
a. Remove and replace (at the Contractor’s expense) any
segregated area where the gradation on the control sieves
is found to vary 10 percent or more from the approved
job mix formula, the asphalt cement varies 1.0% or more
from the approved job mix formula, or if in-place air
voids exceed 13.5% based on GDT 39. The control sieves for each mix type are shown in Subsection 400.5.01.B “Determine Lot Acceptance.”
b. Subsurface mixes. For subsurface mixes, limit removal
and replacement to the full lane width and no less than 10 ft. (3 m) long and as approved by the Engineer.
e. Surface Mixes. For surface mixes, ensure that
removal and replacement is not less than the full width of the affected lane and no less than the length of the affected areas as determined by the Engineer.
Surface tolerance requirements apply to the corrected
areas for both subsurface and surface mixes. Section 400—Hot Mix Asphaltic Concrete Construction
400.3.07 Contractor Warranty and Maintenance A. Contractor’s Record
Maintain a dated, written record of the most recent plant calibration. Keep this record available for the Engineer’s inspection at all times. Maintain records in the form of:
Graphs
Tables
Charts
Mechanically prepared data
400.4 Measurement Thickness and spread rate tolerances for the various mixtures are specified in Subsection 400.4.A.2.b, Table 112, Thickness and Spread Rate Tolerance at Any Given Location. These tolerances are applied as outlined below: A. Hot Mix Asphaltic Concrete Paid for by Weight
1. Plans Designate a Spread Rate
a. Thickness Determinations. Thickness determinations are not required when the Plans designate a spread rate per square yard (meter).
If the spread rate exceeds the upper limits outlined in the Subsection 400.4.A.2.b, Table 12, “Thickness and Spread Rate Tolerance at Any Given Location”, the mix in excess will not be paid for.
If the rate of spread is less than the lower limit, correct the deficient course by overlaying the entire lot.
The mixture used for correcting deficient areas is paid for at the Contract Unit Price of the course being corrected and is subject to the Mixture Acceptance Schedule—Table 10 or 11.
c. Recalculate the Total Spread Rate. After the deficient hot mix course has been corrected, the total spread
rate for that lot is recalculated, and mix in excess of the upper tolerance limit as outlined in the Subsection
400.4.A.2.b, Table 12, “Thickness and Spread Rate Tolerance at Any Given Location” is not paid for.

77 | P a g e
The quantity of material placed on irregular areas such as driveways, turnouts, intersections, feather edge section, etc., is deducted from the final spread determination for each lot.
2. Plans Designate Thickness
If the average thickness exceeds the tolerances specified in the Subsection 400.4.A.2.b, Table 112, “Thickness
and Spread Rate Tolerance at Any Given Location”, the Engineer shall take cores to determine the area of excess
thickness. Excess quantity will not be paid for.
If the average thickness is deficient by more than the tolerances specified in the Thickness and Spread Rate
Tolerance at Any Given Location table below, the Engineer shall take additional cores to determine the area
of deficient thickness. Correct areas with thickness deficiencies as follows:
a. Overlay the deficient area with the same mixture type being corrected or with an approved surface mixture. The overlay shall extend for a minimum of 300 ft (90 m) for the full width of the course.
b. Ensure that the corrected surface course complies with Subsection 400.3.06.C.1, “Visual and Straightedge
Inspection.” The mixture required to correct a deficient area is paid for at the Contract Unit Price of the
course being corrected.
The mixture is subject to the Mixture Acceptance Schedule—Table 910 or 11 . The quantity of the additional
mixture shall not exceed the required calculated quantity used to increase the average thickness of the
overlaid section to the maximum tolerance allowed under the following table.

78 | P a g e
Section 400—Hot Mix Asphaltic Concrete Construction
Table 12—Thickness and Spread Rate Tolerance at Any Given Location
Course Thickness Specified Spread Rate Specified
Asphaltic concrete base course ± 0.5 in (±13 mm) +40 lbs, -50 lbs (+20 kg, -30 kg)
Intermediate and/or wearing course ± 0.25 in (± 6 mm) +20 lbs, -25 lbs (+10 kg, -15 kg)
Overall of any combination of 1 and 2 ± 0.5 in (±13 mm) +40 lbs, -50 lbs (+20 kg, -30 kg)
Note 1: For asphaltic concrete 9.5 mm OGFC and 12.5 mm OGFC, control the spread rate per lot within
5 lbs/yd2 (3 kg/m
2) of the designated spread rate. For asphaltic concrete 12.5 mm PEM, control the
spread rate per lot within 10 lbs/yd2 (6 kg/m
2) of the designated spread rate.
Note 2: Thickness and spread rate tolerances are provided to allow normal variations within a
given lot. Do not continuously operate at a thickness of spread rate not specified.
When the Plans specify a thickness, the Engineer may take as many cores as necessary to determine the average
thickness of the intermediate or surface course. The Engineer shall take a minimum of one core per 1,000 ft (300 m)
per two lanes of roadway. Thickness will be determined by average measurements of each core according to GDT 42.
If the average exceeds the tolerances specified in the Subsection 400.4.A.2.b, Table 112, “Thickness and Spread Rate
Tolerance at Any Given Location”, additional cores will be taken to determine the area of excess thickness and excess
tonnage will not be paid for. B. Hot Mix Asphaltic Concrete Paid for by Square Yard (Meter)
1. The thickness of the base course or the intermediate or surface course will be determined by the Department by cutting cores and the thickness will be determined by averaging the measurements of each core.
2. If any measurement is deficient in thickness more than the tolerances given in the table above, additional cores
will be taken by the Department to determine the area of thickness deficiency. Correct thickness deficiency areas
as follows:
a. Overlay the deficient area with the same type mixtures being corrected or with surface mixture. Extend the overlay at least 300 ft (90 m) for the full width of the course.
b. Ensure the corrected surface course complies with Subsection 400.3.06.C.1, Visual and Straightedge
Inspection” .
c. The mixture is subject to the Mixture Acceptance Schedule—Table 10or 11.
3. No extra payment is made for mixtures used for correction.
4. No extra payment is made for thickness in excess of that specified.
NOTE: Thickness tolerances are provided to allow normal variations within a given lot. Do not continuously operate at a thickness not specified.
C. Asphaltic Concrete
Hot mix asphaltic concrete, complete in place and accepted, is measured in tons (megagrams) or square yards (meters)
as indicated in the Proposal. If payment is by the ton (megagram), the actual weight is determined by weighing each

79 | P a g e
Section 400—Hot Mix Asphaltic Concrete Construction
loaded vehicle on the required motor truck scale as the material is hauled to the roadway, or by using recorded weights if a digital recording device is used.
The weight measured includes all materials. No deductions are made for the weight of the individual ingredients. The
actual weight is the pay weight except when the aggregates used have a combined bulk specific gravity greater than
2.75. In this case the pay weight is determined according to the following formula:
% Aggregate x 2.75
T1 = T x % AC + + % Y
combined bulk Specific Gravity
100
Where:
T1 Pay weight, tonnage (Mg)
T= Actual weight
% AC= Percent asphalt cement by weight of total mixture
% Aggregate = Percent aggregate by weight of total mixture
Combined Bulk Sp. Gr.= Calculated combined bulk specific gravity of various mineral aggregates used in the
mixture
% Y= Percent hydrated lime by weight of mineral aggregate
D. Bituminous Material
Bituminous material is not measured for separate payment. E. Hydrated Lime
When hydrated lime is used as an anti-stripping additive, it is not measured for separate payment. F. Field Laboratory
The field laboratory required in this Specification is not measured for separate payment. G. Asphaltic Concrete Leveling
Payment of hot mix asphaltic concrete leveling, regardless of the type mix, is full compensation for furnishing
materials, bituminous materials, and hydrated lime (when required) for patching and repair of minor defects, surface
preparation, cleaning, hauling, mixing, spreading, and rolling.
Mixture for leveling courses is subject to the acceptance schedule as stated in Subsection 400.3.06.A and Subsection 400.3.06.B.
H. Asphaltic Concrete Patching
Hot mix asphaltic concrete patching, regardless of the type mix, is paid for at the Contract Unit Price per ton (Megagram), complete in place and accepted. Payment is full compensation for:
Furnishing materials such as bituminous material and hydrated lime (when required)

80 | P a g e
Section 400—Hot Mix Asphaltic Concrete Construction
Preparing surface to be patched
Cutting areas to be patched, trimmed, and cleaned
Hauling, mixing, placing, and compacting the materials
400.4.2 Limits When the asphaltic concrete is paid for by the square yard (meter) and multiple lifts are used, the number and thickness of the lifts are subject to the Engineer’s approval and are used to prorate the pay factor for the affected roadway section. 400.5 Payment When materials or construction are not within the tolerances in this Specification, the Contract Price will be adjusted
according to Subsection 106.03, “Samples, Tests, Cited Specifications” and Subsection 400.3.06, “Quality Acceptance.” Hot mix asphaltic concrete of the various types are paid for at the Contract Unit Price per ton (megagram) or per square yard
(meter). Payment is full compensation for furnishing and placing materials including asphalt cement, hydrated lime when
required, approved additives, and for cleaning and repairing, preparing surfaces, hauling, mixing, spreading, rolling, and
performing other operations to complete the Contract Item. Payment will be made under:
Item No. 400 Asphaltic concrete type Superpave, group-blend, Including polymer-modified Per ton (megagram) bituminous materials and hydrated lime
Item No. 400 Asphaltic concrete type, Superpave, group-blend, including bituminous Per ton (megagram) materials and hydrated lime
Item No. 400 Asphaltic concrete type Superpave, group-blend, Including bituminous Per ton (megagram) materials, Gilsonite modifier, and hydrated lime
Item No. 400 _______ inches asphaltic concrete, type Superpave, group-blend including Per square yard (meter) bituminous materials, Gilsonite modifier and hydrated lime
Item No. 400 Asphaltic concrete type Stone Matrix Asphalt, group-blend, including polymer- Per ton (megagram) modified bituminous materials and hydrated lime
Item No. 400 Asphaltic concrete type OGFC, group 2 only, including bituminous materials Per ton (megagram) and hydrated lime
Item No. 400 Asphaltic concrete type OGFC, group 2 only, including polymer-modified Per ton (megagram) bituminous materials and hydrated lime
Item No. 400 Asphaltic concrete type Porous European Mix, group 2 only, including Per ton (megagram) polymer-modified bituminous materials and hydrated lime
400.5.01 Adjustments A. Materials Produced and Placed During the Adjustment Period
An adjustment period is allowed at the start of mixing operations for each type of mix placed on the Contract. Asphaltic
Concrete OGFC or PEM shall be granted an adjustment period for the first 500 tons (500 Mg) produced for the
Contract. A new adjustment period shall not be granted for a change of producer, mix design or asphalt plant
location. The adjustment period is provided to adjust or correct the mix and to establish the construction procedures
and sequence of operations.

81 | P a g e
Section 400—Hot Mix Asphaltic Concrete Construction
The adjustment period consists of the tons (megagrams) of the affected mix produced and placed on the first day of
operation. If this quantity is less than 500 tons (500 Mg), the Engineer may combine the tons (megagrams) produced
and placed on the first day of operation with the tons (megagrams) produced and placed on the next production day of
the affected mix for the adjustment period.
The material produced and placed during the mixture adjustment period is one lot. If the mix is adjusted during this period, a new lot may be necessary, but a new adjustment period will not be permitted.
This material shall be paid for at 100 percent of the Contract Unit Price provided it meets the minimum requirements
for a 1.00 pay factor for asphalt cement content and a 0.90 pay factor for gradation in the Mixture Acceptance
Schedule— Table 10 or 11 .
If the material placed during the adjustment period fails to meet the above requirements, it will be paid for using the
applicable acceptance schedule. However, when mixture used for leveling at a spread rate of 90 lbs/yd² (50 kg/m²) or
less is also used for the surface mix at a spread rate greater than 90 lbs/yd² (50 kg/m²), an additional adjustment
period will be allowed for compaction only. This material will be paid for at a 1.00 pay factor provided it:
Meets the minimum requirements for a 1.00 pay factor in the Mixture Acceptance Schedule—Table 10 or 11 for both asphalt content and gradation.
Meets the minimum requirements for a 0.90 pay factor in Table 13 of Subsection 400.5.01C, “Calculate
Mean Pavement Air Voids.
Mixture which does not meet these requirements shall be paid for using the applicable acceptance schedule. B. Determine Lot Acceptance
Pay factor adjustments are based on control sieves and asphalt cement content. The control sieves used in the mixture acceptance schedule for the various types of mix are indicated below:
Control Sieves Used in the Mixture Acceptance Schedule
Asphaltic concrete 25 mm Superpave 1/2 in., No. 8 (12.5 mm, 2.36 mm) sieves and asphalt cement
Asphaltic concrete 19 mm SMA 1/2 in., No. 8 (12.5 mm, 2.36 mm) sieves and asphalt cement
Asphaltic concrete 19 mm Superpave 3/8 in., No. 8 (9.5 mm, 2.36 mm) sieves and asphalt cement
Asphaltic concrete 12.5 mm Superpave 3/8 in., No. 8 (9.5 mm, 2.36 mm) sieves and asphalt cement
Asphaltic concrete 12.5 mm SMA 3/8 in., No. 8 (9.5 mm, 2.36 mm) sieves and asphalt cement
Asphaltic concrete 12.5 mm PEM 3/8 in., No. 8 (9.5 mm, 2.36 mm) sieves and asphalt cement
Asphaltic concrete 12.5 mm OGFC 3/8 in., No. 8 (9.5 mm, 2.36 mm) sieves and asphalt cement
Asphaltic concrete 9.5 mm Superpave No. 4, No. 8 (4.75 mm, 2.36 mm) sieves and asphalt cement
Asphaltic concrete 9.5 mm SMA No. 4, No. 8 (4.75 mm, 2.36 mm) sieves and asphalt cement
Asphaltic concrete 9.5 mm OGFC No. 4, No. 8 (4.75 mm, 2.36 mm) sieves and asphalt cement
Asphaltic concrete 4.75 mm Mix No. 8 (2.36 mm) sieve and asphalt cement
For projects which do not have milling quantities established as a Pay Item, the Department will pay for 12.5 mm
OGFC and PEM placed on ramps and end of project transitions under the appropriate mixture pay item, but the mix
shall be subject to the same gradation and control sieve requirements as asphaltic concrete 9.5 mm OGFC. Add
polymer-modified bituminous material, hydrated lime, and stabilizing fiber to this mix.
The Department will perform the following tasks:

82 | P a g e
Section 400—Hot Mix Asphaltic Concrete Construction
1. Using the Mixture Acceptance Schedule—Table 10 or 11, determine the mean of the deviations from the job
mix formula per test results per lot.
2. Determine this mean by averaging the actual numeric value of the individual deviations from the job mix formula; disregard whether the deviations are positive or negative amounts.
3. Use the Asphalt Cement Content and Aggregate Gradation of Asphalt Concrete Mixture Acceptance Schedule—
Table10 to determine acceptance of surface mixes and the Mixture Acceptance Schedule—Table 11 to determine
acceptance of subsurface mixes.
On Contracts involving 1,000 tons (1000 Mg) or less of asphaltic concrete, the mixture is accepted for 100 percent payment of the asphaltic concrete Unit Price provided it meets the following:
1. Minimum requirements for a 1.00 pay factor for asphalt cement content and a 0.90 pay factor for gradation in
the applicable Mixture Acceptance Schedule—Table 10 or 11.
2. Minimum requirements for a 0.90 pay factor in Table 13 of Subsection 400.5.01C, “Calculate Pavement Mean Air Voids.
If the material placed on Contracts involving 1,000 tons (1000 Mg) or less of asphaltic concrete does not meet the above requirements, the material will be paid for using the applicable acceptance schedule.
C. Calculate Pavement Mean Air Voids
The Department will determine the percent of maximum air voids for each lot by dividing the pavement mean air voids by the maximum pavement mean air voids acceptable.
The Department will determine the payment for each lot by multiplying the Contract Unit Price by the adjusted pay factor shown in the following Air Voids Acceptance schedule:
Table 13 - Air Voids Acceptance Schedule
Pay Factor Percent of Maximum Air Voids (Lot Average of Percent of Maximum Air Voids (Lot Tests) Average all Tests) (for Reevaluations)
1.00 100 100
0.97 100.1 — 105 100.1 — 104
0.95 105.1 — 112 104.1— 109
0.90 112.1 — 124 109.1 — 118
0.80 124.1 — 149 118.1 — 136
0.70 149.1 —172 136.1 — 153
0.50 172.1 — 191 153.1 — 166
When recommended by the Office of Materials and Testing, Lots receiving less than 0.5 pay factor shall be removed and replaced at the Contractor’s expense.
When the range tolerance is exceeded, the Department will apply a pay factor of 0.95 as described in Subsection 400.3.06.B.2.
D. Asphaltic Concrete For Temporary Detours
Hot mix asphaltic concrete placed on temporary detours not to remain in place as part of the permanent pavement does
not require hydrated lime. Hot mix used for this purpose is paid for at an adjusted Contract Price. Ensure the payment for
this item covers all cost of construction, maintenance and removal of all temporary mix. Ensure hot mix asphaltic
concrete placed as temporary mix meets requirements established in Subsection 400.3.05.F.

83 | P a g e
GDT 7
A. Scope For a complete list of GDTs, see the Table of Contents.
Use this test method to determine the relation between moisture content and the theoretical or laboratory maximum dry density. Measure the density in a 1/30 ft³ (0.000943, ± 0.000008 m³) mold compacted by a 5.5 lb (2.5 kg) rammer.
B. Apparatus The apparatus consists of the following:
Mold: Use a cylindrical metal mold with an approximate 4 in (101.6, ± 0.408 mm) diameter, 4.6 in (116.43, ±
0.1270 mm) high, and a volume of 1/30 ft³ (0.000943, ± 0.000008 m³). The mold is fitted with a detachable base plate and a removable extension approximately 2.5 in (63 mm) high (WM-05) (see Figure 7-1).
This volume to be 1/30 cubic ft., 4.59 ” (1.060 mm³, 116 mm)
Rammer: Use a metal rammer with a 2 in (50.8, ± 0.127 mm) diameter, flat circular face, and weighing 5.5 lbs
(2.49 kg). The rammer must be equipped with a suitable arrangement to control the height of drop to a free fall of 12 in (304.8, ± 1.524 mm) above the soil (WR-1).
Scales and Balances: Use a scale of 20 kg capacity sensitive to and graduated in 0.1g, and a 500 g capacity
balance sensitive to 0.1g.
Drying Device: Use a stove or oven capable of rapidly drying the moisture determination samples (WS-12).
Straightedge: Use a steel straightedge 12 in (300 mm) long (WS-13-1).
Pans or Dishes: Use pie pans or evaporating dishes suitable for drying soil samples (WP-01 or WD-3).
Sieve: Use a No. 10 (2.00 mm) sieve that conforms to the “Standard Specifications for Sieves for Testing Purposes,” AASHTO M 92 (WS-08-#010).
Graduated Cylinder: Use a glass or plastic (WC-5-100) 3.4 oz (100 ml) graduated cylinder used to measure
the mixing water (Bit-04-100).
Mallet: Use a wooden mallet or rubber-covered pestle of suitable size (OH-06).
Cup: Use an 8 oz (237 ml), seamless tin cup (OC-11) for moisture-constant samples.
Extruder (optional): Use a cylindrical piston slightly less than 4 in (100 mm) diameter or similar device for removing compacted specimens from mold.
J. Sample Size and Preparation 1. Break all the soil aggregations without reducing the natural size of individual particles.
2. Select a representative test sample (about 10 lbs (5 kg)) by quartering or by using a sampler.
3. Dry the sample only enough to sift over a No. 10 (2.00 mm) sieve. Do not sift yet.
4. Weigh the sifted sample and record the weight as the weight of the total sample.
5. Split the sample into two portions with the No. 10 (2.00 mm) sieve.
6. Grind the fraction retained on the No. 10 (2.00 mm) sieve with a rubber-covered pestle or wooden mallet until
the aggregations of soil particles are broken up into separate grains.
7. Separate the ground soil into two fractions again with the No. 10 (2.00 mm) sieve.
8. Weigh the fraction retained on the No. 10 (2.00 mm) sieve after the second sieving.
9. Record the weight as the weight of material retained on the No. 10 (2.00 mm) sieve.
K. Procedures 1. Thoroughly mix both fractions that passed the No. 10 (2.00 mm) sieve in both sieving operations.
2. Take a 6.6 lb (3000 g) sample from the minus No. 10 (2.00 mm) material by quartering or by using a sampler.
3. Attach the extension to the cylinder.
4. Compact the sample in the cylinder in three equal layers.

84 | P a ge
GDT 7
1. Compact each layer with 25 blows from the rammer dropped from 1 ft (304.8 mm) above the soil.
2. Rest the mold on a uniform, rigid foundation, such as a concrete block weighing at least 200 lbs (90 kg).
3. Uniformly distribute the blows over the surface of the compacted layer.
4. Remove the soil that adheres to the face of the rammer after every 25th blow.
b. After compacting, remove the extension and base plate.
c. Carefully level the compacted soil to the top and bottom of the cylinder with the straightedge.
d. Weigh the cylinder and sample together.
e. Calculate the wet weight of the compacted soil in pounds per cubic foot (kilograms per cubic meter) as follows:
English—Wet Weight of Compacted Soil (lb/ft3) = Ws - Wc x 30
454 g/lb
metric—Wet Weight of Compacted Soil (kg/m3) = Ws - Wc
0.0009438 x 1000 where:
Ws = weight of the compacted soil and cylinder, in
grams Wc = weight of the cylinder, in grams
If you weighed in grams, calculate the wet weight as grams per cubic foot and divide the total by 454 g/lb. This will give you the wet weight in pounds per cubic foot.
B Remove the compacted soil from the cylinder and slice it vertically through its center.
C Take a 100 g sample from the center and weigh it immediately.
D Dry the sample to a constant weight.
E Calculate the moisture content of the soil as follows:
Moisture (%) = A - B x 100
B where:
A = weight of the wet soil
B = weight of the dry soil Thoroughly pulverize the remaining material from the compacted sample.
Add enough water to increase the moisture content of the soil in predetermined increments (1 percent to 2 percent
for sandy soils, 2 percent to 3 percent for clay soils).
For a 5.94 lb (2.7 kg) sample, add 0.9 oz (27 ml) of water to increase the moisture content by 1 percent.
For a 6.6 lb (3000 g) sample, add 1 oz (30 ml) of water.
Repeat steps 1 through 13 again, taking a moisture sample after each determination.
Repeat the procedure until the soil becomes very wet and the wet weight of the compacted soil substantially decreases.
C. Calculations
Calculate the density (dry weight), in pounds per cubic foot (kilograms per cubic meter), of the compacted soil as follows: English—Dry Density (lb/ft
3) = Ww x 100
M + 100

85 | P a g e
metric— Dry Density (kg/m3)
= Ww x 100 M + 100
where:

86 | P a ge
GDT 7
Ww = wet weight of the compacted soil, in pounds per cubic foot (kilograms per cubic meter) ( Procedures, step D.8) M = moisture content, in percent, at which the wet weight was determined (Procedures, step D.12)
Moisture-Density Relationship
Calculate and record the percent moisture and density for each determination in the series.
When using the moisture-density relationship for compaction control:
Plot a moisture-density curve by plotting the densities against their respective moisture contents.
Draw a smooth curve through the resulting points.
The peak of the curve represents the maximum dry density of the material being tested, and the moisture content at this point represents the optimum moisture content.
For classification purposes, interpret the maximum dry density as the highest density obtained in the test
series, and the optimum moisture as the moisture content at that respective density.
Correction for Plus No. 10 (2.00 mm) Material
If the soil contains material retained on the No. 10 (2.00 mm) sieve and the specifications show density requirements on the total sample, you must correct the maximum dry density to reflect the percentage of Plus No. 10 (2.00 mm) material.
When determining maximum densities for compaction control, always correct the densities for the percentage
of Plus No. 10 (2.00 mm) material.
Use the conversion factors for correcting the density in Tables 1D - 7D, below.
Use the conversion factors for correcting the moisture of Minus No. 10 (2.00 mm) for the Plus No. 10 (2.00 mm) 1n Tables 1M - 10M, below.
D Report
5. Record the maximum dry density and the optimum moisture content of the material being tested as the theoretical or laboratory maximum dry density on Form 495.
6. Send the completed original form to the Office of Materials and Research in Forest Park.
7. Send copies of the form to the Branch Lab and the Area Engineer.
8. Notify the department head of any material that fails.

87 | P a ge
GDT 7

88 | P a g e
GDT 7
% Plus No. 10 Material by Weight in Total Sample
-10 1 2 3 4 5 6 7
Density
130 130.1 130.2 130.3 130.4 130.5 130.6 130.7
129 129.1 129.2 129.3 129.4 129.5 129.6 129.7
128 128.1 128.2 128.3 128.5 128.6 128.7 128.8
127 127.1 127.3 127.4 127.5 127.6 127.8 127.9
126 126.1 126.3 126.4 126.5 126.7 126.8 126.9
125 125.1 125.3 125.4 125.6 125.7 125.9 126.0
124 124.2 124.3 124.5 124.6 124.8 124.9 125.1
123 123.2 123.3 123.5 123.6 123.8 124.0 124.1
122 122.2 122.3 122.5 122.7 122.9 123.0 123.2
121 121.2 121.4 121.5 121.7 121.9 122.1 122.2
120 120.2 120.4 120.6 120.7 120.9 121.1 121.3
119 119.2 119.4 119.6 119.8 120.0 120.2 120.4
118 118.2 118.4 118.6 118.8 119.0 119.2 119.4
117 117.2 117.4 117.6 117.9 118.1 118.3 118.5
116 116.2 116.4 116.7 116.9 117.1 117.3 117.6
115 115.2 115.5 115.7 115.9 116.2 116.4 116.6
114 114.2 114.5 114.7 115.0 115.2 115.4 115.7
113 113.3 113.5 113.8 114.0 114.3 114.5 114.8
112 112.3 112.5 112.8 113.0 113.3 113.6 113.8
111 111.3 111.5 111.8 112.1 112.3 112.6 112.9
110 110.3 110.6 110.8 111.1 111.4 111.7 111.9
109 109.3 109.6 109.9 110.1 110.4 110.7 111.0
108 108.3 108.6 108.9 109.2 109.5 119.8 110.1
107 107.3 107.6 107.9 108.2 108.5 108.8 109.1
106 106.3 106.6 106.9 107.3 107.6 107.9 108.2
105 105.3 105.6 106.0 106.3 106.6 106.9 107.3
104 104.3 104.7 105.0 105.3 105.7 106.0 106.3
103 103.3 103.7 104.0 104.4 104.7 105.0 105.4
102 102.3 102.7 103.0 103.4 103.7 104.1 104.4
101 101.4 101.7 102.1 102.4 102.8 103.1 103.5
100 100.4 100.7 101.1 101.5 101.8 102.2 102.6
99 99.4 99.8 100.1 100.5 100.9 101.3 101.6
98 98.4 98.8 99.2 99.5 99.9 100.3 100.7
97 97.4 97.8 98.2 98.6 99.0 99.4 99.8
96 96.4 96.8 97.2 97.6 98.0 98.4 98.8
95 95.4 95.8 96.2 96.6 97.1 97.5 97.9
94 94.4 94.8 95.3 95.7 96.1 96.5 96.9
93 93.4 93.9 94.3 94.7 95.1 95.6 96.0
92 92.4 92.9 93.3 93.8 94.2 94.6 95.1
91 91.4 91.9 92.3 92.8 93.2 93.7 94.1
90 90.5 90.9 91.4 91.8 92.3 92.7 93.2
89 89.5 89.9 90.4 90.9 91.3 91.8 92.3
88 88.5 88.9 89.4 89.9 90.4 90.8 91.3
87 87.5 88.0 88.4 88.9 89.4 89.9 90.4
86 86.5 87.0 87.5 88.0 88.5 89.0 89.4
85 85.5 86.0 86.5 87.0 87.5 88.0 88.5
84 84.5 85.0 85.5 86.0 86.6 87.1 87.6
83 83.5 84.0 84.6 85.1 85.6 86.1 86.6
82 82.5 83.1 86.3 84.1 84.6 85.2 85.7
81 81.5 82.1 82.6 83.1 83.7 84.2 84.8

89 | P a g e
TABLE 2D—CORRECTION OF MINUS NO. 10 DENSITY FOR % PLUS NO. 10 IN TOTAL SAMPLE
% Plus No. 10 Material by Weight in Total Sample
-10 Density 8 9 10 11 12 13 14
130 130.8 130.9 131.0 131.1 131.2 131.3 131.4 129 129.8 130.0 130.1 130.2 130.3 130.4 130.5
128 128.9 129.0 129.2 129.3 129.4 129.5 129.6
127 128.0 128.1 128.3 128.4 128.5 128.6 128.8
126 127.1 127.2 127.3 127.5 127.6 127.7 127.9
125 126.1 126.3 126.3 126.4 126.6 126.9 127.0
124 125.2 125.4 125.5 125.7 125.8 126.0 126.1
123 124.3 124.4 124.6 124.8 124.9 125.1 125.3
122 123.4 123.5 123.7 123.9 124.0 124.2 124.4
121 122.4 122.6 122.8 123.0 123.1 123.3 123.5
120 121.5 121.7 121.9 122.1 122.2 122.4 122.6
119 120.6 120.8 121.0 121.2 121.4 121.5 121.7
118 119.6 119.8 120.1 120.3 120.5 120.7 120.9
117 118.7 118.9 119.1 119.4 119.6 119.8 120.0
116 117.8 118.0 118.2 118.5 118.7 118.9 119.1
115 116.9 117.1 117.3 117.6 117.8 118.0 118.2
114 115.9 116.2 116.4 116.7 116.9 117.1 117.4
113 115.0 115.3 115.5 115.8 116.0 116.3 116.5
112 114.1 114.3 114.6 114.8 115.1 115.4 115.6
111 113.1 113.4 113.7 113.9 114.2 114.5 114.8
110 112.2 112.5 112.8 113.0 113.3 113.6 113.9
109 111.3 111.6 111.9 112.1 112.4 112.7 113.0
108 110.4 110.7 111.0 111.2 111.5 111.8 112.1
107 109.4 109.7 110.0 110.3 110.6 111.0 111.3
106 108.5 1.8.8 109.1 109.4 409.8 110.1 110.4
105 107.6 107.9 108.2 108.5 108.9 109.2 109.5
104 106.6 107.0 107.3 107.6 108.0 108.3 108.6
103 105.7 106.1 106.4 106.7 107.1 107.4 107.8
102 104.8 105.1 105.5 105.8 106.2 106.5 106.9
101 103.9 104.2 104.6 104.9 105.3 105.7 106.0
100 102.9 103.3 103.7 104.0 104.4 104.8 105.1
99 102.0 102.4 102.8 103.1 103.5 103.9 104.3
98 101.1 101.5 101.9 102.2 102.6 103.0 103.4
97 100.2 100.5 100.9 101.3 101.7 102.1 102.5
96 99.2 99.6 100.0 100.4 100.8 101.2 101.6
95 98.3 98.7 99.1 99.5 99.9 100.3 100.8
94 97.4 97.8 98.2 98.6 99.0 99.5 99.9
93 96.4 96.9 97.3 97.7 98.1 98.6 99.0
92 95.5 95.9 96.4 96.8 97.3 97.7 98.1
91 94.6 95.0 95.5 95.9 96.4 96.8 97.3
90 93.6 94.1 94.6 95.0 95.5 95.9 96.4
89 92.7 93.2 93.7 94.1 94.6 95.0 95.5
88 91.8 92.3 92.7 93.2 93.7 94.2 94.6
87 90.9 91.3 91.8 92.3 92.8 93.3 93.8
86 89.9 90.4 90.9 91.4 91.9 92.4 92.9
85 89.0 89.5 90.0 90.5 91.0 91.5 92.0

90 | P a g e
84 88.1 88.6 89.1 89.6 90.1 90.6 91.1
83 87.2 87.7 88.2 88.7 89.2 89.7 90.3
82 86.2 86.8 87.3 87.8 88.3 88.9 89.4
81 85.3 85.8 86.4 89.9 87.4 88.0 88.5
TABLE 3D—CORRECTION OF MINUS NO. 10 DENSITY FOR % PLUS NO. 10 IN TOTAL SAMPLE

91 | P a g e
% Plus No. 10 Material by Weight in Total Sample
-10 Density 15 16 17 18 19 20 21
130 131.5 131.6 131.7 131.8 131.9 132.0 132.1 129 130.6 130.7 130.8 130.9 131.0 131.1 131.2
128 129.7 129.9 130.0 130.1 130.2 130.3 130.4
127 128.9 129.0 129.1 129.3 129.4 129.5 129.6
126 128.0 128.1 128.3 128.4 128.5 128.7 128.8
125 127.1 127.3 127.4 127.6 127.7 127.9 128.0
124 126.3 126.4 126.6 126.7 126.9 127.0 127.2
123 125.4 125.6 125.7 125.9 126.1 126.2 126.4
122 124.6 124.7 124.9 125.1 125.2 125.4 125.6
121 123.7 123.8 124.0 124.2 124.4 124.6 124.7
120 122.8 123.0 123.2 123.4 123.6 123.7 123.9
119 121.9 122.1 122.3 122.5 122.7 122.9 123.1
118 121.1 121.3 121.5 121.7 121.9 122.1 122.3
117 120.2 120.4 120.6 120.9 121.1 121.3 121.5
116 119.3 119.6 119.8 120.0 120.2 120.5 120.7
115 118.5 118.7 118.9 119.2 119.4 119.6 119.9
114 117.6 117.9 118.1 118.3 118.6 118.8 119.1
113 116.8 117.0 117.3 117.5 117.8 118.0 118.3
112 115.9 116.1 116.4 116.7 116.9 117.2 117.4
111 115.0 115.3 115.6 115.8 116.1 116.4 116.6
110 114.2 114.4 114.7 115.0 115.3 115.5 115.8
109 113.3 113.6 113.9 114.1 114.4 114.7 115.0
108 112.4 112.7 113.0 113.3 113.6 113.9 114.2
107 111.6 111.9 112.2 112.5 112.8 113.1 113.4
106 110.7 111.0 111.3 111.6 111.9 112.3 112.6
105 109.8 110.2 110.5 110.8 111.1 111.4 111.8
104 109.0 109.3 109.6 110.0 110.3 110.6 111.0
103 108.1 108.4 108.8 109.1 109.5 109.8 110.0
102 107.2 107.6 107.9 108.3 108.6 109.0 109.3
101 106.4 106.7 107.1 107.4 407.8 108.2 108.5
100 105.5 105.9 106.2 106.6 107.0 107.3 107.7
99 104.6 105.0 105.4 105.8 106.1 106.5 106.9
98 103.8 104.2 104.5 104.9 105.3 105.7 106.1
97 102.9 103.3 103.7 104.1 104.5 104.9 105.3
96 102.0 102.4 102.8 103.2 103.6 104.0 104.4
95 101.2 101.6 102.0 102.4 102.8 103.2 103.6
94 100.3 100.7 101.1 101.6 102.0 102.4 102.8
93 99.4 99.9 100.3 100.7 101.2 101.6 102.0
92 98.6 99.0 99.4 99.9 100.3 100.8 101.2
91 97.7 98.2 98.6 99.0 99.5 99.9 100.4
90 96.8 97.3 97.8 98.2 98.7 99.1 99.6
89 96.0 96.4 96.9 97.4 97.8 98.3 98.8
88 95.1 95.6 96.1 96.5 97.0 97.5 98.0
87 94.2 94.7 95.2 95.7 96.2 96.7 97.1
86 93.4 93.9 94.4 94.9 95.3 95.8 96.3
85 92.5 93.0 93.5 94.0 94.5 95.0 95.5
84 91.7 92.2 92.7 93.2 93.7 94.2 94.7
83 90.8 91.3 91.8 92.3 90.9 93.4 93.9
82 89.9 90.4 91.0 91.5 92.0 92.6 93.1
81 89.1 89.6 90.1 90.7 91.2 91.7 92.3
TABLE 4D—CORRECTION OF MINUS NO. 10 DENSITY FOR % PLUS NO. 10 IN TOTAL SAMPLE

92 | P a g e
GDT 7
% Plus No. 10 Material by Weight in Total Sample
-10 Density 22 23 24 25 26 27 28
130 132.2 132.3 132.4 132.5 132.5 132.6 132.7 129 131.4 131.5 131.6 131.7 131.8 131.9 132.0
128 130.6 130.7 130.8 130.9 131.0 131.1 131.2
127 129.8 129.9 130.0 130.1 130.3 130.4 130.5
126 128.9 129.1 129.2 129.4 129.5 129.6 129.8
125 128.1 128.3 128.4 128.6 128.7 128.9 129.0
124 127.3 127.5 127.6 127.8 128.0 128.1 128.3
123 126.5 126.7 126.9 127.0 127.2 127.3 127.5
122 125.7 125.9 126.1 126.3 126.4 126.6 126.8
121 124.9 125.1 125.3 125.5 125.6 125.8 126.0
120 124.1 124.3 124.5 124.7 124.9 125.0 125.0
119 123.3 123.5 123.7 123.9 124.1 124.3 124.5
118 122.5 122.7 122.9 123.1 123.3 123.5 123.7
117 121.7 121.9 122.1 122.4 122.6 122.8 123.0
116 120.9 121.1 121.4 121.6 121.8 122.0 122.2
115 120.1 120.3 120.6 120.8 121.0 121.3 121.5
114 119.3 119.5 119.8 120.0 120.3 120.5 120.7
113 118.5 118.8 119.0 119.3 119.5 119.8 120.0
112 117.7 118.0 118.2 118.5 118.7 119.0 119.3
111 116.9 117.2 117.4 117.7 118.0 118.2 118.5
110 116.1 116.4 116.6 116.9 117.2 117.5 117.8
109 115.3 115.6 115.9 116.2 116.4 116.7 117.0
108 114.5 114.8 115.1 115.4 115.7 116.0 116.3
107 113.7 114.0 114.3 114.6 114.9 115.2 115.5
106 112.9 113.2 113.5 113.8 114.1 114.5 114.8
105 112.1 112.4 112.7 113.1 113.4 113.7 114.0
104 111.3 111.6 111.9 112.3 112.6 112.9 113.3
103 110.5 110.8 111.2 111.5 111.8 112.2 112.5
102 109.7 110.0 110.4 110.7 111.1 111.4 111.8
101 108.9 109.2 109.6 110.0 110.3 110.7 111.0
100 108.1 108.4 108.8 109.2 109.5 109.9 110.3
99 107.3 107.6 108.0 108.4 408.8 109.2 109.5
98 106.5 106.9 107.2 107.6 108.0 108.4 108.8
97 105.7 106.1 106.5 106.9 107.2 107.6 108.0
96 104.8 105.2 105.6 106.1 106.5 106.9 107.3
95 104.0 104.5 104.9 105.3 105.7 106.1 106.5
94 103.2 103.7 104.1 104.5 104.9 105.3 105.8
93 102.4 102.9 103.3 103.7 104.2 104.6 105.0
92 101.6 102.1 102.5 103.0 103.4 103.8 104.3
91 100.8 101.3 101.7 102.2 102.6 103.1 103.5
90 100.0 100.5 100.9 101.4 101.9 102.3 102.8
89 99.2 99.7 100.2 100.6 101.1 101.6 102.0
88 98.4 98.9 99.4 99.9 100.3 100.8 101.3
87 97.6 98.1 98.6 99.1 99.6 100.0 100.5
86 96.8 97.3 97.8 98.3 98.8 99.3 99.8
85 96.0 96.5 97.0 97.5 98.0 98.5 99.0
84 95.2 95.7 96.2 96.8 97.3 97.8 98.3
83 94.4 94.9 95.5 96.0 96.5 97.0 97.5
82 93.6 94.1 94.7 95.2 95.7 96.3 96.8
81 92.8 93.4 93.9 94.4 95.0 95.5 96.0
TABLE 5D—CORRECTION OF MINUS NO. 10 DENSITY FOR % PLUS NO. 10 IN TOTAL SAMPLE

93 | P a g e
GDT 7
% Plus No. 10 Material by Weight in Total Sample
-10 Density 29 30 31 32 33 34 35
130 132.8 132.9 133.0 133.1 133.2 133.3 133.4 129 132.1 132.2 132.3 132.4 132.5 132.6 132.7
128 131.4 131.5 131.6 131.7 131.8 131.9 132.1
127 130.6 130.8 130.9 131.0 131.1 131.3 131.4
126 129.9 130.0 130.2 130.3 130.4 130.6 130.7
125 129.1 129.3 129.4 129.6 129.7 129.8 130.0
124 128.4 128.6 128.7 128.9 129.0 129.2 129.3
123 127.7 127.8 128.0 128.2 128.3 128.5 128.6
122 126.9 127.1 127.3 127.4 127.6 127.8 128.0
121 126.2 126.3 126.5 126.7 126.9 127.1 127.2
120 125.4 125.6 125.8 126.0 126.2 126.4 126.5
119 124.7 124.9 125.1 125.3 125.5 125.7 125.9
118 123.9 124.2 124.4 124.6 124.8 125.0 125.2
117 123.2 123.4 123.6 123.8 124.1 124.3 124.5
116 122.5 122.7 122.9 123.1 123.4 123.6 123.8
115 121.7 122.0 122.2 122.4 122.7 122.9 123.1
114 121.0 121.2 121.5 121.7 122.0 122.2 122.4
113 120.3 120.5 120.8 121.0 121.3 121.5 121.8
112 119.5 119.8 120.0 120.3 120.5 120.8 121.1
111 118.8 119.0 119.3 119.6 119.8 120.1 120.4
110 118.0 118.3 118.6 118.9 119.1 119.4 119.7
109 117.3 117.6 117.9 118.2 118.4 118.7 119.0
108 116.6 116.9 117.1 117.4 117.7 118.0 118.3
107 115.8 116.1 116.4 116.7 117.0 117.3 117.6
106 115.1 115.4 115.7 116.0 116.3 116.6 117.0
105 114.3 114.7 115.0 115.3 115.6 115.9 116.3
104 113.6 113.9 114.3 114.6 114.9 115.3 115.6
103 112.9 113.2 113.5 113.9 114.2 114.6 114.9
102 112.1 112.5 112.8 113.2 113.5 113.9 114.2
101 111.4 111.7 112.1 112.5 112.8 113.2 113.5
100 110.6 111.0 111.4 111.7 112.1 112.5 112.8
99 109.9 110.3 110.7 111.0 111.4 111.8 112.2
98 109.2 109.6 109.9 110.3 110.7 111.1 111.5
97 108.4 408.8 109.2 109.6 110.0 110.4 110.8
96 107.7 108.1 108.5 108.9 109.3 109.7 110.1
95 106.9 107.3 107.7 108.2 108.6 109.0 109.4
94 106.2 106.6 107.0 107.4 107.9 108.3 108.7
93 105.4 105.9 106.3 106.7 107.2 107.6 108.0
92 104.7 105.1 105.6 106.0 106.5 106.9 107.3
91 104.0 104.4 104.9 105.3 105.8 106.2 106.6
90 103.2 103.7 104.1 104.6 105.0 105.5 106.0
89 102.5 103.0 103.4 103.9 104.3 104.8 105.3
88 101.7 102.2 102.7 103.2 103.6 104.1 104.6
87 101.0 101.5 102.0 102.5 102.9 103.4 103.9
86 100.3 100.8 101.3 101.7 102.2 102.7 103.2
85 99.5 100.0 100.5 101.0 101.5 102.0 102.5
84 98.8 99.3 99.8 100.3 100.8 101.3 101.9
83 98.1 98.6 99.1 99.6 100.1 100.6 101.2
82 97.3 97.8 98.4 98.9 99.4 100.0 100.5
81 96.6 97.1 97.6 98.2 98.7 99.3 99.8
TABLE 6D—CORRECTION OF MINUS NO. 10 DENSITY FOR % PLUS NO. 10 IN TOTAL SAMPLE

94 | P a g e
GDT 7
% Plus No. 10 Material by Weight in Total Sample
-10 Density 36 37 38 39 40 41 42
130 133.5 133.6 133.7 133.8 133.9 134.0 134.1 129 132.9 133.0 133.1 133.2 133.3 133.4 133.5
128 132.2 132.3 132.4 132.5 132.6 132.8 132.9
127 131.5 131.6 131.8 131.9 132.0 132.1 132.3
126 130.8 131.0 131.1 131.2 131.4 131.5 131.6
125 130.1 130.3 130.4 130.6 130.7 130.9 131.0
124 129.5 129.6 129.8 121.9 130.1 130.2 130.4
123 128.8 129.0 129.1 129.3 129.4 129.6 129.8
122 128.1 128.3 128.5 128.6 128.8 129.0 129.1
121 127.4 127.6 127.8 127.9 128.1 128.3 128.5
120 126.7 126.9 127.1 127.3 127.5 127.7 127.9
119 126.1 126.3 126.4 126.6 126.8 127.0 127.2
118 125.4 125.6 125.8 126.0 126.2 126.4 126.6
117 124.7 124.9 125.1 125.3 125.6 125.8 126.0
116 124.0 124.3 124.5 124.7 124.9 125.1 125.4
115 123.4 123.6 123.8 124.0 124.3 124.5 124.7
114 122.7 122.9 123.2 123.4 123.6 123.9 124.1
113 122.0 122.3 122.5 122.8 123.0 123.3 123.5
112 121.3 121.6 121.8 122.1 122.4 122.6 122.9
111 120.6 120.9 121.2 121.5 121.7 122.0 122.3
110 120.0 120.2 120.5 120.8 121.1 121.4 121.6
109 119.3 119.6 119.9 120.2 120.4 120.7 121.0
108 118.6 118.9 119.2 119.5 119.8 120.1 120.4
107 117.9 118.2 118.6 118.9 119.2 119.5 119.8
106 117.3 117.6 117.9 118.2 118.5 118.8 119.1
105 116.6 116.9 117.2 117.6 117.9 118.2 118.5
104 115.9 116.2 116.6 116.9 117.2 117.6 117.9
103 115.2 115.6 115.9 116.3 116.6 116.9 117.3
102 114.6 114.9 115.3 115.6 116.0 116.3 116.7
101 113.9 114.2 114.6 115.0 115.3 115.7 116.0
100 113.2 113.6 113.9 114.3 114.7 115.0 115.4
99 112.5 112.9 113.3 113.7 114.0 114.4 114.8
98 111.9 112.2 112.6 113.0 113.4 113.8 114.2
97 111.2 111.6 112.0 112.4 112.8 113.2 113.5
96 110.5 110.9 111.3 111.7 112.1 112.5 112.9
95 109.8 110.2 110.6 111.0 111.4 111.9 112.3
94 109.1 109.5 110.0 110.4 110.8 111.2 111.6
93 108.4 108.9 109.3 109.7 110.2 110.6 111.0
92 107.8 108.2 108.6 109.1 109.5 110.0 110.4
91 107.1 107.5 108.0 108.4 408.9 109.3 109.8
90 106.4 106.9 107.3 107.8 108.2 108.7 109.2
89 105.7 106.2 106.7 107.1 107.6 108.1 108.5
88 105.1 105.5 106.0 106.5 107.0 107.4 107.9
87 104.4 104.9 105.4 405.8 106.3 106.8 107.3
86 103.7 104.2 104.7 105.2 105.7 106.2 106.7
85 103.0 103.5 104.0 104.5 105.0 105.5 106.0
84 102.4 102.9 103.4 103.9 104.4 104.9 105.4
83 101.7 102.2 102.7 103.2 103.8 104.3 104.8
82 101.0 101.5 102.1 102.6 103.1 103.6 104.2
81 100.3 100.9 101.4 101.9 102.5 103.0 103.6
TABLE 7D—CORRECTION OF MINUS NO. 10 DENSITY FOR % PLUS NO. 10 IN TOTAL SAMPLE

95 | P a ge
GDT 7
% Plus No. 10 Material by Weight in Total Sample
-10 Density 43 44 45 130 134.2 134.3 134.4
129 133.6 133.7 133.8
128 133.0 133.1 133.2
127 132.4 132.5 132.6
126 131.8 131.9 132.0
125 131.1 131.3 131.4
124 130.5 130.7 103.8
123 129.9 130.1 130.2
122 129.3 129.5 129.7
121 128.7 128.8 139.0
120 128.0 128.2 128.8
119 127.4 127.6 127.8
118 126.8 127.0 127.2
117 126.2 126.4 126.6
116 125.6 125.8 126.0
115 125.0 125.2 125.4
114 124.4 124.6 124.8
113 123.8 124.0 124.3
112 123.1 123.4 123.7
111 122.5 122.8 123.1
110 121.9 122.2 122.5
109 121.3 121.6 121.9
108 120.7 121.0 121.3
107 120.1 120.4 120.7
106 119.5 119.8 120.1
105 118.8 119.2 119.5
104 118.2 118.6 118.9
103 117.6 118.0 118.3
102 117.0 117.4 117.7
101 116.4 116.8 117.1
100 115.8 116.1 116.5
99 115.2 115.5 115.9
98 114.6 114.9 115.3
97 113.9 114.3 114.7
96 113.3 113.7 114.1
95 112.7 113.1 113.5
94 112.1 112.5 112.9
93 111.4 111.9 112.3
92 110.8 111.3 111.7
91 110.2 110.7 111.1
90 109.7 110.1 110.5
89 109.0 109.5 109.9

96 | P a g e
88 108.4 108.9 109.3

97 | P a ge
GDT 7
87 107.8 108.3 108.7
86 107.2 107.6 108.1
85 106.5 107.0 107.5
84 105.9 106.4 107.0
83 105.3 105.8 106.4
82 104.7 105.2 105.8
81 104.1 104.6 105.2

98 | P a ge
GDT 7
TABLE 1M—MOISTURE CORRECTION OF MINUS NO. 10 FOR % PLUS No. 10
(FOR + 10 ABSORPTION OF 1%) % Plus No. 10 Material by Weight in Total Sample
-10 Moisture 5 10 15 20 25 40 38.1 36.1 34.2 32.2 30.3
39 37.1 35.2 33.3 31.4 29.5
38 36.2 34.3 32.5 30.6 28.8
37 35.2 33.4 31.6 29.8 28.0
36 34.3 32.5 30.8 29.0 27.3
35 33.3 31.6 29.9 28.2 26.5
34 32.4 30.7 29.1 27.4 25.8
33 31.4 29.8 28.2 26.6 25.0
32 30.5 28.9 27.4 25.8 24.3
31 29.5 28.0 26.5 25.0 23.5
30 28.6 27.1 25.7 24.2 22.8
29 27.6 26.2 24.8 23.4 22.0
28 26.7 25.3 23.9 22.6 21.3
27 25.7 24.2 23.1 21.8 20.5
26 24.8 23.5 22.3 21.0 19.8
25 23.8 22.6 21.4 20.2 19.0
24 22.9 21.7 20.6 19.4 18.3
23 21.9 20.8 19.7 18.6 17.5
22 21.0 19.9 18.9 17.8 16.8
21 20.0 19.0 18.0 17.0 16.0
20 19.1 18.1 17.2 16.2 15.3
19 18.1 17.2 16.3 15.4 14.5
18 17.2 16.3 15.5 14.6 13.8
17 16.2 15.4 14.6 13.8 13.0
16 15.3 14.6 13.8 13.0 12.3
15 14.3 13.6 12.9 12.2 11.5
14 13.4 12.7 12.1 11.4 10.8
13 12.4 11.8 11.2 10.6 10.0
12 11.5 11.0 10.4 9.8 9.3
11 10.5 10.0 9.5 9.0 8.5
10 9.6 9.1 8.7 8.2 7.8
9 8.6 8.2 7.8 7.4 7.0
8 7.7 7.3 7.0 6.6 6.3
7 6.7 6.4 6.1 5.8 5.5
6 5.8 5.5 5.3 5.0 4.8
5 4.8 4.6 4.4 4.2 4.0
4 3.9 3.7 3.6 3.4 3.3
3 2.9 2.8 2.7 2.6 2.5
2 2.0 1.9 1.9 1.8 1.8

99 | P a ge
GDT 7
TABLE 2M—MOISTURE CORRECTION OF MINUS NO. 10 FOR % PLUS No. 10
(FOR + 10 ABSORPTION OF 1%) % Plus No. 10 Material by Weight in Total Sample
-10 Moisture 30 35 40 45 40 28.3 26.4 24.4 22.5 39 27.6 25.7 23.8 21.9 38 26.9 25.1 23.2 21.4 37 26.2 24.4 22.6 20.8 36 25.5 23.8 22.0 20.3 35 24.8 23.1 21.4 19.7 34 24.1 22.5 20.8 19.2 33 23.4 21.8 20.2 18.6 32 22.7 21.2 19.6 18.1 31 22.0 20.5 19.0 17.5 30 21.3 19.9 18.4 17.0 29 20.6 19.2 17.8 16.4 28 19.9 18.6 17.2 15.9 27 19.2 17.9 16.6 15.3 26 18.5 17.3 16.0 14.8 25 17.8 16.6 15.4 14.2 24 17.1 16.0 14.8 13.7 23 16.4 15.3 14.2 13.1 22 15.7 14.7 13.6 12.6 21 15.0 14.0 13.0 12.0 20 14.3 13.4 12.4 11.5 19 13.6 12.7 11.8 10.9 18 12.9 12.1 11.2 10.4 17 12.2 11.4 10.6 9.8 16 11.5 10.8 10.0 9.3 15 10.8 10.1 9.4 8.7 14 10.1 9.5 8.8 8.2 13 9.4 8.8 8.2 7.6 12 8.7 8.2 7.6 7.1 11 8.0 7.5 7.0 6.5 10 7.3 6.9 6.4 6.0 9 6.6 6.2 5.8 5.4 8 5.9 5.6 5.2 4.9 7 5.2 4.9 4.6 4.3 6 4.5 4.3 4.0 3.8 5 3.8 3.6 3.4 3.3 4 3.1 3.0 2.8 2.7 3 2.4 2.3 2.2 2.1 2 1.7 1.7 1.6 1.6

100 | P a g e
TABLE 3M—MOISTURE CORRECTION OF MINUS NO. 10 FOR % PLUS No. 10

101 | P a ge
GDT 7
(FOR + 10 ABSORPTION OF 2%) % Plus No. 10 Material by Weight
in Total Sample -10 Moisture 5 10 15 20 25 40 38.1 36.2 34.3 32.4 30.5 39 37.2 35.3 33.5 31.6 29.8 38 36.2 34.4 32.6 30.8 29.0 37 35.3 33.5 31.8 30.0 28.3 36 34.3 32.6 30.9 29.2 27.5 35 33.4 31.7 30.1 28.4 26.8 34 32.4 30.8 29.2 27.6 26.0 33 31.5 29.9 28.4 26.8 25.3 32 30.5 29.0 27.5 26.0 24.5 31 29.6 28.1 26.7 25.2 23.8 30 28.6 27.2 25.8 24.4 23.0 29 27.7 26.3 25.0 23.6 22.3 28 26.7 25.4 24.1 22.8 21.5 27 25.8 24.5 23.3 22.0 20.8 26 24.8 23.6 22.4 21.2 20.0 25 23.9 22.7 21.6 20.4 19.3 24 22.9 21.8 20.7 19.6 18.5 23 22.0 20.9 19.9 18.8 17.8 22 21.0 20.0 19.0 18.0 17.0 21 20.1 19.1 18.2 17.2 16.3 20 19.1 18.2 17.3 16.4 15.5 19 18.2 17.3 16.5 15.6 14.8 18 17.2 16.4 15.6 14.8 14.0 17 16.3 15.5 14.8 14.0 13.3 16 15.3 14.6 13.9 13.2 12.5 15 14.4 13.7 13.1 12.4 11.8 14 13.4 12.8 12.2 11.6 11.0 13 12.5 11.9 11.4 10.8 10.3 12 11.5 11.0 10.5 10.0 9.5 11 10.6 10.1 9.7 9.2 8.8 10 9.6 9.2 8.8 8.5 8.0 9 8.7 8.3 8.0 7.6 7.3 8 7.7 7.4 7.1 6.8 6.5 7 6.8 6.5 6.3 6.0 5.8 6 5.8 5.6 5.4 5.2 5.0 5 4.9 4.7 4.6 4.4 4.3 4 3.9 3.8 3.7 3.6 3.5 3 3.0 2.9 2.9 2.8 2.8 2 2.0 2.0 2.0 2.0 2.0
TABLE 4M—MOISTURE CORRECTION OF MINUS NO. 10 FOR % PLUS No. 10

102 | P a g e
(FOR + 10 ABSORPTION OF 2%) % Plus No. 10 Material by Weight in Total Sample

103 | P a ge
GDT 7
-10 Moisture 30 35 40 45 40 28.6 26.7 24.8 22.9 39 27.9 26.1 24.2 22.4 38 27.2 25.4 23.6 21.8 37 26.5 24.8 23.0 21.3 36 25.8 24.1 22.4 20.7 35 25.1 23.5 21.8 20.2 34 24.4 22.8 21.2 19.6 33 23.7 22.2 20.6 19.1 32 23.0 21.5 20.0 18.5 31 22.3 20.9 19.4 18.0 30 21.6 20.2 18.8 17.4 29 20.9 19.6 18.2 16.9 28 20.2 18.9 17.6 16.3 27 19.5 18.3 17.0 15.8 26 18.8 17.6 16.4 15.2 25 18.1 17.0 15.8 14.7 24 17.4 16.3 15.2 14.1 23 16.7 15.7 14.6 13.6 22 16.0 15.0 14.0 13.0 21 15.3 14.4 13.4 12.5 20 14.6 13.7 12.8 11.9 19 13.9 13.1 12.2 11.4 18 13.2 12.4 11.6 10.8 17 12.5 11.8 11.0 10.3 16 11.8 11.1 10.4 9.7 15 11.1 10.5 9.8 9.2 14 10.4 9.8 9.2 8.6 13 9.7 9.2 8.6 8.1 12 9.0 8.5 8.0 7.5 11 8.3 7.9 7.4 7.0 10 7.6 7.2 6.8 6.4 9 6.9 6.6 6.2 5.9 8 6.2 5.9 5.6 5.3 7 5.5 5.3 5.0 4.8 6 4.8 4.6 4.4 4.2 5 4.1 4.0 3.8 3.7 4 3.4 3.3 3.2 3.1 3 2.7 2.7 2.6 2.6 2 2.0 2.0 2.0 2.0
TABLE 5M—MOISTURE CORRECTION OF MINUS NO. 10 FOR % PLUS No. 10

104 | P a g e
(FOR + 10 ABSORPTION OF 3%) % Plus No. 10 Material by Weight in Total Sample

105 | P a ge
GDT 7
-10 Moisture 5 10 15 20 25 40 38.2 36.3 34.5 32.6 30.8 39 37.2 35.4 33.6 31.8 30.0 38 36.3 34.5 32.8 31.0 29.3 37 35.3 33.6 31.9 30.2 28.5 36 34.4 32.7 31.1 29.4 27.8 35 33.4 31.8 30.2 28.6 27.0 34 32.5 30.9 29.4 27.8 26.3 33 31.5 30.0 28.5 27.0 25.5 32 30.6 29.1 27.7 26.2 24.8 31 29.6 28.2 26.8 25.4 24.0 30 28.7 27.3 26.0 24.6 23.3 29 27.7 26.4 25.1 23.8 22.5 28 26.8 25.5 24.3 23.0 21.8 27 25.8 24.6 23.4 22.2 21.0 26 24.9 23.7 22.6 21.4 20.3 25 23.9 22.8 21.7 20.6 19.5 24 23.0 21.9 20.9 19.8 18.8 23 22.0 21.0 20.0 19.0 18.0 22 21.1 20.1 19.2 18.2 17.3 21 20.1 19.2 18.3 17.4 16.5 20 19.2 18.3 17.5 16.6 15.8 19 18.2 17.4 16.6 15.8 15.0 18 17.3 16.5 15.8 15.0 14.3 17 16.3 15.6 14.9 14.2 13.5 16 15.4 14.7 14.1 13.4 12.8 15 14.4 13.8 13.2 12.6 12.0 14 13.5 12.9 12.4 11.8 11.3 13 12.5 12.0 11.5 11.0 10.5 12 11.6 11.1 10.7 10.2 9.8 11 10.6 10.2 9.8 9.4 9.0 10 9.7 9.3 9.0 8.6 8.3 9 8.7 8.4 8.1 7.8 7.5 8 7.8 7.5 7.3 7.0 6.8 7 6.8 6.6 6.4 6.2 6.0 6 5.9 5.7 5.6 5.4 5.3 5 4.9 4.8 4.7 4.6 4.5 4 4.0 3.9 3.9 3.8 3.8 3 3.0 3.0 3.0 3.0 3.0 2 2.1 2.1 2.2 2.2 2.3
TABLE 6M—MOISTURE CORRECTION OF MINUS NO. 10 FOR % PLUS No. 10 (FOR + 10 ABSORPTION OF 3%)

106 | P a g e
% Plus No. 10 Material by Weight in Total Sample

107 | P a ge
GDT 7
-10 Moisture 30 35 40 45 40 28.9 27.1 25.2 23.4 39 28.2 26.4 24.6 22.8 38 27.5 25.8 24.0 22.3 37 26.8 25.1 23.4 21.7 36 26.1 24.5 22.8 21.2 35 25.4 23.8 22.2 20.6 34 24.7 23.2 21.6 21.1 33 24.0 22.5 21.0 19.5 32 23.3 21.9 20.4 19.0 31 22.6 21.2 19.8 16.4 30 21.9 20.6 19.2 17.9 29 21.2 19.9 18.6 17.3 28 20.5 19.3 18.0 16.8 27 19.8 18.6 17.4 16.2 26 19.1 18.0 16.8 15.7 25 18.4 17.3 16.2 15.1 24 17.7 16.7 15.6 14.6 23 17.0 16.0 15.0 14.0 22 16.3 15.4 14.4 13.5 21 15.6 14.7 13.8 12.9 20 14.9 14.1 13.2 12.4 19 14.2 13.4 12.6 11.8 18 13.5 12.8 12.0 11.3 17 12.8 12.1 11.4 10.7 16 12.1 11.5 10.8 10.2 15 11.4 10.8 10.2 9.6 14 10.7 10.2 9.6 9.1 13 10.0 9.5 9.0 8.5 12 9.3 8.9 8.4 8.0 11 8.6 8.2 7.8 7.4 10 7.9 7.6 7.2 6.9 9 7.2 6.9 6.6 6.3 8 6.5 6.3 6.0 5.8 7 5.8 5.6 5.4 5.2 6 5.1 5.0 4.8 4.7 5 4.4 4.3 4.2 4.1 4 3.7 3.7 3.6 3.6 3 3.0 3.0 3.0 3.0 2 2.3 2.4 2.4 2.5
TABLE 7M—MOISTURE CORRECTION OF MINUS NO. 10 FOR % PLUS No. 10 (FOR + 10 ABSORPTION OF 4%)

108 | P a g e
% Plus No. 10 Material by Weight in Total Sample
-10 Moisture 5 10 15 20 25 40 38.2 36.3 34.5 32.6 30.8 39 37.2 35.4 33.6 31.8 30.0 38 36.3 34.5 32.8 31.0 29.3 37 35.3 33.6 31.9 30.2 28.5 36 34.4 32.7 31.1 29.4 27.8 35 33.4 31.8 30.2 28.6 27.0 34 32.5 30.9 29.4 27.8 26.3 33 31.5 30.0 28.5 27.0 25.5 32 30.6 29.1 27.7 26.2 24.8 31 29.6 28.2 26.8 25.4 24.0 30 28.7 27.3 26.0 24.6 23.3 29 27.7 26.4 25.1 23.8 22.5 28 26.8 25.5 24.3 23.0 21.8 27 25.8 24.6 23.4 22.2 21.0 26 24.9 23.7 22.6 21.4 20.3 25 23.9 22.8 21.7 20.6 19.5 24 23.0 21.9 20.9 19.8 18.8 23 22.0 21.0 20.0 19.0 18.0 22 21.1 20.1 19.2 18.2 17.3 21 20.1 19.2 18.3 17.4 16.5 20 19.2 18.3 17.5 16.6 15.8 19 18.2 17.4 16.6 15.8 15.0 18 17.3 16.5 15.8 15.0 14.3 17 16.3 15.6 14.9 14.2 13.5 16 15.4 14.7 14.1 13.4 12.8 15 14.4 13.8 13.2 12.6 12.0 14 13.5 12.9 12.4 11.8 11.3 13 12.5 12.0 11.5 11.0 10.5 12 11.6 11.1 10.7 10.2 9.8 11 10.6 10.2 9.8 9.4 9.0 10 9.7 9.3 9.0 8.6 8.3 9 8.7 8.4 8.1 7.8 7.5 8 7.8 7.5 7.3 7.0 6.8 7 6.8 6.6 6.4 6.2 6.0 6 5.9 5.7 5.6 5.4 5.3 5 4.9 4.8 4.7 4.6 4.5 4 4.0 3.9 3.9 3.8 3.8 3 3.0 3.0 3.0 3.0 3.0 2 2.1 2.1 2.2 2.2 2.3

109 | P a g e
TABLE 8M—MOISTURE CORRECTION OF MINUS NO. 10 FOR % PLUS No. 10
(FOR + 10 ABSORPTION OF 4%) % Plus No. 10 Material by Weight in Total Sample
-10 Moisture 30 35 40 45
40 29.2 27.4 25.6 23.8 39 28.5 26.8 25.0 23.3 38 27.8 26.1 24.4 22.7 37 27.1 25.5 23.8 22.2 36 26.4 24.8 23.2 21.6 35 25.7 25.4 22.6 21.1 34 25.0 23.5 22.0 20.5 33 24.3 22.9 21.4 20.0 32 23.6 22.2 20.8 19.4 31 22.9 21.6 20.2 18.9 30 22.2 20.9 20.6 18.3 29 21.5 20.3 19.0 17.8 28 20.8 19.6 18.4 17.2 27 20.1 19.0 17.8 16.7 26 19.4 18.3 17.2 16.1 25 18.7 17.7 16.6 15.6 24 18.0 17.0 16.0 15.0 23 17.3 16.4 15.4 14.5 22 16.0 15.7 14.8 13.9 21 15.9 15.1 14.2 13.4 20 15.2 14.4 13.6 12.8 19 14.5 13.8 13.0 12.3 18 13.8 13.1 12.4 11.7 17 13.1 12.5 11.8 11.2 16 12.4 11.8 11.2 10.6 15 11.7 11.2 10.6 10.1 14 11.0 10.5 10.0 9.5 13 10.3 9.9 9.4 9.0 12 9.6 9.2 8.8 8.4 11 8.9 8.6 8.2 7.9 10 8.2 7.9 7.6 7.3 9 7.5 7.3 7.0 6.8 8 6.8 6.6 6.4 6.2 7 6.1 6.0 5.8 5.7 6 5.4 5.3 5.2 5.1 5 4.7 4.7 4.6 4.6 4 4.0 4.0 4.0 4.0 3 3.3 3.4 3.4 3.5 2 2.6 2.7 2.8 2.9

110 | P a g e
TABLE 9M—MOISTURE CORRECTION OF MINUS NO. 10 FOR % PLUS No. 10 (FOR + 10 ABSORPTION OF 5%)
% Plus No. 10 Material by Weight in Total Sample
-10 Moisture 5 10 15 20 25 40 38.3 36.5 34.8 33.0 31.3 39 37.3 35.6 33.9 32.2 30.5 38 36.4 34.7 33.1 31.4 29.8 37 35.4 33.8 32.2 30.6 29.0 36 34.5 32.9 31.4 29.8 28.3 35 33.5 32.0 30.5 29.0 27.5 34 32.6 31.1 29.7 28.2 26.8 33 31.6 30.2 28.8 27.4 26.0 32 30.7 29.3 28.0 26.6 25.3 31 29.7 28.4 27.1 25.8 24.5 30 28.8 27.5 26.3 25.0 23.8 29 27.8 26.6 25.4 24.2 23.0 28 26.9 25.7 24.6 23.4 22.3 27 25.9 24.8 23.7 22.6 21.5 26 25.0 23.9 22.9 21.8 20.8 25 24.0 23.0 22.0 21.0 20.0 24 23.1 22.1 21.2 20.2 19.3 23 22.1 21.2 20.3 19.4 18.5 22 21.2 20.3 19.5 18.6 17.8 21 20.2 19.4 18.6 17.8 17.0 20 19.3 18.5 17.8 17.0 16.3 19 18.3 17.6 16.9 16.2 15.5 18 17.4 16.7 16.1 15.4 14.8 17 16.4 15.8 15.2 14.6 14.0 16 15.5 14.9 14.4 13.8 13.3 15 14.5 14.0 13.5 13.0 12.5 14 13.6 13.1 12.7 12.2 11.8 13 12.6 12.2 11.8 11.4 11.0 12 11.7 11.3 11.0 10.6 10.3 11 10.7 10.4 10.1 9.8 9.5 10 9.8 9.5 9.3 9.0 8.8 9 8.8 8.6 8.4 8.2 8.0 8 7.9 7.7 7.6 7.4 7.3 7 6.9 6.8 6.7 6.6 6.5 6 6.0 5.9 5.9 5.8 5.8 5 5.0 5.0 5.0 5.0 5.0 4 4.1 4.1 4.2 4.2 4.3 3 3.1 3.2 3.3 3.4 3.5 2 2.2 2.3 2.5 2.6 2.8

111 | P a g e
TABLE 10M—MOISTURE CORRECTION OF MINUS NO. 10 FOR % PLUS No. 10
(FOR + 10 ABSORPTION OF 5%) % Plus No. 10 Material by Weight in Total Sample
-10 Moisture 30 35 40 45 40 29.5 27.8 26.0 24.3
39 28.8 27.1 25.4 23.7 38 28.1 26.5 24.8 23.2 37 27.4 25.8 24.2 22.6 36 26.7 25.2 23.6 22.1 35 26.0 24.5 23.0 21.5 34 25.3 23.9 22.4 21.0 33 24.6 23.2 21.8 20.4 32 23.9 22.6 21.2 19.9 31 23.2 21.9 20.6 19.3 30 22.5 21.3 20.0 18.8 29 21.8 20.6 19.4 18.2 28 21.1 20.0 18.8 17.7 27 20.4 19.3 18.2 17.1 26 19.7 18.7 17.6 16.6 25 19.0 18.0 17.0 16.0 24 18.3 17.4 16.4 15.5 23 17.6 16.7 15.8 14.9 22 16.9 16.1 15.2 14.4 21 16.2 15.4 14.6 13.8 20 15.5 14.8 14.0 13.3 19 14.8 14.1 13.4 12.7 18 14.1 13.5 12.8 12.2 17 13.4 12.8 12.2 11.6 16 12.7 12.2 11.6 11.1 15 12.0 11.5 11.0 10.5 14 11.3 10.9 10.4 10.0 13 10.6 10.2 9.8 9.4 12 9.9 9.6 9.2 8.9 11 9.2 8.9 8.6 8.3 10 8.5 8.3 8.0 7.8 9 7.8 7.6 7.4 7.2 8 7.1 7.0 6.8 6.7 7 6.4 6.3 6.2 6.1 6 5.7 5.7 5.6 5.6 5 5.0 5.0 5.0 5.0 4 4.3 4.4 4.4 4.5 3 3.6 3.7 3.8 3.9 2 2.9 3.1 3.2 3.4

112 | P a g e
GDT 21
A. Scope For a complete list of GDTs, see the Table of Contents.
This method of test covers the procedures for determining the in-place density of soil-aggregate mixtures in embankments, cuts, subgrades, subbases, bases, etc., where the percent of material retained on the No. 10 (2 mm) sieve is 45 or more, or where the percent of material retained on the 1 in (25 mm) sieve is 10 percent or more.
D. Apparatus Ring—A steel ring 12 in (304.8 mm) in diameter (mold or extension WM-06).
Sand—Any clean, dry sand graded to pass at least a No. 10 (2 mm) sieve but with no clay or silt.
Straightedge—A steel straightedge, 24 in (610 mm) long (WS13-2).
Drying Device—A stove or oven capable of rapidly drying the moisture determination samples.
Scales and Balances—A scale of at least 100 lb (45.36 kg) capacity, sensitive to 2 oz; and a 20 kg balance with an accuracy of 1 g or 0.1 percent of the sample being tested.
Density Mold—A 12 in (304.8 mm) mold (WM06).
Bucket—A 12 in (304.8 mm) measure (WM-02) (optional).
Miscellaneous Tools
Soil auger (optional) (WA-3)
Trowel (optional) (WT-07)
Containers (large pie pans or baking pans) (WP- 12)
Spoon (WS-14)
Brush (2 in or 3 in (50.8 or 76.2 mm) paint brush) (OB-02)
Small pie pans or evaporating dishes (WP-01 or WD-3)
Scoop (WS-03)
Chisel
Hammer or mallet (wooden mallet WM-01)
E. Sample Size and Preparation
Before making density measurements, calibrate the sand to determine its weight in pounds per cubic foot (kilograms per cubic meter). Perform the sand calibration in a manner designed to duplicate the method of pouring the sand into the sample hole.
NOTE: Perform the calibration with extreme care—a small error in the weight per cubic foot (meter) of the sand will cause a large error in the in-place density calculation.
B Weigh the empty volume mold.
NOTE: Calibrate by using a 12 in (304.8 mm) density mold with base plate attached or by using a 1/2
ft3 (0.0142 m
3) bucket.
C. Pour the sand into the mold or bucket until it is full. Use a method comparable to that used in pouring in the
sample hole. Strike off the sand level with the top.
D. Weigh the filled mold or bucket and record as gross weight of mold and plate (or bucket) and sand. Determine the weight of sand used by subtracting weight of mold and plate (or bucket).
E. Repeat the above operations 3 times and average the weight of the sand.
F. Calculate the density of the sand.

113 | P a g e
GDT 21
D. Procedures You must excavate density samples and then determine the volume of the density hole.
8. Excavating Density Samples
a. Prepare the surface of the location to be tested so that it is a level plane. Remove all loose material on
the surface from an area large enough to place the 12 in (304.8 mm) ring.
b. Seat the 12 in (304.8 mm) ring on the surface and mark an outline of the ring.
c. Dig the in-place material out through the ring by using the right outline as a guide to the full depth of the course being tested. Ensure that the sides of the hole are approximately vertical.
d. Place the material from the hole in the large container, being very careful not to lose any of the material. Take
care not to loosen or disturb the materials surrounding the hole. Remove and retain all of the loosened material for the full depth.
NOTE: If the course being tested has a specified thickness, you may measure the thickness at this time.
Immediately weigh the material removed from the hole before moisture is lost. Record the weight as weight of wet material from the hole.
Weigh a representative sample of approximately 2,000 grams of the wet material for moisture determination. Record as weight of wet sample. Dry this sample and weigh, recording as weight of dry sample. Calculate as moisture content.
C. Determining Volume of Density Hole
Place more than enough calibrated density sand needed to fill the sample hole into a container or sack
and weigh. Record this weight as initial weight of sand and container.
Fill the sample hole with the sand. Pour the sand from the container or sack using a method comparable to that used in calibrating the sand. Pour slowly and evenly until the sand is approximately 1 in (25.4 mm) below the top of the hole.
Use a small container (such as a tin cup) to complete the filling. Replace all unused sand into the container or sack. You may level the sand even with the top of the hole using the hand or small straightedge, but never compress or vibrate the sand.
a Weigh the container with the remaining sand. Determine the weight of sand used to fill the sample hole by
subtracting the weight of the remaining sand and container from the original weight of sand and container. Record this weight as weight of sand used.
2 Calculations f. Calculate the density of sand from calibration as follows:
Density of Sand = Pounds per cubic feet Density of Sand = kilograms per cubic meter Wt – Wm Wt – Wm where 454 x V 1000x V
Wwhere Where: Wt = weight of mold, plate and sand, or bucket and sand V = volume of mold or bucket in cubic meters* Wm = weight of mold and plate or bucket V = volume of mold or bucket in cubic feet*
*NOTE: Mold volume is .3927 ft3 (0.0111 m
3), bucket volume is 0.5 ft
3 (0.0142 m
3).
B Calculate the in-place wet density of the material removed, in pounds per cubic foot (kilograms per cubic meter),
by the following:
In-Place Wet Density, pounds per cubic foot (kilograms per cubic meter) =

114 | P a g e
Ww x Ds where Ws
Ww = wet weight of material from hole Ds = density of sand Ws = weight of sand used
B Calculate the moisture content as follows:
Moisture Content, % = A
B
x 100 where B
A = weight of wet sample B = weight of dry sample
B Calculate the in-place dry density of the material removed from the hole, as follows: In-Place Dry Density, pounds per cubic foot (kilograms per cubic meter) =
Dw
100 M x 100 where
Dw = in-place wet density M = moisture content in percent
B The percent compaction is calculated from the maximum dry density as determined by GDT 24 on GDT 49
whichever is applicable and the above in-place dry density using the following formula:
% Compaction = inplace dry density lb/ft3 (kg/m
3) x 100
maximum dry density lb/ft3 (kg/m
3)
NOTE: If the material being compacted contains less than 45% plus No. 10 (2 mm), but more than 10% retained on the 1 in (25 mm) sieve, determine the maximum dry density for use in compaction control according to GDT 7 or GDT 67 whichever is applicable.
F. Report No report is listed for this method.

115 | P a g e
GDT 39
A. Scope For a complete list of GDTs see the Table of Contents.
Use this test method to determine bulk specific gravity of specimens of compacted bituminous mixtures. These procedures are described:
Uncoated Specimens, Dense Graded Mixtures Only Paraffin Coated Specimens AASHTO T 331 is an approved alternative method to Paraffin Coating method.
B. Apparatus
The apparatus consists of the following:
Balance: Use a balance having a capacity of 10 lb (4.5 kg) or more and sensitive to 0.0002 lbs (0.1 g) or less.
Apparatus: The suspension apparatus shall be constructed to enable the unit (wire basket or container) and the specimen to be immersed in water suspended by wire from the center of a weighing device to a depth sufficient to cover it and the test specimen during weighing.
Water bath or Container: for immersing specimens in water while suspended under a weighing device. The water bath or container shall be equipped with an overflow outlet to maintaining a constant water level.
L. Sample Size and Preparation
1. Make test specimens from either laboratory-molded bituminous mixtures or cut or cored compacted pavements. Do not distort, bend, or crack specimens during and after removal from pavement or mold.
2. Store specimens in a safe, cool place.
3. Ensure specimens are free from foreign materials such as seal coat, tack coat, foundation material, soil,
or paper. Separate specimens from other pavement layers by sawing.
M. Procedures 1. Uncoated Specimens
Note: When roadway cores are saturated with water, conduct the following steps in this order: 4, 5, 1, 2, 3, and 6.
G. Dry the specimen to a constant weight. Constant weight is attained when further drying at 110 °, ± 9 °F (43.5 °, ± 5 °C) will not alter the weight 0.0002 lbs (0.1 g).
H. Cool the specimen to room temperature.
I. Weigh the uncoated specimen.
1. Determine the dry weight of the specimen to the nearest 0.0002 lbs (0.l g).
2. Designate this weight as “A”.
J. Weigh the specimen in water.
1. Place the specimen on an immersed in suspension device, in water, at room temperature for
1 to 4 minutes or until a constant weight is obtained. 2. Leave the specimen in the water and weigh to the nearest 0.0002 lbs (0.1 g). 3. Designate this weight as “C”.
K. Weigh the surface-dry specimen.
1. Remove the specimen from the water.

116 | P a g e
f. Dry the surface by blotting with a damp cloth (damp is when no water can be wrung out).
g. Weigh the specimen to determine the surface-dry weight.
h. Designate this weight as “B”. h. Calculate the bulk specific gravity of the uncoated test specimen as follows:
A
Bulk Specific Gravity
where
B C
A = weight of dry sample in air in grams B = weight of surface-dry sample in air in grams C = weight of sample in water in grams
I. Calculate the percent of water absorbed by the specimen (on a volume basis) as follows:
If the percent of water absorbed by the specimen as calculated exceeds 2.0 percent, use the Paraffin Coating Method to determine Bulk Specific Gravity. AASHTO T 331 is the recommended alternative to the Paraffin Coating Method for specimens with water absorbed results that exceeds 2.0 percent of water by volume.
D. Paraffin Coating
Dry the specimen to a constant weight. Constant weight is attained when further drying at 110°, ± 9° F
(43.5 °, ± 5 °C) will not alter the weight 0.0002 (0.1 g).
Cool the specimen to room temperature.
Weigh the uncoated specimen.
Determine the dry weight of the specimen to the nearest0.0002 (0.l g).
Designate this weight as “A”.
Weigh the coated specimen.
Preheat the paraffin to 130 ° to 150 °F (54 ° to 66 °C).
Coat the test specimen on all surfaces with paraffin thick enough to seal all surface voids. Apply the coat in one of two ways: either use a paint brush to apply the hot paraffin or dip the specimen in the heated paraffin and brush more on to seal all pin-point holes.
Determine the dry weight of the test specimen at room temperature. Weigh to the nearest
0.0002 lbs (0.1 g).
Designate this weight as “D”.
Note: If you want to use the specimen for further tests that require removing the paraffin coating, dust the specimen with talc before applying the paraffin.
C. Weigh the coated specimen in water.
1. Place the paraffin-coated specimen in the wire basket.
2. Immerse the basket in water at room temperature.
3. Weigh to the nearest 0.0002 (0.l g).
4. Designate this weight as “C”. H. Calculate the bulk specific gravity of the test specimen as follows:

117 | P a g e
A = Weight in grams of the specimen before paraffin coating in air D = Weight in grams of the paraffin-coated specimen in air C = Weight in grams of the paraffin-coated specimen in water b. = Bulk specific gravity of the paraffin
C Calculations Determine the density of a specimen taken from compacted mixture as follows:
Roadway Core Density = Bulk Specific Gravity of Specimen * Specific Gravity of Water (62.4)
Determine the in-place air voids of a specimen taken from compacted mixture as follows:
{(100) – [(Density of Specimen ÷ Theoretical density) * (100)]}
NOTE: Target Specific Gravity is the Actual Specific Gravity as shown on the job mix formula or the Specific Gravity obtained on the project control strip. B Report
13. Calculate the specific gravity to the nearest 0.001.
14. Report density to the nearest 0.1 on form OMR-TM-150 and 159-5
15. Report voids to the nearest 0.1 on Form OMR-TM-150 and 159-5.

118 | P a g e
GDT 59
A. Scope For a complete list of GDTs, see the Table of Contents.
Use this test method to determine the in-place density of roadway materials using a nuclear moisture and density gauge.
B. Apparatus
The apparatus consists of the following:
Surface Moisture and Density Gauge
Standard Block
Drill Rod and handle
Base Plate
Manufacturer's Instruction Manual
Shipping or Storage Case with required Labeling
Balances: Use balances capable of weighing compacted material plus mold.
N. Gauge Operation
1. To operate the nuclear gauge, follow the procedures shown in the Manufacturer's Instruction Manual accompanying each gauge.
2. Establish both density and moisture standard counts at least at the beginning of each day of testing. Take
the moisture standard count more frequently if the humidity changes considerably between test sites.
3. Allow the gauge to warm up for 15 minutes before reading the counts.
4. Take the standard counts at least 10 ft (3 m) from any large object such as a wall, vehicle or heavy equipment and at least 33 ft (10 m) from any other radioactive source.
5. Test with the deepest mode the conditions and material thickness will allow.
6. It is critical to the accuracy of the test that the gauge rest flat on the surface of the material being tested. Excessive
voids cracks or small depressions should be filled with sand, cement or native fines taking care to fill only the voids. Remove excess fines to insure the gauge rest on the material being tested and not the added fines.
7. Do not utilize the in-place moisture from the gauge when the material is excessively wet or dry. A “flame dry”
moisture shall be utilized for determining In-Place moisture in these cases. In all cases, take extreme care when testing material which is excessively wet or dry.
Note: Excessively wet material is when the material is spongy, boggy, or near saturation as shown by the zero air voids line in the Family of Curves in GDT 67. Excessively dry material is when the material is dusty, cracked, crusty, or when the moisture content falls below the bottom of the slope lines in GDT 67.
L. Gauge Calibration
1. The direct transmission and backscatter moisture charts may be used as they appear, but you will need to adjust both direct transmission and backscatter moisture for aggregate base and sand bituminous, and backscatter density on asphalt concrete. The procedures for making these adjustments are outlined in the following paragraphs.
2. Backscatter Density for Asphaltic Concrete
3. Make a field adjustment based on a correlation test with cores. You may use the adjustment for subsequent
testing and on later projects with the same set of conditions.
4. Asphaltic concrete less than 1-1/4 in (32 mm) thick: Field-calibrate to each type of underlying material, such as asphaltic concrete, surface treatment, soil-cement, etc. Establish another adjustment for any change in the source of aggregate or type of mix being placed.
Note*** For thickness less than 1-1/4 in (32 mm) consider GDT-39 as the preferred method for determining density.
5. Asphaltic Concrete greater than 1-1/4 in (32 mm) thick: Field-calibrate to each mix ID number and material
thickness placed. (Approved Field calibrations may be utilized on multiple projects when pavement conditions are near identical in terms of mix type, thickness and underlying pavement structure.)
6. Direct Transmission Density and Backscatter Moisture

119 | P a g e
GDT 59
Make field adjustments for direct transmission density and backscatter moisture for aggregate bases, subbases, and drainage material for each source.
Verify the theoretical density and Optimum Moisture for aggregate bases, subbases, and drainage material by performing at least one GDT 49 comparison each year for each active quarry.
Site Preparation for Subgrade, Embankment, and Backfill
Remove material to a depth greater than the deepest penetration of the compaction equipment when sheepfoot
rollers are utilized. The area should be at least 2 ft² (0.2 m²) and plane enough so the gauge bottom touches the material.
Pat native fines into minor depressions or surface voids with the base plate.
Subtract gauge wet density from the gauge moisture pcf to obtain the dry density.
Divide the gauge dry density by the maximum dry density from the appropriate page of the GDT-67 curves for
compaction.
D. Procedures Correlation Tests
Adjust field densities and moistures by comparing the nuclear gauge test and the conventional test—total density, wet density, or moisture in pounds per cubic foot (kilograms per cubic meter), whichever applies.
Direct Transmission and Backscatter Density
Perform a minimum of three nuclear density and three conventional density tests to determine
density offset.
Note: Five tests are preferred for asphaltic concrete mixes
Locate the conventional test site directly beneath the center of the gauge for cores and 2 inches behind
the drill rod hole for GDT-20 or GDT-21.
Correction (Offset) of the Nuclear Gauge to Conventional Density Tests
Determine the average of the nuclear gauge densities.
Obtain the average conventional densities.
Note: To convert the specific gravity of cores to pcf, multiply the specific gravity by 62.4 pcf. Use the average conventional densities and average nuclear gauge densities in pcf to determine the needed density result. Subtract the average gauge densities in step E.1.b.1 by the average conventional densities in step E.1.b.2 to get the needed offset. If the average conventional density is higher than the average gauge density the offset will be positive (+). If the average conventional density is lower than the average gauge density the offset will be negative (-). Add or subtract the offset factor from each density for that particular material. Use the offset factor to calculate each nuclear gauge density. Compare nuclear and conventional results. If the averages differ by more than 0.5 pcf, check your values and recalculate. If recalculation fails, recalibrate.
E Moisture Correlation of the Nuclear Gauge
Determine the moisture content in aggregate bases and subbases.
Note: Moisture correlation is not typically required for subgrade, backfill and embankment
materials. a. Moisture Correlation Procedure for Aggregate Bases and Subbases
a Perform a minimum of three nuclear gauge moisture/density tests and three flame dry moisture tests to determine gauge offset.
b The flame dry samples are to be taken from the material directly below the gauge and wet weights
obtained immediately to ensure accuracy of moisture content. c Test for direct transmission density at each location to determine the moisture offset in pcf as follows.

120 | P a g e
GDT 59
Where:
A = In-place wet density by direct transmission B = Percent moisture by drying a sample of material from the appropriate depth C = Corrected in-place dry density D = In-place moisture (pcf ) by flame dry E = Original gauge moisture (pcf)
C Correct in-place dry density by flame dry moisture (for each of three sites)
[ ]
B Calculate in-place moisture (pcf) by flame dry (for each of three sites)
C Determine moisture offset )) ) )
Subtract the average in-place moisture (pcf) by flame dry (D) from the average original gauge moisture (pcf) to get the needed offset. If the average flame dry is higher than the average gauge moisture the offset will be positive (+). If the average flame dry is lower than the average gauge moisture the offset will be negative (-).
b Density Analysis
Backscatter (density of asphaltic concrete and moisture content of embankment and bases)
(3) Place the gauge securely and flat on the test site.
(4) Check density for 1 minute.
Direct Transmission (wet density of bases and soils)
(3) Bases, and subbases, place the base plate on the test site.
(4) Drive the drill pin through the guide hole at least 2 in (50 mm) deeper than the depth to be tested.
(5) When required pat native fines into minor depressions or surface voids with the base plate.
(6) Move the plate and lower the source rod into the hole to the desired test depths (2, 4, 6, 8 10, 12 in
[50, 100, 150, 200, 250, 300 mm]).
3. Calculations a. Asphaltic Concrete:
[ ]
c. Bases, Subbases, Subgrade, Backfill, and Embankment
Dry density, wet density, and moisture are in pounds per cubic foot (kilograms per cubic
meter). Use the following formula to calculate Dry Density directly from Gauge readings. )
Use the following formula to correct the In-Place dry density based on the flame dry moisture content. Corrected [ ]

121 | P a g e
GDT 67
A. Scope For a complete list of GDTs, see the Table of Contents. Use this test method to determine the relation between moisture content and density of soils using the Families of Moisture-Density Curves and the One-Point Proctor Test. See Table set 1 for the Family A Curve, Table set 2 for the Family B Curve, and Table set 3 for the Family C Curve. This method establishes the “theoretical” maximum dry density for soils having less than 45 percent retained on the No. 10 (2.00 mm) sieve. You may use this method in lieu of GDT 7 and GDT 24a for classification purposes and field compaction control of embankment, subgrade, and soil bases.
B. Apparatus The apparatus is the same as outlined in GDT 7 with the following addition:
F. Mold Support: Use a concrete block at least 4 in (102 mm) thick, with a bottom surface area not less than 100 in² (64,520 mm²) and weighing not less than 35 lbs (15.9 kg). Place the block on the roadway to support the mold during compacting.
The upper surface of the block is formed to fit a specific mold base plate, so carefully clean the base and place it on the block the same way each time. Do not rest the block on soil that is considerably above optimum or pumping. Exercise caution to prevent any motion of the mold, or any part of it, during the compaction.
G. Curves: The Office of Materials and Research has established three Families of Moisture and Density Curves, lettered A, B, and C, for use with materials found within the State. The families are:
Family A materials are predominately sandy materials. Family B materials are sand and clayey sand. Family C materials are sand-clay, sandy-silty clay, silty clay, micaceous clay, shale, saprolite, and cherty
clay. H. Sample Size and Preparation
1. One-Point Proctor
a. Take the sample from the roadway and break up any clumps.
b. Thoroughly mix the sample with the appropriate quantity of water to bring it near optimum.
1) If the material is above optimum, dry 2,000 or 3,000 g.
2) Let the sample cool.
3) Thoroughly mix back enough water to bring it near optimum moisture (follow the precautions in step 2).
c. Compact the prepared material in three layers into the 1/30 ft³ (0.0009 m³) density mold.
1) Compact each layer with 25 blows from the 5.5 pound (2.5 kg) rammer dropped from 12 in
(300 mm) above the soil.
2. Precautions
a. Material Too Wet
1) Occasionally the “wet density” versus “moisture” plot will fall above the top of the slope lines. This indicates that the material is excessively wet and must be dried to fit the curve.
2) Dry the entire samples to a constant weight.
3) Let the samples cool.
4) Mix the material to a uniform moisture content (without visible clay lumps) and recompact it to determine a new wet density and moisture content.

122 | P a g e
GDT 67
Do not add the dry soil used to determine the moisture content to the entire sample.
Material Too Dry
If the material is too dry, the plot of “wet density” versus “moisture” will fall below the slope lines of the curve. When this occurs, do not extend the slope lines to the plotted point.
Mix the soil with appropriate amount of water to a uniform condition and recompact it.
Determine the new wet density and moisture content.
Nuclear Gauge Moisture
If you change the soil moisture content for the One-Point Proctor before compacting the
sample into the mold, you must dry a sample for the One-Point Proctor.
If the in-place moisture percent is within +1 percent or -3 percent of optimum moisture, you may use the nuclear gauge moisture in the in-place density or one-point determination.
If the in-place moisture percent is outside +1 percent or -3 percent of optimum moisture, do
not use the nuclear gauge moisture unless you correct the gauge.
E. Procedures Family Section
Determine the type of material tested by visual inspection or gradation analysis, if available, and select the appropriate family of curves.
One-Point Proctor
Determine the wet density of the One-Point Proctor in pounds per cubic foot from the proper family density chart or as follows:
Wet Density = K(W2 - W1)
where: K = Constant, multiplication factor for mold when calibrated by the method in AASHTO T 19 W1 = Weight of
mold W2 = Weight of mold + wet soil
3 Determine the moisture content in the mold.
f. Take a 1.1 lb (500 g) sample of the wet material equally from all three layers of the compacted soil.
Note: If you took the moisture sample from the material before compacting it in the mold, determine the wet weight and compact the sample quickly, before the material dries further. 2) Dry to a constant weight and calculate the percent moisture as follows: % Moisture = A - B x 100 B where: A = Weight of wet soil B = Weight of dry
soil
a Use the moisture percent determined by a surface moisture and density gauge on the in-place material in-place for the One Point Proctor moisture content if you did not adjust the moisture of the sample (follow the precautions in Sample Size and Preparation, step 2).
F. Plot the Maximum Dry Density and Optimum Moisture
1 Plot “wet density” versus “moisture” as determined from the One-Point Proctor on the
appropriate family of curves. The plot should fall on or between the slope lines to be a valid test.
2 Follow a line from the plotted points, parallel to the existing slope lines, to the line of optimums.
3 The percent moisture directly under this point of intersection is considered the optimum moisture.

123 | P a g e
GDT 67
a From the line of optimums, follow parallel with the straight diagonal lines to the “zero air voids”
curve. This curve shows the dry density in pounds per cubic foot (kilograms per cubic meter). The point of intersection is considered the maximum dry density of the material.
B Calculations 3) Calculate wet density:
Wet Density = K(W2 - W1)
where: K = Constant, multiplication factor for mold when calibrated by the method in AASHTO T 19 W1 =
Weight of mold W2 = Weight of mold + wet soil
4) Calculate percent moisture:
Moisture = A - B x 100 B where: A = Weight of wet soil B =
Weight of dry soil 3. Ensure accuracy of the numbers.
a. The values for Maximum Dry Density and Optimum Moisture as determined from any “Family of Curves” should be within 3 lb/ft³ (48 kg/m³) dry density and 2 percent moisture of that obtained by GDT 7.
If the values are not within these limits, or if you question the compaction at any specific area, take samples and use GDT 7 to perform a theoretical density test.
4. Check operator precision.
a. For repeat testing of a specific material to be valid and within a 95 percent confidence level, the operator must be within the following limits using any Family of Curves for maximum dry density and optimum moisture:
Single Operator Multiple Operators
Maximum Dry Density- PCF (kg/m3) 2.0 3.0
Optimum Moisture (%) 1.0 2.0
F. Report Report the wet density and the percentage moisture for the material on Form 386.

124 | P a g e
GDT 67
CURVE ILLUSTRATION
5 ZERO AIR VOIDS
2
1
0
2
1
5
135 1
1
0
1
1
130
(PC
F) LINE OF OPTIMUMS
125
WE
T D
EN
SIT
Y
SLOPE LINES
120
MOISTURE %
5 10 15 20
EXAMPLE
ONE POINT PROCTOR FAMILY OF CURVES
Wet Density = 124 PCF Maximum Dry Density = 115-5 PCF
Moisture = 105% Optimum Moisture = 13-7%
135
130
125
120 (PC
F)
DE
NS
ITY
115
WE
T
110
105 100
5
FAMILY A 0
2
1
5 ZERO AIR VOIDS 1
1
0 1 1 5 0 1 0 0 1 5 9 0 9
SOIL DESCRIPTION PREDOMINATELY SANDY MATERIALS
MOISTURE % 10 15 20 25 30 35

125 | P a g e
GDT 67
GDT 67 Table Set 1—Family of Curves, Theoretical Density-Moisture Chart Table 1 A Curve; Table A Overview

126 | P a g e
% Moisture
Wet Density (pcf)
5.0-10.0 10.5-15.5
98.5 to 107.0 A-1 A-2 107.5 to 116.0 A-3 A-4 116.5 to 125.0 A-5 A-6 125.5 to 131.0 A-7 X

127 | P a g e
GDT 67 Table 2 A Curve – Table A-1
5.0 5.5 6.0 6.5 7.0 7.5 8.0 8.5 9.0 9.5 10.0 98.5 0.0 0.0 0.0 0.0 0.0 0.0 0.0 0.0 0.0 92.3 91.8 0.0 0.0 0.0 0.0 0.0 0.0 0.0 0.0 0.0 14.9 15.3 99.0 0.0 0.0 0.0 0.0 0.0 0.0 0.0 0.0 0.0 92.4 92.1 0.0 0.0 0.0 0.0 0.0 0.0 0.0 0.0 0.0 14.8 15.0 99.5 0.0 0.0 0.0 0.0 0.0 0.0 0.0 0.0 0.0 92.7 92.3 0.0 0.0 0.0 0.0 0.0 0.0 0.0 0.0 0.0 14.6 14.9 100.0 0.0 0.0 0.0 0.0 0.0 0.0 0.0 0.0 0.0 93.2 92.6 0.0 0.0 0.0 0.0 0.0 0.0 0.0 0.0 0.0 14.3 14.6 100.5 0.0 0.0 0.0 0.0 0.0 0.0 0.0 0.0 94.0 93.5 93.0 0.0 0.0 0.0 0.0 0.0 0.0 0.0 0.0 14.0 14.2 14.5 101.0 0.0 0.0 0.0 0.0 0.0 0.0 0.0 0.0 94.3 94.0 93.2 0.0 0.0 0.0 0.0 0.0 0.0 0.0 0.0 13.8 14.0 14.3 101.5 0.0 0.0 0.0 0.0 0.0 0.0 0.0 0.0 94.6 94.2 93.4 0.0 0.0 0.0 0.0 0.0 0.0 0.0 0.0 13.7 13.9 14.2 102.0 0.0 0.0 0.0 0.0 0.0 0.0 0.0 0.0 94.7 94.5 94.0 0.0 0.0 0.0 0.0 0.0 0.0 0.0 0.0 13.6 13.7 14.0 102.5 0.0 0.0 0.0 0.0 0.0 0.0 0.0 95.5 95.1 94.8 94.3 0.0 0.0 0.0 0.0 0.0 0.0 0.0 13.3 13.4 13.6 13.8 103.0 0.0 0.0 0.0 0.0 0.0 0.0 0.0 96.0 95.5 95.0 94.6 0.0 0.0 0.0 0.0 0.0 0.0 0.0 13.1 13.3 13.5 13.7 103.5 0.0 0.0 0.0 0.0 0.0 0.0 0.0 96.4 95.8 95.3 94.9 0.0 0.0 0.0 0.0 0.0 0.0 0.0 12.8 13.1 13.3 13.5 104.0 0.0 0.0 0.0 0.0 0.0 0.0 97.2 96.8 96.2 95.8 95.1 0.0 0.0 0.0 0.0 0.0 0.0 12.5 12.7 12.9 13.1 13.4 104.5 0.0 0.0 0.0 0.0 0.0 98.2 97.5 97.1 96.5 96.1 95.5 0.0 0.0 0.0 0.0 0.0 12.2 12.4 12.5 12.8 13.0 13.3 105.0 0.0 0.0 0.0 0.0 0.0 98.6 98.1 97.7 97.0 96.5 96.0 0.0 0.0 0.0 0.0 0.0 12.0 12.2 12.4 12.7 12.8 13.0 105.5 0.0 0.0 0.0 0.0 0.0 99.0 98.6 98.0 97.4 96.8 96.3 0.0 0.0 0.0 0.0 0.0 11.9 12.0 12.3 12.4 12.7 12.9 106.0 0.0 0.0 0.0 0.0 100.1 99.6 99.0 98.4 97.9 97.3 96.6 0.0 0.0 0.0 0.0 11.5 11.6 11.9 12.1 12.3 12.5 12.8 106.5 0.0 0.0 0.0 0.0 100.2 99.9 99.3 98.8 98.2 97.8 97.1 0.0 0.0 0.0 0.0 11.4 11.5 11.7 12.0 12.2 12.3 12.5 107.0 0.0 0.0 0.0 0.0 101.0 100.6 99.8 99.3 98.7 98.1 97.7 0.0 0.0 0.0 0.0 11.2 11.3 11.5 11.7 12.0 12.2 12.4

128 | P a g e
GDT 67 Table 3 A Curve – Table A-2
10.5 11.0 11.5 12.0 12.5 13.0 13.5 14.0 14.5 15.0 15.5 98.5 91.4 91.2 90.5 90.6 90.4 90.2 0.0 0.0 0.0 0.0 0.0 15.4 15.5 15.7 16.1 16.2 16.4 0.0 0.0 0.0 0.0 0.0 99.0 91.8 91.3 91.1 90.7 90.5 90.2 0.0 0.0 0.0 0.0 0.0 15.2 15.4 15.6 16.0 16.1 16.4 0.0 0.0 0.0 0.0 0.0 99.5 92.0 91.6 91.4 91.0 90.7 90.3 90.1 0.0 0.0 0.0 0.0 15.1 15.3 15.4 15.7 16.0 16.3 16.5 0.0 0.0 0.0 0.0 100.0 92.2 91.9 91.6 91.2 90.8 90.6 90.3 0.0 0.0 0.0 0.0 14.9 15.2 15.3 15.5 15.8 16.1 16.3 0.0 0.0 0.0 0.0 100.5 92.6 92.1 91.8 91.5 91.0 90.7 90.5 90.1 0.0 0.0 0.0 14.6 15.0 15.2 15.4 15.6 16.0 16.1 16.5 0.0 0.0 0.0 101.0 92.8 92.3 92.0 91.6 91.1 90.8 90.6 90.3 0.0 0.0 0.0 14.5 14.9 15.1 15.3 15.6 15.8 16.1 16.3 0.0 0.0 0.0 101.5 93.2 92.6 92.3 91.8 91.5 91.0 90.7 90.5 90.1 0.0 0.0 14.3 14.6 14.9 15.2 15.4 15.6 16.0 16.1 16.5 0.0 0.0 102.0 93.6 93.0 92.6 92.2 91.8 91.3 90.9 90.6 90.3 90.0 0.0 14.2 14.5 14.6 14.9 15.2 15.4 15.7 16.1 16.3 16.6 0.0 102.5 94.0 93.3 92.9 92.3 92.0 91.6 91.1 90.7 90.5 90.2 0.0 14.0 14.3 14.5 14.9 15.1 15.3 15.6 16.0 16.1 16.4 0.0 103.0 94.3 93.8 93.3 92.6 92.3 91.8 91.5 91.0 90.7 90.4 90.0 13.8 14.1 14.3 14.6 14.9 15.2 15.4 15.6 16.0 16.2 16.6 103.5 94.6 94.2 93.6 93.0 92.6 92.0 91.7 91.3 90.9 90.5 90.2 13.2 13.9 14.3 14.5 14.6 15.1 15.3 15.4 15.7 16.1 16.4 104.0 94.9 94.4 94.0 93.4 93.0 92.4 92.0 91.6 91.2 90.7 90.1 13.5 13.8 14.0 14.2 14.5 14.8 15.1 15.3 15.6 16.0 16.5 104.5 95.1 94.7 94.3 93.8 93.1 92.7 92.3 91.8 91.5 91.0 90.7 13.4 13.6 13.8 14.1 14.4 14.6 14.9 15.2 15.4 15.6 16.0 105.0 95.5 95.0 94.7 94.2 93.7 93.1 92.7 92.1 91.7 91.4 90.8 13.3 13.5 13.6 13.9 14.2 14.4 14.6 15.1 15.3 15.4 15.8 105.5 95.8 95.3 95.0 94.5 94.0 93.3 92.9 92.5 92.1 91.5 91.1 13.1 13.3 13.5 13.7 14.0 14.3 14.5 14.8 15.0 15.4 15.6 106.0 96.3 95.8 95.3 94.8 94.4 94.0 93.3 92.9 92.4 92.0 91.6 12.9 13.1 13.3 13.6 13.8 14.0 14.3 14.5 14.8 15.1 15.3 106.5 96.7 96.1 95.7 95.0 94.7 94.3 93.8 93.2 92.8 92.3 91.9 12.8 13.0 13.2 13.5 13.6 13.8 14.1 14.3 14.5 14.9 15.2 107.0 97.0 96.4 96.1 95.5 95.1 94.7 94.1 93.7 93.1 92.6 92.3 12.7 12.8 13.0 13.3 13.4 13.6 14.0 14.2 14.4 14.6 14.9

129 | P a g e
GDT 67 Table 4 A Curve – Table A-3
5.0 5.5 6.0 6.5 7.0 7.5 8.0 8.5 9.0 9.5 10.0 107.5 0.0 0.0 0.0 0.0 101.4 101.0 100.1 99.7 99.1 98.6 97.9 0.0 0.0 0.0 0.0 11.0 11.2 11.4 11.6 11.8 12.0 12.3
108.0 0.0 0.0 0.0 0.0 101.7 101.3 100.8 100.0 99.4 99.1 98.4 0.0 0.0 0.0 0.0 10.9 11.1 11.3 11.5 11.7 11.8 12.1
108.5 0.0 0.0 0.0 102.9 102.2 101.7 101.1 100.7 99.9 99.3 98.9 0.0 0.0 0.0 10.7 10.8 10.9 11.2 11.3 11.5 11.7 11.9
109.0 0.0 0.0 0.0 103.2 102.7 102.3 101.6 101.1 100.5 99.9 99.4 0.0 0.0 0.0 10.6 10.7 10.8 11.0 11.2 11.3 11.5 11.6
109.5 0.0 0.0 0.0 103.7 103.1 102.6 102.0 101.4 100.9 100.4 99.6 0.0 0.0 0.0 10.6 10.6 10.7 10.9 11.0 11.2 11.4 11.6
110.0 0.0 0.0 104.4 104.0 103.5 103.1 102.4 102.0 101.3 100.9 100.0 0.0 0.0 10.2 10.3 10.4 10.6 10.7 10.9 11.1 11.3 11.5
110.5 0.0 0.0 104.9 104.2 103.7 103.4 102.7 102.3 101.7 101.1 100.6 0.0 0.0 10.1 10.2 10.4 10.5 10.7 10.8 10.9 11.2 11.3
111.0 0.0 0.0 105.3 104.9 104.1 103.7 103.1 102.7 102.3 101.6 101.0 0.0 0.0 10.0 10.1 10.3 10.4 10.6 10.7 10.8 11.0 11.2
111.5 0.0 0.0 105.6 105.2 104.6 104.1 103.6 103.0 102.5 102.1 101.4 0.0 0.0 9.9 10.0 10.2 10.3 10.4 10.6 10.7 10.8 11.1
112.0 0.0 0.0 106.4 105.6 105.0 104.5 103.9 103.5 103.0 102.4 102.0 0.0 0.0 9.7 9.9 10.1 10.2 10.3 10.4 10.6 10.7 10.9
112.5 0.0 0.0 106.7 106.2 105.3 105.0 104.2 103.8 103.4 102.8 102.3 0.0 0.0 9.7 9.8 10.0 10.1 10.2 10.3 10.4 10.6 10.8
113.0 0.0 0.0 107.2 106.7 105.7 105.4 104.9 104.2 103.7 103.3 102.7 0.0 0.0 9.6 9.7 9.9 10.0 10.1 10.2 10.3 10.5 10.7
113.5 0.0 0.0 107.4 107.0 106.3 105.6 105.1 104.7 104.0 103.7 103.2 0.0 0.0 9.6 9.7 9.8 9.9 10.1 10.1 10.3 10.3 10.6
114.0 0.0 0.0 107.9 107.5 106.9 106.4 105.6 105.2 104.7 104.0 103.6 0.0 0.0 9.5 9.6 9.7 9.7 9.9 10.0 10.1 10.3 10.4
114.5 0.0 0.0 108.2 107.8 107.2 106.8 106.0 105.5 105.0 104.4 104.0 0.0 0.0 9.5 9.5 9.6 9.7 9.8 10.0 10.1 10.2 10.3
115.0 0.0 109.4 109.0 108.2 107.7 107.2 106.7 106.2 105.5 105.0 104.6 0.0 9.4 9.4 9.5 9.5 9.6 9.7 9.8 10.0 10.1 10.2
115.5 0.0 109.7 109.4 108.9 108.0 107.6 107.0 106.5 105.8 105.4 105.0 0.0 9.3 9.4 9.4 9.5 9.5 9.7 9.7 9.9 10.0 10.1
116.0 0.0 110.1 109.6 109.1 108.4 107.9 107.5 107.0 106.4 105.8 105.4 0.0 9.3 9.3 9.4 9.4 9.5 9.6 9.7 9.7 9.9 10.0

130 | P a g e
GDT 67 Table 5 A Curve – Table A-4
10.5 11.0 11.5 12.0 12.5 13.0 13.5 14.0 14.5 15.0 15.5 107.5 97.6 96.9 96.4 95.8 95.4 94.9 94.6 94.0 93.6 93.1 92.7 12.4 12.7 12.8 13.1 13.3 13.5 13.7 14.0 14.2 14.4 14.6
108.0 98.0 97.3 96.8 96.4 95.9 95.3 94.9 94.5 94.0 93.5 93.1 12.3 12.5 12.7 12.8 13.1 13.3 13.5 14.3 14.0 14.2 14.4
108.5 98.4 97.8 97.3 96.8 96.3 95.8 95.3 94.6 94.3 94.0 93.8 12.1 12.3 12.5 12.7 12.9 13.1 13.3 13.7 13.8 14.0 14.1
109.0 99.0 98.2 97.7 97.2 96.7 96.1 95.7 95.3 95.0 94.5 94.0 11.9 12.2 12.4 12.5 12.8 13.0 13.2 13.3 13.5 14.3 14.0
109.5 99.3 98.7 98.1 97.7 97.1 96.6 96.2 95.7 95.3 95.0 0.0 11.7 12.0 12.2 12.4 12.5 12.7 12.9 13.2 13.3 13.5 0.0
110.0 99.6 99.1 98.6 98.0 97.6 97.1 96.6 96.2 95.9 95.5 0.0 11.6 11.8 12.0 12.3 12.4 12.5 12.7 12.9 13.1 13.3 0.0
110.5 100.0 99.4 99.1 98.5 98.1 97.6 97.2 96.7 96.3 0.0 0.0 11.5 11.7 11.8 12.0 12.2 12.4 12.5 12.8 12.9 0.0 0.0
111.0 100.6 99.9 99.5 99.0 98.7 98.1 97.6 97.3 96.9 0.0 0.0 11.3 11.5 11.7 11.9 12.0 12.2 12.4 12.5 12.7 0.0 0.0
111.5 101.0 100.4 99.8 99.5 99.0 98.5 98.3 97.8 0.0 0.0 0.0 11.2 11.4 11.5 11.7 11.9 12.0 12.2 12.3 0.0 0.0 0.0
112.0 101.4 100.9 100.3 99.8 99.5 99.1 98.8 98.3 0.0 0.0 0.0 11.0 11.2 11.4 11.5 11.7 11.8 12.0 12.1 0.0 0.0 0.0
112.5 101.8 101.3 100.8 100.3 99.9 99.6 99.2 0.0 0.0 0.0 0.0 10.9 11.1 11.2 11.4 11.5 11.6 11.8 0.0 0.0 0.0 0.0
113.0 102.3 101.8 101.3 100.8 100.4 99.4 0.0 0.0 0.0 0.0 0.0 10.8 10.9 11.1 11.3 11.4 11.5 0.0 0.0 0.0 0.0 0.0
113.5 102.7 102.2 101.7 101.3 100.9 100.5 0.0 0.0 0.0 0.0 0.0 10.7 10.8 10.9 11.1 11.2 11.3 0.0 0.0 0.0 0.0 0.0
114.0 103.1 102.6 102.2 101.8 101.4 101.2 0.0 0.0 0.0 0.0 0.0 10.6 10.7 10.8 10.9 11.0 11.1 0.0 0.0 0.0 0.0 0.0
114.5 103.6 103.1 102.7 102.2 101.9 0.0 0.0 0.0 0.0 0.0 0.0 10.5 10.6 10.7 10.8 10.9 0.0 0.0 0.0 0.0 0.0 0.0
115.0 104.0 103.6 103.3 102.8 102.5 0.0 0.0 0.0 0.0 0.0 0.0 10.4 10.5 10.5 10.7 10.7 0.0 0.0 0.0 0.0 0.0 0.0
115.5 104.6 104.0 103.7 103.4 0.0 0.0 0.0 0.0 0.0 0.0 0.0 10.2 10.4 10.4 10.5 0.0 0.0 0.0 0.0 0.0 0.0 0.0
116.0 105.0 104.5 104.1 103.8 0.0 0.0 0.0 0.0 0.0 0.0 0.0 10.1 10.2 10.3 10.4 0.0 0.0 0.0 0.0 0.0 0.0 0.0

131 | P a g e
GDT 67 Table 6 A Curve – Table A-5
5.0 5.5 6.0 6.5 7.0 7.5 8.0 8.5 9.0 9.5 10.0 116.5 0.0 110.7 110.1 109.4 108.9 108.2 107.7 107.5 106.9 106.3 105.8 0.0 9.2 9.3 9.3 9.4 9.5 9.5 9.6 9.7 9.8 9.9 117.0 0.0 111.1 110.5 110.0 109.4 108.9 108.3 107.8 107.3 106.9 106.3 0.0 9.1 9.2 9.3 9.3 9.4 9.4 9.5 9.6 9.7 9.8
117.5 0.0 111.3 110.8 110.4 109.6 109.2 108.7 108.1 107.5 107.2 106.8 0.0 9.1 9.2 9.3 9.3 9.4 9.4 9.5 9.6 9.6 9.7
118.0 112.8 112.2 111.8 110.8 110.3 109.6 109.1 108.8 108.0 107.6 107.2 9.0 9.0 9.1 9.2 9.3 9.3 9.4 9.4 9.5 9.5 9.6
118.5 113.1 112.7 112.0 111.1 110.4 110.1 109.4 109.0 108.5 108.0 107.6 9.0 9.0 9.1 9.2 9.3 9.3 9.3 9.4 9.4 9.5 9.5
119.0 113.8 113.3 112.5 112.0 111.1 110.5 110.1 109.5 109.0 108.6 108.0 9.0 9.0 9.1 9.1 9.2 9.2 9.3 9.3 9.4 9.4 9.5
119.5 114.3 113.7 113.3 112.4 111.9 110.9 110.4 110.1 109.5 109.1 108.6 8.9 9.0 9.0 9.1 9.1 9.2 9.3 9.3 9.3 9.4 9.4
120.0 115.2 114.8 113.6 113.0 112.3 111.9 111.0 110.4 110.1 109.6 109.2 8.8 8.9 9.0 9.0 9.1 9.1 9.2 9.3 9.3 9.3 9.4
120.5 115.6 115.0 114.1 113.4 112.8 112.2 111.8 110.9 110.5 110.0 109.6 8.8 8.9 8.9 9.0 9.0 9.1 9.1 9.2 9.3 9.3 9.3
121.0 117.1 116.6 114.9 114.0 113.3 112.7 112.1 111.6 111.0 110.4 110.0 8.7 8.7 8.8 8.9 9.0 9.0 9.4 9.1 9.2 9.3 9.3
121.5 117.4 117.0 115.1 114.7 113.8 113.4 112.5 112.0 111.4 110.9 110.5 8.7 8.7 8.8 8.9 9.0 9.0 9.1 9.1 9.1 9.2 9.3
122.0 118.7 117.2 116.6 115.0 114.6 113.9 113.3 112.6 112.0 111.5 111.0 8.7 8.7 8.7 8.9 8.9 8.9 9.0 9.0 9.1 9.1 9.2
122.5 119.0 118.3 117.8 115.5 114.9 114.1 113.5 113.1 112.6 112.0 111.8 8.7 8.7 8.7 8.8 8.8 8.9 9.0 9.0 9.0 9.1 9.1
123.0 119.2 118.8 117.3 116.7 115.4 114.8 114.2 113.8 113.0 112.8 112.4 8.6 8.7 8.7 8.7 8.8 8.9 8.9 9.0 9.0 9.0 9.1
123.5 0.0 0.0 0.0 0.0 0.0 0.0 0.0 0.0 113.5 113.1 112.9 0.0 0.0 0.0 0.0 0.0 0.0 0.0 0.0 9.0 9.0 9.0
124.0 0.0 0.0 0.0 0.0 0.0 0.0 0.0 0.0 114.1 113.5 113.1 0.0 0.0 0.0 0.0 0.0 0.0 0.0 0.0 8.9 9.0 9.0
124.5 0.0 0.0 0.0 0.0 0.0 0.0 0.0 0.0 114.4 114.1 113.8 0.0 0.0 0.0 0.0 0.0 0.0 0.0 0.0 8.9 8.9 9.0
125.0 0.0 0.0 0.0 0.0 0.0 0.0 0.0 0.0 114.9 114.6 114.2 0.0 0.0 0.0 0.0 0.0 0.0 0.0 0.0 8.8 8.9 8.9

132 | P a g e
GDT 67 Table 7 A Curve – Table A-6
10.5 11.0 11.5 12.0 12.5 13.0 13.5 14.0 14.5 15.0 15.5 116.5 105.5 105.0 104.7 104.3 0.0 0.0 0.0 0.0 0.0 0.0 0.0 10.0 10.1 10.2 10.2 0.0 0.0 0.0 0.0 0.0 0.0 0.0 117.0 105.8 105.6 105.3 104.9 0.0 0.0 0.0 0.0 0.0 0.0 0.0 9.9 9.9 10.0 10.1 0.0 0.0 0.0 0.0 0.0 0.0 0.0 117.5 106.3 106.0 105.7 0.0 0.0 0.0 0.0 0.0 0.0 0.0 0.0 9.8 9.8 9.9 0.0 0.0 0.0 0.0 0.0 0.0 0.0 0.0 118.0 109.6 106.5 106.2 0.0 0.0 0.0 0.0 0.0 0.0 0.0 0.0 9.7 9.7 9.8 0.0 0.0 0.0 0.0 0.0 0.0 0.0 0.0 118.5 107.3 107.1 0.0 0.0 0.0 0.0 0.0 0.0 0.0 0.0 0.0 9.6 9.6 0.0 0.0 0.0 0.0 0.0 0.0 0.0 0.0 0.0 119.0 107.7 107.4 0.0 0.0 0.0 0.0 0.0 0.0 0.0 0.0 0.0 9.5 9.6 0.0 0.0 0.0 0.0 0.0 0.0 0.0 0.0 0.0 119.5 108.3 107.8 0.0 0.0 0.0 0.0 0.0 0.0 0.0 0.0 0.0 9.4 9.5 0.0 0.0 0.0 0.0 0.0 0.0 0.0 0.0 0.0 120.0 109.0 108.5 0.0 0.0 0.0 0.0 0.0 0.0 0.0 0.0 0.0 9.4 9.4 0.0 0.0 0.0 0.0 0.0 0.0 0.0 0.0 0.0 120.5 109.3 109.0 0.0 0.0 0.0 0.0 0.0 0.0 0.0 0.0 0.0 9.4 9.4 0.0 0.0 0.0 0.0 0.0 0.0 0.0 0.0 0.0 121.0 109.8 109.6 0.0 0.0 0.0 0.0 0.0 0.0 0.0 0.0 0.0 9.3 9.3 0.0 0.0 0.0 0.0 0.0 0.0 0.0 0.0 0.0 121.5 110.2 110.0 0.0 0.0 0.0 0.0 0.0 0.0 0.0 0.0 0.0 9.3 9.3 0.0 0.0 0.0 0.0 0.0 0.0 0.0 0.0 0.0 122.0 110.9 0.0 0.0 0.0 0.0 0.0 0.0 0.0 0.0 0.0 0.0 9.2 0.0 0.0 0.0 0.0 0.0 0.0 0.0 0.0 0.0 0.0 122.5 111.7 0.0 0.0 0.0 0.0 0.0 0.0 0.0 0.0 0.0 0.0 9.1 0.0 0.0 0.0 0.0 0.0 0.0 0.0 0.0 0.0 0.0 123.0 112.4 0.0 0.0 0.0 0.0 0.0 0.0 0.0 0.0 0.0 0.0 9.1 0.0 0.0 0.0 0.0 0.0 0.0 0.0 0.0 0.0 0.0 123.5 112.9 0.0 0.0 0.0 0.0 0.0 0.0 0.0 0.0 0.0 0.0 9.0 0.0 0.0 0.0 0.0 0.0 0.0 0.0 0.0 0.0 0.0 124.0 113.1 0.0 0.0 0.0 0.0 0.0 0.0 0.0 0.0 0.0 0.0 9.0 0.0 0.0 0.0 0.0 0.0 0.0 0.0 0.0 0.0 0.0 124.5 113.8 0.0 0.0 0.0 0.0 0.0 0.0 0.0 0.0 0.0 0.0 9.0 0.0 0.0 0.0 0.0 0.0 0.0 0.0 0.0 0.0 0.0 125.0 114.2 0.0 0.0 0.0 0.0 0.0 0.0 0.0 0.0 0.0 0.0 8.9 0.0 0.0 0.0 0.0 0.0 0.0 0.0 0.0 0.0 0.0

133 | P a g e
GDT 67 Table 8 A Curve – Table A-7
5.0 5.5 6.0 6.5 7.0 7.5 8.0 8.5 9.0 9.5 10.0 125.5 0.0 0.0 0.0 0.0 0.0 0.0 0.0 0.0 115.3 115.0 114.8 0.0 0.0 0.0 0.0 0.0 0.0 0.0 0.0 8.8 8.8 8.8 126.0 0.0 0.0 0.0 0.0 0.0 0.0 0.0 0.0 115.8 115.5 115.3 0.0 0.0 0.0 0.0 0.0 0.0 0.0 0.0 8.8 8.8 8.8 126.5 0.0 0.0 0.0 0.0 0.0 0.0 0.0 0.0 116.3 115.7 115.7 0.0 0.0 0.0 0.0 0.0 0.0 0.0 0.0 8.8 8.8 8.8 127.0 0.0 0.0 0.0 0.0 0.0 0.0 0.0 0.0 116.7 116.4 116.4 0.0 0.0 0.0 0.0 0.0 0.0 0.0 0.0 8.7 8.8 8.8 127.5 0.0 0.0 0.0 0.0 0.0 0.0 0.0 0.0 117.1 117.0 117.0 0.0 0.0 0.0 0.0 0.0 0.0 0.0 0.0 8.7 8.7 8.7 128.0 0.0 0.0 0.0 0.0 0.0 0.0 0.0 0.0 117.5 117.3 117.3 0.0 0.0 0.0 0.0 0.0 0.0 0.0 0.0 8.7 8.7 8.7 128.5 0.0 0.0 0.0 0.0 0.0 0.0 0.0 0.0 118.0 117.7 117.6 0.0 0.0 0.0 0.0 0.0 0.0 0.0 0.0 8.6 8.7 8.7 129.0 0.0 0.0 0.0 0.0 0.0 0.0 0.0 0.0 118.5 118.2 118.1 0.0 0.0 0.0 0.0 0.0 0.0 0.0 0.0 8.6 8.6 8.6 129.5 0.0 0.0 0.0 0.0 0.0 0.0 0.0 0.0 119.0 118.8 118.7 0.0 0.0 0.0 0.0 0.0 0.0 0.0 0.0 8.6 8.6 8.6 130.0 0.0 0.0 0.0 0.0 0.0 0.0 0.0 0.0 119.4 119.3 119.2 0.0 0.0 0.0 0.0 0.0 0.0 0.0 0.0 8.6 8.6 8.6 130.5 0.0 0.0 0.0 0.0 0.0 0.0 0.0 0.0 119.8 119.7 119.7 0.0 0.0 0.0 0.0 0.0 0.0 0.0 0.0 8.6 8.6 8.6 131.0 0.0 0.0 0.0 0.0 0.0 0.0 0.0 0.0 120.2 119.8 119.8 0.0 0.0 0.0 0.0 0.0 0.0 0.0 0.0 8.5 8.6 8.6

134 | P a g e
GDT 67 GDT-67 Table Set 2— Family of Curves, Theoretical Density-Moisture Chart, B Curve Table 1: B Curve – Table B Overview
% Moisture Wet Density (pcf) 4.0–10.0 10.5-15.5 16.0-21.0 21.5-26.5 27.0-32.0 32.5-37.5
98.5 to 111.0 X B-1 B-2 B-3 B-4 B-5
111.5 to 120.0 B-6 B-7 B-8 B-9 B-10 B-11
120.5 to 129.0 B-12 B-13 B-14
129.5 to 137.5 B-15 B-16 X X X X
138.0 to 1440 X X X X X X
Table 2: B Curve – Table B-1
10.5 11.0 11.5 12.0 12.5 13.0 13.5 14.0 14.5 15.0 15.5 98.5 to 109.5 0.0 0.0 0.0 0.0 0.0 0.0 0.0 0.0 0.0 0.0 0.0 0.0 0.0 0.0 0.0 0.0 0.0 0.0 0.0 0.0 0.0 0.0 110.0 0.0 0.0 0.0 0.0 0.0 0.0 0.0 0.0 0.0 97.8 97.1 0.0 0.0 0.0 0.0 0.0 0.0 0.0 0.0 0.0 17.5 17.9 110.5 0.0 0.0 0.0 0.0 0.0 0.0 0.0 0.0 0.0 98.0 97.5 0.0 0.0 0.0 0.0 0.0 0.0 0.0 0.0 0.0 17.4 17.8 111.0 0.0 0.0 0.0 0.0 0.0 0.0 0.0 0.0 98.8 98.3 97.8 0.0 0.0 0.0 0.0 0.0 0.0 0.0 0.0 17.0 17.2 17.5

135 | P a g e
GDT 67 Table 3: B Curve – Table B-2
16.0 16.5 17.0 17.5 18.0 18.5 19.0 19.5 20.0 20.5 21.0 98.5 to 106.5 0.0 0.0 0.0 0.0 0.0 0.0 0.0 0.0 0.0 0.0 0.0 0.0 0.0 0.0 0.0 0.0 0.0 0.0 0.0 0.0 0.0 0.0 107.0 0.0 0.0 0.0 0.0 0.0 0.0 92.5 92.0 91.8 91.2 90.8 0.0 0.0 0.0 0.0 0.0 0.0 22.0 22.5 23.0 23.5 24.0 107.5 0.0 0.0 0.0 0.0 0.0 0.0 92.7 92.4 91.8 91.3 90.9 0.0 0.0 0.0 0.0 0.0 0.0 21.8 22.1 22.8 23.4 23.8 108.0 0.0 0.0 0.0 0.0 93.9 93.4 92.9 92.5 92.0 91.8 91.2 0.0 0.0 0.0 0.0 20.8 21.1 21.5 22.0 22.5 23.0 23.5 108.5 0.0 0.0 0.0 0.0 94.0 93.5 92.9 92.7 92.4 91.8 91.3 0.0 0.0 0.0 0.0 20.5 21.0 21.5 21.8 22.1 22.8 23.4
109.0 0.0 0.0 95.0 94.7 94.2 94.0 93.5 93.2 92.6 92.3 91.8 0.0 0.0 19.5 19.9 20.3 20.5 21.0 21.3 22.0 22.2 23.0
109.5 0.0 95.6 95.0 94.6 94.4 94.0 93.6 93.5 92.7 92.5 91.8 0.0 19.0 19.5 20.0 20.2 20.5 21.0 21.0 21.8 22.1 22.8
110.0 96.5 96.0 95.5 95.0 94.5 94.3 93.9 93.5 93.0 92.7 91.2 18.3 18.8 19.0 19.5 20.0 20.3 20.7 21.0 21.5 22.0 22.5
110.5 96.9 96.3 95.7 95.1 94.7 94.4 94.0 93.6 93.3 92.7 92.5 18.0 18.3 18.7 19.5 20.0 20.1 20.5 21.0 21.1 21.8 22.2
111.0 97.1 96.5 96.0 95.4 95.0 94.5 94.2 94.0 93.4 92.8 92.5 17.8 18.2 18.6 19.2 19.5 20.0 20.3 20.6 21.0 21.8 22.1

136 | P a g e
GDT 67 Table 4: B Curve – Table B-3
21.5 22.0 22.5 23.0 23.5 24.0 24.5 25.0 25.5 26.0 26.5 98.5 to 105.5 0.0 0.0 0.0 0.0 0.0 0.0 0.0 0.0 0.0 0.0 0.0 0.0 0.0 0.0 0.0 0.0 0.0 0.0 0.0 0.0 0.0 0.0
106.0 0.0 0.0 0.0 89.0 88.7 88.4 88.0 87.7 87.2 86.9 86.5 0.0 0.0 0.0 26.1 26.5 27.0 27.3 27.8 28.4 28.9 29.3
106.5 0.0 89.8 89.5 89.2 88.9 88.5 88.2 87.9 87.5 87.0 86.7 0.0 25.3 25.5 26.0 26.3 26.8 27.2 27.5 28.1 28.7 29.1 107.0 90.2 90.0 89.7 89.2 89.0 88.7 88.3 88.0 87.7 87.3 86.8 24.6 25.0 25.4 25.8 26.1 26.6 27.0 27.3 27.8 28.3 28.9
107.5 90.6 90.2 89.8 89.5 89.2 88.8 88.5 88.1 87.9 87.4 87.0 24.2 24.8 25.2 25.5 26.0 26.4 26.8 27.1 27.6 28.2 28.8
108.0 90.8 90.2 90.0 89.7 89.2 89.0 88.7 88.3 88.0 87.7 87.3 24.0 24.6 25.0 25.4 25.8 26.1 26.6 27.0 27.0 27.8 28.3
108.5 90.9 90.6 90.1 89.8 89.5 89.1 88.8 88.5 88.0 87.9 87.4 23.8 24.2 24.8 25.2 25.5 26.0. 26.4 26.9 27.4 27.6 28.2
109.0 91.3 90.8 90.5 90.0 89.8 89.5 89.2 88.7 88.5 88.0 87.5 23.4 24.0 24.5 25.0 25.2 25.8 26.0 26.5 27.0 27.5 28.0
109.5 91.3 91.0 90.5 90.0 89.9 89.5 89.3 88.8 88.5 88.0 87.6 23.2 23.7 24.0 25.0 25.1 25.5 26.0 26.5 26.9 27.5 28.0
110.0 91.7 91.2 90.8 90.5 90.1 89.9 89.5 89.0 88.7 88.5 88.0 23.0 23.4 24.0 24.5 24.9 25.1 25.8 26.1 26.5 27.0 27.5
110.5 91.8 91.5 90.8 90.6 90.5 90.0 89.6 89.3 88.8 88.5 88.1 22.9 23.1 23.9 24.1 24.4 25.0 25.5 25.8 26.4 27.0 27.2
111.0 92.1 91.7 91.4 90.8 90.5 90.2 89.8 89.5 89.0 88.6 88.4 22.6 23.0 23.3 23.9 24.5 24.8 25.2 25.7 26.2 26.6 27.0

137 | P a g e
GDT 67 Table 5: B Curve – Table B-4
27.0 27.5 28.0 28.5 29.0 29.5 30.0 30.5 31.0 31.5 32.0 98.5 to 104.5 0.0 0.0 0.0 0.0 0.0 0.0 0.0 0.0 0.0 0.0 0.0 0.0 0.0 0.0 0.0 0.0 0.0 0.0 0.0 0.0 0.0 0.0
105.0 0.0 0.0 84.6 84.2 83.8 83.5 83.1 82.8 82.3 82.0 81.5 0.0 0.0 31.2 31.7 32.1 32.6 33.1 33.7 34.5 34.9 35.5
105.5 0.0 0.0 84.9 84.4 84.0 83.6 83.2 83.0 82.5 82.1 81.8 0.0 0.0 31.0 31.5 32.0 32.5 33.0 33.4 34.0 34.5 35.1
106.0 86.0 85.5 85.0 84.6 84.2 83.9 83.5 83.1 82.8 82.3 81.9 30.0 30.4 30.8 31.2 31.7 31.7 32.6 33.1 33.7 34.4 34.9
106.5 86.1 85.7 85.1 84.9 84.4 84.0 83.7 83.3 82.8 82.4 82.1 29.8 30.2 30.6 31.0 31.4 32.0 32.5 33.0 33.6 34.1 34.5
107.0 86.3 86.0 85.4 85.0 84.6 84.3 83.9 83.4 83.0 82.7 82.3 29.4 30.0 30.4 30.8 31.3 31.6 32.1 32.8 33.0 33.8 34.3
107.5 86.5 86.1 85.5 85.1 84.9 84.4 84.0 83.7 83.3 82.9 82.5 29.2 29.8 30.3 30.6 31.0 31.4 32.0 32.5 33.0 33.4 34.0
108.0 86.8 86.3 86.0 85.4 85.0 84.6 84.3 83.9 83.4 83.0 82.7 28.9 29.4 30.0 30.4 30.8 31.3 31.6 32.1 32.8 33.3 33.8
108.5 87.0 86.4 86.1 85.5 85.1 84.9 84.4 84.0 83.7 83.2 82.9 28.8 29.1 29.8 30.3 30.6 31.0 31.4 32.0 32.5 33.0 33.4
109.0 87.2 86.9 86.5 86.0 85.5 85.0 84.7 84.5 84.0 83.6 83.2 28.4 28.9 29.4 30.0 30.4 30.7 31.2 31.4 32.0 32.6 33.1
109.5 87.4 87.0 86.5 86.2 85.7 85.2 85.0 84.6 84.0 83.8 84.0 28.1 28.6 29.2 29.8 30.2 30.5 31.0 31.3 32.0 32.4 31.1
110.0 87.5 87.4 86.9 86.5 86.0 85.5 85.0 84.8 84.5 84.0 83.6 28.0 28.2 28.9 29.2 30.0 30.3 30.8 31.0 31.4 32.0 32.5
110.5 87.8 87.5 87.0 86.7 86.4 86.0 85.5 85.0 84.7 84.3 83.8 27.8 28.0 28.6 29.0 29.5 30.1 30.4 30.8 31.3 31.7 32.1
111.0 88.0 87.6 87.4 86.6 86.5 86.3 85.9 85.1 84.8 84.5 84.0 27.5 28.0 28.4 29.0 29.2 29.6 30.1 30.5 31.0 31.4 31.9

138 | P a g e
GDT 67 Table 6: B Curve – Table B-5
32.5 33.0 33.5 34.0 34.5 35.0 35.5 36.0 36.5 37.0 37.5 98.5 to 103.5 0.0 0.0 0.0 0.0 0.0 0.0 0.0 0.0 0.0 0.0 0.0 0.0 0.0 0.0 0.0 0.0 0.0 0.0 0.0 0.0 0.0 0.0
104.0 0.0 80.5 80.3 80.2 0.0 0.0 0.0 0.0 0.0 0.0 0.0 0.0 36.5 37.0 37.2 0.0 0.0 0.0 0.0 0.0 0.0 0.0
104.5 0.0 80.6 80.4 80.1 80.0 0.0 0.0 0.0 0.0 0.0 0.0 0.0 36.5 36.8 37.1 37.4 0.0 0.0 0.0 0.0 0.0 0.0
105.0 81.1 80.9 80.5 80.2 80.1 0.0 0.0 0.0 0.0 0.0 0.0 35.9 36.0 36.5 37.0 37.2 0.0 0.0 0.0 0.0 0.0 0.0
105.5 81.3 81.0 80.7 80.4 80.2 80.0 0.0 0.0 0.0 0.0 0.0 35.6 36.0 36.3 36.6 37.1 37.4 0.0 0.0 0.0 0.0 0.0
106.0 81.5 81.1 80.9 80.5 80.3 80.0 0.0 0.0 0.0 0.0 0.0 35.5 35.8 36.0 36.5 37.0 37.3 0.0 0.0 0.0 0.0 0.0
106.5 81.7 81.4 81.0 80.7 80.4 80.2 80.0 0.0 0.0 0.0 0.0 35.3 35.6 36.0 36.3 36.8 37.1 37.5 0.0 0.0 0.0 0.0
107.0 81.9 81.5 81.1 80.9 80.5 80.3 80.1 0.0 0.0 0.0 0.0 35.0 35.5 35.8 36.0 36.5 37.0 37.3 0.0 0.0 0.0 0.0
107.5 82.1 81.8 81.9 81.0 80.7 80.4 80.3 80.0 0.0 0.0 0.0 34.6 35.1 35.7 36.0 36.3 36.8 37.0 37.5 0.0 0.0 0.0
108.0 82.3 81.9 81.5 81.1 80.9 80.5 80.3 80.1 0.0 0.0 0.0 34.3 35.0 35.5 35.8 36.0 36.5 37.0 37.3 0.0 0.0 0.0
108.5 82.5 82.1 81.8 81.3 81.0 80.7 80.4 80.3 80.0 0.0 0.0 34.0 34.6 35.1 35.7 36.0 36.3 36.8 37.0 37.4 0.0 0.0
109.0 82.9 82.4 82.1 81.8 81.3 81.0 80.5 80.3 80.1 80.0 0.0 33.5 34.0 34.5 35.0 35.7 36.0 36.5 36.8 37.0 37.4 0.0
109.5 83.0 82.5 82.2 82.0 81.6 81.2 81.0 80.5 80.3 80.0 0.0 33.4 34.0 34.5 35.0 35.5 35.8 36.0 36.5 37.0 37.3 0.0
110.0 83.5 83.0 82.5 82.1 82.0 81.5 81.3 81.0 80.5 0.0 0.0 33.0 33.4 34.0 34.6 35.0 35.2 35.5 36.0 36.5 0.0 0.0
110.5 83.5 83.1 82.9 82.7 82.3 82.0 81.6 81.4 0.0 0.0 0.0 32.7 33.0 33.5 34.0 34.4 34.8 35.4 35.5 0.0 0.0 0.0
111.0 83.9 83.5 83.4 83.0 82.6 0.0 0.0 0.0 0.0 0.0 0.0 32.3 32.7 33.0 33.5 34.1 0.0 0.0 0.0 0.0 0.0 0.0

139 | P a g e
GDT 67 Table 7: B Curve – Table B-6
5.0 5.5 6.0 6.5 7.0 7.5 8.0 8.5 9.0 9.5 10.0 111.5 to 118.5 0.0 0.0 0.0 0.0 0.0 0.0 0.0 0.0 0.0 0.0 0.0 0.0 0.0 0.0 0.0 0.0 0.0 0.0 0.0 0.0 0.0 0.0 118.5 0.0 0.0 0.0 0.0 0.0 0.0 0.0 0.0 0.0 0.0 109.5 0.0 0.0 0.0 0.0 0.0 0.0 0.0 0.0 0.0 0.0 13.0
119.0 0.0 0.0 0.0 0.0 0.0 0.0 0.0 0.0 0.0 0.0 110.2 0.0 0.0 0.0 0.0 0.0 0.0 0.0 0.0 0.0 0.0 12.9
119.5 0.0 0.0 0.0 0.0 0.0 0.0 0.0 0.0 0.0 0.0 110.3 0.0 0.0 0.0 0.0 0.0 0.0 0.0 0.0 0.0 0.0 12.8
120.0 0.0 0.0 0.0 0.0 0.0 0.0 0.0 0.0 112.2 111.9 111.2 0.0 0.0 0.0 0.0 0.0 0.0 0.0 0.0 12.4 12.5 12.6

140 | P a g e
GDT 67 Table 8: B Curve – Table B-7
10.5 11.0 11.5 12.0 12.5 13.0 13.5 14.0 14.5 15.0 15.5 111.5 0.0 0.0 0.0 0.0 0.0 0.0 0.0 99.4 99.0 98.5 97.8
0.0 0.0 0.0 0.0 0.0 0.0 0.0 16.6 16.8 17.1 17.5
112.0 0.0 0.0 0.0 0.0 0.0 0.0 100.1 99.6 99.2 98.8 98.2 0.0 0.0 0.0 0.0 0.0 0.0 16.2 16.4 16.6 16.8 17.2
112.5 0.0 0.0 0.0 0.0 0.0 0.0 100.5 99.8 99.4 99.0 98.5 0.0 0.0 0.0 0.0 0.0 0.0 16.2 16.4 16.6 16.8 17.0
113.0 0.0 0.0 0.0 0.0 0.0 101.5 101.0 100.1 99.6 99.3 98.6 0.0 0.0 0.0 0.0 0.0 15.8 16.0 16.2 16.5 16.6 17.0
113.5 0.0 0.0 0.0 0.0 0.0 101.8 101.2 100.4 100.0 99.5 99.0 0.0 0.0 0.0 0.0 0.0 15.7 15.9 16.1 16.2 16.6 16.8
114.0 0.0 0.0 0.0 103.0 102.9 102.0 101.4 101.0 100.5 99.9 99.4 0.0 0.0 0.0 15.1 15.3 15.6 15.8 16.0 16.2 16.4 16.6
114.5 0.0 0.0 0.0 104.0 103.4 102.5 101.8 101.0 100.6 99.0 99.5 0.0 0.0 0.0 15.0 15.1 15.4 15.8 16.0 16.1 16.8 16.6
115.0 0.0 0.0 105.3 104.5 103.7 103.0 102.5 101.5 101.0 100.4 99.8 0.0 0.0 14.5 14.8 15.0 15.3 15.4 15.8 16.0 16.2 16.3
115.5 0.0 0.0 105.5 105.0 104.0 103.3 102.5 101.8 101.5 101.0 100.2 0.0 0.0 14.4 14.6 15.0 15.1 15.4 15.8 15.8 16.0 16.2
116.0 0.0 106.5 106.0 105.4 104.7 103.5 103.0 102.4 101.8 101.5 100.5 0.0 14.0 14.2 14.5 14.8 15.1 15.3 15.5 15.8 15.8 16.0
116.5 0.0 106.9 106.0 105.6 105.0 104.3 103.4 102.5 102.0 101.5 101.0 0.0 13.9 14.2 14.4 14.6 14.9 15.1 15.5 15.7 15.8 16.0
117.0 0.0 107.5 106.5 105.5 105.2 104.6 103.5 102.0 102.5 102.0 101.3 0.0 13.8 14.0 14.4 14.5 14.8 15.1 15.7 15.5 15.7 15.8
117.5 0.0 107.5 107.0 106.4 105.5 105.0 104.4 103.4 103.0 102.5 102.0 0.0 13.8 13.9 14.1 14.4 14.6 14.8 15.1 15.3 15.5 15.7
118.0 108.4 108.0 107.5 106.8 106.0 105.2 104.8 104.0 103.4 102.9 102.2 13.5 13.6 13.8 13.9 14.2 14.5 14.8 15.0 15.1 15.3 15.6
118.5 108.9 108.2 107.5 106.9 106.4 105.5 105.0 104.2 103.7 103.4 102.5 13.3 13.6 13.8 13.9 14.1 14.4 14.6 14.9 15.1 15.1 15.4
119.0 109.3 108.5 108.0 107.3 106.7 106.0 105.5 104.9 104.3 103.6 103.1 13.1 13.5 13.6 13.8 14.0 14.2 14.4 14.7 14.9 15.0 15.3
119.5 109.8 109.0 108.3 107.4 107.0 106.2 105.4 105.0 104.8 104.1 103.5 13.0 13.2 13.4 13.8 13.9 14.1 14.4 14.6 14.7 15.0 15.1
120.0 110.3 109.5 108.5 108.0 107.5 106.9 106.2 105.5 105.0 104.6 104.1 12.8 13.1 13.4 13.6 13.8 13.9 13.1 14.4 14.5 14.8 15.0
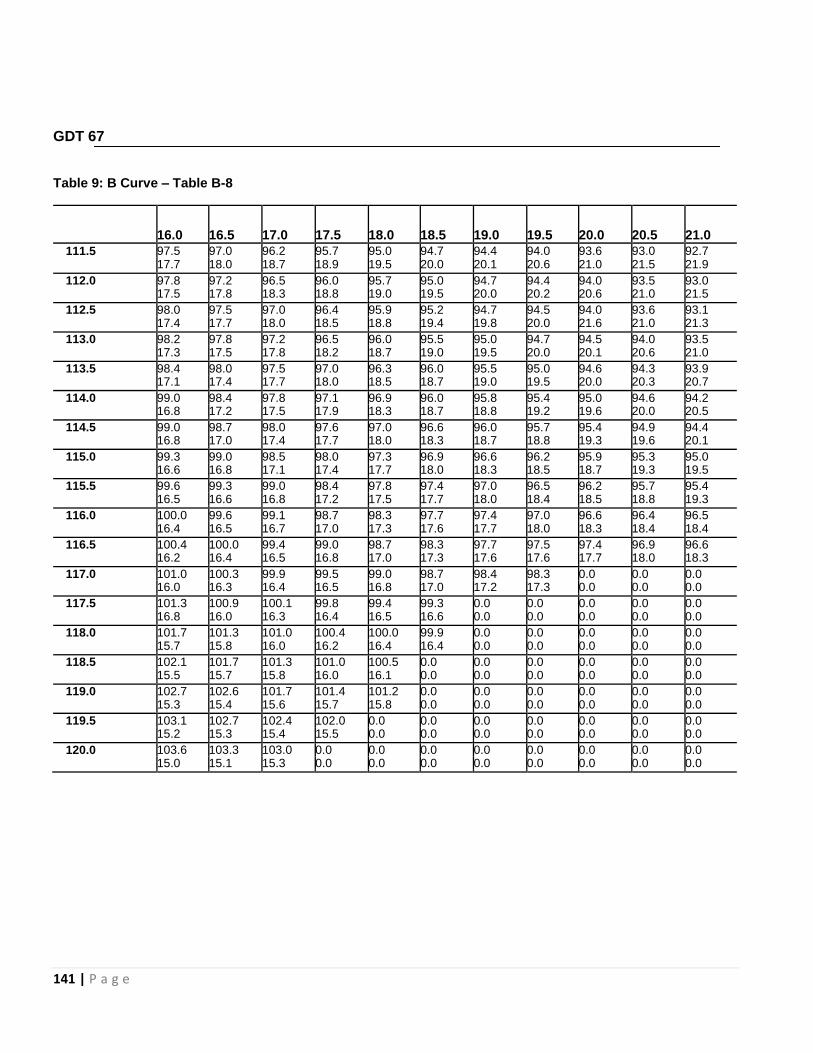
141 | P a g e
GDT 67 Table 9: B Curve – Table B-8
16.0 16.5 17.0 17.5 18.0 18.5 19.0 19.5 20.0 20.5 21.0 111.5 97.5 97.0 96.2 95.7 95.0 94.7 94.4 94.0 93.6 93.0 92.7
17.7 18.0 18.7 18.9 19.5 20.0 20.1 20.6 21.0 21.5 21.9
112.0 97.8 97.2 96.5 96.0 95.7 95.0 94.7 94.4 94.0 93.5 93.0 17.5 17.8 18.3 18.8 19.0 19.5 20.0 20.2 20.6 21.0 21.5
112.5 98.0 97.5 97.0 96.4 95.9 95.2 94.7 94.5 94.0 93.6 93.1 17.4 17.7 18.0 18.5 18.8 19.4 19.8 20.0 21.6 21.0 21.3
113.0 98.2 97.8 97.2 96.5 96.0 95.5 95.0 94.7 94.5 94.0 93.5 17.3 17.5 17.8 18.2 18.7 19.0 19.5 20.0 20.1 20.6 21.0
113.5 98.4 98.0 97.5 97.0 96.3 96.0 95.5 95.0 94.6 94.3 93.9 17.1 17.4 17.7 18.0 18.5 18.7 19.0 19.5 20.0 20.3 20.7
114.0 99.0 98.4 97.8 97.1 96.9 96.0 95.8 95.4 95.0 94.6 94.2 16.8 17.2 17.5 17.9 18.3 18.7 18.8 19.2 19.6 20.0 20.5
114.5 99.0 98.7 98.0 97.6 97.0 96.6 96.0 95.7 95.4 94.9 94.4 16.8 17.0 17.4 17.7 18.0 18.3 18.7 18.8 19.3 19.6 20.1
115.0 99.3 99.0 98.5 98.0 97.3 96.9 96.6 96.2 95.9 95.3 95.0 16.6 16.8 17.1 17.4 17.7 18.0 18.3 18.5 18.7 19.3 19.5
115.5 99.6 99.3 99.0 98.4 97.8 97.4 97.0 96.5 96.2 95.7 95.4 16.5 16.6 16.8 17.2 17.5 17.7 18.0 18.4 18.5 18.8 19.3
116.0 100.0 99.6 99.1 98.7 98.3 97.7 97.4 97.0 96.6 96.4 96.5 16.4 16.5 16.7 17.0 17.3 17.6 17.7 18.0 18.3 18.4 18.4
116.5 100.4 100.0 99.4 99.0 98.7 98.3 97.7 97.5 97.4 96.9 96.6 16.2 16.4 16.5 16.8 17.0 17.3 17.6 17.6 17.7 18.0 18.3
117.0 101.0 100.3 99.9 99.5 99.0 98.7 98.4 98.3 0.0 0.0 0.0 16.0 16.3 16.4 16.5 16.8 17.0 17.2 17.3 0.0 0.0 0.0
117.5 101.3 100.9 100.1 99.8 99.4 99.3 0.0 0.0 0.0 0.0 0.0 16.8 16.0 16.3 16.4 16.5 16.6 0.0 0.0 0.0 0.0 0.0
118.0 101.7 101.3 101.0 100.4 100.0 99.9 0.0 0.0 0.0 0.0 0.0 15.7 15.8 16.0 16.2 16.4 16.4 0.0 0.0 0.0 0.0 0.0
118.5 102.1 101.7 101.3 101.0 100.5 0.0 0.0 0.0 0.0 0.0 0.0 15.5 15.7 15.8 16.0 16.1 0.0 0.0 0.0 0.0 0.0 0.0
119.0 102.7 102.6 101.7 101.4 101.2 0.0 0.0 0.0 0.0 0.0 0.0 15.3 15.4 15.6 15.7 15.8 0.0 0.0 0.0 0.0 0.0 0.0
119.5 103.1 102.7 102.4 102.0 0.0 0.0 0.0 0.0 0.0 0.0 0.0 15.2 15.3 15.4 15.5 0.0 0.0 0.0 0.0 0.0 0.0 0.0
120.0 103.6 103.3 103.0 0.0 0.0 0.0 0.0 0.0 0.0 0.0 0.0 15.0 15.1 15.3 0.0 0.0 0.0 0.0 0.0 0.0 0.0 0.0

142 | P a g e
GDT 67 Table 10: B Curve; Table B-9
21.5 22.0 22.5 23.0 23.5 24.0 24.5 25.0 25.5 26.0 26.5 111.5 91.4 91.8 91.3 91.0 90.6 90.4 90.0 89.6 89.4 88.8 88.5 22.2 22.9 23.4 23.7 24.1 24.5 25.0 25.4 25.9 26.4 26.9 112.0 92.8 92.0 91.7 91.4 90.8 90.6 90.2 89.9 89.6 89.1 88.8 22.0 22.6 23.0 23.5 23.8 24.2 24.8 25.1 25.5 26.0 26.4
112.5 92.8 92.5 92.0 91.7 91.1 90.8 90.5 90.3 89.7 89.3 89.1 21.9 22.1 22.6 23.0 23.5 23.9 24.3 24.7 25.2 25.8 26.0
113.0 93.0 92.8 92.4 92.0 91.6 91.1 90.8 90.5 90.0 89.7 89.5 21.5 21.9 223. 22.7 23.1 23.5 23.8 24.3 25.0 25.3 25.6
113.5 93.3 93.0 92.7 92.3 91.9 91.5 91.5 90.8 90.6 90.2 89.8 21.1 21.5 21.9 22.2 22.7 23.1 23.2 23.8 24.3 25.0 25.3
114.0 93.9 93.3 92.8 92.8 92.3 91.9 91.8 91.4 90.8 90.7 90.6 20.7 21.1 21.7 21.8 22.2 22.7 22.9 23.3 23.8 23.9 24.3 114.5 94.5 94.0 93.6 92.8 92.7 92.4 92.0 91.8 0.0 0.0 0.0 20.4 20.6 20.9 21.7 21.8 22.3 22.6 22.8 0.0 0.0 0.0
1150 95.0 94.6 94.0 93.9 0.0 0.0 0.0 0.0 0.0 0.0 0.0 20.0 20.4 20.6 20.7 0.0 0.0 0.0 0.0 0.0 0.0 0.0
115.5 95.1 0.0 0.0 0.0 0.0 0.0 0.0 0.0 0.0 0.0 0.0 19.4 0.0 0.0 0.0 0.0 0.0 0.0 0.0 0.0 0.0 0.0
116.0 to 0.0 0.0 0.0 0.0 0.0 0.0 0.0 0.0 0.0 0.0 0.0 129.5 0.0 0.0 0.0 0.0 0.0 0.0 0.0 0.0 0.0 0.0 0.0

143 | P a g e
GDT 67 Table 11: B Curve; Table B-10
27.0 27.5 28.0 28.5 29.0 29.5 30.0 30.5 31.0 31.5 32.0 111.5 88.2 88.0 87.5 87.1 86.8 86.5 86.1 85.8 85.4 84.7 84.5 27.2 27.5 28.0 28.5 28.9 29.3 29.8 30.1 30.4 31.0 31.4 112.0 88.5 88.2 87.9 87.6 87.1 86.9 86.5 86.0 85.8 85.3 84.9 26.7 27.1 27.6 28.0 28.6 28.2 29.3 29.9 30.1 30.5 31.0 112.5 88.8 88.7 88.1 88.0 87.6 87.1 86.9 86.4 86.1 0.0 0.0 26.4 26.5 27.3 27.5 28.0 28.4 28.7 29.4 29.8 0.0 0.0 113.0 89.2 88.9 88.7 88.3 87.8 87.8 87.5 0.0 0.0 0.0 0.0 26.0 26.3 26.5 27.1 27.5 27.6 28.4 0.0 0.0 0.0 0.0 113.5 89.7 89.5 89.2 89.0 0.0 0.0 0.0 0.0 0.0 0.0 0.0 25.4 25.6 26.0 26.2 0.0 0.0 0.0 0.0 0.0 0.0 0.0 114.0 to 0.0 0.0 0.0 0.0 0.0 0.0 0.0 0.0 0.0 0.0 0.0 129.5 0.0 0.0 0.0 0.0 0.0 0.0 0.0 0.0 0.0 0.0 0.0 Table 12: B Curve; Table B-11
32.5 33.0 33.5 34.0 34.5 35.0 35.5 36.0 36.5 37.0 37.5 111.5 84.3 83.9 83.7 83.6 0.0 0.0 0.0 0.0 0.0 0.0 0.0 31.6 32.2 32.4 33.0 0.0 0.0 0.0 0.0 0.0 0.0 0.0 112.0 84.7 0.0 0.0 0.0 0.0 0.0 0.0 0.0 0.0 0.0 0.0 31.3 0.0 0.0 0.0 0.0 0.0 0.0 0.0 0.0 0.0 0.0
112.5 to 0.0 0.0 0.0 0.0 0.0 0.0 0.0 0.0 0.0 0.0 0.0 129.5 0.0 0.0 0.0 0.0 0.0 0.0 0.0 0.0 0.0 0.0 0.0

144 | P a g e
GDT 67 Table 13: B Curve; Table B-12
5.0 5.5 6.0 6.5 7.0 7.5 8.0 8.5 9.0 9.5 10.0 120.5 0.0 0.0 0.0 0.0 0.0 0.0 0.0 0.0 113.0 112.2 111.3
0.0 0.0 0.0 0.0 0.0 0.0 0.0 0.0 12.2 12.4 12.6
121.0 0.0 0.0 0.0 0.0 0.0 0.0 0.0 0.0 113.0 112.5 111.5 0.0 0.0 0.0 0.0 0.0 0.0 0.0 0.0 12.2 12.4 12.5
121.5 0.0 0.0 0.0 0.0 0.0 0.0 0.0 114.0 113.5 112.8 112.0 0.0 0.0 0.0 0.0 0.0 0.0 0.0 11.9 12.0 12.2 12.4
122.0 0.0 0.0 0.0 0.0 0.0 0.0 0.0 114.7 114.0 113.0 112.5 0.0 0.0 0.0 0.0 0.0 0.0 0.0 11.8 12.0 12.2 12.4
122.5 0.0 0.0 0.0 0.0 0.0 0.0 0.0 115.0 114.1 113.5 113.0 0.0 0.0 0.0 0.0 0.0 0.0 0.0 11.7 11.9 12.1 12.2
123.0 0.0 0.0 0.0 0.0 0.0 0.0 0.0 115.5 114.8 114.0 113.5 0.0 0.0 0.0 0.0 0.0 0.0 0.0 11.6 11.8 12.0 12.1
123.5 0.0 0.0 0.0 0.0 0.0 0.0 116.0 115.5 115.0 114.3 113.5 0.0 0.0 0.0 0.0 0.0 0.0 11.4 11.5 11.7 11.9 12.0
124.0 0.0 0.0 0.0 0.0 0.0 0.0 116.3 116.0 115.4 114.6 114.0 0.0 0.0 0.0 0.0 0.0 0.0 11.2 11.4 11.6 11.7 12.0
124.5 0.0 0.0 0.0 0.0 0.0 0.0 116.7 116.0 115.5 115.0 114.5 0.0 0.0 0.0 0.0 0.0 0.0 11.1 11.4 11.5 11.7 11.8
125.0 0.0 0.0 0.0 0.0 0.0 0.0 117.0 116.5 116.0 115.5 115.0 0.0 0.0 0.0 0.0 0.0 0.0 11.0 11.1 11.4 11.5 11.7
125.5 0.0 0.0 0.0 0.0 0.0 0.0 117.5 116.9 116.1 115.5 115.0 0.0 0.0 0.0 0.0 0.0 0.0 11.0 11.1 11.4 11.5 11.7
126.0 0.0 0.0 0.0 0.0 0.0 118.5 117.6 117.1 116.5 116.0 115.5 0.0 0.0 0.0 0.0 0.0 10.7 11.0 11.0 11.2 11.3 11.5
126.5 0.0 0.0 0.0 0.0 0.0 118.8 118.2 117.5 117.0 116.2 115.8 0.0 0.0 0.0 0.0 0.0 10.6 10.8 11.0 11.1 11.3 11.5
127.0 0.0 0.0 0.0 0.0 0.0 119.0 118.6 117.5 117.0 116.5 116.0 0.0 0.0 0.0 0.0 0.0 10.5 10.6 10.8 11.1 11.2 11.3
127.5 0.0 0.0 0.0 0.0 120.2 119.6 118.8 118.3 117.3 117.0 116.5 0.0 0.0 0.0 0.0 10.0 10.3 10.5 10.6 11.0 11.1 11.2
128.0 0.0 0.0 0.0 0.0 120.5 120.0 119.2 118.8 118.0 117.5 116.8 0.0 0.0 0.0 0.0 10.0 10.1 10.3 10.5 10.8 11.0 11.1
128.5 0.0 0.0 0.0 122.0 121.0 120.5 119.5 119.0 118.5 117.8 117.2 0.0 0.0 0.0 9.6 10.0 10.0 10.3 10.5 10.6 10.9 11.0
129.0 0.0 0.0 0.0 122.5 121.0 120.5 120.0 119.0 118.8 118.1 117.5 0.0 0.0 0.0 9.5 10.0 10.0 10.1 10.5 10.5 10.8 11.0

145 | P a g e
GDT 67 Table 14: B Curve; Table B-13
10.5 11.0 11.5 12.0 12.5 13.0 13.5 14.0 14.5 15.0 15.5 120.5 110.8 109.8 109.0 108.5 107.7 107.0 106.5 105.9 105.5 105.0 104.6
12.8 13.0 13.2 13.8 13.8 13.9 14.0 14.4 14.4 14.6 14.8 121.0 111.0 110.3 109.5 109.6 108.0 107.5 106.9 105.8 105.8 105.3 104.9
12.7 12.8 13.0 13.1 13.6 13.8 13.9 14.3 14.3 14.5 14.7 121.0 111.2 110.5 109.8 108.8 108.5 107.6 107.1 106.1 106.1 105.8 105.3
12.6 12.8 13.0 13.2 13.5 13.7 13.9 14.1 14.1 14.3 14.5 122.0 111.5 111.0 110.4 109.5 108.6 108.0 107.5 106.6 106.6 106.1 105.8
12.5 12.7 12.8 13.0 13.5 13.6 13.8 14.0 14.0 14.1 14.3 122.5 112.0 111.2 110.5 110.0 109.0 108.5 108.0 107.7 107.0 106.7 106.5
12.5 12.6 12.8 13.0 13.2 13.5 13.6 13.9 13.9 14.0 14.0 123.0 112.5 111.5 111.0 110.3 109.7 109.0 108.5 107.6 107.6 107.4 106.9
12.3 12.5 12.8 12.8 13.0 13.2 13.5 13.7 13.7 13.7 13.9 123.5 113.0 112.2 111.2 110.5 110.0 109.5 108.8 108.1 108.1 107.7 107.6
12.2 12.4 12.6 12.8 13.0 13.0 13.4 13.6 13.6 13.6 13.7 124.0 113.5 112.5 111.8 111.0 110.5 109.8 109.3 108.5 108.5 108.3 107.9
12.1 12.3 12.5 12.7 12.8 13.0 13.2 13.5 13.5 13.5 13.6 124.5 113.8 113.0 112.2 111.5 111.0 110.2 109.7 109.3 109.0 108.8 108.5
12.0 12.2 12.4 12.5 12.7 12.9 13.0 13.1 13.3 13.4 13.5 125.0 114.2 113.5 113.0 112.0 111.2 110.7 110.2 109.6 109.3 109.1 109.1
11.8 121. 12.2 12.5 12.5 12.7 12.9 13.0 13.1 13.3 13.3 125.5 114.5 114.0 113.0 112.5 112.0 111.2 110.7 110.2 109.8 109.4 0.0
11.8 12.0 12.2 12.3 12.5 12.6 12.7 12.9 13.0 13.1 0.0 126.0 115.0 114.0 113.7 113.0 112.5 111.8 111.1 110.7 110.2 109.9 0.0
11.6 12.0 12.0 12.2 12.5 12.4 12.5 12.7 12.9 13.0 0.0 126.5 115.4 114.5 114.0 113.5 113.0 112.2 111.7 111.1 111.0 0.0 0.0
11.5 11.8 12.0 12.0 12.3 12.4 12.4 12.6 12.7 0.0 0.0 127.0 115.5 115.0 114.5 114.0 113.4 112.8 112.4 112.1 112.0 0.0 0.0
11.5 11.6 11.8 12.0 12.1 12.3 12.3 12.4 12.4 0.0 0.0 127.5 116.0 115.5 115.0 114.3 114.0 113.4 113.1 113.1 0.0 0.0 0.0
11.3 11.5 11.6 11.8 12.0 12.1 12.2 12.2 0.0 0.0 0.0 128.0 116.2 115.8 115.5 114.7 114.4 114.1 113.8 113.7 0.0 0.0 0.0
11.3 11.5 11.5 11.7 11.8 11.9 12.0 12.0 0.0 0.0 0.0 128.5 116.5 116.0 115.7 115.1 114.9 114.6 114.4 0.0 0.0 0.0 0.0
11.1 11.3 11.5 11.5 11.6 11.7 11.8 0.0 0.0 0.0 0.0 129.0 117.0 116.5 116.1 115.6 115.4 115.1 115.0 0.0 0.0 0.0 0.0
11.1 11.1 11.3 11.4 11.5 11.6 11.6 0.0 0.0 0.0 0.0

146 | P a g e
GDT 67 Table 15: B Curve; Table B-14
16.0 16.5 17.0 17.5 18.0 18.5 19.0 19.5 20.0 20.5 21.0 120.5 104.1 103.7 103.4 0.0 0.0 0.0 0.0 0.0 0.0 0.0 0.0 14.9 15.0 15.1 0.0 0.0 0.0 0.0 0.0 0.0 0.0 0.0 121.0 104.4 104.1 0.0 0.0 0.0 0.0 0.0 0.0 0.0 0.0 0.0 14.8 14.9 0.0 0.0 0.0 0.0 0.0 0.0 0.0 0.0 0.0 121.5 105.0 104.7 0.0 0.0 0.0 0.0 0.0 0.0 0.0 0.0 0.0 14.6 14.7 0.0 0.0 0.0 0.0 0.0 0.0 0.0 0.0 0.0 122.0 105.3 105.1 0.0 0.0 0.0 0.0 0.0 0.0 0.0 0.0 0.0 14.5 14.5 0.0 0.0 0.0 0.0 0.0 0.0 0.0 0.0 0.0 122.5 105.9 0.0 0.0 0.0 0.0 0.0 0.0 0.0 0.0 0.0 0.0 14.3 0.0 0.0 0.0 0.0 0.0 0.0 0.0 0.0 0.0 0.0 123.0 106.4 0.0 0.0 0.0 0.0 0.0 0.0 0.0 0.0 0.0 0.0 14.0 0.0 0.0 0.0 0.0 0.0 0.0 0.0 0.0 0.0 0.0 123.5 107.2 0.0 0.0 0.0 0.0 0.0 0.0 0.0 0.0 0.0 0.0 13.8 0.0 0.0 0.0 0.0 0.0 0.0 0.0 0.0 0.0 0.0 124.0 to 0.0 0.0 0.0 0.0 0.0 0.0 0.0 0.0 0.0 0.0 0.0 129.0 0.0 0.0 0.0 0.0 0.0 0.0 0.0 0.0 0.0 0.0 0.0

147 | P a g e
GDT 67 Table 16: B Curve; Table B-15
5.0 5.5 6.0 6.5 7.0 7.5 8.0 8.5 9.0 9.5 10.0 129.5 0.0 0.0 0.0 122.5 122.0 121.0 120.5 120.0 119.0 118.8 118.0
0.0 0.0 0.0 9.5 9.6 10.0 10.0 10.1 10.5 10.6 10.8 130.0 0.0 0.0 123.8 123.0 122.1 121.5 120.5 120.2 119.5 119.0 118.5
0.0 0.0 9.2 9.5 9.5 9.8 10.0 10.0 10.3 10.5 10.6 130.5 0.0 0.0 124.0 123.2 122.5 122.0 121.0 120.5 120.0 119.0 118.9
0.0 0.0 9.1 9.3 9.6 10.0 10.0 10.0 10.1 10.5 10.5 131.0 0.0 0.0 124.5 123.9 123.0 122.4 121.9 120.9 120.5 120.0 119.5
0.0 0.0 9.0 9.1 9.5 9.5 9.6 10.0 10.0 10.1 10.3 131.5 0.0 125.5 125.0 124.0 123.1 122.9 122.0 121.0 120.5 120.0 119.5
0.0 8.6 8.9 9.1 9.3 9.5 9.6 10.0 10.0 10.1 10.3 132.0 0.0 126.0 125.0 124.5 123.9 123.0 122.5 122.0 121.0 120.5 120.3
0.0 8.5 8.9 9.0 9.1 9.5 9.5 9.6 10.0 10.0 10.0 132.5 0.0 126.5 125.5 125.0 124.2 123.8 123.0 122.5 121.5 121.0 120.5
0.0 8.4 8.6 8.9 9.2 9.1 9.5 9.5 9.8 10.0 10.0 133.0 0.0 126.9 126.0 125.0 124.5 124.0 123.5 122.5 122.0 122.8 121.1
0.0 8.2 8.5 8.9 9.0 9.1 9.2 9.5 9.5 9.5 9.9 133.5 0.0 127.2 126.5 125.5 125.0 124.5 124.0 123.2 122.8 122.3 121.7
0.0 8.1 8.4 8.6 8.9 9.0 9.1 9.5 9.4 9.5 9.7 134.0 0.0 127.5 126.9 126.0 125.5 124.8 124.5 124.2 124.0 123.0 122.4
0.0 8.0 8.2 8.5 8.8 8.9 9.0 9.0 9.1 9.5 9.5 134.5 0.0 127.8 127.0 126.5 125.5 125.0 124.7 124.2 124.0 123.4 123.0
0.0 8.0 8.1 8.4 8.6 8.9 8.9 9.0 9.1 9.3 9.4 135.0 128.8 128.4 127.5 126.9 126.2 125.6 125.0 124.5 124.5 124.1 123.9
7.7 7.8 8.0 8.2 8.4 8.6 8.9 9.0 9.0 9.1 9.2 135.5 129.0 128.6 128.0 127.2 126.9 126.0 125.5 125.0 124.9 124.5 124.3
7.7 7.8 8.0 8.1 8.2 8.5 8.6 8.9 8.9 9.0 9.0 136.0 129.6 129.0 128.5 128.0 127.0 126.8 126.0 125.8 125.2 124.9 124.8
7.4 7.7 7.8 8.0 8.1 8.2 8.5 8.5 8.7 8.9 8.9 136.5 130.0 129.5 129.0 128.5 127.5 127.0 126.5 126.4 126.0 125.6 0.0
7.3 7.4 7.7 7.8 8.0 8.1 8.4 8.5 8.5 8.6 0.0 137.0 130.5 129.8 129.3 128.9 128.0 127.5 127.0 126.8 126.4 126.2 0.0
7.1 7.3 7.5 7.8 8.0 8.0 8.1 8.3 8.4 8.4 0.0 137.5 131.0 130.5 129.5 129.0 128.5 128.0 127.5 127.3 126.9 0.0 0.0
7.0 7.1 7.4 7.7 7.8 8.0 8.0 8.0 8.3 0.0 0.0

148 | P a g e
GDT 67 Table 17: B Curve; Table B-16
10.0 11.0 11.5 12.0 12.5 13.0 13.5 14.0 14.5 15.0 15.5 129.5 117.5 117.0 116.6 116.1 115.9 115.6 115.5 0.0 0.0 0.0 0.0 11.0 11.0 11.2 11.3 11.4 11.5 11.5 0.0 0.0 0.0 0.0 130.0 118.0 117.5 117.1 116.8 116.6 116.2 0.0 0.0 0.0 0.0 0.0 10.8 11.0 11.1 11.2 11.3 11.3 0.0 0.0 0.0 0.0 0.0 130.5 118.5 118.0 117.6 117.3 117.0 116.9 0.0 0.0 0.0 0.0 0.0 10.6 10.7 10.9 11.0 11.1 11.1 0.0 0.0 0.0 0.0 0.0 131.0 118.8 118.4 118.0 117.6 117.6 0.0 0.0 0.0 0.0 0.0 0.0 10.6 10.7 10.7 10.9 10.9 0.0 0.0 0.0 0.0 0.0 0.0 131.5 119.4 118.9 118.5 118.2 118.2 0.0 0.0 0.0 0.0 0.0 0.0 10.4 10.5 10.6 10.7 10.7 0.0 0.0 0.0 0.0 0.0 0.0 132.0 119.8 119.4 119.1 118.9 118.8 0.0 0.0 0.0 0.0 0.0 0.0 10.3 10.4 10.5 10.5 10.5 0.0 0.0 0.0 0.0 0.0 0.0 132.5 120.2 119.9 119.7 119.3 0.0 0.0 0.0 0.0 0.0 0.0 0.0 10.1 10.2 10.3 10.4 0.0 0.0 0.0 0.0 0.0 0.0 0.0 133.0 121.1 120.4 120.1 120.1 0.0 0.0 0.0 0.0 0.0 0.0 0.0 9.8 10.0 10.1 10.1 0.0 0.0 0.0 0.0 0.0 0.0 0.0 133.5 121.2 121.0 120.6 0.0 0.0 0.0 0.0 0.0 0.0 0.0 0.0 9.8 9.9 10.0 0.0 0.0 0.0 0.0 0.0 0.0 0.0 0.0 134.0 122.0 121.8 121.8 0.0 0.0 0.0 0.0 0.0 0.0 0.0 0.0 9.7 9.8 9.8 0.0 0.0 0.0 0.0 0.0 0.0 0.0 0.0 134.5 122.6 122.5 0.0 0.0 0.0 0.0 0.0 0.0 0.0 0.0 0.0 9.5 9.5 0.0 0.0 0.0 0.0 0.0 0.0 0.0 0.0 0.0 135.0 123.5 123.4 0.0 0.0 0.0 0.0 0.0 0.0 0.0 0.0 0.0 9.3 9.3 0.0 0.0 0.0 0.0 0.0 0.0 0.0 0.0 0.0 135.5 124.2 0.0 0.0 0.0 0.0 0.0 0.0 0.0 0.0 0.0 0.0 9.0 0.0 0.0 0.0 0.0 0.0 0.0 0.0 0.0 0.0 0.0 136.0 124.8 0.0 0.0 0.0 0.0 0.0 0.0 0.0 0.0 0.0 0.0 8.8 0.0 0.0 0.0 0.0 0.0 0.0 0.0 0.0 0.0 0.0 136.5 to 0.0 0.0 0.0 0.0 0.0 0.0 0.0 0.0 0.0 0.0 0.0 137.5 0.0 0.0 0.0 0.0 0.0 0.0 0.0 0.0 0.0 0.0 0.0

149 | P a g e
GDT 67 Table 18: B Curve; Table B-17
4.0 4.5 5.0 5.5 6.0 6.5 7.0 7.5 8.0 8.5 9.0 138.0 0.0 132.6 131.5 130.8 130.0 129.5 129.0 128.6 125.1 127.9 127.5
0.0 6.6 6.9 7.0 7.3 7.4 7.8 7.8 7.9 8.0 8.1 138.5 0.0 132.6 132.0 131.5 130.8 130.0 129.6 129.2 128.8 128.7 129.2
0.0 6.5 6.8 6.9 7.1 7.3 7.4 7.8 7.6 7.7 7.6 139.0 0.0 133.3 132.6 131.8 131.2 130.5 130.6 129.6 129.2 129.3 0.0
0.0 6.4 6.5 6.8 7.0 7.2 7.3 7.5 7.7 7.6 0.0 139.5 0.0 134.0 132.6 132.0 131.5 131.0 130.5 130.1 129.8 129.8 0.0
0.0 6.2 6.5 6.8 6.9 7.0 7.2 7.3 7.4 7.4 0.0 140.0 0.0 134.0 133.3 132.6 132.0 131.5 131.0 130.7 130.3 130.3 0.0
0.0 6.2 6.4 6.5 6.8 6.9 7.0 7.2 7.3 7.3 0.0 140.5 0.0 134.5 134.0 133.0 132.5 132.0 131.6 131.3 131.2 0.0 0.0
0.0 6.1 6.2 6.5 6.5 6.8 6.9 7.0 7.0 0.0 0.0 141.0 135.0 134.5 134.0 133.5 132.8 132.5 132.1 131.9 131.9 0.0 0.0
6.0 6.1 6.2 6.3 6.5 6.5 6.7 6.8 6.8 0.0 0.0 141.5 135.5 135.0 134.5 134.0 133.5 133.0 132.8 132.8 0.0 0.0 0.0
5.8 6.0 6.1 6.2 6.3 6.5 6.5 6.5 0.0 0.0 0.0 142.0 135.8 135.2 134.5 134.3 134.0 133.6 133.4 0.0 0.0 0.0 0.0
5.7 5.8 6.1 6.2 6.2 6.4 6.4 0.0 0.0 0.0 0.0 142.5 136.2 135.5 135.0 134.8 134.5 134.1 0.0 0.0 0.0 0.0 0.0
5.6 5.7 6.0 6.0 6.0 6.2 0.0 0.0 0.0 0.0 0.0 143.0 136.5 136.0 135.5 135.2 135.0 134.7 0.0 0.0 0.0 0.0 0.0
5.5 5.6 5.7 5.9 6.0 6.0 0.0 0.0 0.0 0.0 0.0 143.5 137.0 136.5 135.8 135.5 135.4 0.0 0.0 0.0 0.0 0.0 0.0
5.3 5.5 5.7 5.7 5.7 0.0 0.0 0.0 0.0 0.0 0.0 144.0 137.5 137.0 136.5 136.5 135.9 0.0 0.0 0.0 0.0 0.0 0.0
5.1 5.2 5.5 5.5 5.6 0.0 0.0 0.0 0.0 0.0 0.0

150 | P a g e
GDT 67 GDT-67 Table Set 3—Family of Curves; Theoretical Density-Moisture Chart, C Curve Table 1: C Curve; Table C Overview
Wet Density (pcf) % Moisture
4-0-10.0 10.5-15.5 16.0-21.0 21.5-26.5 27.0-32.0 32.5-37.5 98.5 to 108.0 X X C-1 C-2 C-3 C-4
108.0 to 117.0 X C-5 C-6 C-7 C-8
117.5 to 126.0 C-9 C-10 C011 X
126.5 to 135.0 C-12 C-13 X X X X
135.5 to 144.0 C-14 X X X X X
Table 2: C Curve; Table C-1
16.0 16.5 17.0 17.5 18.0 18.5 19.0 19.5 20.0 20.5 21.0
98.5 0.0 0.0 0.0 0.0 0.0 0.0 0.0 0.0 0.0 0.0 0.0 0.0 0.0 0.0 0.0 0.0 0.0 0.0 0.0 0.0 0.0 0.0
105.0 0.0 0.0 0.0 0.0 0.0 0.0 0.0 0.0 0.0 0.0 92.3 0.0 0.0 0.0 0.0 0.0 0.0 0.0 0.0 0.0 0.0 24.7
105.5 0.0 0.0 0.0 0.0 0.0 0.0 0.0 0.0 0.0 0.0 92.4 0.0 0.0 0.0 0.0 0.0 0.0 0.0 0.0 0.0 0.0 24.6
106.0 0.0 0.0 0.0 0.0 0.0 0.0 0.0 0.0 93.6 93.1 92.6 0.0 0.0 0.0 0.0 0.0 0.0 0.0 0.0 23.7 24.0 24.4
106.5 0.0 0.0 0.0 0.0 0.0 0.0 0.0 94.2 93.7 93.3 92.7 0.0 0.0 0.0 0.0 0.0 0.0 0.0 23.3 23.7 23.9 24.4
107.0 0.0 0.0 0.0 0.0 0.0 95.7 95.0 94.4 93.9 93.5 92.6 0.0 0.0 0.0 0.0 0.0 22.1 22.7 23.1 23.5 23.8 24.3
107.5 0.0 0.0 0.0 0.0 0.0 95.8 95.2 94.5 93.9 93.7 93.0 0.0 0.0 0.0 0.0 0.0 22.1 22.4 23.1 23.5 23.7 24.1
108.0 0.0 0.0 0.0 0.0 96.9 96.2 95.2 94.7 94.0 93.8 93.0 0.0 0.0 0.0 0.0 21.5 21.8 22.4 22.9 23.4 23.6 24.1

151 | P a g e
GDT 67 Table 3: C Curve; Table C-2
21.5 22.0 22.5 23.0 23.5 24.0 24.5 25.0 25.5 26.0 26.5 98.5 to 0.0 0.0 0.0 0.0 0.0 0.0 0.0 0.0 0.0 0.0 0.0 101.5 0.0 0.0 0.0 0.0 0.0 0.0 0.0 0.0 0.0 0.0 0.0 102.0 0.0 0.0 0.0 0.0 0.0 0.0 0.0 0.0 86.4 85.8 85.4 0.0 0.0 0.0 0.0 0.0 0.0 0.0 0.0 29.3 29.8 30.1 102.5 0.0 0.0 0.0 0.0 0.0 0.0 0.0 0.0 86.6 85.9 85.5 0.0 0.0 0.0 0.0 0.0 0.0 0.0 0.0 29.0 29.6 30.0 103.0 0.0 0.0 0.0 0.0 0.0 87.8 87.5 87.1 86.6 86.2 85.5 0.0 0.0 0.0 0.0 0.0 28.0 28.3 28.6 29.0 29.1 30.0 103.5 0.0 0.0 0.0 0.0 88.6 87.9 87.5 87.1 86.6 86.2 85.7 0.0 0.0 0.0 0.0 27.4 27.9 28.3 28.6 29.0 29.4 29.9 104.0 0.0 90.9 90.1 89.4 88.8 88.0 87.6 87.2 86.7 86.3 85.8 0.0 25.8 26.4 26.9 27.2 27.9 28.0 28.6 28.9 29.3 29.3 104.5 0.0 91.0 90.3 89.5 89.0 88.4 87.8 87.4 86.9 86.4 86.0 0.0 25.7 26.3 26.8 27.1 27.5 28.0 28.4 28.8 29.2 29.6 105.0 92.0 91.3 90.6 89.8 89.3 88.5 88.0 87.5 87.1 86.6 86.2 24.9 25.5 26.0 26.6 27.0 27.5 27.9 28.3 28.6 29.0 29.4 105.5 92.1 91.3 90.7 90.0 89.3 88.7 88.2 87.5 87.2 86.8 86.3 24.8 25.5 25.9 26.5 27.0 27.3 27.7 28.3 28.6 28.8 29.3 106.0 92.1 91.4 90.8 90.1 89.6 88.8 88.3 87.7 87.4 87.0 86.5 24.0 25.4 25.8 26.4 26.8 27.2 27.7 28.2 28.4 28.7 29.2 106.5 92.2 91.5 91.0 90.2 89.6 89.0 88.4 87.8 87.4 87.2 86.6 24.7 25.3 25.7 26.3 26.8 27.1 27.5 28.0 28.4 28.6 29.0 107.0 92.3 91.8 91.2 90.6 90.0 89.2 88.1 88.1 87.7 87.2 86.7 24.7 25.0 25.5 26.0 26.5 27.0 27.2 27.8 28.2 28.6 28.9 107.5 92.6 91.9 91.3 90.7 90.1 89.4 88.9 88.3 87.8 87.3 86.9 24.4 25.0 25.5 25.9 26.4 26.9 27.2 27.7 28.0 28.5 28.8 108.0 92.8 92.0 91.7 90.9 90.3 89.7 89.2 88.5 88.1 87.6 87.2 24.3 24.9 25.1 25.8 26.3 26.7 27.0 27.5 27.8 28.2 28.6

152 | P a g e
GDT 67 Table 4: C Curve; Table C-3
27.0 27.5 28.0 28.5 29.0 29.5 30.0 30.5 31.0 31.5 32.0 98.5 to 99.5 0.0 0.0 0.0 0.0 0.0 0.0 0.0 0.0 0.0 0.0 0.0 0.0 0.0 0.0 0.0 0.0 0.0 0.0 0.0 0.0 0.0 0.0 100.0 0.0 0.0 0.0 0.0 0.0 0.0 0.0 0.0 80.2 0.0 0.0 0.0 0.0 0.0 0.0 0.0 0.0 0.0 0.0 34.5 0.0 0.0 100.5 0.0 0.0 0.0 0.0 0.0 82.1 81.1 80.9 80.4 80.0 0.0 0.0 0.0 0.0 0.0 0.0 33.0 33.5 33.8 34.2 34.6 0.0 101.0 0.0 0.0 83.6 83.1 82.6 82.1 84.6 81.0 80.5 80.3 0.0 0.0 0.0 31.5 31.9 32.3 32.9 33.2 33.7 34.0 34.4 0.0 101.5 84.6 84.0 83.7 83.4 82.6 82.4 81.6 81.4 80.6 80.5 79.8 30.8 30.8 31.5 31.7 32.3 32.6 33.2 33.4 34.0 34.2 34.8 102.0 84.8 84.3 83.7 83.5 82.8 82.5 82.0 81.5 80.8 80.5 80.0 30.2 31.0 31.4 31.5 32.1 32.4 32.9 33.4 33.9 34.2 34.6 102.5 84.8 84.5 83.7 83.5 82.9 82.6 82.0 81.5 81.0 80.6 80.1 30.2 30.8 31.4 31.5 32.1 32.8 32.9 33.3 33.7 34.0 34.5 103.0 85.1 84.5 83.9 83.6 83.1 82.6 82.2 81.7 81.3 80.7 80.3 30.3 30.8 31.2 31.5 31.9 32.3 32.7 33.2 33.4 34.0 34.4 103.5 85.2 84.7 84.0 83.7 83.2 82.6 82.3 81.8 81.4 80.9 80.3 30.2 30.7 31.2 31.4 31.8 32.3 32.7 33.1 33.4 33.9 34.4 104.0 85.3 84.8 84.3 83.8 83.4 82.8 82.5 82.1 81.6 81.2 80.6 30.2 30.7 31.0 31.3 30.7 32.1 32.4 32.9 33.2 33.6 34.1 104.5 85.4 85.0 84.5 84.0 83.6 83.1 82.6 82.3 81.7 81.3 80.7 30.1 30.4 30.8 31.2 31.5 31.9 32.3 32.7 33.2 33.4 34.0 105.0 85.6 85.2 84.7 84.2 83.7 83.3 82.7 82.4 81.9 81.5 80.8 30.0 30.2 30.7 31.0 31.4 31.7 32.2 32.6 33.0 33.3 33.9 105.5 85.7 85.3 84.8 84.3 83.8 83.5 82.8 82.6 82.1 81.7 81.1 29.9 30.2 30.7 31.0 31.3 31.5 32.1 32.3 32.9 33.2 33.7 106.0 85.9 85.5 85.0 84.6 84.0 83.7 83.1 82.7 82.2 81.9 81.2 29.7 30.0 30.4 30.8 31.2 31.4 31.9 32.2 32.7 33.0 33.5 106.5 86.0 85.3 85.1 84.8 84.1 83.8 83.2 82.9 82.4 82.1 81.5 29.6 30.0 30.3 30.7 31.1 31.3 31.8 32.1 34.6 32.9 33.3 107.0 86.1 85.8 85.3 85.0 84.4 84.0 83.6 83.1 82.6 82.3 81.8 29.5 29.8 30.2 30.4 30.9 31.5 31.5 31.9 32.3 32.7 33.0 107.5 86.6 86.0 85.6 85.1 84.7 84.1 83.7 83.3 82.8 82.4 82.0 29.0 29.6 30.0 30.3 31.7 31.1 31.4 31.7 32.1 32.6 32.9 108.0 86.7 86.2 85.7 85.3 84.8 84.6 83.9 83.6 83.0 82.7 82.2 28.9 29.4 29.9 30.2 30.7 30.8 31.2 31.5 32.0 32.2 32.7

153 | P a g e
GDT 67 Table 5: C Curve; Table C-4
32.5 33.0 33.5 34.0 34.5 35.0 35.5 36.0 36.5 37.0 37.5 98.5 to 103.0 0.0 0.0 0.0 0.0 0.0 0.0 0.0 0.0 0.0 0.0 0.0 0.0 0.0 0.0 0.0 0.0 0.0 0.0 0.0 0.0 0.0 0.0 103.5 80.0 0.0 0.0 0.0 0.0 0.0 0.0 0.0 0.0 0.0 0.0 34.6 0.0 0.0 0.0 0.0 0.0 0.0 0.0 0.0 0.0 0.0
104.0 80.2 0.0 0.0 0.0 0.0 0.0 0.0 0.0 0.0 0.0 0.0 34.5 0.0 0.0 0.0 0.0 0.0 0.0 0.0 0.0 0.0 0.0
104.5 80.3 79.9 0.0 0.0 0.0 0.0 0.0 0.0 0.0 0.0 0.0 34.4 34.7 0.0 0.0 0.0 0.0 0.0 0.0 0.0 0.0 0.0
105.0 80.6 80.0 0.0 0.0 0.0 0.0 0.0 0.0 0.0 0.0 0.0 34.1 34.6 0.0 0.0 0.0 0.0 0.0 0.0 0.0 0.0 0.0
105.5 80.7 80.3 79.9 0.0 0.0 0.0 0.0 0.0 0.0 0.0 0.0 34.0 34.4 34.7 0.0 0.0 0.0 0.0 0.0 0.0 0.0 0.0
106.0 80.8 80.5 80.2 0.0 0.0 0.0 0.0 0.0 0.0 0.0 0.0 33.9 34.2 34.5 0.0 0.0 0.0 0.0 0.0 0.0 0.0 0.0
106.5 81.1 80.6 80.3 79.8 0.0 0.0 0.0 0.0 0.0 0.0 0.0 33.6 34.1 34.4 34.8 0.0 0.0 0.0 0.0 0.0 0.0 0.0
107.0 81.4 80.9 80.6 80.1 0.0 0.0 0.0 0.0 0.0 0.0 0.0 33.4 33.9 34.1 34.5 0.0 0.0 0.0 0.0 0.0 0.0 0.0
107.5 81.6 81.1 80.7 80.3 80.0 0.0 0.0 0.0 0.0 0.0 0.0 33.2 33.6 34.0 34.4 34.6 0.0 0.0 0.0 0.0 0.0 0.0
108.0 81.9 81.4 80.9 80.7 0.0 0.0 0.0 0.0 0.0 0.0 0.0 33.0 33.4 33.9 34.0 0.0 0.0 0.0 0.0 0.0 0.0 0.0
108.5 82.1 81.7 0.0 0.0 0.0 0.0 0.0 0.0 0.0 0.0 0.0 32.9 33.2 0.0 0.0 0.0 0.0 0.0 0.0 0.0 0.0 0.0
109.0 82.2 0.0 0.0 0.0 0.0 0.0 0.0 0.0 0.0 0.0 0.0 32.7 0.0 0.0 0.0 0.0 0.0 0.0 0.0 0.0 0.0 0.0
109.5 to 117.0 0.0 0.0 0.0 0.0 0.0 0.0 0.0 0.0 0.0 0.0 0.0 0.0 0.0 0.0 0.0 0.0 0.0 0.0 0.0 0.0 0.0 0.0

154 | P a g e
GDT 67 Table 6: C Curve; Table C-5
10.5 11.0 11.5 12.0 12.5 13.0 13.5 14.0 14.5 15.0 15.5 108.5 to 0.0 0.0 0.0 0.0 0.0 0.0 0.0 0.0 0.0 0.0 0.0 111.0 0.0 0.0 0.0 0.0 0.0 0.0 0.0 0.0 0.0 0.0 0.0 111.5 0.0 0.0 0.0 0.0 0.0 0.0 0.0 0.0 0.0 102.7 102.0 0.0 0.0 0.0 0.0 0.0 0.0 0.0 0.0 0.0 18.2 18.6 112.0 0.0 0.0 0.0 0.0 0.0 0.0 0.0 0.0 104.0 102.7 102.1 0.0 0.0 0.0 0.0 0.0 0.0 0.0 0.0 17.5 18.2 18.5 112.5 0.0 0.0 0.0 0.0 0.0 0.0 0.0 104.6 104.1 102.7 102.1 0.0 0.0 0.0 0.0 0.0 0.0 0.0 17.3 17.4 18.2 18.5 113.0 0.0 0.0 0.0 0.0 0.0 0.0 106.3 104.7 104.2 103.0 102.3 0.0 0.0 0.0 0.0 0.0 0.0 16.5 17.2 17.4 18.0 18.4 113.5 0.0 0.0 0.0 0.0 0.0 0.0 106.6 104.8 104.4 103.0 102.5 0.0 0.0 0.0 0.0 0.0 0.0 16.3 17.1 17.3 18.0 18.3 114.0 0.0 0.0 0.0 0.0 0.0 107.9 106.7 104.9 104.5 103.3 102.6 0.0 0.0 0.0 0.0 0.0 15.8 16.3 17.0 17.3 17.9 18.3 114.5 0.0 0.0 0.0 0.0 0.0 107.9 107.2 105.9 104.6 103.3 102.7 0.0 0.0 0.0 0.0 0.0 15.8 16.0 16.7 17.3 17.9 18.2 115.0 0.0 0.0 0.0 109.8 109.0 108.0 107.4 106.0 105.3 103.4 103.0 0.0 0.0 0.0 14.9 15.2 15.7 16.0 16.6 16.8 17.7 18.0 115.5 0.0 0.0 0.0 109.9 109.1 108.1 107.5 106.1 105.4 104.0 103.1 0.0 0.0 0.0 14.9 15.2 15.7 15.9 16.5 16.8 17.5 18.0 116.0 0.0 0.0 111.2 110.0 109.2 108.2 107.5 106.2 105.6 104.3 103.3 0.0 0.0 14.4 14.8 15.1 15.6 15.9 16.5 16.7 17.4 17.9 116.5 0.0 0.0 111.4 110.1 109.5 108.3 107.6 106.4 105.7 104.3 103.8 0.0 0.0 14.3 14.7 15.0 15.5 15.8 16.4 16.6 17.4 17.6 117.0 113.1 112.0 111.5 110.1 109.7 108.4 107.9 106.5 106.0 104.5 104.0 13.6 14.0 14.3 14.7 15.0 15.5 15.8 16.5 16.6 17.3 17.5

155 | P a g e
GDT 67 Table 7: C Curve; Table C-6
16.0 16.5 17.0 17.5 18.0 18.5 19.0 19.5 20.0 20.5 21.0 108.5 0.0 0.0 0.0 0.0 97.1 96.2 95.3 94.9 94.2 93.8 93.2 0.0 0.0 0.0 0.0 21.4 21.8 22.4 22.7 23.3 23.6 24.0 109.0 0.0 0.0 98.5 97.8 97.2 96.5 95.4 95.0 94.3 94.0 93.5 0.0 0.0 20.6 21.0 21.3 21.7 22.3 22.7 23.1 23.4 23.8 109.5 0.0 0.0 98.6 97.8 97.3 96.5 95.7 95.1 94.5 94.0 93.6 0.0 0.0 20.5 21.0 21.3 21.7 22.1 22.5 23.1 23.4 23.7 110.0 100.4 99.9 98.8 98.0 97.4 96.8 95.8 95.3 94.6 94.3 93.8 19.4 19.8 20.4 20.8 21.2 21.5 22.1 22.4 23.0 23.2 23.6 110.5 100.4 100.0 98.8 98.1 97.6 97.0 95.9 95.4 94.7 94.4 93.9 19.4 19.7 20.4 20.8 21.1 21.4 22.0 22.3 22.9 23.1 23.5 111.0 100.6 100.1 98.9 98.3 97.7 97.2 96.0 95.6 94.9 94.5 94.0 19.3 19.7 20.3 20.7 21.0 21.3 21.9 22.2 22.7 23.1 23.4 111.5 101.3 100.3 98.9 98.5 97.7 97.2 96.3 95.7 95.0 94.6 94.2 18.9 19.6 20.3 20.6 21.0 21.3 21.7 22.1 22.7 23.0 23.3 112.0 101.4 100.3 99.1 98.6 98.0 97.4 96.7 95.9 95.2 94.9 94.3 18.8 19.3 20.2 20.5 20.8 21.2 21.5 22.0 22.5 22.7 23.1 112.5 101.5 100.5 99.3 98.8 98.1 97.5 96.8 96.5 95.4 95.0 94.6 18.8 19.1 20.1 20.4 20.8 21.2 21.5 21.7 22.3 22.7 23.0 113.0 101.7 106.0 99.9 99.4 98.3 97.8 97.1 96.6 95.7 95.4 94.7 18.7 19.0 19.8 20.0 20.7 21.0 21.4 21.7 22.1 22.3 22.9 113.5 107.7 101.0 100.0 99.5 98.4 97.9 97.3 96.9 95.8 95.4 94.8 18.7 19.0 19.8 20.0 20.6 20.9 21.3 21.5 22.1 22.3 20.8 114.0 101.8 101.1 100.2 99.7 98.3 98.1 97.5 97.1 96.2 95.6 95.0 18.6 19.0 19.7 20.0 20.4 20.8 21.2 21.4 21.8 22.2 22.7 114.5 101.9 101.2 100.3 99.8 98.9 98.3 97.6 97.3 96.4 95.8 95.2 18.6 18.9 19.5 19.9 20.3 20.7 21.2 21.3 21.6 22.0 22.5 115.0 102.0 101.4 100.6 100.1 99.4 98.6 97.9 97.5 97.0 96.2 95.6 18.6 18.8 19.3 19.7 20.2 20.5 20.9 21.2 21.4 21.8 22.2 115.5 102.2 101.8 101.0 100.2 99.6 98.8 98.1 97.8 97.2 96.4 95.8 18.4 18.6 19.0 19.7 20.0 20.4 20.8 21.0 21.3 21.6 22.0 116.0 102.5 101.9 101.0 100.6 99.8 99.5 98.4 98.0 97.4 97.0 96.1 18.3 18.5 19.0 19.3 19.9 20.0 20.6 20.8 21.2 21.4 21.8 116.5 102.6 102.0 101.2 100.7 100.0 99.6 98.6 98.2 97.8 97.3 96.4 18.3 18.6 18.9 19.3 19.8 20.0 20.5 20.7 21.0 21.3 21.6 117.0 103.0 102.5 101.6 101.0 100.3 99.7 99.0 98.6 97.9 97.4 97.0 18.0 18.3 18.7 19.0 19.5 20.0 20.3 20.5 20.9 21.2 21.4

156 | P a g e
GDT 67 Table 8: C Curve; Table C-7
21.5 22.0 22.5 23.0 23.5 24.0 24.5 25.0 25.5 26.0 26.5 108.5 92.8 92.2 91.8 91.0 90.7 89.9 89.4 88.7 88.2 87.7 87.3 24.3 24.7 25.0 25.7 25.9 26.5 26.9 27.3 27.7 28.2 20.5 109.0 92.8 92.3 92.0 91.2 90.8 90.0 89.6 88.9 88.6 88.0 87.6 24.3 24.7 24.9 25.5 25.8 26.5 26.8 27.2 27.4 27.9 28.2 109.5 93.0 92.4 92.0 91.3 90.9 90.3 89.8 89.1 88.6 88.1 87.6 24.2 24.6 24.9 25.5 25.8 26.3 26.6 27.1 27.4 27.8 28.2 110.0 93.3 92.7 92.2 91.6 91.2 90.4 90.0 89.4 89.0 88.3 88.0 24.0 24.4 24.7 25.2 25.5 26.2 26.5 26.9 27.1 27.7 27.9 110.5 93.4 92.8 92.3 91.9 91.3 90.8 90.1 89.6 89.2 88.6 88.2 24.9 24.3 24.7 25.0 25.5 25.8 26.4 26.8 27.0 27.4 27.7 111.0 93.7 93.0 92.6 92.0 91.6 90.9 90.4 89.9 89.4 88.9 88.5 23.7 24.2 24.4 24.9 25.2 25.8 26.2 26.5 26.9 27.2 27.5 111.5 93.8 93.2 92.7 92.1 91.7 91.2 90.7 90.0 89.7 89.1 88.7 23.6 24.0 24.4 24.8 25.1 25.5 25.9 26.5 26.7 27.1 27.3 112.0 94.0 93.5 92.9 92.4 92.0 9 1.4 91.0 90.4 90.0 89.5 89.0 23.4 23.8 24.2 24.6 24.9 25.4 25.7 26.2 26.5 26.8 27.1 112.5 94.1 93.7 93.1 92.6 92.1 91.6 91.2 90.7 90.2 89.7 89.1 23.4 23.7 24.1 24.4 24.8 25.2 25.5 25.9 26.3 26.7 27.1 113.0 94.3 93.9 93.5 92.8 92.4 91.8 91.5 90.9 90.6 90.0 89.6 23.0 23.5 23.8 24.3 24.6 25.0 25.3 25.8 26.0 26.5 26.8 113.5 96.4 94.0 93.6 93.0 92.6 92.0 91.7 91.0 90.7 90.3 0.0 23.0 23.4 23.7 24.1 24.4 24.9 25.1 25.7 25.9 26.3 0.0 114.0 94.7 94.2 94.0 93.3 92.8 92.3 92.0 91.4 91.0 0.0 0.0 22.9 23.3 23.4 23.9 24.3 24.7 24.9 25.4 25.7 0.0 0.0 114.5 94.8 94.4 94.1 93.6 93.0 92.4 92.1 91.6 0.0 0.0 0.0 20.8 23.1 23.4 23.7 24.1 24.6 24.8 25.2 0.0 0.0 0.0 115.0 95.1 94.7 94.4 93.8 93.5 92.8 0.0 0.0 0.0 0.0 0.0 22.6 22.9 23.1 23.6 23.8 24.3 0.0 0.0 0.0 0.0 0.0 115.5 95.4 94.8 94.5 94.0 93.7 0.0 0.0 0.0 0.0 0.0 0.0 22.3 20.8 23.1 23.4 23.7 0.0 0.0 0.0 0.0 0.0 0.0 116.0 95.7 95.0 94.7 94.3 0.0 0.0 0.0 0.0 0.0 0.0 0.0 22.1 22.7 22.9 23.2 0.0 0.0 0.0 0.0 0.0 0.0 0.0 116.5 95.8 95.3 94.8 0.0 0.0 0.0 0.0 0.0 0.0 0.0 0.0 22.0 22.5 20.8 0.0 0.0 0.0 0.0 0.0 0.0 0.0 0.0 117.0 96.2 95.7 0.0 0.0 0.0 0.0 0.0 0.0 0.0 0.0 0.0 21.8 22.1 0.0 0.0 0.0 0.0 0.0 0.0 0.0 0.0 0.0 117.5 96.6 0.0 0.0 0.0 0.0 0.0 0.0 0.0 0.0 0.0 0.0 21.7 0.0 0.0 0.0 0.0 0.0 0.0 0.0 0.0 0.0 0.0
118.0 to 0.0 0.0 0.0 0.0 0.0 0.0 0.0 0.0 0.0 0.0 0.0 126.0 0.0 0.0 0.0 0.0 0.0 0.0 0.0 0.0 0.0 0.0 0.0

157 | P a g e
GDT 67 Table 9: C Curve; Table C-8
27.0 27.5 28.0 28.5 29.0 29.5 30.0 30.5 31.0 31.5 32.0 108.5 86.8 86.4 85.8 85.5 85.0 84.7 84.2 83.7 83.2 82.9 82.4 28.8 29.2 29.8 30.0 30.4 30.7 31.0 31.4 31.8 32.1 32.6
109.0 87.0 86.7 86.1 85.7 85.3 85.0 84.5 84.0 83.5 83.1 82.7 28.7 28.9 29.5 29.9 30.2 30.4 30.8 31.2 31.6 31.9 32.2 109.5 87.1 86.8 86.3 85.8 85.5 85.1 84.7 84.2 83.8 83.3 0.0 28.6 28.8 29.3 29.8 30.0 30.3 30.7 31.0 31.1 31.7 0.0 110.0 87.5 87.1 86.6 86.2 85.7 85.4 84.9 84.6 84.2 0.0 0.0 28.3 28.6 29.0 29.4 29.9 30.1 30.5 30.8 31.0 0.0 0.0 110.5 87.7 87.2 86.8 86.4 85.9 85.6 85.2 84.8 0.0 0.0 0.0 28.2 28.6 28.8 29.2 29.7 30.0 30.2 30.7 0.0 0.0 0.0 111.0 88.0 87.5 87.0 86.7 86.2 85.8 85.5 0.0 0.0 0.0 0.0 27.9 28.3 28.7 28.9 29.4 29.8 30.0 0.0 0.0 0.0 0.0 111.5 88.2 87.8 87.4 86.9 86.6 0.0 0.0 0.0 0.0 0.0 0.0 27.7 28.0 28.4 28.8 29.0 0.0 0.0 0.0 0.0 0.0 0.0 112.0 88.4 88.1 87.7 87.2 0.0 0.0 0.0 0.0 0.0 0.0 0.0 27.5 27.8 28.2 28.6 0.0 0.0 0.0 0.0 0.0 0.0 0.0 112.5 88.7 88.3 0.0 0.0 0.0 0.0 0.0 0.0 0.0 0.0 0.0 27.3 27.7 0.0 0.0 0.0 0.0 0.0 0.0 0.0 0.0 0.0 113.0 89.1 0.0 0.0 0.0 0.0 0.0 0.0 0.0 0.0 0.0 0.0 27.1 0.0 0.0 0.0 0.0 0.0 0.0 0.0 0.0 0.0 0.0 113.5 to 0.0 0.0 0.0 0.0 0.0 0.0 0.0 0.0 0.0 0.0 0.0 126.0 0.0 0.0 0.0 0.0 0.0 0.0 0.0 0.0 0.0 0.0 0.0

158 | P a g e
GDT 67 Table 10: C Curve; Table C-9
4.0 4.5 5.0 5.5 6.0 6.5 7.0 7.5 8.0 8.5 9.0 9.5 10.0 117.5 to 0.0 0.0 0.0 0.0 0.0 0.0 0.0 0.0 0.0 0.0 0.0 0.0 0.0 118.5 0.0 0.0 0.0 0.0 0.0 0.0 0.0 0.0 0.0 0.0 0.0 0.0 0.0 119.0 0.0 0.0 0.0 0.0 0.0 0.0 0.0 0.0 0.0 0.0 0.0 115.2 114.4 0.0 0.0 0.0 0.0 0.0 0.0 0.0 0.0 0.0 0.0 0.0 12.8 13.1 119.5 0.0 0.0 0.0 0.0 0.0 0.0 0.0 0.0 0.0 0.0 0.0 115.4 114.6 0.0 0.0 0.0 0.0 0.0 0.0 0.0 0.0 0.0 0.0 0.0 12.7 13.0 120.0 0.0 0.0 0.0 0.0 0.0 0.0 0.0 0.0 0.0 0.0 116.5 115.7 114.9 0.0 0.0 0.0 0.0 0.0 0.0 0.0 0.0 0.0 0.0 12.5 12.6 12.9 120.5 0.0 0.0 0.0 0.0 0.0 0.0 0.0 0.0 0.0 0.0 116.6 115.9 115.0 0.0 0.0 0.0 0.0 0.0 0.0 0.0 0.0 0.0 0.0 12.2 12.5 12.9 121.0 0.0 0.0 0.0 0.0 0.0 0.0 0.0 0.0 0.0 117.6 116.7 116.0 115.2 0.0 0.0 0.0 0.0 0.0 0.0 0.0 0.0 0.0 11.8 12.2 12.4 12.8 121.5 0.0 0.0 0.0 0.0 0.0 0.0 0.0 0.0 0.0 117.8 117.1 116.2 115.2 0.0 0.0 0.0 0.0 0.0 0.0 0.0 0.0 0.0 11.7 12.0 12.3 12.8 122.0 0.0 0.0 0.0 0.0 0.0 0.0 0.0 119.4 118.8 117.9 117.3 116.4 115.3 0.0 0.0 0.0 0.0 0.0 0.0 0.0 11.0 11.4 11.7 11.9 12.3 12.8 122.5 0.0 0.0 0.0 0.0 0.0 0.0 0.0 119.6 118.9 118.1 117.3 116.5 115.7 0.0 0.0 0.0 0.0 0.0 0.0 0.0 11.0 11.3 11.5 11.9 12.2 12.6 123.0 0.0 0.0 0.0 0.0 0.0 0.0 0.0 119.7 119.1 118.5 117.5 117.0 115.9 0.0 0.0 0.0 0.0 0.0 0.0 0.0 10.9 11.2 11.9 11.8 12.1 12.5 123.5 0.0 0.0 0.0 0.0 0.0 0.0 120.3 119.8 119.2 118.5 117.6 117.2 116.0 0.0 0.0 0.0 0.0 0.0 0.0 10.6 10.8 11.1 11.4 11.8 12.0 12.4 124.0 0.0 0.0 0.0 0.0 0.0 0.0 120.5 119.9 119.4 118.8 117.7 117.3 116.1 0.0 0.0 0.0 0.0 0.0 0.0 10.5 10.8 11.0 11.4 11.7 11.9 12.4 124.5 0.0 0.0 0.0 0.0 0.0 0.0 120.6 120.0 119.4 118.9 117.8 117.4 116.2 0.0 0.0 0.0 0.0 0.0 0.0 10.5 10.7 11.0 11.3 11.7 11.8 12.3 125.0 0.0 0.0 0.0 0.0 0.0 122.5 121.7 120.2 119.6 119.2 118.4 117.6 116.5 0.0 0.0 0.0 0.0 0.0 9.9 10.3 10.6 11.0 11.1 11.5 11.8 12.2 125.5 0.0 0.0 0.0 0.0 0.0 122.6 121.8 120.4 119.6 119.2 118.6 117.6 116.7 0.0 0.0 0.0 0.0 0.0 9.9 10.1 10.6 11.0 11.1 11.4 11.8 12.2 126.0 0.0 0.0 0.0 0.0 0.0 122.8 121.9 120.6 119.8 119.4 118.8 117.7 117.0 0.0 0.0 0.0 0.0 0.0 9.8 10.1 10.5 10.8 11.0 11.4 11.7 12.1

159 | P a g e
GDT 67 Table 11: C Curve; Table C-10
10.5 11.0 11.5 12.0 12.5 13.0 13.5 14.0 14.5 15.0 15.5 117.5 113.2 112.3 111.6 110.7 109.8 108.8 107.9 106.6 106.0 104.7 104.2 13.6 13.8 14.2 14.5 14.9 15.3 15.8 16.6 16.6 17.2 17.4 118.0 113.4 112.6 111.7 111.0 109.9 109.0 108.0 106.2 106.2 104.8 104.5 13.5 13.8 14.2 14.4 14.9 15.2 15.7 16.5 16.5 17.1 17.3 118.5 113.6 112.7 112.0 111.0 110.0 109.1 108.1 106.3 106.3 105.3 104.5 13.4 13.7 14.0 14.4 14.8 15.2 16.0 16.5 16.5 16.8 17.3 119.0 113.7 113.0 112.2 111.1 110.5 109.3 108.6 107.5 107.2 105.5 105.0 13.3 13.7 13.9 14.4 14.6 15.1 15.4 15.9 16.2 16.7 17.0 119.5 114.0 113.1 112.4 111.4 110.7 109.4 108.8 107.7 107.1 105.8 105.3 13.2 13.6 13.8 14.3 14.5 15.0 15.3 15.8 16.1 16.1 16.8 120.0 114.4 113.2 112.4 111.4 110.8 109.6 108.9 107.9 107.4 106.0 105.5 13.1 13.6 13.8 14.3 14.4 15.0 15.2 15.8 16.0 16.6 16.7 120.5 114.4 113.3 112.6 111.6 111.0 109.7 109.0 108.0 107.5 106.2 105.7 13.1 13.5 13.8 14.2 14.4 15.0 15.2 15.7 15.9 16.5 16.6 121.0 114.6 113.5 112.8 111.9 111.2 109.7 109.2 108.1 107.6 106.4 106.0 13.0 13.5 13.7 14.1 14.4 15.0 15.1 15.7 15.8 16.4 16.6 121.5 114.7 113.7 113.0 112.0 111.4 110.0 109.5 108.3 107.8 107.0 106.2 12.9 13.3 13.7 14.0 14.3 14.4 15.0 15.5 15.7 16.2 16.5 122.0 114.9 113.8 113.1 112.2 111.5 110.6 109.7 108.7 108.1 107.2 106.6 12.9 13.3 13.6 13.9 14.3 14.2 15.0 15.3 15.7 16.0 16.3 122.5 115.0 114.2 113.2 112.3 111.6 110.8 109.9 109.0 108.2 107.4 107.0 12.8 13.2 13.6 13.8 14.2 14.4 14.9 15.2 15.6 16.0 16.2 123.0 115.2 114.5 113.3 112.5 110.9 111.0 110.5 109.2 108.7 107.7 107.2 12.8 13.1 13.5 13.8 14.0 14.4 14.6 15.1 15.3 15.8 16.0 123.5 115.2 114.6 113.5 112.7 112.0 111.1 110.6 109.4 109.0 108.0 107.5 12.8 13.0 13.5 12.7 14.0 14.4 14.6 15.0 15.2 15.7 15.9 124.0 115.6 114.8 114.2 113.0 112.3 111.4 110.8 109.8 109.2 108.3 107.7 12.3 13.0 13.2 13.7 13.8 14.3 14.4 14.9 15.1 15.5 15.8 124.5 115.8 114.8 114.4 113.0 112.5 111.6 111.0 110.1 109.4 108.6 108.0 12.5 13.0 13.1 13.7 13.8 14.2 14.4 14.7 15.0 15.4 15.7 125.0 115.9 115.0 114.5 113.5 112.7 112.0 111.2 110.4 109.8 109.0 0.0 12.5 12.8 13.1 13.5 13.7 14.0 14.4 14.6 14.9 15.2 0.0 125.5 116.0 115.3 114.7 113.6 113.0 112.1 111.5 110.7 110.0 109.4 0.0 12.4 12.8 13.0 13.4 13.7 14.0 14.3 14.5 14.8 15.0 0.0 126.0 116.2 115.5 114.9 114.1 113.2 112.6 111.9 111.0 110.3 0.0 0.0 12.3 12.7 12.9 13.3 13.6 13.8 14.1 14.4 14.7 0.0 0.0

160 | P a g e
GDT 67 Table 12: C Curve; Table C-11
16.0 16.5 17.0 17.5 18.0 18.5 19.0 19.5 20.0 20.5 21.0 117.5 103.2 102.6 101.8 101.2 100.4 100.0 99.1 98.8 98.1 97.7 97.2 17.9 18.3 18.6 18.9 19.4 19.8 20.2 20.4 20.8 21.0 21.3 118.0 103.3 102.8 102.0 101.4 100.9 100.3 99.6 99.2 98.5 98.0 97.6 17.9 18.2 18.6 18.8 19.2 19.5 20.0 20.2 20.6 20.8 21.1 118.5 103.8 103.2 102.3 101.8 101.0 100.6 100.0 99.6 98.9 98.4 0.0 17.6 17.9 18.4 18.6 19.0 19.3 19.8 20.0 20.3 20.6 0.0 119.0 104.1 103.6 102.6 102.1 101.3 101.0 100.3 99.9 99.2 0.0 0.0 17.4 17.7 18.3 18.5 18.9 19.0 19.5 19.8 20.2 0.0 0.0 119.5 104.3 103.9 102.9 102.4 101.6 101.1 100.6 0.0 0.0 0.0 0.0 17.4 17.5 18.1 18.4 18.7 19.0 19.3 0.0 0.0 0.0 0.0 120.0 104.6 104.1 103.3 102.7 102.1 101.6 101.2 0.0 0.0 0.0 0.0 17.3 17.4 17.9 18.2 18.5 18.7 18.9 0.0 0.0 0.0 0.0 120.5 104.8 104.3 103.5 103.0 102.3 101.9 0.0 0.0 0.0 0.0 0.0 17.1 17.4 17.7 18.0 18.4 18.3 0.0 0.0 0.0 0.0 0.0 121.0 105.1 104.5 104.0 103.5 102.8 0.0 0.0 0.0 0.0 0.0 0.0 16.8 17.3 17.5 17.7 18.1 0.0 0.0 0.0 0.0 0.0 0.0 121.5 105.3 104.8 104.3 103.7 0.0 0.0 0.0 0.0 0.0 0.0 0.0 16.8 17.1 17.4 17.6 0.0 0.0 0.0 0.0 0.0 0.0 0.0 122.0 105.8 105.0 104.5 0.0 0.0 0.0 0.0 0.0 0.0 0.0 0.0 16.6 17.0 17.3 0.0 0.0 0.0 0.0 0.0 0.0 0.0 0.0 122.5 106.0 105.3 104.8 0.0 0.0 0.0 0.0 0.0 0.0 0.0 0.0 16.6 16.8 17.1 0.0 0.0 0.0 0.0 0.0 0.0 0.0 0.0 123.0 106.3 105.7 0.0 0.0 0.0 0.0 0.0 0.0 0.0 0.0 0.0 16.5 16.6 0.0 0.0 0.0 0.0 0.0 0.0 0.0 0.0 0.0 123.5 106.8 0.0 0.0 0.0 0.0 0.0 0.0 0.0 0.0 0.0 0.0 16.3 0.0 0.0 0.0 0.0 0.0 0.0 0.0 0.0 0.0 0.0 124.0 107.0 0.0 0.0 0.0 0.0 0.0 0.0 0.0 0.0 0.0 0.0 16.0 0.0 0.0 0.0 0.0 0.0 0.0 0.0 0.0 0.0 0.0 124.5 to 126.0 0.0 0.0 0.0 0.0 0.0 0.0 0.0 0.0 0.0 0.0 0.0 0.0 0.0 0.0 0.0 0.0 0.0 0.0 0.0 0.0 0.0 0.0

161 | P a g e
GDT 67 Table 13: C Curve; Table C-12
4.0 4.5 5.0 5.5 6.0 6.5 7.0 7.5 8.0 8.5 9.0 9.5 10.0 126.5 0.0 0.0 0.0 0.0 0.0 123.0 122.0 121.0 120.0 119.5 118.9 118.0 117.3 0.0 0.0 0.0 0.0 0.0 9.8 10.0 10.4 10.7 11.0 11.3 11.6 11.9 127.0 0.0 0.0 0.0 124.4 123.7 123.0 122.2 121.7 120.1 119.7 119.1 118.5 117.4 0.0 0.0 0.0 9.2 9.5 9.8 10.0 10.3 10.7 10.9 11.2 11.4 11.8 127.5 0.0 0.0 125.1 124.6 124.0 123.2 122.2 121.7 120.3 119.7 119.3 118.8 117.9 0.0 0.0 9.0 9.2 9.4 9.7 10.0 10.3 10.6 10.9 11.0 11.3 11.7 128.0 0.0 0.0 125.5 124.8 124.2 123.6 122.7 121.8 120.6 120.0 119.4 119.0 117.7 0.0 0.0 8.8 9.1 9.3 9.6 9.8 10.1 10.5 10.7 11.0 11.2 11.7 128.5 0.0 0.0 125.7 125.0 124.4 123.8 122.7 122.0 120.9 120.3 119.5 119.2 118.0 0.0 0.0 8.7 9.0 9.2 9.6 9.8 10.0 10.4 10.6 11.0 11.1 11.6 129.0 0.0 0.0 125.8 125.1 124.5 124.1 123.0 122.4 121.5 120.5 119.7 119.4 118.6 0.0 0.0 8.8 9.0 9.2 9.4 9.8 10.0 10.2 10.6 10.9 11.0 11.4 129.5 0.0 0.0 126.0 125.3 124.6 124.2 123.5 122.7 121.8 120.8 120.0 119.6 118.8 0.0 0.0 8.7 8.9 9.2 9.3 9.6 9.8 10.1 10.5 10.7 11.0 11.3 130.0 0.0 126.8 126.0 125.7 124.9 124.4 123.7 122.8 122.1 121.5 120.4 119.7 119.1 0.0 8.5 8.7 8.7 9.0 9.2 9.5 9.8 10.0 10.2 10.6 10.9 11.2 130.5 0.0 127.1 126.2 125.8 125.0 124.5 123.9 123.3 122.3 121.9 120.6 120.0 119.4 0.0 8.4 8.6 8.8 9.0 9.2 9.4 19.7 9.9 10.1 10.5 10.7 11.0 131.0 128.3 127.8 126.5 126.0 125.3 124.8 124.3 123.6 122.7 122.0 121.2 120.3 119.7 7.9 8.1 8.6 8.7 8.9 9.1 9.3 9.6 9.8 10.0 10.3 10.6 10.9 131.5 128.5 128.0 126.8 126.1 125.6 124.9 124.4 123.8 123.0 122.3 121.6 120.6 119.8 7.8 8.0 8.5 8.7 8.8 9.0 9.2 9.6 9.8 9.9 10.2 10.5 10.8 132.0 129.0 128.1 127.5 126.5 125.9 125.3 124.7 124.1 123.5 122.6 121.9 121.9 121.3 7.7 8.0 8.3 8.6 8.7 8.9 9.2 9.4 9.6 9.9 10.1 10.1 10.3 132.5 129.17 128.6 127.8 126.6 126.0 125.5 124.8 124.4 123.8 123.2 122.1 121.8 120.6 .7 7.8 8.2 8.5 8.7 8.8 8.8 9.2 9.6 9.7 10.0 10.1 10.5 133.0 129.4 129.0 128.0 127.5 126.4 125.9 125.1 124.7 124.1 123.5 122.6 122.0 121.2 7.6 7.7 8.0 8.3 8.6 8.7 9.0 9.2 9.4 9.6 9.9 10.0 10.3 133.5 130.4 129.1 128.2 127.7 126.7 126.1 125.4 124.9 124.4 123.8 122.9 122.4 121.6 7.2 7.7 8.0 8.2 8.5 8.7 8.9 9.0 9.2 9.6 9.8 10.0 10.2 134.0 130.7 130.1 128.7 128.0 127.5 126.5 125.9 125.3 124.7 124.2 123.6 122.9 0.0 7.1 7.2 7.8 8.0 8.3 8.6 8.7 8.9 9.2 9.3 9.6 9.8 0.0 134.5 131.0 130.2 129.0 128. 127.6 126.8 126.1 125.8 124.9 124.6 123.9 123.2 0.0 7.0 7.2 7.7 7.9 8.2 8.5 8.7 8.8 9.0 9.2 9.4 9.7 0.0 135.0 131.6 130.6 129.2 128.7 128.0 127.5 126.6 126.0 125.5 124.8 124.2 0.0 0.0 6.8 7.3 7.7 7.8 8.0 8.3 8.5 8.7 8.8 9.1 9.3 0.0 0.0

162 | P a g e
GDT 67 Table 14: C Curve; Table C-13
10.5 11.0 11.5 12.0 12.5 13.0 13.5 14.0 14.5 15.0 126.5 116.5 115.8 115.0 114.4 113.5 112.9 112.1 111.2 0.0 0.0 12.2 12.6 12.9 13.1 13.5 13.7 14.0 14.3 0.0 0.0 127.0 117.0 116.0 115.4 114.7 114.0 113.1 112.4 111.7 0.0 0.0 12.1 12.4 12.7 13.0 13.2 13.6 13.8 14.2 0.0 0.0 127.5 117.1 116.2 115.7 114.8 114.4 113.3 112.7 0.0 0.0 0.0 12.0 12.3 12.6 13.0 13.1 13.5 13.7 0.0 0.0 0.0 128.0 117.3 116.7 116.0 115.2 114.7 114.0 0.0 0.0 0.0 0.0 11.9 12.2 12.4 12.8 13.0 13.2 0.0 0.0 0.0 0.0 128.5 117.6 116.7 116.3 115.5 115.0 114.4 0.0 0.0 0.0 0.0 11.8 12.2 12.3 12.7 12.9 13.1 0.0 0.0 0.0 0.0 129.0 117.7 117.2 116.7 115.8 115.3 0.0 0.0 0.0 0.0 0.0 11.7 12.0 12.2 12.6 12.8 0.0 0.0 0.0 0.0 0.0 129.5 118.0 117.4 117.0 116.0 115.5 0.0 0.0 0.0 0.0 0.0 11.6 11.8 12.1 12.4 12.7 0.0 0.0 0.0 0.0 0.0 130.0 118.5 117.7 117.3 116.6 0.0 0.0 0.0 0.0 0.0 0.0 11.4 11.7 11.9 12.2 0.0 0.0 0.0 0.0 0.0 0.0 130.5 118.9 118.0 117.5 117.0 0.0 0.0 0.0 0.0 0.0 0.0 11.3 11.6 11.8 12.1 0.0 0.0 0.0 0.0 0.0 0.0 131.0 119.1 118.6 117.9 0.0 0.0 0.0 0.0 0.0 0.0 0.0 11.2 11.4 11.7 0.0 0.0 0.0 0.0 0.0 0.0 0.0 131.5 119.4 118.8 0.0 0.0 0.0 0.0 0.0 0.0 0.0 0.0 11.0 11.3 0.0 0.0 0.0 0.0 0.0 0.0 0.0 0.0 132.0 119.9 119.2 0.0 0.0 0.0 0.0 0.0 0.0 0.0 0.0 10.7 11.1 0.0 0.0 0.0 0.0 0.0 0.0 0.0 0.0 132.5 120.0 0.0 0.0 0.0 0.0 0.0 0.0 0.0 0.0 0.0 10.7 0.0 0.0 0.0 0.0 0.0 0.0 0.0 0.0 0.0 133.0 to 135.0 0.0 0.0 0.0 0.0 0.0 0.0 0.0 0.0 0.0 0.0 0.0 0.0 0.0 0.0 0.0 0.0 0.0 0.0 0.0 0.0

163 | P a g e
GDT 67 Table 15: C Curve; Table C-14
4.0 4.5 5.0 5.5 6.0 6.5 7.0 7.5 8.0 8.5 9.0 9.5 10.0 135.5 131.7 130.7 129.3 128.9 128.3 127.7 126.9 126.4 125.1 125.1 0.0 0.0 0.0 6.8 7.1 7.7 7.8 7.9 8.2 8.4 8.6 8.8 9.0 0.0 0.0 0.0 136.0 131.9 131.2 130.1 129.3 128.6 128.1 127.6 126.9 126.3 125.8 0.0 0.0 0.0 6.7 7.0 7.2 7.6 7.8 8.0 8.2 8.4 8.7 8.8 0.0 0.0 0.0 136.5 132.8 131.5 130.4 130.0 128.9 128.5 127.9 127.4 126.6 126.1 0.0 0.0 0.0 6.5 6.8 7.4 7.3 7.8 7.8 8.1 8.3 8.5 8.7 0.0 0.0 0.0 137.0 133.0 132.3 130.8 130.2 129.3 128.7 128.3 127.8 127.2 0.0 0.0 0.0 0.0 6.4 6.6 7.0 7.2 7.6 7.8 7.9 8.2 8.3 0.0 0.0 0.0 0.0 137.5 133.1 132.5 131.2 130.6 129.5 129.1 128.4 127.9 127.5 0.0 0.0 0.0 0.0 6.3 6.6 6.9 7.3 7.5 7.7 7.9 8.1 8.3 0.0 0.0 0.0 0.0 138.0 133.9 132.9 131.6 131.0 130.2 129.8 129.0 128.5 0.0 0.0 0.0 0.0 0.0 6.1 6.5 6.8 7.0 7.2 7.4 7.7 7.8 0.0 0.0 0.0 0.0 0.0 138.5 134.0 133.0 131.9 131.2 130.6 130.0 129.3 128.9 0.0 0.0 0.0 0.0 0.0 6.0 6.4 6.7 7.0 7.1 7.4 7.7 7.8 0.0 0.0 0.0 0.0 0.0 139.0 134.2 133.7 132.5 131.7 131.1 130.6 130.0 0.0 0.0 0.0 0.0 0.0 0.0 6.0 6.2 6.6 6.8 7.0 7.1 7.3 0.0 0.0 0.0 0.0 0.0 0.0 139.5 134.7 133.8 132.9 132.3 131.4 131.0 130.4 0.0 0.0 0.0 0.0 0.0 0.0 5.8 6.1 6.5 6.6 6.9 7.0 7.2 0.0 0.0 0.0 0.0 0.0 0.0 140.0 134.9 134.2 133.5 132.7 132.0 131.5 131.0 0.0 0.0 0.0 0.0 0.0 0.0 5.7 6.0 6.2 6.5 6.6 6.8 7.0 0.0 0.0 0.0 0.0 0.0 0.0 140.5 135.1 134.6 134.0 133.1 132.4 132.0 0.0 0.0 0.0 0.0 0.0 0.0 0.0 5.6 5.8 6.0 6.4 6.5 6.6 0.0 0.0 0.0 0.0 0.0 0.0 0.0 141.0 136.0 135.0 134.1 133.8 133.0 0.0 0.0 0.0 0.0 0.0 0.0 0.0 0.0 5.3 5.7 6.0 6.1 6.4 0.0 0.0 0.0 0.0 0.0 0.0 0.0 0.0 141.5 136.2 135.1 134.7 134.0 133.5 0.0 0.0 0.0 0.0 0.0 0.0 0.0 0.0 5.3 5.6 5.8 6.0 6.2 0.0 0.0 0.0 0.0 0.0 0.0 0.0 0.0 142.0 136.8 136.0 135.0 134.6 0.0 0.0 0.0 0.0 0.0 0.0 0.0 0.0 0.0 5.2 5.3 5.7 5.8 0.0 0.0 0.0 0.0 0.0 0.0 0.0 0.0 0.0 142.5 137.2 136.2 135.3 135.0 0.0 0.0 0.0 0.0 0.0 0.0 0.0 0.0 0.0 5.0 5.3 5.6 5.7 0.0 0.0 0.0 0.0 0.0 0.0 0.0 0.0 0.0 143.0 137.6 137.0 136.0 0.0 0.0 0.0 0.0 0.0 0.0 0.0 0.0 0.0 0.0 4.9 5.1 5.3 0.0 0.0 0.0 0.0 0.0 0.0 0.0 0.0 0.0 0.0 143.5 138.0 137.5 136.7 0.0 0.0 0.0 0.0 0.0 0.0 0.0 0.0 0.0 0.0 4.8 4.9 5.2 0.0 0.0 0.0 0.0 0.0 0.0 0.0 0.0 0.0 0.0 144.0 0.0 0.0 0.0 0.0 0.0 0.0 0.0 0.0 0.0 0.0 0.0 0.0 0.0 0.0 0.0 0.0 0.0 0.0 0.0 0.0 0.0 0.0 0.0 0.0 0.0 0.0

164 | P a g e
GDT 67 Table 67-4 Table 1: Table 67-4; Conversion for Proctor Soil Density Tests
Table
67-1a 67-1b 67-1c Weight in grams 1000-1495 1500-1995 2000-2495
The tables convert proctor soil specimen wet weight in grams to soil wet weight per cubic foot in pounds. NOTE: Table computed for proctor molds having capacity of 1/30 cubic foot. Table 2: Table 67-1a Wt in Wt. Wt. In Wt. Wt in Wt. Wt in Wt. Wt in Wt. grams Cu. Ft. grams Cu. Ft. grams Cu. grams Cu. grams Cu. Ft. Ft. Ft. 1000 66.0 1100 72.6 1200 79.2 1300 85.8 1400 92.4 1005 66.3 1105 72.9 1205 79.5 1305 86.1 1405 92.7 1010 66.7 1110 73.3 1210 79.9 1310 86.5 1410 93.1 1015 67.0 1115 73.6 1215 80.2 1315 86.8 1415 93.4 1020 67.3 1120 73.9 1220 80.5 1320 87.1 1420 93.7 1025 67.7 1125 74.3 1225 80.9 1325 87.5 1425 94.1 1030 68.0 1130 74.6 1230 81.2 1330 87.8 1430 94.4 1035 68.3 1135 74.9 1235 81.5 1335 88.1 1435 94.7 1040 68.6 1140 75.2 1240 81.8 1340 88.4 1440 95.0 1045 69.0 1145 75.6 1245 82.2 1345 88.8 1445 95.4 1050 69.3 1150 75.9 1250 82.5 1350 89.1 1450 95.7 1055 69.6 1155 76.2 1255 82.8 1355 89.4 1455 96.0 1060 70.0 1160 76.6 1260 83.2 1360 89.8 1460 96.4 1065 70.3 1165 76.9 1265 83.5 1365 90.1 1465 96.7 1070 70.6 1170 77.2 1270 83.8 1370 90.4 1470 97.0 1075 71.0 1175 77.6 1275 84.2 1375 90.8 1475 97.4 1080 71.3 1180 77.9 1280 84.5 1380 91.1 1480 97.7 1085 71.6 1185 78.2 1285 84.8 1385 91.4 1485 98.0 1090 71.9 1190 78.5 1290 85.1 1390 91.7 1490 98.3 1095 72.3 1195 78.9 1295 85.5 1395 92.1 1495 98.7

165 | P a g e
GDT 67
Table 3: Table 67-1b Wt in Wt. Wt. In Wt. Wt in Wt. Wt in Wt. Wt in Wt. grams Cu. Ft. grams Cu. Ft. grams Cu. grams Cu. grams Cu. Ft. Ft. Ft. 1500 99.0 1600 105.6 1700 112.2 1800 118.8 1900 25.4 1505 99.3 1605 105.9 1705 112.5 1805 119.1 1905 125.7 1510 99.7 1610 106.3 1710 112.9 1810 119.5 1910 126.1 1515 100.0 1615 106.6 1715 113.2 1815 119.8 1915 126.4 1520 100.3 1620 106.9 1720 113.5 1820 120.1 1920 126.7 1525 100.7 1525 107.3 1725 113.9 1825 120.5 1925 127.1 1530 101.0 1630 107.6 1730 114.2 1830 120.8 1930 127.4 1535 101.3 1635 107.9 1735 114.5 1835 121.1 1935 127.7 1540 101.6 1640 108.3 1740 114.8 1840 121.4 1940 128.0 1545 102.0 1645 108.6 1745 115.2 1845 121.8 1945 128.4 1550 102.3 1650 108.9 1750 115.5 1850 122.1 1950 128.7 1555 102.6 1655 109.2 1755 115.8 1855 112.4 1955 129.0 1560 103.0 1660 109.6 1760 116.2 1860 122.8 1960 129.4 1565 103.3 1665 109.9 1765 116.5 1865 123.1 1965 129.7 1570 103.6 1670 110.2 1770 116.8 1870 123.4 1970 130.0 1575 104.0 1675 110.6 1775 117.2 1875 123.8 1975 130.4 1580 104.3 1680 110.9 1780 117.5 1880 124.1 1980 130.7 1585 104.6 1685 111.2 1785 117.8 1885 124.4 1985 131.0 1590 104.9 1690 111.5 1790 118.1 1890 124.7 1990 131.4 1595 105.3 1695 111.9 1795 118.5 1895 125.1 1995 131.7

166 | P a g e
GDT 67
Table 4: Table 67-1c Wt in Wt. Wt. In Wt. Wt in Wt. Wt in Wt. Wt in Wt. grams Cu. Ft. grams Cu. Ft. grams Cu. Ft. grams Cu. grams Cu. Ft. Ft. 2000 132.0 2100 13806 2200 145.2 2300 151.8 2400 158.4 2005 132.3 2105 139.0 2205 145.5 2305 152.1 2405 158.7 2010 132.7 2110 139.3 2210 145.9 2310 152.5 2410 159.1 2015 133.0 2115 139.6 2215 1465.2 2315 152.8 2415 159.4 2020 133.3 2120 139.9 2220 146.5 2320 153.2 2420 159.7 2025 133.7 2125 140.3 2225 146.9 2325 153.5 2425 160.0 2030 134.0 2130 140.6 2230 147.2 2330 153.8 2430 160.4 2035 134.3 2135 140.9 2235 147.5 2335 154.1 2435 160.7 2040 134.6 2140 141.2 2240 147.8 2340 154.4 2440 161.0 2045 135.0 2145 141.6 2245 148.2 2345 154.8 2445 161.4 2050 135.3 2150 141.9 2250 148.5 2350 155.1 2450 161.7 2055 135.6 2155 142.2 2255 148.8 2355 155.4 2455 162.0 2060 136.0 2160 142.6 2260 149.2 2360 155.8 2460 162.4 2065 136.3 2165 142.9 2265 149.5 2365 156.1 2465 162.7 2070 136.6 2170 143.2 2270 149.8 2370 156.4 2470 163.0 2075 137.0 2175 143.6 2275 150.2 2375 156.8 2475 163.4 2080 137.3 2180 143.9 2280 150.5 2380 157.1 2480 163.7 2085 137.6 2185 144.2 2285 150.8 2385 157.4 2485 164.0 2090 137.9 2190 144.5 2290 151.1 2390 157.7 2490 164.3 2095 138.3 2195 144.9 2295 151.5 2395 158.1 2495 164.7

167 | P a g e
GDT 73
A. Scope For a complete list of GDTs, see the Table of Contents. Use these test methods to randomly select and test for acceptance asphaltic concrete mixes and pavement construction. The characteristics to be tested are mixture composition and compaction. B. Apparatus For Method C, the apparatus consists of the following:
Computer—Use the computer specified in Section 152 of the Specifications. C. Sample Size and Preparation
Lot Boundaries An Acceptance Lot normally consists of the amount of asphaltic concrete produced and placed in one construction day, or at least 500 tons (500 Mg).
Evaluate each Lot with the sampling procedures and the specified acceptance criteria for mixture composition and voids.
When evaluating these features, always use the same Lot boundaries. If the Job Mix Formula changes
significantly, the Engineer may end one Lot and begin a new Lot. D. Procedures
Selecting Loads to be Sampled
Randomly sample the designated Lot based on the load number.
Randomly sample the mix for the Lot from sublots consisting of approximately 500 tons (500 Mg).
Sublots may be increased to 750 tons (750 Mg) if approved by both the District Testing Management Operations Supervisor and the Area Bituminous Technical Services Engineer. To be considered for use of expanded sublots, the contractor must have produced at least 2,000 tons (2,000 Mg) of a specific mix per day for three consecutive working days. Approval for increased sublot sizes may be rescinded upon agreement by both the District Testing Management Operations Supervisor and the Area Bituminous Technical Services Engineer any time the Contractor fails to produce at least 2,000 tons (2,000 Mg) of mix in any one day of production.
Method A: Use random numbers chosen from Table 1.
Method B: Draw numbered tokens from a container.
Method C: Use the FDCS computer-generated numbers. See examples in Calculations, for using each of these methods.
Testing for Asphalt Cement Content and Gradation
Use GDT 83 or GDT 125 to test the asphalt cement content.
When the plant that produces the mix is operating and the mix is tested according to GDT 125, use the asphalt cement content calculated from the ticket .Calculate the content from the appropriate ticket that corresponds to the load from which the sample was taken. The ticket and gradation worksheet should be attached to the TM159-5 report and retained in the project files. In all cases, test the mixture gradation with GDT 38.
Project personnel may submit to the Central Laboratory for approval any other method for random
sampling when existing conditions make load sampling impractical.
Note: Test according to GDT 83 or GDT 125 and GDT 38. Accept according to Section 400 of the Standard Specifications.
C. Determining Core locations for Mixture
Acceptance a. Determine core locations as follows:
Divide the Lot into 5 sub-lots for lots containing greater than 500 tons (500 Mg) or 1 sub-lot per 100 tons (100 Mg) if 500 tons (500 Mg) or less (Example)

168 | P a g e
Lots ≥ 500 tons (500Mg) of mix should be divided into 5 sub-lots of equal distance. Lots <500 tons (500Mg) of mix should be comprised of a sub-lot or sub-lots consisting of up to 100 tons (100 Mg) of mix each. There may be less than 5 sub-lots. Note: Round up for any fraction tonnage to the next 100 tons (100 Mg). Example: 301 tons = 4 cores
GDT 73 Table 1
1 2 3 4 5 6 7
.576 .730 .430 .754 .271 .870 .732 .721 .998 .239 .053 .899 .554 .627
.892 .948 .858 .025 .935 .114 .153 .508 .749 .291 .810 .159 .225 .163
.669 .726 .501 .402 .231 .505 .009 .420 .517 .858 .081 .277 .035 .039
.609 .482 .809 .140 .396 .025 .937 .310 .253 .761 .982 .468 .334 .921
.971 .824 .902 .470 .997 .392 .892 .957 .640 .463 .095 .801 .576 .417 8 9 10 11 12 13 14
.427 .760 .470 .040 .904 .993 .509 .025 .794 .850 .917 .887 .751 .608
.549 .405 .285 .542 .231 .919 .371 .059 .164 .838 .289 .169 .569 .977
.860 .507 .081 .538 .986 .501 .165 .996 .356 .375 .654 .979 .815 .592
.690 .806 .879 .414 .106 .031 .477 .535 .137 .155 .767 .187 .579 .787
.251 .884 .522 .235 .398 .222 .788 .101 .434 .638 .021 .894 .324 .871 15 16 17 18 19 20 21
.698 .683 .566 .815 .622 .548 .947 .169 .817 .472 .864 .466 .897 .877
.796 .996 .901 .342 .873 .964 .942 .985 .123 .086 .335 .212 .875 .969
.348 .743 .470 .682 .412 .064 .150 .962 .925 .355 .909 .019 .190 .696
.358 .595 .068 .242 .667 .356 .195 .313 .396 .460 .740 .247 .341 .688
.698 .539 .874 .420 .127 .284 .448 .215 .833 .652 .601 .326 .846 .355 22 23 24 25 26 27 28
.209 .862 .428 .117 .100 .259 .425 .284 .882 .227 .552 .077 .454 .731
.109 .843 .759 .239 .890 .317 .428 .802 .464 .658 .629 .269 .069 .998
.757 .283 .666 .491 .523 .665 .919 .146 .123 .791 .503 .447 .659 .463
.587 .908 .865 .333 .928 .404 .892 .696 .116 .120 .721 .137 .263 .176
.831 .218 .945 .364 .673 .305 .195 .887 .836 .206 .914 .574 .870 .390 29 30 31 32 33 34 35
.716 .265 .058 .075 .636 .195 .614 .486 .629 .663 .619 .007 .296 .456
.917 .217 .220 .659 .630 .673 .665 .666 .399 .592 .441 .649 .270 .612
.994 .307 .631 .422 .804 .112 .331 .606 .551 .928 .830 .841 .602 .183
.798 .879 .432 .391 .360 .193 .181 .399 .564 .772 .890 .062 .919 .875
.104 .755 .082 .939 .183 .651 .157 .150 .800 .875 .205 .446 .648 .685
2. Take one random core in each sublot insuring that cores meet minimum weight requirements in GDT 125.
3. Select successive numbers, depending on the number of sublots, from Table 1 for the longitudinal coordinate.
4. Select the same number of successive numbers for the transverse coordinate.
5. Determine the axis based on the beginning of a sublot and the left-hand edge of the pavement looking
ahead.

169 | P a g e
B. example for coring lots for Acceptance (using Method A). You
are given the following:
The lot is 3,000 ft (914.4 m) long and the lane is 12 ft (3.65 m) wide and has 300 tons (300 Mg) of mix.
1 You are cutting three cores from the lot. By an unbiased method, use the First random number in Block 18 of Table 1 in the right column and the two successive numbers (0.947, 0.942, and 0.150) to determine longitudinal values.
2 Take the lane width minus 1 foot and place 1 pill per foot into a can to be drawn out for Transverse
Coordinate (12 foot lane 1 through 11 in can-pills 3, 5, 9).
Note: It is the intention of this procedure to sample materials from the population in a random manner. The use of a Random Number Generator such as those found as a function on some Scientific Calculators and as found within the Field Data Collection System is allowed. If a Random Number Generator is used, determine the test location by substituting the randomly generated number for the random numbers from Table 1 in the examples of Method A
Location of Sample from Beginning of Each Sublot
Sample No. Longitudinal Coordinate Transverse Coordinate
1 1000 ft. x 0.947 = 947 ft 3 ft
2 1000 ft. x 0.942 = 942 ft 5 ft
3 1000 ft. x 0.150 = 150 ft 9 ft
Note: In some individual cases due to safety reasons, material must be tested within a lane closure. This will make
equal sublots impossible; however, you must include the full length of each day's production in the Lot. There are also safety issues to be considered. In the event that a test site falls in a unsafe area (i.e. in blind curves or just over the crest of a hill) the test location should be move to just beyond the unsafe area but within the boundaries of the sublot being tested. In the event that either of these is the case, an explanation should be included in the remarks section of TM 150 test report. 4. Determining locations with Nuclear Gauge
a. The length of the Lot is 5,000 ft (1,524 m). Use 1,000 ft (1,524 m) per sublot (5000 ft/5 = 1000
b. To determine stations, use an unbiased method. The first random number in block 18 in the right column and the four successive ones (.947, 0.942, 0.150, 0.195, and 0.448) determine the stations.
Station Within Each Sublot Sublot 1 1000 feet x 0.947= 947 feet from start of sublot Sublot 2 1000 feet x 0.942= 942 feet from start of sublot Sublot 3 1000 feet x 0.150= 150 feet from start of sublot Sublot 4 1000 feet x.195 = 195 feet from start of sublot Sublot 5 1000 feet x 0.448= 448 feet from start of sublot
Note: Do not test any section within 25 ft of a transverse joint. Do not test any turning lanes, turnouts, and driveways less than 200 ft in length or tapered sections less than 10 ft wide.
C. To determine transverse coordinates, divide the lane into three equal transverse zones.
D. Record on the work sheet one reading within each zone at the random selected site.
E. Determine the average and record it as a test.

170 | P a g e
6 If the width of lane is 12 feet you will use 4 feet per zone (12 ft/3 zones = 4 ft per zone
7 For this example, place 4 tokens, numbered 1 through 4, in a container.
8 By an unbiased method, you select three numbers from the pill can to determine the transverse locations of the test sites. The numbers are 2, 3, and 1.
9 Since the left edge of the lane looking ahead is the axis, take the readings at the following transverse locations:
Zone Calculation Location
1 Pill 2 2ft
2 Pill 3 3 ft
3 Pill 1 1 ft
Note: Avoid testing sites that fall on the edge of a paving lane. For example, use 1 ft (300 mm) for any sites falling 1 ft (300 mm) or less.
J. Take the 3 gauge readings for sublot #1 starting 947 ft from the beginning of the sublot at 2 ft, 7 ft, and 9 ft from the left edge of the lane.
K. Use the average of the three readings as the test for that sublot.
L. Determine the test locations for the remaining sublots using the same process.
Note: Before reporting test results for payment, automatically retest non-conforming lots of asphaltic concrete density. Test at the same longitudinal location as the previous tests and at a randomly selected transverse site according to GDT 39. Base official values for non-conforming average Lot density on the core average from step 5 below.
e. Re-evaluating Non-Conforming Average Voids
If you reevaluate beyond the automatic recheck, use randomly determined cores at new locations as described in Procedure 4. 1 and 2
Determine the Transverse Coordinates by taking the lane width minus 1 ft and placing 1 pill per foot into a
can. Draw a pill from the can and core at that transverse location on the mat. 5. Calculations
Method A
Method A Calculations This example uses Table 1 to calculate the sublot tests. You are given the following: Expected
plant production: 1,600 to 1,800 tons (1,600 to 1,800 Mg) (3 to 4 samples) Average load of haul
vehicles: 20 tons (20 Mg)
Therefore, use 25 loads [(500 tons (500 Mg)) / (20 tons (20 Mg)/load) = 25] for the first sublot.
By an unbiased method, use the last random number in Block 18 of Table 1 in the right column and the four successive numbers (.215, .284, .802, .146 and .696).
Calculate the loads to sample as follows:
Sample Calculation Load
1 25 loads x .215 = 5.4 or 5 +0 = 5th Load
2 25 loads x .284 = 7.1 or 7 + 25 = 32nd Load
3 25 loads x .802 = 20.1 or 20 + 50 = 70th Load
4 25 loads x .146 = 3.7 or 4 + 75 = 79th Load
4). If the plant produced 92 loads for that day, take samples of the mix from loads 5, 32, 70, and 79 to represent that Lot.

171 | P a g e
2. method B (Random Tokens) This example uses Method B to calculate the sublot tests. You are given the following: Plant
production: 2,600 to 3,000 tons (2,600 to 3,000 Mg) (4 to 5 samples) Average load of haul vehicles: 22 tons (22 Mg)
a. Therefore, use 34 loads (750 tons (750 Mg) / 22 tons (20 Mg)/load = 34) for the sublots.
b. Place 34 tokens numbered 1 through 34 in a container.
c. Draw a token from the container.
d. Record the number and return it to the container.
e. Calculate the sublots to be tested as follows:
Sample Calculation Load
1 Token #1 drawn = 1 = 1st Load
2 Token #16 drawn = 16 + 34 = 50th Load
3 Token #31 drawn = 31 + 68 = 99th Load
4 Token #16 drawn = 16 + 102 = 118th Load
5 Token #11 drawn = 11 + 136 = 147th Load
6. If the plant produced 130 loads for that day, take samples of the mix from loads 1, 50, 99, 118, and 147 to
represent that Lot
3 Method C (DOT Computer Program) This example uses Method C to calculate the sublot tests.
a Using the computer program developed by the Georgia DOT, enter the requested pertinent data about expected production and the haul load sizes. The program will randomly select the loads per sublot for the entire Lot.
b Retain this list for future reference.
Note: Method C is the preferred method when performing sampling at an asphalt plant. It should be utilized as the correct sampling procedure at all times unless specific permission is granted by both the District Testing Management Operations Supervisor and the Area Bituminous Technical Services Engineer f) Re-Evaluation
(1) Mixture Acceptance For all mix types other than PEM, OGFC, Mixture paid as patching and thin lift courses < 110 lbs/yd
2, the Department
will take the same number of new tests on cores taken at the locations where the loads sampled were placed and will use only those cores results for acceptance. If the location of the sampled loads cannot be isolated and documented to the approval of the Engineer, the lot will not be re-evaluated and the original test results will be used for
acceptance. For PEM, OGFC and thin lift courses < 110 lbs/yd2, the retained opposite quarter shall be used for revaluation
when a re-evaluation is requested by the Contractor.
(2) Compaction Acceptance The Department will reevaluate the lot through additional testing by cutting the same number of cores originally obtained at randomly selected locations and averaging these results with the results from the original density tests.
Note: Reevaluation of Lots and acceptance will be based on Department evaluations. The Request for reevaluation shall be made within 5 working days of notification of the Lot results. The Department will be reimbursed for the cost of the re-evaluation. Traffic control will be the responsibility of the contractor. The TMOS, Assistant, or TSE must be present during re-evaluation(The cost can be found below in the RE-Evaluation Cost Table)

172
Report Keep track of the loads sampled and locations sampled and report actual tests on the respective forms:
From GDT 83 or GDT 125 for Asphalt Cement Content.
From GDT 38 for Mixture Gradation.
From GDT 59 for Nuclear Gauge Compaction.
From GDT 39 for Core Compaction.
RE- Evaluation Cost Table
GDT Hr/Rate Mileage Bit wear Test
GDT-39 $55.00 per person .70 mile $12 per inch $25 per core
GDT-125 $55.00 per person .70 mile $12 per inch $150 per core

173
SAMPLING, TESTING
AND
INSPECTION COMPACTION REQUIREMENTS
COMPACTION REQUIREMENTS
Backfill Structures 95% up to one foot of grade
Sub-grade 100%
GAB Group II 100%
GAB Group I 98%
GAB 96% shoulders 6’ or less
Asphalt (End Result / On System) 7.0 % Voids
Asphalt (Non-End Result / Off System) 7.8% Voids
Earth Backfill 100%
Earth wall Leveling Pad 100% 100’ of bridge
Earth wall Leveling Pad 95% other
Embankment 100% total fill within 100’ of bridge
Embankment 95% all other to one foot of grade

174
GENERAL INFORMATION
For
Roadway
Sampling and Testing
(General Information)
GAUGE CALIBRATION
(Asphaltic Concrete)
1. Ensure that the mixture is within the allowable tolerance of Section 828 (Standard Specification).
2. Move to another section from where rolling densification was established.
3. Minimum of 100 feet.
4. Observe rollers to make sure rolling densification is being followed.
5. After completion of the rolling operation, divide the selected area into three or five equal
longitudinal sub-lots and select one transverse sector at each sub-lot. Obtain a minimum of one
nuclear density reading within each longitudinal sub-lot. Mark selected areas where gauge readings
was taken and core the areas to determine the (GDT-39) Bulk Specific Gravity.
6. Correlation of the nuclear gauge to cores. N/G calibration – asphaltic concrete
Cores (Bulk Specific Gravity GDT-39)
Prepare Proper Gauge Calibration Worksheet and OMR-TM-150 Compaction Report.
Inform Project Engineer, Contractor Representative and Technical Service of final results.
Place all test reports in project file for future references.

175
(General Information)
FREQUENCIES FOR ROADWAY TESTING
(ASPHALT)
ROLLING DENSIFICATION
The Department is responsible for pavement mean air void acceptance testing. The Contractor is
responsible for establishing all roller patterns and any quality control testing. Upon written request by the
Contractor, the Office of Materials and Testing will provide nuclear gauge testing assistance for
compaction related issues.
DETERMINATION OF MEAN AIR VOID CONTENT
(determined through compaction test)
1. Five Air Void Contents should be recorded and filed for each lot.
2. Lots containing less than 500 tons require one Void Contents per 100 tons of mix.
3. If Void Contents are to be obtained with a nuclear gauge, gauge calibration is required.
4. If voids fail with nuclear gauge (backscatter mode), Cores should be taken at the same random
stations used for void determination
5. E-mail Branch Lab and Asphalt Plant to report Void Contents on each lot.
6. Void Contents are to be taken reported as soon as possible.
ROADWAY ADJUSTMENT PERIOD FOR MEAN AIR VOID CONTENT
“On-System”
1. Density: Contractors are allowed 4 Lots or “Production” days to correct mix exceeding 7.0%
maximum Pavement Mean Air Void for compaction per contract.
2. Pavement Mean Air Voids for density must meet a 0.90 Pay Factor during Adj. Period to receive
100% pay.
3. Extraction Acceptance: Contractors are allowed 1 Lot or “Production day to correct mix out of tolerance
on AC and gradation per contract.
4. Asphalt cement content must meet a minimum 1.00 Pay Factor and a 0.90 pay factor for gradation
during Adj. Period to receive 100% pay.
5. If Voids are below 0.90 pay factor, then a penalty is applied.
6. “Range” penalties do not apply during an Adjustment period.
“Off-System”
1. Contractors are allowed 3 “Production” days to correct mix exceeding 7.8% Pavement Mean Air Void
2. After Adjustment period if Mean Air Voids exceed 8.3%, BCE shall stop production
And allow up to a 1000’ test strip until problem is corrected.
3. Range Penalties do not apply on “Off-System” Project

176
ROADWAY TESTING (ASPHALT continued)
DEPTH CHECKS
1. Depth checks must be obtained on all projects where depth is specified on the plans.
2. Depth checks not required on projects where a “Spread-Rate” is specified in the plans.
2. If 25MMSP and 19MMSP mix depth is specified on plans but surface mix is paid for by the spread
rate, then depth check cores should be cut prior to surface mix placement.
3. Depth check frequency is 1 per 1000 feet per 2 lanes (12-feet lane width).
NOTE: If lane width is other than 12-feet wide, pro-rate accordingly. For example, 4 foot shoulder frequency
is 1 per 6,000 feet per two lanes.
ROADWAY SAMPLING AND TESTING
207 NORMAL BACKFILL Compaction frequency 1 per 2800 cubic feet
Compaction requirements 95% up to top foot
100% on top foot
Sampling requirements 1 per major soil type
30 lbs. sample
Examined for 810.01
208 EMBANKMENT Compaction frequency 1 per 5,000 cubic yards
Compaction requirements 95% up to top foot
100% on top foot or within 100 feet of any bridge structure
Sampling requirements 1 per major soil type
30 lbs. sample
Examined for 810.01
209 SUB-GRADE
Compaction frequency 1 per 1500 feet per 2 lanes
Compaction requirements 100%
Sampling requirements 1 per 1500 feet per 2 lanes
Examined for 810.01
310 GRADED AGGREGATE BASE
Compaction frequency 1 per 1500 feet per 2 lanes
Compaction requirements 98% for Group I Aggregates
100% for Group II Aggregates
96% for GAB no more than 6 feet in width
Thickness measurements 1/2” tolerance
Sampling frequency 1 per 20,000 tons (If placed from an approved source and
with approved spreader no samples required for
classification)
45 lbs. sample

177
Compaction Range
1. RANGE
If there is a range penalty with the nuclear gauge, the highest and lowest void should be re-read with the nuclear gauge if there is still a range penalty the lot should be cored
For a lot to receive a pay factor of 1.00 for compaction acceptance, the air void range cannot exceed 5 percent for new construction or resurfacing projects. The range is the difference between the highest and lowest acceptance test results within the affected lot. If the air void range exceeds these tolerances, apply a Pay Factor of 95%.
The 5% reduced pay factor for the compaction range does not apply in these instances:
• The mixture is placed during the adjustment period as defined in
Subsection 400.5.01.A, “Materials Produced and Placed During the Adjustment Period.”
A. All air void results within a given lot are less than 7.0%.
B. A lot containing two sublot or less. C. On two foot trench widening
D. For sub-surfaces mixes including 19 mm and 25 mm Superpave mixes if all air void results
within a given lot are >2.5 % <8 %.
When lots are reevaluated for range penalty, as shown in Subsection 106.03, “Samples, Tests, Cited
Specifications,” sampling and testing is according to GDT 73. Request for reevaluation must be made
within 5 working days of notification of the lot results. The following procedures apply:
The Department will reevaluate the lot through additional testing by obtaining and testing three
additional cores acquired in representative sites selected randomly throughout each sub-lot
representing the high and low in-place air voids as detailed in GDT 73. The additional six cores (three
cores from each sub-lot will be averaged) will replace the original five core results for range specified
requirements only. The original five cores results will be reported for Pavement Mean Air Voids for the
lot. This will be the final evaluation for compaction range for the lot. Lots will not be re-evaluated for
range when the Pavement Mean Air Voids result in a lower than 95% pay factor. Ensure requests for
reevaluation are made within 5 working days of notification of the lot results.
The Department will determine the payment for each lot by multiplying the Contract Unit Price by the
adjusted pay factor shown in the Table 7 Average Air Voids Range Acceptance Schedule:
Table 7—Average Air Voids Range For Acceptance Schedule Pay Factor Range between High and Low Air Void
Original 5 cores Re-evaluated Range between High and Low Air Void Cores
6 New Cores obtained from High (3 cores) and Low location (3 cores)
Pay is as follows:
100 ≤ 5 % < 4.50 %
0.95 > 5 % > 4.50%
**NEVER APPLY PENALTY BASED ON NUCLEAR GAUGE**
4. Anytime roadway compaction is extremely hard to obtain or extreme changes in roadway results are
obtained, notify the Area TSE. The Area TSE may then request that a sample be submitted for T-209
results.

178
(GENERAL INFORMATION ON ROLLER TYPES)
1. BREAKDOWN ROLLING
Usually roll breakdown until break point. Then back off 1 pass. (Usually 3-4 passes.)
NOTE: a. Vibratory is much more effective at slow ground speed than fast. Therefore 3 slow passes
is usually more effective than 5 fast passes. (Good speed is fast walking pace.)
b. Do not set up more passes than can be done and keep roller close behind paver. (May in
extreme cases need 2 breakdown rollers. Talk to Area TSE. & Project Engineer)
c. Do not damage mat by over-rolling, cracking, skipping, knots.
d. Breakdown roller should make a complete coverage of the mat before proceeding to
remaining required passes.
e. Generally but not always vibratory roller on asphalt should be run on high frequency (How
fast it vibrates) and on low amplitude (How hard it hits.)
2. PNEUMATIC ROLLING (Intermediate Rolling)
NOTE: a. Pneumatic roller is required not optional on conventional mixes – may not be able to be
used on Superpave or Modified A-C mixes.
b. CANNOT use on Open Graded Friction (D) or SMA’s.
c. Check roller for uniform air pressure (Should be within 5 lbs.)
d. Tires should be same size and ply.
e. Water system and mats can be required if needed.
f. No readings are required behind the rubber tire roller.
It’s very important for this roller to roll as continuous as possible to minimize “picking-up” mixes on tires
and marring newly placed mat.
Need minimum of 8-12 passes over each area.
SPEED – adjust as needed to begin rolling as soon as possible behind breakdown roller without causing
excessive “picking-up” or mat marring to obtain continuous operation.
3. FINISH ROLLING
NOTE: a. Finish rolling is accomplished using a steel wheeled tandem or vibratory roller (in static
mode).
b. DO NOT VIBRATE FINISH ROLLING.
c. Begin finish rolling as soon as possible behind pneumatic rolling without causing cracking,
slipping, or displacement of the newly placed mat.
d. Generally, rolling 1-3 passes at a slow ground speed (walking pace) is satisfactory to
remove visible blemishes.
**Any technician not satisfied with results of rolling pattern, target density, or surface texture should notify
the T.M.O.S. and/or Area TSE.

179
(General Information)
SOIL COMPACTION (207, 208, 209)
A. FREQUENCY
1. Subgrade compactions: one per 1500’ per two lanes or fraction thereof.
2. Embankment: one per 5000 cubic yards of fill material or fraction thereof.
3. Small structure backfill: 1 per 2800 cubic feet of pipe or 500 cubic yards whichever
comes first.
4. Miscellaneous items.
a. Culverts – 500 cubic yards whicheve
b. Median barrier walls – two tests per mile.
c. Two foot widening – one compaction per mile per two lanes.
d. Bridge column footing – one per footing if requested by engineer.
e. Utilities – as requested by engineer.
B. PREPARATION OF SITE
1. With shovel or help of motor grader, prepare a level surface. If gauge rocks to the
touch, make adjustment to level.
2. Drive metal pin through plate deeper than the depth to be tested.
C. STANDARD COUNTS
1. Standard counts of both moisture and density shall be taken twice daily – once in
the morning and once in afternoon.
2. Place back of gauge against block lip.
3. Obtain standard count readings using the four minute setting and record counts.
Gauge is kept in safe position.
4. Gauge shall be at least 30’ away from any vehicle.
D. TAKING READINGS
1. Push probe to depth to be tested.
2. Set gauge to one minute reading and record counts.
E. SELECTION OF MATERIAL FOR MOLD
1. Shovel material from test site where gauge rested.
2. Use a cross section of all materials, i.e. rock, decayed rock, soil, etc.
3. Break-up big clumps and thoroughly mix.
F. COMPACTING MATERIAL IN MOLD
1. Place mold on mold block.
2. Check wing nuts and extension for tightness.
3. Using rammer, compact material in three layers, 25 blows per layer. (Clean
rammer face after each layer.)
4. Scrape excess material off both ends of mold using a straightedge free of dings
and nicks.

180
5. Weigh material plus mold and record.
G. CALCULATIONS ON GAUGE
1. Take Wet Density and Moisture PCF from Gauge
2. Subtract pcf moisture from wet density. Answer is dry density. Record
3. Divide pcf moisture by dry density. Answer is percent moisture. Record
H. CALCUALTIONS OF MOLD WEIGHT
1. Subtract weight of mold from total weight. Result is weight of material. Record.
2. Multiply material weight by mold correction factor or multiply weight by 30 and
divide by 454. Answer is pcf. Record.
I. DETERMINING MAXIMUM DRY DENSITY
1. Use percent moisture and pcf material from mold.
2. Determine optimum moisture by looking straight down chart from MDD.
3. Use percent moisture and density pcf from proctor to plot in appropriate Family
of Curves and determine MDD. Record.
J. COMPACTION
Divide In-Place dry density by MDD. Answer is % compaction. Record.
K. FLAME DRIED MOISTURE
1. There are times when soil is excessively dry or wet and the gauge does not give a
representative moisture percent. In this case disregard gauge moisture and flame
dry one. (1% over, 3% under.)
2. Tare a container and weigh at least 500 grams of material from roadway site.
Record.
3. Dry to a constant weight. Record.
4. Divide the difference between wet and dry by the dry weight. Answer is percent
moisture. Record.
Example: A – wet weight B – dry weight
5. On compaction worksheet, divide the wet density by percent moisture plus 100.
Answer is dry density. Record.
L. PLUS 10 CORRECTION
1. As a general rule, the family of curves book or chart will accurately give a MDD
on ten percent plus ten or less. If more than ten percent, you have to correct the
total sample to a chart found in GDT-7.
2. Dry sample to a low moisture content. Let cool and record weight.
3. Screen material through a number ten sieve and capture plus ten material.
B
B -A

181
4. Weigh plus ten material. Record and divide initial weight into plus ten weight.
Answer is percent plus ten. Record.
5. Wet minus ten material and determine pcf material in mold and MDD as
previously stated.
6. Use MDD on minus ten material and percent plus ten and determine total sample
MDD on chart.
7. Optimum moisture is also to be adjusted by using optimum moisture on minus ten
material and percent plus ten material.
8. Use moisture chart with two percent absorption and determine optimum moisture.
M. MOISTURE ADJUSTMENT FOR CHART OR BOOK
1. When soil is too dry, add water, mix thoroughly, compact in mold and flame dry a
moisture.
2. When soil is too wet, dry back below curve line and add water back, mix
thoroughly, compact in mold and flame dry a moisture.
3. After pcf mold weight and percentage moisture are determined, look up MDD as
previously stated

182
GDOT 553 - Roadway Compaction Report (English) Tech ID: RTT07452 Sample Number: 446 Sample Year: 2012
Contract ID No.: B13846-10-000-1 Contractor Code: 2MA850 CountyNo: 093 Project No.: M004205 District No: 3 Date: 4/25/2012 Item No.: 209 Item Desc: Subgrade Area Engineer No: 313 Station No.(l.ft.): 1288+50
Gauge No: 36388 Mode: 6 Density Standard Count: 2488 Moisture Standard Count: 631
In Place Data Gauge Offset
Total Location: SBOL Wet Density (lb/ft³): 122.4 0.00 122.40 Depth - BG (feet): Plan Thickness (inches): Actual Thickness (inches): Moisture PCF (lb/ft³): 15.60 0.00 15.60 Dry Density (lb/ft³): 106.8 % Moisture: 14.61
Moisture Data Wet Mass (grams): % Moisture:
Dry Mass (grams): Dry Density(lb/ft³):
Proc-tor Wet Dry % % Moist. MassMix+M Mass of WetMassof MoldCorr. Wet Mass Soil Max. Dry Optimum % # Mass Mass Moisture Used old Mold Mix Fctr (lb/ft³/g) PCF curve Den(lb/ft³) Moisture grams grams (grams) (grams) (grams) (lb/ft³) chart Ff. Curve
Final: 14.61 3761 2039 1722 0.06638 114.3 C 104.6 17.3
Dry Density Used (lb/ft³): 106.8 Passed Test: Passed Max. Dry Density (lb/ft³): 104.6 Recheck: N Optimum % Moisture: 17.3 Testing Group: Testing Management % Compaction Required: 100 IA Quality: % Compaction Obtained: 102.1 Verified By: BLJ Remarks:
Thursday, September 06, 2012 Page 1 of 1

183
GDOT 553 - Roadway Compaction Report (English) Tech ID: RTT07452 Sample Number: 374 Sample Year: 2012
Contract ID No.: B13846-10-000-1 Contractor Code: 2MA850 CountyNo: 093 Project No.: M004205 District No: 3 Date: 4/13/2012 Item No.: 310 Item Desc: GAB Top Lift Area Engineer No: 313 Station No.(l.ft.): 1201+50
Gauge No: 35284 Mode: 6 Density Standard Count: 2487 Moisture Standard Count: 637
In Place Data Gauge Offset
Total Location: SBOS Wet Density (lb/ft³): 131.9 4.20 136.10 Depth - BG (feet): Plan Thickness (inches): 6 Actual Thickness (inches): 6.5 Moisture PCF (lb/ft³): 9.20 -1.20 8 .00 Dry Density (lb/ft³): 128.1 % Moisture: 6.25
Moisture Data Wet Mass (grams): % Moisture:
Dry Mass (grams): Dry Density(lb/ft³):
Proc-tor Wet Dry % % Moist. MassMix+M Mass of WetMassof MoldCorr. Wet Mass Soil Max. Dry Optimum % # Mass Mass Moisture Used old Mold Mix Fctr (lb/ft³/g) PCF curve Den(lb/ft³) Moisture grams grams (grams) (grams) (grams) (lb/ft³) chart Ff. Curve
Final: 6.25 0.06638
Dry Density Used (lb/ft³): 128.1 Passed Test: Passed Max. Dry Density (lb/ft³): 127.3 Recheck: N Optimum % Moisture: 8.7 Testing Group: Testing Management % Compaction Required: 100 IA Quality: % Compaction Obtained: 100.6 Verified By: BLJ Remarks: CRUSHED CONCRETE
Thursday, September 06, 2012 Page 1 of 1

184
Pipe Test Calculation
3.14 x radius2 X Linear Ft = Number of Pipe Test
144 2800
Radius = Diameter/2
Example:
Project has 15,000 linear feet of 18 inch pipe (18 is the diameter)
18/2 = 9
3.14 x 92 X 15000 = Number of Pipe Test
144 2800
3.14 x 81 X 15000 = Number of Pipe Test
144 2800
254.34 X 15000 = Number of Pipe Test
144 2800
1.77 X 5.36 = 10 pipe tests

185
(General Information)
GAB COMPACTION (310)
A. FREQUENCY
One test per 1500’ per two lanes per lift is minimum requirements.
B. PREPARATION OF SITE
1. Select a representative test site of area to be tested.
2. Drive pin to depth to be tested plus one inch.
C. GAUGE READINGS
1. Set probe at desired depth.
2. Set gauge to one minute reading and record moisture and density counts.
D. CALCULATIONS
1. Take Wet Density and Moisture PCF from Gauge. Record
2. Add or subtract calibration factors (offsets)
3. Subtract pcf moisture from wet density. Result is dry density. Record.
4. Divide pcf moisture by dry density. Result is percent moisture. Record.
5. Divide pcf dry density from MDD. Result is percent compaction. Record.
GDT-49 establishes Theoretical Maximum Dry Density for GAB used as pay item 310

186

187
DOT 553 GEORGIA DEPARTMENT OF TRANSPORTATION
Rev. 7/26/11 OFFICE OF MATERIALS AND RESEARCH
ROADWAY COMPACTION REPORT
PROJECT __________________________________________PR-491-2(63)C1 CONTRACT ID _________________________________________C30461-99-000-0 PI __________________________________
ITEM ____310_________ COUNTY ___________________________HENRY DISTRICT _________ 3 PRIME CONTRACTOR _______________________________ER SNELL
AREA ENGINEER _______________________________315 TESTED BY ______________________________________BRENT JOHNSON TITLE ________________________________TMFT 2
IN-PLACE DATA
BASE, SUBGRADE, EMB., ETC GAB
GAUGE NO. DATE 09 / 05 /12 / /
20935 SAMPLE NO RTT07452
MODE " _____________________6 STATION 31+00
DENSITY STANDARD COUNT LOCATION NBL
2437 DEPTH THICKNESS 6
MOISTURE STANDARD COUNT PLAN THICKNESS 6
643 WET DENSITY 149.3
DENSITY OFFSET (BASE, GAB) CORRECTED DENSITY (+/-) 151.3
2 MOISTURE (PCF) 8.3
MOISTURE OFFSET (BASE, GAB) CORRECTED M. PCF (+/-) 7.3
-1 DRY DENSITY 144
CORRECTED DRY DENSITY - WHEN NEEDED
% MOISTURE 5.06
*IN-PLACE WET WEIGHT
MOISTURE BY DRIED WEIGHT
DRYING A SAMPLE PERCENT (%)
FAMILY OF CURVES DATA
*MOISTURE IN WET WEIGHT
ONE POINT BY DRIED WEIGHT
DRYING A SAMPLE PERCENT (%)
% MOISTURE (FROM IN-PLACE DATA)
WT. OF MIXTURE + MOLD
WT. OF MOLD
WET WT. OF MIXTURE
WET WT. PER CU. FT.
MAX DRY DENSITY / FROM CURVE NO.
COMPACTION DATA
MAX DRY DENSITY 141
% COMPACTION REQUIRED 100
% COMPACTION OBTAINED 102.1
OPTIMUM MOISTURE 5.3
PASSED/FAILED/RECHECK P
* FOR USE WHEN GAUGE WAS NOT USED TO TEST MOISTURE

188
(General Information)
TESTING MANAGEMENTGUIDELINES
FOR
ESTABLISHING ROLLING DENSIFICATION AND GAUGE CALIBRATION
FOR ASPHALTIC CONCRETE (Voids Specification)
A. ROLLING DENSIFICATION
The Department is responsible for pavement mean air void acceptance testing. The
Contractor is responsible for establishing all roller patterns and any quality control
testing. Upon written request by the Contractor, the Office of Materials and Testing
will provide nuclear gauge testing assistance for compaction related issues.

189
CORRELATION WORKSHEET
CALIBRATION OF NUCLEAR GAUGE TO ASPHALT CORES
Project # TSAP-120(85)01 PI#
Contract ID B14775-11-000-0 Date 9-5-12
County BIBB Gauge # 30165
Plant/Contractor GA ASPHALT Type Mix 25MM
% AC 4.30 Theoretical 159.4
Mix I.D. # 171XR25 Lot # 1 Density Standard Count 2748 Tested By BRENT
JOHNSON
OBTAIN CORE DENSITIES Sample Numbers
Site 1 2 3 4 5
Air Weight 1078 1495 1383 1291 1252
SSD Weight or Wax Weight 1079 1496 1384 1293 1254
Water Weight 630 875 819 753 731
Difference (SSD – Water Weight) 449 621 565 540 523
Specific Gravity (Air Weight ÷
Difference) 2.4009 2.4074 2.4478 2.3907 2.3939
Density (Specific Gravity x 62.4) 149.8 150.2 152.7 149.2 149.4
1. Average Core Density ________150.3
2. Average Gauge Density** _________148.1
3. Density Offset (1-2) _________+2.2_______
Note: If 1 is higher than 2, offset will be a plus (+)
If 2 is higher than 1, offset will be a minus (-)
CALCULATE GAUGE DENSITIES
Site 1 2 3 4 5 Average
Gauge Density ** ( Nuclear Gauge Readings)
148 149.2 147.6 148.6 147.2 **148.1
Core Density
149.8 150.2 152.7 149.2 149.4 150.3
Gauge Density (From 5 gauge readings, after offset
is applied)
150.2 151.4 149.8 150.8 149.4 150.3
Difference (Core Density – Gauge Density with
offset)
1. If the average difference is greater than .5 lbs/ft³ (8.0095 Kg/m³),
contact Area Coordinator or Field Supervisor for further instruction.

190
OMR-TM-158
Rev. 07/25/11 Nuclear Gauge Calibration to Graded Aggregate Base Department of Transportation Project: _______STP-00-004(90)01_______ County: UPSON _____
Date __9___/_5____/__12____
State of Georgia Contract ID: ___B11754-10-000-1_______ PI # _______________________ N/G # _23015____________
Prime Contractor: ____REEVES____________________________________ Mode____6___________
Nuclear Gauge Calibration Quarry: _____FLORIDA ROCK GRIFFIN_____________________________ Density Standard
(12" Ring) Material: ______GAB_____.______________ Item: _____310_____________ Count ____3001_________
Tested By: ___MIKE ELLINGTON_________Title: ______ET_____________
Moisture Standard
Maximum Dry Density:__132.5_____ _ Count ___650___________
Optimum Moisture_____6.4________
IN PLACE DATA (NUCLEAR GAUGE) (1) (2) (3)
Sample No 1 2 3
Station # 1+00 2+00 3+00
Depth - Thickness 6 6 6
Gauge Wet Density (PCF)** 135.2 133.7 135.5
Density Offset +2.4 +2.4 +2.4
Wet Density (Gauge Wet Density +/- Offset) 137.6 136.1 137.9
Gauge Moisture Density (PCF)** 2.45 3.60 3.25
Moisture Offset 2.5 2.5 2.5
Moisture (PCF) (Gauge Moisture Density +/- Offset) 4.95 6.1 5.75
Dry Density (Wet Density – Moisture PCF) 132.7 130.0 132.2
% Moisture (Moisture PCF ÷ Dry Density)
IN PLACE WET DENSITY (12" RING) (1) (2) (3)
Sand Density________95.5 ________________
Gross Wt. (Container and Sand) ____22294 _gms./lbs. __17799 ___gms./lbs. 19449 __gms./lbs.
Final Wt. (Container / Bag) ____5398 _gms./lbs. 3466_ gms./lbs. 8854_ __gms./lbs.
Wt. of Sand Used (Gross Wt – Final Wt.) ___16896 _gms./lbs. ___14333_ __gms./lbs. ____10595 __gms./lbs. Wt. of Wet Material from Hole (Include. Container) ___25534 _gms./lbs. 21215 __ _gms./lbs. 15900 __gms./lbs.
Wt. of Container / Bag _____823 _gms./lbs. 826_ _ __gms./lbs. 826 __gms./lbs. Wt. of Wet Material from Hole (Wet Wt Fr. Hole -- Container Wt) __24711 _ _gms./lbs. __20389 _gms./lbs. _____15074 __gms./lbs. In-Place Wet Density (Wet Wt Fr. Hole x Sand Density ÷ Sand Used) ____139.7 _ __PCF ___135.9 __ _PCF __ 135.9 ____PCF In-Place Dry Density (Wt. Density ÷ % Moist. Content +100 x 100) ___ 134.1 ____PCF ____129.8 ___ _PCF ____130.8 ____PCF
IN-PLACE MOISTURE (FLAME DRY) (1) (2) (3)
Wt. of Wet Sample _____2000 _gms./lbs. _2000 _ _gms./lbs. 2000 __gms./lbs.
Wt. of Dry Sample _1920.4 gms./lbs. 1910.1 __gms./lbs. 1925.7 __gms./lbs. Wt. of Water (Wt. Wet Sample – Wt. Dry Sample) _79.6___ __gms./lbs ___89.9 __gms./lbs. __74.3 __gms./lbs. Moisture Content % (Wt. of Water ÷ Dry Sample x 100) __4.14_____ ___% ____4.71__ _____% __3.86___ ____% Moisture Content PCF (Wet density – Dry density) __5.6___ _____PCF ___6.1___ _____PCF ___5.1___ _____PCF
CALCULATION FOR DENSITY OFFSET CALCULATION FOR MOISTURE OFFSET
Avg. In-Place Wet Density (12” Ring) ______137.2_________ (A) Avg. PCF (Flame Dry Moisture) ______5.6_______(A)
Avg. Nuclear Gauge Wet Density ** _______134.8_________ (B) Avg. N/G Moisture Density ** ______3.1________(B) A – B = Density Offset ________+2.4_________ A – B = Moisture Offset ______+2.5__________

191
OMR-TM-150 (Rev. 7/26/11)
GEORGIA DEPARTMENT OF TRANSPORTATION
OFFICE OF MATERIALS AND RESEARCH
PROJECT BRF00-0153-01(024) LOT 3 ITEM 400
ASPHALTIC CONCRETE COMPACTION REPORT
COUNTY MACON (189) DISTRICT 3 DATE 09/22/15
CONTRACTOR
2GS050 TESTED BY
TORREY WALL
CONTRACT ID
B14653-13-000-1
PI #
BEG. STA
END STA.
LENGTH
LANE LOCATION
RES. ENG
313 TITLE TMBS
55+00 71+55
16+55
EBL PLANT LOCAT.
MACON (098)
55+00 71+55
16+55
WBL TYPE MIX 12.5MM SP %A.C. 5.1 Total
Length Length of
NOTES:
of Lot= Sublot=
33+10 6+62
TABLE # BEG
STA END STA
LENGTH LN LOCATIO
N
RANDOM #
RANDOM STA
MEAS
REMARKS
1.)SAMPLE#
55+00
61+62
3+99 EBL .602 58+99 204
2.)SAMPLE#
61+62
68+24
6+08 EBL .919 67+70 205
3.)SAMPLE#
68+24
71+55
4+23 EBL .648 55+92 206 55+0
0 58+31
WBL 4.)SAMPLE#
58+31
64+93
3+02 WBL .456 61+33 207
5.)SAMPLE#
64+93
71+55
4+05 WBL .612 68+98 208
GAUGE #
31646 NUCLEAR RESULTS CORE RESULTS THEO. DENSITY = DEN. 0 CORREC
TED
AIR SPEC. GR.
0
153.8 LEFT 144.1
(+/-) Offset
SURF. AIR
PCF
DENSITY OFFSET (+/-) =
CENTER
141.1
DENSITY 144 WATER
1.9 RIGHT 141.1
DIFFERENCE
% VOIDS
MAX % VOIDS = AVG. 142.1
% VOIDS 6.4
7 DEN. CORRECTED
AIR SPEC. GR.
AVG. VOIDS = LEFT 148.1
(+/-) Offset
SURF. AIR
PCF
5.2 CENTER
145.8
DENSITY 147.3 WATER
RANGE =
RIGHT 142.4
DIFFERENCE
% VOIDS
2.2 AVG. 145.4
% VOIDS 4.2
DENSITY STD. COUNT=
DEN. CORRECTED
AIR SPEC. GR.
2379 LEFT 143.7
(+/-) Offset
SURF. AIR
PCF
CENTER
144.7
DENSITY 145.8 WATER
RIGHT 143
.4 DIFFERE
NCE %
VOIDS
AVG. 143
.9 % VOIDS 5.2
DEN. CORREC
TED
AIR SPEC. GR.
LEFT 144
.9 (+/-)
Offset
SURF. AIR
PCF
CENTER
140.8
DENSITY 145.2 WATER
RIGHT 144
.2 DIFFERE
NCE %
VOIDS
AVG. 143
.3 % VOIDS 5.6
DEN. CORREC
TED
AIR SPEC. GR.
LEFT 144
.7 (+/-)
Offset
SURF. AIR
PCF
CENTER
144.6
DENSITY 147 WATER
RIGHT 145
.9 DIFFERE
NCE %
VOIDS
AVG. 145
.1 % VOIDS 4.4
0 = RANDOM LATITUDE

192
(General Information)
CALIBRATING NUCLEAR GAUGE TO 12” RING USING FORM OMR-IM-158
1. First, determine the Density of Sand according to GDOT-21.
2. Next, obtain Standard Counts for both density and moisture.
3. Then get wet density and moisture pcf on the three areas.
a. Average the 3 wet density’s from the 3 areas.
b. Average the 3 moisture pcf from the 3 areas.
4. At this point perform the Conventional Tests. (12” ring calibration)
a. Get the gross wt. of bag (container) and enough sand.
b. Weigh the bag (container) to be used for material from hole.
c. Place 12” Ring on test site to use as guide to dig holes.
d. Dig hole as specified and place material into bag (container).
e. Immediately determine the weight of material from the hole.
f. Carefully fill the hole with calibrated sand as specified.
g. Calculate how much sand was used to fill hole.
5. Determine “in-place” wet density for the 3 areas. Use this formula.
Ww x Ds Where, Ww = Wet weight of material from hole
Ws Ds = Density of Sand
Ws = Weight of sand used
Example:
6. Next, determine the Offset for density.
a. Average the 3 “in place” wet densities – (example – Avg. = 145.2)
b. Average the 3 Nuclear Gauge Wet Densities.
c. To determine the Offset for Density, we take the difference from our “In-place” wet density
and the Nuclear gauge wet density.
Example: Avg. In-place wet density- Avg. Nuclear gauge wet density = Offset
145.2 - 143.7 = +1.5
Correlate each gauge density to each 12” ring test wet density. Results should be within 0.5 pcf.
7. Next we perform Moisture Determinations for each area.
a. Obtain specimen of no more than 2000 gms taken from the material removed from one of the
holes. Weigh and record.
b. Flame dry the specimen. Once dry, subtract the weight of the drying pan, and record.
c. Calculate the weight of the water by subtracting the weight of the dry sample from the weight
of the wet sample. Record.
d. Next, we determine the Moisture Content in Percent using this formula.
Where, A = Wt. of wet sample
B = Wt. of dry sample
Example
9.14493864.1447644
911,107,1
7644
81.5 x 13,594
100 x B
B -A

193
= 3.25245 or 3.3
e. Now, we change the Moisture Content in percent to Moisture pcf.
1) First, determine the “in-place” dry density using this formula
x 100
Example
x 100 = 140.27105 or 140.3
2) Now, we calculate the Moisture pcf by subtracting the “in-place dry density from the “in-
place” wet density.
“in-place” wet density 144.9
- “in-place” dry density - 140.3
Moisture PCF 4.6
8. Now, we find the Offset for moisture.
a. Average the 3 Moisture pcf’s. (Example Avg. = 4.2)
b. Average the three Nuclear gauge moisture pcf’s.
c. We now determine an Offset for Moisture. To do this, we take the difference from our Avg.
“in-place” moisture pcf’s and our Avg. Nuclear gauge moisture
Example:
Avg. “in-place” moisture – Avg. nuclear gauge moisture.
5.52 – 4.63 = +.89
9. To check the results and the gauge, correlate each gauge moisture pcf to each flame dry moisture
pcf. Results should be within 0.5 pcf.
calculate the average of the 3 moisture pcf’s from our Moisture Determinations.
1001937
1937 - 2000x
100 (%) Moisture
density wet place"-in"
100 3.3
144.9

194
DEPARTMENT OF TRANSPORTATION
STATE OF GEORGIA
______________________________________
INTERDEPARTMENT CORRESPONDENCE
FILE OFFICE Materials and Research
Forest Park, Georgia
DATE February 14, 2005
FROM Rick Douds, Testing Management Branch Chief
TO Distribution
SUBJECT Field Data Collection System
Due to previous problems we have encountered with 159’s in the Field Data
Collection System, I am writing this explanation on the proper procedure if 159’s
are uploaded with incorrect information.
Since the system will not to allow for duplicate 159’s to be uploaded, there are specific
procedures that should be followed when it is discovered that a corrected 159 must be
uploaded.
Before you upload a corrected 159, the District TMOS, Field Supervisor. Or Area
Coordinator must be notified so they can un-verify the report in the DATA Base.
Make sure that the corrected portion of the 159 is marked corrected copy.
Make a notation in the plant diary as to what happened and when the report was re-
uploaded.
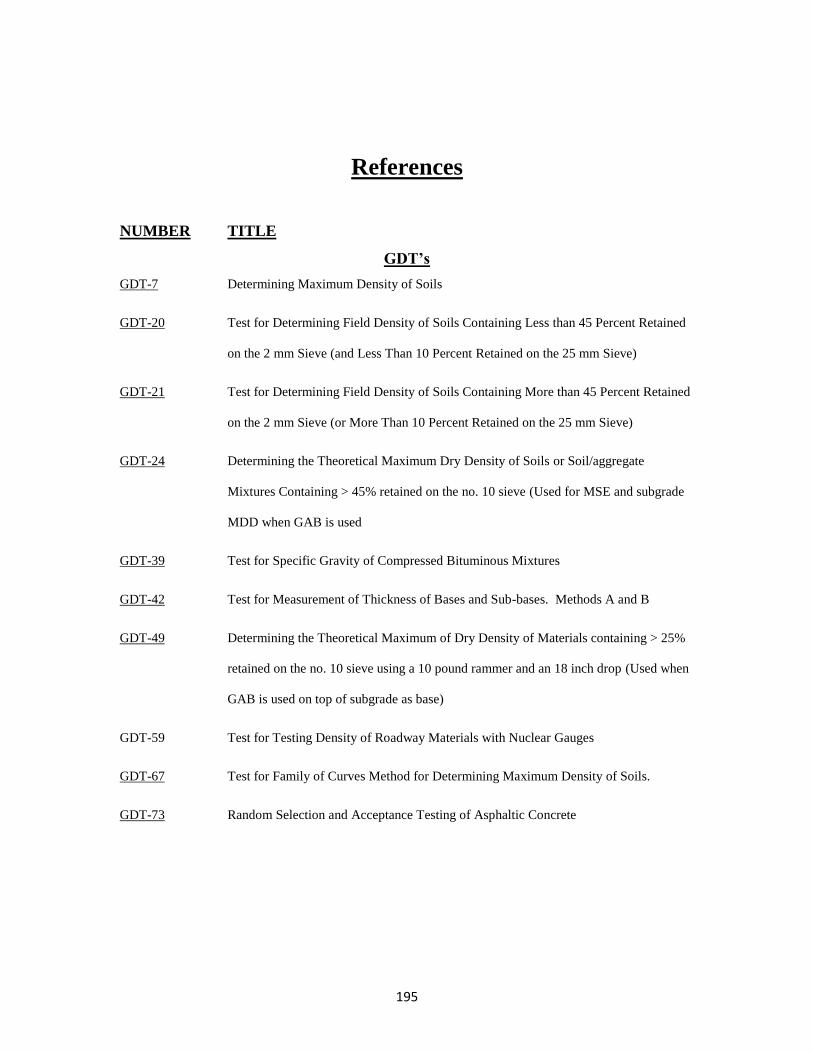
195
References
NUMBER TITLE
GDT’s
GDT-7 Determining Maximum Density of Soils
GDT-20 Test for Determining Field Density of Soils Containing Less than 45 Percent Retained
on the 2 mm Sieve (and Less Than 10 Percent Retained on the 25 mm Sieve)
GDT-21 Test for Determining Field Density of Soils Containing More than 45 Percent Retained
on the 2 mm Sieve (or More Than 10 Percent Retained on the 25 mm Sieve)
GDT-24 Determining the Theoretical Maximum Dry Density of Soils or Soil/aggregate
Mixtures Containing > 45% retained on the no. 10 sieve (Used for MSE and subgrade
MDD when GAB is used
GDT-39 Test for Specific Gravity of Compressed Bituminous Mixtures
GDT-42 Test for Measurement of Thickness of Bases and Sub-bases. Methods A and B
GDT-49 Determining the Theoretical Maximum of Dry Density of Materials containing > 25%
retained on the no. 10 sieve using a 10 pound rammer and an 18 inch drop (Used when
GAB is used on top of subgrade as base)
GDT-59 Test for Testing Density of Roadway Materials with Nuclear Gauges
GDT-67 Test for Family of Curves Method for Determining Maximum Density of Soils.
GDT-73 Random Selection and Acceptance Testing of Asphaltic Concrete

196
DOT FIELD TECHNICIANS AND CONTRACTORS
QCT’S AND RTT’S EQUIPMENT LIST
PLANT EQUIPMENT NOTED WITH *
WORK GLOVES *
SAFETY EQUIPMENT FOR IGNITION
OVEN
FIRST AID KIT*
FIRE EXTINGUISHER*
LIGHTER, MATCHES*
CALCULATOR*
SPECIFICATIONS BOOK
QUICK GUIDE
SAMPLE TESTING INSPECTION
MANUAL
TESTING & MGMT PROCEDURES
PROPOSAL OR CONTRACT*
CLIPBOARD*
STAPLER*
FILE FOLDERS*
ACCORDIAN FOLDERS
STROBE LIGHTS
TWO WAY RADIO
MARKING CRAYON
MARKING PAINT
NUCLEAR GAUGE
APPROVED TRANSPORT CASE
BILL OF LADING
STANDARD BLOCK
GAUGE BOOK
GAUGE CHARGER
SAMPLE BAGS (Cloth & Plastic)*
SOIL FERTILITY BAGS
SAMPLE CARD BAGS
HARD HAT
SAFETY VEST SAFETY FLAGS FLASH LIGHT
RAIN SUIT
RUBBER BOOTS
HEAT GLOVES *
LONG STRAIGHT EDGE
1/30 CF MOLD
MOLD BLOCK
MOLD RAMMER
WIRE BRUSH*
SPATULA *
SPOONS*
CHISEL
THREE POUND HAMMER
TWELVE INCH RING
PIE PANS
MIXING BOWLS*
GAS STOVE'GAS BOTTLE*
GAS REGULATOR*
6000 GRAM SCALES*
SCALE LEVELING DEVICE*
PAINT BRUSH 3 INCH*
SQUARE SHOVEL
ROUND SHOVEL
POSTHOLE DIGGERS
PICK
6 FOOT FOLDING RULER
PIN
PLATE
T-HANDLE
LAPTOP / DESK TOP COMPUTER*
POWER CONVERTER
TOKENS*
THERMOMETER*
IGNITION OR CONVECTION OVENS*
HOT MELT BOXES*
QUARTERING TOOL*
12” TO 16” DIAMETER ROUND PAN*

197