
DEPARTMENT OF THE INTERIOR U.S. … Lake and cold springs emanating on the flanks of Mount Mazama in...
25
1i-6: DEPARTMENT OF THE INTERIOR U.S. GEOLOGICAL SURVEY Chemical Analyses of Waters from Crater Lake, Oregon, and Nearby Springs by J. Michael Thompson, L. Douglas White and Manuel Nathenson 345 Middlefield Road Menlo Park, California 94025 Open-File Report 87-587 1987 SOUTHERN OREGON UNMERSITY LiBRARY - _- ASHLAND, OREGON 97520 This report is preliminary and has not been reviewed for conformity with U.S. Geological Survey editorial standards. SOT l Nl I SITY LIBRARY 3 5138 006211814
Transcript of DEPARTMENT OF THE INTERIOR U.S. … Lake and cold springs emanating on the flanks of Mount Mazama in...
I. 1i-6:
DEPARTMENT OF THE INTERIOR
U.S. GEOLOGICAL SURVEY
Chemical Analyses of Waters from Crater Lake,
Oregon, and Nearby Springs
by
J. Michael Thompson, L. Douglas White and Manuel Nathenson
345 Middlefield Road
Menlo Park, California 94025
Open-File Report 87-587
1987
SOUTHERN OREGON UNMERSITY LiBRARY- _- ASHLAND, OREGON 97520
This report is preliminary and has not been reviewed for
conformity with U.S. Geological Survey editorial standards.
SOT l Nl I SITY LIBRARY
3 5138 006211814

Abstract
Crater Lake, Oregon, has no surface outlet and loses its inflow by
evaporation and leakage. In order to understand the hydrology of the lake and
the leakage of the lake in relation to nearby cold springs, water samples were
collected for chemical and isotopic analyses. No spring analyzed had evidence
of more than ten percent Crater Lake water. One spring, Crater Spring, has
higher than usual chloride concentrations and slightly heavier isotopes than
average meteoric water. If these are caused by Crater Lake water, then the
calculated fraction of Crater Lake water is near seven percent. Chemical and
isotopic analyses show that Crater Lake is well mixed. Crater Lake also has
anomalously high chloride, boron, lithium, sulfate, and silica concentrations
compared to nearby Diamond Lake and to cold springs discharging on the flanks
of Mount Mazama. This elevated chloride may be caused by input of thermal
water. Weight ratios of Cl/Li are within the range of western United States
hot springs and significantly below those for surrounding cold spring waters.
Estimates of total heat flow out of the lake bottom range from 670 to
1380 mW/m2, also suggesting addition of thermal water to the lake bottom.
Introduction
Crater Lake, Oregon, is located in the 6800 year old caldera of Mount
Mazama (Bacon, 1983). The lake receives 85 percent of its inflow by direct
precipitation with the remainder coming as inflow from the surrounding
drainage area. The lake covers 78 percent of its drainage area. The lake has
no surface outlet, but loses 72 percent of its inflow by leakage and 28
percent by evaporation (Phillips, 1968). Van Denburgh (1968) recognized that
chloride and sulfate and perhaps silica and sodium were anomalously-high in
the lake and suggested that these constituents may be contributed by thermal
springs at depth in the lake. Based on unpublished analyses, Van Denburgh
also suggested that the lake is quite uniform in chemical quality both areally
and vertically.
The purpose of this paper is to present chemical and isotopic data for
Crater Lake and cold springs emanating on the flanks of Mount Mazama in order
to understand questions concerning the lake dynamics and the relationship of
the lake water to nearby cold springs. The pertinent questions are: 1) Are
the lake chemistry and isotopic composition anomalous compared to-nearby cold
springs? 2) If so, are there any springs that show a significant component of
Crater Lake water mixed with shallow ground water? 3) How well mixed
chemically and isotopically is the water in Crater Lake? and 4) Do the
dissolved chemical constitiuents in Crater Lake water indicate an input of
thermal water?
Table 1 contains the complete chemical and isotopic data previously
discussed in Thompson and White (1983), Salinas and others (1984), and White
and others (1985). These abstracts contained only preliminary answers to the
questions posed above. Additionally, inconsistencies in some of the
previously reported data have been identified, and the values have been
redetermined and are given in Table 1. A complete study of the methods of
chloride analysis was also made in order to calculate the accuracy and
precision of various methods of analysis.
p. 1

Sampling and Analysis
Spring waters were collected using methods similar to those described in
Thompson (1975). Temperatures of springs were determined using a
conventional, total immersion, mercury-in-glass thermometer. In 1981 and 1982
field measurements of the spring water pH were made with non-bleeding,
low-ionic-strength, pH-indicating dyes (E. M. Colorphast pH strips*).
Beginning in 1983 all field pH measurements were made with a gel-filled pH
electrode and a portable pH meter. Temperature and pH were generally
determined at each spring site. The alkalinity of the 1984 and the few 1985
samples was also determined in the field. At each spring site a filtered,
unacidified CFU) water sample for anion analysis was collected by passing the
water through a 0.45 pm membrane filter. Additionally, a filtered,
acidified sample (FA) for cation analysis was collected by adding
concentrated, trace-metal quality HCI to the filtered water. An untreated
sample for deuterium and oxygen-18 analysis was also collected at each site.
Samples of lake water were collected in 2 liter Van Dorn sample bottles
attached to a metal cable and retrieved either by hand (1981 samples) or
mechanically (all others). The depth of sampling in 1983 was limited to 300 m
by the available cable; in 1984 the winch and cable were replaced, permitting
us to retrieve samples from the bottom of the lake. Samples were collected
and treated similar to the spring water ones: one bottle for anion analysis,
FU, another for cation analysis, FA, and a third for isotopic analysis,
untreated. In 1985 a one-liter raw sample was collected and evaporated to
approximately 50 mL for B and Li analysis.
Laboratory Analyses
Silica was analyzed at 640 nm by a modification of the molybdenum blue
spectrophotometric procedure described by Shapiro and Brannock (1956) using
10 mL of the filtered acidified spring water.
Boron was determined spectrophotometrically using the carmin procedure at
600 nm (Brown and others, 1970).
Bicarbonate was determined titrimetrically as alkalinity using a
constant-drive buret, a combination pH glass electrode, a specific ion - pH
meter, a strip chart recorder,- and standardized sulfuric acid (0.05N). The
laboratory pH was taken as the pH at the start of the alkalinity titration.
If bicarbonate was analyzed in the field, the analysis was not repeated in the
laboratory.
Sulfate was determined by a turbidimetric procedure using BaCl2 to
precipitate BaSO4. The 1983 samples of lake water were determined by ion
chromatography (Fishman and Pyen, 1979).
Chloride was determined by four procedures: a) the colorimetric ferric
thiocyanate method (Fishman and Friedman, 1985); b) the manual mercurimetric
titration procedure (Brown and others, 1970), c) an ion chromatographic
procedure using a HCO3 - Co3 eluent and conductivity detection (Dionex
p. 2
Brand names used are for information purposes only and do not constitute a
recommendation by the U.S. Geological Survey.
model 16), and d) an automated AgNO3 titration (Brinkman, model 682).
Results of the various chloride analyses are reported in table 2.
Fluoride was determined by an Orion ion specific electrode; TISAB II was
mixed 1:1 with all samples and standards. The 1983 samples were analyzed by
ion chromatography (Fishman and Pyen, 1979).
Sodium and lithium were determined simultaneously by flame emission
spectroscopy (FES) in a fuel-rich, air-acetylene flame with added potassium
ion (0.1 percent v/v) at 589.0 nm and 670.8 nm, respectively.
Potassium was determined by FES in a stoichiometric air-acetylene flame
with added cesium ion (0.1 percent v/v) at 766.6 nm.
Calcium and magnesium were determined simultaneously by atomic absorption
spectroscopy (AAS) in a stoichiometric air-acetylene flame with added La(III)
(1.0 percent v/v) at 422.7 and 285.2 nm, respectively.
Specific Conductance was determined following the procedure described in
Brown and others (1970).
Deuterium analyses were made following the procedure of Bigeleisen and
others (1952).
Oxygen-18 analyses were made following the procedure of Epstein and
Mayeda (1953).
Cold-Spring Waters
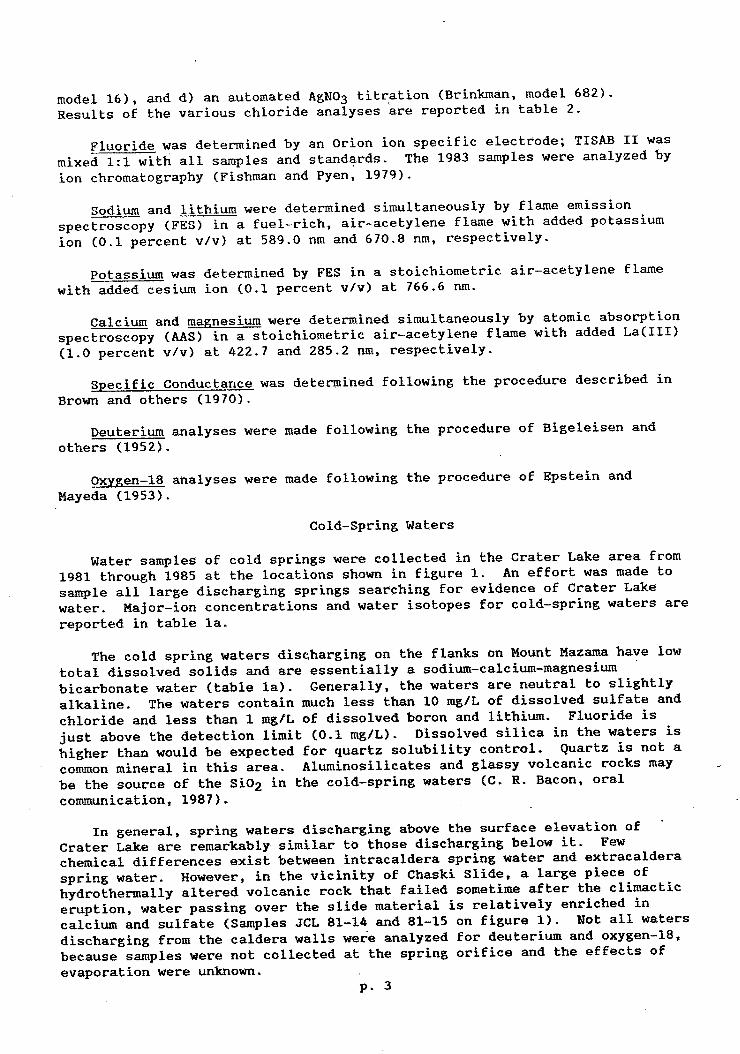
Water samples of cold springs were collected in the Crater Lake area from
1981 through 1985 at the locations shown in figure 1. An effort was made to
sample all large discharging springs searching for evidence of Crater Lake
water. Major-ion concentrations and water isotopes for cold-spring waters are
reported in table la.
The cold spring waters discharging on the flanks on Mount Mazama have low
total dissolved solids and are essentially a sodium-calcium-magnesium
bicarbonate water (table la). Generally, the waters are neutral to slightly
alkaline. The waters contain much less than 10 mg/L of dissolved sulfate and
chloride and less than 1 mg/L of dissolved boron and lithium. Fluoride is
just above the detection limit (0.1 mg/L). Dissolved silica in the waters is
higher than would be expected for quartz solubility control. Quartz is not a
common mineral in this area. Aluminosilicates and glassy volcanic rocks may
be the source of the SiO2 in the cold-spring waters (C. R. Bacon, oral
communication, 1987).
In general, spring waters discharging above the surface elevation of
Crater Lake are remarkably similar to those discharging below it. Few
chemical differences exist between intracaldera spring water and extracaldera
spring water. However, in the vicinity of Chaski Slide, a large piece of
hydrothermally altered volcanic rock that failed sometime after the climactic
eruption, water passing over the slide material is relatively enriched in
calcium and sulfate (Samples JCL 81-14 and 81-15 on figure 1). Not all waters
discharging from the caldera walls were analyzed for deuterium and oxygen-18,
because samples were not collected at the spring orifice and the effects of
evaporation were unknown.p. 3

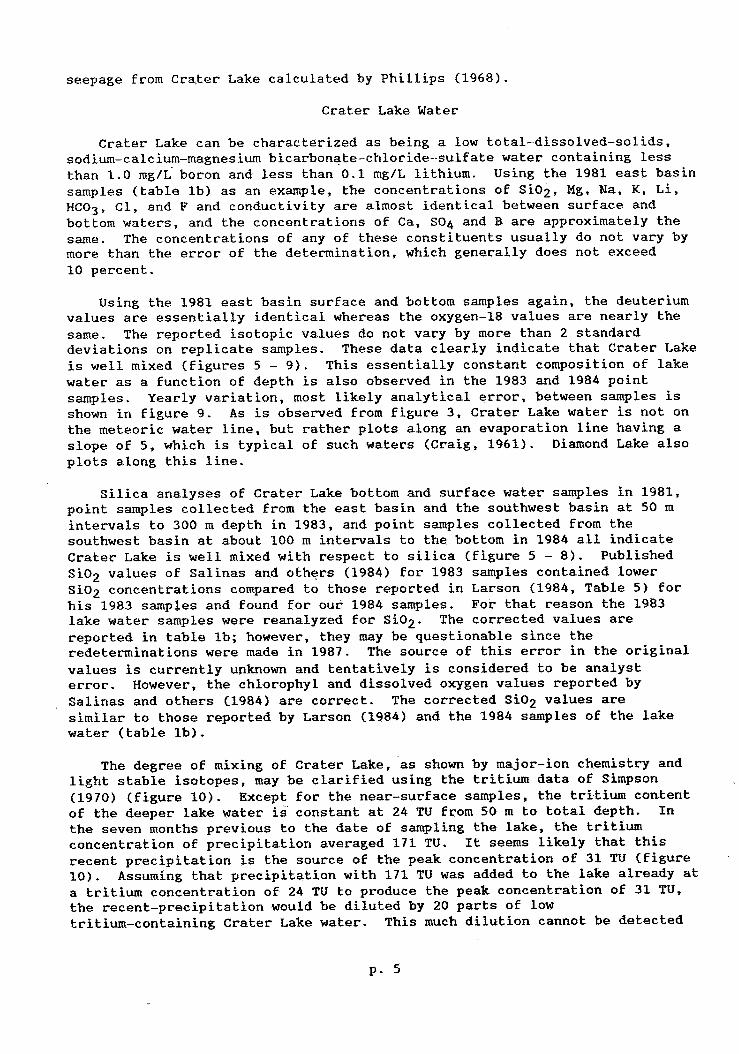
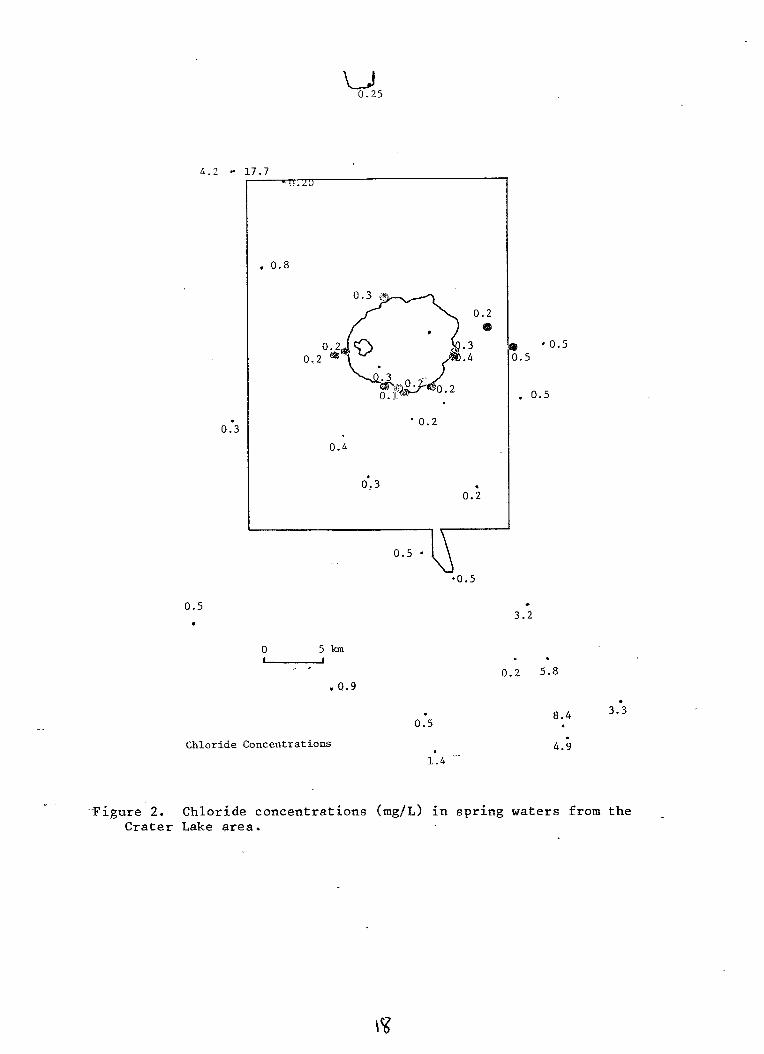
Springs above the lake all have chloride concentrations less than 0.4 mg/L
whereas the lake has a chloride concentration of 10 mg/L (figure 2). The
chloride concentration in the cold springs is similar to that measured in
precipitation in western Oregon (Junge and Werbe, 1958), so that the chloride
in the cold springs appears to be that which was in the water as
precipitation. Because the lake loses 28 percent of its inflow by
evaporation, the chloride concentration of the cold-spring water and direct
precipitation into the lake can be raised by evaporation by no more than
40 percent. Thus the chloride concentration in the lake is quite anomalous
compared to the available water supply.
Both Crater Lake-and Diamond Lake show the effect of evaporation on theirisotopic contents, and they have distinctly different values from cold-spring
samples both above and below the surface elevation of Crater Lake (figure 3).
The evaporation trend is the empirical slope of five reported by Craig
(1961). It is possible to use values for the isotopes to calculate this
evaporation trend (e.g. Gonfiantini, 1986); however, there are a number of
free parameters that have not been measured that are required to perform such
a calculation. Mixing between Crater Lake water and other waters would be
along a straight line in this diagram. Based on the isotopes, there is no
single cold spring with a significant fraction of Crater Lake water.
When deuterium is compared to chloride for Crater Lake and the cold-springsamples, a few samples show elevated chlorides, but the combination of mixing
in the isotope plot of figure 3 and figure 4 permits some of these to be ruled
out as containing a large fraction of Crater Lake water. Based solely on Cl
and SD, the spring on Hamaker Creek (Spring 84-11 on Figure 1, with Cl = 4.2
mg/L, SD = -90 0/oo) could be a mixture of 40 percent normal spring water
and 60 percent Crater Lake water (Figure 4). However, its plotted value in
Figure 3 is near the meteoric water line, indicating that it has no more than
a small percentage of Crater Lake water. The six data points below the lines
on Figure 4 appear to have similar isotopes with varying amounts of chloride;
they cluster together on Figure 3 with similar values of deuterium and
oxygen-18 isotopes. They do not appear to contain any significant fraction of
Crater Lake water. These springs are located southeast of Crater Lake (figure
2). These springs may be dissolving chloride and boron from sediments of the
receding Agency Lake. One of these springs, the source of the Wood River, was
initially thought to be a good candidate for containing a significant fraction
of Crater Lake water because of its high chloride concentration (Williams and
Von Herzen, 1983); however, the isotopic data show that this is unlikely.
Several springs have somewhat elevated chloride concentrations and isotopes
that are in the correct range to have a few percent of Crater Lake water
(Annie Spring 1984 sample, Ranger, Crater, and Fourmile springs); however,none of these have a sufficiently high concentration of chloride to have a
clearly demonstrated contribution from Crater Laker. -Ranger and Fourmile
Springs are located far south and probably in a separate drainage area and areunlikely to contain any significant Crater Lake water. Crater Spring plots
slightly along a mixing trend in figure 3 (shown as a filled square) and along
a SD - Cl trend in figure 4 and, thus, may contain some lake water. CraterSpring, however, cannot contain more than seven percent Crater Lake water.
Other springs could have small fractions of Crater Lake water as shown bytheir position on Figure 4. No single spring is convincingly demonstrated to
contain a substantial amount of Crater Lake water. This is not surprising as
the total flow of springs discharging on Mount Mazama is many times the 89 cfs
p. 4
seepage from Crater Lake calculated by Phillips (1968).
Crater Lake Water
Crater Lake can be characterized as being a low total-dissolved-solids,
sodium-calcium-magnesium bicarbonate-chloride-sulfate water containing less
than 1.0 mg/L boron and less than 0.1 mg/L lithium. Using the 1981 east basin
samples (table lb) as an example, the concentrations of SiO2, Mg, Na, K, Li,
HCO3, Cl, and F and conductivity are almost identical between surface and
bottom waters, and the concentrations of Ca, S04 and B are approximately the
same. The concentrations of any of these constituents usually do not vary bymore than the error of the determination, which generally does not exceed
10 percent.
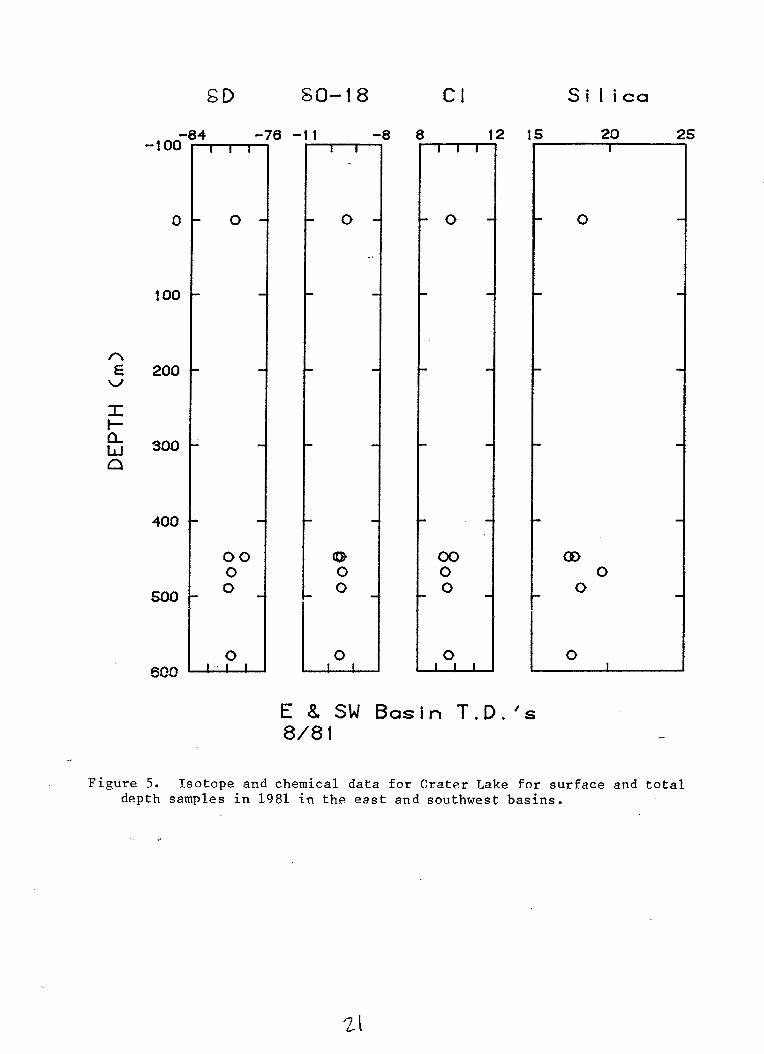
Using the 1981 east basin surface and bottom samples again, the deuterium
values are essentially identical whereas the oxygen-18 values are nearly the
same. The reported isotopic values do not vary by more than 2 standard
deviations on replicate samples. These data clearly indicate that Crater Lake
is well mixed (figures 5 - 9). This essentially constant composition of lake
water as a function of depth is also observed in the 1983 and 1984 point
samples. Yearly variation, most likely analytical error, between samples is
shown in figure 9. As is observed from figure 3, Crater Lake water is not on
the meteoric water line, but rather plots along an evaporation line having a
slope of 5, which is typical of such waters (Craig, 1961). Diamond Lake also
plots along this line.
Silica analyses of Crater Lake bottom and surface water samples in 1981,point samples collected from the east basin and the southwest basin at 50 m
intervals to 300 m depth in 1983, and point samples collected from thesouthwest basin at about 100 m intervals to the bottom in 1984 all indicate
Crater Lake is well mixed with respect to silica (figure 5 - 8). Published
SiO2 values of Salinas and others (1984) for 1983 samples contained lower
SiO2 concentrations compared to those reported in Larson (1984, Table 5) for
his 1983 samples and found for our 1984 samples. For that reason the 1983lake water samples were reanalyzed for SiO2. The corrected values are
reported in table lb; however, they may be questionable since theredeterminations were made in 1987. The source of this error in the original
values is currently unknown and tentatively is considered to be analysterror. However, the chlorophyl and dissolved oxygen values reported by
Salinas and others (1984) are correct. The corrected SiO2 values are
similar to those reported by Larson (1984) and the 1984 samples of the lakewater (table lb).
The degree of mixing of Crater Lake, as shown by major-ion chemistry andlight stable isotopes, may be clarified using the tritium data of Simpson
(1970) (figure 10). Except for the near-surface samples, the tritium contentof the deeper lake water is constant at 24 TU from 50 m to total depth. In
the seven months previous to the date of sampling the lake, the tritiumconcentration of precipitation averaged 171 TU. It seems likely that this
recent precipitation is the source of the peak concentration of 31 TU (figure10). Assuming that precipitation with 171 TU was added to the lake already ata tritium concentration of 24 TU to produce the peak concentration of 31 TU,the recent-precipitation would be diluted by 20 parts of lowtritium-containing Crater Lake water. This much dilution cannot be detected
p. 5

by the other chemical or stable isotopic data that we have, because the
techniques are not sensitive enough to show it. For example, precipitation
with a chloride concentration of 0.2 mg/L added to 20 parts Crater Lake water
with 10 mg/L chloride would have a resulting concentration of 9.5 mg/L. This
small difference is well within the analytical uncertainty of chloride
determinations.
Comparing Crater Lake water to other cold-spring waters and to Diamond
Lake water, a lake about 20 km (12 miles) north of Crater Lake and 300 m
(1000 ft) lower in elevation, Crater Lake has higher Cl, S04, HCO3, Ca,
Mg, Na, Li, and B concentrations (table la and lb). Crater Lake, at such a
high elevation, should contain either less chloride than a typical lower
elevation lake and nearby cold springs or a similar chloride, but not more.
Both lakes are significantly lower in dissolved SiO2 than surrounding
cold-spring waters. For Diamond Lake, which is quite a productive lake, this
is probably a result of diatom metabolism. For Crater Lake, diatoms also
consume silica, but its silica concentration is actually anomalously high.
The inflow of spring and ground water measured by Phillips (1968) is 15
percent of the total inflow to Crater Lake. Precipitation carries negligible
silica whereas the cold springs above Crater Lake carry about 35 mg/L. Using
the assumptions in Phillips (1968), the inflow from the cold springs would
yield a silica concentration of only 7.5 mg/L in Crater Lake whereas the
measured concentration is 18 mg/L. This extra silica must be provided by the
same inflow that supplies the added chloride and sodium calculated by
Nathenson (1987, written communication).
The anomalous constituents in Crater Lake led Van Denburgh (1968) to the
interpretation that the enrichment of Cl and SO4, and perhaps SiO2 and Na,
"... may have been contributed to the lake by thermal springs or fumaroles
..." This suggestion, which is supported by the heat flow data of Williams
and Von Herzen (1983), has caused much controversy. However, if the
interpretation of Williams and Von Herzen's heat flow data is correct, it
provides a mechanism for the relatively uniform chemical and isotopic
composition of the lake, namely Rayleigh convection. They reported a Rayleigh
number of 6.3 x 10¹⁴, whereas 1000 is sufficient to initiate convection.
Chloride Analyses of Crater Lake Water
Because of inconsistencies in chloride values from two methods that became
apparent when analyzing the last samples collected, we reanalyzed our Crater
Lake water samples by at least two, and generally three, different methods for
dissolved C1 (table 2). From the data in table 2, different analytical
methods yield different Cl concentrations. Some measured C1 concentrations
differ more than 1 mg/L.
These determinations pointed out the requirement for more information on
both the precision and accuracy of the chloride procedures followed. To
address this analytical problem, we prepared two different experiments. The
first was to reanalyze the 1981, 1983, and 1984 lake water samples using
analytical techniques not initially employed. The second was to prepare four
solutions containing 5, 10, 15, and 20 mg/L Cl and then to analyze each of the
four solutions three times by each analytical method employed: ion
chromatography, an automated AgN03 titration, and a manual Hg(N03)2titration. The results of these analyses are reported in table 3.
p. 6

To standardize the titrants for the two titration procedures, we used the
method described by Fishman and Friedman (1985). After standardization of the
titrant, the various standards were titrated 3 times and each individual
concentration calculated (table 3). The mean and standard deviation are also
reported in table 3. Because preparing standards for the ion chromatographic
procedure is essentially a repeat of preparing the four standard Cl solutions,
the error for this method was the variations in the peak heights. As can be
observed from the RSDs calculated in table 3, some values are quite precise
but others have significant variations.
The regression that passes nearest the origin using mean values is the ion
chromatographic line, intercept a = -.014. Using the total data set, the best
regression line is that for the automated AgNO3 titration, a = .545. Using
the mean values, the Hg(N03)2 titration has good overall precision, but
the worst intercept, a = 2.08. The method of choice seems to be the automated
AgNO3 titration because it is easy, rapid, and accurate. The Cl
concentrations reported in table lb for Crater Lake water samples collected
since 1982 were determined using the automated AgNO3 titration. The 1981
samples apparently evaporated too much for an adequate comparison.
Fishman and Pyen (1979) reported results of ion chromatographic (IC) and
automated colorimetric (AC) Cl analyses for numerous surface waters. Assuming
that the AC method is correct, the mean difference between the IC and AC is
-0.76 (std. dev. = 1.30) for samples containing less than 20 mg/L C1. A
similar comparison can be made for our 1983 Crater Lake data in table 2.
Assuming the AgNO3 procedure is correct, the mean difference between methods
is 0.95 (std dev = .34). This suggests a constant error of about 1 mg/L
between the IC method and any other method.
Chemical'Evidence of Thermal Components in Crater Lake Water
Elevated concentrations of boron and lithium are typically found in
thermal waters of volcanic origin (e.g., White and others, 1976, Ellis and
Mahon, 1977, p. 58-116). Because Crater Lake water is enriched in boron and
lithium compared to local meteoric water and because the concentration of
boron and lithium is either at or below the detection limit for these
dissolved constituents in the cold spring waters, we evaporated water from 8
cold spring and 2 lake water profiles, collected at 100 m intervals, from 1
-liter to approximately 50 mL. This reduced volume was then analyzed for boron
and lithium. The concentration of lithium and boron were then significantly
above the detection limits and are reported in table 4.
The concentrations of boron (tables 1 and 4) in Crater Lake water is at
least twice that of the cold-spring water, and the lithium concentration is at
least 10 times that of the cold springs. If the chloride, boron, and lithium
are derived from a thermal source, then the Cl/B and Cl/Li weight ratios would
be expected to be similar to ratios from known hot springs in volcanic areas
(table 4). Unfortunately, the cold water Cl/B ratios range from 6 to 33 and
the lake water ratios range from 17 to 31. This overlap invalidates the use
of the Cl/B ratio for identifying thermal components in the lake waters.
The Cl/Li ratio appears to be more diagnostic. In cold-spring waters the
Cl/Li ranges from 540 to 4600, and in Crater Lake the ratio ranges from 220 to
280 (mean = 242, std. dev. = 20)(table 4). The Cl/Li weight ratio is
substantially lower in lake water than in cold-spring water. Typical Cl/Li
p. 7

weight ratios for thermal waters from other volcanic areas range from 80 to410 (mean = 246, std. dev. = 115)(table 4). The Crater Lake Cl/Li weight
ratios are near the mean Cl/Li ratios for a variety of volcanic settings in
the western United States. This also suggests that the additional chloride
may be contributed by a thermal water.
Of the other anionic indicators of thermal waters, S04 and HCO3, S04can arise from biogenic oxidation of sulfur and sulfides (Schoen, 1969; Schoenand Rye, 1970; and Brock and Mosser, 1975), and atmospheric C02 can also
dissolve in the lake. We do not have the requisite isotopic data to determinethe fraction of HCO3 and S04 contributed by this deep thermal fluid.
Crater Lake is a slightly alkaline (pH-7.5) sodium chloride-sulfatelake. This observation negates the possibility that acidic fumarolic gases
such as HCl and H2S are being discharged into the lake bottom as was
suggested by Van Denburgh (1968). If HC1 were being added to the lake, then
the ionization of the HCI would make the lake acidic (pH<7). The oxidation
of H2S, which generates sulfuric acid, also would tend to make the lake
acidic. Thus, Na+ and Cl- appear to enter the lake together, probablydissolved in water. NaCl is not transported in a low temperature (t(150'C),
low pressure (P<15 bars) gas. Additionally, the excess SiO2 discussed
earlier suggests transport of SiO2 in water because little SiO2 is
transported in a vapor phase.
Conclusions
Compared to nearby cold springs and Diamond Lake to the north, Crater Lakehas anomalously high concentrations of dissolved Na, Li, Cl, S04, and B.
Additionally, the 6D and 6180 values for the lake water aresignificantly higher (heavier) than for cold-spring waters. The isotopic
difference between lake water and cold-spring water is caused by evaporation.
The water isotopes, SD and 6180, determine an evaporation line betweenAnnie Spring and Crater Lake water having a slope of five, which is typical
for evaporated waters. Diamond Lake also plots along this evaporation line.
The chemical enrichments in Crater Lake, however, cannot be explained by
evaporation.
No one spring was identified as being the outlet of Crater Lake. We seeno evidence for any spring containing more than ten percent lake water.
Crater Spring in the NW part of the park (see figure 1 and 2) may contain someCrater Lake water. The evidence for this is that Crater Spring plots along a
mixing line between Crater Lake water and the meteoric water line and alsothat it contains some Cl and plots along a 6D - Cl mixing line between
Crater Lake and dilute spring waters. If Crater Spring does contain CraterLake water, it cannot contain more than seven percent lake water. Oasis
Spring, in the same vicinity, may also contain some Crater Lake water.
Crater Lake appears to be well mixed based on chemical and isotopicanalyses. The concentrations of SiO2, Cl, Na, Li, SO4, and B do not vary
significantly as a function of depth. The 6D and 6180 values areremarkably uniform throughout the lake water. Tritium data indicate that
recent precipitation rapidly mixes with many volumes of lake water in the nearsurface. The heat flow values reported by Williams and Von Herzen (1983) aresufficient to cause small density gradients that allow the lake to convect inthe deeper levels. This Rayleigh convection is apparently able to mix the
p. 8

lake water thoroughly over a 1-year period because there are no major ionchemical gradients found in Crater Lake (Simpson, 1970).
Thermal water generally contains moderate to high concentrations ofdissolved boron, chloride, and lithium. Crater Lake also appears to have ananomalously high Li concentration compared to other waters in this area. Asis observed from table la and table 4, other cold springs can have somewhatelevated chloride concentrations and similar Cl/B weight ratios thus negatingtheir overall usefulness. The Cl/Li weight ratio may be useful in assessingif the Cl is also derived from a thermal water. The mean Cl/Li weight ratiofor Crater Lake is calculated to be 242, which is comparable to thermal watersfrom volcanic environments, 81 - 410, and is substanially lower than thelowest cold-spring ratio (550) at Annie Spring. This supports the hypothesisthat Crater Lake contains thermal water and also explains the elevated Ma, Li,Cl, S04, and B concentrations. With the present data it is not possible toassess a) the amount of, b) the temperature of, or c) the composition of thisinferred thermal water.
P. 9

References
Bacon, C. R., 1983, Eruptive history of Mount Mazama and Crater Lake caldera,
Cascade Range, U.S.A.: Journal of Volcanology and Geothermal Research,
vol. 18, p. 57-115.
Bigeleisen, J., Perlman, M. L., and Prosser, H. C., 1952, Conversion of
hydrogenic materials to hydrogen for isotopic analysis: Analytical
Chemistry, vol. 24, p. 1356-1357.
Brock, T. D., and Mosser, J. L., 1975, Rate of sulfuric-acid production in
Yellowstone National Park: Geological Society of America Bulletin, vol.
86, p. 194-198.
Brown, Eugene, Skougstad, M. W., and Fishman, M. J., 1970, Methods for
collection and analysis of water samples for dissolved minerals and
gases: Techniques of Water-Resources Investigations of the U. S.
Geological Survey, Book 5, Chapter Al, 160 p.
Craig, Harmon, 1961, Isotopic variations in meteoric waters: Science,
vol. 133, p. 1702-1703.
Ellis, A- J., and Mahon, W. A. J., 1977, Chemistry and Geothermal Systems:
Academic Press, New York, 392 p.
Epstein, S., and Mayeda, T., 1953, Variations of the 180 contents of waters
from natural sources: Geochimica et Cosmochimica Acta, vol. 4,
p. 213-224.
Fishman, M. J., and Friedman, L. C., 1985, Methods for determination of
inorganic substances in water and fluvial sediment: Techniques of
Water-Resources Investigations of the United States Geological Survey,
Book 5, Chapter Al: U.S. Geological Survey Open-File Report 85-495,
p. 211-228.
Fishman, M. J., and Pyen, Grace, 1979, Determination of selected anions in
water by ion chromatography: U.S. Geological Survey Water-Resources
Investigations 79-101, 30 p.
Gonfiantini, Roberto, 1986, Environmental isotopes in lake studies, in
Handbook of Environmental Isotope Geochemistry, P. Fritz and J. Ch.
Fontes, editors: Elsevier Scientific Publishing Company, Amsterdam, The
Netherlands, vol. 2, p. 113-168.
Junge, C. E., and Werby, R. T., 1958, The concentration of chloride, sodium,
-potassium, calcium, and sulfate in rain water over the United States:
Journal of Meteorology, vol. 15, p. 417-425.
Larson, D. W., 1984, Second annual report on the limnology and water quality
monitoring program at Crater Lake National Park, Oregon: National Park
Service Pacific Northwest Region, Seattle, 108 p.
Mariner, R. H., Presser, T. S., and Evans, W. C., 1982, Chemical and isotopic
composition of water from thermal and mineral springs of Washington: U.S.
Geological Survey Open-File Report 82-98, 18 p.
p. 10
Mariner, R. H., and Willey, L. M., 1976, Geochemistry of thermal waters in
Long Valley, Mono County, California: Journal of Geophysical Research,
vol. 81, p. 792-800.
Phillips, K. N., 1968, Hydrology of Crater, East, and Davis Lakes, Oregon:
U.S. Geological Survey Water-Supply Paper 1859-E, 60 p.
Salinas, John, White, L. D., and Thompson, J. M., 1984, Studies on chemical,
isotopic, and limnological parameters of Crater Lake, Oregon (abs): Eos,
vol. 65, p. 885.
Schoen, Robert, 1969, Rate of sulfuric acid formation in Yellowstone National
Park: Geological Society of America Bulletin, vol. 80, p. 643-650.
Schoen, Robert, and Rye, R. O., 1970, Sulphur isotope distribution in
solfataras, Yellowstone National Park: Science, vol. 170, p. 1082-1084.
Shapiro, Leonard, and Brannock, W. W., 1956, Rapid analysis of silicate
rocks: U.S. Geological Survey Bulletin 1036C, 56p.
Simpson, H. J., 1970, Tritium in Crater Lake, Oregon: Journal of Geophysical
Research, vol. 75, p. 5195-5207.
Thompson, J. M., 1975, Selecting and collecting thermal springs for chemical
analysis: A method for field personnel: U.S. Geological Survey Open-File
Report 75-68, 11 p.
Thompson, J. M., 1985, Chemistry of thermal and nonthermal springs in the
vicinity of Lassen Volcanic National Park: Journal of Volcanology and
Geothermal Research, vol. 25, p. 81-104.
Thompson, J. M., Goff, F. E., and Donnelly-Nolan, J. M., 1981, Chemical
analyses of waters from springs and wells in the Clear Lake volcanic area
in R. J. McLaughlin and J. M. Donnelly-Nolan (editors), Research in the
Geysers - Clear Lake Geothermal Field, Northern California: U.S.
Geological Survey Professional Paper 1141, p. 183-191.
Thompson, J. M., and Yadav, Sandhya, 1979, Chemical analyses of waters from
geysers, hot springs, and pools in Yellowstone National Park, Wyoming,
from 1974 to 1978, U.S. Geological Survey Open-File Report 79-704, 49 p.
Thompson, J. M., and White, L. D., 1983, Does Crater Lake, Oregon, have a
discernible outlet?-(abs): Eos, vol. 64, p. 895.
Van Denburgh, A. S., 1968, Chemistry of the Lakes, in Hydrology of Crater,
East, and Davis Lakes, Oregon: U.S. Geological Survey Water-Supply Paper
1859-E, p. 41-45.
White, D. E., Thompson, J. M., and Fournier, R. O., 1976, Lithium contents of
thermal and mineral springs, in J. D. Vine (editor), Lithium Resources and
Requirements by the Year 2000: U.S. Geological Survey Professional Paper
1005, p. 58-60.
White, L. D., Thompson, J. M., and Maley, C. A., 1985, Evidence for thermal
water in Crater Lake, Oregon (abs): Eos, vol. 66, p. 1146.
Williams, D. L., and Von Herzen, R. P., 1983, On the terrestrial heat flow and
physical limnology of Crater Lake, Oregon: Journal of Geophysical
Research, vol. 88, p. 1094-1104.
p. 11

Table la. Chemical Analyses of Springs in the Vicinity of Mount Mazama
Sample Cond. Water T.Numbers Name or Localityl Date 1 pH SiC 2 Ca Mq Na K Li HCO3 S04 Cl F 8 (pMHOS) 'C a180 aD
in mg/L
1981 Samples
.JCL-81-1 Annie Spring 8 Aug 81 7.2 38 2.9 1.0 2.6 0.8 <0.01 15 4 0.4 0.17 0.1 144 4 -13.89 -99.4JCL.-81-2 Diamond Lake, S End 9 Aug 81 7.3 3.6 1.7 1.0 3.2' 0.8 <0.01 30 1 0.2 0.13 0.1 121 22.5 -10.85 -83.2.JCL-81-3 Boundary Springs 9 Aug 81 7.6 34 4.3 2.4 3.3 .5 <0.01 25 3 0.2 0.15 <0.1 120 5 -13.76 -98.1JCL-81-4 Lightning Spri ngs 9 Aug 81 7.1 26 1.7 .25 1.5 .8 <0.01 12 1 0.2 0.13 0.1 84 4 -14.23 -96.6JCL-81-5 Lodgepole Picnic area 9 Aug 81 7.2 36 1.9 .48 2.8 1.5 <0.01 17 <0.5 0.3 0.14 <0.1 102 5 -- --JCL-81-6 Maklaks Spring 10 Aug 81 6.9 24 1.8 .41 1.8 .8 <0.01 12 1 0.2 D.14 <0.1 105 10.5 - -
.JCL-81-7 Headwater of Lost Creek 10 Aug 81 7.2 32 1.8 .61 1.9 .4 <0.01 22 1 0.3 0.15 <0.1 109 7 .5 - -
.JCL-81-8 Vidae Falls 10 Aug 81 1.1 34 2.1 .70 2.0 .8 <0.01 16 <0.5 0.2 0.15 0.2 117 9-- -
JCL-81.-9 Thousand Springs 11 Aug 81 7.3 34 4.8 2.5 2.5 1 .1 <0.01 27 2 0.2 0.16 <0.1 129 5 -13.70 -99.2.JCL-81-10 Source of Wood River 11 Aug 81 7.3 40 5.6 2.7 6.1 1.0 .01 34 5 3.2 0.18 .2 132 9.5 -14.87 -107.6JCL.-81-11 Steel Bay, C.L. 13 Aug 81 7.0 26 .4 .30 1.9 .4 <0.01 14 2 0.3 0.18 <0.1 105 18 -13.75 -101.7JCL-81-12 N. 'Pumice Castle' C.L. 13 Aug 81 8.6 36 1.6 .83 2.5 .6 .01 18 <0.5 0.3 0.24 <0.1 102 9 -- --
JCL-81-13 S. 'Pumice Castle' C.L. 13 Aug 81 8.2 40 1.6 1.1 2.7 1.0 <0.01 27 1 0.4 0.19 <0.1 110 6.5 -15.45 -110.5JCL-81-14 'Chaski Slide-~E', C.L. 13 Aug 81 7.06 26 4.9 1.7 2.0 .9 <0.01 19 12 0.1 0.19 <0.1 125 12 -- --
JICL-81-15 'Chaski Slide-WI, C.L. 13 Aug 81 6.2 22 10.1 3.2 3.3 .4 <0.01 20 26 0.2 0.20 <0.1 145 9.5 -13.88 -105.2JCL-81-16 'The Watchman Spring' 13 Aug 81 6.6 34 1.6 .42 2.1 1.0 <0.01 16 <0.5 0.2 0.15 <0.1 110 5 -- --
.JCL-81-17 Dutton Cliff 13 Aug 81 7.8 36 1.1 .92 4.2 .6 <0.01 21 1 0.2 0.16 <0.1 115 14-- -
JCL-81-24 Spring near C. L. Lodge 17 Aug 81 .6. 3 30 2.0 .29 1.9 .7 <0.01 24 <0.5 0.3 0.17 0.2 107 6 - -
1982 Samples
JCL-82-1 Cascade Spring '31 Aug 82 7.06 40.5 2.5 .90 2.9 1.4 <0.01 37 <0.2 0.2 0.03 0.4 - 3.5 -15.11 -108.4JCL-82-2 Cattle Crossing Rest. f1 Sep 82 7.15 40.0 2.7 2.9 10.8 .7 <0.01 63 <0.2 0.2 0.13 1.1 -- COLD -14.04 -101.1
1983 Sample
JCL-83-1 Crater Spring 7 Aug 83 6.34 35.1 3.0 1.1 3.0 1.6 <0.01 32 <2 0.8 0.1 <.1 -- 3.0 -13.56 -97.4
1984 Samples
JCL-84-1 Annie Spring 3 Aug 84 5.39 40.5 2.0 1.4 3.0 2.2 <0.01 30 <1 1.2 0.7 0.2 44 3 -13.9 -99.5JCL-84-2 Tecumseh Spring 3 Aug 84 7.88 34.2 7.46 1.8 1.2.5 1.4 <0.01 58 3.4 4.9 0.17 0.2 95.5 11 -14.7 -106.8.JCL-84-3 Source of Crooked Crk 3 Aug 84 7.90 36.3 8.03 2.4 15.6 1.9 <0.01 53 6.2 8.4 0.16 0.4 126 11 -14.7 -108.0JCL-84-4 Source of Wood River 3 Aug 84 6.74 45.8 2.09 2.4 6.6 1.9 <0.01 47 1.8 2.8 0.10 0.2 50 12 -15.1 -105.5JCL-84-5 Reservation Spring 3 Aug 84 7.58 39.5 15.7 1.9 10.8 2.1 .01 50 4.6 5.8 0.14 0.1 103 8 -14.6 -106.JCL-84-6 Source of Spring Crk 3 Aug 84 7.51 40.8 3.22 1.8 8.5 1.3 <0.01 46 2.4 3.3 0.12 0.1 60 6 -14.3 -105JCL-84-7 Annie Creek at boundary 3 Aug 84 N.R. 39.8 6.43 1.1 3.4 1.6 <0.01 32 1.8 0.5 < .1 0.2 50.3 10 -14.2 -98JCL-84-8 Pothole Spring 4 Aug 84 6.68 42.7 2.68 0.90 2.9 1.7 <0.01 29 0.2 0.5 <.I 0.1 30 3 -15.1 -110JCL-84-9 Unnamed spring nr road 4 Aug 84 6.79 45.4 2.99 1.3 3.6 2.1 <0.01 34 0.1 0.5 <.1 0.1 47 4 -15.2 -108JCL-84-10 Unnamed spring, source 4 Aug 84 6.94 31.4 17.8 0.53 2.4 1.4 <0.01 21 0.4 0.5 <.I 0.2 29 6 -15.0 -103
of Crk 1/4 ml S of Scott CrkJCL-84-11 Unnamed spring on 4 Aug 84 N.R. 98.6 23.7 5.1 89 9.7 .03 417 0.8 4.2 0.12 0.2 320 10 -13.2 -90.
Hamaker Creek nr Soda springJCL-84-12 Mare's Egg Spring 5 Aug 84 7.70 34.8 10.8 9.0 4.2 1.5 <0.01 55 0.3 0.5 0.05 0.2 77 4 -14.4 -101.JCL-84-13 Four-mile Spring 5 Aug 84 7.96 31.7 6.01 2.4 4.4 1.5 <0.01 54 0.5 1.4 <.1 0.2 74 5 -14.1 -98.JICL-84-14 Ranger Spring 5 Aug 84 N.R. 38.9 14.2 1.0 3.0 2.0 <0.01 34 <0.1 0.9 <.I 0.2 47 2 -13.6 -95.JCL-84-15 Cedar Springs 5 Aug 84 6.37 39.2 11.6 1.2 3.4 1.6 <0.01 44 <0.1 0.5 < .1 < .1 60 7 -13.4 -101.JCL-84-16 Geyser Spring 6 Aug 84 N.R. 30.7 7.52 2.7 3.3 1.2 <0.01 57 0.1 0.5 <.1 0.2 75 5 -12.9 -91
1985 Sample
JCL-85-7 Soda Spq on Hamaker Cr 6 Aug 85 5.31 71 271. 243 106. 31.5 0.06 2280 16. 17.7 0.04 0.43 3620 10 -14.3 -102
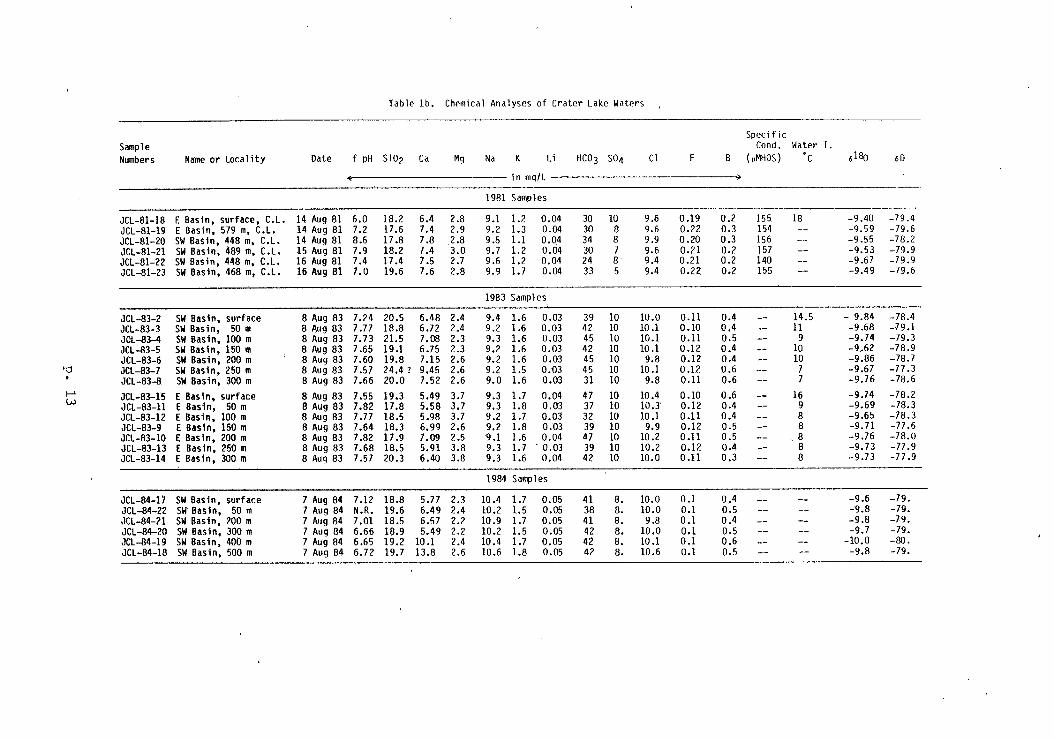
Table lb. Chemical Analyses of Crater Lake Waters
SpecificSample Cond. Water T.Numbers Name or Locality Date f pH SiO2 Ca Mg Na K Li HCO 3 504 Cl F B (pMHOS) C 6180 6D
4 in mg/L z
1981 Samples
JCL-81-18 E Basin, surface, C.L. 14 Aug 81 6.0 18.2 6.4 2.8 9.1 1.2 0.04 30 10 9.6 0.19 0.2 155 18 -9.40 -79.4JCL-81-19 E Basin, 579 m, C.L. 14 Aug 81 7.2 17.6 7.4 2.9 9.2 1.3 0.04 30 8 9.6 0.22 0.3 154 -- -9.59 -79.6JCL-81-20 SW Basin, 448 m, C.L. 14 Aug 81 8.6 17.8 7.8 2.8 9.5 1.1 0.04 34 8 9.9 0.20 0.3 156 -- -9.55 -78.2JCL-81-21 SW Basin, 489 m, C.L. 15 Aug 81 7.9 18.2 7.4 3.0 9.7 1.2 0.04 30 7 9.6 0.21 0.2 157 -- -9.53 -79.9JCL-81-22 SW Basin, 448 m, C.L. 16 Aug 81 7.4 17.4 7.5 2.7 9.6 1.2 0.04 24 8 9.4 0.21 0.2 140 -- -9.67 -79.9JCL-81-23 SW Basin, 468 m, C.L. 16 Aug 81 7.0 19.6 7.6 2.8 9.9 1.7 0.04 33 5 9.4 0.22 0.2 155 -- -9.49 -79.6
1983 Samples
JCL-83-2 SW Basin, surface 8 Aug 83 7.24 20.5 6.48 2.4 9.4 1.6 0.03 39 10 10.0 0.11 0.4 -- 14.5 - 9.84 -78.4JCL-83-3 SW Basin, 50 m 8 Aug 83 7.77 18.8 6.72 2.4 9.2 1.6 0.03 42 10 10.1 0.10 0.4 -- 11 -9.68 -.79.1JOL-83-4 SW Basin, 100 m 8 Aug 83 7.73 21.5 7.08 2.3 9.3 1.6 0.03 45 10 10.1 0.11 0.5 -- 9 -9.74 -79.3JCL-83-5 SW Basin, 150 m 8 Aug 83 7.65 19.1 6.75 2.3 9.2 1.6 0.03 42 10 10.1 0.12 0.4 -- 10 -9.62 -78.9JCL-83-6 SW Basin, 200 m 8 Aug 83 7.60 19.8 7.15 2.6 9.2 1.6 0.03 45 10 9.8 0.12 0.4 -- 10 -9.86 -78.7JCL-83-7 SW Basin, 250 m 8 Aug 83 7.57 24.4 ? 9.45 2.6 9.2 1.5 0.03 45 10 10.1 0.12 0.6 -- 7 -9.67 -77.3JCL-83-8 SW Basin, 300 m 8 Aug 83 7.66 20.0 7.52 2.6 9.0 1.6 0.03 31 10 9.8 0.11 0.6 -- 7 -9.76 -78.6
JCL-83-15 E Basin, surface 8 Aug 83 7.55 19.3 5.49 3.7 9.3 1.7 0.04 47 10 10.4 0.10 0.6 -- 16 -9.74 -78.2JCL-83-11 E Basin, SO m 8 Aug 83 7.82 17.8 5.58 3.7 9.3 1.8 0.03 37 10 10.3 0.12 0.4 -- 9 -9.69 -78.3JCL-83-12 E Basin, 100 m 8 Aug 83 7.77 18.5 5.98 3.7 9.2 1.7 0.03 32 10 10.1 0.11 0.4 -- 8 -9.65 -78.3JCL-83-9 E Basin, 150 m 8 Aug 83 7.64 18.3 6.99 2.6 9.2 1.8 0.03 39 10 9.9 0.12 0.5 -- 8 -9.71 -77.6JCL-83-10 E Basin, 200 m 8 Aug 83 7.82 17.9 7.09 2.5 9.1 1.6 0.04 47 10 10.2 0.11 0.5 -- 8 -9.76 -78.0JCL-83-13 E Basin, 250 m 8 Aug 83 7.68 18.5 5.91 3.8 9.3 1.7 0.03 39 10 10.2 0.12 0.4 -- 8 -9.73 -77.9JCL-83-14 E Basin, 300 m 8 Aug 83 7.57 20.3 6.40 3.8 9.3 1.6 0.04 42 10 10.0 0.11 0.3 -- 8 -9.73 -77.9
1984 Samples
JCL-84-17 SW Basin, surface 7 Aug 84 7.12 18.8 5.77 2.3 10.4 1.7 0.05 41 8. 10.0 0.1 0.4 _- -- -9.6 -79.JCL-84-22 SW Basin, 50 m 7 Aug 84 N.R. 19.6 6.49 2.4 10.2 1.5 0.05 38 8. 10.0 0.1 0.5 -- -- -9.8 -79.JCL-84-21 SW Basin, 200 m 7 Aug 84 7.01 18.5 6.57 2.2 10.9 1.7 0.05 41 8. 9.8 0.1 0.4 -- -- -9.8 -79.JCL-84-20 SW Basin, 300 m 7 Aug 84 6.66 18.9 5.49 2.2 10.2 1.5 0.05 42 8. 10.0 0.1 0.5 -- -- -9.7 -79.JCL-84-19 SW Basin, 400 m 7 Aug 84 6.65 19.2 10.1 2.4 10.4 1.7 0.05 42 8. 10.1 0.1 0.6 -- -- -10.0 -80.JCL-84-18 SW Basin, 500 m 7 Aug 84 6.72 19.7 13.8 2.6 10.6 1.8 0.05 42 8. 10.6 0.1 0.5 -- -- -9.8 -79.
i.-.
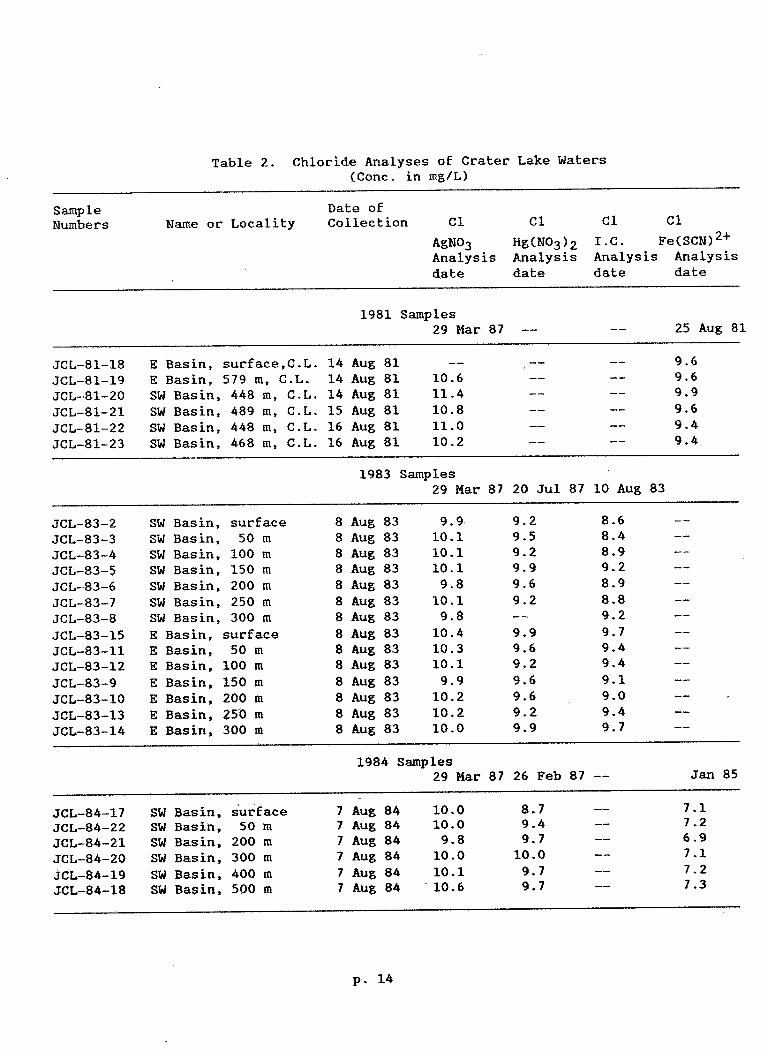
Table 2. Chloride Analyses of Crater Lake Waters(Cone. in mg/L)
Sample Date ofNumbers Name or Locality Collection Cl Cl Cl Cl
AgNO3 Hg(N03 )2 I.C. Fe(SCN)2+Analysis Analysis Analysis Analysisdate date date date
1981 Samples29 Mar 87 - - 25 Aug 81
JCL-81-18 E Basin, surface,C.L. 14 Aug 81 -- - -9.6
JCL-81-19 E Basin, 579 m, C.L. 14 Aug 81 10.6 - 9.6
JCL-81-20 SW Basin, 448 m, C.L. 14 Aug 81 11.4 - 9.9
JCL-81--21 SW Basin, 489 m, C.L. 15 Aug 81 10.8 - 9.6
JCL-81-22 SW Basin, 448 m, C.L. 16 Aug 81 11.0 - 9.4
JCL-81-23 SW Basin, 468 m, C.L. 16 Aug 81 10.2 --- 9.4
1983 Samples29 Mar 87 20 Jul 87 10 Aug 83
JCL-83-2 SW Basin, surface 8 Aug 83 9.9. 9.2 8.6 -
JCL-83-3 SW Basin, 50 m 8 Aug 83 10.1. 9.5 8.4 -
JCL-83-4 SW Basin, 100 m 8 Aug 83 10.1 9.2 8.9
JCL-83--5 SW Basin, 150 m 8 Aug 83 10.1 9.9 9.2 -
JCL-83-6 SW Basin, 200 m 8 Aug 83 9.8 9.6 8.9 -
JCL-83--7 SW Basin, 250 m 8 Aug 83 10.1 9.2 8.8 -
JCL-83--8 SW Basin, 300 m 8 Aug 83 9.8 -- 9.2 -
JCL-83---15 E Basin, surface 8 Aug 83 10.4 9.9 9.7 -
JCL-83-11 E Basin, 50 m 8 Aug 83 10.3 9.6 9.4 -
JCL-83-12 E Basin, 100 m 8 Aug 83 10.1 9.2 9.4 -
JCL-83-9 E Basin, 150 m 8 Aug 83 9.9 9.6 9.1 -
JCL-83-10 E Basin, 200 m 8 Aug 83 10.2 9.6 9.0 -
JCL-83--13 E Basin, 250 m 8 Aug 83 10.2 9.2 9.4-
JCL-83--14 E Basin, 300 m 8 Aug 83 10.0 9.9 9.7-
1984 Samples29 Mar 87 26Feb 87 -- Jan 85
JCL-84-17 SW Basin, surface 7 Aug 84 10.0 8.7 -- 7.1
JCL-84--22 SW Basin, 50 m 7 Aug 84 10.0 9.4 -- 7.2
JCL-84-21 SW Basin, 200 m 7 Aug 84 9.8 9.7 -- 6.9
JCL-84-20 SW Basin, 300 m 7 Aug 84 10.0 10.0 -- 7.1
JCL-84-19 SW Basin, 400 m 7 Aug 84 10.1 9.7 -- 7.2
JCL-84-18 SW Basin, 500 m 7 Aug 84 -10.6 9.7 -- 7.3
p. 14
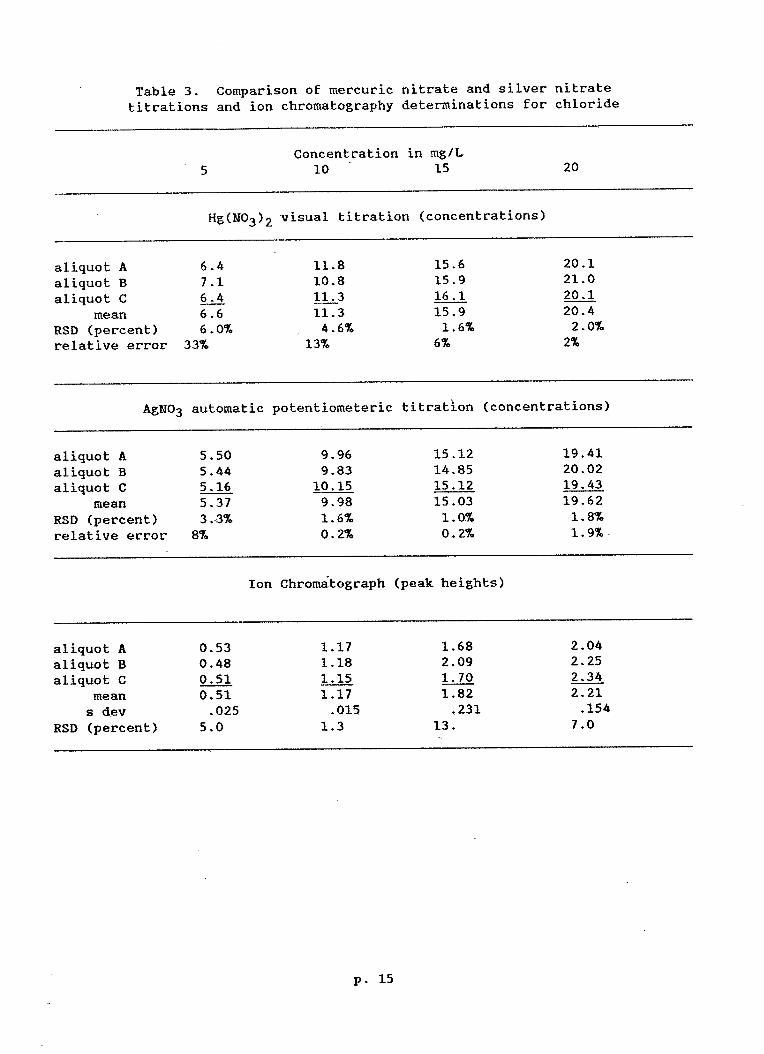
Table 3. Comparison of mercuric nitrate and silver nitrate
titrations and ion chromatography determinations for chloride
Concentration in mg/L5 ~~~10 15 20
Hg(N03)2 visual titration (concentrations)
aliquot A 6.4 11.8 15.6 20.1
aliquot B 7.1 10.8 15.9 21.0
aliquot C 6.4 11.3 16.1 20.1
mean 6.6 11.3 15.9 20.4
RSD (percent) 6.0% 4.6% 1.6% 2.0%
relative error 33% 13% 6% 2%
AgN03 automatic potentiometeric titration (concentrations)
aliquot A 5.50 9.96 15.12 19.41
aliquot B 5.44 9.83 14.85 20.02
aliquot C 5.16 10.15 15.12 19.43
mean 5.37 9.98 15.03 19.62
RSD (percent) 3,-3% 1.6% 1.0% 1.8%
relative error 8% 0.2% 0.2% 1.9%,
Ion Chromatograph (peak heights)
aliquot A 0.53 1.17 1.68 2.04
aliquot B 0.48 1.18 2.09 2.25
aliquot C 0.51 1.15 1.70 2.34
mean 0.51 1.17 1.82 2.21
s dev .025 .015 .231 .154
RSD (percent) 5.0 1.3 13. 7.0
p. 15
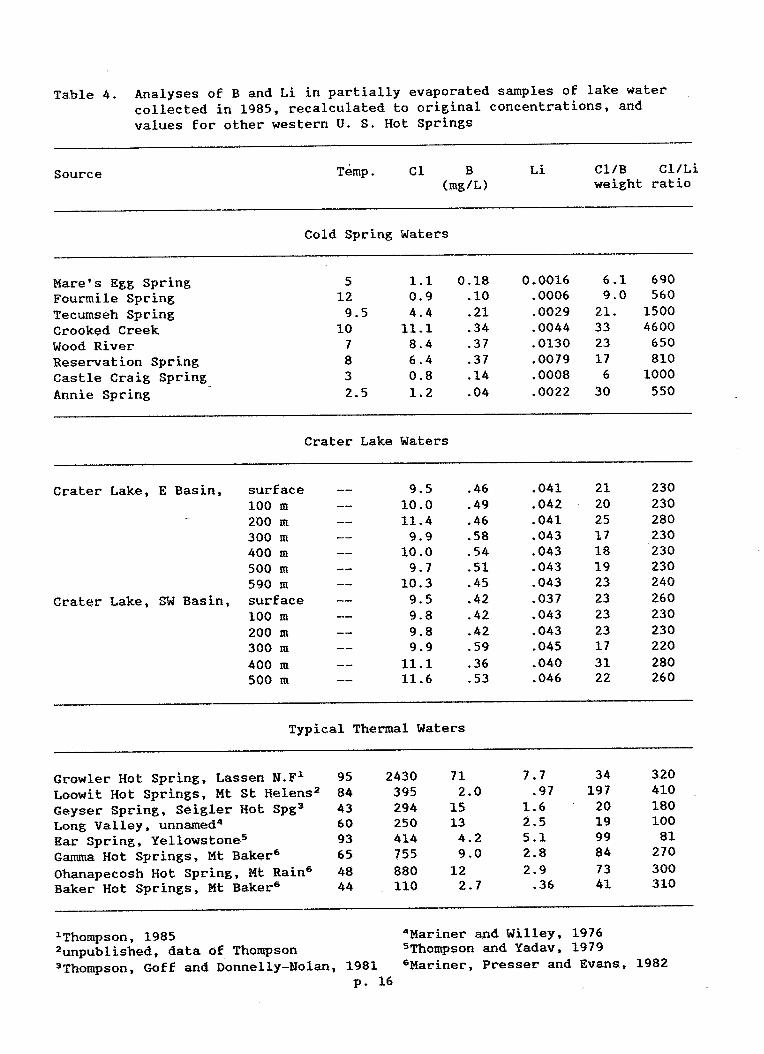
Table 4. Analyses of B and Li in partially evaporated samples of lake water
collected in 1985, recalculated to original concentrations, and
values for other western U. S. Hot Springs
Source Temp. Cl B Li Cl/B Cl/Li(mg/L) weight ratio
Cold Spring Waters
Mare's Egg Spring 5 1.1 0.18 0.0016 6.1 690
Fourmile Spring 12 0.9 .10 .0006 9.0 560
Tecumseh Spring 9.5 4.4 .21 .0029 21. 1500
Crooked Creek 10 11.1 .34 .0044 33 4600
Wood River 7 8.4 .37 .0130 23 650
Reservation Spring 8 6.4 .37 .0079 17 810
Castle Craig Spring 3 0.8 .14 .0008 6 1000
Annie Spring 2.5 1.2 .04 .0022 30 550
Crater Lake Waters
Crater Lake, E Basin, surface -- 9.5 .46 .041 21 230
100 m -- 10.0 .49 .042 20 230
200 m -- 11.4 .46 .041 25 280
300 m -- 9.9 .58 .043 17 230
400 m -- 10.0 .54 .043 18 230
500 m -- 9.7 .51 .043 19 230
590 m -- 10.3 .45 .043 23 240
Crater Lake, SW Basin, surface -- 9.5 .42 .037 23 260
100 m -- 9.8 .42 .043 23 230
200 m -- 9.8 .42 .043 23 230
300 m -- 9.9 .59 .045 17 220
400 m -- 11.1 .36 .040 31 280
500 m -- 11.6 .53 .046 22 260
Typical Thermal Waters
Growler Hot Spring, Lassen N.F! 95 2430 71 7.7 34 320
Loowit Hot Springs, Mt St Helens2 84 395 2.0 .97 197 410
Geyser Spring, Seigler Hot Spg3 43 294 15 1.6 20 180
Long Valley, unnamed4 60 250 13 2.5 19 100
Ear Spring, Yellowstones 93 414 4.2 5.1 99 81
Gamma Hot Springs, Mt Baker6 65 755 9.0 2.8 84 270
Ohanapecosh Hot Spring, Mt Rain6 48 880 12 2.9 73 300
Baker Hot Springs, Mt Baker6 44 110 2.7 .36 41 310
'Thompson, 19852unpublished, data of Thompson3Thompson, Goff and Donnelly-Nolan, 1981
p. 16
4Mariner and Willey,5Thompson and Yadav,6Mariner, Presser and Evans, 1982
19761979

Diamond Lake
Sp. 84-11 I- Sd p
Thousand
oundary Sp.
, Crater Sp.
Cas
Lightning
Sp.
Annie Sp.
Sp. 8 1-5Maklaks Sp.
Sp. 81-7
'Vidae Falls
,ade Sp.
Sp I Sp.84-9Pothole Sp.
.'Sp. 84-10
Cedar Sp. *
* Annie Ck.
Geyser Sp. ~~~~~~~Source of Wood R.
0 5 km
IRanger Sp.
- Mares El
Cattle Rest. Reservation Sp.
Spring Ck.
Source of Crooked Ck.
zg SD.
Tecumseh SD.
Fourmile Sp.
Figure 1. Locations of spring samples' in-the Crater Lake-area. Large dots
show spring locations that are higher in altitude than the surface of
Grater Lake. Numbers around Crater Lake are last two digits of sample
number series JCL 81-.
'9
y. 5
4.2 ** 17.7
0.3
0.5 -
*0.5
0 5 km
. 0.9
0.5
Chloride Concentrations
1.4
'Figure 2. Chloride concentrations (mg/L) in spring waters from theCrater Lake area.
- U . ZL
* 0.8
0.3
0.2
0.2~ * .4
0. 2
0.4
60.3O.
a0.5
' 0.5
0.5
0.53.2
0.2 5.8
3.38.4
4.9

-75
F- 8A
Z) U
-105
-105s MA
-16 -14 -12 -10 -8
OXYGEN- 18
Figure 3. Values for deuterium versus oxygen 18 isotopes for Crater Lake(average of 1983 values) and Diamond Lake and nearby cold springs.Springs above the elevation of the surface of Crater Lake shown astriangles; springs below the surface elevation shown as squares. CraterSpring shown by filled square. Meteoric water line is &D = 8 6j18 +12 0/oo, which has a slightly different intercept than the meteoricwater line of Craig (1961). The evaporation trend line has a slope of 5,which is similar to results for other lakes (Craig, 1961).

I I I TV I I I T I I I
Crater Lake
_~1
-8S
:D 0DH
LIi
boos t _X a 0~~~~~~01
-i s IO-
-115 I As * It I | I
0 2 4 6 8 to 12
CHLORIDE Cmg/L)
Figure 4. Deuterium versus chloride concentration for Crater Lake (average of1983 values) and nearby cold springs. Springs above the elevation of thesurface of Crater Lake shown as triangles; springs below the surfaceelevation shown as squares. Crater Spring shown by filled square. Linesshown are for mixing Crater Lake water with the available range ofdeuterium isotopes in cold-spring waters.
-75
80-1 8 Si I ica
-100-84 -76-10 r-TF 1
0
100
200
300
400
500
600
- 0
0000
01 - I
-11 -8
I I
0
00
0
8 12, i i
0
0000
0
E & SW Basin T.D.'s8/81
Figure 5. Isotope and chemical data for Crater Lake for surface and totaldepth samples in 1981 in the east and southwest basins.
CI
15 20 25
- 0
E
I-0-wj
00
[ 0
I
-
I

SILICA
-84 -76-too I1I,, I
0
too
200
300
400
500
600
(
)
-1 1 -8
_
(
I
8 10 12
_
* E Basin
8/83
Figure 6. Profile of isotope and chemical data for Crater Lake for the east
basin in 1983. Silica values shown were redetermined in 1987, and the
variation is not necessarily real. -
U-1
15 20 25
£-v
Li.
I ,
SD SO-18 ClI
I
I
/
I-I

SD 5O-1 8
-100 I I II I
0%
100
200
300
400
S00
600 -I-I-
C I
8 10 12
I W I
SILICA
25
SW Basi n
8/83
Figure 7. Profile of isotfope and chemical data for Crater Lake for thesouthwest bas'in in 1983. Silica values shown were redetermined in 1987,and the variation is not necessarily real.
'N%E
bJ

90-1 8 SILICA
-84 -76 -11 -8-100 I I I I I I I I
0
100
200
300
400
500
600
Q
)
8 10 12l l l
C
i5 20
SW Bas i n
8/84
Figure 8. Profile of isotope and chemical data for Crater Lake for thesouthwest basin in 1984.-
1L1
SD CI
25
E
Ir
bJ
IL i
I
I
I
-
6


![Lezione 9.1 Rocce ignee [modalità compatibilità] variation diagram for 310 analyzed volcanic rocks from Crater Lake (Mt. Mazama), Oregon Cascades. Data compiled by Rick Conrey ,](https://static.fdocuments.in/doc/165x107/5a9f936d7f8b9a62178ce721/pdflezione-91-rocce-ignee-modalit-compatibilit-variation-diagram-for-310-analyzed.jpg)


