DEPARTMENT OF THE INTERIOR ANALYTICAL …
25
DEPARTMENT OF THE INTERIOR U.S. GEOLOGICAL SURVEY ANALYTICAL REPRODUCIBILITY AND ABUNDANCES OF MAJOR ELEMENTS AND SEDIMENTARY COMPONENTS IN CORES FROM THE SISQUOC, MONTEREY, AND POINT SAL FORMATIONS, UNION NEWLOVE 51 WELL, ORCUTT OIL FIELD, ONSHORE SANTA MARIA BASIN, CALIFORNIA by Caroline M. Isaacs Joseph E. Taggart, Jr. Larry L. Jackson Norman Scott, III 1 Open-File Report 89-459 This report is preliminary and has not been reviewed for conformity with U.S. Geological Survey editorial standards or with the North American Stratigraphic Code. Any use of trade, product, or firm names is for descriptive purposes only and does not imply endorsement by the U.S. Government. 1 2 U.S. Geological Survey U.S. Geological Survey 345 Middlefield Road Federal Center, Box 25046 Menlo Park, California 94025 Denver, Colorado 80225 1989
Transcript of DEPARTMENT OF THE INTERIOR ANALYTICAL …

DEPARTMENT OF THE INTERIOR
U.S. GEOLOGICAL SURVEY
ANALYTICAL REPRODUCIBILITY AND ABUNDANCES OF MAJOR ELEMENTS ANDSEDIMENTARY COMPONENTS IN CORES FROM THE SISQUOC, MONTEREY, AND POINT
SAL FORMATIONS, UNION NEWLOVE 51 WELL, ORCUTT OIL FIELD,ONSHORE SANTA MARIA BASIN, CALIFORNIA
by
Caroline M. Isaacs Joseph E. Taggart, Jr.
Larry L. Jackson Norman Scott, III 1
Open-File Report 89-459
This report is preliminary and has not been reviewed for conformity with U.S. Geological Survey editorial standards or with the North American Stratigraphic Code. Any use of trade, product, or firm names is for descriptive purposes only and does not imply endorsement by the U.S. Government.
1 2U.S. Geological Survey U.S. Geological Survey345 Middlefield Road Federal Center, Box 25046 Menlo Park, California 94025 Denver, Colorado 80225
1989

CONTENTS
PageAbstract................................................................. 1Introduction............................................................. 1Me thods.................................................................. 4Analytical reproducibility............................................... 5Results.................................................................. 11Acknowledgements......................................................... 13References...................................... . 15
ILLUSTRATIONS
Page Figure 1. Locality map.................................................. 2
2. Map and cross section of the Orcutt oil field................. 33. AloOo versus other major oxides in samples from the...........
Union Newlove 51 well......................................... 124. Mean composition of lithostratigraphic units in the...........
Union Newlove 51 well......................................... 14
TABLES
Page Table 1. Formulas used to convert elemental abundances to approximate..
mineral abundances............................................ 62a. Major oxide analyses of duplicate powder splits of samples....
from the Union Newlove 51 well................................ 72b. Sedimentary components of duplicate powder splits of..........
samples from the Union Newlove 51 well........................ 93. Carbon analyses of duplicate powder splits of samples.........
from the Union Newlove 51 well................................ 104. Average abundance of sedimentary components in samples from...
the Union Newlove 51 well..................................... 13
APPENDIX
Page Table 1. Elemental abundances in samples from the Union Newlove 51.....
well.......................................................... 172. Approximate mineral abundances in samples from the Union......
Newlove 51 well............................................... 203. Depth intervals for cores from the Union Newlove 51 well...... 23

ABSTRACT
Abundances of sedimentary components based on chemical analyses of 79 fine-grained core samples from the Union Newlove 51 well indicate an average composition (in weight percent) as follows:
Formation
Sisquoc FmMonterey FmPoint Sal Fm
Detritus
684668
Silica
283121
Carbonateminerals
42210
Apatite
011
Organicmatter
174
In both the Monterey and Point Sal Formations, fine-grained detritus in the Union Newlove 51 well is generally more abundant than in age-equivalent Monterey strata in the Santa Barbara coastal area or in the Point Conception COST well (OCS-Cal 78-164 No. 1) in the offshore Santa Maria basin.
Analyses of duplicate splits of powders show that the reproducibility of major oxides is excellent. Standard deviations generally represent <2% of analyzed values, except Na20 which has an average standard deviation of 3% of analyzed values (0.04 wt% Na20). Reproducibility of sedimentary components based on major oxide analyses is excellent, with average standard deviations of 0.5 wt% detritus, 0.4 wt% silica, 0.1 wt% dolomite, 0.2 wt% calcite, and 0.01 wt% apatite. Reproducibility of carbon analyses is less good, with average standard deviations of duplicate powder splits 0.1 wt% total carbon, 0.5 wt% organic carbon, and 0.4 wt% carbonate carbon. Average standard deviations of organic matter abundance are thus about 0.7 wt% organic matter.
INTRODUCTION
The Union Newlove 51 well is located in the Orcutt oil field in the on shore Santa Maria basin (Figure 1). Located on the south side of the Orcutt fault bordering the north end of the field (Figure 2), the well was drilled in 1932 by Union Oil Company, penetrating 4114 feet of section, and was exten sively cored. As originally reported by the operator, the drilled sequence includes the Careaga Formation (0-90 ft), the Foxen Mudstone (90-462 ft), the Sisquoc Formation (462-1884 ft), the Monterey Formation (1884-4014 ft), and the Lospe Formation (4014-4114 ft). Within the Monterey Formation, the original operator reports identify the arenaceous zone (1884-1918 ft), cherty zone (1918-2154 ft), bentonitic-brown zone (2154-2309 ft), buff and brown zone (2309-2515 ft), dark brown zone (2515-2841 ft), oil sand zone (2841-3132 ft), and siltstone and shell zone (3132-4014 ft). Subsequently Canfield (1939) proposed the name "Point Sal Formation" for the siltstone and shell zone, and Woodring and Bramlette (1950) formally adopted the proposal. Common current usage is to include the oil sand zone in the Point Sal Formation as well, and this scheme is used here.
The purpose of this report is to present analytical results on 83 core samples from the Union Newlove 51 well, including 79 fine-grained samples from the lower part of the Sisquoc Formation, the Monterey Formation, and the Point Sal Formation. 4 additional samples analyzed include 3 sandstones from the Point Sal Formation and 1 sample (at 530 feet) from the upper part of the
36*
34<
SALINAS CALIENTE
SANTA BARBARA-VENTUR
I22< I20< I 18°
35GUADALUPE
^Santa Maria^SANTA MARIA VALLEY
>
B
*Cuyama
16 km
120°
Figure 1. Locality map showing Neogene basins of south-central California (above) and oil fields in the onshore Santa Maria basin (below). Neogene basins are from Blake and others (1978), dotted pattern indicates original distribution of Monterey deposits. Oil fields are from California Division of Oil and Gas (1974).

ORCUTT OIL FIELD
(Contours on top of Monterey) \\V»
^%
T8N R33W
_-*»°°
l£iiiL-^_..., CAREAGA ^*RE*^/
\ _,»ooo^
^»
K
K
*"
D u
O
E O0
Z
O
X
K
a
...
O O
§
a
1
FORMATIONAND
ZONE
UREU*
fmSt
ZONEI
ZONE 2
- ZONE 3
ZONE 4
; ZONE i
ZONE!
O
z
»z a:
~^iffi%-*^z%yp
^-^_^'
^^
Union Newlove 51 well
HSO KOM.ES (PLIO)
Figure 2. Map and cross section of the Orcutt oil field showing location of the Union Newlove 51 well. From California Division of Oil and Gas (1974).

Sisquoc Formation, lithologically unlike all other samples from the Sisquoc Formation.
Values were determined for the abundances of major elements (SiC^, A^Oo, FeoO-j, NaoO, ^2^* ^a^> M8^» Ti02» ^2^5* anc* MnO), organic carbon, and carbon ate carbon. These values have been converted, by analytical constants, to estimated abundances of sedimentary components namely (biogenic and diagen- etic) silica, (fine-grained terrigenous) detritus, calcite, dolomite, apatite, and organic matter. Preliminary compositional results were previously summar ized in terms of lithostratigraphic correlation and depositional controls by Isaacs and others (1983).
METHODS
Sample Preparation
Prior to analysis, samples were cut either with a water saw or a dry saw into matched pieces for porosity determination and analytical determination. The latter piece, about 10-15 g by weight, was ground first with a steel mor tar and then with a mullite mortar to <100 mesh. Powders were then split into portions for X-ray diffraction, major element analysis, and (in most cases) carbon analysis.
Analytical Techniques - Major Oxides
Samples were analyzed for major oxides by X-ray fluorescence spectroscopy. For this analysis, 0.8 g of sample powder (ground to <100 mesh) was weighed into a tared platinum-gold (95:5) crucible and ignited for 45 minutes at 925°C, after which it was reweighed to determine loss on ignition (LOI). An 8 g charge (dry basis) of lithium tetraborate was then added to the crucible, physically mixed with the sample, and then fused at 1130°C for 25 minutes (Taggart and Wahlberg, 1980a) after which it was cast in a platinum- gold mold (Taggart and Wahlberg, 1980b) and allowed to cool. The disc was then presented to a Phillips PW1600 simultaneous X-ray spectrometer using an on-line Digital Equipment Corporation PDP 11/04 computer to perform a de Jongh matrix correction program for analysis (Taggart and others, 1981).
Note that I^O*" (adsorbed water) was present in the samples and duplicates analyzed. Amounts of t^O"" probably range from about 1% to as much as 5% in clay-rich Sisquoc samples (Isaacs, 1980, appendix A).
Analytical Techniques - Carbon
The abundance of organic carbon was measured by difference between total carbon and carbonate carbon. Total carbon abundances were measured by dry combustion with a LEGO WR12 apparatus which combusts the sample in oxygen at 1200°C, converting carbon to C02; ©2 was then measured by a thermal conduc tivity detector (Leventhal and Shaw, 1980). Carbonate carbon (the acid-soluble fraction) was determined by a gasometric procedure (Rader and Grimaldi, 1961; Leventhal and Shaw, 1980).
In contrast to techniques used for major oxides, powders analyzed for carbon were dried for 4-24 hours prior to analysis.

Determination of Sedimentary Components
Abundances of silica and detritus were estimated from elemental abundan ces of SiOo and A^Oo by constants developed for the Monterey Formation in adjacent onshore areas (Table 1). Resulting values are for the most part re liable for Monterey strata but probably underestimate the amount of alumino- silicate material where mica or chlorite is abundant; values also may under estimate detrital quartz (and thus overestimate biogenous and diagenetic silica) in highly terrigenous samples. Abundances of silica and detritus for non-Monterey strata should therefore be regarded as approximations.
Abundances of calcite, dolomite, and apatite were estimated from abun dances of CaO, MgO, and ?2®5 a f ter adjustment of these values for average abundances in the aluminosilicate fraction (Table 1). Samples were also evaluated by X-ray diffraction analysis for bulk mineralogy. Abundances of organic matter were estimated from the abundance of total organic carbon (Table 1).
A problem with this set of samples is that organic carbon was not measured in all samples. In addition, powders that were analyzed for major oxides contained adsorbed water (l^O") whereas powders analyzed for carbon did not. As a result, in order to make values easier to compare, abundances of silica, terrigenous detritus, calcite, dolomite and apatite were normalized to 100% on an organic-matter-free basis. These abundances are thus similar to the kind of values widely reported from X-ray diffraction analysis.
ANALYTICAL REPRODUCIBILITY
During this study, a number of duplicate splits of powders were analyzed to test the reproducibility of the analytical methods. These duplicates were "blind" tests in the sense that they were submitted for analytical determina tion with different numbers and without the knowledge of the analysts, in some cases in the same lot and in other cases in separate lots as much as two years apart.
Major oxides
For major oxides, duplicate splits were analyzed in the same laboratory by identical methods over a period of one year. Table 2a presents the analytical results of a total of 15 analyses of 4 powders. For the most part, standard deviations represent <2.0% of analyzed values. An exception is Na20, which has an average standard deviation of 0.04 wt% Na20 or about 3% of measured values.
Sedimentary components calculated from major oxide analyses of duplicate splits are presented in Table 2b. These data show that detritus is reproducible to within 1 wt% in the range 10-70% detritus, with an average standard deviation of 0.5 wt% detritus. Other parameters are even more closely reproducible. Dolomite, for example, is reproducible to within 0.5 wt% in the range 1-60% dolomite, with an average standard deviation of 0.1 wt% dolomite. These data show that analytical reproducibility is so excellent that variability introduced by the analytical method is negligible for most practical purposes.

Table
1.
Form
ulas
used to convert
elem
enta
l abundances to
approximate
mineral
abun
danc
es.
Formulas fo
r detritus and
sili
ca co
nten
ts an
d av
erag
e ab
unda
nce
of major
elem
ents
in de
trit
us ar
e derived
from
the
evalu
ation
in Is
aacs
(1980, appendix B) fo
r th
e Mo
nter
ey Formation
in the
west
ern
Sant
a Barbara
coastal
area
. Ca
O and
?2®5 ab
unda
nces
in
apatite
are
base
d on pu
blis
hed
refe
renc
es (see Is
aacs
, 19
80,
p. 22
8),
and
calc
ula
ti
ons
for
calcite
and
dolo
mite
are
based
on their
mole
cula
r fo
rmul
as.
Because
most
do
lomi
te in th
e Mo
nter
ey
Form
atio
n co
ntai
ns ex
cess
Ca
O,
dolomite ab
unda
nces
are
generally
unde
rest
imat
ed an
d calcite
abundances
overestimated.
Quan
tity
Explanation
Form
ula
Detritus
Equals aluminosilicates +
detr
ital
qu
artz
Aluminosilicates
Base
d on
Al
203
content
Detr
ital
qu
artz
Silica (bioge
nic
and
diagenetic)
Apatite
Dolomite
Calcite
Base
d on a pr
opor
tion
of aluminosilicates
Base
d on Si
02 content
adjusted fo
r am
ount
s in detritus
Base
d on
?2
Q5
content
adju
sted
fo
r 0.
7% ?2°
in aluminosilicates and
assuming
42.4%
P205
in apatite
Base
d on
MgO content
adju
sted
for
2.6% MgO
in al
umin
osil
icat
es and
assu
ming
21
.9%
MgO
in do
lomite
Base
d on CaO
content
adju
sted
fo
r 1.
9% Ca
O in
al
umin
osilicates,
55.5%
CaO
in apatite,
and
30.4
% Ca
O in do
lomi
te,
and
assuming
56.0
%
CaO
in ca
lcit
e
5.6
x A1
203
4.2
x Al
20o
Alum
inos
ilic
ates
*
3
Si02
- (3
.5 x
A120
3)
[P20
5 -
(0.0
32 x
A120
3)]
* 0.
424
[MgO -
(0.1
1 x
A1203
)]
* 0.
219
[CaO
-
(0.0
8 x
A1203
- (0
.555
x
apatite)
- (0.304 x
dolo
mite
)]
* 0.56
Organic
matter
Base
d on organic
carb
on co
nten
t(Organic ca
rbon
) x
1.5

Table 2a.
Major ox
ide
analyses of
duplicate powder splits of
samples
from the
Union Newlove 51
we
ll.
(Weight
%)
Sam
ple
num
ber
1497
(4B
)S
pli
t B
atch
*1
A2
B3
C4
D5
BM
ean
Sta
nd
ard
Devia
tion
% S
tan
dar
d D
evia
tio
n
2037
(5B
)S
pli
t B
atch
*1
A2
A3
A4
B5
DM
ean
Sta
nd
ard
D
evia
tion
% S
tan
dar
d D
evia
tio
n
26
5K
7A
)S
pli
t B
atch
*1
D2
EM
ean
Sta
ndar
d devia
tion
% S
tandar
d
devia
tion
Si0
2
63.9
63
.664.3
63
.963.5
63.8
0.3
0.5%
45.8
45.7
45.7
45.7
45.7
45.7
0.0
40.
1%
21.8
21
.921.9
0.0
70.
3%
A12
03
12.2
12.2
12.3
12.4
12.2
12.3
0.0
90.
7%
4.6
54
.65
4.6
54.6
84.7
74.6
80.0
51.
1%
2.2
92.1
22
.21
0.1
25.
4%
Fe2°
3
4.3
24
.31
4.3
54.3
14.3
04.3
20
.02
0.4%
1.5
31.5
41.5
31.
531
.53
1.5
30
.00
40.
3%
0.9
20.9
20.9
20.0
00
0.0%
MgO 1.6
61.6
41.6
81.6
71.6
41.6
60.0
21.
1%
1.9
71.9
71.9
91.9
81.9
41.9
70.0
20.
9%
13.3
13.2
13.3
0.0
70.
5%
CaO 2.2
12.2
22.2
52
.21
2.1
92.2
20.0
21.
0%
15
.415.5
15.4
15.4
15
.415.4
0.0
40.
3%
23.8
24.0
23.9
0.1 0.6%
Na2
0
2.3
52
.36
2.3
92.2
72
.31
2.3
40.0
52.
0%
1.0
30.9
90.9
60.9
90.9
30.9
80.0
43.
8%
0.3
30.2
80.3
10.0
411
.6%
K20
1.9
61.9
41.9
91.9
61.9
41.9
60.0
21.
0%
0.9
10.9
20.9
10.9
20.9
20
.92
0.0
05
0.6%
0.4
50.4
40.4
50.0
07
1.6%
Ti0
2
0.5
80.5
90.5
80
.59
0.5
80.5
80.0
05
1.0%
0.2
20.2
20
.22
0.2
20.2
20.2
20.0
00
0.0%
0.0
90.0
90.0
90.0
00
0.0%
P20
5
0.6
70
.66
0.6
70.6
70.6
60
.67
0.0
05
0.8%
0.5
00.5
00
.50
0.5
00.5
00.5
00.0
00
0.0%
0.3
80
.37
0.3
80.0
07
1.9%
MnO
<0.
020.0
20.0
20.0
2<
0.02 - - -
<0.
02<
0.0
2<
0.02
<0.
02<
0.0
2<
0.0
2- - 0.0
30.0
30.0
30.0
00
0.0%
LO
I
8.8
78
.77
8.4
18.8
38.6
68.7
10.1
82.
1%
24.2
24.0
24
.124.5
24.1
24.2
0.2
0.8%
34.1
34.3
34
.20.1
0.4%

Table
2a.
Cont
inue
d
2687
(5
B)
Sp
lit
Bat
ch*
1 A
2 C
3 F
Mea
nS
tandard
dev
iati
on
% st
andard
d
ev
iati
on
Av
erag
eA
v st
andard
d
ev
iati
on
% st
andard
devia
tion
66
.766.9
67
.867.1
0.6
0.9%
49
.60
.30.
5%
9.0
29
.07
9.1
39
.07
0.0
60.
6%
7.1
0.0
81.
1%
3.8
13.8
33.9
03.8
50.0
51.
2%
2.6
60.0
20.
7%
1.7
81.8
21
.82
1.8
10.0
21.
3%
4.7
0.0
30.
7%
2.0
12
.01
2.0
62.0
30.0
31.
4%
10.9
0.0
60.
5%
1.4
01
.36
1.3
51.3
70.0
31.
9%
1.2
50.0
42.
9%
1.8
51.8
81.8
91.8
70
.02
1.1%
1.3
00
.01
1.0%
0.4
50.4
50.4
80.4
60
.02
3.8%
0.3
40.0
06
1.6%
0 0 0 0 0 0 0 0 0
.09
0.0
2.0
9
<0
.02
.09
0.0
2.0
9.0
00
.0%
.41
.003
.7%
10.5
10
.69.8
010.3
0.4
44.
2%
19.4
0.2 1.2%
* U.S. Geol
ogic
al Su
rvey
, Denver Lab:
Batc
h A
(Sep
19
81),
Ba
tch
B (Sep 19
81),
Batch
C (Mar 19
82),
Ba
tch
D (Sep
1982
), Batch
E (M
ar 19
82),
and
Batc
h F
(Sep 1982).

Table 2b. Abundance of sedimentary components (in weight %) of duplicate powder splits of samples from the Union Newlove 51 well No. 1 based on data in Table 2a. See text for calculation method.
Sample number
1497C4B)Split Batch
1 A2 B3 C4 D5 B
MeanStandard deviation% standard deviation
2037(56)Split Batch
1 A2 A3 A4 B5 D
MeanStandard deviation% standard deviation
265K7A)Split Batch
1 D2 E
MeanStandard deviation% Standard deviation
2687 (5B)Split Batch
1 A2 C3 F
MeanStandard deviation% standard deviation
Average valueAv standard deviation% standard deviation
Detritus
68.368.368.969.468.368.70.50.7%
26.026.026.026.226.726.20.31.1%
12.811.912.30.75.5%
50.550.851.150.70.511.0%
39.50.51.3%
Silica
21.220.921.320.520.820.90.31.5%
29.529.429.429.329.029.30.20.7%
13.814.514.10.53.5%
35.135.235.835.40.411.1%
24.90.41.4%
Dolomite
1.51.41.51.41.41.40.064.1%
6.76.76.86.76.56.60.11.6%
59.659.259.40.30.4%
3.63.83.73.70.082.3%
17.80.10.7%
Calcite
0.80.90.80.80.80.80.034.3%
22.422.622.322.422.522.40.090.4%
9.19.7 9T4
0.44.5%
0.80.70.80.80.067.0%
8.40.21.8%
Apatite
0.660.640.650.640.640.650.011.6%
0.830.830.830.830.820.830.0040.5%
0.720.710.720.011.1%
-0.47-0.47-0.48-0.470.0040.9%
0.430.0071.5%

Table 3. Carbon analyses (in weight %) of duplicate powder splits of samples from the Union Newlove 51 well. Note that analyses were performed in 3 separate laboratories over a period of 2 years (1981-1983).
Sample number
2178(1A) Split Batch*1 A2 B3 C4 C
Mean (LEGO)Standard deviation% Standard Deviation
5 F6 F7 F
Mean (wet oxidation)Standard deviation% Standard deviation
2227 (8A) Split Batch*1 B2 B3 B4 D
Mean (LEGO)Standard Deviation% Standard Deviation
5 F
2651 (7A) Split Batch*1 A2 B3 E
Mean (LEGO)Standard Deviation% Standard Deviation
Average value (LEGO)Av standard deviation% standard deviation
Total carbon
9.069.129.089.109.090.030.3%
---
4.905.014.854.734.870.122.4%
-
11.1311.1010.6710.970.262.3%
8.310.131.6%
Organic carbon
7.376.137.387.727.150.709.8%
6.196.106.586.290.264.1%
4.904.954.774.674.820.132.6%
4.07
2.813.041.932.590.59
22.6%
4.850.479.7%
Carbonate carbon
1.692.991.701.381.940.72
36.9%
---
<0.010.060.080.070.050.0468.5%
-
8.328.068.748.370.344.1%
3.450.3710.6%
Batch A (Nov 1981): U.S. Geological Survey, Denver Lab; Batches B (Dec 1981), C (Dec 1981), D (Jun 1983) and E (Jul 1983): U.S. Geological Survey, Menlo Park Lab; Batch F (Mar 1982): Rinehart Laboratories, Wheatridge CO.
10

Carbon
For total carbon and carbonate carbon, duplicate splits were analyzed in 2 different U.S. Geological Survey laboratories by a similar method over a period of 2 years. Some splits (but not other samples) were also analyzed for organic carbon in a third laboratory (Rinehart Laboratories) by a different method; these analyses were measured by the direct organic carbon wet- oxidation method after drying at 110°C for 4-24 hours and storage over ?2®5 ^ n a vacuum desiccator.
Table 3 presents results for a total of 10 analyses on 3 powders by the U.S. Geological Survey laboratories as well as a total of 4 analyses on 2 of the same powders by Rinehart Laboratories. Reproducibility of total carbon abundances is generally good, with an average standard deviation of 0.1 wt% carbon. Reproducibility of the abundance of carbonate carbon (and of organic carbon by difference), however, is only fair, with average standard deviations of 0.4 wt% (and 0.5 wt%) carbon respectively. Note also that samples analyzed by the LEGO method have consistently different values than samples analyzed by the wet oxidation method.
RESULTS
Major Oxides
Core samples from the Union Newlove 51 well show a wide range of major oxide and carbon abundances, particularly within the Monterey Formation (Table 4; data in Appendix Table 1). A^O-j, Na20, ^0, and Ti02 mainly reflect detritus abundance, Fe20o reflects both detritus and pyrite, CaO reflects mainly calcite (also apatite and detritus), MgO reflects mainly dolomite (also detritus), and ?2®5 reflects mainly apatite (also detritus) (Isaacs, 1980, appendix B). The average ratios between A1203 and Fe203, Na20, and Ti02 are generally about the same within all three formations. However, Sisquoc samples from the Union Newlove 51 well have a distinctly smaller ratio of KoO/A^O^ than other samples from this well (Figure 3).
Sedimentary Components
Sedimentary components estimated from major oxide and carbon abundances are presented in Appendix Table 2. The presence of some negative numbers in this table indicates that the conversion parameters (Table 1) are somewhat inaccurate. Note that the reproducibility of the negative values from replicate analyses (Table 2b, sample 2687(5B)) is excellent. The inaccuracy is thus probably due to partitioning slightly too much CaO, MgO, and ?2®5 into the aluminosilicate fraction. These inaccuracies are generally less than 1 wt% and thus are only significant where values are small.
A more serious inaccuracy results from the partitioning of CaO into calcite and dolomite. Many of the samples listed in Appendix Table 2 as having calcite do not have any calcite detectable by bulk X-ray diffraction analysis (e.g., sample 3057 (3a) listed as having 8% calcite). However, Isaacs and others (in press) show that total measured carbonate averages within 0.02 wt% of the carbonate carbon calculated from the sum of calcite + dolomite based on major oxides. The total of carbonate minerals is thus reasonably accurate, and this value has been used for averages*.
11

15
as
10
o cvj
<
5
2 3
Fe
2O3
, w
t %
15
as
10
O cvj
00
1 2
K2
O,
wt
%
15
as
10
O _O
J
<
5
1 2
Na
2O,
wt%
15
as
10
CO o cvj
<
5S
isquoc
Mon
tere
y P
oint
Sal
0.5
TiO
2,
wt
Fig
ure
3.
A12
03
vers
us
Fe2
03
, N
a20,
^0
, an
d T
i02
in
fin
e-g
rain
ed
sa
mp
les
anal
yze
d
fro
m
the
Unio
n
New
love
51
w
ell
. In
clu
des
all
sa
mple
s an
aly
zed
ex
cept
the
3 sa
nd
sto
nes
from
th
e
Po
int
Sal
F
orm
atio
n
and
the
sam
ple
at
530
feet
from
th
e
upper
part
of
the
Sis
qu
oc
Fo
rmati
on
.

Table 4. Average abundance (in weight %) of sedimentary components in the Union Newlove 51 well, Orcutt oil field, onshore Santa Maria basin. Values here (except organic matter) have been normalized to 100% on an organic- matter-free basis and are not directly comparable to values in Figure 4. Values exclude samples 530, 3057 (3A), 3256 (4A), and 3383 (2A). Standard deviations assume a normal distribution of values.
Formation Detritus Silica Carbonate minerals
Apatite Organic matter
Sisquoc Formation (14 samples):Range 56-76 22-40Average 68 28Std dev 6 6
Monterey Formation (55 samples):Range 7-91 2-72Average 46 31Std dev 21 17
Point Sal Formation (10 samples):
1-14 4 3
0-912223
0.0-0.7 0.2 0.3
0.0-11.3 1.3 2.3
1.0-1.4 1.2 0.1
1.5-27.7 7.2 4.8
RangeAverageStd dev
53-816810
15-29214
0-24109
0.0-6.11.22.1
1.1-6.14.01.8
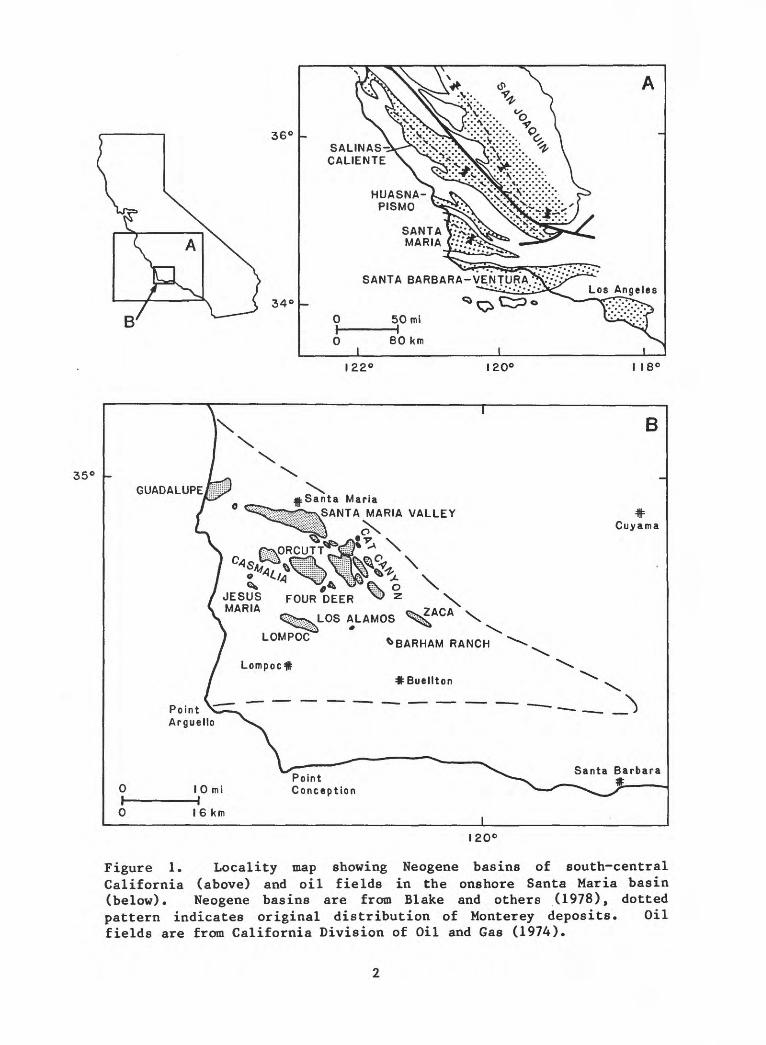
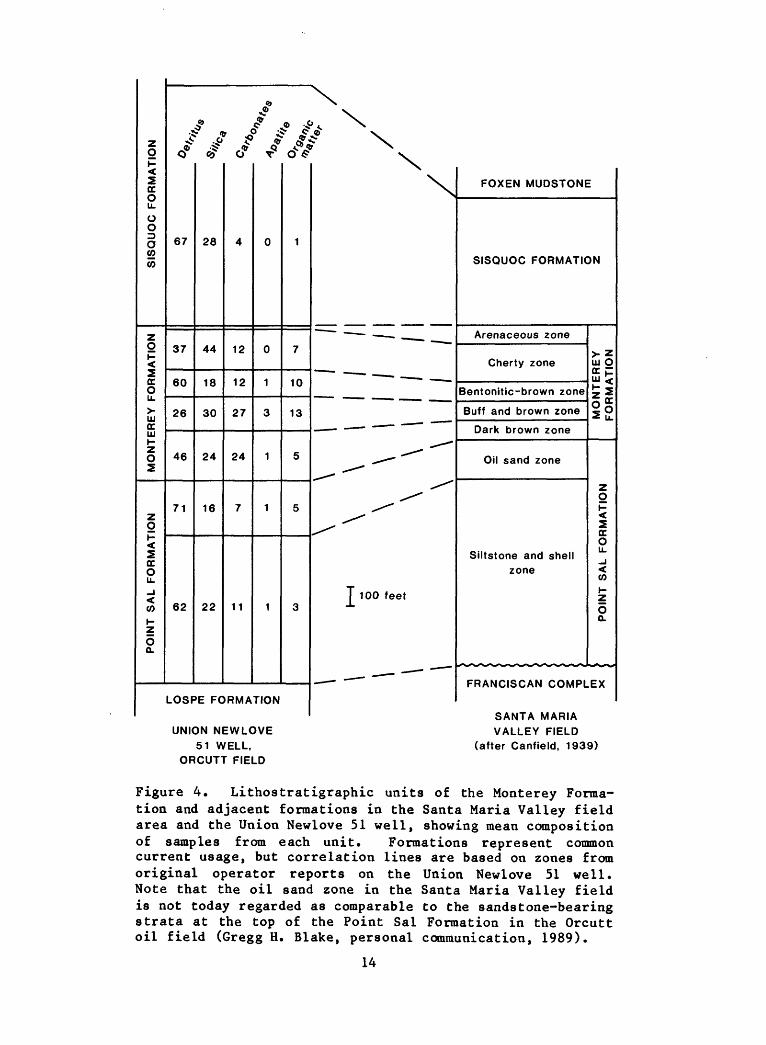
abundances are summarized by formation in Table 4. Note that abundances range widely within the Monterey Formation and more moderately in the Sisquoc and Point Sal Formations (Table 4; data in Appendix Table 2). Another interesting feature of the data in Table 4 is that the average silica abundance of the 55 samples from the Monterey Formation is only 31%, barely above the average 28% shown for the Sisquoc Formation. Data from the Union Newlove 51 well have also been averaged according to Canfield's (1939) zones, as originally defined by the operator (Figure 4), but sample numbers are not adequate to be confident of the differences shown in any detail.
Compared to correlative strata in the Santa Barbara coastal area (Isaacs and others, 1983), samples from the Union Newlove 51 well have a greater average abundance of fine terrigenous detritus, particularly in the Point Sal Formation. The average detritus abundance in all lithologic units from the Union Newlove 51 well is also greater than in correlative strata from the Point Conception COST well in the offshore Santa Maria basin (Isaacs and others, 1983).
ACKNOWLEDGEMENTS
We specially thank Gregg H. Blake and Mary Lou Thornton of Unocal Corporation in Ventura for valuable discussions about this well, and access to original operator reports and paleontological evaluation. For access to the core samples, we thank William J. M. Bazeley, Larry A. Beyer, William K. Dahleen, Robert Fellows, and Kenneth A. Pisciotto. We also thank Margaret A. Keller for cutting cores, and Vicki A. Gennai and Barbara A. Graciano for
13
z0H-
SQCOU_
oO
o(0CO
rORMATION
u.
UJOCUJH-Z0
ZoH-
ocoU_
-1
(0H-Z
O0.
# ^«?
/ / / <? ^<$ CO C? T d"^1
67
37
60
26
46
71
62
28
44
18
30
24
16
22
4
12
12
27
24
7
11
0
0
1
3
1
1
1
1
7
10
13
5
5
3
LOSPE FORMATION
^-
UNION NEWLOVE51 WELL,
ORCUTT FIELD
\\\
I 100 feet
FOXEN MUDSTONE
SISQUOC FORMATION
Arenaceous zone
Cherty zone
Bentonitic-brown zone
Buff and brown zone
Dark brown zone
Oil sand zone
Siltstone and shell zone
> zUJ Oa P"Iz *
5QC O
(0H- Z
O o.
FRANCISCAN COMPLEX
SANTA MARIAVALLEY FIELD
(after Canfield, 1939)
Figure 4. Lithostratigraphic units of the Monterey Forma tion and adjacent formations in the Santa Maria Valley field area and the Union Newlove 51 well, showing mean composition of samples from each unit. Formations represent common current usage, but correlation lines are based on zones from original operator reports on the Union Newlove 51 well. Note that the oil sand zone in the Santa Maria Valley field is not today regarded as comparable to the sandstone-bearing strata at the top of the Point Sal Formation in the Orcutt oil field (Gregg H. Blake, personal communication, 1989).
14

grinding the samples and running bulk X-ray diffraction analyses. For major element determinations, project leaders were Joseph E. Taggart, Jr. and James S. Wahlberg; analysts were James W. Baker, Ardith J. Bartel, Kathleen C. Stewart, Joseph E. Taggart, Jr., and James S. Wahlberg. For carbon determinations, project leaders were Larry L. Jackson, James L. Seeley, and William Updegrove; analysts were Georgia Mason, Sarah T. Neil, and Van E. Shaw. Martin B. Lagoe and Margaret A. Keller reviewed preliminary versions of the manuscript.
REFERENCES
Blake, M. C., Jr., Campbell, R. H., Dibblee, T. W., Jr., Howell, D. G., Nilsen, T. H., Normark, W. R. , Vedder, J. G., and Silver, E. A., 1978, Neogene basin formation in relation to plate-tectonic evolution of the San Andreas Fault System, California: American Association of Petroleum Geologists Bulletin, v. 62, p. 344-372.
California Division of Oil and Gas, 1974, California oil and gas fields, south, central coastal, and offshore California: State of California, Sacramento, California, v. 2.
Canfield, C. R., 1939, Subsurface stratigraphy of Santa Maria Valley oil field and adjacent parts of Santa Maria Valley, California: American Association of Petroleum Geologists Bulletin, v. 23, p. 45-81.
Isaacs, C. M., 1980, Diagenesis in the Monterey Formation examined laterally along the coast near Santa Barbara, California: Stanford University unpublished Ph.D. thesis, 329 p.
Isaacs, C. M., Jackson, L. L., Stewart, K. C. , and Scott, N., III, in press, Analytical reproducibility and abundances of major oxides, total carbon, organic carbon, and sedimentary components of Miocene and early Pliocene cuttings from the Point Conception Deep Stratigraphic Test Well, OCS-Cal 78-164 No. 1, offshore Santa Maria basin, southern California: U.S. Geological Survey Open-File Report 87-75 (in press).
Isaacs, C. M., Keller, M. A., Gennai, V. A., Stewart, K. C. , and Taggart, J. E., Jr., 1983, Preliminary evaluation of Miocene lithostratigraphy in the Point Conception COST well OCS-Cal 78-164 No. 1, off Southern California, in Isaacs, C. M., and Garrison, R. E., eds., Petroleum generation and occurrence in the Miocene Monterey Formation, California: Society of Economic Paleontologists and Mineralogists Pacific Section Book 33, p. 99-110.
Leventhal, J. S. , and Shaw, V. E., 1980, Organic matter in Appalachian Devonian black shale: I. Comparison of techniques to measure organic carbon, II. Short Range organic carbon content variations: Journal of Sedimentary Petrology, v. 50, p. 77-81.
Rader, L. F. , and Grimaldi, F. S., 1961, Chemical analyses for selected minor elements in Pierre Shale: U.S. Geological Survey Professional Paper 391- A, 45 p.
Taggart, J. E. , Jr., and Wahlberg, J. S. , 1980a, A new in-muffle automatic fluxer design for casting glass discs for X-ray fluorescence analysis: Federation of Analytical Chemists and Spectroscopy Societies Meeting, Philadelphia, Pa., September 1980.
Taggart, J. E. , Jr., and Wahlberg, J. S. , 1980b, New mold design for casting fused samples, in Rhodes, J. R., ed., Twenty-eighth annual conference on applications of X-ray analysis: Advances in X-ray analysis, v. 23, p. 257-261.
15

Taggart, J. E., Jr., Lichte, F. E., and Wahlberg, J. S., 1981, Methods of analysis of samples using X-ray fluorescence and induction-coupled plasma spectroscopy, in Lipman, P. W., ed., The 1980 eruptions of Mount St. Helens, Washington: U.S. Geological Survey Professional Paper 1250, p. 683-687.
Woodring, W. P., and Bramlette, M. N. , 1950, Geology and Paleontology of the Santa Maria district, California: U.S. Geological Survey Professional Paper 222, 142 p.
16
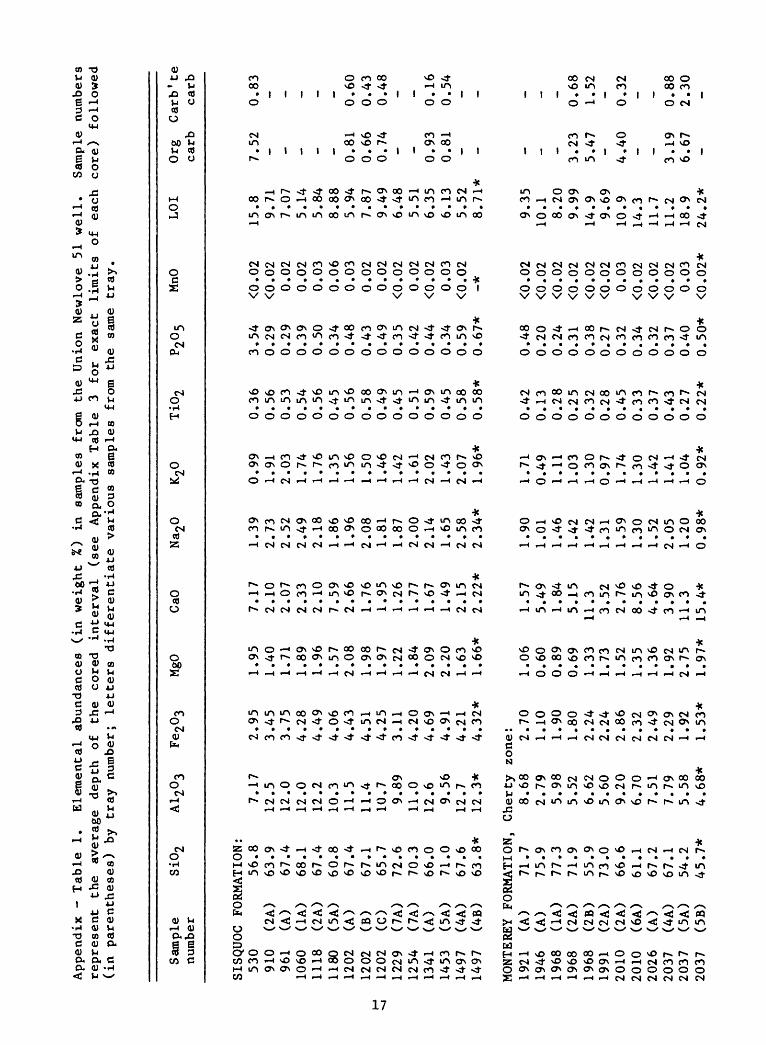
Appendix - Table 1.
Elemental abundances (in
weight %) in samples
from th
e Union Newlove 51
we
ll.
Sample numbers
repr
esen
t th
e average
dept
h of
the
core
d in
terv
al (s
ee Appendix Table 3
for
exac
t li
mits
of
ea
ch co
re)
followed
(in
parentheses) by tray nu
mber
; le
tter
s differentiate various sa
mple
s fr
om the
same tray.
Sam
ple
num
ber
Si0
2A
1203
Fe2°
3M
gOC
aON
a20
K20
Ti0
2P2
°5M
nOL
OI
Org
C
arb't<
ca
rb
carb
SISQ
UO
C
FOR
MA
TIO
N:
530
910
961
1060
1118
1180
1202
1202
1202
1229
1254
1341
1453
1497
1497
(2A
)(A
)(1
A)
(2A
)(5
A)
(A)
(B)
(0 (7A
)(7
A)
(A)
(5A
)(4
A)
(4B
)
56.8
63.9
67.4
68
.16
7.4
60
.86
7.4
67
.165.7
72.6
70.3
66.0
71.0
67.6
63.8
*
MON
TE K
EY
FOR
MA
TIO
N,
1921
1946
1968
1968
1968
1991
2010
2010
2026
2037
2037
2037
(A)
(A)
(1A
)(2
A)
(2B
)(2
A)
(2A
)(6
A)
(A)
(4A
)(5
A)
(5B
)
71.7
75.9
77.3
71.9
55.9
73.0
66.6
61.1
67.2
67.1
54
.24
5.7
*
7.1
712.5
12.0
12.0
12.2
10.3
11.5
11.4
10.7
9.8
911.0
12.6
9.5
61
2.7
12
.3*
Cher
ty8.6
82.7
95.9
85
.52
6.6
25.6
09.2
06.7
07.5
17
.79
5.5
84.6
8*
2.9
53
.45
3.7
54.2
84.4
94.0
64.4
34.5
14.2
53.1
14.2
04
.69
4.9
14.2
14.3
2*
zone: 2
.70
1.1
01.9
01.8
02.2
42.2
42.8
62.3
22
.49
2.2
91
.92
1.5
3*
1.9
51.4
01.7
11.8
91
.96
1.5
72.0
81.9
81.9
71.
221.8
42
.09
2.2
01.
631
.66
*
1.0
60.6
00.8
90.6
91.3
31.
731.5
21.
351.3
61.
922
.75
1.9
7*
7.1
72.1
02.0
72.3
32.1
07
.59
2.6
61
.76
1.9
51.2
61.7
71.
671.4
92.1
52.2
2*
1.5
75
.49
1.8
45.1
511.3
3.5
22.7
68.5
64
.64
3.9
011.3
15
.4*
1.3
92.7
32.5
22.4
92.1
81.8
61.9
62.0
81.8
11.
872.0
02
.14
1.6
52.5
82.3
4*
1.9
01.
011.4
61.
421.4
21.
311.5
91.3
01.5
22.0
51.2
00.9
8*
0.9
91.
912.0
31
.74
1.7
61.3
51
.56
1.5
01
.46
1.42
1.6
12
.02
1.4
32.0
71.9
6*
1.7
10.4
91.1
11.0
31.3
00.9
71
.74
1.30
1.4
21.
411.0
40
.92
*
0.3
60.5
60
.53
0.5
40.5
60.4
50.5
60.5
80.4
90
.45
0.5
10.5
90.4
50.5
80.5
8*
0.4
20.1
30.2
80.2
50
.32
0.2
80.4
50.3
30.3
70.4
30.2
70
.22
*
3.5
40.2
90.2
90
.39
0.5
00
.34
0.4
80.4
30.4
90
.35
0.4
20.4
40
.34
0.5
90.6
7*
0.4
80
.20
0.2
40.3
10.3
80
.27
0.3
20.3
40.3
20
.37
0.4
00
.50
*
<0.
02<
0.02
0.0
20.0
20.0
30.0
60
.03
0.0
20
.02
<0.
020.0
2<
0.02
0.0
3<
0.0
2-* <0.
02<
0.02
<0.
02<
0.02
<0
.02
<0.
020.0
3<
0.02
<0.
02<
0.02
0.0
3<
0.0
2*
15
.89.
717
.07
5.1
45
.84
8.8
85.9
47
.87
9.4
96.4
85.5
16.3
56
.13
5.5
28.7
1*
9.3
510
.18.2
09
.99
14.9
9.6
910.9
14.3
11.7
11
.218.9
24.2
*
7.5
2- - - - - 0.8
10
.66
0.7
4- -
0.9
30.8
1- - - - -
3.2
35.4
7- 4.4
0-
3.1
96
.67
-
0.8
3- - - - -
0.6
00
.43
0.4
8- -
0.1
60.5
4- - - - -
0.6
81.5
2- 0.3
2- 0.8
82.3
0-

Appen
dix
-
Tab
le
1.
co
nti
nu
ed
MO
NTE
REY
FO
RM
ATI
ON
, B
en
ton
itic
br
own
zone:
oo
2178
(1
A)
2178
(6
A)
2202
(1
A)
2227
(6
A)
2227
(8
A)
2254
(2
A)
49.8
37.6
66
.055.2
56.1
50
.7
MO
NTE
REY
FO
RM
ATI
ON
,23
95
(A)
2408
(A
)24
39
(A)
2441
(3
)24
55
(5)
2487
(A
)24
87
(B)
52.0
77.3
45.1
48
.918.8
36.4
40
.7
MO
NTE
REY
FO
RM
ATI
ON
,26
34
(A)
2651
(7
A)
2667
(A
)26
69
(1A
)26
69
(4A
)26
69
(6A
)26
87
(2A
)26
87
(3A
)26
87
(4A
)26
87
(5A
)26
87
(5B
)26
87
(6A
)26
87
(7A
)27
05
(2A
)27
05
(2B
)27
05
(4A
)27
05
(5A
)27
22
(2A
)
36.1
21.9
*71.5
57.5
65
.261.9
63
.054.8
65.8
61
.76
7.1
*5
9.0
23.2
65.8
65.9
25
.86
1.6
6.3
3
7.3
36.0
210.6
13.6
12.3
11
.2
Bu
ff
and
6.2
83.8
95.5
76.5
33.1
52.9
63
.05
2.6
92
.14
3.3
74.9
64
.48
4.4
9
brow
n2.2
91
.30
2.4
62.4
91.3
11
.17
1.1
9
1.6
61
.70
1.3
11
.50
1.7
32
.86
zone: 4.4
31
.14
3.8
62
.12
11.0
8.3
88.3
4
10.9
18.5
0.9
91.0
32.1
26.0
6
7.8
61
.99
8.9
13.5
52
4.6
18
.316.9
1.0
30.8
61
.71
2.0
51.9
81
.64
0.7
50.5
50.7
70.8
10.4
30.5
20.5
2
1.3
81
.14
1.7
02
.58
2.3
42.2
1
1.4
60.8
41
.30
1.6
50.4
90
.52
0.5
6
0.3
60.2
90
.54
0.7
20.6
50.6
0
0.3
20
.19
0.3
40.3
70
.19
0.1
30
.14
0.6
50
.48
0.3
30.3
90.1
81.6
4
0.6
70
.31
1.7
90.5
82.7
82
.69
1.9
3
0.0
30.0
2<
0.0
20
.03
0.0
30.0
4
<0
.02
<0.0
2<
0.0
2<
0.0
2<
0.0
2<
0.0
2<
0.0
2
19.9
27
.61
2.7
17
.11
6.3
15.7
19.6
10
.82
4.4
29.0
33.7
26.4
24
.5
Dar
k br
own
zone:
2.3
42.2
1*
4.4
84
.15
10
.712.8
7.6
58.9
010.2
8.8
99
.07
*7.2
53
.95
9.7
11
0.7
5.4
712.0
1.3
0
0.9
90.9
2*
1.9
01.5
95
.13
4.3
93.0
42.9
63.8
23.5
93
.85
*3
.12
1.5
14.3
04
.20
2.2
24.9
40.9
5
9.2
813.3
*1.6
95.1
41
.56
0.8
32
.71
3.6
51.0
41.5
41.8
1*
3.2
111.7
1.5
71
.40
11
.91.1
21
7.0
19.2
23
.9*
3.7
29.7
41.3
00
.24
4.5
66.9
91.2
04
.62
.03
*6
.01
22.0
1.4
81.5
919.4
0.4
229.7
0.4
00.3
1*
0.8
10.6
91.3
31
.33
1.2
80.9
61.5
71.2
71.3
7*
1.1
60.5
91.5
91
.77
0.8
11
.81
0.2
1
0.4
30.4
5*
0.9
40.8
02.1
72.2
41.7
01
.53
2.1
11.6
51.8
7*
1.4
50.6
91.9
31.8
90.9
82
.57
0.2
0
0.1
00.0
9*
0.2
20.1
90.5
80.5
50.3
70
.39
0.5
10
.43
0.4
6*
0.3
70
.15
0.5
10.4
40.2
40.6
10
.04
1.9
00
.38
*0.8
60
.69
0.1
00
.11
0.4
90
.95
0.6
42.2
40.0
9*
0.9
41
.13
0.0
90.2
30
.23
0.1
50.1
0
<0.0
20.0
3*
<0.0
2<
0.0
20
.03
<0.0
2<
0.0
2<
0.0
2<
0.0
2<
0.0
2-* 0
.02
0.0
60.0
2<
0.0
20
.07
0.0
20
.08
26
.934.2
*1
0.5
16.9
10.6
14
.810.6
12.9
12
.41
2.4
10.3
*1
3.1
31
.311.1
9.8
52
8.1
13.5
41.5
5.6
8
0.3
9
18.4
55
.56
0.8
97.6
2
3.8
7
5.5
8
4.3
6
5.6
72
.59
*
8.3
7*
5.5
3
0.4
8
2.5
2
0.3
2
3.5
2
<0.0
1
5.1
4
5.6
23.4
8
0.2
9
1.8
9
7.1
2
1.1
7
11.1
4
Appendix - Table 1.
continued
2722
2722
2743
2758
2788
2788
2810
2824
2824
2824
2824
2837
(3A
)(6
A)
(2A
)(2
A)
(2A
)
(A)
(A)
(B)
(c)
(5A
)(2
A)
64
.456.5
33.7
60.8
61.9
50.1
32.3
37.1
11.8
46.4
61.2
47.2
7.2
36.2
96.2
612.8
12
.19.4
64
.72
7.5
12.7
09.8
91
2.4
9.5
8
2.9
72.4
52
.82
4.8
64
.74
3.5
92
.09
2.8
42.2
33
.87
4.2
53.6
3
2.5
64
.66
9.6
11.2
61
.69
5.7
69
.46
7.4
514.7
5.8
31.5
73.0
2
3.7
47.6
316.2
0.5
11.7
58
.85
18.0
15.5
27.3
9.2
90.6
910.3
1.2
81.
220.8
81.9
61
.90
1.4
50
.90
1.33
0.5
51
.59
2.0
71
.58
1.3
81.1
81.1
12.7
12.4
81.9
60.9
41.5
00.4
11.8
42
.53
1.91
0.3
20.2
80.2
80.6
10.5
80.4
60.2
20
.35
0.1
00.5
00.6
10.4
6
0.2
10.2
50.5
50.2
30
.75
0.1
31
.19
2.3
90.0
90.3
20.2
34.5
6
<0.
020
.02
0.0
70.0
20.0
20.0
50
.06
0.0
60.1
20.0
70.0
20
.02
12
.714.0
22.9
12.8
10.6
12.4
26.2
19.7
37.6
14
.613.3
14
.1
5.3
13
.85
-2.4
9- 1.5
84.0
3- 0.9
7 4.5
35.1
8
0.4
62.5
7-
0.0
6
3.2
15.6
9
10.1
4 0.0
41.5
1
POINT SAL
FORMATION, Oi
l sa
nd zone
2850
2867
3040
3040
3057
POIN
T31
3731
5632
5632
5633
8333
8335
0035
24
(3A
)(2
A)
(3A
)(4
A)
(3A
)
SAL
(3A
)(B
)
(4A
)(2
A)
(2B
)(3
)(2
)
64
.551.1
54.1
60.5
48.7
FOR
MA
TIO
N,
49.3
61.5
51
.738.3
71.9
62.5
64.6
66.2
13
.210.7
11.6
12.7
6.6
5
Sil
tsto
ne
8.7
79.9
88.9
06.
2111.0
11.9
12.4
13.0
4.2
14
.09
4.7
84.2
61.7
7
and
3.4
53
.58
3.2
21
.77
2.9
14.4
74.9
34.7
9
1.3
94
.75
2.2
71.9
86.6
2
shell
zo
ne5.0
11.
422.9
41.
131.3
82.0
82
.71
2.7
2
0.3
67.6
55.6
71.
8112.8
: 9.5
15
.60
11.3
26.8 1.8
53
.62
1.9
11.
21
2.6
41
.94
2.0
32
.15
2.2
0
1.6
71
.89
1.6
01.8
33.2
92.1
92.3
62
.67
2.3
82.0
52.4
02.6
20.8
3
1.7
72.0
11.7
80
.83
1.7
92.2
42.1
22
.27
0.6
10.5
00.6
10.6
50.1
8
0.4
10.4
70.4
40.2
10.3
90
.56
0.6
70
.65
0.2
00.1
42.6
70.7
30.1
4
1.2
10
.99
1.0
30.1
50.1
00.8
80.1
80
.17
<0.
020.0
80.0
20.0
20.0
9
0.0
5<
0.02
0.0
20.0
50.0
30.0
30.0
40.0
4
9.3
31
1.2
11.6
10
.91
6.8
13
.91
0.6
13.1
20.6
2.8
67
.80
6.9
45
.18
-2.0
84.0
94.0
01.2
5
3.0
2 3.3
10.6
60
.25
2.3
91.5
30
.74
-2.0
60.2
30.0
44.5
0
2.7
7 2.5
15.3
80.1
40.2
70.2
10.1
0
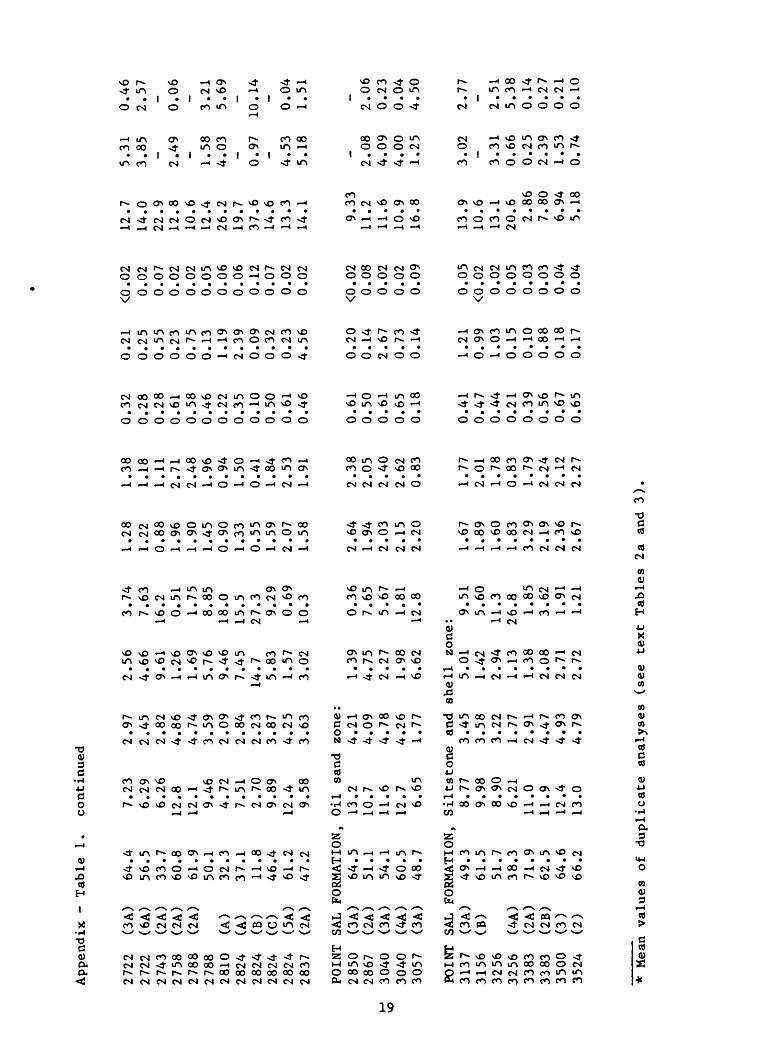
* Mean values of duplicate analyses (see text Tables 2a an
d 3)
.

ro
o
Appendix -
Table
2.
Approximate
mineral
abun
danc
es (in
weight %)
in
samples
from the
Union
Newlove
51 we
ll ba
sed
on data in Appendix T
able 1.
See
text for
calc
ulat
ion
method,
comm
ents
on
ne
gati
ve va
lues
, an
d problems wi
th the
accu
racy
of th
e calcite-dolomite partition.
Samp
le
Numb
erDe
trit
usSi
lica
Dolomite
Calc
ite
Apatite
Organic
matt
er
SISQUO
C FORMATION:
530*
910
961
1060
1118
1180
1202
1202
1202
1229
1254
1341
1453
1497
1497
(2A)
(A)
(1A)
(2A)
(5A)
(A)
(B)
(c)
(7A)
(7A)
(A)
(5A)
(4A)
(4B)
MONTE REY FORMATION,
1921
1946
1968
1968
1968
1991
2010
2010
2026
2037
2037
2037
(A)
(A)
(1A)
(2A)
(2B)
(2A)
(2A)
(6A)
(A)
(4A)
(5A)
(5B)
47 76 70 69 71 60 67 68 65 59 64 74 56 73 74
Cher
ty zone:
53 17 36 34 41 34 57 41 46 48 35 31
37 22 27 27 26 26 28 29 31 40 33 23 40 24 22 45 72 61 57 36 58 38 41 45 44 39 34
6 0 2 3 3 2 4 4 4 1 3 3 6 1 2 1 1 1 0 3 5 3 3 3 5 11 8
1 2 1 1 0 121 0 0 0 0
-1 -2 1 1 1 9 2 9 19 3 3 14 6 3 15 26
9.1
-0.3
-0.2 0.0
0.3
0.0
0.3
0.1
0.4
0.1
0.2
0.1
0.1
0.4
0.7
0.5
0.3
0.1
0.3
0.4
0.2
0.1
0.3
0.2
0.3
0.6
1.0
11.3 - - - - - 1.2
1.0
1.1 - - 1.4
1.2 - - - - -
4.8
8.2 - 6.6 - -
4.8
10.0 -

Appendix - Table
2.
cont
inue
d
MONTEREY FORMATION, Be
ntonit
ic br
own
zone
2178
(1A)
48
282178
(6A)
40
202202
(1A)
67
332227
(6A)
91
92227
(8A)
81
1522
54
(2A)
72
13
MONTEREY FO
RMAT
ION,
Buff and
brow
n zo
ne:
2395
(A
) 41
352408
(A)
24
7124
39
(A)
40
332441
(3
) 52
372455
(5
) 19
9
2487
(A
) 18
28
2487
(B)
18
32
MONTEREY FORMATION, Da
rk br
own
zone:
2634
2651
2667
2669
2669
2669
2687
2687
2687
2687
2687
2687
2687
2705
2705
2705
2705
2722
(A)
(7A)
(A)
(1A)
(4A)
(6A)
(2A)
(3A)
(4A)
(5A)
(5B)
(6A)
(7A)
(2A)
(2B)
(4A)
(5A)
(2A)
14 13 28 25 67 83 48 55 65 56 56 46 24 61 66 32 79 7
30 15 62 46 31 20 40 26 34 35 39 38 10 36 32 7 23 2
18 34 0 0 2 3
1.1
0.8
0.0
-0.1
-0.6
3.5
10.7
16.2 7.5
7.2
9.3
20 4 19 9 53 40 39
3 1 4 2 12 7 6
1.3
0.5
4.8
1.2
6.9
6.7
4.6
8.5
27.7
8.3
5.8
44 62 623 2_0 9
14 0 3 4 12 55 3 154 -1 79
8 10 2 4 0 1 2 3 0 1 1 2 9 1 1 6 0 11
4.6
0.8
1.9
1.4
-0.6
-0.8
0.6
1.7
0.8
5.1
-0.5
1.
9 2.5
-0.6
-0.3
0.
1-0
.6
0.1
6.5
3.9
8.3
3.8
5.3
7.7
5.2
2.8
1.8

Appendix - Table
2.
cont
inue
d
2722
2722
2743
2758
2788
2788
2810
2824
2824
2824
2824
2837
POINT
2850
2867
3040
3040
3057
POIN
T3137
3156
3256
3256
3383
3383
3500
3524
(3A)
(6A)
(2A)
(2A)
(2A)
(A)
(A)
(B)
(c)
(5A)
(2A)
SAL
FORM
ATIO
N,(3
A)(2
A)(3
A)(4
A)(3
A)*
SAL
FORM
ATIO
N:(3
A)(B)
(4A)
*(2
A)*
(2B)
(3)
(2)
46 39 37 83 76 56 29 45 16 60 80 61
Oil
sand
zo
ne:
81 64 73 79 38 53 61 53 35 63 71 73 75
44 38 13 19 22 18 17 12 2 13 20 15 20 15 15 18 26 20 29 22 17 34 22 22 21
920 44 -1 223 44 32 69 231
10 0 18 5 3 28 20 2 10 2 1 4 6 6
1 3 5 0 0 3 7 6 13 4 -1 2 -1 4 1-18 4 7 13 462 2 -1 -2
-0.1 0.1
0.9
-0.5 1.0
-0.4 2.7
5.4
0.0
0.0
-0.5
11.3
-0.6
-0.5 6.1
0.9
-0.2 2.4
1.7
1.9
-0.1
-0.6 1.3
-0.5
-0.6
8.0
5.8 -
3.7 -
2.4
6.0 - 1.5 - 6.8
7.8 -
3.1
6.1
6.0
1.9
4.5 - 5.0
1.0
0.4
3.6
2.3
1.1
* Thes
e sa
mple
s ar
e not
included in figures
and mean calculations.
Samp
le 530
is fr
om th
e up
per
part of
the
Sisquoc
Formation; th
e ot
her
thre
e samples
are
sandston
es.

Appendix - Table 3. Depth intervals represented by sample numbers (Appendix Tables 1 and 2) from the Union Newlove 51 well.
Sample No.
530910961
1060111811801202122912541341145314971921194619681991201020262037217822022227225423952408
Depth interval
520-540897-923948-974
1049-10701113-11231168-11911191-12161216-12411241-12661328-13541444-14621487-15061913-19371937-19551955-19801980-20022002-20182018-20332033-20412165-21902190-22132215-22182240-22672387-24042404-2413
Sample No.
2439245524872634265126692687270527222743275827882810282428372850286730403057313731563256338335003524
Depth interval
2435-24432447-24632480-24952625-26412641-26602660-26772677-26962696-27142714-27302736-27502750-27662785-27902804-28162816-28322832-28412841-28592859-28753030-30503050-30643129-31463146-31653247-32653373-33933491-35093515-3533
23