Department of Environmental Engineering Applying the ...€¦ · Department of Environmental...
83
Department of Environmental Engineering Applying the Methods of Chemical Extraction and DGT to Measure Available Sediment Phosphorus Honours Dissertation Ben Annan November 2002
Transcript of Department of Environmental Engineering Applying the ...€¦ · Department of Environmental...

Department of Environmental Engineering
Applying the Methods of Chemical Extraction and DGT to
Measure Available Sediment Phosphorus
Honours Dissertation
Ben Annan
November 2002

Acknowledgements
I firstly would like to thank Dr Carolyn Oldham for her supervision and enthusiasm for
the project.
I would also like to thank Kathryn Linge for her endless support and advice all year
long.
Thank you to Bridget Alexander for helping me out in the lab.
Thank you to my fellow final years who made this year enjoyable.
Thank you to Pippa McManus for her love, encouragement and understanding all
throughout the year
And finally, (even though they always put me first) I would like to thank my family:
Dad, Mum, Melanie, Natasha, Katrina and Jessica. Each one of you supported me in
your own special way.

Abstract
Phosphorus is often the limiting nutrient of primary production in freshwater wetland
ecosystems. During summer months, when the risk of algal blooms is high, wetland
sediments become the major, if not only, source of phosphorus. Therefore, it is crucial to
understand the amount of phosphorus available from sediments.
This study uses the traditional method of chemical extractions and the new method of
diffusive gradients in thin-films (DGT) to measure available phosphorus in sediment
from Lake Yangebup, Western Australia. The DGT technique allows phosphorus species
to diffuse through a layer of acrylamide gel before binding to ferrihydrite embedded in a
further layer of gel. The chemical extractions target phosphorus bound to different
phases of the sediments, while the DGT technique measures reactive phosphorus species
in a sediment slurry. Results from the two methods were compared in order to
determine with which sediment phase the phosphorus measured by DGT is associated.
The DGT technique was successfully applied to sediment slurries for the measurement
of phosphorus. It was found that the concentrations of phosphorus measured by the
DGT technique (DGT-P) corresponded to the phosphorus associated with electrostatic
attractions, i.e. the ion exchangeable phase. The other extraction mechanisms of acid
dissolution and reduction recorded much higher phosphorus concentrations. DGT-P
was less than previous FRP measurements in a sediment slurry, indicating that DGT may
be measuring a more bioavailable form of phosphorus.

Table of Contents
1 Introduction........................................................................................ 1
2 Background........................................................................................ 32.1 Lake Yangebup...................................................................................................32.2 Phosphorus..........................................................................................................3
2.2.1 Phosphorus in Freshwater Ecosystems ........................................................32.2.2 Phosphorus in Sediments .............................................................................4
2.3 Chemical Extraction..........................................................................................52.4 The Diffusive Gradients in Thin-films (DGT) Technique............................7
2.4.1 DGT Components ........................................................................................82.4.2 DGT Theory...............................................................................................102.4.3 Theoretical Response in Solution...............................................................152.4.4 DGT in Sediments......................................................................................18
3 Methods........................................................................................... 233.1 Lake Sampling..................................................................................................233.2 Chemical Analysis ...........................................................................................24
3.2.1 Malachite Green Method............................................................................243.3 Chemical Extraction........................................................................................27
3.3.1 Extraction Solutions ...................................................................................283.4 Diffusive Gradients in Thin-films (DGT) Technique..................................29
3.4.1 Preparation of Gels .....................................................................................293.4.2 Preparation of DGT units ...........................................................................333.4.3 Using the DGT units ..................................................................................343.4.4 Testing the DGT technique ........................................................................353.4.5 DGT Measurement in Sediment Slurries ...................................................36
4 Results ............................................................................................. 384.1 Chemical Extraction........................................................................................384.2 DGT...................................................................................................................39
4.2.1 Gel Preparation...........................................................................................394.2.2 Validation Tests ..........................................................................................434.2.3 DGT Sediment Slurry Deployment............................................................53
5 Discussion........................................................................................ 575.1 DGT Validation Tests......................................................................................57
5.1.1 DGT Preparation........................................................................................575.1.2 Variation in Results ....................................................................................59
5.2 Sediment Phosphorus Measurements............................................................63
6 Conclusions...................................................................................... 676.1 DGT Validation Tests......................................................................................67

6.2 Sediment Phosphorus Measurements............................................................67
7 Recommendations for Future Work................................................... 687.1 DGT Validation................................................................................................687.2 Sediment Measurements .................................................................................68
References.............................................................................................. 70

List of Figures
Figure 2.1: The reaction of orthophosphate with ferrihydrite......................................................9
Figure 2.2: A cross section through a DGT unit showing the concentration gradient through the
diffusive gel.................................................................................................................. 10
Figure 2.3: Percentage recovery of P loaded on a resin gel when treated with 0.25 M H2SO4. .... 13
Figure 2.4: Measured mass of phosphate accumulated in DGT units versus time....................... 16
Figure 2.5: Measured mass of Ca accumulated in DGT units versus bulk solution concentration.
.................................................................................................................................... 17
Figure 2.6: Measured mass of phosphate for different gel thicknesses ...................................... 18
Figure 2.7: The three different cases of supply of ions from the sediment to the porewaters ....... 20
Figure 2.8: Fluxes of Zn from soils to DGT unit with varying gel thicknesses.......................... 21
Figure 3.1: Equipment used for collecting sediment cores. ...................................................... 24
Figure 3.2: Determination of concentration using the standard curve........................................ 27
Figure 3.3: Absorbencies measured by the malachite green method.......................................... 27
Figure 3.4: The glass plates and plastic spacer; components of the casting unit. ........................ 32
Figure 3.5: DGT units deployed in known P concentrations ..................................................... 36
Figure 3.6: DGT units deployed in sediment slurry container................................................... 37
Figure 4.1: Samples treated with malachite green colouring reagents ....................................... 38
Figure 4.2: Binding gel 3, showing the cut circular discs. ........................................................ 43
Figure 4.3: Phosphorus mass accumulation versus time for time experiment 1. ......................... 45
Figure 4.4: Phosphorus mass accumulation versus time for time experiment 1. ......................... 46
Figure 4.5: Mass of P in the binding gels of DGT deployment 1............................................... 49
Figure 4.6: The calculated concentration for DGT units........................................................... 50
Figure 4.7: Mass of P n the binding gels of DGT deployment 2................................................ 51
Figure 4.8: Calculated concentrations with time for DGT experiment 2. ................................... 51
Figure 4.9: Mass of P accumulated by DGT units at different times.......................................... 54
Figure 4.10: Accumulated P Mass for the different gel thicknesses it. Errors are 9%. ............... 54
Figure 4.11: Mass of P in the sediment slurry per mass of dry sediment. ................................. 55
Figure 4.12: Average values of mass of P per mass of dry sediment for the four different slurries.
.................................................................................................................................... 56
Figure 5.1: The theoretical mass and actual mass accumulations of DGT units deployed in 50
ppb.. ............................................................................................................................ 62
Figure 5.2: DGT-P measurements compared to FRP measurements ......................................... 66

List of Tables
Table 2.1: Results of Linge's (2002) fractionation scheme .........................................................7
Table 4.1: Dilutions required in order to analyse extraction solutions........................................ 39
Table 4.2: Mass of P measured in extraction solutions. ............................................................ 39
Table 4.3: Diffusive gel preparation dates............................................................................... 40
Table 4.4: Binding gel preparation dates................................................................................. 41
Table 4.5: Average values of P accumulation for binding gel sheets. ........................................ 44
Table 4.6: Results from gels placed in 10 mL of a 1000 ppb P ................................................. 47
Table 4.7: Results from gel cuttings placed in 10 mL of 1000 ppb P for 44 hours. ................... 48
Table 4.8: Cuttings placed in solutions of 1 and 100 ppm P. .................................................... 48
Table 4.9: Results from a 24 hour DGT deployment. ............................................................... 52
Table 4.10: Sediment masses in the four sediment slurries. ...................................................... 53


Ben Annan Introduction______________________________________________________________________________
______________________________________________________________________________Centre for Water Research 1
1 Introduction
Urbanisation of catchments has lead to increased inputs of nutrients into wetland
ecosystems. Of particular concern is the increased loading of phosphorus in freshwater
wetlands. Phosphorus (P) is of great importance in freshwater ecosystems as it is often
considered to be the nutrient that limits phytoplankton growth. Therefore, small
increases in the phosphorus concentration of a wetland can lead to algal blooms,
resulting in a decrease in water quality.
Wetland sediments play an important role in maintaining water quality as they can
remove P from the water column through sedimentation. Often, the sediments of a
wetland hold many orders of magnitude more phosphorus than the overlying water
column. However, the sediments are not a permanent sink of phosphorus, and
remobilisation can occur frequently. This remobilisation is especially important in
summer months, when all other elements for phytoplankton growth, such as heat and
light, are in large supply, and inputs of phosphorus from runoff are low. Therefore, the
sediments may become the main factor controlling phytoplankton growth.
Knowledge of the amounts of phosphorus available from the sediments is crucial for
wetland management. Traditionally, the method of chemical extraction has been used to
determine the amounts of available phosphorus. Chemical solutions are applied to
sediments to measure the amounts of phosphorus bound to different phases of the
sediment. However, problems may occur as the chemical solutions may not be specific
for each sediment phase.
A new method of potentially measuring available sediment phosphorus is the technique
of diffusive gradients in thin-films (DGT). The DGT technique is based on the diffusion
of phosphorus ions through a hydrogel before being accumulated with a binding agent.
Concentration of phosphorus is then calculated using Fick’s First Law.

Ben Annan Introduction______________________________________________________________________________
______________________________________________________________________________Centre for Water Research 2
The DGT technique has not been applied to sediment slurries. This project aimed to
apply the technique of DGT to measure the phosphorus concentrations in sediment. The
DGT results were then compared to chemical extraction results and previous sediment
slurry results to obtain understanding of the form of phosphorus measured by the DGT
technique (DGT-P).

Ben Annan Background______________________________________________________________________________
______________________________________________________________________________Centre for Water Research 3
2 Background
2.1 Lake Yangebup
Lake Yangebup lies approximately 16 km south of Perth, Western Australia on the Swan
Coastal Plain. This lake has been the subject of many studies (e.g. Bell 1997, Masters
1995). It has a history of contamination and is eutrophic with respect to phosphorus
(Davies et al. 1993), therefore it makes an ideal site for this study. As a result of high
nutrient concentrations, the lake experiences year round blooms of blue-green algae
(Davis et al. 1993)
2.2 Phosphorus
2.2.1 Phosphorus in Freshwater Ecosystems
Phosphorus (P) is of vast importance in freshwater ecosystems, as it is often the limiting
nutrient in phytoplankton growth. Consequently, slight increases in phosphorus
concentrations of a wetland can lead to the occurrence of algal blooms (Boulton and
Brock 1999).
In water, phosphorus can exist in dissolved, colloidal or particulate forms (Kramer et al.
1972). Phosphorus is embodied in ions of phosphoric acid, which is freely soluble in
water, therefore releasing phosphorus anions to the water column (Emsley 1980). The
relative proportion of these anions (PO43-, HPO42- and H2PO4-) varies with pH (Reynolds
and Davies 2001).
A nutrient is considered bioavailable if it is readily assimilable by organisms (Reynolds
and Davies 2001). Orthophosphate (PO43-) is widely considered to be the form of
phosphorus that is bioavailable (e.g. Currie and Kalf 1984).

Ben Annan Background______________________________________________________________________________
______________________________________________________________________________Centre for Water Research 4
2.2.2 Phosphorus in Sediments
Sediments play a vital role in the phosphorus dynamics of a wetland ecosystem. The
sediments of freshwater wetlands can hold many orders of magnitude more phosphorus
than the overlying water column (Emsley and Hall 1976). The amounts of phosphorus
in sediments vary largely between different lakes. For example several lakes from
Wisconsin (USA) have recorded ranges of 580 to 7 000 ìg of total phosphorus per gram
of sediment (ìg/g) (Williams et al. 1971). Total phosphorus in Lake Yangebup has been
measured at 910 ìg/g (Linge 2002)
Sediments can either remove phosphorus from the water column, or remobilise it.
Under normal conditions, the amount of phosphorus lost from the water column
through sedimentation is greater than the amount released (Syers et al. 1973). However,
the sediments do not always act as a sink. Under certain conditions, there may be a
large release of phosphorus from the sediments (Lennox 1984). This is particularly
important in summer months, when all other parameters essential for phytoplankton
growth (e.g. light and heat) are in plentiful supply, resulting in phosphorus becoming
the limiting factor.
There are different phases in the sediment that phosphorus can bind to. Sediments
consist of several mineral phases and detrital organic matter (Forstner 1990).
Phosphorus can bind to either one of these phases through adsorption or precipitation.
Adsorption occurs when a solute binds to a solid, usually at a specific site. Precipitation
occurs when two or more solutes join together to form a solid.
Iron, manganese, and calcium minerals in the sediment have all been shown to bind
phosphorus (e.g. Williams et al. 1971, Chang and Jackson 1956). Organic forms of
phosphorus generally make up the largest amount of total phosphorus in sediments,
ranging anywhere from 15 – 80% (Senesi and Loffredo 1990).
The phase in the sediment with which phosphorus is associated will affect its mobility,
and hence availability to the water column (Reynolds and Davies 2001). Knowledge of

Ben Annan Background______________________________________________________________________________
______________________________________________________________________________Centre for Water Research 5
the association of phosphorus with the sediment phases is important in understanding
the amounts of available phosphorus. Typically, measurements of phosphorus phases
have been performed with the method of chemical extraction.
2.3 Chemical Extraction
The phosphorus bound to different phases of the sediment may be released by applying
different chemical solutions to sediment samples. This method is called chemical
extraction. Typically, chemical extractions are applied to the sediment sequentially, as
some extractions may target multiple phases. Such a scheme is called fractionation.
Chang and Jackson (1956) performed the first fractionation scheme aimed at extracting
various associations of inorganic phosphorus. However, as Bostrom et al. (1982) has
shown, this scheme had problems, as the extraction solutions weren’t specific to one
phase of phosphorus. Many authors have since modified the fractionation scheme of
Chang and Jackson (1956) (e.g. Kaiserli et al. 2001). However, the problems of multiple
phase extraction still exist.
Although many different extraction schemes may exist, the underlying extraction
mechanisms are the same. The four most common extraction mechanisms are ion
exchange, acid and base dissolution and reduction.
Ion exchange
Elements bound to sediment by electrostatic attraction do so at sites on clay minerals,
organic materials and amorphous solids. These elements can easily be replaced since
there is no specific bond to the adsorption site. Ion exchangeable phosphorus extraction
involves displacement by another anion of similar mass or by the formation of an
alkaline phosphate complex (Ruttenberg 1992). Linge (2002) used 1 M MgCl2 to extract
the ion exchangeable fraction in Lake Yangebup sediment (Table 2.1).
Acid dissolution

Ben Annan Background______________________________________________________________________________
______________________________________________________________________________Centre for Water Research 6
Many minerals in the sediment are, to some extent, acid soluble (Williams and Mayer
1972). Acid dissolution involves dissolving these mineral, therefore releasing the
phosphorus bound to them. Acid dissolutions have been used to extract phosphorus
bound to apatite minerals, and iron and aluminum oxides (Williams and Mayer 1972).
Acid extractions are typically used last in sequential fractionation schemes as they
extract a wide range of phosphorus. Linge (2002) used HCl to remove residual apatite-
bound phosphorus in the last stage of a fractionation scheme (Table 2.1).
Base Dissolution
Base solutions are perhaps the most widely used chemical extraction technique. Base
extractions work on the same dissolution principle as the acid extractions discussed
above. It has been shown that base extractions will release a wide range of phosphorus
from the sediment, including that bound to humic substances (e.g. Deurer et al. 1978).
Sharpley et al. (1991) suggest that an extraction solution of 0.1 M NaOH correlates well
with bioavailable phosphorus. Other work has shown that NaOH will extract the
orthophosphate adsorbed onto Fe and Al phases in the sediment (Williams and Mayer
1972). As orthophosphate is bioavailable, these two findings may agree with each other.
Reduction
Reduction extractions are based on reducing minerals in the sediment, thereby releasing
phosphorus. Reduction solutions are most often used to extract metal oxides (e.g. Fe
and Mn) which are important to binding trace elements to sediments (Pickering 1986).
Iron oxides are particularly important in the binding of phosphorus (Emsley 1980).
Linge (2002) used an acidified solution of hydroxylamine hydrochloride (NH2OH.HCl)
solution to extract amorphous iron oxides (Table 2.1). However, the HCl used to acidify
the solution may also extract phosphorus bound to apatite minerals.

Ben Annan Background______________________________________________________________________________
______________________________________________________________________________Centre for Water Research 7
Table 2.1: Results of Linge's (2002) fractionation scheme on Lake Yangebup sediment.
The ion exchange, reduction and acid dissolution mechanisms are asterisked
respectively.
Phase targeted Solution used Mass of phosphorus per
mass of dry sediment ( ìg
/g)
Dissolved Deionised (DI) water 0.9 +/- 0.67
Ion Exchangeable* MgCl2 1.9 +/- 0.55
Organic NaOCl 13 +/- 4.93
Carbonate NaOAc 22 +/- 1.42
Amorphous* NH2OH.HCl 290 +/- 66
Crystalline (NH4)2C2O 250 +/- 93.1
Apatite* HCl 5 +/- 1.14
Although widely used, these techniques provide no definitive answer on which
extraction will measure bioavailable phosphorus. Also, as mentioned above, problems
exist with extraction solutions targeting multiple phases.
2.4 The Diffusive Gradients in Thin-films (DGT)
Technique
The technique of diffusive gradients in thin-films (DGT) was first developed in 1994
(Davison and Zhang 1994). It was initially developed to measure trace metal
concentrations in natural waters, and was later used to measure solute fluxes and
concentrations in sediments and soils (Harper et al. 1998). Solutes that have been
measured by the DGT technique include Ni, Cu, Fe, Mn, Zn, Cd. Mg, Ca (Zhang et al.
1995, Dahlqvist et al. 2002), phosphorus (Zhang et al. 1998) and even radiocesium
(Murdock et al. 2001).

Ben Annan Background______________________________________________________________________________
______________________________________________________________________________Centre for Water Research 8
The DGT technique uses a simple device that accumulates solutes on a binding agent
after passage through a hydrogel, which acts as a well defined diffusion layer (Davison
and Zhang 1994). It relies on the establishment of a steady state concentration gradient
in the diffusion layer so that Fick’s First Law can be used to calculate unknown
concentrations.
2.4.1 DGT Components
The crucial components of the DGT technique are the diffusive gel and the binding
agent. The binding agent, usually a resin, is selective for the species being measured. It
is embedded in a layer of hydrogel, which is known as the binding gel. The binding gel
is separated from the solution by the diffusive gel and is held in place by a simple,
plastic unit.
Diffusive Gels
The diffusive gel used in the DGT technique is an acrylamide based gel, crossed linked
with a patented agarose-derived cross linker (DGT Research Ltd., UK). The roles of the
diffusive gel are to allow the passage of ions from the solution to the binding gel, and to
act as a layer where a concentration gradient can be established. The establishment of
this concentration gradient is discussed in the DGT Theory section.
Binding Gels
The role of the binding gel is to selectively bind to the target ions after they have passed
through the diffusion gel. The term target ions refers to the analyte ions. The binding
gel is comprised of the same components as the diffusive gel, however, it contains a
binding agent, which is responsible for the binding of the target ions. The binding agent
used is selective to the species being measured.
Ben Annan Background______________________________________________________________________________
______________________________________________________________________________Centre for Water Research 9
The most common binding agent used in DGT deployments is an ion-exchangeable
Chelex-100 resin. This binding agent has been used in the measurements of a large
range of metals in natural waters (e.g. Webb and Keough 2002, Zhang et al. 1995).
However, different binding agents have been used in order to measure different
elements. Murdock et al. (2001) measured radiocesium in natural waters using
ammonium molybdophosphate as the binding agent. Teasdale et al. (1999) showed that
AgI could be used as the binding agent in the measurement of dissolved sulfide.
To measure phosphate concentrations in natural waters, Zhang et al. (1998) used
ferrihydrite as the binding agent. Ferrihydrite (FeOOH) is iron hydroxyoxide, which,
due to its surface OH groups is very reactive. These OH groups can bind either cations
or anions (Figure 2.1).
Figure 2.1: The reaction of orthophosphate with ferrihydrite. Ferrihydrite is used asthe binding agent in the measurement of phosphate (modified from Boulton and
Brock 1999).
More recently, Li et al. (2002) has demonstrated that a cellulose phosphate ion exchange
membrane can be used as the binding phase in the measurements of Cu and Cd. The
membrane binding agent is unique, as it can be reused.
The DGT Unit
The diffusive and binding gels are held in place by a small plastic unit, which is referred
to as the DGT unit. The units consist of a backing support and a front cap with a 2.0 cm

Ben Annan Background______________________________________________________________________________
______________________________________________________________________________Centre for Water Research 10
diameter window. This window controls the area of diffusion (Zhang and Davison
1995).
Once the unit has been loaded with the diffusive gel and resin gels, it is deployed in the
solution which is being analysed. This solution is often referred to as the bulk solution
(Davison and Zhang 1994)
2.4.2 DGT Theory
Calculation of Concentration
Ions will diffuse from the bulk solution, through the diffusive gel, and to the binding gel.
At the interface of the diffusive gel and the bulk solution, the concentration of target ions
is assumed to be equal to the concentration of target ions in the solution. At the binding
gel, the target ions are bound by the binding agent and are therefore removed from the
diffusive gel such that the species concentration at the interface is effectively zero.
Therefore, a concentration gradient is established within the diffusive gel (Davison and
Zhang 1994) (Figure 2.2).
Figure 2.2: A cross section through a DGT unit showing the concentration gradient
through the diffusive gel. The black line represents the concentration of target ions at
each point within the diffusive gel. (Modified from Windsor Scientific Limited).

Ben Annan Background______________________________________________________________________________
______________________________________________________________________________Centre for Water Research 11
The theory of the DGT technique is based on the establishment of this concentration
gradient. The theory is based upon Fick’s First Law of Diffusion (equation [1]). Fick’s
First Law dictates that the flux of a species through a media is equal to the concentration
gradient multiplied by the diffusion coefficient of that species in the media:
dxdC
DF = [1]
where, F is the flux, D is the diffusion coefficient and dxdC
is the concentration gradient.
Rewriting the concentration gradient to apply to the DGT unit, the equation [1] becomes:
g
CCDF
∆−
= 21 [2]
where, C1 is the concentration at the bulk solution and diffusive gel interface (i.e. the
concentration of the bulk solution), C2 is the concentration at the diffusive gel and
binding gel interface and g∆ is the thickness of the diffusive gel.
However, as discussed above, the concentration on the diffusive gel/binding gel
interface is zero. Using the fact that C2 is zero, equation [2] can now be rearranged to
give an equation to calculate C1:
DgF
C∆=1 [3]
In this case, the actual definition of flux through the gel is equal to the mass of species
diffusing through the diffusive gel per unit area in a known amount of time:
AtM
F = [4]

Ben Annan Background______________________________________________________________________________
______________________________________________________________________________Centre for Water Research 12
where, M is the mass, A is the area of diffusion and t is the time of diffusion.
When equation [4] is substituted into equation [3], an equation for the concentration in
the bulk solution is obtained, based on parameters that are known, or that can be
measured:
DAtgM
C∆=1 [5]
where, M is the mass accumulated by the binding gel, g∆ is the thickness of the
diffusive gel layer, D is the diffusion coefficient of the target ion through the diffusive
gel, A is the area of the diffusive gel exposed to the bulk solution and t is the time that
the DGT unit is deployed in the bulk solution.
Discussion of Parameters
Mass
Accurate measurement of the mass accumulated in the binding layer is crucial in order
to obtain reliable results. Mass is measured by eluting the binding gels, most commonly
with acid, so that the bounded species are released from the gel into the eluent (Zhang et
al. 1995). The concentration of the species in then measured and the mass is determined
using the following equation:
e
gee
fVVC
M )( += [6]
where, M is the mass accumulated, Ce is the concentration of species in the eluent, Ve is
the volume of the eluent, Vg is the volume of the resin gel and fe is the elution factor.
The elution factor has been included in the equation as the eluent may not recover 100%
of the accumulated mass (Zhang et al. 1995). Therefore, a correction factor must be
applied. The elution factor is dependent on the ions being measured, the binding agent

Ben Annan Background______________________________________________________________________________
______________________________________________________________________________Centre for Water Research 13
used and the eluent used. For the measurement of metal concentrations using a Chelex-
100 binding resin (e.g. Zhang et al. 1995), the eluent used was HNO3. Zhang et al. (1995)
recorded only an 80% recovery of various metals when this elution process was used.
Therefore, the elution factor used was 0.8. When determining mass of iron, an even
lower recovery was recorded, therefore an elution factor of 0.7 is required (Zhang et al.
1999b).
In the measurement of phosphate (Zhang et al. 1998), sulfuric acid was used as the
eluent. Zhang et al. (1998) found that elution with 0.25 M H2SO4 resulted in 100%
recovery of phosphate, irrespective of elution time (Figure 2.3), therefore an elution
factor is not required in the determination of accumulated mass.
Figure 2.3: Percentage recovery of phosphorus loaded on a resin gel when treated with
0.25 M H2SO4. The result means that this project can use any elution time between 1
and 20 hours (modified from Zhang et al. 1998).
The concentration of species in the eluent have been measured with various analytical
techniques. Zhang et al. (1998) used the spectrophotometric method, molybdenum blue,
to determine phosphate concentrations in the H2SO4 eluent. Metal concentrations have
been determined by atomic adsorption spectrometry (e.g. Webb and Keough 2002) and
inductively coupled plasma – mass spectrometry (e.g. Zhang et al. 1999).

Ben Annan Background______________________________________________________________________________
______________________________________________________________________________Centre for Water Research 14
Gel thickness
Gel thicknesses used range from 0.13 mm to 2.4 mm (Zhang et al. 1998b, Zhang and
Davison 1995), with the most common thickness being 0.8 mm (e.g., Zhang et al. 1998).
However, as will be explained in the Theoretical Response section, the DGT technique
should yield the same concentration, regardless of the diffusive gel thickness.
Diffusion Coefficient
The diffusion coefficient refers to the diffusion of the target species through the diffusive
gel layer. Zhang and Davison (1995) discovered that the diffusion coefficients of metal
ions through the diffusive gel are indistinguishable from values in water. This indicates
that there is no reaction between metal ions and the gel. This project, however, is
concerned with the diffusion of dissolved phosphorus species through the diffusive
layer. Zhang et al. (1998) found that the diffusion of phosphate is slightly impeded by
the gel. The diffusion coefficient for orthophosphate in the gel was measured to be 6.05
x 10-6 cm2s-1; this is 71% of its value in water (Zhang et al. 1998). As this project prepared
the diffusive gels using identical methods to Zhang et al. (1998), this value of diffusion
coefficient was used for all DGT calculations.
Diffusion Area
The area of the exposed gel is determined by the DGT unit, discussed in section 2.4.1.
The circular discs cut of the resin and diffusive gels are usually cut to 2.5 cm diameter
(e.g. Dahlqvist et al. 2002). However, due to the window in the front cap, the area
available for diffusion is only that of a circle with radius of 2 cm.
Deployment Time
The concentration gradient will establish itself in the diffusion gel within a few minutes
of deployment time (Davison et al. 2000). As discussed in the following section, as long
as the concentration gradient remains constant, equation [5] should yield the same
concentration independent of deployment time.

Ben Annan Background______________________________________________________________________________
______________________________________________________________________________Centre for Water Research 15
2.4.3 Theoretical Response in Solution
In order to understand how the DGT technique can be applied to sediments, the theory
of the technique in solutions must first be explained. Equation [5] indicates that DGT is
a kinetic technique, that is, it does not rely on equilibrium conditions to develop (Li
2002). Therefore equation [5] should yield the same concentration, regardless of
deployment time. This will only be true, however, if the DGT unit responds according
to theory. An equation for theoretical accumulated mass can be obtained by rearranging
equation [5]:
gCDAt
M∆
= [7]
Equation [7] indicates that, if all other parameters are kept constant, the mass
accumulated by the DGT unit will increase linearly with time.
Zhang et al. (1998) tested the theoretical response of DGT units by deploying them in
solutions of known concentrations for different amounts of time. They found that the
accumulated mass of phosphate in stirred solutions of 200 ppb phosphorus increased
linearly with time (figure 4). The dotted points show the measured values, while the
black line is a plot of the theoretical response calculated using equation [7].

Ben Annan Background______________________________________________________________________________
______________________________________________________________________________Centre for Water Research 16
Figure 2.4: Measured mass of phosphate accumulated in DGT units versus time. The
dot points show the measured values, while the black line is a plot of the theoretical
response calculated using equation [7] (Zhang et al. 1998).
The close fit between the measured values and the theoretical accumulation indicate that
the DGT units are responding according to theory.
Similar tests of theoretical response were performed by Dahlqvist et al. (2002). Equation
[7] indicates that the accumulated mass should increase linearly with bulk solution
concentration, as long as all other parameters (including time) are kept constant.
Dahlqvist et al. (2002) tested this by deploying DGT units of equal gel thickness in
solutions of varying Ca concentrations for equal amounts of time (Figure 2.5).

Ben Annan Background______________________________________________________________________________
______________________________________________________________________________Centre for Water Research 17
Figure 2.5: Measured mass of Ca accumulated in DGT units versus bulk solution
concentration. The dot points show the measured values, while the black line is a
plot of the theoretical response calculated using equation [7] (Dahlqvist et al. 2002).
As seen in Figure 2.5, the linear relationship between concentration and accumulated
mass breaks down at a certain point. This indicates that the binding gel can no longer
accumulate mass, and is therefore saturated.
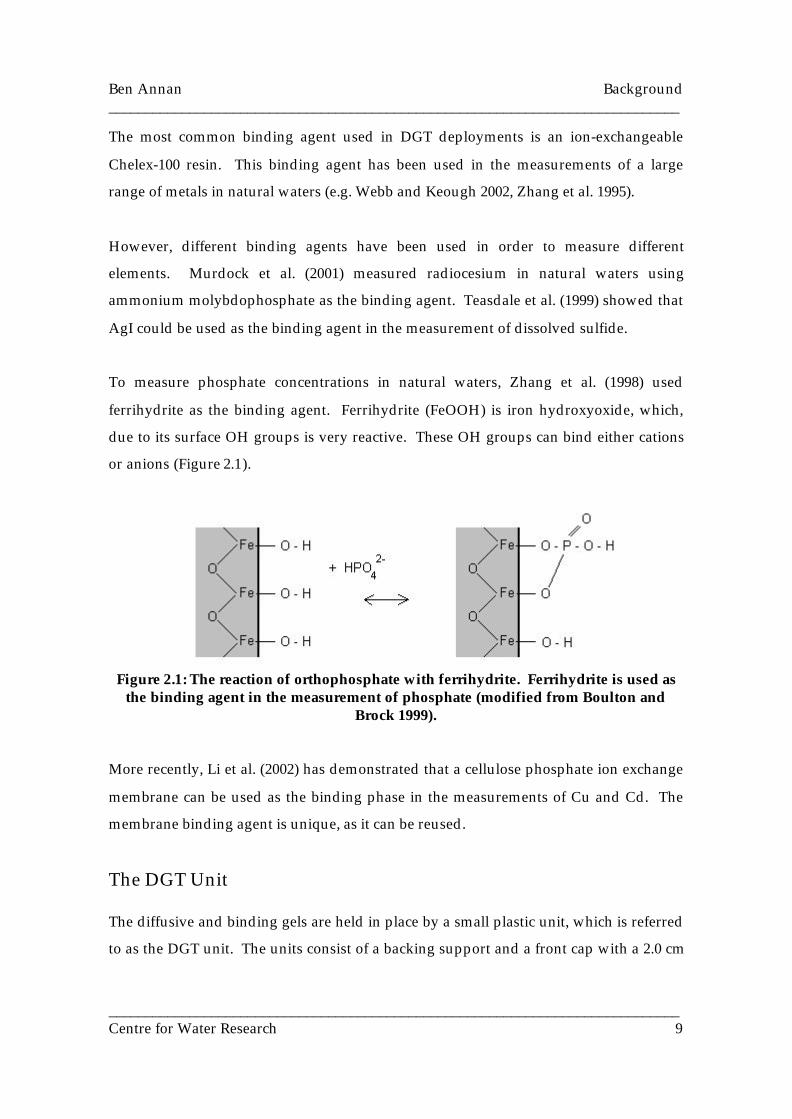
Equation [8] also indicates that the accumulated mass is theoretically proportional to the
reciprocal of the diffusive gel thickness. As seen in Zhang et al. (1998), several DGT units
with different diffusive gel thicknesses were deployed into solutions of equal
concentration for equal deployment time. The resulting accumulated mass increased
linearly with decreasing gel thickness (Figure 2.6).
Ben Annan Background______________________________________________________________________________
______________________________________________________________________________Centre for Water Research 18
Figure 2.6: Measured mass of phosphate for different gel thicknesses (24 hr
deployment) (Zhang et al. 1998)
Since the area of diffusion in all DGT deployments is fixed by the DGT unit, then no
tests have been performed on the relationship between mass and area. However, it can
be expected that the mass will relate to area the same way it did with time and bulk
solution concentration (Figure 2.4 and Figure 2.5).
2.4.4 DGT in Sediments
The theory of the DGT has been shown to work well when deploying DGT units in
solutions and natural waters. However, when the DGT technique is used to measure
concentrations in sediments, the theory is different. Typical use of DGT with sediments
has been performed by inserting DGT units into sediment cores (e.g. Zhang et al. 1995).
In this case, the bulk solution is the porewater of the sediment.
Equation [5] assumes a constant flux of species from the solution to the DGT unit, which
will only happen with a constant bulk solution concentration. This situation will occur
in well mixed solutions, but will not necessarily occur for the deployment of DGT in
sediments (Zhang et al. 1995). In sediment deployment, as the DGT unit removes

Ben Annan Background______________________________________________________________________________
______________________________________________________________________________Centre for Water Research 19
species from the porewaters, lack of mixing may lead to a decrease in concentration
adjacent to the device (Zhang et al. 1995). If this occurs, the concentration gradient in
the diffusive gel may decrease and, hence, the flux of species will also decrease. Thus,
the flux from the solid phase to the solution phase may fall into one of the following
three categories (Zhang et al. 1998b):
Case 1, Fully Sustained: Species removed from the porewaters by the DGT unit are
rapidly resupplied from the sediment, keeping the concentration adjacent to the device
constant. The flux to the DGT unit is approximately equal to the flux of species to the
solution from the solid phase. Therefore, the concentration measured by equation [5],
will be equal to the concentration of the porewater.
Case 2, Unsustained: There is no resupply of species from the sediment. The
concentration in the solution will be depleted over time, and hence the flux to the DGT
unit will decrease. In this case, there is no flux from the sediment to the solution phase,
so the supply of species to the DGT unit is solely by diffusion from the solution.
Therefore, the concentration measured by equation [5] will be less than the actual
porewater concentration.
Case 3, Partially Sustained: There is significant resupply of species to the solution;
however, it is not enough to maintain a constant flux to the DGT unit. There is a flux
from the sediment to the solution, but it is not as great as the flux from the solution to
the DGT unit. Therefore, equation [5] will underestimate the actual porewater
concentration, but not to the degree of the unsustained case.
These three cases are shown in Figure 2.7.

Ben Annan Background______________________________________________________________________________
______________________________________________________________________________Centre for Water Research 20
Diffusive Gel
C
Pore WatersFully SustainedCase 1
Partially SustainedCase 3
UnsustainedCase 2
Sink
Figure 2.7: The three different cases of supply of ions from the sediment to the
porewaters (modified from Zhang et al. 1998b)
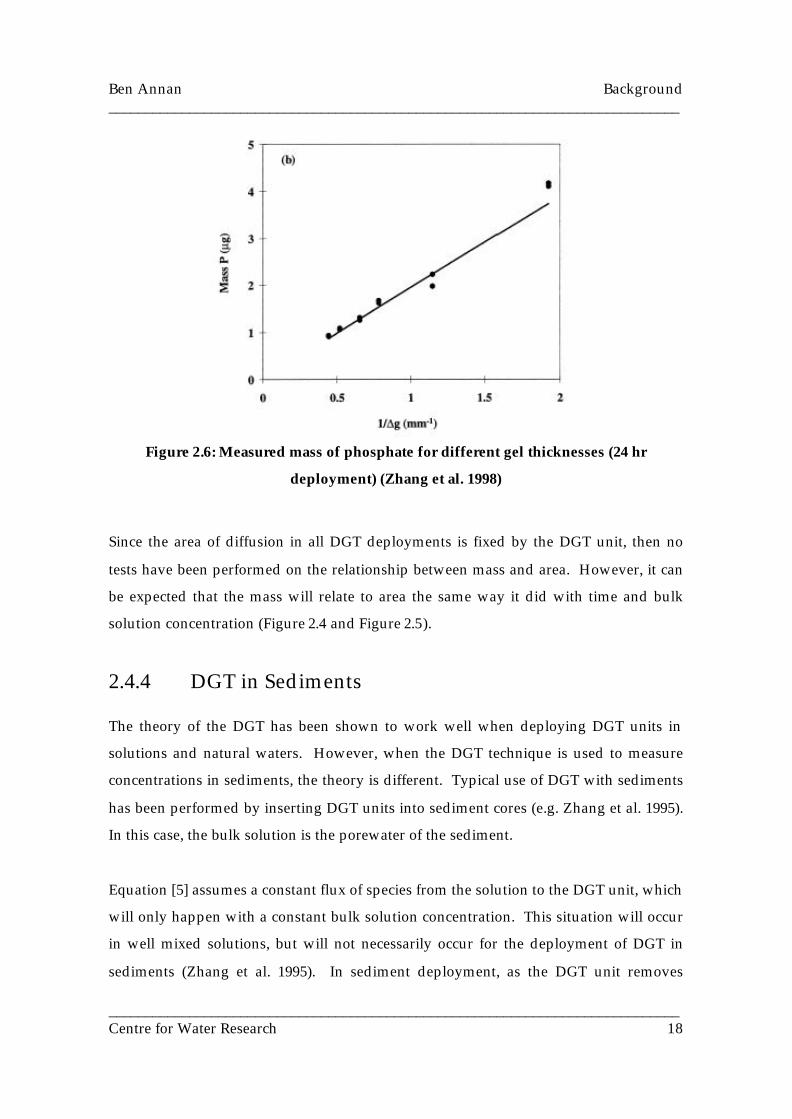
The practical application of these cases has been studied by Zhang et al (1998b). DGT
units with different gel thicknesses (1.3 – 2.13 mm) were deployed in soils that were
treated with metal-amended sludge from a wastewater treatment plant. Using the
definition of flux (equation [4]), the fluxes of zinc from the soil solution to the DGT unit
were measured for the different gel thicknesses. A plot of flux against the reciprocal of
gel thickness shows that as gel thickness decreased, the flux deviated away from a linear
relationship (Figure 2.8). This is a stark contrast from the deployment of DGT units in
solutions (Figure 2.6), where the linear relationship is maintained for all gel thicknesses.
Ben Annan Background______________________________________________________________________________
______________________________________________________________________________Centre for Water Research 21
Figure 2.8: Fluxes of Zn from soils to DGT unit with varying gel thicknesses. The
linear eventually breaks down (Zhang 1998b).
This infers that only the beginning part of the curve can be considered to be the fully
sustained case, and therefore only those gel thicknesses will yield the theoretical
concentration using equation [5]. The thicker gels give the theoretical response, because
diffusion from the solution phase to the binding layer is slower, therefore the flux is
lower (Zhang et al. 1998b). The lowered flux through the diffusive gel will now be closer
to the flux of species from the solid phase to the solution. This relates to the fully
sustained case. Conversely, the thinner gels result in a higher flux to the DGT unit. The
solid phase cannot meet this flux demand, and so the species concentration in the bulk
solution will decrease; this relates to the partially sustained or unsustained cases.
Sediment Slurry
The above discussion of DGT in sediment refers to the insertion of units in sediment
cores. However, another possible method to measure sediment concentrations is the
deployment of DGT units in sediment slurries. There have been no published accounts
of this, therefore knowledge on the matter is very limited.

Ben Annan Background______________________________________________________________________________
______________________________________________________________________________Centre for Water Research 22
The stirred sediment slurry will measure the concentration in the porewaters, but will
also measure the phosphorus released from the sediment due to the increased volume of
water.

Ben Annan Methods______________________________________________________________________________
______________________________________________________________________________Centre for Water Research 23
3 Methods
3.1 Lake Sampling
Lake Yangebup sediment consists of two distinct layers: loose floc and an underlying
consolidated layer. The floc layer contained living worms and larvae. There were also
traces of algae in this layer. The consolidated layer is a darker layer with lower moisture
content. It is the more important layer in terms of phosphorus release (Linge 2002).
Therefore, the consolidated layer was analysed during this project.
On the 29th of August and the 14 th of October 2002, four sediment cores were taken from
Lake Yangebup. The four cores were taken approximately 2 m away from each other in
order not to sample already disturbed sediment.
The coring system consists of a tube with a stainless steel blade attached to one end, and
a handle attached to the other (Figure 3.1). The corer was pushed into the lake sediment,
then the handle was removed, allowing the corer to fill with water. Once full, a plastic
cap is screwed to the end, and the corer was removed from the water. The steel blade
was removed, and replaced with another cap. Before use, all equipment was acid
washed to ensure no contamination from previous use.

Ben Annan Methods______________________________________________________________________________
______________________________________________________________________________Centre for Water Research 24
.
Figure 3.1: Equipment used for collecting sediment cores. (a) the handle, (b) stainless
steel blade, (c) and (d) caps, and (e) (inset) a sediment core held in the coring tube.
Intact sediment cores were taken back to the laboratory for analysis. The overlying
water was siphoned off, and then the sediments were pushed out of the corers. In order
to minimise heterogeneity, consolidated sediment from all four cores was mixed together
to create a bulk sample. All samples for analysis were taken from this bulk sample with
an acid washed polyethylene spoon.
3.2 Chemical Analysis
Phosphorus analysis was performed using the malachite green spectrophotometric
method.
3.2.1 Malachite Green Method
The malachite green method has been used to determine dissolved phosphate
concentrations in both water and soils (e.g. Rao et al. 1997). In the past, the ascorbic acid

Ben Annan Methods______________________________________________________________________________
______________________________________________________________________________Centre for Water Research 25
method was used to measure phosphate, however, it has been recently shown that the
malachite green method is approximately 4 times as sensitive. Also, the malachite green
method is not as sensitive to changes in heating, reagent addition or reaction time.
The malachite green method is based on the formation of a molybdophosphoric acid,
which turns green. The intensity of the colour development depends on the amount of
dissolved phosphorus present in the solution.
Reagents
Malachite Green Reagent
Concentrated sulfuric acid (H2SO4) (95 mL, approximately 18 M) was added very slowly
to 375 mL of DI water. After the mixture had cooled to room temperature, 27 g of
ammonium molybdate ((NH4)6Mo7O24.7H2O) was added and stirred until dissolved.
Malachite green oxalate (C25H22N2O4) (0.135 g) was then added to the resulting solution
and stirred until dissolved. After the addition of malachite green oxalate, the solution
turned a deep orange. The solution was then made up to one litre, and stored at 4°C.
Polyvinyl Alcohol
A stock solution of 0.1 % (w/v) polyvinyl alcohol (PVA) was prepared by dissolving 5 g
in 500 mL. To assist the dissolution process, the solution was heated to near boiling
point while being stirred.
Standard Solutions
Standard solutions of phosphorus (P) were prepared daily from a stock solution of 1000
ppm P. The stock solution was prepared by dissolving 0.4393 g potassium dihydrogen
phosphate (KH2PO4) in 100 mL DI water. A new stock solution was prepared weekly.

Ben Annan Methods______________________________________________________________________________
______________________________________________________________________________Centre for Water Research 26
Procedure
The colour reagent was prepared daily by mixing equal amounts of the malachite green
and PVA reagents. In a small test tube, 2 mL of this colour reagent was added to 6 mL of
the solution being analysed. The solution was mixed well, and then allowed 15 minutes
for colour development.
The absorbencies were measured at 615 nm using a HACH DR/3000 Spectrophotometer
(Hach Company, USA).
Calibration
Working calibration solutions between 10 ppb and 100 ppb P were prepared from the
stock standard in order to create a calibration curve. The calibration curve was used to
calculate the concentrations in solutions where only the absorbance is known.
The measured absorbencies of the calibration solutions were plotted against their
concentrations, and a linear trendline was fitted. This trendline was used with the
absorbance values of the analyte solutions to determine their phosphate concentrations
(Figure 3.2).
v

Ben Annan Methods______________________________________________________________________________
______________________________________________________________________________Centre for Water Research 27
Figure 3.2: Determination of concentration using the standard curve. An absorbance
of 0.15 is equivalent to a concentration of 71 ppb P.
The malachite green method has a limited range of linear colour response to
concentration. At too high a concentration, the colour development is no longer linearly
proportional to the concentration. Therefore, the linear response measured using the
calibration curve breaks down (Figure 3.3). Therefore, this project only used standards
between 10 and 100 ppb.
0
0.1
0.2
0.3
0.4
0.5
0 200 400 600 800 1000 1200
P concentration (ppb)
Ab
sorb
ance
Figure 3.3: Absorbencies measured by the malachite green method. The linear
calibration curve breaks down when concentrations are too high. When the 1000 ppb
reading is removed, then a straight line results (Figure 3.2)
3.3 Chemical Extraction
Chemical extractions were applied to sediment in order to investigate the amount of
phosphorus associated with different phases in the sediment. The methods used were
based on the fractionation scheme used by Linge (2002), however, a sequential process
used by Linge (2002) was not adopted in this project. Instead, the extractions were

Ben Annan Methods______________________________________________________________________________
______________________________________________________________________________Centre for Water Research 28
applied to individual sub-samples of sediment. The 0.1 M NaOH was based on
Sharpley et al. (1991) finding that the P extracted with this solution correlated well with
bioavailable P.
3.3.1 Extraction Solutions
Reagents
Magnesium Chloride
Approximately 50.1 g of magnesium chloride (MgCl2) was dissolved in 250 mL of
deionised (DI) water to create a 1 M solution. The pH of the solution was adjusted to 7
with the addition of 1 M sodium hydroxide (NaOH).
Hydrochloric Acid
A 1 M hydrochloric acid (HCl) solution was prepared by diluting 28.5 ml of concentrated
HCl to 250 mL with DI water.
Sodium Hydroxide
A 1 M solution of NaOH was prepared by dissolving 10 g of solid NaOH in 250 mL DI
water. From this solution, 0.1 M NaOH was prepared with a 1:10 dilution.
Hydroxylamine Hydrochloride
Solid hydroxylamine hydrochloride (NH2OH.HCl) (4.34 g) was dissolved in DI water,
and then concentrated HCl (7.125 mL) was added. The resulting solution was made up
to 250 mL with DI water.
Procedure
A fresh, wet sediment sample equivalent to 1 g in dry weight was added to 20 mL of
each of the extraction solution and processed as described below. After the extraction
processes were complete, the slurries were left still for at least 20 minutes to allow the

Ben Annan Methods______________________________________________________________________________
______________________________________________________________________________Centre for Water Research 29
sediment to settle. The overlying solution was then passed through a 0.45 ìm filter
before being analysed for P concentration.
MgCl2
The sediment slurry was shaken continuously for 2 hours.
HCl
The sediment slurry was shaken continuously for 17 hours.
NaOH
The sediment slurry was shaken continuously for 17 hours.
NH2OH.HCl
The sediment slurry was shaken in a water bath at 50° C for 30 minutes.
3.4 Diffusive Gradients in Thin-films (DGT)
Technique
3.4.1 Preparation of Gels
The methods of DGT component preparation used in this project are based upon the
procedure outline by Zhang et al. (1998)
To avoid contamination of DGT components, contact with metal objects were avoided.
Acid washed plastic tweezers were used to handle the gels.

Ben Annan Methods______________________________________________________________________________
______________________________________________________________________________Centre for Water Research 30
Reagents
The gels used were acrylamide based, cross-linked with a patented agarose-based cross-
linker. They were made from a gel solution, prepared from a bulk solution. In order to
make the binding gel, ferrihydrite was also required.
Bulk Solution
The bulk solution comprises of 15% (w/v) acrylamide and 0.3% (w/v) cross-linker. A 50
mL bulk solution was prepared by adding 18.75 mL of a 40 % (w/v) acrylamide solution
to 7.5 mL of a 3% (w/v) cross linker solution and 23.75 mL of DI water. The solution was
stored in the fridge until required.
Gel Solution
A 10% (w/v) ammonium persulphate solution was prepared by dissolving 1 g of solid
ammonium persulphate in 10 mL of DI water. The gel solution was prepared by adding
35 ìL of the ammonium persulphate and 10 ìL of a TEMED catalyst to 5 mL of the bulk
gel solution. It was essential that a fresh ammonium persulphate solution was prepared
each day a new gel solution was made. Failure to do resulted in gel solutions that would
not set during casting (described below).
The gel solution begins to solidify after about 5 minutes, and therefore was used
immediately after preparation.
Ferrihydrite
Ferrihydrite was used as the binding agent in the binding gels. A solution of 0.1 M Fe3+
was prepared by dissolving 8 g of iron nitrite nonahydrate (Fe(NO3)3.9H20) in 200 mL of
DI water. The solution was continuously stirred as NaOH (1 M) was added drop-wise
until the pH reached 7. During the addition of NaOH, a dark brown-red precipitate
formed. The volume of NaOH added was approximately 65 ml, which agreed with the
volume used by other researches (Zhang et al. 1998).

Ben Annan Methods______________________________________________________________________________
______________________________________________________________________________Centre for Water Research 31
The slurry was then stored in the dark at 4°C for approximately two hours to allow the
precipitate to completely settle. After the two hours, the overlying water was removed
with a pipette. The precipitate was then washed with DI water, allowed to settle, and
the water removed again. This process was repeated three times. After the final wash,
an overlying layer of about 1 cm of water was left. To ensure the exclusion of light, the
beaker containing the slurry was wrapped in aluminum foil before being stored at 4°C.
The ferrihydrite slurry will last for at least nine months if prepared properly (Zhang et
al. 1998).
Sodium Nitrate
A sodium nitrate (NaNO3) solution was required for the storage of diffusive gel. A 0.1 M
solution was prepared by dissolving 2.12 g of solid NaNO3 in 250 mL of DI water.
Procedure
Diffusive Gel
The diffusive gel was prepared by casting the gel solution using the procedure described
below.
Binding Gel
To prepare the binding gel, 1 g of the ferrihydrite slurry was added to 5 mL of the gel
solution. In the initial stages of the project, ferrihydrite with the lowest visible moisture
content was extracted from the slurry. However, in the later stages, the ferrihydrite
slurry was stirred vigorously to ensure homogeneity of the extracted sample. The
binding gel solution was cast as described below.
Casting
In order to make the thin-films of diffusive and binding gels, the gel solutions were cast
between two glass plates, separated by a plastic spacer. A 10 cm x 10 cm plastic sheet of
0.1 mm thickness was cut into a U-shape, and then placed between two 10 cm x 10 cm

Ben Annan Methods______________________________________________________________________________
______________________________________________________________________________Centre for Water Research 32
glass plates to create the casting unit (Figure 3.4). The glass plates and spacer were held
in place using plastic clamps on the three closed edges.
Figure 3.4: The glass plates and plastic spacer; components of the casting unit. The gel
solution is cast into the space created by the U-shaped plastic spacer. The black dot
indicates the best place to insert the gel solution
The glass plates were offset by a few millimeters to allow room for the gel to be inserted.
This also made it easier to take the casting units apart. The gel solutions were cast into
the U-shaped cavity using a micro-pipette. The solution was cast by placing the tip of
the pipette at one corner of the space (shown by the black dot in Figure 3.4) and
continually squeezing.
Gel solutions were cast as soon as they were prepared as they would start to solidify
after approximately 5 minutes. After insertion of the gel solution, the casting unit was
placed in an oven at 42° C (+/- 2°C) for 45 minutes to allow the gel solution to set.
The components of the casting unit could be reused, but it was essential that they were
thoroughly acid washed. Imperfections on the glass surface resulted in bubbles while
the gel solution was being cast. However, even with extremely clean glass plates were
used, bubbles were not uncommon. Often, they could be removed by inserting more gel
solution, or by tilting the glass plates so that the bubbles rise to the open end of the
Ben Annan Methods______________________________________________________________________________
______________________________________________________________________________Centre for Water Research 33
casting unit. When bubbles could not be removed, the casting unit was still placed in
the oven, but when using the gel, the areas with bubbles were not used
Storage of Gels
After setting, the casting units disassembled. The resulting thin-films of gel tended to
stick to one of the glass plates. They were removed using acid washed plastic spacers.
Both the diffusive and binding gels were placed in DI water for a 24 hour hydration
period. The hydration period allowed any unwanted ions in the gels to diffuse out.
During this time, the water was changed 2 times. After the hydration period, the
binding gels were stored in DI water, and the diffusive gels were stored in 0.1 M NaNO 3.
Measuring Gel Thickness
The thickness of the gel depends on the thickness of the plastic spacer used in the casting
unit. Three different gel thicknesses were used throughout the project. Most commonly
only one plastic spacer was used for casting. However, to increase gel thickness, 2 and
also 3 spacers were used.
To measure the thickness of gel, a very thin slice of cut from the gel sheet, then turned on
its side. The thickness was then measured using a microscope with a ruler scale in it.
3.4.2 Preparation of DGT units
Cutting the Gels and Filters
Circular discs were cut from the binding gels using a plastic bottle cap of approximately
2.5 cm diameter. The accuracy of this cutting tool was not important, as the window on
the cap of the DGT unit controls the actual area of diffusion. The gel was laid flat on a
clean glass plate and the bottle cap was pressed down firmly into the gel. The resulting
disc was removed from the sheet using plastic tweezers. To lay the gel sheet flat, it had
to be squirted with water, otherwise it would bunch up.

Ben Annan Methods______________________________________________________________________________
______________________________________________________________________________Centre for Water Research 34
Glass fibre membrane filters were also cut to size by placing it on an unloaded DGT
piston, then closing the cap over it.
Loading the DGT Unit
Using plastic tweezers, the binding gel was placed on the top of the DGT piston, and
then the diffusive gel was placed on top of the binding gel. The glass fibre membrane
filter was placed on top of the diffusive gel. The cap was then closed down tightly.
3.4.3 Using the DGT units
Deployment of DGT units
Loaded DGT units were placed in solutions for known amounts of time. They were then
taken out and disassembled. To remove the cap from the DGT unit, and flat-head
screwdriver was placed in the slot on the cap, the unit was held firmly by the piston, and
the screwdriver rotated slowly. This eased the cap off without disrupting the gels. The
filter and the diffusive gel were then removed with tweezers. After rinsing the tweezers
several times with DI water, they were used to remove the binding gel.
Elution
In order to measure the amount of phosphate obtained by the binding gel, the phosphate
had to be released from the gel. This was achieved by eluting each gel in 10 mL of 0.25
M sulfuric acid (H2SO4) for 2 hours. Sometimes, a longer elution time was used, but
Zhang et al. (1998) found that any time longer than 1 hour is sufficient. Before the
binding gels were placed into the acid, they were rinsed with DI water to eliminate the
chance of contamination from droplets of deployment solution that remain on the gels
surface.
The gels were removed from the eluent before it was analysed for P concentration using
the methods described above. The mass of P accumulated by the gel was then calculated
by multiplying the concentration by the volume of the eluent (equation [7]).

Ben Annan Methods______________________________________________________________________________
______________________________________________________________________________Centre for Water Research 35
(L)eluent of Volume x (ppb)eluent ofion Concentrat (ug) P of Mass = [7]
Effect of Acid Concentration on the Malachite Green Method
As discussed above, the determination of phosphorus concentrations was performed
using the spectrophotometric method of malachite green. The malachite green method
has been shown to be sensitive to changes in acidity, when final acid concentrations are
higher than 0.5 M (Linge and Oldham 2001). The final acidity of the eluent treated with
the malachite green reagent was less than this upper value. However, tests were still
performed to confirm there would be no effect.
Samples of water and 0.25 ml H2SO4 were treated with the malachite green methods. No
significant differences in absorbencies of the samples were measured, therefore
confirming that the acid did not affect the colour development.
3.4.4 Testing the DGT technique
Testing the Binding Gel
Reproducibility
In order to test the variations in accumulated mass of P, replicate binding gels were
placed in solutions of known concentration and left for equal amounts of time.
Time Loading
Experiments were performed on the binding gels to test the accumulation of P over time.
Known masses of binding gels were placed in solutions of known P concentration, and
taken out after known amounts of time.
General Loading

Ben Annan Methods______________________________________________________________________________
______________________________________________________________________________Centre for Water Research 36
Experiments were performed to determine the variations of binding gel response in
solutions of various concentrations and for different deployment times.
Testing the DGT Unit
The above experiments were useful in testing how the binding gel behaves in
phosphorus solutions. However, it is important to also test the response of the complete
DGT unit. In order to do this, loaded DGT units were placed in solutions of known
phosphorus concentrations for varying amounts of time (Figure 3.5).
Figure 3.5: DGT units deployed in known P concentrations
3.4.5 DGT Measurement in Sediment Slurries
To test the amount of phosphorus in the consolidated sediment collected from Lake
Yangebup, DGT units were deployed in stirred sediment slurries.
The sediment slurry was prepared by placing 20 g of fresh, wet sediment in a 1000 mL
beaker containing 750 mL of DI water. The slurry was stirred using a magnetic stirrer of
3 cm length. The DGT units could not sit on the bottom of the beaker, as they would
interrupt the stirring. Instead they were suspended in the sediment slurry (Figure 3.6).

Ben Annan Methods______________________________________________________________________________
______________________________________________________________________________Centre for Water Research 37
Figure 3.6: DGT units deployed in sediment slurry container (before addition of
water). Units are suspended in the beaker by fishing wire attached to the outside of
the beaker.
The DGT unit was suspended approximately half way up the beaker (near the 550 mL
mark) with fishing wire. Four DGT units could fit comfortably in one sediment slurry
using this method (Figure 3.6).

Ben Annan Results______________________________________________________________________________
Centre for Water Research 38
4 Results
4.1 Chemical Extraction
As discussed in the Methods section, the malachite green spectrophotometric method
has an upper limit to reliable concentration determination. Therefore, it is important
that the solutions being analysed are within the range of the calibration solutions, i.e.
between 10 ppb and 100 ppb.
After addition of the malachite green reagents, the chemical extraction solutions were
visually compared with the calibration solutions (Figure 4.1). All the extraction
solutions had darker than the 100 ppb calibration solution, indicating they were greater
than 100 ppb in concentration. Therefore, extraction solutions were diluted to ensure
they were within the measurable range (Table 4.1).
Figure 4.1: Samples treated with malachite green colouring reagents. It is possible to
visually determine if the colour development of analyte solutions is in the range of
the calibration solutions (the bottom row).

Ben Annan Results______________________________________________________________________________
Centre for Water Research 39
Table 4.1: Dilutions required in order to analyse extraction solutions using the
malachite green method
Extraction Solution Dilution Required
MgCl2 1:10
HCl 1:250
NaOH 1:250
NH2OH.HCl 1:250
After diluting to within the correct range, the extraction solutions were then analysed for
P concentration. The mass extracted from the sediment for each extraction is shown in
Table 4.2. These concentrations agreed with the fractionation results of Linge (2002).
The MgCl2 extracted significantly less P than the other extractions.
Table 4.2: Mass of P measured in extraction solutions. Values shown are the average,
and the error is the standard deviation from quadruplicate tests.
Extraction Solution Mass P per mass dry sediment
( ìg/g)
MgCl2 5.40 +/- 0.23
NaOH 184 +/- 28
NH2OH.HCl 221 +/- 29
HCl 476 +/- 40
4.2 DGT
4.2.1 Gel Preparation
It was hypothesised that there would be variations in DGT performance caused by
variations in gel properties. Therefore, knowledge of the details of gel preparation was
important.

Ben Annan Results______________________________________________________________________________
Centre for Water Research 40
Dates of Preparation
Throughout the project, three different bulk solutions were prepared, from which many
different sheets of diffusive and binding gels were made (Table 4.3 and Table 4.4). If two
or more gels were prepared on the same day, it implies that they were prepared from the
same gel solution
Table 4.3: Diffusive gel preparation dates. Gel 4 and 5 were prepared with double
and triple layers of plastic spacers respectively.
Diffusive gel
sheet #
Bulk solution used Date prepared
1 1 9/7/02
2 2 16/9/02
3 2 16/9/02
4 * 2 3/10/02
5 ** 2 3/10/02
6 2 3/10/02
7 2 3/10/02
8 3 9/10/02
9 3 9/10/02
10 3 9/10/02

Ben Annan Results______________________________________________________________________________
Centre for Water Research 41
Table 4.4: Binding gel preparation dates
Binding gel
sheet #
Bulk solution used Date prepared
1 1 10/7/02
2 1 10/7/02
3 2 16/9/02
4 2 30/9/02
5 2 30/9/02
6 2 30/9/02
7 3 9/10/02
8 3 9/10/02
9 3 9/10/02
Variation in Gel Preparation
Diffusive Gels
The preparation of the diffusive gel was a relatively simple procedure when compared
to the binding gels. Therefore, there was little room for differences in gels to occur
during the preparation phase. However, when preparing gels 4 and 5, extra plastic
spacers were used to increase the gel thickness. Diffusive gel 4 used two plastic spacer,
and diffusive gel 5 used three plastic spacers.
Binding Gels
The preparation of binding gels is complicated by the addition of a ferrihydrite. As
discussed in the Methods, two different methods of extracting the ferrihydrite from its
slurry were used. Binding gels 1, 2 and 3 were prepared using the first method of
ferrihydrite extraction where the beaker holding the slurry was tilted, so that the
overlying water shifted to one side, the ferrihydrite was then extracted from the opposite
side of the beaker. Binding gels 4 to 9 were prepared using the second method which
gave more homogeneous gels. Before extracting the ferrihydrite, the slurry was

Ben Annan Results______________________________________________________________________________
Centre for Water Research 42
vigorously shaken, ensuring homogeneity. It is likely that gels using the first method
have a higher concentration of ferrihydrite.
Description of Gels
Diffusive Gels
Diffusive gels 1 to 3 and 6 to 10 appeared of identical appearance, and were 0.3 mm
thick. Gels 4 and 5 had very similar appearance, but were 0.6 mm and 0.9 mm thick
respectively. The thickness of the plastic spacer used was 0.1 mm; therefore the
expansion factor of the diffusive gels during hydration was 3.
Binding Gels
The 9 binding gels made during this project appeared similar, with patches of brown
ferrihydrite densely scattered throughout each gel sheet (Figure 4.2). However, some
gels appeared to have a more dense spread of ferrihydrite than the others.
Binding gel 2 had a more dense spread of ferrihydrite throughout the gel sheet than
binding gel 1. Binding gel 3 had a very similar appearance to binding gel 1. The patches
of ferrihydrite in gels 4, 5 and 6 were very close together, but the patches themselves
were finer that those of binding gels 1, 2 and 3. Binding gels 7, 8 and 9 were of similar
appearance to binding gels 1 and 3.
Not only were there differences in appearance between different binding gels, but there
also differences within a binding gel sheet (Figure 4.2). The edges of the sheets were
much darker brown that the inside. Therefore, the edges of the sheets were avoided
when cutting the circular discs. Dark brown patches also often appeared within the
sheet. When possible, discs were only cut from areas showing an even spread of
ferrihydrite.

Ben Annan Results______________________________________________________________________________
Centre for Water Research 43
Figure 4.2: Binding gel 3, showing the cut circular discs. Darker patches of brown
indicate higher densities of ferrihydrite.
4.2.2 Validation Tests
Binding Gel Variation
Reproducibility
Reproducibility tests were performed on the binding gels in order to test the variations
in accumulated mass of P for gel discs cut from the same gel sheet, and between gel
sheets made from the same bulk solution
As they were made from the same gel solution, binding gels 4, 5 and 6 were used for the
reproducibility tests. Each gel was placed in 10 mL of a 50 ppb solution for 24 hours.
After this deployment time, the mass of accumulated P was measured and standardised
to the mass of the binding gel (Table 4.5)

Ben Annan Results______________________________________________________________________________
Centre for Water Research 44
Table 4.5: Average values of P accumulation for binding gel sheets. Replicate gel
discs from each gel sheet were placed in 10 mL of 50 ppb P for 24 hours. Errors are
standard deviations.
Gel Average P accumulation per
gel mass ( ìg/g)
4 (n = 3) 1.52 +/- 0.09
5 (n = 3) 1.58 +/- 0.09
6 (n = 4) 1.52 +/- 0.21
All gels (n = 10) 1.54 +/- 0.14
Binding gel sheet (BGS) 5 had the highest average value of P accumulation per gram of
gel of 1.52 ìg/g. However, BGS 6 recorded the maximum value for any gel discs, and
also the minimum value. Consequently, BGS 6 showed the biggest intra-gel sheet
variation, with a standard deviation of 0.21 ìg/g.
Using all gel values, the percentage of standard deviation to average values of both
accumulated mass, and accumulated mass per gel mass was 9%. Therefore, for all other
tests where replicates were not used, an error of 9% was used to give an indicator of the
likely variation.
Time Loading
The DGT theory assumes the mass of P accumulated by the binding gels increases
linearly with time. Therefore, it was important to test the binding gels mass
accumulation for different times.
The first time loading experiment used 5 discs from binding gel 1, each in a separate 10
mL solution of 100 ppb. The gels were deployed for 1, 2, 4, 8 and 24 hours (Figure 4.3).

Ben Annan Results______________________________________________________________________________
Centre for Water Research 45
y = 0.2981x
R2 = 0.8146
0
0.2
0.4
0.6
0.8
1
1.2
1.4
0 10 20 30
Time (hr)
Mas
s P
(ug
)
Figure 4.3: Phosphorus mass accumulation versus time for time experiment 1. A
linear trendline has been added to the data up to 4 hours.
A linear response with time is seen until 4 hours. After 4 hours the accumulated mass
remains steady at 1 ìg.
The second time loading used involved six circular discs cut from binding gel 6. Each
gel disc was placed in a separate 10 mL solutions of 50 ppb P. Gels were deployed for
0.5, 1, 2, 4, 8 and 24 hours (Figure 4.4).

Ben Annan Results______________________________________________________________________________
Centre for Water Research 46
y = 0.0624x
R2 = 0.9578
0
0.05
0.1
0.15
0.2
0.25
0.3
0.35
0.4
0.45
0 5 10 15 20 25 30
Time (hr)
Mas
s P
(u
g)
Figure 4.4: Phosphorus mass accumulation versus time for time experiment 1. A
linear trendline has been added to the data up to 4 hours.
As with the first time loading experiment, a linear relationship exists only for the first
four hours. The linear relationship in the second time loading experiment was greater
than the first.
General Loading
Tests were performed on binding gels using various concentrations and deployment
times. The role of these tests was to determine the variations different binding gels will
show under different conditions.
Three binding gels discs (one cut from binding gel 1 and two cut from binding gel 2)
were placed in separate 10 mL solutions of 1000 ppb. The gels were deployed in the
solutions for four hours and 20 minutes (Table 4.6). The gels were weighed so that P
accumulation per gram of gel could be calculated.

Ben Annan Results______________________________________________________________________________
Centre for Water Research 47
Table 4.6: Results from gels placed in 10 mL of a 1000 ppb P solution for 4 hours and
20 minutes. Each solution had 10 ìg of P available for uptake. The last column shows
the percentage of this mass that was accumulated. Errors are 9% of the value, except
for the last row where they are standard deviations.
Gel Mass P ( ìg) Mass P per gel mass ( ìg/ g) % accumulated
6 0.92 +/- 0.08 3.49 +/- 0.31 9.24
7 1.00 +/- 0.09 3.92 +/- 0.35 10.00
8 0.99 +/- 0.09 4.88 +/- 0.44 9.93
All gels 0.97 +/- 0.04 4.1 +/- 0.71 9.72
Gels 6 and 7 were cut from binding gel sheet 2, whereas gel 8 was cut from binding gel
sheet 1. The gel discs all accumulated approximately 1 ìg. However, when comparing
the mass of P accumulated per gram of binding gel (P/gel mass (ìg/g)), the similarities
aren’t as strong. Gels 6 and 7 give approximately the same P/gel mass, however, gel 8 is
significantly higher. Using all gel measurement, the percentage of standard deviation to
average value is 17%. This is significantly higher than the 9% value obtained in the
reproducibility tests.
A similar experiment was performed using left over gel pieces (cuttings), rather than
discs (Table 4.7). These cuttings were too small to be used in the actual DGT units, but it
was thought that experiments could still be performed on them.
Six pieces of gel were cut from binding gel sheets 1 and 2. The gels were weighed then
placed in a 10 mL solution of 1000 ppb P. The gels were taken out of the solution after 44
hours.

Ben Annan Results______________________________________________________________________________
Centre for Water Research 48
Table 4.7: Results from gel cuttings placed in 10 mL of 1000 ppb P for 44 hours. Errors
are 9% of the value.
Gel Mass P ( ìg) Mass P per mass gel ( ìg/g) % accumulated
1 2.11 +/- 0.19 12.0 +/- 1.08 21.07
2 2.47 +/- 0.27 17.6 +/- 1.58 24.75
3 2.97 +/- 0.22 14.0 +/- 1.26 29.70
4 2.89 +/- 0.26 16.5 +/- 1.48 28.88
5 2.68 +/- 0.24 18.9 +/- 1.70 26.77
6 3.16 +/- 0.28 14.1 +/- 1.27 31.59
Gels 1 to 3 were cut from binding gel sheet 1, and gels 4 to 6 cut from binding gel sheet 2.
These cuttings have much larger P/gel mass values than the discs used in the first
general loading experiment.
Another experiment performed with cuttings, rather than discs, was carried out in 10
mL solutions of 1 ppm and 100 ppm using solutions of 1 ppm and 100 ppm P.
Table 4.8: Cuttings from binding gels 1 and 3 were placed in solutions of 1 and 100
ppm P.
Gel & solution Mass P ( ìg) Mass P per mass
gel ( ìg/g)
% accumulated
binding gel 1, 1 ppm 9.87 +/- 0.89 113.97 +/- 10.25 98.7
binding gel 3, 1 ppm 4.99 +/- 0.45 67.89 +/- 6.11 49.9
binding gel 1, 100 ppm 9.54 +/- 0.86 45.47 +/- 4.09 9.54
binding gel 3, 100 ppm 9.52 +/- 0.86 89.56 +/- 8.06 9.52
Three of the gel cuttings take up the same mass of P, only the other one takes up half of
that mass. However, there are no similarities between the gels when comparing the
mass of accumulation per mass of gel. Compared to the other two general loading
experiments, these P/gel mass values are extremely high.

Ben Annan Results______________________________________________________________________________
Centre for Water Research 49
DGT Validation
Deployment of DGT units in solutions determines whether the units were responding
according to theory. Binding gel tests showed those gels accumulated P linearly with
time for four hours. Therefore, the DGT units were deployed in the solutions for no
more than 4 hours. Two experiments were performed.
The first DGT experiment involved four DGT units deployed in 100 mL solutions of 50
ppb P. From the accumulated mass of P (Figure 4.5) the concentration of the solution
was calculated (Figure 4.6). The units were all loaded with binding gels from binding
gel sheet 5. DGT units 1, 2 and 3 used diffusive gel sheet 6 and DGT 4 used diffusive gel
sheet 7, which both had 0.3 mm thickness.
y = 0.0511x
R2 = 0.9081
0
0.05
0.1
0.15
0.2
0.25
0 1 2 3 4 5
Deployment time (hrs)
Mas
s P
(u
g)
Figure 4.5: Mass of P accumulated in the binding gels of DGT deployment experiment
1. The masses increase linearly with time. Error bars are 9%.

Ben Annan Results______________________________________________________________________________
Centre for Water Research 50
0.00
20.00
40.00
60.00
80.00
100.00
0 1 2 3 4 5
Deployment time (hr)
Co
nce
ntr
atio
n (p
pb
)
Figure 4.6: The calculated concentration for DGT units deployed in 50 ppb P for 1.2, 2,
3 and 4 hours decreased with time. The actual concentration of the deployment
solution (50 ppb P) is represented by the broken line. Errors are 9%.
While the mass of P accumulated by the resin gel did increase linearly with time (Figure
4.5), this experiment did not accurately calculate the solution concentrations. The
calculated concentrations decrease with time, therefore deviating from the actual
concentration (Figure 4.6).
A second DGT deployment experiment used binding gels cut from binding gel 7, and
diffusive gels all cut from sheet 8. Four DGT units were deployed in separate 90 mL
solutions of 50 ppb P. Units were retrieved after 1, 2, 3 and 4 hours (Figure 4.7 and
Figure 4.8).

Ben Annan Results______________________________________________________________________________
Centre for Water Research 51
y = 0.0861x
R2 = 0.9889
0
0.05
0.1
0.15
0.2
0.25
0.3
0.35
0.4
0 1 2 3 4 5
Deployment time (hrs)
Mas
s P
(u
g)
Figure 4.7: Mass of P accumulated in the binding gels of DGT deployment experiment
2. The mass is increasing linearly with time. Errors are 9%.
0.0
20.0
40.0
60.0
80.0
100.0
0 1 2 3 4 5
Deployment time (hr)
Co
nce
ntr
atio
n (
pp
b)
Figure 4.8: Calculated concentrations with time for DGT experiment 2. The actual
concentration (50 ppb P) is shown by the broken line. Errors are 9%.

Ben Annan Results______________________________________________________________________________
Centre for Water Research 52
Again, the mass of P accumulated increased linearly with time. While still low,
calculated concentrations were also closer to the actual concentration in solution and
were similar over the four hours.
To test whether the DGT theory really did not hold at times greater than 4 hours, DGT
units were deployed in solutions for 24 hours. Two DGT units (DGT 1 and DGT 2) were
deployed in separate 100 mL solutions of 100 ppb P; and two other units (DGT 3 and
DGT 4) were deployed in 100 mL solutions of 200 ppb P (Table 4.9). All DGT units were
loaded with binding gel discs cut from binding gel sheet 3. DGT 1 and DGT 3 used
diffusive discs from diffusive gel sheet 1, and DGT 2 and 4 used diffusive gel sheet 2.
After 24 hours the units were retrieved from the solutions, disassembled, and analysed
for P accumulation.
Table 4.9: Results from a 24 hour DGT deployment. Errors are 9%.
Mass
accumulated
on binding
gel ( ìg)
Estimated
concentration
(ppb)
Actual
concentration
(ppb)
Ratio of
calculated to
actual
concentration
(%)
DGT 1 0.88 +/- 0.08 16.1 +/- 1.5 100 16.1 +/- 1.5
DGT 2 1 +/- 0.09 18.3 +/- 1.6 100 18.3 +/- 1.6
DGT 3 1.62 +/- 0.15 29.6 +/- 2.7 200 14.8 +/- 1.3
DGT 4 1.8 +/- 0.16 32.9 +-/ 3.0 200 16.4 +/- 1.5
The results show that the method greatly under estimated the actual concentrations.
The final column in the table shows the percentage of calculated concentration to the
actual concentration. The average percentage was 16.4% with a standard deviation of
1.4%.

Ben Annan Results______________________________________________________________________________
Centre for Water Research 53
4.2.3 DGT Sediment Slurry Deployment
Triplicate sediment slurries were prepared, and 4 DGT units were deployed in each, as
described in the Methods. Approximately 5 g equivalent dry weight of wet sediment
was added to make the slurry (Table 4.10). From each slurry, a unit was retrieved after 1,
2, 3 and 4 hours (Figure 4.9). Three DGT units, each of different gel thickness, were
deployed in a fourth slurry. The DGT units in this slurry had gel thicknesses of 0.3, 0.6
and 0.9 mm. They were retrieved after a one hour deployment time (Figure 4.10).
Table 4.10: Sediment masses in the four sediment slurries. Dry masses were
calculated from the wet mass using a moisture content of 73.9%. This moisture
content was the same as that measured by Linge (2002).
Wet mass (g) Equivalent
Dry Mass (g)
Slurry 1 19.5 5.1
Slurry 2 20 5.2
Slurry 3 20.5 5.4
Slurry 4 21.5 5.6
Behavior of the DGT in sediment slurries was as expected from theory. The mass
accumulated by the DGT units in slurries 1, 2 and 3 increased linearly with deployment
time (Figure 4.9), while the mass accumulated by the DGT units in slurry 4 increased
linearly with the inverse of gel thickness (Figure 4.10).

Ben Annan Results______________________________________________________________________________
Centre for Water Research 54
0
0.05
0.1
0.15
0.2
0.25
0.3
0 1 2 3 4 5
Deployment time (hrs)
Mas
s P
(ug
)
slurry 1
slurry 2
slurry 3
Figure 4.9: Mass of P accumulated by DGT units at different times for sediment
slurries 1, 2 and 3. Errors are 9%.
y = 0.0256x
R2 = 0.9889
0.00
0.02
0.04
0.06
0.08
0.10
0 0.5 1 1.5 2 2.5 3 3.5
1/gel thickness (mm-1)
mas
s P
(ug
)
Figure 4.10: Accumulated P Mass for the different gel thicknesses in sediment slurry
4. A clear linear relationship exists. Errors are 9%.
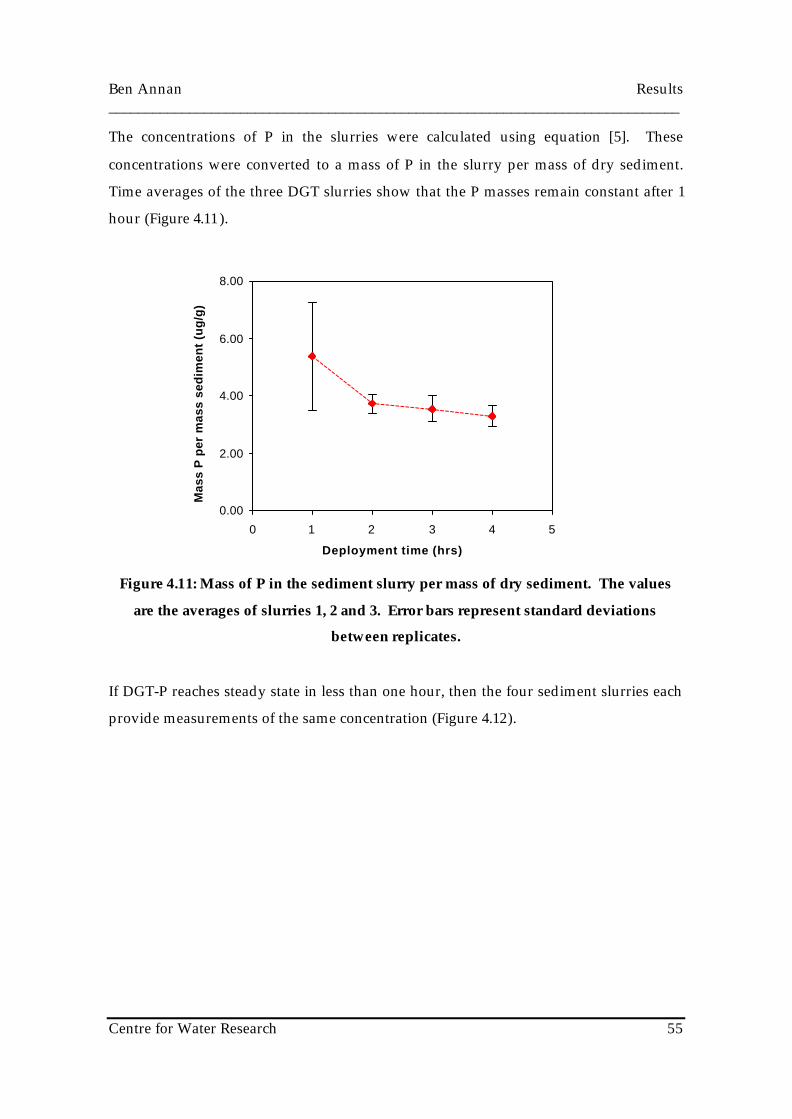
Ben Annan Results______________________________________________________________________________
Centre for Water Research 55
The concentrations of P in the slurries were calculated using equation [5]. These
concentrations were converted to a mass of P in the slurry per mass of dry sediment.
Time averages of the three DGT slurries show that the P masses remain constant after 1
hour (Figure 4.11).
0.00
2.00
4.00
6.00
8.00
0 1 2 3 4 5
Deployment time (hrs)
Mas
s P
per
mas
s se
dim
ent
(ug
/g)
Figure 4.11: Mass of P in the sediment slurry per mass of dry sediment. The values
are the averages of slurries 1, 2 and 3. Error bars represent standard deviations
between replicates.
If DGT-P reaches steady state in less than one hour, then the four sediment slurries each
provide measurements of the same concentration (Figure 4.12).

Ben Annan Results______________________________________________________________________________
Centre for Water Research 56
0
2
4
6
8
0 1 2 3 4 5
Slurry #
Mas
s P
per
mas
s se
dim
ent
(ug
/g)
Figure 4.12: Average values of mass of P per mass of dry sediment for the four
different slurries. Slurries 1, 2 and 3 are time-averaged values and slurry 4 is a gel
thickness average value.
Averaging all 15 measurements gave a mean value of 4.21 +/- 1.19 (SD) ìg P /g dry
sediment.

Ben Annan Discussion______________________________________________________________________________
Centre for Water Research 57
5 Discussion
5.1 DGT Validation Tests
The validation tests determined variations in binding gels and loaded DGT units. This
discussion will explain these variations, by linking them to stages in the preparation
phase.
5.1.1 DGT Preparation
The preparation of the DGT unit has several stages where variations in gel properties
may be introduced. These stages are discussed below.
Ferrihydrite Preparation
Only one ferrihydrite batch was used in this project. Therefore no variation can be
attributed to ferrihydrite preparation. However, Zhang et al. (1998) have noted that
ferrihydrite can turn to goethite if not prepared properly. Poor DGT performance may
occur because phosphate binds more slowly to goethite than to ferrihydrite.
Extracting the slurry
The greatest source of variation in the preparation stage arises due to the extraction of
ferrihydrite. As described in the Methods section, two different methods of extraction
were used. The initial method created gels with more ferrihydrite, but that were less
homogenous. The other method produced more homogenous gels, but with less
ferrihydrite. The increased ferrihydrite in the first method was expected to result in a
higher phosphorus accumulation.
Casting
Differences that exist between gel sheets made from the same gel solution can be
attributed to the casting procedure. The two processes involved in the casting procedure

Ben Annan Discussion______________________________________________________________________________
Centre for Water Research 58
are extracting the binding gel solution, and casting the gel solution between the glass
plates.
After the ferrihydrite is added to the gel solution, it settles at the bottom of the vial. To
ensure an even distribution of ferrihydrite, the vial was shaken before extracting the gel
solution. However, due to the small volume being extracted, the gel solution is unlikely
to contain the same amount of ferrihydrite each time. Thus, gel sheets made from the
same gel solution may contain different amounts of ferrihydrite, and will have different
binding properties.
The actual casting process involved inserting the gel solution between the two glass
plates. The volume of gel solution required to fill the U-shaped cavity of the casting unit
can be estimated from the dimensions of unit. However, all casting units required more
gel than estimated because gel solution leaked out of the U-shaped cavity. Regardless of
how tight the clamps were, leaking still occurred. When binding gel solution leaked out
of the U-shaped cavity, it appeared to be mostly clear, indicating the ferrihydrite had
remained in the space. This explains the darker brown colour often seen on the edges of
the binding gels (Figure 4.2 - Results).
Gel solution was inserted into the casting unit until the cavity filled. Therefore,
depending on the rate at which it leaked out, different casting units may have different
amounts of ferrihydrite in them. This creates more potential for differences between
binding gel sheets made from the same gel solution and differences between gel discs
cut from the same binding gel sheet (BGS).
The way that the solutions fill the U-shaped cavity can also cause differences. As the
solution is cast into one corner of the U-shaped cavity, it fills down and outwards. As it
hits the bottom of the cavity, the solution starts to fill upwards. As it does this, it often
left behind darker streaks of brown; representing a higher density of ferrihydrite. This
created heterogeneities within a single gel sheet, therefore explaining differences
between discs cut from the same sheet.

Ben Annan Discussion______________________________________________________________________________
Centre for Water Research 59
Casting may also have the potential to produce gels of slightly different thicknesses. As
discussed in methods, clamps are placed on the three closed edges of the casting unit.
Care was taken to ensure that each casting unit had the same arrangement of clamps.
However, the clamps may have different strengths, and consequently slight differences
between gel sheet thicknesses may arise. The actual locations of the clamps may result
in different thicknesses within a gel sheet. It is likely that the glass plates will be held
closer together at the edges. Therefore, the gels in the centre of the U-shaped cavity may
be slightly thicker.
5.1.2 Variation in Results
Binding Gel Tests
Reproducibility
The replicate tests performed on binding gel sheets (BGS) 4, 5 and 6 proved there exists
variations in the accumulation of P between gel sheets and also within a gel sheet (Table
4.5 in Results). BGS 4, 5 and 6 were all prepared from the same gel solution. Therefore,
the variations in gel performance seen in this test arise from the casting stage.
Time Loading
The time loading experiment proved variations exist between binding gel sheets made
from the different methods of extracting ferrihydrite. The gels in the first time
experiment were prepared using the first method of ferrihydrite extraction. These gels
exhausted the P supply in the deployment solutions, indicating they still have the
potential to accumulate P. The gels in the second time experiment were prepared from
the second method of extraction. In contrast to the first time experiment, these gels
stopped accumulating mass at approximately 0.35 µg, which is less than the available 0.5
µg. Therefore, the gels have reached their capacity. The differences seen between these
two experiments can be attributed to the different methods for extracting ferrihydrite, as

Ben Annan Discussion______________________________________________________________________________
Centre for Water Research 60
discussed above. The expectation that the first method of extracting ferrihydrite will
result in higher P loading has been confirmed by this experiment.
Despite their differences, the two experiments share one important result: the mass
accumulated by the binding gel increases linearly with time for 4 hours. This is
important, as the DGT theory will only work if this linear relationship exists.
General Loading
The variations in results from the first general loading experiment were significantly
higher than the reproducibility tests. This can be attributed to the two different methods
of ferrihydrite extraction. The gels used in the first general loading experiment were
prepared using the first method of extraction, whereas, the reproducibility tests used
gels prepared using the second method. As discussed above, it was expected that the
second method would produce more homogenous gels. The larger variation in the
performance of gels using extraction method one has proven this.
The second and third general loading experiments used leftover cuttings rather than gel
discs. The P/gel mass accumulations for the cuttings were much higher, and had greater
variation than the discs.
The large variations in the gel cutting results showed that they are not reliable for
validation tests. These large variations can be attributed to the nature of these ‘leftover’
cuttings. When cutting the gel discs, care was taken to obtain gel that visibly contained
an even spread of ferrihydrite; darker patches of ferrihydrite were avoided. When there
was no room left to cut out circular discs, smaller, randomly shaped gel cuttings were
taken. This often meant the cuttings were taken from areas that incorporated darker
patches of ferrihydrite. Therefore, the heterogeneity within the cuttings, and also
between different cuttings is greater than the gel discs. The increased ferrihydrite in the
cuttings can lead to a greater accumulation of P.

Ben Annan Discussion______________________________________________________________________________
Centre for Water Research 61
The size of the cutting relative to the gel discs was also important. The gel discs will be
more homogenous because the surface area is much larger than any of the
heterogeneities within the gel sheet. Therefore on average, they will be more
homogenous than the smaller cuttings.
DGT unit tests
The time loading experiments showed that the binding gels accumulate P linearly with
time for four hours. This was also shown to be the case for DGT units in two DGT
experiments (DGT experiments 1 and 2) carried out for 4 hours. A third DGT
experiment, deploying units for 24 hours, confirmed that the DGT theory breaks down
when mass accumulation is not linear with time.
While both experiment 1 and 2 showed a linear relationship between mass and time,
both underestimated the actual concentration in the deployment solution. Comparing
the experimental and theoretical mass curves shows that theoretical mass accumulation
would be much faster (Figure 5.1).

Ben Annan Discussion______________________________________________________________________________
Centre for Water Research 62
y = 0.0511x
R2 = 0.9081
y = 0.0861x
R2 = 0.9889
y = 0.114x
R2 = 1
0
0.05
0.1
0.15
0.2
0.25
0.3
0.35
0.4
0.45
0.5
0 1 2 3 4 5
Deployment time (hrs)
Mas
s P
(u
g)
DGT experiment 1
DGT experiment 2
Theoretical Response
Figure 5.1: The theoretical mass and actual mass accumulations of DGT units
deployed in 50 ppb. The theoretical masses were calculated from the DGT theory
(equation [5] - Background), using the diffusion coefficient of Zhang et al. (1998).
Underestimates may be due to incorrect variables being used in the theory equation.
(Equation [5] – Background). The variables that may be incorrect are the diffusion
coefficient or gel thickness.
Throughout the project, a diffusion coefficient of 6.05 x 10⁻⁶ cm2s-1 was used, as measured
by Zhang et al. (1998). However, when a diffusion coefficient of 4.57 x 10⁻⁶ cm2s-1 is
used, then the gradient of the theoretical mass curve becomes equal to the gradient of
the measured mass in DGT experiment 2. As a result, the average estimate of
concentrations for all deployment times was 47.2 +/- 5.53 (SD) ppb P.
Despite the uncertainty of Zhang et al. (1998) diffusion coefficient, it was still used in
calculations as there was insufficient data to validate the use of the new diffusion
coefficient. However, the difference between using the two values in sediment
experiments was smaller than the standard deviations of the replicates.

Ben Annan Discussion______________________________________________________________________________
Centre for Water Research 63
Differences in the diffusive gel thickness may be another reason for the underestimation
of concentrations. Throughout the project, a gel thickness of 0.3 mm was assumed for
the thin gels. This was based on a measurement of the thickness of one diffusive gel.
However, as discussed above there may be slight variations in gel thickness between,
and even within, gel sheets.
5.2 Sediment Phosphorus Measurements
Chemical Extraction
Comparisons between the chemical extraction method from this project can be made
with the fractionation scheme of Linge (2002). Some significant differences are seen
between the two sets of results. However, these were expected, as Linge (2002) adopted
a sequential procedure.
The MgCl2 extraction (5.40 +/- 0.23 ìg/g) is significantly lower than the other
extractions, agreeing with Linge (2002). Linge’s (2002) MgCl2 value was lower than
measured in this project as the dissolved phase of P had been removed sequentially.
The 0.1 M NaOH solution has previously been shown to extract bioavailable P.
(Sharpley et al. 1991). However, the high result from this study does not agree with this,
especially when compared to FRP released from sediment slurries. FRP has been
measured in Lake Yangebup sediment as 30 ìg/g by Linge (2002). FRP is widely
thought of as a measure of bioavailable P. Therefore, the significantly higher
concentration measured by the NaOH extraction (183.88 +/- 27.64 ìg/g) indicates it is
not a good measure of bioavailable P in Lake Yangebup.
The NH2OH.HCl extraction for both this project and Linge (2002) give similar values
(221 +/- 29 ìg/g and 290 +/- 66 ìg/g respectively). This indicates that the NH2OH.HCl
selectively extracts only phosphorus associated with amorphous iron oxides.
Conversely, the HCl extractions were extremely different (477 +/- 40 ìg compared with

Ben Annan Discussion______________________________________________________________________________
Centre for Water Research 64
Linge’s (2002) 5 +/- 1.14 ìg). This confirms that HCl will extract a large range of
phosphorus phases.
DGT-P
The linear mass accumulation of the three time-based experiments showed that the DGT
units were responding correctly. This was confirmed by the linear relationship between
DGT units with different gel thicknesses. As discussed in the background, this linear
relationship also indicates that the slurries are in the fully sustained case. This confirms
that the slurry was well mixed.
The time-based experiments showed that DGT-P had reached steady-state with the
sediment slurry in less than an hour. Therefore, the four sediment slurries provide four
independent measurements of the mass of DGT-P.
Comparing DGT-P to Chemical Extraction
When the DGT-P is compared to the chemical extraction results (Table 4.2), it is seen that
the ion exchangeable phase closely corresponds to the DGT-P. This result may mean
that the DGT technique measures the ion-exchangeable P. However, the ion
exchangeable P was only released from the sediment by means of a chemical extraction.
Linge (2002) found that P release in a sediment slurry was controlled by the dissolution
of an amorphous Fe-P oxyhydroxide. While possible that ion exchangeable P has been
released in the sediment slurry, this can only be confirmed with future work. Another
explanation for the similarity between the two results is that the DGT technique may
measure a form of P that is present in the same magnitude as the ion exchangeable
fraction.
Comparing DGT to a Fractionation Scheme
The DGT-P measured by this study is significantly higher than the dissolved P measured
by Linge (2002). This indicates that the DGT is not simply measuring porewater

Ben Annan Discussion______________________________________________________________________________
Centre for Water Research 65
concentrations. This indicates that the sediment slurry has induced P to be released
from the sediment; some of which is measured by the DGT technique.
Comparing DGT to measurements of FRP
Linge (2002) found that the FRP measured in a stirred slurry of Lake Yangebup sediment
continued to rise until steady state was reached at a value of approximately 30 ìg/g
after 24 hours. This is higher than the DGT-P (4.21 +/- 1.19 ìg/g), which reached
equilibrium with the slurry in at least one hour (Figure 5.2). This shows that the DGT
technique is measuring a more specific form of P than FRP. The small pore sizes in the
diffusive gel may prevent the colloidal P that pass through the filter from being bound to
the binding agent. Zhang and Oldham (2001) showed that typical sizes of colloidal
phosphorus in wetlands of the Swan Coastal Plain range from 1 nm – 0.5 ìm. The pore
sizes of the diffusive gels are roughly 2 – 5 nm in radius (Zhang and Davison 1999),
indicating the filtration of some colloidal P occurs.
Zhang et al. (1998) found that DGT measurements of P in a eutrophic pond in the U.K.
agreed closely with FRP measurements. The differences between this finding, and the
findings of this work may arise because Zhang et al. (1998) analysed water
concentrations, while this project measured sediment concentrations. Also, the water of
Lake Yangebup is extremely coloured, indicating a high organic content. The organic
content of the lake studied by Zhang et al. (1998) is unknown.

Ben Annan Discussion______________________________________________________________________________
Centre for Water Research 66
0.00
4.00
8.00
12.00
16.00
20.00
24.00
0 1 2 3 4 5
Deployment time (hrs)
Mas
s P
per
mas
s se
dim
ent
(ug
/g)
FRP
DGT-P
Figure 5.2: DGT-P measured in this study, compared to FRP measurements by Linge
(2002). FRP values continued to rise until 24 hours at a value of 30 ìg/g, while DGT-P
remained constant during the four hour measurement period.
FRP has been accepted as a measure of bioavailable P (Currie and Kalff 1984). However,
FRP has been shown to also measure colloidal P (Stainton 1980), which, due to the nature
of colloids, is not immediately bioavailable. Therefore, there exists a strong case of
evidence suggesting that the DGT technique measures the P that is most bioavailable.

Ben Annan Conclusions______________________________________________________________________________
Centre for Water Research 67
6 Conclusions
This project investigated the application of the diffusive gradients in thin-films (DGT)
technique to measure sediment phosphorus. Validation tests were performed before the
DGT technique was used in a sediment slurry.
6.1 DGT Validation Tests
The validation tests determined there were significant differences in the binding gels
ability to accumulate P. The greatest differences occurred between gel sheets made from
different binding gel solutions. Smaller variations also occurred between gel sheets
made from the same gel solution, and also within gel sheets.
These differences have been attributed the preparation of the gels. The largest cause of
variation was the addition of ferrihydrite to the gel solutions. However, the casting
procedure also created gels with different properties.
The extremely large variations measured for smaller gel cuttings, as opposed to the
larger gel discs, indicates there is a critical size required for the gels to overcome
heterogeneities.
6.2 Sediment Phosphorus Measurements
The DGT technique can be successfully applied to measure phosphorus in sediment
slurries. The DGT-measurable-P (DGT-P) closely agreed with ion exchangeable P
measured by chemical extraction. However, determining if the two techniques actually
measure the same form of phosphorus requires further investigation.
DGT-P measurements stayed constant for 4 hours, indicating that steady state had been
reached. The DGT-P is less than FRP measured in previous studies of Lake Yangebup.
Therefore, DGT-P may be a more accurate measurement of bioavailable P. However, this
needs to be investigated further.

Ben Annan Future Work______________________________________________________________________________
Centre for Water Research 68
7 Recommendations for Future Work
This project has thoroughly investigated all aspects of the application of DGT to measure
sediment phosphorus. The potential causes of variations in results have been identified,
and these issues need to be addressed in future work.
7.1 DGT Validation
Binding Gels
This work has shown there are many levels of potential error associated with the
binding gels. Further work needs to be carried out to address these issues. Firstly, it is
recommended that several ferrihydrite slurries be made, and tested in the initial stages
of any future project. The properties of binding gels prepared from the different slurries
should be extensively tested. X-ray diffraction measurements should be performed on
the slurry to monitor possible goethite or hematite formation.
Methods should be applied to the casting procedure to ensure the creation of more
homogenous gels. An investigation into a clamping system that provides uniform
pressure over the casting unit is recommended. It is also recommended to monitor the
volume of the gel inserted into the casting unit.
Diffusion Coefficient
It is possible that the use of the Zhang et al. (1998) diffusion coefficient for this project
resulted in the variations seen in DGT performance. Therefore, it is recommended that
self measurements of diffusion coefficient should be made.
7.2 Sediment Measurements
This project has provided a good basis to determine the type of phosphorus measured
by DGT deployments in sediment slurries. Although, any definite conclusions require
further investigation.

Ben Annan Future Work______________________________________________________________________________
Centre for Water Research 69
The close agreement between the two results suggests that DGT-P may be measuring ion
exchangeable P. A method for confirming this hypothesis is to deploy DGT units in the
supernatant after the chemical extraction has been applied. This would require larger
volumes of extraction solution than used in this project. It is recommended that DGT
units be deployed in all chemical extraction solutions.
This project has provided a strong case of evidence suggesting that the DGT technique
measures bioavailable P. However, more work needs to be performed to confirm this
hypothesis. It is recommended that DGT-P be compared to measurements of
bioavailable P using algal bioassays.

Ben Annan References______________________________________________________________________________
Centre for Water Research 70
References
Bell, F. 1997, An investigation of dissolved arsenic dynamics in Yangebup Lake, Honours
Thesis, University of Western Australia.
Bostrom, B., Jannson, M. and Forsbeg, C. 1982, ‘Phosphorus release from lake
sediments’, Arch. Hydrobiol. Beih. Ergebn. Limnol., vol. 18, pp. 5 – 59.
Boulton, J.A. and Brock, M.A. 1999, Australian Freshwater Ecology: Processes and
Management, Gleneagles Publishing, Australia.
Chang, S.C. and Jackson, M.L. 1956, ‘Fractionation of soil phosphorus’, Soil Science, vol.
84, pp. 133 – 144.
Currie, D.F. and Kalff, J. 1984 ‘The relative importance of bacterioplankton and
phytoplankton in phosphorus uptake in freshwater’, Limnology and Oceanography., vol.
29, pp. 311 – 321.
Dahlqvist, R., Zhang, H., Ingri, J. and Davison, W. 2002, ‘Performance of the diffusive
gradients in thin films technique for measuring Ca and Mg in freshwater’, Analytica
Chimica Acta, vol. 460, pp. 247 – 256.
Davis J.A., Rosich, R.S. Bradley, J.S., Growns, J.E., Schmidt, L.G. and Cheal, F. 1993,
Wetlands of the Swan Coastal Plain: Volume 6: Wetland Classifications on the Basis of
Water Quality and Invertebrate Community Data, Water Authority of WA/EPA, Western
Australia.
Davison, W. and Zhang, H. 1994, ‘In situ speciation measurements of trace components
in natural waters using thin-film gel’, Nature, vol. 367, pp. 546 – 548.

Ben Annan References______________________________________________________________________________
Centre for Water Research 71
Davison, W., Fones, G., Harper, M., Teasdale, P. and Zhang, H. 2000, ‘Dialysis, DET and
DGT: in situ diffusional techniques for studying water, sediments and soils’, in In situ
monitoring of aquatic systems chemical analysis and speciation, eds. Buffle, J. and Horvari, G.,
Wiley and Sons, New York, pp. 495 – 569.
Deurer, R., Förstner, U. and Shmoll, G. 1978 ‘Selective chemical extraction of carbonate-
associated metals from recent lacustrine sediments’, Geochimica et Cosmochimica Acta, vol.
42, pp. 425-427.
Emsley, J. and Hall, D. 1976, The chemistry of phosphorus: environmental, organic, biochemical
and spectroscopic aspects, Harper and Row, Devon.
Emsley, J. 1980, ‘The phosphorus cycle’, in The handbook of organic chemistry, ed.
Hutzinger, O., Springer Verlag, Berlin.
Forstner, U. 1990, ‘Inorganic sediment chemistry and elemental speciation’ in Sediments:
chemistry and toxicity of in-place pollutants, eds. Baudo, R., Giesy, J. and Muntau, H.,
Lewis Publishers, Ann Arbor.
Harper, M.P., Davison, W., Zhang, H. and Tych, W. 1998, ‘Kinetics of metal exchange
between solids and solutions in sediments and soils interpreted from DGT measured
fluxes’, Geochimica et Cosmochimica Acta, vol. 62, no. 16, pp. 2757 – 2770.
Kaiserli, A., Vousta, D., Samara, C. 2001, ‘Phosphorus fractionation of lake sediments –
Lakes Volvi and Koronia, N. Greece’, Chemosphere, vol. 46, pp. 1147 – 1155.
Kramer, J.K., Herbes, S.E. and Allen, H.E. 1972, ‘Phosphorus: analysis of water, biomass
and sediment’, in Nutrients in natural waters, eds. Allen, H.E. and Kramer, J.K., John
Wiley and Sons, New York, pp. 51 – 100.
Ben Annan References______________________________________________________________________________
Centre for Water Research 72
Lennox, L.J. 1984, ‘Lough Ennel: laboratory studies on sediment phosphorus release
under varying mixing, aerobic and anaerobic conditions’, Freshwater Biology, vol. 14, pp.
183 – 197.
Li, W., Zhao, H., Teasdale, P.R., John, R. and Zhang, S. 2002, ‘Application of cellulose
phosphate ion exchange membrane as a binding phase in the diffusive gradients in thin
films technique for measurements of trace metals’, Analytica Chimica Acta, vol. 464, pp.
331 – 339.
Linge, K.L. 2002, Assessment of contaminant availability in a shallow wetland, PhD Thesis,
University of Western Australia.
Linge, K.L. and Oldham, C.E. 2001, ‘Interference from arsenate when determining
phosphate by the malachite green spectrophotometric method’, Analytica Chimica Acta,
vol. 450, pp. 247 – 252.
Murdock, C., Kelly, M., Chang, L.Y., Davison, W. and Zhang, H. 2001, ‘DGT as an in situ
tool for measuring radiocesium for natural waters’, Environ. Science and Technology, vol.
35, pp. 4530 – 4535.
Pickering, W.F. 1986, ‘Metal ion speciation – soils and sediments (a review)’, Ore Geology
Review, vol. 1, pp. 83-146.
Rao, A.S., Reddy, K.S. and Takkar, P.N. 1997, ‘Malachite green method compared to
ascorbic acid for estimating small amounts of phosphorus in water, 0.01 M calcium
chloride, and Olsen soil extracts’, Communications in Soil Science and Plant Analysis, vol.
26, pp. 589 – 601.
Reynolds, C.S. and Davies, P.S. 2001, ‘Sources and bioavailability of phosphorus
fractions in freshwaters: a British perspective’, Biological Reviews of the Cambridge
Philosophical Society, vol. 76, no. 1, pp. 27 – 64.

Ben Annan References______________________________________________________________________________
Centre for Water Research 73
Ruttenberg, K.C. 1992, ‘Development of a sequential extraction method for different
forms of phosphorus in marine sediment’, Limnology and Oceanography, vol. 37, pp. 1460-
1482.
Senesi, N. and Loffredo, E. 1999, ‘The chemistry of soil organic matter’, in Soil physical
chemistry, ed., Sparks, D. L., CRC, Boca Raton, pp. 239-370.
Sharpley, A.N., Troeger, W.W. and Smith, J.S. 1991, ‘The measurement of bioavailable
phosphorus in agricultural runoff’, Journal of Environmental Quality, vol. 20, pp. 235 –
238.
Shuttleworth, S.M., Davison, W. and Hamilton-Taylor, J. 1999, ‘Two-dimensional and
fine structure in the concentrations of iron and manganese in sediment pore-waters’,
Analytica Chimica Acta, vol. 33, pp. 4169 – 4175.
Stainton, M.P. 1980, ‘Errors in molybdenum blue methods for determining
orthophosphate in freshwater’, Canadian Journal of Fisheries and Aquatic Sciences, vol. 37,
pp. 472 – 478.
Syres, J.K., Harris, R.F. and Armstrong, D.E. 1973, ‘Phosphate chemistry in lake
sediments’, Journal of Environmental Quality, vol. 2, no. 1, pp. 1 – 14.
Teasdale, P.R., Hayward, S. and Davison, W. 1999, ‘In situ, high resolution measurement
of dissolved sulfide using diffusive gradients in thin films with computer-imaging
densitometry’, Analytical Chemistry, vol. 71, no. 11, pp. 2186 – 2191.
Webb, J.A. and Keough, M.J. 2002, ‘Quantification of copper doses to settlement plates in
the field using diffusive gradients in thin films’, the Science of the Total Environment,
article in press.

Ben Annan References______________________________________________________________________________
Centre for Water Research 74
Williams, J.D.H. and Mayer, T. 1972, ‘Effects of sediment diagenesis and regeneration of
phosphorus with special reference to Lakes Erie and Ontario’, in Nutrients in natural
waters, eds Allen, H.E. and Kramer, J.K., John Wiley and Sons, New York, pp. 281 - 316.
Williams, J.D.H., Syers, J.K., Harris, R.F. and Armstrong, D.E. 1971, ‘Fractionation of
inorganic phosphate in calcareous lake sediments’, Soil Science Society of America Journal,
vol. 35, pp. 551 – 561.
Windsor Scientific Limited - Diffusive Gradient Films. (5th August 2002), Windsor
Scientific Limited, [online], available from http://www.windsort-ltd.co.uk/dgt.htm
[21st April 2002].
Zhang, A. and Oldham, C. 2001, ‘The use of an ultrafiltration technique for measurement
of orthophosphate in shallow wetlands’, the Science of the Total Environment, vol. 266, pp.
159 – 167.
Zhang, H. and Davison, W. 1995, ‘Performance characteristics of diffusion gradients in
thin films for the in situ measurement of trace metals in aqueous solution’, Analytica;
Chemistry, vol. 67, pp. 3391 – 3400.
Zhang, H., Davison, W., Miller, S. and Tych, W. 1995, ‘In situ high resolution
measurements of fluxes of Ni, Cu, Fe and Mn and concentrations of Zn and Cd in
porewaters by DGT’, Geochemica et Cosmochimica Acta, vol. 59, no. 20, pp. 4181 – 4192.
Zhang, H., Davison, W., Gadi, R. and Kobayashi, T. 1998, ‘In situ measurement of
dissolved phosphorus in natural waters using DGT’, Analytica Chimica Acta, vol. 370, pp.
29 – 38.

Ben Annan References______________________________________________________________________________
Centre for Water Research 75
Zhang, H., Davison, W., Knight, B. and McGrath, S. 1998b, ‘In situ measurement of
solution concentrations and fluxes of trace metals in soils using DGT’, Environmental
Science and Technology, vol. 32, no. 5, pp. 704 – 710.
Zhang, H. and Davison, W. 1999, ‘Diffusional characteristics of hydrogels used in DGT
and DET techniques’, Analytica Chimica Acta, vol. 398, pp. 329 – 340.
Zhang, H., Teasdale, P.R., Waterhouse, K. and Davison, W. 1999b, ‘Multi-elements
determination of metal species in natural waters using DGT with ICP-MS detection’,
Analyst, article in press.