Demo/Work Session Developing a Simple Energy Network...Guenter Conzelmann. Center for Energy,...
41
Demo/Work Session Developing a Simple Energy Network Workshop on Developing National Long-Range Nuclear Energy Strategies Argonne, August 8-19, 2011 Guenter Conzelmann Center for Energy, Environmental, and Economic Systems Analysis Decision and Information Sciences Division (DIS) Argonne National Laboratory 9700 South Cass Avenue Argonne, IL 60439
Transcript of Demo/Work Session Developing a Simple Energy Network...Guenter Conzelmann. Center for Energy,...

Demo/Work SessionDeveloping a SimpleEnergy Network
Workshop on Developing National Long-Range Nuclear Energy Strategies
Argonne, August 8-19, 2011
Guenter ConzelmannCenter for Energy, Environmental, and Economic Systems AnalysisDecision and Information Sciences Division (DIS)Argonne National Laboratory9700 South Cass AvenueArgonne, IL 60439

Introductory Points
This is a simple exercise– Simple model approach– Simple case configuration
Exercise is meant to show the influence of various parameters– Technical– Economic– Environmental
Please work in teams in case we have insufficient number of computers/laptops– It’s more fun, too
We will walk you through the development of the initial case study– You will then run various scenarios (with our help)
Discussions could focus on findings, explanations for results, limitations of the model and model setup, and the need for more complex tools
2
ENPEP‐BALANCE Determines the Equilibrium Supply/Demand Balance of the Energy System
3
SupplyDemand
Equilibrium
INPUT
Energy systemstructure
Base year energyflows and prices
Energy demandgrowth projections
Technical andpolicy constraints
BALANCE
OUTPUT
Quantity
Price/Cost

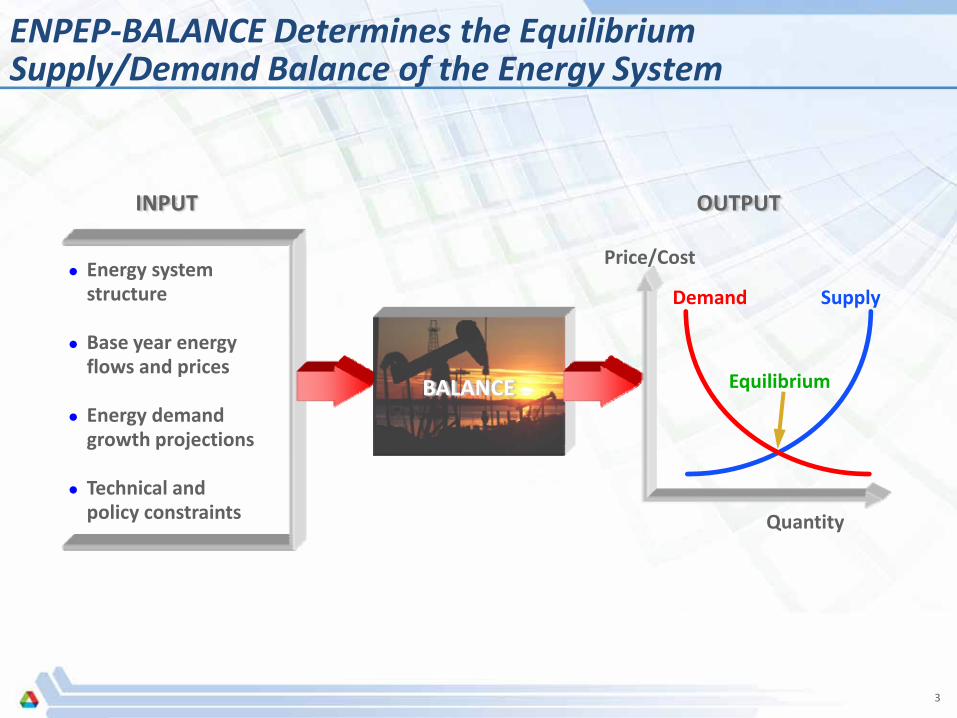
ENPEP‐BALANCE Uses an Energy Network to Simulate Energy Markets (We will Focus on Electricity ONLY)
4
Transmission and Distribution of Oil Products, Coal, Electricity, and Other Fuels/Resources
Residential PaperIndustry
OtherIndustry
Food Proc.Industry
Agriculture& Fishing Transport Commercial
CementIndustry
ChemicalIndustry
CeramicIndustry
TextileIndustry
Electric Sector
Oil and Gas Supply Sector Coal Sector Supply Sector Renewables and Others Sector
Networks are Organized into Sectors
5

Network Sectors Consist of Nodes and Links
6

The Following Node Types are Available to Model Different Energy Activities
7
Demand
Conversion Processes
Resource Processes
Economic Processes
Electricity Dispatch andThermal and Hydro Units
Single In‐/Output Multi Output Multi Input Transport
Depletable Renewable
Decision/Allocation Pricing
Central Dispatch Thermal Unit Hydro Unit

ENPEP‐BALANCE Uses a Logit‐Function to Estimate Market Shares of Competing Commodities at the Decision Node
8
0.0
0.5
1.0
0.00 0.25 0.50 0.75 1.00 1.25 1.50 1.75 2.00Relative Price (P1/P2)
Mar
ket S
hare
Pro
duct
1
y = 1 y = 3 y = 5 y = 10 y = 50
Increasingprice sensitivity
γ price sensitivity forthis decision process
MS: market share
P: price
PM:Q: quantity
premium multiplier
MS 1 =Q 1
Q 1 + Q2
=
1P1 x PM1
γ
+1
P1 x PM 1
γ1
P2 x PM 2
γDecision
P1 Q1 P2 Q2
Qdemand

The ENPEP‐BALANCE Nonlinear Equilibrium Algorithmis Based on Decentralized Decision MakingMarket share calculation assumes “ideal market” subject to government policies, fuel availability, and market constraintsA lag factor accounts for delays in capital stock turnoverThe result is a nonlinear, market‐based equilibrium solutionwithin policy constraints, not a simple, linear optimizationNo single person or organization controls all energy prices and decisions on energy useAll decision makers make their energy choices based on their own needs and desires
9
0.0
0.5
1.0
0.00 0.25 0.50 0.75 1.00 1.25 1.50 1.75 2.00Relative Price (P1/P2)
Mar
ket S
hare
Pro
duct
1
y = 1 y = 3 y = 5 y = 10 y = 50
ENPEPSimulation
0.0
0.5
1.0
0.00 0.50 1.00 1.50 2.00 2.50Relative Price (P1/P2)
Mar
ket S
hare
Pro
duct
1
Optimization

Network for our Simple Case Study – We will Start with One Sector (Electric) and 2 Power Plants
10

Later, we will Add one more Technology to the Mix and Change the Configuration Slightly
11

Configuration of the Simple Case Study
Two fuel sources– Coal– Natural gas
Two power plants (conversion processes)– Coal power plant– Natural gas power plant
One decision point/node– Choice between electricity from coal or gas
One demand node: Electricity
Study period: 30 years, 2009‐2038
12

Steps in Developing the Simple Case Study
Prepare the power system structure (see Steps 1 – 10 on following slides)– Draw the system using nodes and links– Label each system element• Each link and node has a name and abbreviation
Execution Step 1: Validate network structure– Click on “up‐down”– Necessary when arrows are RED
Enter the input data
Execution Step 2: Run the simulation– Click on “Run BALANCE”– Necessary when face is RED (sad)
Review and interpret the results
13
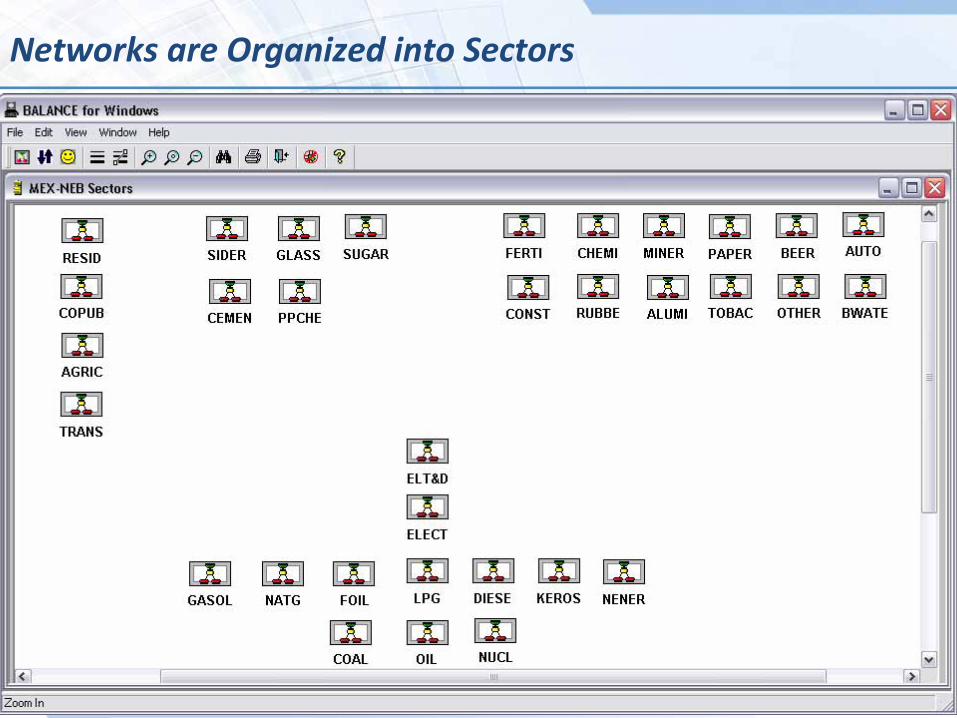
STEP 1: Create a New DATABASE
14
(1) Click NEW
(3) Enter name of new database, e.g., Simple_Exercise
(4) Click SAVE
(2) Use the pulldown to choose the folder where you want to save the
database

STEP 2: Open the New Database; Highlight the Nameand Double‐click
15
Double‐click here

STEP 3: Create a New CASE
16
(1) Click ADD
(2) Enter Name, Abbreviation, Description, Start Year, and End
Year(3) Click OK

Step 4: Open the New Case ; Highlight the Nameand Double‐click
17
Double‐click here

Step 5: Create New Sector and Name the Sector
18
(1) Click on ADD SECTOR icon
(2) Move the mouse to where you want to place the sector and
click
(3) Enter Name, Abbreviation,
Description, and click OK

Step 6: Enter the Sector by Double‐clicking
19
Double‐click the sector

Step 7: Use the Node Pull‐down Icon and Select the Node you Want to Include in the Sector
20
(1) Select Demand Node icon
(2) Move the mouse to where you want to place the node and
click
(3) Enter Name, Abbreviation,
Description, and click OK

Step 8: Repeat Step 7 for all Nodes in the Network
Allocation node– Name: Decision node– Abbreviation: Decis
Conversion process node 1– Name: Coal power plant– Abbreviation: CoaPP
Conversion process node 2– Name: Gas power plant– Abbreviation: GasPP
Depletable resource node 1– Name: Coal resource– Abbreviation: Coal
Depletable resource node 2– Name: Natural gas resource– Abbreviation: Gas
21

Step 9: Use the “Add Link” Icon in the Menu to Draw the Links and to Connect the NodesStart at the bottom with the resourcesFROM – TO: Trace how energy flows from resource (bottom) to consumption (top)
22
(1) Click on Add Linkicon
(2) Move the mouse to the starting node
(FROM) and click the node
(4) Enter Name, Abbreviation, Description (optional), and click
OK
(3) Move the mouse to the finish node (TO) and click the node

Step 10: Repeat Step 9 for all Links in the Network
Gas resource to gas power plant– Name: gas– Abbreviation: gas
Coal power plant to decision node– Name: coal electricity– Abbreviation: co‐el
Gas power plant to decision node– Name: gas electricity– Abbreviation: gs‐el
Decision node to demand node– Name: electricity– Abbreviation: elect
23

Step 11: Validate Integrity of Network Structure
24
(1) Click on the Close icon to close the
sector
(2) Click on the up‐down icon to run the
validation

Step 11: Validate Integrity of Network Structure (cont’d)
25
(1) Click Yes to confirm
(2) Look for “Normal Termination and then
click OK
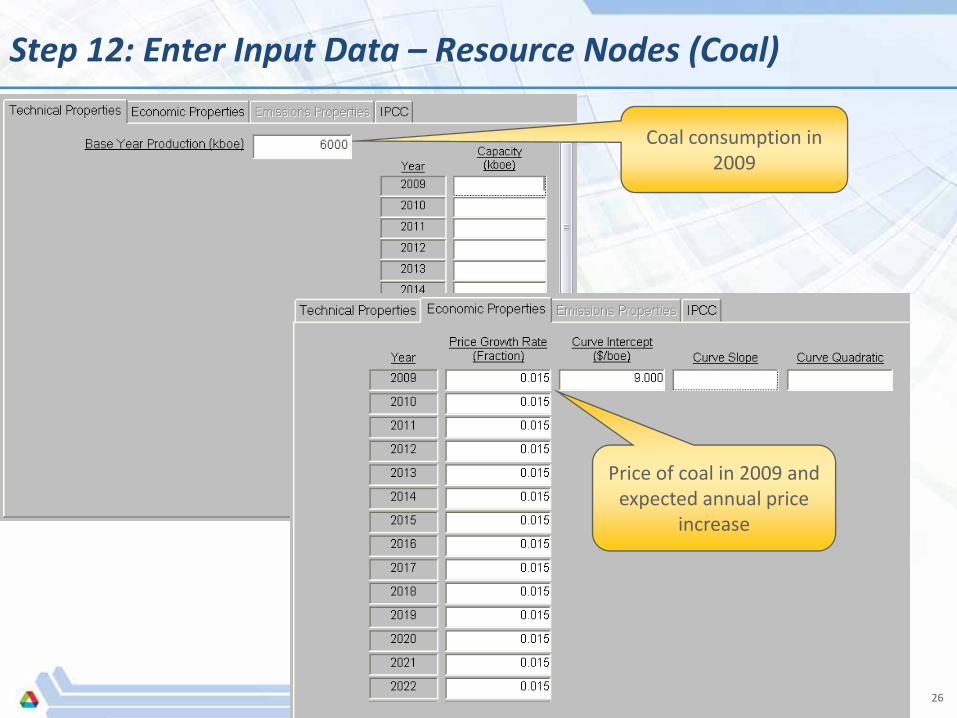
Step 12: Enter Input Data – Resource Nodes (Coal)
26
Coal consumption in 2009
Price of coal in 2009 and expected annual price
increase

Step 12: Enter Input Data – Resource Nodes (Gas)
27
Gas consumption in 2009
Price of gas in 2009 and expected annual price
increase

Step 13: Enter Input Data – Conversion Nodes (Coal Power Plant)
28
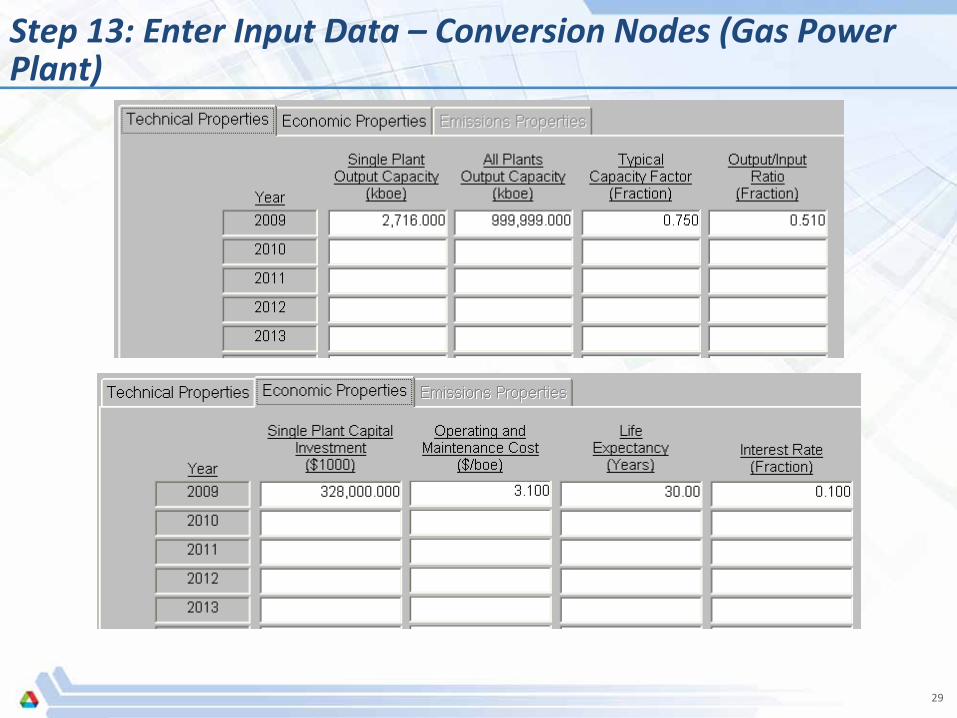
Step 13: Enter Input Data – Conversion Nodes (Gas Power Plant)
29

Step 14: Enter Input Data – Decision/Allocation Node
30

Step 15: Enter Input Data – Demand Node
31

Step 16: Run ENPEP‐BALANCE
32
(1) Click on the Close icon to close the
sector
(2) Click on the Run BALANCE icon to run
the simulation

Step 16: Run ENPEP‐BALANCE (cont’d)
33
(1) Click YES to confirm
(2) If no warnings and error messages, click
OK
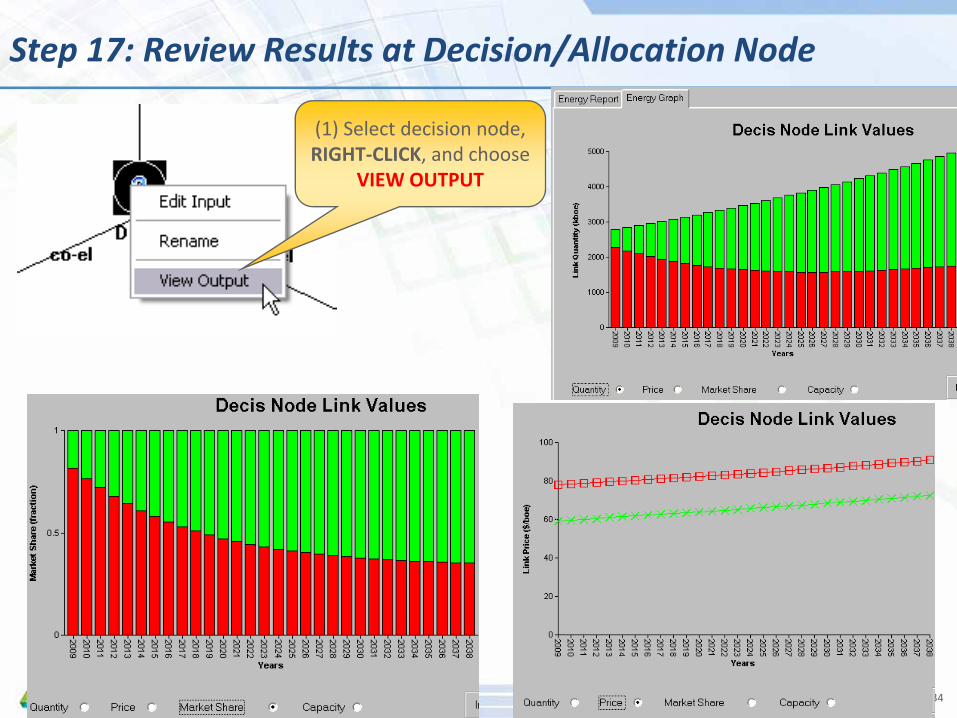
Step 17: Review Results at Decision/Allocation Node
34
(1) Select decision node, RIGHT‐CLICK, and choose
VIEW OUTPUT

Run the Following Scenarios and Interpret the Results
Higher price sensitivity (Decision/Allocation Node): 13
Different gas price scenario: 1% increaseuntil 2015, 4% starting in 2016
Effect of financing terms, for examplegas power plant: Interest rate of 25%
35

New Nuclear Power with Different Network Configuration
36

Step 1: Enter Input Data – Resource Nodes (Nuclear Fuel)
37

Step 2: Enter Input Data – Conversion Nodes (Nuclear Power Plant)
38

Step 3: Enter Input Data – Decision/Allocation Node
39
2009
2009
2010

Step 4: Review Results at Decision/Allocation Node
40
(1) Select decision node, RIGHT‐CLICK, and choose
VIEW OUTPUT

Run the Following Scenarios and Interpret the Results
Effect of financing terms, for example nuclear power plant: Interest rate of 18%
Effect of carbon price
41
2009
2010
2011
2009
2009
Gas plant; emission factor and carbon price
Coal plant; emission factor and carbon price