Demography of Russia and the Former Soviet Union Lecture 7 Sociology SOCI 20182.
Upload
ruby-boothCategory
view
220download
0
Demography of Russia and the Former Soviet Union
Lecture 3
Sociology SOCI 20182

Course website
http://course.health-studies.org/2010/
Basic population concepts
Population number and population distribution.
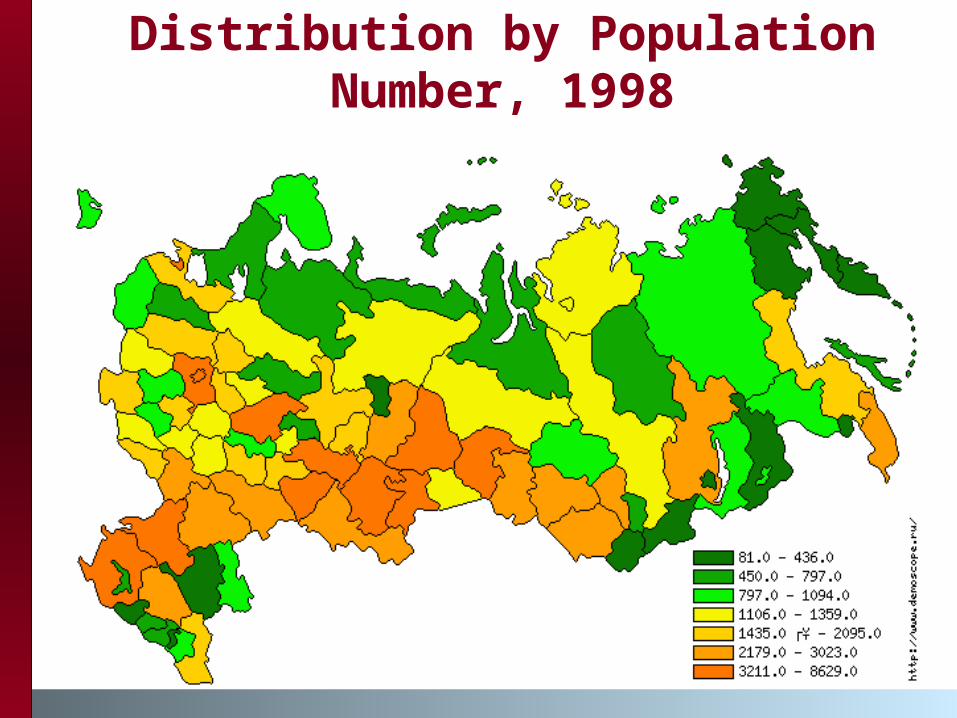
Distribution by Population Number, 1998
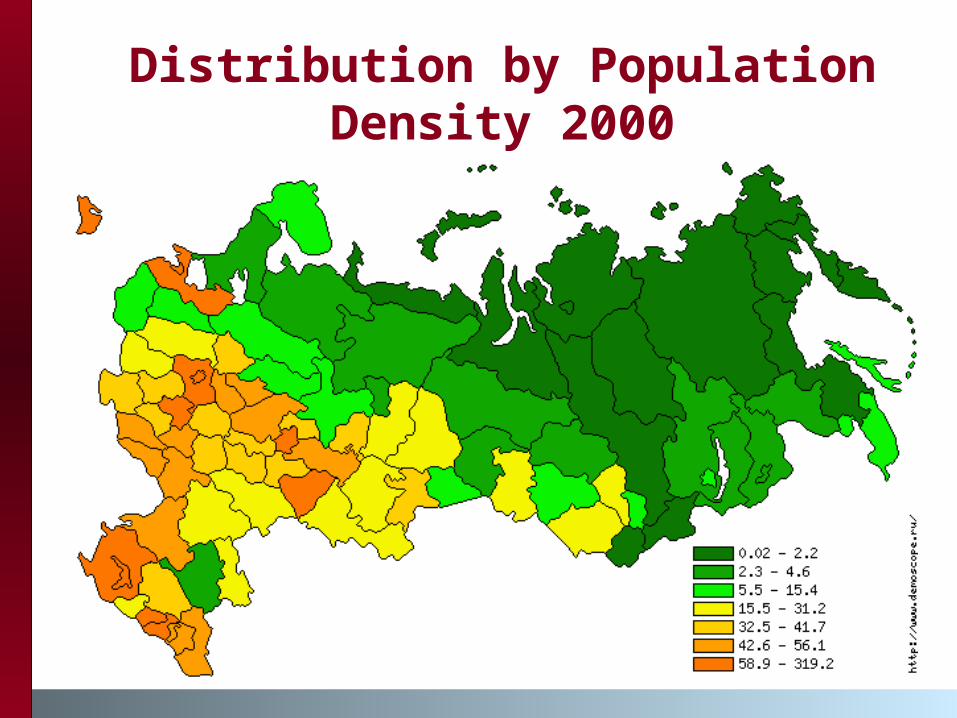
Distribution by Population Density 2000
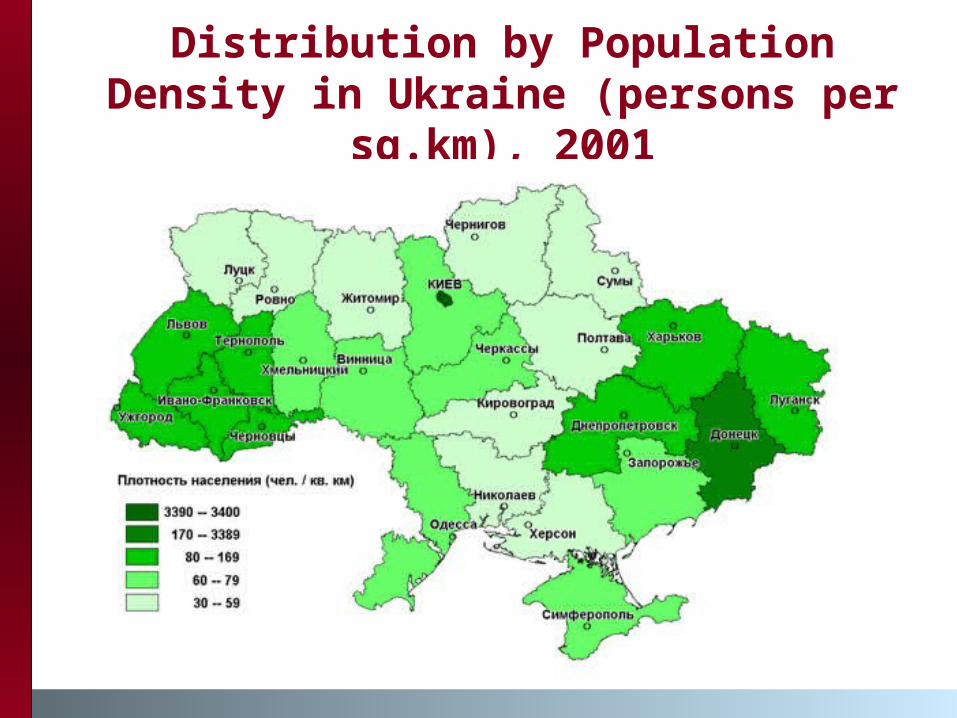
Distribution by Population Density in Ukraine (persons per sq.km),
2001
Population growth
Population natural movement – population changes due to births and deaths as natural processes in contrast to ‘mechanical’ changes due to migration
Population growth can be expressed in absolute numbers.
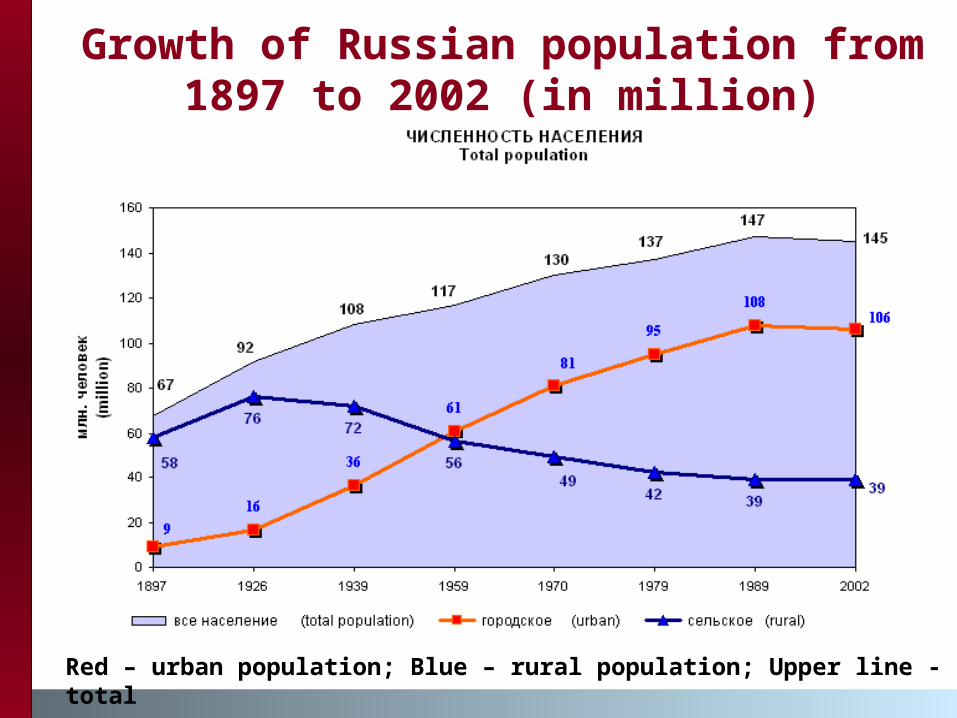
Growth of Russian population from 1897 to 2002 (in million)
Red – urban population; Blue – rural population; Upper line - total
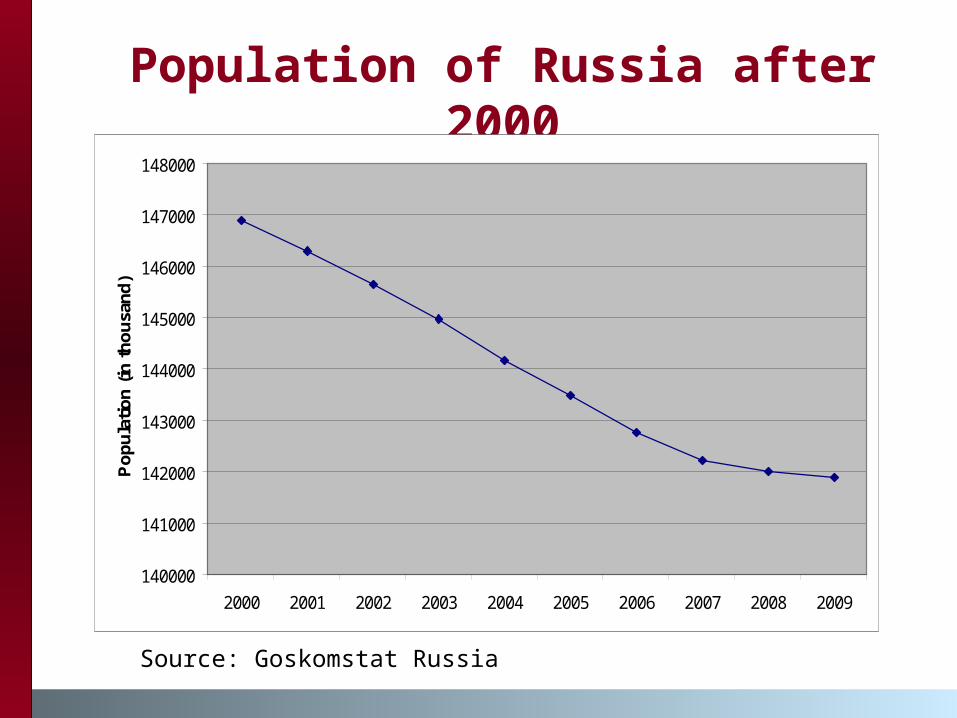
Population of Russia after 2000
140000
141000
142000
143000
144000
145000
146000
147000
148000
2000 2001 2002 2003 2004 2005 2006 2007 2008 2009
Po
pu
lati
on
(in
th
ou
san
d)
Source: Goskomstat Russia
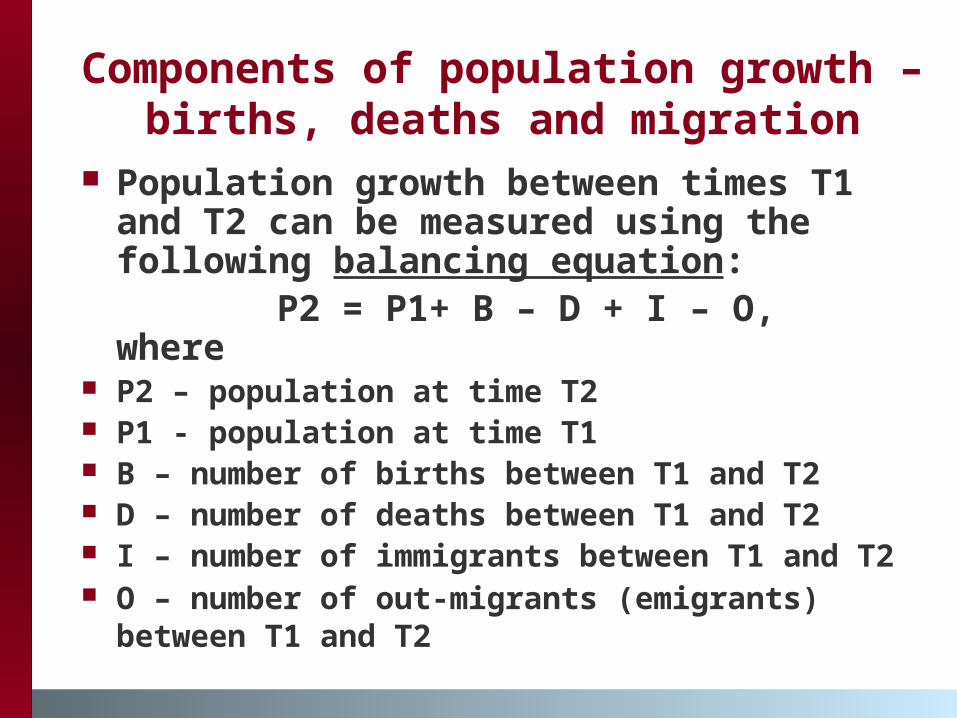
Components of population growth – births, deaths and migration
Population growth between times T1 and T2 can be measured using the following balancing equation:
P2 = P1+ B – D + I – O, where P2 – population at time T2 P1 - population at time T1 B – number of births between T1 and T2 D – number of deaths between T1 and T2 I – number of immigrants between T1 and
T2 O – number of out-migrants (emigrants)
between T1 and T2
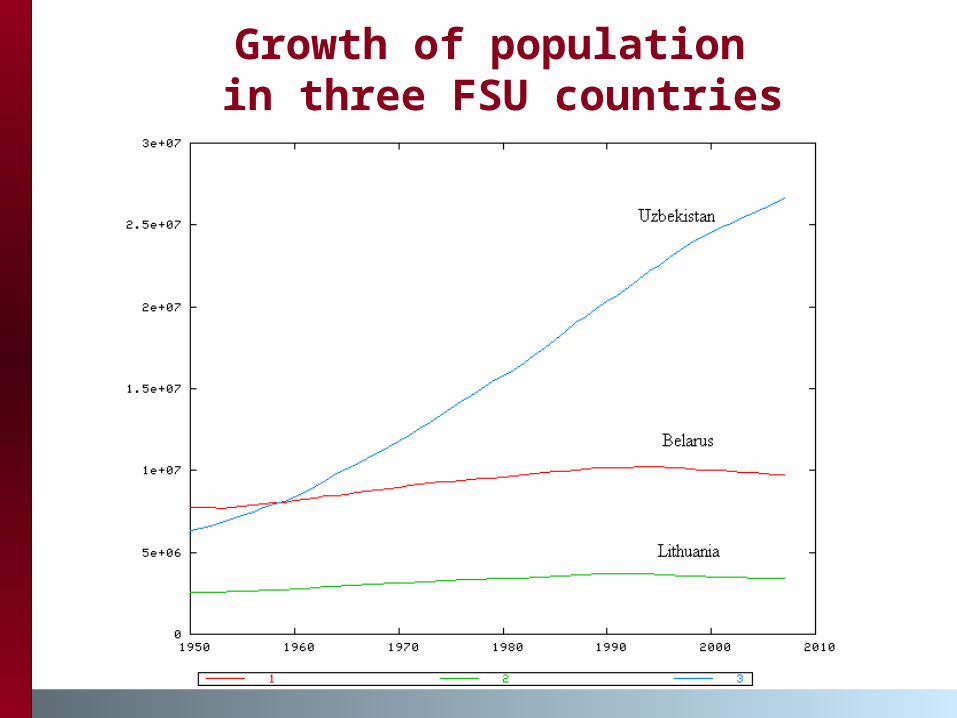
Growth of population in three FSU countries
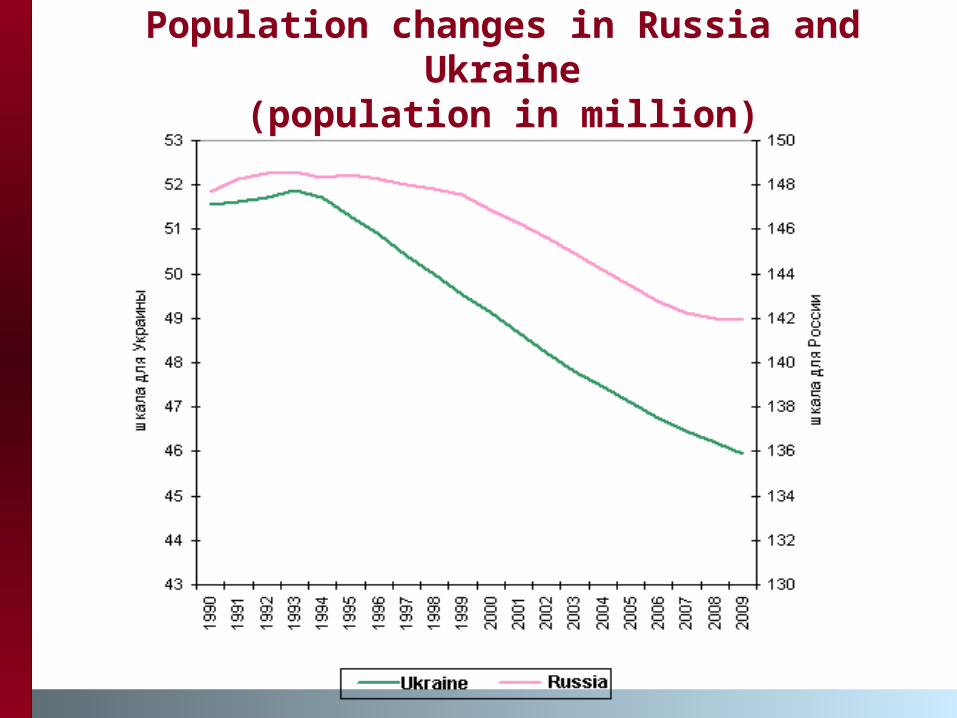
Population changes in Russia and Ukraine
(population in million)
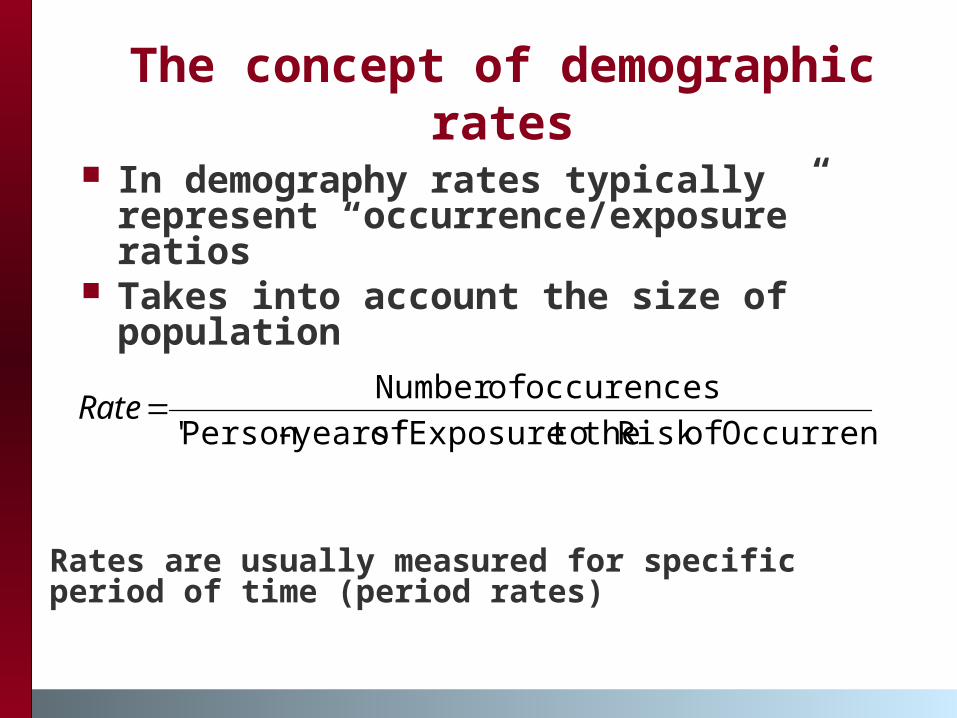
The concept of demographic rates
In demography rates typically represent “occurrence/exposure” ratios
Takes into account the size of population
Occurrence ofRisk the toExposure of years'-Person'
occurences ofNumber Rate
Rates are usually measured for specific period of time (period rates)

Growth rates in demography Population growth can be expressed using rates.
Helps to compare countries with different population numbers. Rates are measured for specific period of time (usually for one calendar year)
Crude Birth rate (CBR) – number of live births per 100,000 population during year X
Crude Death rate (CDR) - number of deaths per 100,000 population during year X
Rate of natural increase: CBR - CDR Rate of total increase: CBR – CDR + CMR CMR – crude migration rate per 100,000 = CRIM -
CROM CRIM – crude rate of In-migration; CROM – crude rate of
Out-migration. Both measured per 100,000 population.
Population decline or depopulation occurs when rate of total population increase becomes negative (population decrease)
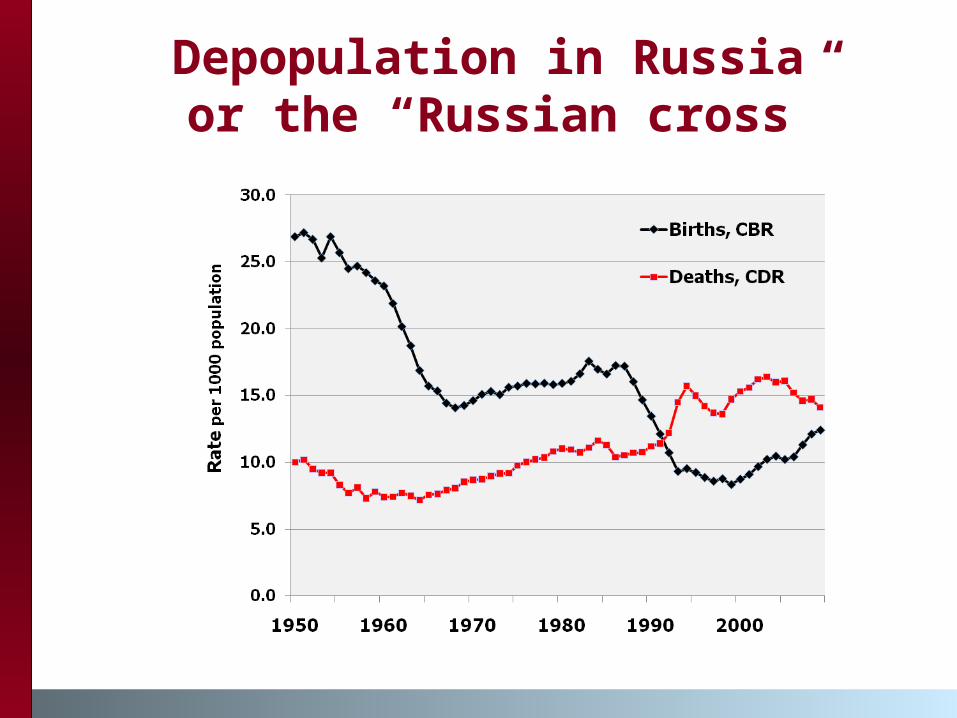
Depopulation in Russia or the “Russian cross”
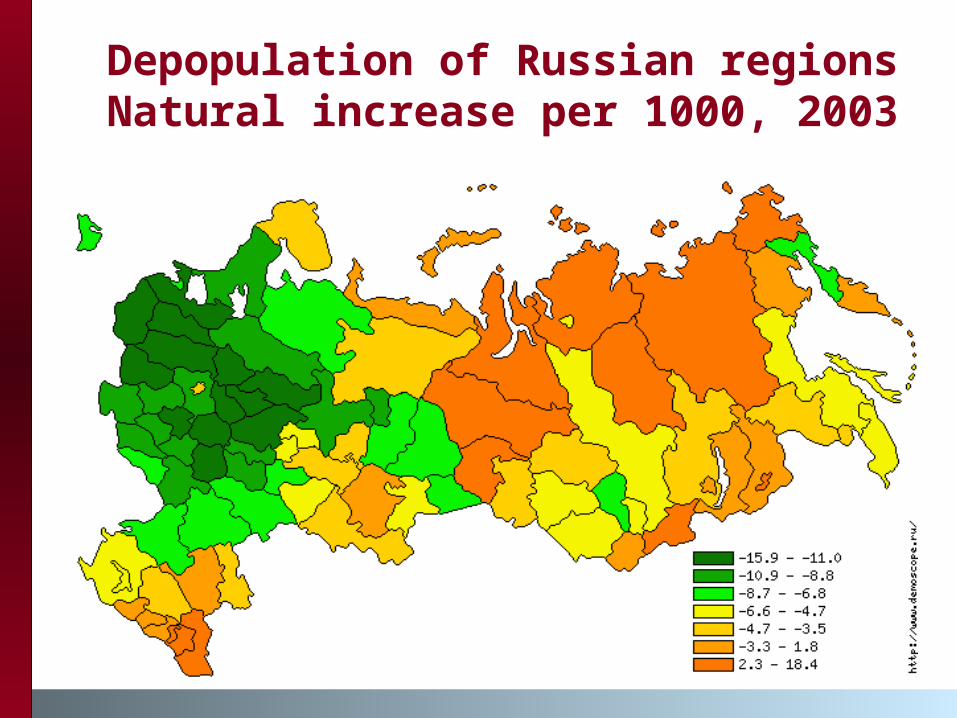
Depopulation of Russian regionsNatural increase per 1000, 2003
Administrative division in Russia
Types of regions Oblast – the most common type Kray – similar to oblast National republic – higher level of
autonomy National okrug – part of oblast, kray
or national republic Moscow and St. Petersburg are
counted separately by state statistics
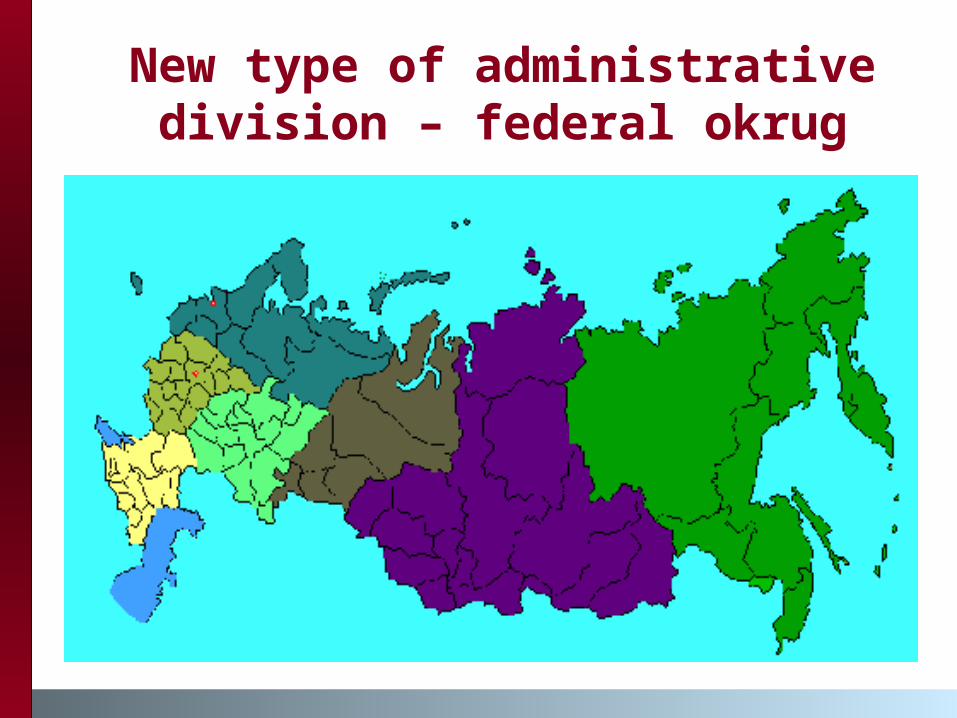
New type of administrative division – federal okrug
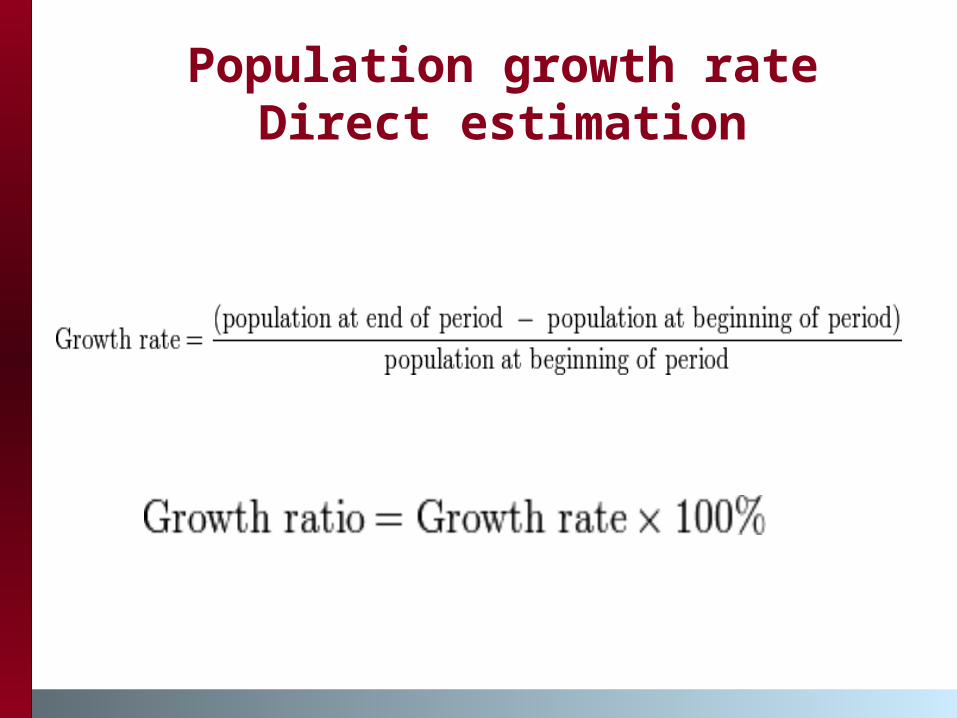
Population growth rateDirect estimation
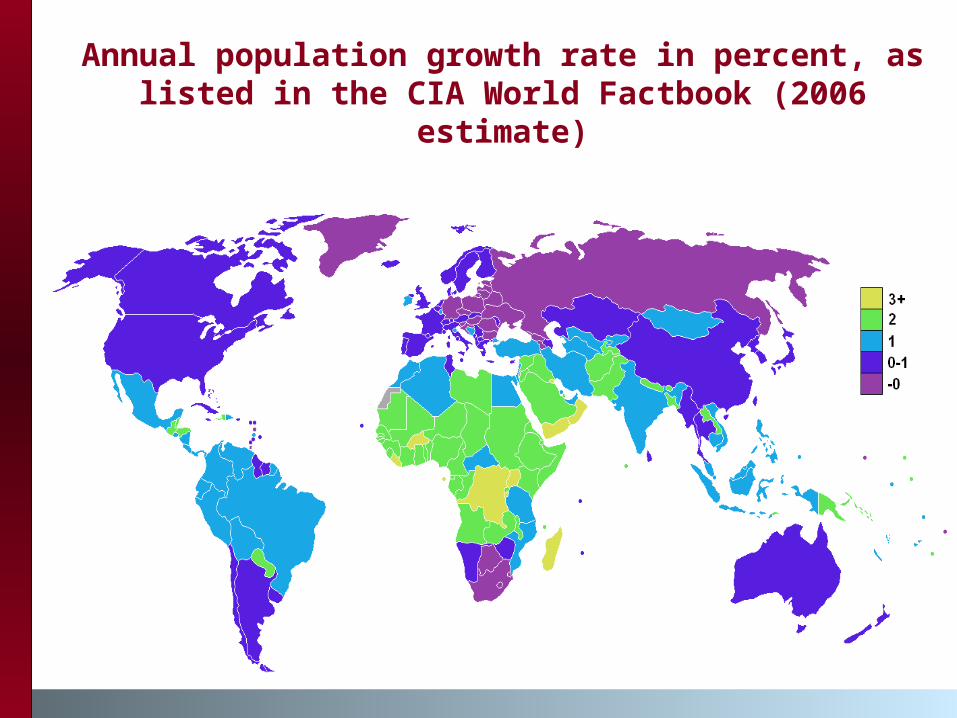
Annual population growth rate in percent, as listed in the CIA World Factbook (2006
estimate)
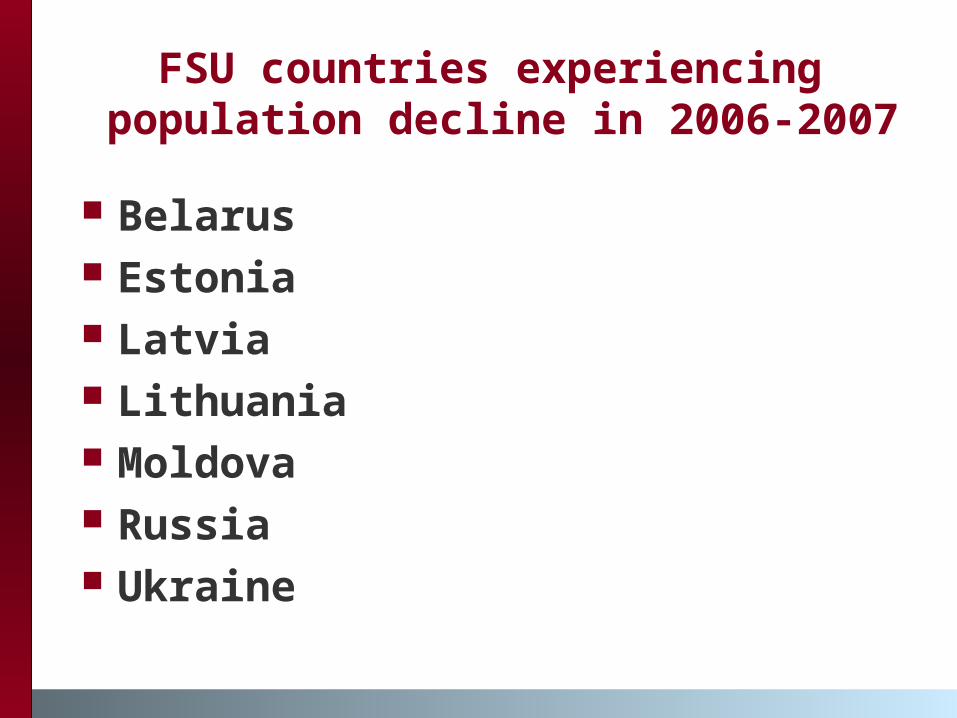
FSU countries experiencing population decline in 2006-2007
Belarus Estonia Latvia Lithuania Moldova Russia Ukraine

Percent growth in the FSU countries, 1999
Population structure Age and sex are the main components
of population structure Demographers commonly use
population pyramids to describe both age and sex distributions of populations. Youthful populations are represented by pyramids with a broad base of young children and a narrow apex of older people, and older populations are characterized by more uniform numbers of people in the age categories.
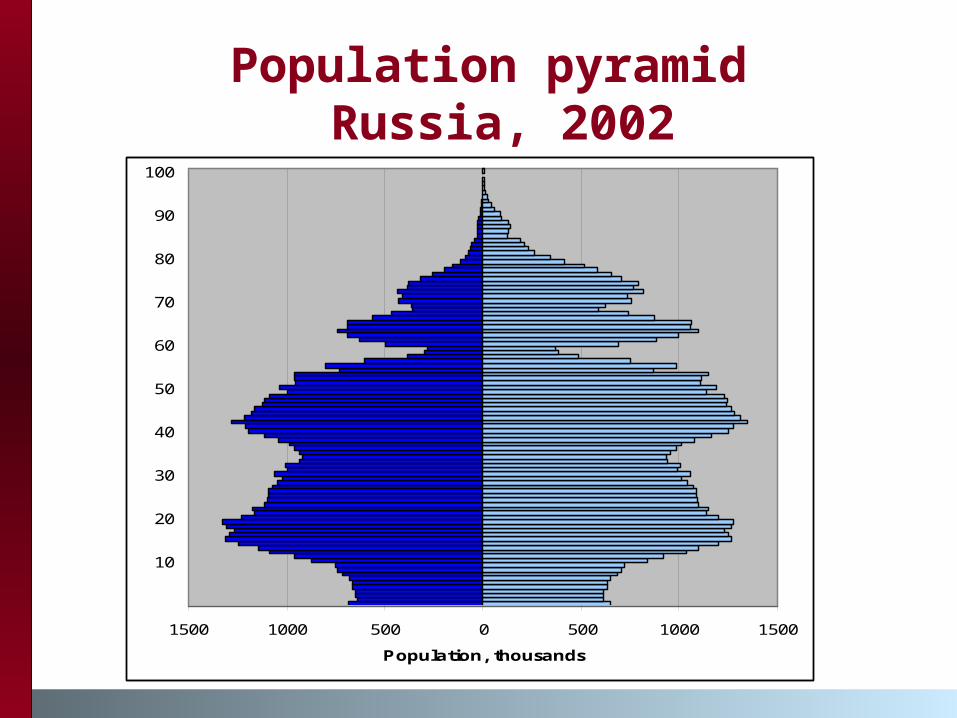
Population pyramid Russia, 2002
1500 1000 500 0 500 1000 1500
10
20
30
40
50
60
70
80
90
100
Population, thousands
Men Women
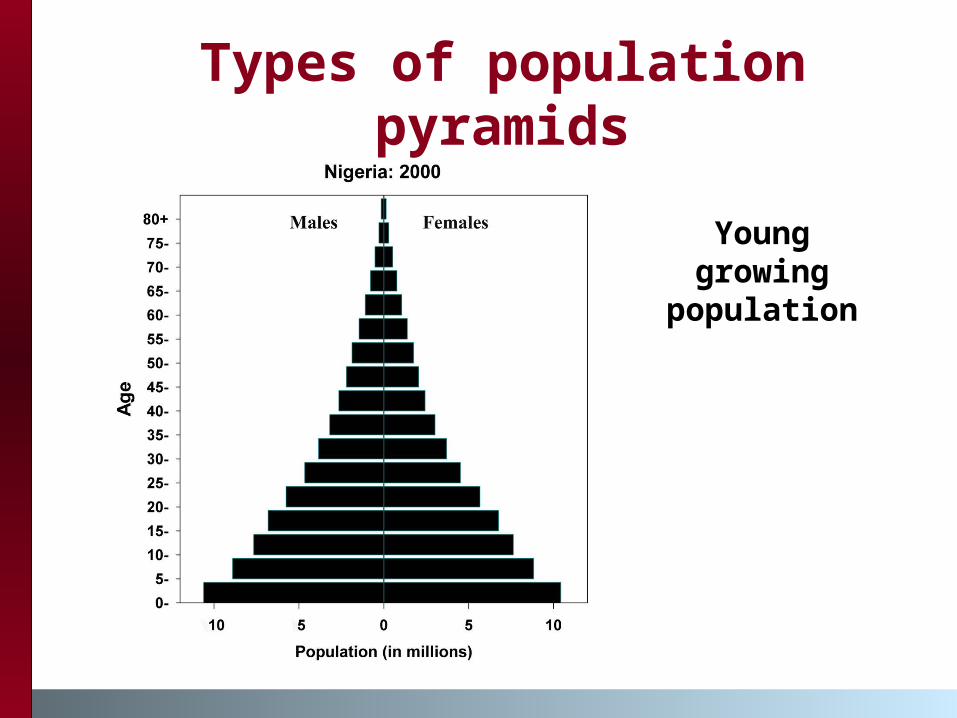
Types of population pyramids
Young growing
population
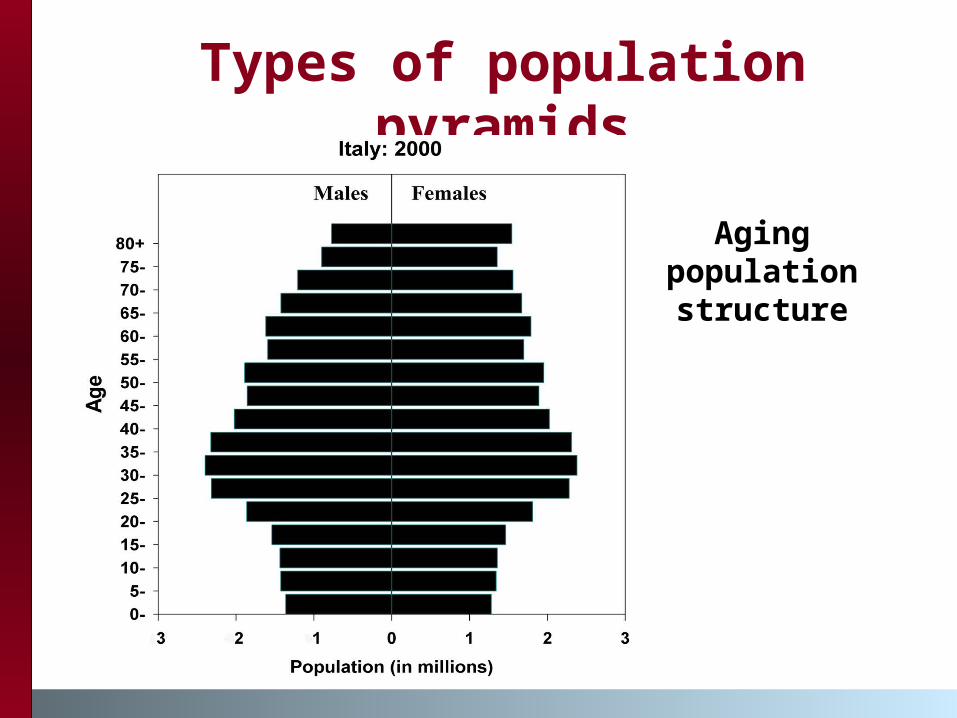
Types of population pyramids
Aging population structure
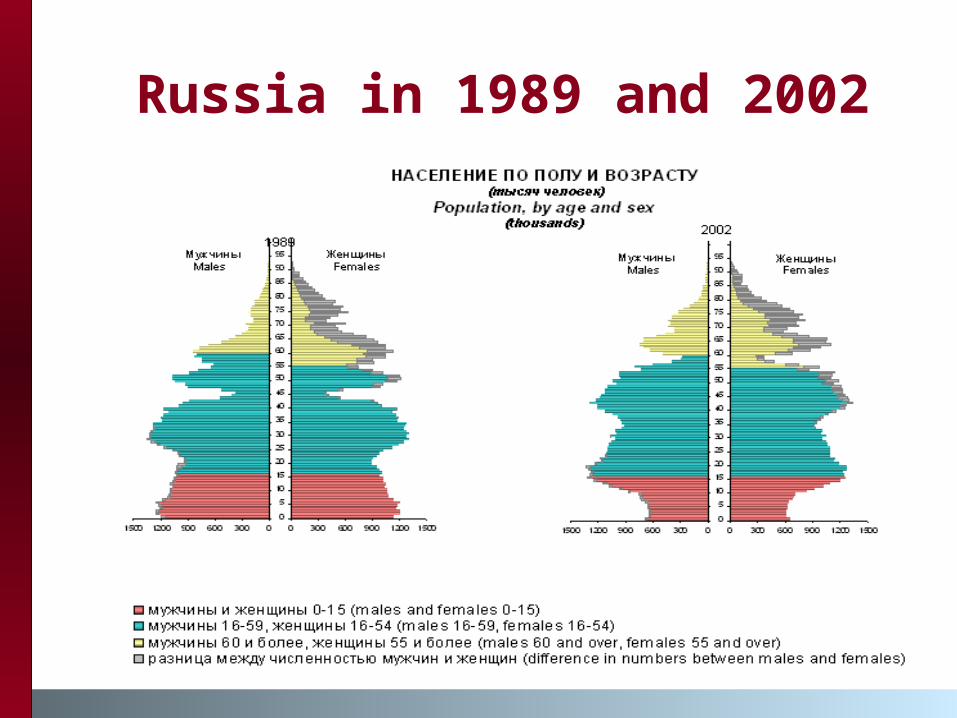
Russia in 1989 and 2002
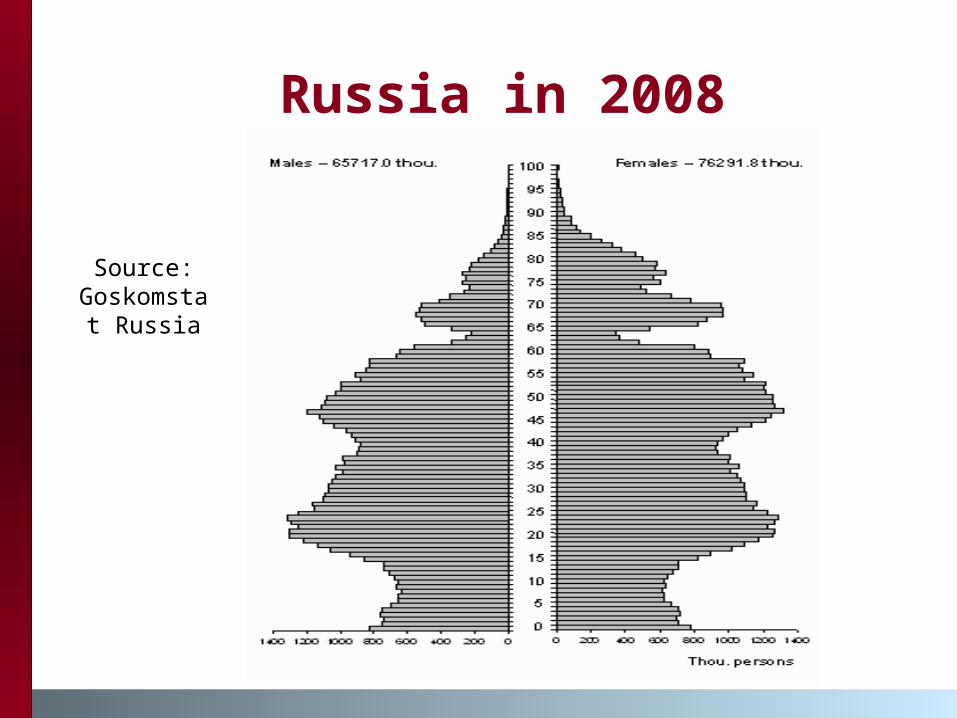
Russia in 2008
Source:Goskomstat
Russia
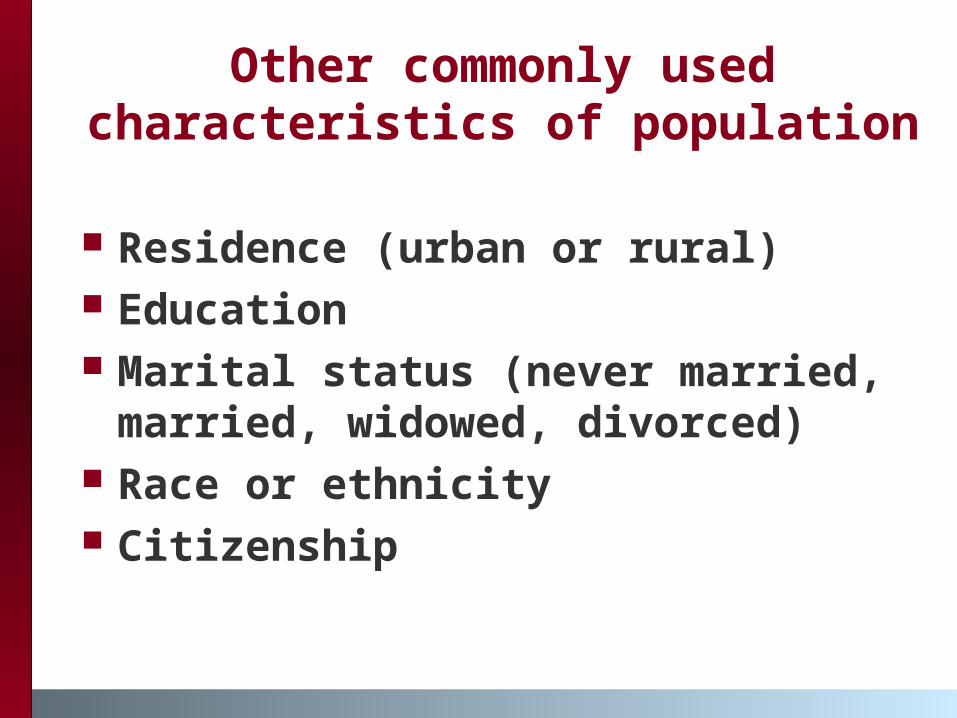
Other commonly used characteristics of population
Residence (urban or rural) Education Marital status (never married,
married, widowed, divorced) Race or ethnicity Citizenship
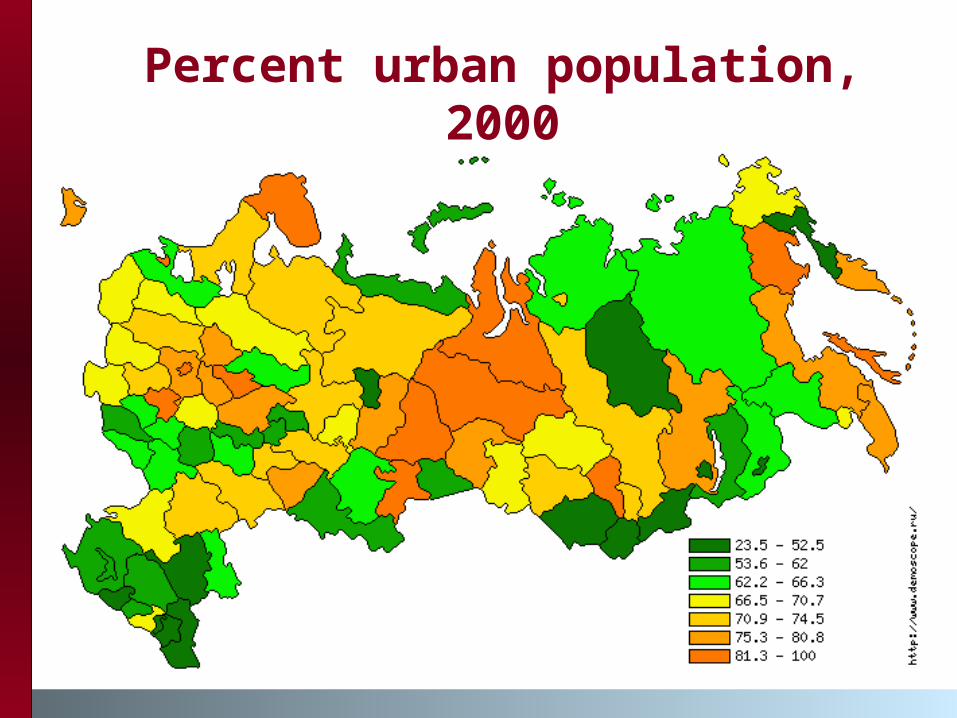
Percent urban population, 2000
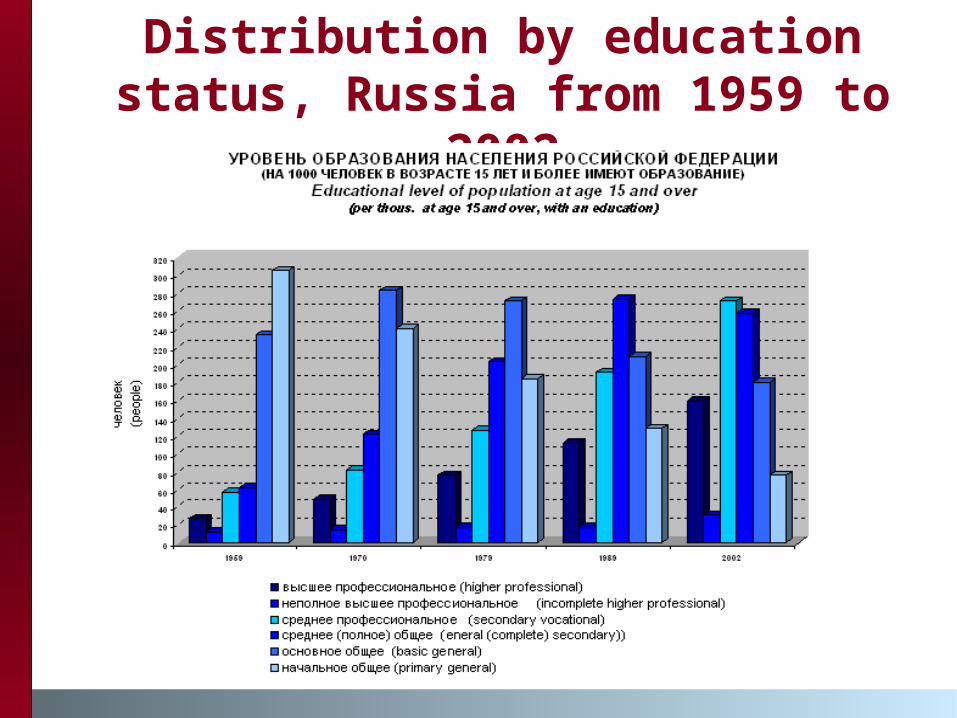
Distribution by education status, Russia from 1959 to
2002
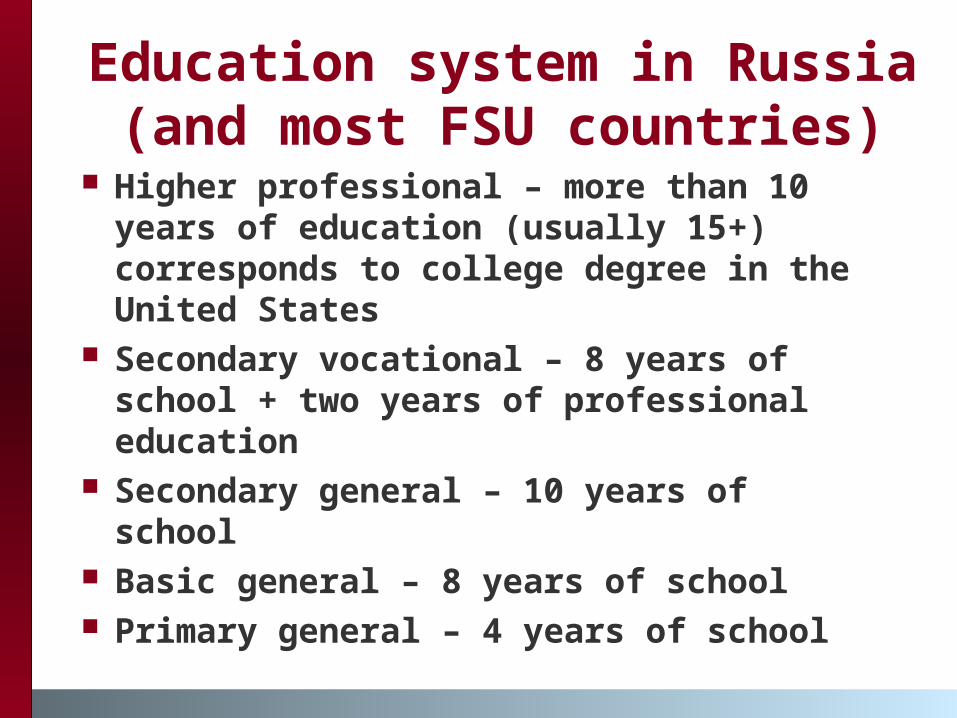
Education system in Russia (and most FSU countries)
Higher professional – more than 10 years of education (usually 15+) corresponds to college degree in the United States
Secondary vocational – 8 years of school + two years of professional education
Secondary general – 10 years of school
Basic general – 8 years of school Primary general – 4 years of school
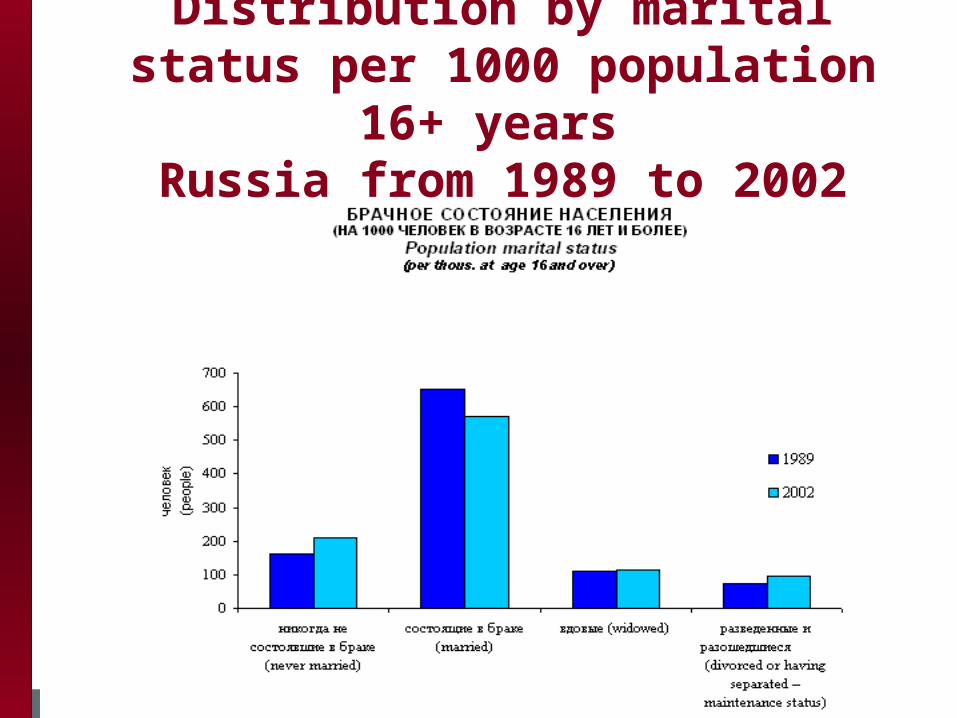
Distribution by marital status per 1000 population 16+ years
Russia from 1989 to 2002
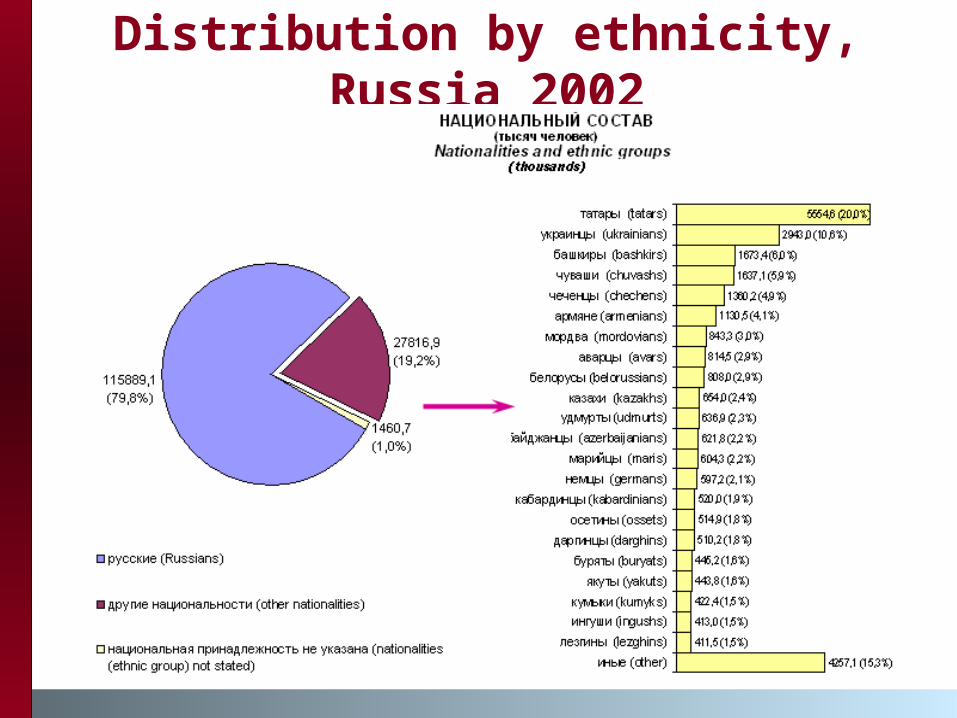
Distribution by ethnicity, Russia 2002
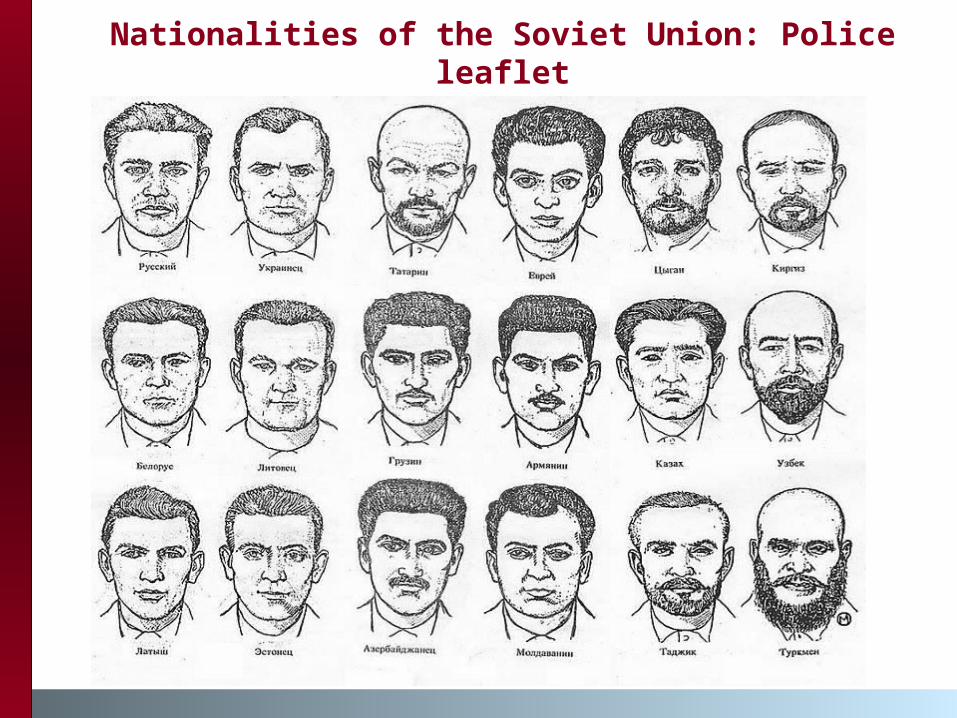
Nationalities of the Soviet Union: Police leaflet
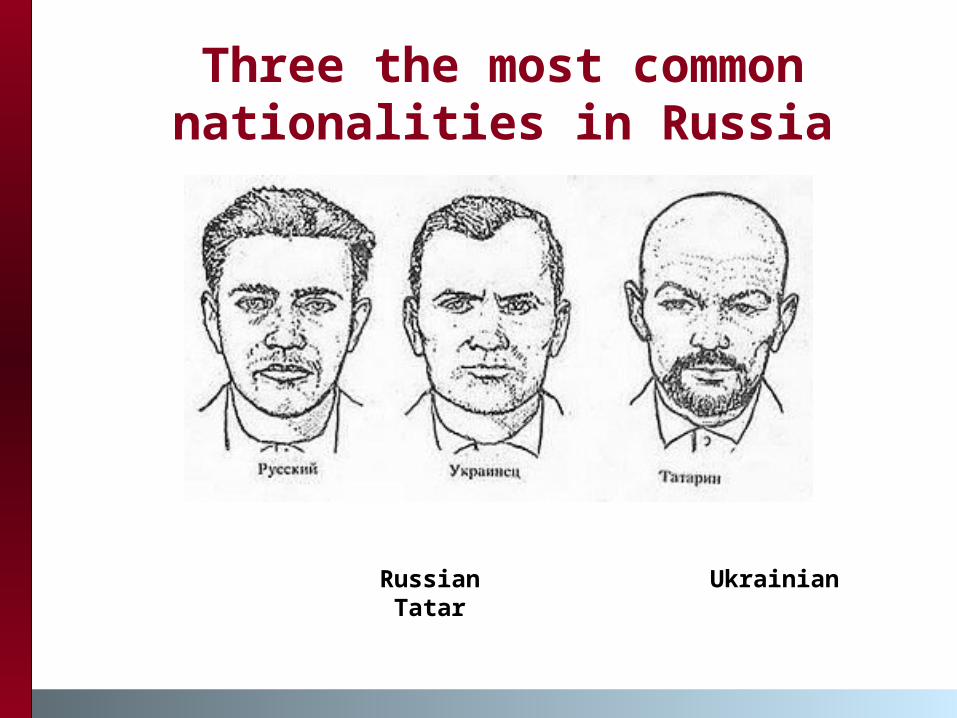
Three the most common nationalities in Russia
Russian Ukrainian Tatar
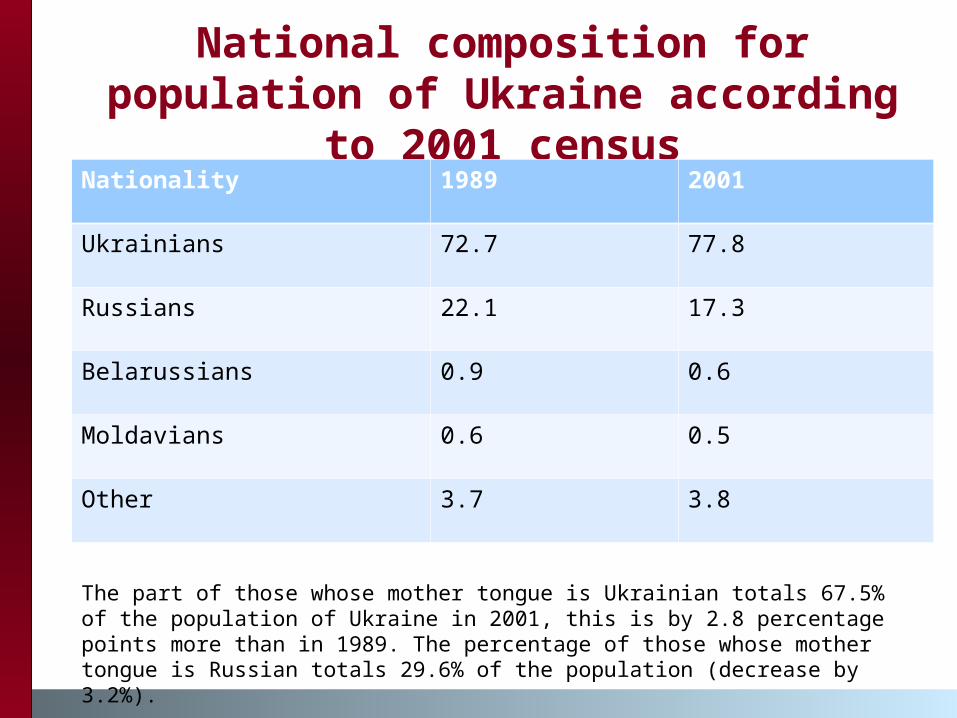
National composition for population of Ukraine according to
2001 censusNationality 1989 2001
Ukrainians 72.7 77.8
Russians 22.1 17.3
Belarussians 0.9 0.6
Moldavians 0.6 0.5
Other 3.7 3.8
The part of those whose mother tongue is Ukrainian totals 67.5% of the population of Ukraine in 2001, this is by 2.8 percentage points more than in 1989. The percentage of those whose mother tongue is Russian totals 29.6% of the population (decrease by 3.2%).
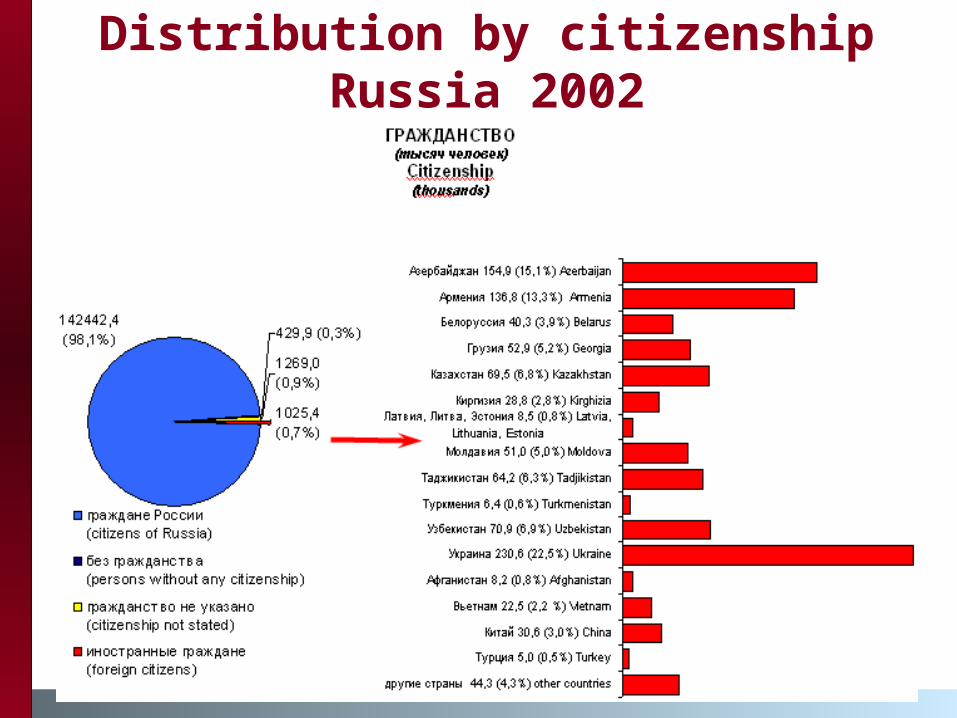
Distribution by citizenshipRussia 2002
Changes in Russian population between 1989 and 2002
censuses Population decline – by 1,855,000 or 1.5%. The most rapid decline is observed during the last 10 years. From 1993 to 2006 population of Russia decreased by 4.5%. But population increase in Central and Southern federal okrugs from 1989 to 2002. However, after 1993 negative natural increase (decline) in all federal okrugs.
Non-uniformity in population distribution increased.
Stagnation of urbanization (deurbanization?)
Synthetic cohorts in demography
A hypothetical cohort of persons that is represented when data for a year or other brief period are treated as though they relate to a single cohort.
For example, the total fertility rate, which summarizes the age-specific birth rates for a population of women in a given year, may be assumed to represent the average total children born per woman for a synthetic cohort of women that passed through life bearing children at the given rates.
Synthetic or hypothetical cohorts are based on cross-sectional distributions
Demographic measures based on hypothetical cohorts are called period measures (e.g., period life tables)

Reading
Anderson, B. 2002. "Russia faces depopulation? Dynamics of population decline," Population and Environment 23(5): 437-64.