Demographic Trends, Policy Influences, and Economic ... · OSD, by Charles Wolf, Jr., Siddhartha...
80
Demographic Trends, Policy Influences, and Economic Effects in China and India Through 2025 JULIE DAVANZO, HARUN DOGO, AND CLIFFORD A. GRAMMICH WR-849 April 2011 WORKING P A P E R This product is part of the RAND National Security Research Division working paper series. RAND working papers are intended to share researchers’ latest findings and to solicit informal peer review. They have been approved for circulation by RAND National Security Research Division but have not been formally edited or peer reviewed. Unless otherwise indicated, working papers can be quoted and cited without permission of the author, provided the source is clearly referred to as a working paper. RAND’s publications do not necessarily reflect the opinions of its research clients and sponsors. is a registered trademark.
Transcript of Demographic Trends, Policy Influences, and Economic ... · OSD, by Charles Wolf, Jr., Siddhartha...

Demographic Trends, Policy Influences, and Economic Effects in China and India Through 2025 JULIE DAVANZO, HARUN DOGO, AND CLIFFORD A. GRAMMICH
WR-849
April 2011
WORK ING P A P E R
This product is part of the RAND National Security Research Division working paper series. RAND working papers are intended to share researchers’ latest findings and to solicit informal peer review. They have been approved for circulation by RAND National Security Research Division but have not been formally edited or peer reviewed. Unless otherwise indicated, working papers can be quoted and cited without permission of the author, provided the source is clearly referred to as a working paper. RAND’s publications do not necessarily reflect the opinions of its research clients and sponsors.
is a registered trademark.

ii
Preface
In this paper we compare the recent and likely future demographic situations in
China and India and their implications. This is a background paper for the chapter,
“Population Trends in China and India: Demographic Dividend or Demographic Drag?.
in the RAND report, China And India, 2025: A Comparative Assessment, MG-1009-
OSD, by Charles Wolf, Jr., Siddhartha Dalal, Julie DaVanzo, Eric V. Larson, Alisher R.
Akhmedjonov, Harun Dogo, Meilinda Huang, and Silvia Montoya, and contains some of
material referenced therein. The RAND report was done under the sponsorship of the
Office of Net Assessment with the objective of understanding how China and India will
compare to one another in 2020-2025 with regards to demographics, economic growth,
science and technology and military spending.
This research was conducted within the RAND Center for Asia Pacific Policy, part
of International Programs at the RAND Corporation. The center aims to improve public
policy by providing decisionmakers and the public with rigorous, objective research on
critical policy issues affecting Asia and U.S.-Asia relations.
For more information on the RAND Center for Asia Pacific Policy, see
http://www.rand.org/international_programs/capp/ or contact the director (contact
information is provided on the web page).
Comments or questions on this working paper should be addressed to the project
leader, Tom McNaugher, Director of the Center for Asia Pacific Policy at

iii
Acknowledgments
This work has been a long time in coming and its gestation has been aided by a
number of individuals. For their helpful comments and support we express our
appreciation to Judith Banister, Charles Becker, David Bloom, Nicholas Eberstadt, David
Evans, Peter Heller, Alejandro Herrin, Michael Mattock, Tom McNaugher, Enders
Wimbush, and Charles Wolf, Jr. We thank the RAND Center for Asia Pacific Policy for
its initial support of this work and Dr. Andrew Marshall of the Office of Net Assessment
for supporting its completion. Any and all mistakes remain solely the responsibility of the
authors.

iv
Abstract
China and India have the two largest populations in the world; each has over a
billion people. The population of China is currently larger than that of India, but with its
higher population growth rate, India’s population size is projected to surpass China’s in
2025. China’s lower fertility rate and longer life expectancy have led to a population that
is considerably older than India’s. The proportion of the population that is of working age
has been higher in China than in India since the mid-1970s and is projected to be so until
2030.
An increasing proportion of the population that is of working age provides an
opportunity to reap a “demographic dividend,” both through both brute force increase in
the numbers of potential workers and an accelerated accumulation of capital due to
reduced spending on dependents. The proportion of the population of China that is of
working age is projected to peak in 2011 and generally decrease thereafter. In India,
however, the proportion of the population that is of working age is projected to increase
through 2029. China’s demographic window of opportunity is rapidly closing, while
India’s will remain open until at least 2030 (and changes immediately thereafter will be
very small).
Growth in the working-age population provides an opportunity for a country to
reap a demographic dividend, but the extent to which this occurs depends on the
socioeconomic and policy environment. When compared with India, in the short term
China has more of the preconditions to take advantage of its demographic window of
opportunity and to deal with demographics when they become a potential drag. These
preconditions include more flexible labor markets; less illiteracy and more highly
educated people in general, and especially for women, and more open attitudes about
women working; higher rates of female labor force participation; a healthier population;
better infrastructure; more internal migration and a higher degree of urbanization; and
more openness to foreign trade. It is for these reasons that we feel that, on balance, China
will remain “ahead” of India during the 2020–2025 assessment period.
In the long term, however, China’s prospects may be hindered by its aging
population, while India will have more favorable demographics than China. Whether
India is able to reap a demographic dividend will depend on its ability to meet the

v
challenges of improving its educational system and closing gender gaps in education,
improving its health care system, enhancing its infrastructure, and incorporating more
women into the workforce..

Introduction
Long the two most populous countries in the world, India and China have emerged
as important actors in the world economy. There is great interest in the extent to which
future population trends in these two countries might affect their economies. Although
China is currently more economically advanced than India, its population is, on average,
considerably older than India’s. Might this be a “demographic drag” that limits China’s
economic prospects relative to those of India? Might India, whose population is both
younger and growing relative to that of China, experience a “demographic dividend”
from these trends?
In this paper, we review recent and projected demographic trends in India and
China and their likely implications. Our focus is on the years 2020–2025; to put this
period in perspective, we show data for the years 2000–2035.
We begin by looking at data on population growth and its components (births,
deaths, and international migration). We then consider the implications of these for the
age structure and sex composition of the population. We conclude by discussing the
implications of these demographics.
Official demographic data for China and India are somewhat limited, both
regarding total population characteristics over time and particularly for details of
demographic events such as births and deaths, though that quality of such information has
been improving in both nations (Bhat, 1993; Lavely, 2001; and Kennedy, 2001). Several
international agencies present demographic data for all countries in the world, drawing
upon available information and the judgments of their experts. The resulting statistics
sometimes vary across sources. In this paper, we mostly use data from the United States
Census Bureau International Data Base (IDB), and, unless otherwise noted, this is the
source for data presented. We have chosen this source both because of its long-term
estimates and projections1 and because the bureau’s data on China pertain only to
1 The IDB offers annual population estimates and projections of the population in China and India
from 1950 through 2050. By contrast, the United Nations Population Division (UNPD) offers only quinquennial estimates and projections for this time period, and the World Development Indicators of the World Bank offer only estimates from 1960 through 2010.
Data from other international organizations, such as the United Nations and the World Bank, and from the countries themselves show patterns similar to those in the IDB data. In 2009, for example, the

2
mainland China, which is our focus. (By contrast, data from United Nations Population
Division [UNPD] on “China” include Taiwan, whose population the IDB estimates at just
over 23 million.) In addition, the Census Bureau recently updated these data (in June
2009 for India and in December 2009 for China), making them the most up-to-date data
available at the time of our analysis.2 Occasionally we present data from other sources on
topics not covered by the IDB.
Population Growth and Its Components
China and the India are the only countries in the world with populations of more
than one billion, and China and the Indian subcontinent (including Bangladesh and
Pakistan) have been the most populous regions of the world for at least 2,000 years
(Durand, 1977). According to the most recent censuses of each nation, there were 1.266
billion people in China in 2000 (National Bureau of Statistics of China, 2005) and 1.029
billion in India in 2001 (Registrar General and Census Commissioner of India, 2001).
According to IDB estimates, in 2010 there were 1.330 billion people in China and 1.173
billion in India, and population growth rates have been consistently higher in India than
in China since the early 1970s and is projected to remain so for years to come. India’s
population is projected to grow through at least 20503 (when it will be 1.656 billion),
surpassing China in 2025, whereas China’s population is projected to reach a maximum,
of 1.395 billion, in 2026 and to decrease thereafter (Figure 1).
most recent year for which comparable data are available, the National Bureau of Statistics in China estimated the total population to be 1.32129 billion, the IDB estimated it to be 1.32359 billion, and the World Bank estimated it to be 1.33146 billion. Similarly, in 2001, the year of the last census in India, the Office of the Registrar General and Census Commissioner in India enumerated a population of 1.0287 billion, compared to an IDB estimate of 1.0233 billion and a World Bank estimate of 1.0325 billion. We find all these reasonable, but, again, prefer the IDB for the annual projections it offers, projections whose assumptions we are better able to assess and discuss later in this document.
2 For example, the IDB’s December 2009 update for China is based on a new triangulation of evidence from a variety or sources, including analysis of data from surveys and China’s most recent census at that time.
3 2050 is the latest year for which IDB shows projections on its website.

3
Figure 1. Total Population Sizes, and China and India, 2000–2035
Calculating the population change for a nation is done by subtracting the number of
deaths from the number of births and adding the net international migration. Although in
the 20th century both nations experienced relatively large international migration flows
because of historical events—foreign invasion and civil war in China and the partition in
India—in recent years net emigration from these nations has been relatively low.
According to the IDB, in 2010, India, on net, lost 3.3 persons to international migration
per 100,000 population, while China lost 34.0 per 100,000.4 This leads us to focus here
on other, more predictable events—i.e., births and deaths—that are currently doing much
more to shape the demographics of each nation.
At present, in both China and India, the number of births considerably exceeds the
number of deaths. The IDB estimates that in 2010 there were 16.19 million births in
China, resulting in a crude birth rate (CBR) of 12.17 births per 1,000 population. There
are estimated to be just over half as many deaths in 2010—9.17 million—resulting in a
4 Despite low net immigration rates, both nations have relatively large numbers of natives living
abroad—including, for example, more than one million from each nation in the United States alone (United States Census Bureau, 2002). Many of these are sending remittances back to their home countries. In dollar terms, India ranked first in the world in the amount of remittances received, with $21.7 billion received in 2004, and China ranked second, with $21.3 billion, although, as a proportion of home country GDP, remittances to neither nation rank among the top 20 in the world (World Bank, 2006). How remittances may affect the economies of India and China deserves further analysis, as does whether either nation should make more efforts to encourage educated emigrants to return.

4
crude death rate (CDR) of 6.89 deaths per 1,000 population. The difference between
births and deaths, which is called natural increase, is even greater in India, where an
estimated 25.03 million births were estimated in 2010, resulting in a CBR of 21.34 per
1,000, but only 8.83 million deaths, resulting in a CDR of 7.53 per 1,000.
Components of national population growth in 2010, including net immigration, are
shown in Table 1. The IDB estimates that China’s population increased by 0.49 percent
in 2010, while India’s increased by 1.38 percent. (By comparison, the U.S. population—
bolstered by net immigration of 4.25 per 1,000 population—was expected to grow 0.97
percent in 2010.) Table 1 shows that India’s higher rate of population growth is largely
due to its considerably higher CBR, though the difference in the net immigration rate also
contributes modestly. We will now examine the trends in births and deaths in the two
countries.
Table 1. Components of Population Change, China and India, 2010
Demographic Rate China India
Crude birth rate (per 1,000 population) 12.17 21.34
Crude death rate (per 1,000 population) 6.89 7.53
Natural population growth (per 1,000 population)
5.28 13.81
Net immigration (per 1,000 population) –0.34 –0.03
Annual rate of population growth (%) 0.49 1.38
Birth Rates
The CBR in India is projected to exceed that in China over the entire 2000–2035
period (Figure 2). During the 2020–2025 period, the CBR difference between the two
countries is projected to be slightly smaller (7.2 to 7.4 births per 1,000 population
difference) than what it is in 2010 (9.2 per 1,000), and it will shrink to 6.4 per 1,000 by
2035.

5
Figure 2. Crude Birth Rates, China and India, 2000–2035
During the 2000–2035 period, the CBR in India is projected to decrease smoothly,
from 26.0 per 1,000 to 15.0 per 1,000. In contrast, the CBR in China fell from 12.9 to
11.4 between 2000 and 2006 but is expected to increase to l2.3 in 2011–2012, after which
it will decline again, to 8.6 in 2035. The slight CBR increase projected for China between
2006 and 2011 is an “echo effect” of the post-Cultural Revolution baby boom; i.e., the
women born during that period are now having babies.
The number of births in a country is the product of two variables: the average
number of births per woman of childbearing age5 and the number of women in this age
range. If the number of women of childbearing age is increasing, the number of births can
increase even if the number of births per woman is falling – a phenomenon known as
“population momentum.” We now discuss each of these in turn.
The total fertility rate (TFR), the average number of lifetime births per woman (or
more precisely, the number of births a woman would have in her lifetime if at each age
she experienced the age-specific fertility rates of that year), is a measure of fertility that is
not affected by the number of women of childbearing age in the population. The TFR is
5 The average number of births per woman of childbearing age is the general fertility rate (GFR).
Below we discuss the total fertility rate (TFR), synthetic cohort measure of the average number of children that would be born to a woman over her lifetime if she were to experience the current age-specific fertility rates prevalent in the population in that year, because the TFR is a more commonly used, and more intuitive, measure of fertility. It is closely related to the GFR.

6
thus considered a better measure than the CBR for comparing fertility levels between
countries or time periods. China’s TFR has been lower than India’s for many years
(Figure 3). The IDB estimates that in 2010 the TFR in India was 2.65 children per
woman, while in China it was 1.54; i.e., each Chinese woman is currently having, over
the course of her lifetime, an average of more than one fewer child than each Indian
woman is. The IDB estimates that the TFR in India will decrease very gradually to
“replacement level”—the level needed for population stabilization in the long run
(approximately 2.1 children per woman)—by 2035.
Figure 3. Total Fertility Rates, China and India, 2000–2035
By contrast, the TFR in China has been below replacement level since 1991.6 The
IDB estimates that the TFR in China decreased to 1.48 children per woman in 2006 but
projects that it will increase toward 1.60 as we approach 2025 (and it is projected to be
1.70 in 2050). As a result, throughout the period we consider, India’s TFR remains higher
6 Staff at the International Programs Center at the U.S. Census Bureau have told us that the IDB
data on fertility are based on the official CBR series released by the National Bureau of Statistics of China in its China Statistical Yearbook, which contains upward adjustments from reported birth data. This official CBR series for 1990–1995 was used by the Census Bureau to generate an implied TFR series based on available age-specific fertility rate patterns and the age structure of women in China for each year of this period. These data correspond closely to the estimates based on new school enrollments, suggesting that 13 percent of children aged 5–9 went unreported in the 2000 census, close to the figure implied by backward projections of those aged 10–14 in the 2005 sample census.

7
than China’s, though the difference between the two countries will decrease over time.
By 2025, women in India are projected to average 0.65 children more than those in
China; and in 2050 the difference is projected to be 0.45 children.7
The number of births in a country depends not only on the number of births per
woman of childbearing age but also on the number of women in this age range. The size
of the female population that is of childbearing age (ages 15–49) is currently greater in
China than in India (Figure 4). However, the number of women of childbearing age in
India is projected to increase over the entire 2000–2035 period (and until at least 2050),
leading to positive “momentum,” while that number has already begun to decrease in
China, resulting in negative momentum. India is projected to overtake China in total
number of women of childbearing age in 2017. This is why the relative difference in
future CBRs shown in Figure 2 is considerably greater than that for TFRs in Figure 3.
7 In 2010 the UNPD estimated the TFR in India to be 2.76 and that in China to be 1.77. (We remind
the reader the UNPD includes Taiwan in “China.”) Among its projection variants are those that assume the TFR in both nations will eventually reach to 1.35 (low), 1.85 (medium), or 2.35 (high) children per women. The UNPD projects China to reach these levels after 2020 and India to do so after 2035.
These projections can matter considerably. For example, should the “low” variant prove more accurate for China but the “high” variant prove more accurate for India—and the fertility assumptions of each are close to current fertility behavior in each nation—then the population of India will surpass that of China before 2020, or a decade sooner than a medium variant for both countries would project. Projected changes in population age structure, the resulting dependency ratios, and the social and economic issues that these raise for each nation, would likewise change. All such long-term models depend largely on the fertility decisions of persons not yet of childbearing age and some not even yet born, lending to their vagaries. (For general discussion on the accuracy of population projections, see Bongaarts and Bulatao, 2000.)
Research by the International Institute for Applied Systems Analysis has demonstrated how rather small differences in TFR assumptions can produce large changes in population forecasts (Helig, 1999; Leahy, 2009). The population projections inherent in the U.S. Census IDB data imbed a certain set of TFR assumptions, which in turn internalize a set of assumptions about the broader policy environment. Methodologically, however, these predictions are usually obtained through regression of previous data, which is fitted to a model of a changing TFR seen in other countries whose economic and policy environment mirror the country under study in the present. This contains an underlying assumption that a generalizable pattern of demographic change is valid anywhere around the world under similar socio-economic conditions (Walker, 2008).

8
Figure 4. Number of Women of Childbearing Age (Ages 15–49), China and India, 2000–2035
One suggested cause of the lower fertility rates in China is the “One Child Policy”
(OPC), which was introduced in 1979 as a “temporary” measure to slow population
growth (Gu et al., 2007). Under this policy, couples need to apply for a childbearing
permit prior to the wife’s becoming pregnant, and penalties are assessed if childbearing
limits are exceeded. The policy has been strictly implemented in urban areas. Rural
couples are allowed to have a second child if their first child is a girl. Disadvantaged
ethnic minorities are also exempt from these rules, and, more recently, couples made up
of only children are allowed to have two children.8 In recent decades, the emerging
market economy, by increasingly placing the financial burden of raising children on
Chinese families (rather than the state), has probably also contributed to decreasing
fertility rates (Wang and Mason, 2005). There are indications that the one-child way of
life has taken cultural hold in the urban Chinese society.9
8 For more information about family planning policies in China, see Greenhalgh (1986), Blayo
(1992), Ting (2004), and White (2006). 9 India has a longer history of family planning efforts (Dyson, 2004a; Visaria, 2004a) than China,
but China now has a higher level of contraceptive prevalence than India (United Nations Population Division, 2005). In the late 1990s 84 percent of Chinese women of childbearing age who were married or in union used contraception (with virtually all doing so using modern methods, the most popular methods being female sterilization and the IUD). In India, 48 percent of such women used contraception (and 70 percent of these used the permanent method of female sterilization).

9
Death Rates
India’s crude death rate (CDR) is currently higher than China’s, and this has been
the situation since at least 2000 (Figure 5); however, China’s CDR is projected to surpass
India’s in 2014. China’s CDR began increasing in 2006 and is projected to continue
doing so at an increasing rate over the period of interest. India’s CDR is projected to
decrease until 2020–2021, after which it will increase slightly. The CDR difference
between the two countries is projected to grow throughout the 2000–2035 period, leading
to increasingly lower population growth rates in China relative to India.
Figure 5. Crude Death Rates, China and India, 2000–2035
The CDR is strongly affected by the age composition of a population. Indeed, one
reason why CDRs will be higher in China than in India after 2013 is that China’s
population is, on average, older, and older people are more likely to die than younger
people.10 As we will see in the next section, the populations of both China and India are
becoming older. Crude death rates may increase in both countries as a result.
A better measure for comparing mortality risks or overall health between countries
and across time periods is life expectancy at birth (LEB)—the number of years that a
10 For example, 2010 CDRs were lower in both China (7.06 deaths per 1,000 population) and India
(6.23) than in the United States (8.38).

10
person born in a given year can expect to live if the age-specific mortality rates of that
year apply throughout that person’s life. LEB has been increasing in both countries
(Figure 6) and is expected to continue to do so through at least 2050. LEB is currently
considerably higher in China (74.5 years) than in India (66.5).11 Death rates from
communicable, maternal, perinatal, and nutritional conditions are higher in India than in
China for every single cause (WHO, 1999). The LEB gap will narrow somewhat in the
future, but LEB in India will lag behind China for the foreseeable future. In fact, it will
not be until 2038 that India’s LEB will equal the LEB in China in 2010 (74.5 years).12
Figure 6. Life Expectancy at Birth, China and India, 2000–2035
Population Growth Rates
In both China and India, the gap between births and deaths is narrowing, resulting
in slower population growth in both nations, as shown in Figure 7. Population growth
rates are expected to be lower in China than in India until at least 2050. India’s
11 UNPD estimates the 2010 LEB in China to be 73.0 years and that in India to be 63.5 years. Both
of these are lower than the IDB estimates. The difference is much greater for India; hence, the UNPD estimate of the LEB difference between the two countries is larger than the IDB estimate.
12 To project future LEBs, IDB uses S-shaped logistic functions, which are typically used to model the transition from relatively high mortality to relatively low mortality, and fits a logistic curve to one or more estimates of life expectancy at birth. For more on IDB projection methods, see http://www.census.gov/ipc/www/idb/estandproj.pdf#mortdbe

11
population growth rate has been declining since before 2000 and is expected to do so at
about the same rate until at least 2050. By contrast, although China’s population growth
rate is considerably lower than India’s, China’s rate is quite flat between 2002 and 2011
but is expected to fall somewhat more rapidly than India’s thereafter. Beginning in 2027,
the number of deaths in China is expected to exceed the number of births, resulting in
natural population loss.
Figure 7. Population Growth Rates, China and India, 2000–2035
Age-Sex Structure of the Population
The trends in fertility and mortality discussed above affect the present and
projected age distribution of a population. Demographers typically use population
pyramids to depict the age-sex structure of a population. Such figures are called pyramids
because, historically for most nations, particularly in those with persistently high fertility
rates, they resemble a pyramid, with a wide base representing large numbers of younger
age groups and more narrow bands near the top representing smaller numbers of older
people near the end of their natural life span. In Figure 8 we show population pyramids
for India and China for the years 2000, 2010, 2020, 2025, and 2035. The Indian age-sex
structure in 2000 is a good example of the classic pyramid shape.

12
Figure 8. Age-Sex Structure of the Populations of India and China, 2000, 2010, 2020, 2025, and 2035
The pyramid shape can still be seen for the 2010 population of India, though with a
thicker base than in 2000. Because India’s fertility rate remains above replacement level
and the number of women of childbearing age has been increasing, each birth cohort is
larger than the one above it in the population pyramid, though the widths of the “steps”
between adjacent bands are smaller for the most recent birth cohorts.

13
As we go forward, the base (ages 0–4) of the pyramid for India in 2020 is not quite
as wide as it for 2010 (reflecting fewer births in the later year), but above age 20 the bars
are all much wider than they are now for those age groups. In the 2030s, fertility in India
is expected to fall nearly to replacement level, and the number of women who are of
childbearing age will level off. As a result, the total number of births will stop increasing,
and younger cohorts will become slightly smaller than those immediately older.
The “pyramids” for China have much smaller bases than those for India,
especially in future years, and are much more jagged in shape. Each of the pyramids for
China has two population bulges. In 2010, there is a bulge for those aged 35 –49 (who
were born between 1961 and 1975); this reflects the rapid increase in fertility that
followed the Great Leap Forward of 1958 and the three subsequent “Black Years” of
famine from 1959 to 1961. The smaller cohorts of persons aged 25–34 in 2010 (born
between 1976 and 1985) likely reflect China’s renewal of family planning campaigns in
1971. The large number of persons aged 15–24 in 2010 (who were born between 1986 and
1995) reflects legal changes in the marriage age that led to earlier marriages and
childbirth, as well as some population momentum from persons born in the 1960s who
then married and had children in the 1980s. In 1984, there was a backlash against marriage
and birth regulations; this led to a relaxation of marriage registration regulations that
aimed to delay marriage for women past age 23 and for men past age 25.13 The legal
minimum remained 20 years of age for women as changed in the 1980 Marriage Law
(which had elevated it from 18 to 20) and began to have an effect on fertility in 1985. The
large cohorts born between 1963 through 1972 married in large numbers in their early
twenties. The marriage boom of these cohorts began around 1984, and their births
followed shortly thereafter (personal communication from Judith Banister, June 12, 2010).
The small cohorts born in recent years in China reflect the low fertility rate
following the implementation of the One Child Policy. The “bulges” of the Chinese
population pyramid will move upward in coming years as the large cohorts age. For
example, in 2035, the large cohort that is now 35-49 will be 60-74. In 2035 there will be
13 Additional discussion of impact of changing legislation and regulation on fertility rates in China
can be found in Coale (1984).

14
many more older people than there are now; for example, there are projected to be 103
million people in China aged 65–69 in that year, compared with 40 million in 2010.
These changes in age structure will shape the social and economic issues China and
India will confront in coming years, as we discuss below.
Working-Age and Dependent Populations
All these changes in population age composition will affect the percentage of the
population that is of working age (typically defined as ages 15–64)—members of the
population who can (but not necessarily will) contribute to the economy—as well as the
percentage of population that is of “dependent” ages (0–14 and 65+), presumed to be too
young or too old to support themselves through labor market activity and who therefore
need to be supported by others, typically the family or the state.14
Youth
The percentage of the population that is young (under age 15) is projected to be
higher in India than in China throughout the 2000–2035 period, though this percentage is
projected to decrease steadily in both countries (Figure 9). The difference between the
countries is currently at its maximum and will be smaller in the 2020–2025 period
(average of 8.8 percentage points) than it was in 2010 (12.2 percentage points).
14 Not all people aged 15–64 will work, and some who are younger or older may work. Nonetheless,
it is generally presumed that, on average, people aged 15–64 produce more than they consume, while the opposite is true for those who are younger and older.

15
Figure 9. Percentages of the Population That Are Under Age 15, of Working Age (15–64), and Older Age (65+), China and India, 2000–2035
Working-Age Population
China has had a larger percentage of its population that is of working age than
India since the mid-1970s (Ahya et al., 2006). Furthermore, as seen in Figure 9, in the
first decade of this century this percentage was increasing more rapidly in China than in
India. This is largely due to the large number of people born in China in the 1960s and
early 1970s who were joined in the workforce by their children born in the 1980s and
early 1990s (demographic echo effect), as evidenced by the corresponding bulges in the
population pyramids shown in Figure 8. The percentage of the population of China that is
of working age is expected to peak now and to decrease after 2011 (except for a very
slight increase in 2026–2027 (the last period when the large post-Great Leap cohorts will
still be of working age).15
The trend in the percentage of the population that is of working age is more linear
in India, with increases in this indicator reflecting steady, nearly linear decreases in the
fertility rate. The percentage of the population that is of working age in India is expected
15 Other data sources show similar proportions of the population of working age. The World Bank
shows 71 percent of the population in China and 63 percent of the population in India to be of working age in 2007. The UNPD medium-variant projection estimates that, in 2010, the working-age population was 72 percent in China and 62 percent in India and that, in 2035, it will be 65 percent in China and 70 percent in India. We remind the reader that the UNPD includes Taiwan in its estimates and projections for “China.”

16
to crest around 2030—the same year that India will surpass China on this statistic—and
then decline very slowly, reflecting the expectation of decreasing fertility. It is important
to note that this decline in India will be very gradual, compared with a much steeper rate
of decline in China. (The percentage varies by less than one point in India over the 2019–
2035 period, whereas it decreases by 6.2 points in China over the same period.) The
difference between the two countries in the percentage of the population that is of
working age is currently at its maximum (73.4 percent in China, 64.6 percent in India).
Another indicator of the overall shift in balance between the two countries is that
the total number of people of working age in India is projected to overtake that of China
in 2028 (when there are projected to be 971 million people of working age in India and
956 million in China [U.S. Census Bureau, 2010]). Furthermore, around this time the
working-age population in India will be younger than that in China (Figure 10), providing
the foundation for growth but also creating a need for entry-level jobs. Meanwhile, there
will be more people aged 35–64 (and especially aged 50–64) in China. Nonetheless, it is
important to note that throughout our period of focus, 2020–2025, the percentage of the
population that is of working age will be larger in China (70.6 percent in 2020, 69.2
percent in 2025) than in India (67.0 percent in 2020, 67.5 percent in 2025), albeit older.
Figure 10. Age Breakdown of Working-Age Populations in China and India in 2025

17
Older Population
In 2010, 5.3 percent of India’s population and 8.6 percent of China’s was aged 65
or older. In both countries, this percentage will increase, and at an increasing rate (Figure
9). By 2025, these numbers will be 7.7 percent in India and 14.3 percent in China, and by
2035 they will be 10.2 percent and 21.0 percent, respectively. (Interestingly, the
percentage for China in 2035 is very close to what the IDB projects for the U.S. in that
year – 19.9 percent.) By 2035, both China and India will have more than twice as many
older people in relative terms as they do now (and an even higher ratio in absolute terms).
In terms of the absolute numbers of people, China will have more elders than India
in every age subgroup, and they will be relatively older (see Figure 11 for data for 2025).
Currently, a higher proportion of elders (people aged 65+) is of age 75 or older in China
(37.4 percent) than in India (29.9 percent). The difference will narrow considerably by
2025 (when the figures will be 35 percent and 32 percent, respectively). In 2025, both
countries will have higher proportions of their elderly who are aged 85 or older (6.6
percent in China and 5.1 percent in India) than they do now (5.8 percent and 3.6 percent,
respectively), meaning that the elderly population is likely to be more frail than it is now
and to require more care.
Figure 11. Age Composition of Older Population (Age 65+) in China and India in 2025

18
Dependency Ratios
The trends in the working-age and dependent populations just presented determine
the trends in dependency ratios, i.e., ratios of persons of “dependent” ages to those of
“working” age. The dependency ratio can be decomposed into the part for youth
dependents (under age 15) and that for old dependents (age 65+).
Figure 12. Youth and Old-Age Dependency Ratios, China and India, 2000–2035
In 2010, in China there were 36.2 dependents for every 100 persons of working
age. Of these dependents, 67 percent are youths and 33 percent are at least age 65. The
youth dependency ratio has decreased in recent years, as a result of absolute decreases in
the number of persons under 15 years of age (which is a result of a decreasing number of
births). The youth dependency ratio will increase slightly between 2014 and 2022 (due to
the current increase in the crude birth rate) and decline thereafter (Figure 12).
The old-age dependency ratio has increased modestly in China in recent years, in
part because of improvements in survival to older ages. In 2010 the old-age dependency
ratio in China was 11.8 elderly dependents per 100 persons of working age. However, it
is projected to rise rapidly and surpass the youth dependency ratio by 2029, as persons
born shortly after the 1949 revolution and before the implementation of family planning
19
programs reach the age of 65. In 2035, there will be 10.8 more elderly dependents than
young dependents for every 100 people of working age.
The pattern in dependency ratios is very different in India. At 46.6 people under
age 15 for every 100 of working age, India’s 2010 youth dependency ratio is nearly twice
that of China’s (24.4). India has fewer old-age dependents than China, but the difference
between the two countries in their old-age dependency ratios (8.3 for India, 11.8 for
China) is much smaller than it is for youth dependents. In 2010, 85 percent of India’s
dependents were youths, compared with 67 percent in China. India’s youth dependency
ratio has been decreasing slowly in recent years and is projected to continue a slow,
steady decrease throughout our study period, to 33.2 in 2035. India’s old-age dependency
ratio is projected to increase slowly over the study period, but the rate of change will
increase over time. Nonetheless, even by 2035 there will be more than twice as many
youth dependents as old-age dependents in India (which is the situation now in China).
The overall dependency ratio for China is still falling, but it is expected to begin
increasing in 2012 (Figure 13), due to continuing increases in the old-age dependency
ratio. Throughout the next two decades, India’s overall dependency ratio will remain
greater than China’s; India’s overall dependency ratio will fall below China’s in 2030. As
with every demographic indicator we have considered, changes in India are projected to
be less rapid and smoother than those in China.16
16 Other sources offer similar estimates on dependency ratios. In 2009, the World Bank estimated a
youth dependency ratio of 29 dependents per 100 people of working age and an old-age dependency ratio of 11 for China. For India that year, it estimates a youth dependency ratio of 51 and an old-age dependency ratio of 8. The UNPD, using its medium-variant assumptions, estimates that in 2010 the youth dependency ratio in China was 28 and the old-age dependency ratio was 11; it estimates that by 2035 the youth dependency ratio in China will decrease to 24 and the old-age dependency ratio will increase to 30. (We again remind the reader that the UNPD includes Taiwan in its estimates for “China.”) The UNPD estimates in 2010 the youth dependency ratio in India was 48 and the old-age dependency ratio was 8; it estimates that by 2035 the youth dependency ratio in India will decrease to 30 and the old-age dependency ratio will increase to 14.

20
Figure 13. Total Dependency Ratios in China and India, 2000–2035
Sex Ratios
Another demographic trend that may have social implications for China and India
is a growing ratio of males to females. This can be seen in the population pyramids in
Figure 8 (in the wider widths for males than females for most age groups) and in the sex
ratios in Figure 14. In both China and India, a preference for sons coupled with
decreasing fertility has contributed to a higher ratio of males to females among
successively younger cohorts (Das Gupta et al., 2003; Lane, 2004; Poston, 2002). Most
parents in China or India want to have at least one son. When they decide (or are
encouraged) to have fewer children, they sometimes assess the sex of their fetus and
abort those shown to be female (Visaria, 2004b; Dyson, 2004; Jha et al., 2006). The fact
that the ratios of males to females are much larger at all ages in China and India than in
the United States has been taken as evidence that sex-selective abortion is practiced or
that girls are not treated as well as boys, or both.17
17 In the absence of sex-selective abortion, biologically about 105 males are born for every 100
females (Newell, 1988). If males and females are treated similarly in terms of diet and health care, at each age (except during the childbearing ages in societies with high levels of maternal mortality), males have higher mortality rates than females, so the sex ratio falls as age increases. Such a pattern can be seen for the United States in Figure 14.

21
Figure 14. Sex Ratios, by Age Group, in China, India, and the United States, 2010
Implications of Demographic Changes in China and India
In this section, we discuss the main implications of the demographic changes
between now and 2025 in China and India that we have presented in this paper, with a
particular focus on the effects of demographic change on broader national power and the
national abilities to adequately support a growing and aging population and to enable the
countries to reap a demographic dividend. We will look at the broader economic
implications of the changes, as well as the ability of infrastructure, health care, and
education sectors to support these changes.
Opportunity to Reap a Demographic Dividend
An increasing proportion of the population that is of working age provides an
opportunity to reap a “demographic dividend” (Bloom, Canning, and Sevilla, 2003),
through both brute force increase in the numbers of potential workers and an accelerated
Data on mortality by sex do show higher infant and child mortality of girls, apparently due either to
deliberate infanticide or less careful treatment of female children relative to males (Wang and Mason, 2005).
It has also been suggested that some of the “missing” girls in China may exist but are not reported in government censuses and surveys (e.g., Wang and Mason, 2005; Greenhalgh and Winckler, 2005; Dyson, 2001). Nonetheless, estimates that show lower male-to-female ratios than those in official statistics still show higher ratios than are seen in countries such as the United States.
22
accumulation of capital due to reduced spending on dependents. Demographic dividends
are estimated to have accounted for one-fourth to two-fifths of East Asian per capita GDP
growth in late 20th century (Bloom, Canning, and Sevilla, 2003).
The proportion of the population that is of working age will be higher in China
than in India until 2030. However, the opportunity to reap a demographic dividend comes
mainly from the positive change in the proportion of the population that is in the labor
force, which creates the demand and supply signals necessary for economic growth
(Bloom et al., 2003). The proportion of the population of China that is of working age is
projected to peak in 2011 and then decrease thereafter (except for a flattening in the mid-
2020s, which is just before the post-Great Leap baby boom reaches age 65). In India,
however, the proportion of the population that is of working age will increase through
2029 and then decrease slowly but steadily afterward. China’s demographic window of
opportunity is rapidly closing, while India’s will remain open until at least 2030 (and
changes immediately thereafter will be very small).
Bloom et al. (2009) find that economic growth in China and India between 1980
and 2000 was mainly due to increasing productivity, in large part because of the shift
from agriculture to industry and services, but that increases in the proportion of the
population that is of working age and in labor force participation rates contributed
significantly as well. While the effect of the change in the working-age proportion would,
other things the same, favor India, Bloom et al. (2009) find that the level of working-age
population percentage also matters, favoring China in the years leading up to 2030.
India’s working-age population is and will continue to be younger than China’s.
Younger workers are generally more vigorous and adaptive (Lallemand and Rycx, 2009),
and in developing countries they are typically better educated than older workers;
however, they can be a source of drag if jobs are not available for them. An older
workforce may not be particularly problematic for China as it tries to develop a post-
industrial economy: Research (e.g., Bloom et al., 2007) suggests that productivity may
not decline as much with age for more highly cognitive tasks as it does for physical tasks.
Though growth in the working-age population provides an opportunity for a
country to reap a demographic dividend, the extent to which this occurs depends on the
socioeconomic and policy environment (Figure 15). Obviously, there must be a demand

23
for the increased supply of labor, and conditions must enable its productivity. This
requires effective policies in key areas, including strong health and educational systems
to increase the productivity of potential workers; flexibility and competitiveness in the
labor market to enable it to absorb the “boom” generations; openness to trade that leads
to a growth of productive and rewarding jobs; modern infrastructure and technology to
reduce transactions costs and enable economic efficiency; good governance, stable
macroeconomics, and a sound financial system to promote savings and investment; and
low levels of crime and corruption, which can impede economic progress. Those
forecasting the extent of economic growth for China and India note the need for
conditions similar to those needed to reap a demographic dividend (Wilson and
Purushothaman, 2003; National Intelligence Council, 2004).18
Figure 15. Linkages and Mechanisms Between Policy and Socioeconomic Influences on Demographics and Economic Growth
18 Both China and India have undertaken reforms, beginning in the late 1960s in China and
somewhat later in India, that have increased the roles of markets, opened their economies to international trade, and attracted foreign investment. For more on this and the role of sectoral shifts between agriculture and industry, see Bloom et al. (2009) and references therein.

24
A “second dividend” may arise when the anticipation of population aging
incentivizes savings and capital accumulation, but this will not occur if old-age security
relies on wealth transfer schemes (Mason and Lee, 2006). Currently, the elderly in both
China and India tend to rely overwhelmingly on families for old-age support. In 2006,
only 15 percent of Chinese workers were enrolled in pension plans (Cai, 2006), with a net
present value of unfunded liabilities exceeding current annual GDP (Eberstadt, 2005).
India faces a similar problem; a 2001 study estimated that only 10–11 percent of India’s
workers had participated in any form of a guaranteed retirement income system
(Gillingham and Kanda, 2001).19 This is discussed in more detail below, under “Fiscal
Implications.”
There are no publicly available forecasts that enable us to compare China and India
on the presence of all of these conditions. In the sections that follow, we present some
recent data on education, health, the role of women, and infrastructure to explore how the
two countries differ in key factors that will condition how their demographics will affect
their economic prospects.
Education
The capability of employing in productive jobs those who want to work is a way a
country can capitalize on having a “boom” generation of people of working age.
However, in a rapidly changing global economy, the population must be educated in
order to have the ability to keep up with the changes. Therefore, having an educated
workforce is one of the preconditions for reaping a demographic dividend from an age-
structure window of opportunity.
Large portions of the population that will be of working age in 2020–2025 have
already completed their schooling, and those currently in school and recent graduates will
be important contributors to this group. We therefore examine UNESCO’s statistics on
enrollments and expenditures in education, as well as the reports of the relevant
government agencies on future plans and priorities, and compare them to similar statistics
19 Gillingham and Kanda (2001) estimate that in 1999 only 11 percent of workers in India
participated in any form of a guaranteed retirement income system. Uppal and Sarma (2007) suggest that this number has fallen below 10 percent. The uncertainty in these figures stems from considerable uncertainty about the size of the labor force.

25
for the U.S. Data availability on education is limited for both China and India, and
depending on the indicator, the latest official data can be five or more years old. For most
statistics, the most recent years for which comparable data are available are 2002-2003,
except where noted below. Since each country recently conducted a census (China in
November 2010 and India in February 2011), better data will be available soon. Most of
the current data represents ministerial estimates or samples of 1 percent of the population,
conducted in between censuses.
Table 2. Comparison of Education Indicators for China, India, and the United States20
Indicator China (Year) India (Year) U. S. (Year)
Net primary enrollment (%) 95% (2003) 89% (2004) 98% (2004)
Gross secondary enrollment (%) 70% (2003) 53% (2003) 88% (2004)
Gross tertiary enrollment (%) 16% (2003) 12% (2003) 72% (2005)
Adult literacy rate (total) (%) 91% (2001) 61% (2001) 99% (2007)
Adult literacy rate (male) (%) 95% (2001) 73% (2001) 99% (2007)
Adult literacy rate (female) (%) 87% (2001) 48% (2001) 99% (2007)
Public education expenditure (% of GDP) 2.10% (2001) 3.22% (2005) 7.50% (2005)
Total expenditure per primary pupil (USD) $372 (1999) $303 (1999) $9,138 (2005)
Total expenditure per secondary pupil (USD) $833 (1999) $295 (1999) $9,670 (2005)
Primary pupil-teacher ratio 17.6 (2007) 40.2 (2004) 13.8 (2007)
Secondary pupil-teacher ratio 16.4 (2007) 32.7 (2004) 14.5 (2007)
Researchers per 1 million 926 (2006) 110 (2000) 4,651 (2005)
Currently, the population of China is better educated than that of India. In 2002–
2003 (the most recent year for which data are available), China had higher rates of
enrollment than India at all levels of schooling (95 percent vs. 82 percent for net primary
enrollment, 70 percent vs. 53 percent for gross secondary enrollment, and 16 percent vs.
20 This table is based on data for China and India presented in Goldman, Kumar, and Liu (2006), but
updated where new data have since become available and compared to the same indicators in the United States. Underlying data are from the UNESCO Educations Statistics or World Education Indicators and OECD Statistics.

26
12 percent for gross tertiary enrollment)21 and a considerably higher adult literacy rate
(91 percent versus 61 percent) (Goldman, Kumar, and Liu, 2008).
Furthermore, data suggest that the “quality” of schooling is better in China: In
2002–2003, China had a considerably lower average primary pupil-per-teacher ratio than
India (17.6 versus 40.2) and spent more per student, especially on secondary education.22
Improving the quality of education is one of the goals of the 12-year plan announced in
China in 2008 (Xinhua News Agency, 2009). By contrast, India is focusing on improving
access to education and is just now making investments in such basics as walls, toilets,
and running water in schools for all pupils (Ministry of Human Resource Development,
2008). Therefore, the smaller cohorts entering the Chinese labor force between 2020 and
2025 will be better educated than the larger ones in India, placing China at an advantage.
Brain drain from both China and India has been considerable, effectively skimming
off the most productive elements of each society. For example, since 1978, more than 70
percent of all the Chinese who traveled abroad to study have not returned home (China
Daily, 2007), and approximately two-thirds of those who emigrate from India have some
college education (Vonderheid, 2002). It is possible that improving economic conditions
may lure some emigrants to return (Dyson and Visaria, 2004).
Health
Health affects not only life expectancy and mortality rates, and hence population
growth rates, but also the extent to which working-age people become productive
contributors to the economy. Healthy older people may be able to contribute to the
economy even after they otherwise might have retired, while improvements in health and
longevity can motivate people to save more for retirement (Bloom et al., 2009). The
health of a population affects its demand for health care and the resources devoted to it.
21 India had a higher rate of gross tertiary enrollment than China prior to 2001, but its growth rate
has slowed, whereas China’s has grown at an increasing rate. All of the other enrollment rates have been higher in China than in India since before 1985 (Goldman, Kumar, and Liu, 2008).
The gross enrollment rate is calculated by dividing (1) the number of students enrolled a particular level of education, regardless of age, by (2) the population of official school age for that level. The net enrollment rate is calculated by dividing (3) the number of children of official school age for a particular level of education who are enrolled in that level by (4) the total population of children of these ages.
22 Based on UNESCO statistics (UNESCO, 2009), India has historically spent a higher percentage of its admittedly lower GDP on education than China has, but this trend appears to have reversed in the past ten years. Reliable comparative annual statistics on education are difficult to find after 1999. However, it is known that China has invested heavily in education, particularly with the 2009 stimulus (Bradsher, 2009).

27
Health data for recent years and those projected for the future suggest that the
advantage on this dimension goes to China. As of 2004, the average Chinese was
healthier than the average Indian (Chatterji et al., 2008). The burden of disease, measured
in years of “healthy” life lost, is about 50 percent higher in India (355 years per 1,000
people) than in China (260 years per 1,000 people).23 Another metric for comparing the
health of different groups is the “health score,” which is a scale from 0 to 100, where 0
indicates complete inability to conduct day-to-day activities and 100 indicates no
difficulty whatsoever. WHO estimated the average health score in China to be 69.0, while
that in India was 60.8, and these health scores are higher in China than India for all age,
sex, and residence subgroups (Table 3). As another example, one-sixth (16.6 percent) of
respondents in China and nearly half (46.9 percent) in India report having at least one
chronic condition (Chatterji et al., 2008). Death rates from communicable, maternal,
perinatal, and nutritional conditions are higher for India than for China for every single
cause (WHO, 2010).
23 Technically, these are called the “disability-adjusted life years,” or DALYs. DALY is an
increasingly popular measure of disease burden, and is typically measured for specific health conditions. It is calculated by adding (1) years of life lost due to premature mortality due to a specific cause of death and (2) years lost due to disability for incident cases of the health condition. The sum of these DALYs across health conditions can be thought of as a measurement of the gap between current health status and an ideal health situation where the entire population lives to an advanced age, free of disease and disability.

28
Table 3. Mean Health Scores in India and China, 2002-2003
SOURCE: From Chatterji et al. (2008)
Note: The health score is calculated on a scale of 0 to 100, where a score of 0 = complete difficulty functioning in day-to-day activities and 100 = no difficulty. Differences between China and India are statistically significant for each row of this table.
Chatterji et al. (2008) also projected the indicators forward to 2030, based on
projections of GDP per capita and human capital. Their simulation found that the burden
of disease is expected to shift increasingly to the elderly, due to population aging: In 2030
about 66 percent of the total disease burden in China and about 45 percent in India will
be carried by the population aged 45 or older, which are each much higher than the
corresponding figures for 2004 (44 percent and 25 percent respectively). In China, about
60 percent of all disease burden across all age groups will be due to non-communicable
diseases in the 45+ age group.
The Chatterji et al. study projects that DALYs for all causes will decrease in both
countries for the 45+ age group (substantially in China, from 267 DALYs per thousand
people age 45 and older in 2004 to 220 in 2030, and very little in India, from 355 to 354
over this period). When broken down by cause, the examination shows that DALYs lost
will decline in China for all groups of diseases, indicating that, though older, the
population of China will be healthier in each age group than it is now. In India, however,

29
while DALYs lost to communicable diseases are expected to decline (from 52 per
thousand in 2004 to 20 per thousand in 2030), the DALYs attributable to non-
communicable disease are expected to increase (from 278 to 307 per thousand) during the
same period, suggesting that the health of the older population in India will be getting
worse.
The underlying changes in the DALYs can be illustrated by the WHO Western
Pacific (WestPac) studies stating that in China “health vulnerabilities arise as the by-
product of changes in social and economic development. Urbanization, environmental
damage, and increasing tobacco consumption and motor vehicles have resulted in a high
prevalence of risk factors for chronic diseases. Some 23 percent of the population is
overweight and 160 million people are suffering from hypertension, most of whom are
between the ages of 18 and 59 years. Diabetes prevalence is projected to double by 2030,
to more than 42 million cases. Around 350 million people smoke in China. Most of them
are men; smoking prevalence is 66 percent among men but only 3 percent among women.
Furthermore, uptake of smoking is occurring at younger ages. Smoking is a primary
contributor to lung cancer mortality, estimated at more than 300,000 deaths annually. It is
projected that, by 2020, tobacco use will account for one-third of all deaths—among
which half will occur between the ages of 35 and 64 years” (WHO WestPac, 2009).
In India, communicable diseases account for about 38 percent of the disease
burden (compared to less than 30 percent in China), though there are large variations
across states. Non-communicable diseases are evolving into a major public health
problem and accounted for 53 percent of all deaths in the 30-59 age group in 2005,
according to WHO Western Pacific (2009). It is projected that by 2015, 59 percent of the
total deaths in India would be due to them. In India, the obesity rate at the turn of the
century was 1 percent for males and 4 percent for females in the slums, while the same
indicators for those of middle class socio-economic status were 32 and 50 percent,
respectively (Gupte, Ramachandran, and Mutatkar, 2001). Tobacco is widely consumed
and remains as the single most important preventable risk factor, with 47 percent of men
and 15 percent of women being regular consumers of tobacco. Road traffic injuries result
in the deaths of more than 100,000 people every year.

30
India has a high death rate from infectious and parasitic diseases—many times
higher than in China; controlling those will help improvements in life expectancy
continue in both countries (see Cook and Dummer, 2004, for China, and Horton, 2001,
for India). Long-term trends, however, will mainly be affected by how well each nation
controls “civilization diseases” resulting from its socioeconomic development.
Cardiovascular disease is the leading cause of death in both countries. Cancer accounts
for nearly 20 percent of all deaths in China, but only 7 percent in India. Respiratory
disease is an important cause of death in India, and to a lesser degree in China (see
epidemiologic data in He et al., 2005, for China, and Joshi et al., 2006, for India). Deaths
due to respiratory disease may increase in both countries as pollution increases. By one
estimate (Havely, 2005), China has seven of the ten most polluted cities in the world. The
World Health Organization (WHO) rates New Delhi as the fourth most polluted city in
the world in terms of suspended particulate matter (Gadhok, n.d.).
HIV/AIDS is another factor that will affect trends in life expectancy. Mortality
from HIV/AIDS was estimated to be much higher in India (18 per 100,000 population)
than in China (0.6 per 100,000) in the late 1990s, but the disease is expanding rapidly in
both nations (UNAIDS, 2006a and 2006b). In 2007 (the most recent year for which data
are available), India was estimated to have 2.31 million persons living with AIDS, the
highest total of any country in the world, though its prevalence rate among adults, 0.34
percent, is much lower than the 20 to 30 percent in the most-affected countries in Africa
(National AIDS Control Organization, 2008). The corresponding numbers are much
smaller for China: 650,000 persons living with AIDS and a prevalence rate of 0.1
percent, although this is believed to be increasing rapidly (Gordon, 2002). In both
nations, AIDS is geographically concentrated, primarily in southern regions and in areas
attracting migrants.
These forecasts foreshadow a necessity of increasing expenditures on health in
both countries. The initial inklings of these cost increases can be seen in Figure 16 below,
which shows that per capita health expenditures nearly doubled in China between 2000
and 2006 (WHO, 2006), and increased by more than 50 percent in India over the same
period (WHO, 2009). WHO expects these costs to keep increasing in the decades to
come. Because health care costs increase significantly with age, the burden of the older

31
population will be significantly greater for China than for India, though, as noted above,
currently elders are healthier in China than in India. As can be seen in Figure 16, China
has already been spending more on health care than India.
0
50
100
150
200
250
300
350
400
1999 2000 2001 2002 2003 2004 2005 2006 2007
Year
$ U
SD
SOURCE: WHO Statistical Information System (WHOSIS)
Figure 16. Per capita expenditures on health (in PPP USD PPP), China and India, 1999-2007
The question of where the added expenditure will come from is an interesting one,
because the composition of the expenditure source can have a strong effect on the
economic effects; i.e. out-of-pocket funding can have an effect similar to a tax, while
government spending can constrain other fiscal priorities. Currently, slightly over 50
percent of health expenditures in China and 75 percent in India come from out-of-pocket
expenses. Given that the annual per capita income adjusted for adjusted for purchasing
power parity (PPP) in India was over $3,800 in 2006, the effect of spending over $80 out
of pocket on average, represents a 2 percent increase in marginal tax rate. In China, with
a 75 percent out-of-pocket participation in expenditure rate, but a higher PPP GDP, this
represents an almost 4 percent additional marginal tax rate.
To conclude, China is healthier than India and will remain so for the foreseeable
future. The cost of disease to India will be considerable and may retard its ability to
capture the demographic dividend offered by its demographics.

32
Women in the Economy
A significant determinant of future economic growth in both countries will be the
degree to which women participate in the formal economy (Apps and Rees, 2001; Bloom
et al., 2009; Fortin, 2009). In both countries, women are much less likely to participate in
the formal labor force than men are, but the difference is much greater in India. In 2009,
67 percent of women aged 15 or older in China participated in the labor force, while in
India the rate was only 33 percent (World Bank, 2011), which is one of the lowest female
labor force participation rates in the world.
Attitudes regarding women’s roles are presently more permissive in China than in
India. For example, 87 percent of Chinese respondents to the World Values Survey feel
that a university education is as important for a girl as for a boy, compared with 50
percent in India (Table 4). On several indicators China even surpasses the U.S. As a
consequence, China appears better positioned than India to continue to welcome women
into the formal workforce.
Table 4. Views on Roles of Women in China, India, and the United States
China India U.S.
Disagree men have more right to a job than women 40% 28% 81%
Agree it is not necessary for a woman to have children to be fulfilled 55% 14% 81%
Agree that a husband and wife should both contribute to household income
96% 77% 67%
Disagree that men make better political leaders than women 46% 36% 73%
Disagree that a university education is more important for a boy than for a girl
87% 50% 91%
Agree that a working mother can have as warm a relationship with her child as a mother who stays at home
89% 50% 77%
SOURCE: Ronald Inglehart et al., World Values Surveys, 1999-2001 (computer file), Ann Arbor, Mich.: Institute for Social Research and Inter-University Consortium for Political and Social Research. http://www.worldvaluessurvey.org/.
Note: All of the inter-country differences shown in this table are statistically significant.
Studies have generally found a positive association between gender equity in
education and economic development (e.g., Chen, 2004). Females lag behind males in

33
literacy and educational attainment in both countries, but this is particularly so in India
(Goldman, Kumar, and Liu, 2008). In 2000–2001, women in China trailed men in adult
literacy by eight percentage points (87 percent versus 95 percent), whereas in India the
difference was 25 percentage points (48 percent versus 73 percent). In 2000, less than
half of adult women in India were literate. Not only does educating women prepare them
to be productive members of the labor force, it also has the additional effects of reducing
the number of children desired (which may be useful in India but moot in China because
of its One Child Policy) and promoting investments in their children’s health and
education (World Bank, 2009).
Though women in both countries will have fewer responsibilities for child care
because of declining fertility, as the populations age, work opportunities for women may
be constrained by the need to provide care to elderly parents and parents-in-law, a
responsibility they will share with fewer, if any, siblings.
Infrastructure
A well-developed infrastructure can reduce transactions costs, enable economic
efficiency, increase the productivity of labor, and alleviate some of the limitations of an
aging society by easing movement and extending productivity into later years. The
construction of such infrastructure can also provide employment opportunities.
China ranks considerably ahead of India on many dimensions of infrastructure,
especially those related to communications and energy. This was not always so; it is a
result of a recent, systematic campaign of reinvesting national savings into infrastructure,
resulting in rapid growth over the 1980–2005 period (Table 5). This is a pattern followed
by other authoritarian, high-growth economies in Asia, where centrally planned
infrastructure is systematically built ahead of demand, promoting export-oriented growth
(Akteruzzaman, 2006).
34
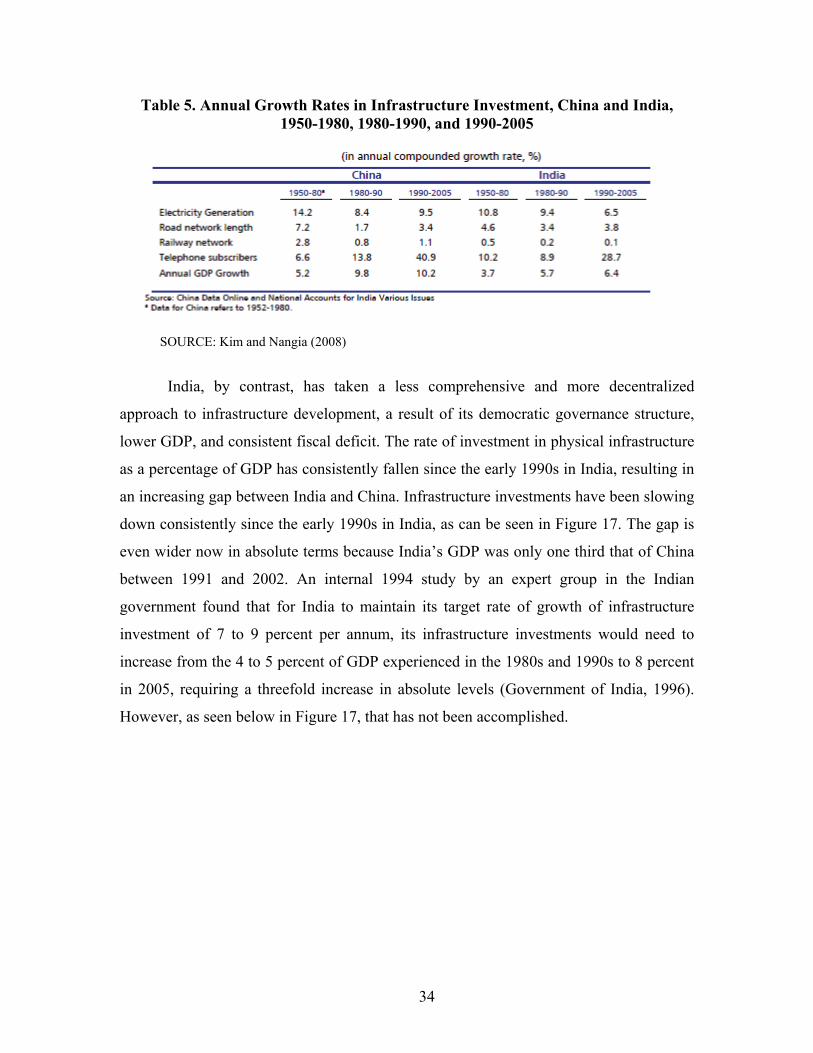
Table 5. Annual Growth Rates in Infrastructure Investment, China and India, 1950-1980, 1980-1990, and 1990-2005
SOURCE: Kim and Nangia (2008)
India, by contrast, has taken a less comprehensive and more decentralized
approach to infrastructure development, a result of its democratic governance structure,
lower GDP, and consistent fiscal deficit. The rate of investment in physical infrastructure
as a percentage of GDP has consistently fallen since the early 1990s in India, resulting in
an increasing gap between India and China. Infrastructure investments have been slowing
down consistently since the early 1990s in India, as can be seen in Figure 17. The gap is
even wider now in absolute terms because India’s GDP was only one third that of China
between 1991 and 2002. An internal 1994 study by an expert group in the Indian
government found that for India to maintain its target rate of growth of infrastructure
investment of 7 to 9 percent per annum, its infrastructure investments would need to
increase from the 4 to 5 percent of GDP experienced in the 1980s and 1990s to 8 percent
in 2005, requiring a threefold increase in absolute levels (Government of India, 1996).
However, as seen below in Figure 17, that has not been accomplished.

35
SOURCE: Kim and Nangia (2008)
Figure 17. Infrastructure Investment as a Percentage of GDP
A good example of these trends is road infrastructure. China’s annual investment
in its road network increased from about US$1 billion in 1991 to around $38 billion in
2002 (Kim and Nangia, 2008). With over 30,000 km of expressways, China is rapidly
catching up with the United States, which has the world’s largest road network. In
response to the 2008 financial crisis, the Chinese government created a 4 trillion Yuan
(approximately US$586 billion) stimulus plan, 38 percent of which went to infrastructure
investment. The combination of continued investment and targeted, efficient stimulus
funding will result in China adding 5,000 km of expressway each year. By contrast,
India's annual investment increased from $1 billion to just $3 billion over the 1991-2002
period, and its national highway network is slow and heavily congested. The story is
similar for other infrastructure sectors (Table 6).

36
Table 6. Infrastructure sector performance indicators, India and China, 1980, 1990, and 2005
SOURCE: Kim and Nangia (2008)
This failure to marshal resources and address a public-good need will certainly
put India’s economy at a disadvantage and eventually require boosted investment in the
sector. A recent study by McKinsey and Co. (Gupta et al., 2009) concluded that there are
severe inefficiencies in the government implementation of infrastructure projects in India
and that these may cost India up to 10 percent of potential GDP in 2017–2018.
Other Implications of Changes in Population Age-Sex Composition
Implications of Gender Imbalances and the Changing Composition of “Dependents”
Some have speculated that many of the “excess men” in China and India will not
be able to find wives, resulting in a “bachelor bomb” that could lead to social instability
and violent crime and foster an authoritarian political system to control perceived
increases in violence by such males, lead to larger armies that pursue expansionist
policies, or even cause public health problems because of more widespread prostitution
(Hudson and den Boer, 2004; Poston and Morrison, 2005). Such arguments, however,
may not sufficiently acknowledge the possibility that differences in age at marriage for

37
men and women may increase; that is, men may still marry, but at older ages, while
women may marry at younger ages. “Excess” men may also emigrate, or brides may be
“imported” from other countries. A recent study of China (Edlund et al., 2007), however,
did find that regions with higher sex ratios had higher rates of crime.
China’s “window of opportunity” of low dependency ratios to prepare for an
aging population will begin to close this year (2011). The youth dependency ratio in
China will stabilize at around 27 youths per 100 people age 15 to 64 (i.e., one young
dependent for about four persons of working age), but the old-age dependency ratio will
begin to increase more rapidly than it has been. China will soon have many older persons
to support, while at the same time having as many youths to support as it currently does.
As a result, the overall dependency ratio will increase by about a fifth by 2025, fuelled by
an old-age dependency ratio that will nearly double. India, by contrast, is projected to see
its overall dependency ratio continue to fall throughout the period of interest.
The contrasting composition of dependency ratios in each nation indicates that
issues related to youth, such as education, will be more prominent in India, while issues
regarding the elderly, such as pensions and geriatric health care, will be more prominent
in China. It is not clear whether China has dedicated the resources necessary to support
larger numbers of the elderly with fewer youths. State-owned enterprises that
traditionally funded social programs for workers and their families have largely
collapsed, and no national social welfare system has yet replaced them.
Elderly in both India and China traditionally rely on family members to care for
them in their old age. With fewer children, parents may expect less support from their
families. When the parents of the only children born under China’s one-child policy reach
old age, they will have, at most, one surviving child to support them, and if that child is a
daughter who follows long-standing cultural norms, she may give more attention to her
husband’s parents than to her own. In 2025, roughly 30 percent of Chinese women at
least 60 years of age will have never born a son (Eberstadt, 2005). If the sex imbalance
results in an increase in the percentage of men who don’t marry, this will mean that many
elderly will not have a daughter-in-law to help take care of them. The sex ratios shown
above suggest that parents continue to have strong preferences for having sons. It remains
to be seen whether these attitudes will change under pressure from demographics. Recent

38
evidence from rural China indicates that the incidence of young couples residing with the
wife’s parents has been increasing (Shuzhuo and Xiaovi, 2004).
If children migrate to areas of greater economic opportunity and leave their parents
behind, the assistance to parents may change from coresidence and other types of
nonmonetary support to monetary transfers, which can be used to purchase goods and
services that would have been provided by family members. The markets for elderly day
care and assisted living are likely to grow. Alternatively, if adult children decide not to
migrate or join the modern labor force in order to take care of their elderly parents,
opportunities for economic growth may be constrained.24
Fiscal Implications
China does not maintain a nationwide social safety net; i.e., there is no national
level old-age and disability pension system. With an increasing number of elderly placing
a strain on the traditional, family-based support system, there have been calls in Chinese
society for the government to step in to provide a universal pension plan. Recently, the
national government advocated, and the provincial government of Liaoning experimented
with, introducing a new three-tier system comprised of (1) a small-base pension funded
from a payroll tax and guaranteed by the government; (2) mandatory individual accounts
in managed investment funds funded by wage taxes paid by the employer and the
employee; and (3) tax preferences for voluntary contributions to private retirement
accounts (Crane et al., 2005). Nonetheless, the sheer number of people, particularly those
in the rural areas who would be primarily relaying on first tier of such a system if it were
implemented nationally, makes the implementation of these plans quite expensive even if
the minimum payment is relatively modest.
A recent RAND monograph (Crane et al., 2005) estimated that creating a pay-as-
you go system in China that would provide a base monthly pension for all elderly age 65
and older at the level of 20 percent of the average monthly wage in 200125 would see the
total annual government expenditure on pensions increase from 3.1 percent of GDP in
2005 to 5.1 percent in 2025. However, this represents only one option for providing
24 For a more extensive discussion of the effects of aging in China, see Banister et al. (2010). 25 Twenty percent of the average monthly wage in 2001 was 161 RMB, or approximately US$22 at
the official exchange rate.

39
coverage; with the growth of individual wealth and per capita income in China, such
minimum pensions may no longer be politically and socially sufficient. Different World
Bank studies have estimated that creating a funded rather than pay-as-you-go pension
system would encumber the Chinese fiscal accounts with liabilities ranging between 46
and 71 percent of GDP (see Lin, 2003, and Yan, 2001). While it is unusual for a system
to be fully capitalized, and most pension system are partially funded from current
revenue, such estimates identify the magnitude of the potential liability that an aging
society may impose on Chinese governments finance, whose pro forma fiscal picture
currently looks rather rosy, with national debt at 7 percent GDP and foreign exchange
reserves at approximately 45 percent of GDP as of 2010 (CIA, 2010a).
India also lacks a comprehensive national pension system, and nearly 90 percent of
its workforce is not covered by any pension system, particularly among the rural and the
poor population. In the past decade the government has revamped the pension system and
created a National Pension Scheme, containing a combination of public- and private-
sector pension savings funds structured with the same three-tier structure as that recently
proposed in China, with mandatory participation of all new civil servant hires and an
option for participation of those in the “unstructured” part of the economy. The National
Old-Age Pension Scheme, the welfare program for the destitute elderly who are without
regular means of subsistence from their own or their family’s sources of income and aged
65 or above, provides a minimal pension ranging of at least 200 rupees per month
(approximately US$4.50 per month) from the central government. The states contribute
an additional 60-300 rupees (~US$1.50 to $7.00) per month depending on the state
affluence and cost of living, with age eligibility requirements ranging widely by state and
by sex, with some states offering such aid to women as young as 50 years of age
(Ministry of Rural Areas and Employment, Government of India). Nonetheless, this
program’s coverage is estimated at around 30 percent of the poorest elderly (Goswami,
2001).
The new national pension scheme in India aims to transition the system towards a
one based on defined contribution and away from the previous model of defined benefits.
Nonetheless, this is applicable only to new entrants to the system, and the problem of
underfunded liabilities for the legacy government employees is variously estimated to be

40
somewhere around 65 percent of GDP (Swarup, 2008). When compared to China, this is
reflective of the smaller GDP in India, since a similar amount of a smaller GDP is
required to cover the more generous unfunded liabilities for a considerably smaller
fraction of the population. Nonetheless, on one hand, India’s freedom of action in
addressing this gap is limited by the fact that the national debt load is at around 56
percent of GDP, and foreign exchange reserves are a comparatively paltry 7 percent of
GDP (CIA, 2010b). However, on the other hand, India has more flexibility in designing a
pay-as-you-go system given that its future work force will be younger and each worker
will be encumbered by fewer retirees when compared to the situation in China.
Implications for the Armed Forces
Both countries have, and will continue to have very large military-age populations
and are unlikely to face a shortage of people available for military service, per se.
However, the underlying social and economic changes may change the internal culture of
the people in the military and by extension the militaries themselves.
At present, most of the conscripts in the Chinese People’s Liberation Army (PLA)
are the only children in their families, and their representation has been increasing with
the entry of the One Child Policy cohorts into service, from 20.6 percent in 1996 to 52.4
percent in 2006 (Li, 2001). A study by the PLA found that although “One Child” soldiers
are no different from their siblinged comrades in certain aspects, such as personality,
training records, and service achievement, they do have a higher prevalence of
individualism, egocentricity, and risk aversion, underscoring the importance of the
“political work” required by the party wing to adequately socialize these soldiers into the
military (Finkelstein and Gunnes, 2006, p. 29).
Officer reenlistments for only-child personnel are likely to be affected by greater
economic opportunity and the need to provide for elderly parents, potentially reducing
the long-term quality of the non-commissioned officer corps. This is a part of an overall
decrease in the level of prestige enjoyed by the military in a rapidly modernizing Chinese
economy, where the armed forces no longer serve as one of only a few ladders for social
advancement.
However, the increasing sophistication of the Chinese society brings a more
technologically attuned pool of labor into the military. The ability of the PLA to harness

41
and mobilize that potential will depend on the status of civilian-military relations and the
incentives offered by the defense establishment. Improving both of these elements will
require additional investments in manpower, further raising the cost of maintaining an
advanced military force. The importance of these factors is likely to increase and become
more acute during the 2020–2025 time frame.
India’s military will not face the same fertility-induced social problems as China’s,
as India’s fertility rate is still above replacement level, and it is the babies born around
2000–2005 who will be the new conscripts in 2020–2025. However, India will face
problems similar to China’s in officer and highly technical cadre accession and retention,
as the broader economy will be more strongly competing with the military for talent. This
may even be more acute in India, because the higher levels of income disparity26 will
shrink the available pool of highly qualified candidates, thus increasing the competition
and raising the wages that the military will have to offer in order to attract the top talent
necessary for a military proficient in the full spectrum of warfare. Therefore, much like
China, economic growth will raise the cost of the manpower budget for the Indian
defense establishment.
Regional Differences
Given the enormous geographic sizes of these two nations, it is not surprising that
there is considerable variation by region within them. In China, dependency ratios are,
and are likely to remain, most favorable for economic growth in the more densely
populated urban areas in the east. In China’s most urbanized provinces, total fertility rates
are considerably below replacement level, average health status is much better than in
rural areas, and large numbers of migrant laborers from rural areas are helping to sustain
economic growth. In contrast, rural areas are aging as working-age people move to cities,
leaving the elderly behind. Rural-to-urban migration may be affecting not only care of the
elderly in China and India, but also other aspects of family life (e.g., the likelihood of
marriage, whether those who marry live together).
Within India, total fertility rates have been below replacement level since the mid-
1990s in Kerala and Tamil Nadu, but some northern states still have total fertility rates
26 For a discussion of inequality in India, see Bardhan (2003).
42
over four children per woman. These northern states are poor and have weak
infrastructure, educational systems, and governance, limiting their ability to absorb the
upcoming increase in the working-age population as productive members of the labor
force (Acharya, 2003).
AIDS is geographically concentrated in both nations, primarily in southern regions
and in areas attracting migrants (UNAIDS, 2006a; National AIDS Control Organisation,
2007).
In both countries, barring a substantial increase in the extent of internal migration,
such regional variation means that the evolving demographic conditions that aid or hinder
economic growth are likely to affect different regions at different times. To date, India
has experienced relatively low rates of internal migration, perhaps because children tend
to be educated in the local language of each region and hence often do not have language
capabilities to work in other areas. This may change as the country realizes that it may
need to overcome regional parochialism in order to promote economic growth.
Since 1990, China has had a higher proportion of its population living in urban
areas than India, and China is continuing to urbanize more rapidly than India (Figure 18).
The United Nations Population Division (2009c) estimates that in 2010 China’s
population was 47.0 percent urban, while India’s was only 30.0 percent urban; it projects
that China will have an urban majority by 2015, something India will not reach until well
after 2045 (UNPD, 2009c). Urbanization in China is largely the result of great increases
in rural-to-urban migration, due both to the “push” of a deterioration of agricultural
opportunities in rural areas and the “pull” of economic and lifestyle opportunities in
urban areas. On average, about one in ten Chinese is living outside his or her location of
household registration. In the economically most dynamic regions of China, such as
Guangdong, Fujian, Shanghai and Beijing, 20 to 30 percent of residents in 2003 were
registered elsewhere (Wang and Mason, 2005). Many of these are illegal migrants who
are part of China’s large “floating population.”

43
0%
10%
20%
30%
40%
50%
60%
70%
2000 2005 2010 2015 2020 2025 2030 2035
Year
Pe
rce
nt
tota
l po
pu
latio
n
India China
SOURCE: UNPD (2009c)
Figure 18. Estimated and Projected Percentage Urban, 2000-2035
Great urban population concentrations in China could, arguably, make it easier for
China to provide social services as well as to develop the economy with lesser need of
extending national infrastructure to hinterlands. With an estimated five million persons
leaving farms to move to cities each year in China (Bergsten et al., 2006), however, there
are questions about the ability of the labor market to absorb them and whether they will
overwhelm existing infrastructure. Further analysis is needed of regional variations and
of the potential for internal migration to lessen (or exacerbate) regional inequalities.
Uncertainties and Alternative Scenarios
The data we have presented in this paper are projections of future demographics in
China and India (and estimates of demographics in the recent past). We have used what
we believe are the best data currently available, but it is important to keep in mind that
these data are based on assumptions about the future (and the past) that may or may not

44
prove to be correct (for example, regarding the impact of HIV/AIDS in the future). In
particular, there has long been debate about fertility levels in China, due largely to
questions about the extent of birth and child underreporting. Because the impacts of
assumptions and uncertainties on estimates of the population size and distribution can be
profound, we are implored to some of mention them. In the Appendix we demonstrate the
effects that changes in assumptions can have on population projections.
Assumptions about demographics and uncertainties about the future have led to a
wide range of population change–based scenarios for the development of the Chinese
economy and its broader society. On one side are the optimists, such as Robert Fogel,
whose recent work discusses the possibility of the Chinese economy reaching $123
trillion in annual GDP by 2040, up from $4.9 trillion in 2009 (Fogel, 2010). On the other
side of the argument is, for example, Nicholas Eberstadt, who foresees profound negative
economic impacts of population aging, gender imbalances, reversal of the rural-to-urban
migration flows, and the emergence of new, unfamiliar family structures based on the
changing dependency ratios (Eberstadt, 2004).
Fundamentally, the difference in these projections is based on the expectations of
a rapid paradigm shift in the Chinese population. For example, Eberstadt’s “perfect
storm” scenario “posits very low fertility in 2040, extremely high sex ratios at birth, a 30
percent decline in both urban and rural marriage rates, and a tripling of divorce rates—
and assumes sudden and imminent rather than gradual distant shifts in all these
tendencies” (Eberstadt, 2004, p. 17). By contrast, Fogel focuses on the effects of a rapid
increase in education, improved rural productivity, and the ability of the Chinese state to
implement population-enhancing policies.
We believe that our focus on more near-term developments between 2020 and
2025 and on the most recent data available allows us to present a balance between these
more speculative alternatives. Though demographic changes will certainly pose
considerable challenges and provide significant opportunities to both nations in this
period, we do not expect those to be either catastrophic or euphoric. While complex
systems, such as human populations, are occasionally prone to rapid changes in behavior,
often precipitated by unexpected phenomena, such as the HIV/AIDS epidemic, it is
important to keep in mind that the entirety of the workforce and the elderly of the 2020–
45
2025 period have already been born; the largest uncertainty concerns the size of the youth
population and the resultant socioeconomic impact of changes in the youth dependency
ratio.
Summary Assessment of the Relative Strengths and Weaknesses Brought About by Demographic Trends in China and India
It is projected that China’s population will remain larger than India’s during most
of the 2020–2025 assessment period, but that India will surpass China in population size
in 2025. China is likely to continue to have higher GDP per capita than India,27 which
matters more on the world stage than numbers of people. In both countries, increasing
populations, together with increasing income and affluence, will increase demands on
world resources and place strains on the environment (World Bank, 2007). China has
since the mid-1970s had a larger percentage of its population of working age than India;
this difference is projected to persist through our period of interest, 2020–2025, until
2030. However, the percentage of China’s population that is of working age will peak
this year (2011) and decline thereafter, while this percentage will continue to increase in
India (until about 2030; it is projected to decline very slowly immediately thereafter).
However, because many more women participate in the labor force in China than in
India, the crossover point for the proportion of the total population that actually works is
likely to occur considerably later.
The opportunity to reap a “demographic dividend” is limited in time. Eventually,
the working-age population decreases in relative size, as its retiring members are replaced
by smaller cohorts resulting from lower fertility rates. While China has two decades
before its overall dependency ratio is projected to exceed India’s, its population of older
people has already begun increasing rapidly.
When compared with India, in the short term China seems to have more of the
preconditions to take advantage of its demographic window of opportunity and to deal
with demographics when they become a potential drag: more flexible labor markets; less
illiteracy and a more highly educated population in general (and especially for women),
more open attitudes about women working, and higher rates of female labor force
27 For extended discussion, see the macroeconomic forecast in Chapter 3 of Wolf et al. (2010).

46
participation; better infrastructure; more internal migration (though much of it “illegal”)
and a higher degree of urbanization; higher rates of savings, capital formation, and
foreign direct investment (e.g., Kim and Nangia, 2008); more openness to foreign trade;
and slightly higher rates of coverage by public pensions. It is for these reasons that we
feel that, on balance, China will remain “ahead” of India during the 2020–2025
assessment period.
In the long term, however, China’s prospects may be hindered by its demographics.
An aging population without an established safety net will create demands for new types
of services (particularly health care), reducing the disposable income of the working
population through wealth transfers to the elderly and laying claim to the large national
savings pool that China has built up during the boom years.
It is our assessment that, on the whole, China’s projected demographics are
creating a challenge for its economic development—a potential demographic drag—that
may be more complex to manage compared with the situation of India. While China was
very successful in controlling the size of its population through antinatalist policies in the
late 1970s and early 1980s, it is unclear whether it can successfully implement pronatalist
policies to avoid a long-term decrease in its population. Not only has the social
environment changed, but the goals of these policies are more difficult to achieve. Both
democratic and authoritarian regimes in Europe have found that pronatalist policies
mostly result in changes in the timing of childbearing rather than in the overall number of
children (Hugo, 2000; David, 1982; Grant et al., 2004). Furthermore, even if pronatalist
policies are successful, it takes around two decades for the babies they produce to
become old enough to enter the labor force; in the meantime, the result is an increase in
the number of young dependents. India is perhaps facing a more straightforward task,
since its primary challenges are improving infrastructure, health care, education, and the
role of women rather than altering the fertility behavior of individuals. However, China
has a good head start on development and, given its centralized decision-making
governance structure, it should have an easier time implementing the needed
socioeconomic policies, but the methods by which it could successfully increase fertility
are not obvious.

47
In the future, India will have more favorable demographics than China, and its
labor force has much more potential to grow than China’s because currently many fewer
women work outside the home in India. Whether India is able to reap a demographic
dividend, however, will depend on its ability to meet the challenges of improving its
educational system and closing gender gaps in education, improving its health care
system, enhancing its infrastructure, and incorporating more women into the workforce,
while maintaining social peace in a society that is increasingly stratifying by income.
Whether such a course is possible in a large, diverse parliamentary democracy such as
India is difficult to predict. China’s experiences indicate that such policies are feasible,
but direct comparison between the two remains difficult.
These comparisons are summarized in the net assessment table below, which
attempts to enumerate the assets and liabilities of each country and capture in a structured
way some of the ambiguity in the assessment while also understanding where the two
countries are relative to one another. During the 2020-2025 period of focus we expect
that China will be a more established and mature economic power, while India will have
the potential for higher growth rates, subject to all the qualifications noted herein.

48
Table 7. Net Assessment of the Impact of Demographic Changes on China and India by 2025
China India Advantage Demo-graphic
Indicator Assets Liabilities Assets Liabilities
Pop
ula
tio
n S
ize
Global prestige tied with having a large, increasingly affluent population
Increasing population, together with increasing income and affluence, increases demands on world resources and places even greater strains on the environment28
Growing population that will ultimately become the world’s largest will imply a growth in stature and importance of India
Increasing population increases demands on world resources and places a greater strain on the environment.29
Ambiguous - India’s population is growing more rapidly than China’s, but China’s GDP per capita is higher and growing more quickly for now.
Lab
or F
orce
Large, and experienced labor force throughout the assessment period
Aging labor force, requiring higher average wages as it moves up in seniority, reducing the competitiveness of Chinese manufacturing
Increasing size of the labor force provides opportunity for economic growth; there is a large opportunity to increase the size of the labor force by increasing female labor force participation rates.
Increasing labor force leads to pressure to create jobs or sustain a growth-friendly business environment.
India - provided it can provide productive jobs for its growing working-age population
Age
str
uct
ure
of
pop
ula
tion
During this period, China will have a large and more prosperous working-age population that will create an increasing domestic market for consumer goods.
Aging population increases the cost of retiree benefits, health care, and geriatric care. Increasing requirement for wealth transfers from workers to (old-age) dependents due to increasing number of (old-age) dependents
Falling number of dependents per worker reduces the share of required wealth transfer per worker, allowing for more wealth accumulation, higher savings and investment and creating circumstances favorable for economic growth.
Increasing cost of retiree benefits, health care and geriatric care, as population ages, but not as rapidly as in China.
India – China is currently at the peak of its demographic strength, and while it will have a broader, richer labor force in 2025, India’s population will be more dynamic and will present more opportunities for growth and development when compared to a more mature China.
Fer
tili
ty/
You
th p
opu
lati
on
Having few children enables families to focus on quality rather than quantity of children; this is likely to foster demand for expanded education, leading to a better educated labor force. Low numbers of children per woman allows for greater female participation in the labor force.
Decreasing number of children is reducing the number of future workers available to support the growing retiree population, creating additional demand for wealth transfers.
Decreasing number of children per family increases focus on quality rather than quantity of children; this is likely to foster demand for expanded education, leading to a better educated labor force. Decreasing number of children per woman allows for greater female participation in the labor force.
Larger demand for youth services Large youth populations can fuel unrest, crime or be radicalized if not gainfully employed
China – If managed properly, this transition can lead to a more mature and productive, if aging, population. On the other hand, the rates of change in India are forecast to be rather slow, and correspondingly the changes will move at a much slower pace.
Hea
lth
China is starting with a healthier population and will thus have the inertia to keep the system going. In many ways the epidemiological transition has already occurred.
Increasing numbers of older people will steadily raise the cost of health-care and increase the draw on resources required for their care.
Indian population will be younger, providing a larger labor supply required to provide care to the increasing numbers of the elderly.
India is still struggling with the most basic of services and will only in the coming years complete the epidemiological transition.
Ambiguous – There will be more Indian youths but they will be required to take care of a sicker elderly population and vice-versa for China.
28 http://siteresources.worldbank.org/INTEAPREGTOPENVIRONMENT/Resources/China_Cost_of_Pollution.pdf 29 http://www.economist.com/world/asia/displaystory.cfm?story_id=11751397

49
Appendix: Comparisons of Demographic Data on China and India from Different Sources
Differences Between IDB Data for China and India for the Period 2000-2035 on the IDB Website in Mid-2009 and Those on the IDB Website in January 2010
In an earlier draft of this paper, we used data we accessed from the IDB website
in mid-2009. When we began to finalize the paper, we updated all of the data with those
posted on the IDB website on January 2010. In comparing the two sets of estimates, we
were struck that some of the differences were quite large. This section describes the key
differences, and, in the process, illustrates how changes in underlying assumptions affect
population projections.
Prior to December 2009, estimates of fertility on the IDB matched the official
crude birth rates from China's National Bureau of Statistics (NBS) -- which contain
upward adjustments from reported data. Since December 2009, however, the IDB
estimates were made based on a new triangulation of evidence from a variety sources,
resulting in a lower estimate of fertility.30 The latest projections for India assume a higher
30 On May 21, 2010, Daniel Goodkind, of the U.S. Census Bureau’s International Programs Center,
sent an e-mail to Julie DaVanzo that included an attachment entitled “Response to ad hoc requests about the derivation of China’s fertility estimates in the IDB.” It read as follows:
The fertility estimates for China currently shown in the International Data Base (IDB) were derived as follows.
From 1990-1995, the crude birth rates (CBR) match the official CBR series released by the National Bureau of Statistics (NBS) in its China Statistical Yearbook, which contains upward adjustments from reported birth data. This official CBR series for 1990-1995 was used by the Census Bureau to generate an implied total fertility rate (TFR) series based on available age-specific fertility rate patterns and the age structure of women in China for each year of this period. These are the TFRs reported in the IDB for each of these years.
From 1996-2008, the TFRs used to generate the estimates in the IDB for each year are calculated as the average of the implied TFR, calculated as described above, for each year and the unadjusted TFRs officially reported in annual surveys or censuses. After 2008, the TFR is projected and rises gradually throughout the projection period to 2050.
We chose the TFRs implied by the official CBR for the 1990-1995 period because they correspond closely to those estimated based on new school enrollments. Moreover, use of these TFRs in forward projections suggests that 13 percent of children at ages 5-9 went unreported in the 2000 census, close to that implied by backward projections of those 10-14 in the 2005 sample census.
Following 1995, however, we chose a lower set of TFR estimates based on their correspondence with 1) new school enrollment estimates, 2) estimates implied from figures supplied by provinces to the NBS, and 3) estimates published by other researchers. Moreover, use of these TFRs from 1996-2000 in forward projections implies levels of underreporting of children

50
rate of mortality than the previous projections, due to reduced expectations of health care
system improvement.
In what follows the data accessed in August 2009 are referred to as the “earlier”
estimates, while those accessed in January 2010 are referred to as the “later” estimates.
Population Size and Growth
In the “later” data accessed in January 2010, the population size of China’s
population peaks six years earlier, in 2026, at 1,395 billion and 67 million lower, than in
the earlier projection (peak at 1,462 billion in 2032); see Figure A.1. In the later estimates
India passes China in total population size in 2025, whereas in the earlier estimates this
crossover occurred a year later, in 2026. In the earlier estimates, China’s population was
projected to be 1.461 billion by 2035, the last year that we consider, whereas in the later
estimates it is projected to be 83 million less (1.378 billion). The difference between the
earlier and later projections for 2035 for India is even greater (92 million; 1.611 billion
for the earlier estimates vs. 1.529 billion for the later).
750,000,000
850,000,000
950,000,000
1,050,000,000
1,150,000,000
1,250,000,000
1,350,000,000
1,450,000,000
1,550,000,000
1,650,000,000
1,750,000,000
2000 2005 2010 2015 2020 2025 2030 2035
Year
Po
pu
latio
n S
ize
India Earlier India Later China Earlier China Later
Figure A.1. Total Mid Year Population 2000-2035, a Comparison of “Earlier” and “Later” IDB Estimates for China and India
in the 2000 census similar to those implied by backward projections of those aged 5-9 in the 2005 sample census.

51
As a result, the population growth rates are lower in both countries in the later
estimates, and China’s growth rate becomes negative six years earlier (in 2027 rather than
2033) in the “later” data compared to the “earlier” data (Figure A.2).
-0.50
0.00
0.50
1.00
1.50
2.00
2000 2005 2010 2015 2020 2025 2030 2035
Year
Per
cent
of p
opul
atio
n pe
r ye
ar
India Earlier India Later China Earlier China Later
Figure A.2. Population Growth Rates 2000-2035, a Comparison of “Earlier” and “Later” IDB Estimates for China and India
Fertility
The later estimates of TFRs for China are all considerably lower than the earlier
estimates, with the largest difference around 2015 (Figure A.3).

52
1.0
1.5
2.0
2.5
3.0
3.5
2000 2005 2010 2015 2020 2025 2030 2035
Year
Num
ber
of C
hild
ren
per
Wom
an
India Earlier India Later China Earlier China Later
Figure A.3. Population Growth Rate 2000-2035, a Comparison of “Earlier” and “Later” IDB Estimates for China and India
The two sets of TFR data for India are quite similar, with slightly lower later
values between 2005 and 2010 in the later estimates. As a result, similar differences are
seen in comparing the earlier and later estimates of CBRs for each country (Figure A.4).
5
10
15
20
25
30
2000 2005 2010 2015 2020 2025 2030 2035Year
Birt
hs p
er 1
,000
pop
ulat
ion
India Earlier India Later China Earlier China Later
Figure A.4. Crude Birth Rates 2000-2035, a Comparison of “Earlier” and “Later” IDB Estimates for China and India
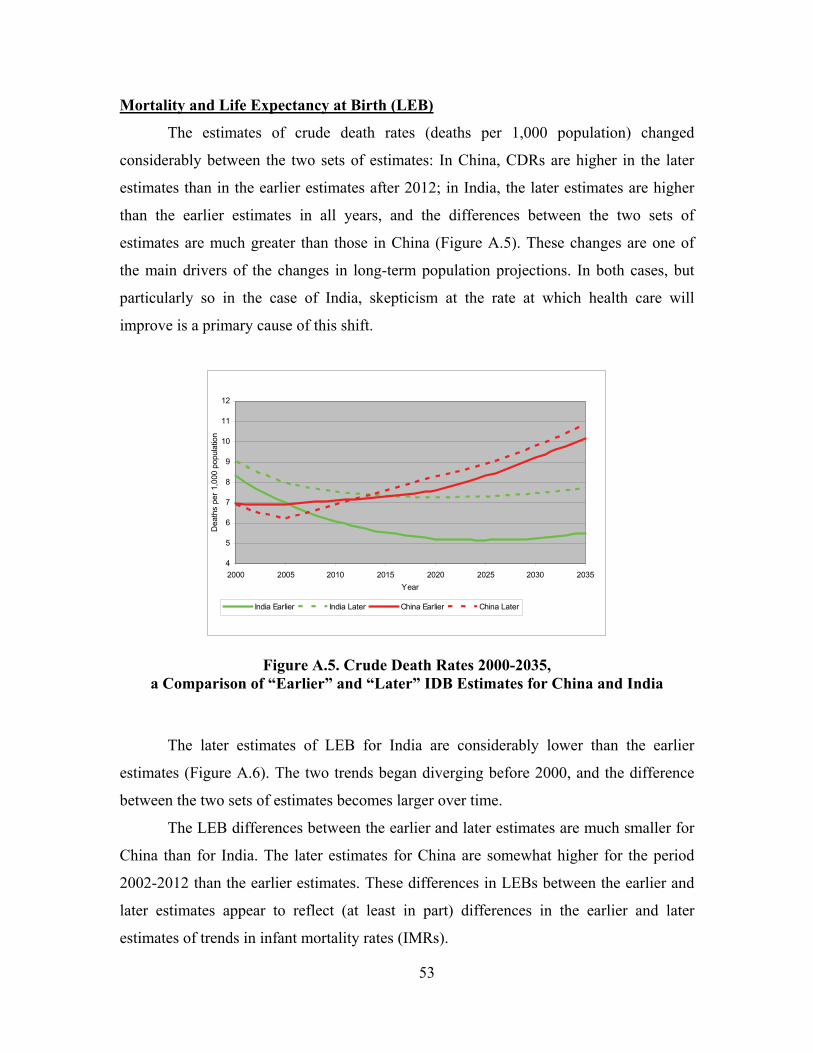
53
Mortality and Life Expectancy at Birth (LEB)
The estimates of crude death rates (deaths per 1,000 population) changed
considerably between the two sets of estimates: In China, CDRs are higher in the later
estimates than in the earlier estimates after 2012; in India, the later estimates are higher
than the earlier estimates in all years, and the differences between the two sets of
estimates are much greater than those in China (Figure A.5). These changes are one of
the main drivers of the changes in long-term population projections. In both cases, but
particularly so in the case of India, skepticism at the rate at which health care will
improve is a primary cause of this shift.
4
5
6
7
8
9
10
11
12
2000 2005 2010 2015 2020 2025 2030 2035
Year
Dea
ths
per
1,00
0 po
pula
tion
India Earlier India Later China Earlier China Later
Figure A.5. Crude Death Rates 2000-2035, a Comparison of “Earlier” and “Later” IDB Estimates for China and India
The later estimates of LEB for India are considerably lower than the earlier
estimates (Figure A.6). The two trends began diverging before 2000, and the difference
between the two sets of estimates becomes larger over time.
The LEB differences between the earlier and later estimates are much smaller for
China than for India. The later estimates for China are somewhat higher for the period
2002-2012 than the earlier estimates. These differences in LEBs between the earlier and
later estimates appear to reflect (at least in part) differences in the earlier and later
estimates of trends in infant mortality rates (IMRs).

54
60
65
70
75
80
85
2000 2005 2010 2015 2020 2025 2030 2035
Year
Yea
rs
India Earlier India Later China Earlier China Later
Figure A.6. Life Expectancy at Birth 2000-2035, a Comparison of “Earlier” and “Later” IDB Estimates for China and India
For India the later estimates of IMRs are considerably higher than the earlier
estimates throughout the 2000-2035 period; for China the IMRs are slightly lower in the
later set of estimates for the period 2001-2015 (Figure. A.7).

55
0
10
20
30
40
50
60
70
80
2000 2005 2010 2015 2020 2025 2030 2035
Year
Infa
nt d
eath
s pe
r 1,
000
live
birt
hs
India Earlier India Later China Earlier China Later
Figure A.7. Infant Mortality Rates 2000-2035, a Comparison of “Earlier” and “Later” IDB Estimates for China and India
The differences between the two series of IMRs are greater for females than for
males in both countries (Figures A.8 and A.9).
0
10
20
30
40
50
60
70
80
2000 2005 2010 2015 2020 2025 2030 2035
Year
Infa
nt d
eath
s pe
r 1,
000
live
birt
hs
India Earlier India Later China Earlier China Later
Figure A.8. Male Infant Mortality Rates 2000-2035, a Comparison of “Earlier” and “Later” IDB Estimates for China and India

56
0
10
20
30
40
50
60
70
80
2000 2005 2010 2015 2020 2025 2030 2035
Year
Infa
nt d
eath
s pe
r 1,
000
live
birt
hs
India Earlier India Later China Earlier China Later
Figure A.9. Female Infant Mortality Rates 2000-2035, a Comparison of “Earlier” and “Later” IDB Estimates for China and India
Net immigration
The later estimates for China show less net emigration prior to 2025 and more
after that year (Figure A.10). The trend in the later estimates is flatter than that in the
earlier estimates. There is no difference between the two sets of estimates for India.

57
-0.45
-0.40
-0.35
-0.30
-0.25
-0.20
-0.15
-0.10
-0.05
0.00
2000 2005 2010 2015 2020 2025 2030 2035
Year
Mig
rant
s pe
r 10
00
India Earlier India Later China Earlier China Later
Figure A.10. Net Emigration Rates 2000-2035, a Comparison of “Earlier” and “Later” IDB Estimates for China and India
Dependency Ratios
The dependency ratio is of particular interest in our study. This ratio is lower in
both countries for the later estimates than the earlier estimates, with the differences being
greater in China than in India for the years 2007-2025, while the differences are greater
for India than China after that (Figure A.11).

58
0.30
0.35
0.40
0.45
0.50
0.55
0.60
0.65
2000 2005 2010 2015 2020 2025 2030 2035
Year
Rat
io
India Earlier India Later China Earlier China Later
Figure A.11. Total Dependency Ratios 2000-2035, a Comparison of “Earlier” and “Later” IDB Estimates for China and India
For China these differences are due to differences in youth dependency ratios
(Figure A.12). The lower youth dependency ratios in the later estimates reflect the lower
TFRs and CBRs in those estimates, seen above. India also has lower youth dependency
ratios in the later estimates; these appear to reflect the higher values of IMRs in the later
data (because, for India, there is very little difference in CBRs and TFRs between the two
sets of estimates).

59
0.20
0.25
0.30
0.35
0.40
0.45
0.50
0.55
0.60
2000 2005 2010 2015 2020 2025 2030 2035
Year
Rat
io
India Earlier India Later China Earlier China Later
Figure A.12. Youth Dependency Ratios 2000-2035, a Comparison of “Earlier” and “Later” IDB Estimates for China and India
The old-age dependency ratios for India are slightly lower in the later set of
estimates compared to the earlier ones (presumably due to the lower estimated values of
LEB in the later estimates), and that, too, contributes to the difference in total
dependency ratios between the two sets of estimates (Figure A.13). Old-age dependency
ratios for China are slightly higher in the later estimates.
0.00
0.05
0.10
0.15
0.20
0.25
0.30
0.35
2000 2005 2010 2015 2020 2025 2030 2035
Year
India Earlier India Later China Earlier China Later
Figure A.13. Elderly Dependency Ratios 2000-2035, a Comparison of “Earlier” and “Later” IDB Estimates for China and India

60
Despite these differences in the levels of dependency ratios, the patterns of their
trends are similar for the two sets of estimates. For example, China’s dependency ratio is
at its minimum in the same year -- 2011 -- in both sets of estimates, and the curves for
India are very flat and reach their minima in the late 2020s. In the later estimates, the old-
age dependency ratio for China surpasses its youth dependency ratio in 2029 whereas this
occurred in 2031 in the earlier estimates.
The effect of these changes can be observed in the plot of the projected percentage
of population of working age (Figure A.14). The crossover point at which India surpasses
China in the percentage of the population that is of working age occurs two years earlier
(2030) in the later estimates than in the earlier estimates (2032). The amount by which
China exceeds India on this indicator is greatest in the later estimates compared to the
earlier ones for the period 2015-2020, whereas India exceeds China by more in the later
estimates than in the earlier estimates for years after 2027. The percentage of the
population that is of working age reaches a maximum in China in the same year (2011) in
both sets of estimates and changes little between the two sets of estimates for India
(2025-2030 in the earlier estimates, 2027-2031 in the later estimates).
Figure A.14. Percentage of Population of Working Age 2000-2035, a Comparison of “Earlier” and “Later” IDB Estimates for China and India

61
Number of Women of Childbearing Age
The numbers of women of childbearing age are lower in the later estimates in
both countries for the years ahead (Figure A.15).
200,000,000
220,000,000
240,000,000
260,000,000
280,000,000
300,000,000
320,000,000
340,000,000
360,000,000
2000 2005 2010 2015 2020 2025 2030 2035
Year
Pop
ulat
ion
Siz
e
India Earlier India Later China Earlier China Later
Figure A.15. Numbers of Women of Childbearing Age 2000-2035, a Comparison of “Earlier” and “Later” IDB Estimates for China and India
Estimates by the United Nations Population Division (UNPD)
Every two years the United Nations Population Division (UNPD) issues a report,
World Population Prospects, that includes estimates of actual population size for every
country in the world for every five years in the past beginning in 1950 and for three
variants (low, medium, and high) of projections for every five years in the future through
2050. Over the years that the U.N. has made its projections, the assumptions underlying
the three variants have changed. In this appendix, we use data from the UNPD
projections made from the 2008 Revision (UNPD, 2009a).
The U.N. data on “China” include Taiwan. To make the U.N. data comparable to
all of the other data in this paper, we have adjusted them to exclude Taiwan by

62
subtracting current IDB data (accessed on May 20, 2010) for Taiwan.31 The different
variant estimates vary mainly in the assumptions that they make about current and future
levels of TFRs.32
Figure A.16 below shows the U.N.’s high-, medium-, and low-variant estimates
for India and (Taiwan-less) China for the period 2000-2035. In medium-variant
estimates, which are the ones most often used, India’s population surpasses China’s in
size shortly before 2025. However, estimates of population sizes and crossover points
vary widely depending on which combination of variants is used, which is not surprising
given the differences in TFR assumptions across the variants (a difference of 1 child per
woman between the low and high variant in each country for all years after 2020). For
example, with the low-variant estimates for China and the high-variant estimates for
India, India is projected to surpass China in population size before 2020, whereas with
the high-variant estimates for China and the low-variant estimates for India, China’s
population will still exceed India’s in 2035.
31 For 2010, the IDB estimates the population of Taiwan to be 23.0 million, whereas the IDB
estimate for China is 1.3301 billion. Hence, Taiwan accounts for only 1.7% of the population of the U.N.’s “China.”
32 The table below shows the TFR assumptions underlying UNPD’s high, medium, and low variants.
TFRs (Children per Woman) Underlying the U.N.’s 2010 High-, Medium-, and Low-Variant
Estimates for China and India
China India
High Medium Low High Medium Low
2000-2005 1.77 1.77 1.77 3.11 3.11 3.11
2005-2010 1.77 1.77 1.77 2.76 2.76 2.76
2010-2015 2.04 1.79 1.54 2.77 2.52 2.27
2015-2020 2.24 1.84 1.44 2.70 2.30 1.90
2020-2025 2.35 1.85 1.35 2.62 2.12 1.62
2025-2030 2.35 1.85 1.35 2.46 1.96 1.46
2030-2035 2.35 1.85 1.35 2.36 1.86 1.36 Similarly, mortality is projected on the basis of models of change of life expectancy produced by the
UNPD. These models produce smaller gains the higher the life expectancy already reached. The selection of a model for each country is based on recent trends in life expectancy by sex. These assumptions are constant across the UN scenarios.

63
1,000,000
1,100,000
1,200,000
1,300,000
1,400,000
1,500,000
1,600,000
1,700,000
1990 2000 2010 2020 2030 2040
Year
Pop
ulat
ion
size
(in
mill
ions
)ChinaHigh
China Low
ChinaMedium
India High
India Low
IndiaMedium
SOURCE: From projections in the 2008 Revision; Chinese data have been adjusted to exclude Taiwan by subtracting the IDB estimates for Taiwan.
Figure A.16. U.N Low-, Medium-, and High-Variant Projections of Total Population Sizes of China and India 2000-2035
Figure 17 below compares the U.N. medium-variant estimates to the IDB
estimates of total population size. For India, the U.N. estimates are higher than the IDB
estimates throughout the 2000-2035 period. For China, the U.N. estimates are higher than
the IDB estimates for the period 2015-2035. Despite the fact that the U.N. estimates are
higher than the IDB estimates for the future, the crossover points occurs around 2025 in
the both sets of estimates. Note that the crossover point in the IDB data now on the
Census Bureau website (“later” estimates) is much more similar to that in the U.N. data
than was the case for the IDB data that were on the Census Bureau website in August
2009.

64
1,000,000
1,100,000
1,200,000
1,300,000
1,400,000
1,500,000
1,600,000
1990 2000 2010 2020 2030 2040Year
Po
pu
latio
n s
ize
(in
mill
ion
s)
U.N. China (med. var.) U.N. India (med. var.)
IDB China ("Later") IDB India ("Later")
SOURCE: U.N. data are from projections in the 2008 Revision. U.N. data for China have been adjusted to exclude Taiwan by subtracting the IDB estimates for Taiwan.
Figure A.17. Comparison of IDB (“Later”) and U.N Medium-Variant Projections of Total Population Size of China and India 2000-2035
Conclusion
We have shown in this appendix that estimates of population statistics for China
and India, not only for the future but also for the past, differ across sources and even for
the same source for data issued at different points in time, and, furthermore, for the U.N.
data across its high, medium, low variants. Nonetheless, although the date at which the
population of India is projected to surpass that of China and the date when China’s
population peaks and begins decreasing vary across estimates, the general patterns shown
in the body of this paper remain qualitatively the same when other estimates are
considered.

65
References
Acharya, Shankar, “Can India Grow Without Bharat?” India Abroad, November 25,
2003. As of July 20, 2010: http://www.rediff.com/money/2003/nov/25guest.htm
Apps, Patricia Frances, and Ray Rees, “Fertility, Female Labor Supply and Public
Policy,” Institute for the Study of Labor (IZA), Discussion Paper #409, 2001.
Banister, Judith, David E. Bloom, and Larry Rosenberg, “Population Aging and
Economic Growth in China,” Program on Global Demography and Aging, Harvard
University, Working Paper 53, March 2010. As of July 21, 2010:
http://www.hsph.harvard.edu/pgda/WorkingPapers/2010/PGDA_WP_53.pdf
Bardhan, Pranab, “Crouching Tiger, Lumbering Elephant: A China-India Comparison,”
in Kaushik Basu, Ranjan Ray, and Pulin Nayak, eds., Markets and Governments, New
York: Oxford University Press, 2003.
Blayo, Yves, “Political Events and Fertility in China Since 1950,” Population: An English
Selection, Vol. 4, 1992, pp. 209-232.
Bongaarts, John, and Rodolfo A. Bulatao, eds., Beyond Six Billion: Forecasting the World’s
Population, Washington: National Academy Press, 2000.
Bloom, David E., and David Canning., “Global Demographic Change: Dimensions and
Economic Significance,” in David E. Bloom, Alexia Prskawetz, and Wolfgang Lutz,
eds., Population Aging, Human Capital Accumulation, and Productivity Growth,
special issue of Population and Development Review, supplement to Vol. 33, 2007.
Bloom, David E., David Canning, and Jaypee Sevilla, The Demographic Dividend: A
New Perspective on the Economic Consequences of Population Change, Santa Monica,
Calif.: RAND Corporation, MR-1274-WFHF/DLPV/RF, 2003. As of July 21, 2010:
http://www.rand.org/pubs/monograph_reports/MR1274

66
Bloom, David E., David Canning, Günther Fink, and Jocelyn E. Finlay, “Fertility, Female
Labor Force Participation and the Multiplier Effect,” Harvard School of Public Health,
2009. As of July 21, 2010:
http://iussp2009.princeton.edu/download.aspx?submissionId=92713
Bradsher, Keith, “In Downturn, China Sees Path to Growth,” New York Times, March 17,
2009.
Bulatao, R.A., and Lee, R.D. (eds.) “The Changing Economic Costs and Benefits of
Having Children,” in, Determinants of Fertility in Developing Countries, (New York:
Academic Press for the National Research Council, 1983), Vol. I, pp. 494-516.
Cai, Yong, “Assessing Fertility Levels in China Using Variable-r Method,” paper presented at
the annual meeting of the Population Association of America, Boston, April 2005.
Cai, April, “China’s Pension System Faces Major Reform,” China Business, July 21,
2006. As of July 21, 2010:
http://www.atimes.com/atimes/China_Business/HG21Cb01.html
Carnell, Brian, “China’s One Child Policy,” May 17, 2000. As of July 23, 2010:
http://web.archive.org/web/20010516010636/http://www.overpopulation.com/faq/Pop
ulation_Control/one_child.html
Central Intelligence Agency (CIA), “China,” The World Factbook, 2010a. As of April 8,
2011: https://www.cia.gov/library/publications/the-world-factbook/geos/ch.html
Central Intelligence Agency (CIA), “India,” The World Factbook, 2010b. As of April 8,
2011: https://www.cia.gov/library/publications/the-world-factbook/geos/in.html
Chatterji, Somnath, Paul Kowal, Colin Mathers, Nirmala Naidoo, Emese Verdes, James
P. Smith, and Richard Suzman, “The Health of Aging Populations in China and India,”
Health Affairs, Vol. 27, No. 4, July/August 2008, pp. 1052–1063.

67
Chen, Derek H.C., “Gender Equality and Economic Development: The Role for
Information and Communication Technologies,” World Bank Policy Research Working
Paper 3285, April 2004.
China Daily, “China Hit by Brain Drain, Report Says,” June 1, 2007. As of October 7,
2007: http://www.chinadaily.com.cn/china/2007-06/01/content_884824.htm
Coale, Ansley J., Rapid Population Change in China, 1952-1982, National Academy Press,
Washington D.C., 1984.
Cook, Ian G., and Trevor J. B. Dummer, “Changing Health in China: Re-Evaluating the
Epidemiological Transition Model,” Health Policy, Vol. 67, No. 3, March 2004, pp.
329–343.
Crane, Keith, Roger Cliff, Evan Madeiros, James Mulvenon, and William Overholt,
Modernizing China’s Military Opportunities and Constraints, MG-260, RAND
Corporation, Santa Monica, CA, 2005.
Das Gupta, Monica, Jiang Zhenghua, Li Bohua, Xie Zhenming, Woojin Ching, and Bae
Hwa-Ok, “Why Is Son Preference So Persistent in East and South Asia? A Cross-
Country Study of China, India, and the Republic of Korea,” Journal of Development
Studies, Vol. 40, No. 2, December 2003, pp. 153–187.
David, Henry P., “Eastern Europe: Pronatalist Policies and Private Behaviour,”
Population Bulletin, Vol. 36, No. 6, 1982, pp. 1–49.
Durand, John D., “Historical Estimates of World Population: An Evaluation,” Population
and Development Review, Vol. 3, No. 3, September 1977, pp. 253-296.
Dyson, Tim, “The Preliminary Demography of the 2001 Census of India,” Population
and Development Review, Vol. 27, No. 2, June 2001, pp. 341–356.

68
Dyson, Tim, “India’s Population—The Future,” in Tim Dyson, Robert Cassen, and Leela
Visaria, eds., Twenty-First Century India: Population, Economy, Human Development,
and the Environment, New York: Oxford University Press, 2004, pp. 74–107.
Dyson, Tim, and Pravin Visaria, “Migration and Urbanization: Retrospect and
Prospects,” in Tim Dyson, Robert Cassen, and Leela Visaria, eds., Twenty-First
Century India: Population, Economy, Human Development, and the Environment,
New York: Oxford University Press, 2004, pp. 108–129.
Eberstadt, Nicholas, “Aging in Low-Income Countries: Looking to 2025,” in Augusto
Lopez-Claros, Michael E. Porter, and Klaus Schwab, eds., Global Competitiveness
Report 2005–2006, Houndmills, England: Plagrave Macmillan, September 2005, pp.
163–178.
Eberstadt, Nicholas, “Power and Population in Asia,” Policy Review, No. 123, February–
March, 2004, As of July 11, 2010:
http://www.hoover.org/publications/policyreview/3439671.html
Edlund, Lena, Hongbin Li, Junjian Yi, and Junsen Zhang, More Men, More Crime:
Evidence from China’s One-Child Policy, Institute for the Study of Labor (IZA), IZA
Discussion Papers 3214, 2007.
Fargues, Philippe, “The Demographic Benefit of International Migration: Hypothesis and
Application to the Middle Eastern and North African Contexts,” World Bank Policy
Research Working Paper No. 4050, 2006
Finkelstein, David M., and Kristen Gunnes, eds., Civil-Military Relations in Today’s
China: Swimming in a New Sea, Armonk, NY: M. E. Sharpe, Inc., October 2006.
Fogel, Robert, “$123,000,000,000,000*,” Foreign Policy, January/February 2010. As of
July 210, 2010: http://www.foreignpolicy.com/articles/2010/01/04/123000000000000
Fortin, Nicole M., “Gender Role Attitudes and Women’s Labor Market Participation:
Opting-Out, AIDS, and the Persistent Appeal of Housewifery,” unpublished

69
manuscript, June 2009. As of July 21, 2009:
http://www.econ.ubc.ca/nfortin/Fortin_Gender.pdf
Gillingham, Robert, and Daniel Kanda, Pension Reform in India, International Monetary
Fund, WP/01/125, September 2001. As of July 23, 2010:
http://www.imf.org/external/pubs/ft/wp/2001/wp01125.pdf
Goldman, Charles A., Krishna B. Kumar, and Ying Liu, Education and the Asian Surge:
A Comparison of the Education Systems in India and China, Santa Monica, Calif.:
RAND Corporation, OP-218-CAPP, 2008. As of July 23, 2010:
http://www.rand.org/pubs/occasional_papers/OP218/
Golley, Jane, and Rod Tyers, “China’s Growth to 2030: Demographic Change and the
Labor Supply Constraint,” Australian National University, 2006.
Gordon, David, The Next Wave of HIV/AIDS: Nigeria, Ethiopia, Russia, India, and
China, Washington, D.C.: National Intelligence Council, September 2002.
Goswami, Ranadev, “Indian Pension System: Problems and Prognosis,” International
Actuarial Association, Pension Seminar, Brighton, United Kingdom, 5-7 June 2001.
As of April 8, 2011:
http://www.actuaries.org/EVENTS/Seminars/Brighton/presentations/goswami.pdf.
Grant, Jonathan, Stijn Hoorens, Suja Sividasan, Mirjam van het Loo, Julie DaVanzo,
Lauren Hale, Shawna Gibson, and William Butz, Low Fertility and Population Ageing:
Causes, Consequences and Policy Options, Santa Monica, Calif.: RAND Corporation,
MG-206-EC, 2004. As of July 23, 2010:
http://www.rand.org/pubs/monographs/MG206/
Greenhalgh, Susan, “Shifts in China’s Population Policy, 1984-86: Views from the Central,
Provincial, and Local Levels,” Population and Development Review, Vol. 12, No. 3,
September 1986, pp. 491-515.

70
Greenhalgh, Susan, and Edwin A. Winckler, Governing China’s Population: From
Leninist to Neoliberal Biopolitics, Stanford, Calif.: Stanford University Press, 2005.
Gupta, Prashant, Rajat Gupta, and Thomas Netzer, Building India: Accelerating
Infrastructure Projects, Mumbai, India: McKinsey and Company, August 2009. As of
July 23, 2010:
http://www.mckinsey.com/locations/india/mckinseyonindia/pdf/Building_India_Execu
tive_Summary_Media_120809.pdf
Gupta, S. P., India: Vision 2020, New Delhi: Planning Commission, Government of
India, December 2002. As of July 26, 2010:
http://planningcommission.nic.in/reports/genrep/pl_vsn2020.pdf
Gupte, D. M., V. Ramachandran, and R. K. Mutatkar, “Epidemiological Profile of India:
Historical and Contemporary Perspectives,” Journal of Biosciences, Vol. 26, No. 4,
November 2001, pp. 437–464.
He, Jiang, Dongfeng Gu, Xigui Wu, Kristi Reynolds, Xiufang Duan, Chonghua Yao,
Jialiant Want, Chung-Shiuan Chen, Jing Chen, Rachel P. Wildman, Michael J. Klag,
and Paul K. Whelton, “Major Causes of Death Among Men and Women in China,”
New England Journal of Medicine, Vol. 53, No. 11, September 15, 2005, pp. 1124–
1134.
Horton, Susan, “The Nutritional and Epidemiological Transitions,” IFPRI 2020 Vision
conference panelist comments, Bonn, September 4–6, 2001. As of July 23, 2010:
http://www.ifpri.org/2020conference/PDF/summary_horton.pdf
Huang, Jikun, Linxiu Zhang, Qiang Li, and Huanguang Qiu, National and Regional
Economic Development Scenarios for China’s Food Economy Projections in the Early
21st Century, Chinese Academy of Sciences, December 2003.
Hudson, Valerie M., and Andrea M. den Boer, Bare Branches: The Security Implications
of Asia’s Surplus Male Population, Cambridge, Mass.: MIT Press, 2004.

71
Hugo, Graeme, “Declining Fertility and Policy Intervention in Europe: Some Lessons for
Australia?” Journal of Population Research, Vol. 17, No. 2, November 2000.
Jha, Prabhat, Rajesh Kumar, Priya Vasa, Neeraj Dhingra, Deva Thirachelvam, and Rahim
Moineddin, “Low Male-to-Female Ratio of Children Born in India: National Survey of
1.1 Million Households,” The Lancet, Vol. 367, No. 9506, January 21, 2006, pp. 211–
218.
Joint United Nations Programme on HIV/AIDS, Report on the Global AIDS Epidemic,
2006a. As of July 23, 2010:
http://www.unaids.org/en/KnowledgeCentre/HIVData/GlobalReport/2006/default.asp
Joint United Nations Programme on HIV/AIDS, AIDS Epidemic Update, 2006b. As of
July 23, 2010: http://data.unaids.org/pub/EpiReport/2006/2006_EpiUpdate_en.pdf
Joshi, Rohina, Magnolia Cardona, Srinivas Iyengar, A. Sukumar, C Ravi Raju, K. Rama
Raju, Krishnam Raju, K. Srinath Reddy, Alan Lopez, and Bruce Neal, “Chronic
Diseases Now a Leading Cause of Death in Rural India—Mortality Data from the
Andhra Pradesh Rural Health Initiative,” International Journal of Epidemiology, Vol.
35, No. 6, 2006, pp. 1522–1529.
Kim, M. Julie, and Rita Nangia, Infrastructure Development in India and China—A
Comparative Analysis, Pacific Basin Research Center, August 2008. As of July 23,
2010: http://www.pbrc.soka.edu/Resources/Documents/KimNangia.pdf
Lane, Trevor, “In India, Son Preference Declines with Ideal Family Size, but Remains
Strong,” International Family Planning Perspectives, Vol. 30, No. 2, June 2004, pp.
100–101.
Li, Changzu, “Jiedu dusheng zunibing” (Understanding the only-child soldiers),
Zhongguo wujing (China’s armed police), No. 31, February 2001, pp. 28-29.
Lin Shuanglin, “China’s Government Debt: How Serious?” China: An International
Journal, I, March 2003.

72
Lueth, Erik, “Capital Flows and Demographics—An Asian Perspective,” International
Monetary Fund, WP/08/8, 2008.
Ma, Sai, and Neeraj Sood, A Comparison of Health Systems in China and India, RAND
Corporation, OP-212, 2008. As of April 15, 2011:
http://www.rand.org/content/dam/rand/pubs/occasional_papers/2008/RAND_OP212.pd
f
Mason, Andrew, and Ronald Lee, “Reform and Support Systems for the Elderly in
Developing Countries: Capturing the Second Demographic Dividend,” Genus, Vol. 57,
No. 2, 2006, pp. 11–35.
Ministry of Rural Areas and Employment, “NSAP Guidelines for State Governments.”
As of April 8, 2011: http://www.oldagesolutions.org/Facilities/Noaps.aspx
National AIDS Control Organisation, “HIV Sentinel Surveillance and HIV Estimation in
India 2007: A Technical brief,” 2007. As of July 23, 2010:
http://www.nacoonline.org/Quick_Links/HIV_Data/
National Bureau of Statistics of China, China Statistical Yearbook, Beijing: China
Statistics Press, 2005. As of July 23, 2010:
http://www.stats.gov.cn/tjsj/ndsj/2005/indexeh.htm
National Intelligence Council, Mapping the Global Future, December 2004. As of July
23, 2010: http://www.foia.cia.gov/2020/2020.pdf
National Intelligence Council, Global Trends 2025: A Transformed World, NIC 2008-
003, 2008.
Poston, Dudley L., Jr., “Son Preference and Fertility in China,” Journal of Biosocial
Science, Vol. 34, No. 3, July 2002, pp. 333–347.

73
Poston, Dudley L., Jr., and Peter A. Morrison, “China: Bachelor Bomb,” International
Herald-Tribune, September 14, 2005.
Registrar General and Census Commissioner of India, Census of India, 2001. As of July
23, 2010: http://www.censusindia.net
Shuzhuo, Li, and Jin Xiaovi, “Uxorilocal Marriage in Contemporary Rural China,”
Chinese Cross Currents, Vol. 1, No. 4, October 2004, pp. 64–79.
Swarup, D. “Pension Reform in India – A Social Security Need,” Speech to the Social
Security Association of India, March 2008. As of April 8, 2011:
http://pfrda.org.in/writereaddata/linkimages/IIC_MARCH_2008739214703.pdf
Tyers, Rod, Jane Golley, and Iain Bain, “Projected Economic Growth in China and India:
The Role of Demographic Change,” Australian National University, 2006.
UNAIDS—See Joint United Nations Programme on HIV/AIDS.
UNESCO Institute of Statistics, Data Center. As of December 20, 2010:
http://stats.uis.unesco.org/unesco/tableviewer/document.aspx
UNPD—See United Nations Population Division.
United Nations Population Division, World Population Prospects: The 2008 Revision,
2009a. As of July 26, 2010: http://esa.un.org/unpp/index.asp
United Nations Population Division, World Population Prospects: The 2008 Revision
Population Database, 2009b. As of July 26, 2010:
http://esa.un.org/unpp/index.asp?panel=2
United Nations Population Division, World Urbanization Prospects: The 2009 Revision,
2009c. As of February 13, 2011: http://esa.un.org/unpd/wup/index.htm

74
United Nations Population Division, World Contraceptive Use, 2005. As of April 22,
2011:
http://www.un.org/esa/population/publications/contraceptive2005/WCU2005.htm.
U.S. Census Bureau, International Data Base, 2010. As of February 7, 2010:
http://www.census.gov/ipc/www/idb/
Uppal, Sharanjit, and Sisira Sarma, “Aging, Health and Labour Market Activity: The
Case of India,” World Health and Population, Vol. 9 No. 4, 2007. As of July 23, 2010:
http://www.longwoods.com/product.php?productid=19516
Visaria, Leela, “The Continuing Fertility Transition,” in Tim Dyson, Robert Cassen, and
Leela Visaria, eds., Twenty-First Century India: Population, Economy, Human Development,
and the Environment, New Delhi: Oxford University Press, 2004a, pp. 57-73.
Visaria, Leela, “Mortality Trends and the Health Transition,” in Tim Dyson, Robert
Cassen, and Leela Visaria, eds., Twenty-First Century India: Population, Economy,
Human Development, and the Environment, New Delhi: Oxford University Press,
2004b, pp. 32–56.
Wang, Feng, and Andrew Mason, “The Demographic Factor in China’s Transition,”
Chinese Journal of Population Science, Vol. 3, 2006, pp. 2-18.
Wilson, Dominic, and Roopa Purushothaman, “Dreaming with BRICs: The Path to
2050,” Goldman Sachs Global Economics Paper No. 99, October 2003. As of July 23,
2010: http://www2.goldmansachs.com/ideas/brics/brics-dream.html
Woetzel, Jonathan, Preparing for China’s Urban Billion, McKinsey Global Institute,
2008.
World Bank, “Girls’ Education,” January 4, 2009. As of July 23, 2010:
http://web.worldbank.org/WBSITE/EXTERNAL/TOPICS/EXTEDUCATION/0,,conte

75
ntMDK:20298916~menuPK:617572~pagePK:148956~piPK:216618~theSitePK:28238
6,00.html#why
World Bank, “Labor participation rate, female,” World Development Indicators, 2011. As of
April 15, 2011: http://data.worldbank.org/indicator/SL.TLF.CACT.FE.ZS
World Bank, World Development Indicators online database, no date. As of July 23,
2010: http://data.worldbank.org/data-catalog/world-development-indicators
World Health Organization, Country Cooperation Strategy at a Glance: India, 2006. As
of July 26, 2010:
http://www.who.int/countryfocus/cooperation_strategy/ccsbrief_ind_en.pdf
World Health Organization, Regional Office for the Western Pacific, “Country Context,
China,” 2009. As of July 26, 2010: http://www.wpro.who.int/countries/2008/chn
World Health Organization, WHO Statistical Information System (WHOSIS), no date.
As of July 26, 2010: http://www.who.int/whosis/en/index.html
World Health Organization, World Health Report 1999: Making a Difference, 1999. As
of July 26, 2010: http://www.who.int/whr/1999/en/
World Values Survey Association, World Values Survey website, 2009. As of July 26,
2010: http://www.worldvaluessurvey.org/
Xinhua News Agency, “China Solicits Public Opinions on 12-Year Plan for Education,”
January 8, 2009.
Yan Wang, Dianqing Xu, Zhi Wang, and Fan Zhai, “Transition Cost, Options and Impact
of China’s Pension Reform,” Policy Research Working Paper No. 2555, Washington,
D.C.: World Bank, February 2001.