Democratic Transitions David Epstein, Robert Bates, Jack Goldstone, Ida Kristensen, Sharyn...
31
Democratic Transitions David Epstein, Robert Bates, Jack Goldstone, Ida Kristensen, Sharyn O’Halloran
-
Upload
julius-cotterell -
Category
Documents
-
view
220 -
download
0
Transcript of Democratic Transitions David Epstein, Robert Bates, Jack Goldstone, Ida Kristensen, Sharyn...

Democratic Transitions
David Epstein, Robert Bates, Jack Goldstone, Ida Kristensen, Sharyn
O’Halloran

In the News… Building democracy is getting new
levels of scrutiny in the popular press Afghanistan
Built off existing institutions (loya jirga) Still, no real national government (“warlords”)
Iraq One justification for war was to establish a
democratic government in the Middle East But a long interim gov’t may be needed first

Big Questions How do you establish democracy? What keeps democratic governments
from sliding into autocracy/chaos? “Home-grown” vs. Imported democracy
How do you get non-violent transitions?
If democracy=elections, is this even a good thing for developing polities? Zakaria – “Illiberal Democracies”

Institutions vs. institutions We have certain outcomes that we
want a political system to deliver Policy that reflects public opinion
Public officials responsive to their constituents
Protection for minorities, esp. ethnic Rule of Law via a fair, efficient court
system Uncorrupt bureaucracy
These are Institutions Really, objectives of the system

Institutions vs. institutions We know little about what institutions
can provide these in different settings Parliamentary vs. Presidential systems Federalism and/or corporatism Electoral rules and campaign finance laws
Like economic institutions in China We have some examples of what fully
developed, stable democracies look like But how to reach this destination?

This Paper Try to look at how countries have
democratized in the past Review existing theories Present some new data and methods Look at the results and their
implications Speculate about how these trends
are changing in the 21st Century What, if anything, can the international
community do to help?

Quick Peek at the Results Results
Modernization theory holds up well Positive income effects at all levels of
democratization Also some support for inequality effects
Casts spotlight on partial democracies Numerous Most volatile Hardest to predict/understand

Modernization Theory Lipset (1959) – Money matters
Higher income per capita is associated with democratic governance
Supported by evidence until… Przeworski, et. al. (PACL, 2000)
Positive results were due to over-aggregation of data
Separate into democracies and all others
Nothing predicts transitions up Once up, per capita income of over $4,000
helps keep things stable

Other Theories Acemoglu & Robinson (2003)
Transitions are economically based, as they redistribute income from rich to poor
Nonlinear impact of inequality on transitions Rosendorff (2001)
Inequality as well, plus increases in workforce and capital stock make revolutions less likely
Haggard & Kaufman (1995) Inflation & low growth: transitions out of
autocracy Schmitter, O’Donnell – Consolidation
Factors promoting transition could make it fragile

Data: Partial Democracies PACL employ a dichotomous regime
type Democracy if:
Chief executive elected Legislature exists and is elected More than one political party At least one successful transition of power
Autocracy otherwise We employ a trichotomous measure,
including partial democracy

Distribution of Polity ScoresF
ract
ion
Polity Score-10 -9 -8 -7 -6 -5 -4 -3 -2 -1 0 1 2 3 4 5 6 7 8 9 10
0
.1
.2

Distribution of Polity ScoresF
ract
ion
Polity Score-10 -9 -8 -7 -6 -5 -4 -3 -2 -1 0 1 2 3 4 5 6 7 8 9 10
0
.1
.2
Autocracy

Distribution of Polity ScoresF
ract
ion
Polity Score-10 -9 -8 -7 -6 -5 -4 -3 -2 -1 0 1 2 3 4 5 6 7 8 9 10
0
.1
.2
Autocracy
FullDemoc.

Distribution of Polity ScoresF
ract
ion
Polity Score-10 -9 -8 -7 -6 -5 -4 -3 -2 -1 0 1 2 3 4 5 6 7 8 9 10
0
.1
.2
Autocracy
FullDemoc.
PartialDemoc.

World Democratization Trends, 1955-2000
0%
10%
20%
30%
40%
50%
60%
70%
80%
90%
100%
1955
1957
1959
1961
1963
1965
1967
1969
1971
1973
1975
1977
1979
1981
1983
1985
1987
1989
1991
1993
1995
1997
1999
Year
Democracy
Partial
Autocracy

Regional Democratization Trends, 1955-2000
South America
EuropeAustralia
Africa Asia
North & Central America

Transition Frequencies
A
D
P
A P D
97.47 1.89 0.63
5.12 91.97 2.90
1.00 0.87 98.13
1-Year

Transition Frequencies
A
D
P
A P D
A
D
P
A P D
97.47 1.89 0.63
5.12 91.97 2.90
1.00 0.87 98.13
89.64 7.13 3.24
20.43 65.76 13.81
3.84 4.13 92.03
1-Year 5-Year

AP AD
Autocracy
year1956 1960 1970 1980 1990 2000
0
2
4
6
8
year1956 1960 1970 1980 1990 2000
0
2
4
6
8
PDPA
Partial Dem.
year1956 1960 1970 1980 1990 2000
0
2
4
6
8
year1956 1960 1970 1980 1990 2000
0
2
4
6
8
DA DP
Democracy
year1956 1960 1970 1980 1990 2000
0
2
4
6
8
year1956 1960 1970 1980 1990 2000
0
2
4
6
8
66 obs.
16 obs. 14 obs.
44 obs. 25 obs.
22 obs.
Transition Frequencies by Type and Year
Data: Previous Transitions Previous attempts at transition may
affect success of current attempt Is it like:
Trying to quite smoking (+); or A sign of structural instability (-)
Hard to capture this systematically We use “Sumdown,” the sum of
previous downward Polity movements Example: Turkey, 1955-2000

Pol
ity S
cale
Year
Polity Score PrevTrans
1955 1965 1975 1985 1995 2000-10
0
10
20
30
4
8
-2
9
-5
79 8
7
9
01
11
2526 27
Illustration of PrevTrans Variable for Turkey, 1955-2000

Data: Inequality Plays a big role in many stories,
including Acemoglu and Robinson Previous measures are rather
incomplete Even Denninger and Squire agree with this
We create a new measure Idea: infant mortality is caused by both
health conditions & inequality So regress IM on health correlates and take
the residual as a measure of inequality

Infant Mortality Residual vs. Gini Coefficient
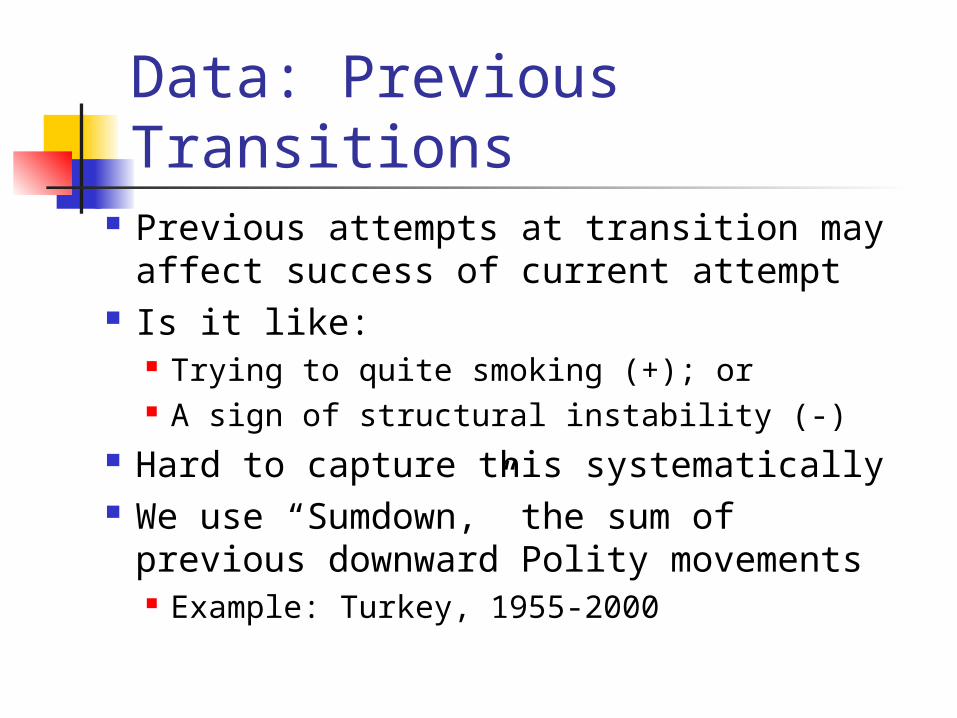
Econometric Approaches Tobit
Traditional regression approach, using full data range
But with limits at –10 and 10 Markov
Breaks data into three categories: autocracy, partial democracy, full democracy
Looks at impact of variables on transition probabilities
Duration Analysis Analyzes length of time until a given transition
occurs

Predictions Modernization: GDP/capita (+) Acemoglu & Robinson: Inequality (-),
Inequality2 (-) Rosendorff: Inequality (-),
Workforce (-), CapitalStock (-) Haggard & Kaufmann: GDP growth
(+), inflation(-) Consolidation: non-monotone hazard

Markov Analysis0
.51
4.338934 10.69568
0.5
1
4.597264 9.659036
0.5
1
5.209844 10.73535
0.5
1
-1.45599 1.74149
0.5
1
-1.641473 1.25747
0.5
1
-1.379472 1.452754
0.5
1
0 43
0.5
1
0 43
0.5
1
0 27
GDP/cap
Inequality
Previous Attempts
Autocracy Partial Democracy

Duration Analysis Question: What prevents newly
democratized countries from backsliding? Different from the question of what gets them
democratic in the first place Can ask this for full or partial democracies
I.e., most newly democratized nations will start off as partial democracies
Tricky estimation, since we have repeated events (can democratize more than once)

0.20
0.40
0.60
0.80
1.00
0 50 0 50
0 1
Observed: highgdp = 0 Observed: highgdp = 1Predicted: highgdp = 0 Predicted: highgdp = 1
Sur
viva
l Pro
babi
lity
analysis time
Graphs by highgdp

.2.3
.4.5
.6
10 20 30 40 50analysis time
Smoothed Hazard Estimate, Adjusted for Per Capita GDP
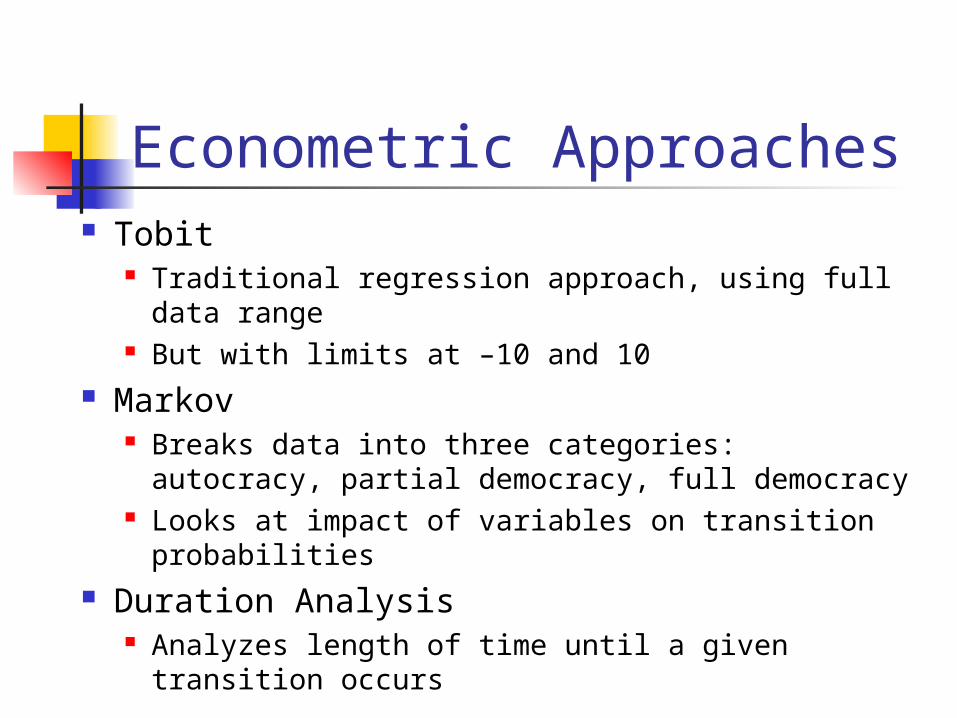
Conclusion Modernization theory holds up well
With 3-way dependent variable, income level does predict transitions out of autocracy
Helps keep partials from backsliding Acemoglu and Robinson get some
support Focus debate on partial democracies
Increasingly common Most volatile Hardest to predict

Markov Analysis
Variable
Pro
bab
ility
Autocracy
Partial Dem.Full Democracy


![[David Epstein, Sharyn O'Halloran] Delegating Powe(BookZZ.org)](https://static.fdocuments.in/doc/165x107/563dbb59550346aa9aac625d/david-epstein-sharyn-ohalloran-delegating-powebookzzorg.jpg)