Democracy and Reforms: Evidence from a New Dataset · Democracy and Reforms: Evidence from a New...
43
1 Democracy and Reforms: Evidence from a New Dataset * July, 2010 Paola Giuliano UCLA, NBER, CEPR and IZA Prachi Mishra IMF Antonio Spilimbergo IMF, CEPR, and WDI Abstract Empirical evidence on the relationship between democracy and economic reforms is limited to few reforms, countries, and years. This paper studies the impact of democracy on the adoption of economic reforms using a new dataset on reforms in the financial, capital and banking sectors, product markets, agriculture, and trade for 150 countries over the period 1960–2004. Democracy has a positive and significant impact on the adoption of economic reforms but there is no evidence that economic reforms foster democracy. Our results are robust to the inclusion of a large variety of controls and estimation strategies. JEL Classification Numbers: O57, E6 Keywords: Institutions, political economy, transition, economic liberalization. Authors’ E-mail address: [email protected] ; [email protected] ; [email protected] * The views expressed in this paper are those of the author(s) and do not necessarily represent those of the IMF or its board of directors. Alessandro Prati provided invaluable comments and suggestions. We are grateful to Daron Acemoglu, Paola Conconi, Francesco Giavazzi, Dennis Quinn, Guido Tabellini and the seminar participants at the 2007 IMF seminar on structural reforms, the 2008 Annual Meetings of the American Economic Association in Atlanta, the 2008 North-Eastern Universities Development Conference in Boston, the 2008 IMF seminar on structural reforms, and the 2010 annual meeting of the Society for Economic Dynamics for helpful comments.
Transcript of Democracy and Reforms: Evidence from a New Dataset · Democracy and Reforms: Evidence from a New...
1
Democracy and Reforms: Evidence from a New Dataset*
July, 2010
Paola Giuliano UCLA, NBER, CEPR and IZA
Prachi Mishra
IMF
Antonio Spilimbergo IMF, CEPR, and WDI
Abstract
Empirical evidence on the relationship between democracy and economic reforms is limited to few reforms, countries, and years. This paper studies the impact of democracy on the adoption of economic reforms using a new dataset on reforms in the financial, capital and banking sectors, product markets, agriculture, and trade for 150 countries over the period 1960–2004. Democracy has a positive and significant impact on the adoption of economic reforms but there is no evidence that economic reforms foster democracy. Our results are robust to the inclusion of a large variety of controls and estimation strategies. JEL Classification Numbers: O57, E6 Keywords: Institutions, political economy, transition, economic liberalization. Authors’ E-mail address: [email protected]; [email protected]; [email protected]
* The views expressed in this paper are those of the author(s) and do not necessarily represent those of the IMF or its board of directors. Alessandro Prati provided invaluable comments and suggestions. We are grateful to Daron Acemoglu, Paola Conconi, Francesco Giavazzi, Dennis Quinn, Guido Tabellini and the seminar participants at the 2007 IMF seminar on structural reforms, the 2008 Annual Meetings of the American Economic Association in Atlanta, the 2008 North-Eastern Universities Development Conference in Boston, the 2008 IMF seminar on structural reforms, and the 2010 annual meeting of the Society for Economic Dynamics for helpful comments.

2
1. Introduction
Political and economic freedoms go hand in hand … or do they not? This is one of
the oldest questions in economics and in political science, which is still largely unanswered.
This paper answers this question using a novel dataset on economic reforms, which is the
most exhaustive in the literature in terms of countries, years, and range of reform coverage.
This question is still open because there are very good theoretical arguments and
numerous examples as to why political freedom can either hinder or facilitate economic
reforms. Take the historical examples of Chile under Pinochet, or South Korea under Park.
In both cases, important economic reforms were undertaken under dictatorial regimes. The
majority of the contemporary industrialized countries were not democracies when they took
off (Schwarz, 1992). In most cases, East Asian economies did develop under undemocratic
regimes. In addition to these historical examples from every region of the world and
different historical periods, there are compelling theoretical reasons as to why less
democratic regimes may favor economic reforms and growth.
A fully democratic regime can fall prey to interest groups, which put their goals
before general well being. Sometimes, capitalists entrenched in their rent-seeking positions
are the main opponents of economic reforms. In a newly independent country only a
‘benevolent dictator’ can shelter the institutions, avoid that the state becomes captive of any
specific interest group, and allow the state to perform its function in an efficient way.1
1 Along these lines, Haggard (1990) argues “... Institutions can overcome collective-action dilemmas by restraining the self-interested behavior of groups through sanctions: collective action problems can be resolved by command.”
In
particular, interest groups can block reforms if there is uncertainty about the distribution of
the benefits (Fernandez and Rodrik, 1991). In addition to pressure from interest groups,
democracy can lead to excessive private and public consumption and lack of sufficient
investment (Huntington, 1968); so dictatorial regimes can rely on financial repression to
increase the domestic saving rate. Wages are typically higher under democracy (Rodrik, 1999).
Several countries, including the Soviet Union and many East Asian countries, have been able
to increase savings, and ultimately achieve high economic growth rate, thanks to a repressive
political system and an attendant highly regulated financial system. In conclusion, do the
historical examples and the theoretical arguments provide a compelling case against the role
of democracy in fostering economic reforms? The answer to this question is a resounding no.

3
The alternative view that democracy often accompanies economic reforms is also
based on strong theoretical arguments and solid empirical evidence. Secured property rights,
as guaranteed by a democracy, are considered key to economic development. In general,
dictators cannot credibly make commitments because of time-inconsistency; so no reform
can be undertaken (McGuire and Olson, 1996). Autocratic rulers tend to be predatory,
disrupting economic activity and making any reform effort meaningless; autocratic regimes
have also an interest in postponing reforms and maintaining rent-generating activities for a
restricted number of supporting groups. On the opposite, democratic rulers should be more
sensitive to the interest of the public, and so more willing to implement reforms, which
destroy monopolies in favor of the general interests. In addition to these theoretical
arguments, there is strong empirical evidence that reforms are highly correlated with
democracy.
The correlation between democracy and economic reforms is very strong both
across time and in a cross section. Figure 1 shows the correlation over time between the
indices of democracy (measured as polity IV and normalized between 0 and 1) and reform
(all the indices are normalized between 0 and 1, with 0 corresponding to the least reformed
and 1 to the most reformed) in the following six sectors (or areas)2—(i) domestic financial,
(ii) capital account, (iii) product markets (electricity and telecommunications), (iv) agriculture,
(v) trade (based on tariffs) and (vi) current account transactions—over time.3
The sharp contrast between these opposing views has left the question of the effects
of democracy on economic reforms largely unanswered. The goal of this paper is to address
again this issue using a novel database, which covers almost 150 countries, 6 sectors and
spanning more than 40 years of data.
All the cases
show a strong correlation between democracy and regulation, with democracy usually
preceding the deregulation process. Figure 2 shows that the correlation holds very strongly
also when we take a cross section: countries that are more democratic are also more
reformed. However, these correlations in themselves do not show that democracy
necessarily causes economic reforms. The correlation could run in the opposite direction, or
both democracy and economic reforms could be driven by a common third factor.
2 We will use the term “sector” in the rest of the paper to denote the broad area in which the reforms take place. 3 See below for data description.

4
The main findings are that an increase in the quality of democratic institutions is
significantly correlated with the adoption of economic reforms but there is no evidence of a
feedback effect from economic to political liberalization. These results are robust to
controlling for country, reform-specific effects and any possible interaction among them.
Global reform waves and possible country-time varying determinants of reforms (including
crises, reforms in neighboring countries, existence of compensation for losers, human capital
and bureaucratic quality, and several political variables) do not weaken these results, which
are also robust to using an instrumental variable strategy.
The remainder of the paper is organized as follows. Section 2 reviews the existing
literature on economic reforms and democracy; Section 3 presents the data; Section 4
presents the results on the effects of democracy on reforms, controlling for other possible
determinants of reforms and the possibility of reverse causality and omitted variables;
Section 5 concludes.
2. Democracy and Reforms: Theory and Empirics
While there is a vast theoretical and empirical literature that considers the
determinants of economic reforms in general, there is scarce evidence, particularly empirical,
on the relationship between democracy and reforms.4
Economic theory does not give a clear answer on whether political liberalizations
favor or hinder economic reforms or if the relationship could go both ways. Democratic
regimes could lead to more reforms if reforms create more winners than losers (Giavazzi
and Tabellini, 2005). Democratically elected governments may also have greater legitimacy to
implement and sustain policies bearing high short-term costs; similarly institutional
changes—e.g., strengthening an independent legal system or a professional civil service
required to ensure political freedom and democracy—could lead also to successful market
reforms. Finally, democracy could create an environment conducive to economic reforms by
limiting rent-seeking and putting in place a system of checks and balances (Dethier, Ghanem
and Zoli, 1999).
Alternatively, political liberalization could lead to less economic reforms if the
electoral system creates a pivotal voter with veto power. For instance, it has been argued that
4 For some recent papers, see Alesina, Ardagna, and Trebbi (2005), Abiad and Mody (2005), Drazen and Easterly (2001), and Lora (1998).

5
Chile in the late 70s and the 80s implemented several forward-looking economic reforms
because the military regime did not have to respond to a short-sighted electorate. At the
same time, it has been argued that Costa Rica has been a laggard in economic reforms
because the democratic system gives veto power to groups that can lose from reforms.
Democratic legislators are more likely to adopt time-inconsistent policies (Quinn 2000). In
fact, uncertainty about the impact of economic reforms at the individual level could also lead
a rational electorate to vote against reforms even if they are known ex ante to benefit a
majority of them (Fernandez and Rodrik, 1991).
The theoretical predictions about the feedback effect from economic reforms to
democratization are ambiguous as well. For example, economic liberalizations could be
associated with higher quality of democratic institutions if they increase the power of the
middle class (Rajan and Zingales, 2003). On the other hand, liberalization could lower
democracy through increases in income inequality and the associated political strife and
violence (Quinn, 1997, Dixon and Boswell, 1996).
On the empirical side, only a few empirical papers have looked at the relationship
between democracy and reforms. Among the available evidence, Giavazzi and Tabellini
(2005) study the feedback effects between economic and political liberalizations. Economic
liberalization is defined as the event of becoming open, where openness is defined as in
Wacziarg and Welch (2008). Political liberalization is the event of becoming a democracy;
where democracy is defined by strictly positive values of polity2. Using a panel of 140
countries over 1960–2000 (with country and year fixed effects), Giavazzi and Tabellini (2005)
find evidence of a positive and significant relationship between democratizations and trade
reforms; they find that the feedback effect could run in both directions although the
causality is more likely to run from political to economic reforms. In comparison, we find
little evidence of feedback effects from reforms to democracy.5 Similarly, Persson (2005)
shows that the forms of democracy (parliamentary, proportional and permanent ones) are
important in explaining variation in trade reforms (measured by the Wacziarg and Welch
index) and an index protection of property rights.6
5 Not, however, that the results are not directly comparable because Giavazzi and Tabellini (2005) consider only trade reforms.
Amin and Djankov (2009) show that
6 Banerji and Ghanem (1997), and Milner and Kubota (2005) also look at trade reforms. The former presents cross-country evidence to show that authoritarian regimes are associated with higher protectionism (measured by an index of protectionism from Dollar (1992)), while the latter show that
6
democracy (measured by Freedom House or PolityIV scores) is good for micro-reforms (as
defined in the World Bank’s Doing Business Database).7 Eichengreen and Leblang (2008)
find evidence of a positive two-way relationship between democracy and globalization
defined as trade and capital account liberalization.8
Quinn (2000) examines the relationship between democracy and international
financial liberalization. He measures international financial regulation through changes in
current and capital account openness created using the Exchange Arrangements and Exchange
Restrictions from the IMF. Democracy is measured by changes in polity2. Quinn uses both
panel data techniques and individual country VARs for 40–50 countries over 1950–97 and
finds evidence that democracies liberalize international finance, especially capital accounts.
Unlike this paper, he also finds evidence of feedback effects from financial liberalization to
democratizations whereby capital account liberalization is associated with decreases in
democracy 6 to 15 years later.
They, however, find that these effects are
not uniform across time and space.
9
Other papers examine the relationship between economic and political liberalizations
in the context of post-communist countries. For example, Fidrmuc (2003) in a sample of
25 transition countries over 1990-2000 finds a positive relationship between the indices of
Finally, Olper, Falkowski and Swinnen (2009) study the effect
of regime transitions from autocracy to democracy on agricultural policy distortions,
measured by indicators of government transfers to the agriculture sector. They find that
while agriculture protection increases after a country’s transition to democracy, there is no
effect when the regime shifts from democracy to autocracy.
regime changes towards democracy are associated with greater liberalization (measured by tariff rates and Sachs Warner indices). Banerji and Ghanem (1997) also find evidence that more authoritarian regimes are associated with greater wage distortions, as measured by the ratio of manufacturing wage rate to the nonmanufacturing value added per worker. 7 Micro-reforms are defined as reforms that lower the administrative costs of starting or running a business. The World Bank’s Doing Business Database dataset covers only the last 5 years so a long-term analysis is not possible. 8 Their measure of trade liberalization is imports plus exports as a fraction of GDP; the authors also check the robustness of their results using the dichotomous measure of Wacziarg and Welch (2004). Capital controls are measured combining information from the International Monetary Fund’s Annual Report on Exchange Arrangements and Exchange Restrictions together with historical data taken from Eichengreen and Bordo (2003). 9 Mulligan, Gill and Sala-i-Martin (2004) do not look specifically at reforms, but analyze the effect of democracy on public spending and taxes. They do not find any significant relationship between democracy and total government consumption, education or social spending; but find that democracies are associated with flatter income taxes (or less income redistribution).

7
liberalization and democracy. Liberalization is measured by an average of various reform
indicators developed by the European Bank for Reconstruction and Development covering
privatization, governance and enterprise restructuring, price liberalization, trade and foreign
exchange, competition policy, and banking and securities markets. Democracy is measured
by an average of the indicators of political rights and civil liberties reported by the Freedom
House. In a similar vein, Dethier, Ghanem, and Zoli (1999) also find that political freedom
and civil liberties facilitated economic liberalization in the 25 post-communist countries
between 1992 and 1997. Milner and Mukerjee (2009) find evidence that democracy fosters
trade and capital account liberalization, but also that the impact of openness of democracy is
quite weak in developing countries. Grosjean and Senik (forthcoming) using a survey
conducted in 2006 by the European Bank for Reconstruction and Development and the
World Bank in 28 post-transition countries find a significant effect of democracy (measured
by the Freedom House democracy score) on market liberalization, but no evidence of a
feedback effect. In addition to the statistical analysis, some papers (Bates and Krueger, 1993)
have focused on case studies. This approach takes into account the complexity and the
country specificity of the interaction between democracy and economic reforms.
To summarize, while there are many theoretical predictions about the relationships
between political and economic liberalizations, empirical evidence on the subject is limited to
reforms in particular sectors, in particular international trade and finance, micro-reforms, or
specific countries over a short period.
Our study is the first one to combine a comprehensive coverage of reforms in
different sectors, a significant coverage of countries and a long time period. In particular, the
dataset used in this paper spans six sectors, and both developing and developed countries
from the 1960 up until 2004.
3. Data
3.1. Data on reforms
Our analysis is based on a completely new and extensive dataset, compiled by the
Research Department of the IMF, describing the degree of regulation for a sample of 150
industrial and developing countries. The new dataset thus has significant advantages over
existing data sources, which cover a narrower set of reforms and countries. Reform
indicators cover six sectors, including both financial and real sectors. Financial sector reform

8
indicators include reforms pertaining to domestic financial markets and the external capital
account, while real sector structural reform indicators include measures of product and
agriculture markets, trade, and current account reforms. Each indicator contains different
sub-indices summarizing different dimensions of the regulatory environment in each sector.
The sub-indices are then aggregated into indices and normalized between 0 and 1. We
construct all the measures of reform in each sector so that higher values represent greater
degrees of liberalization.
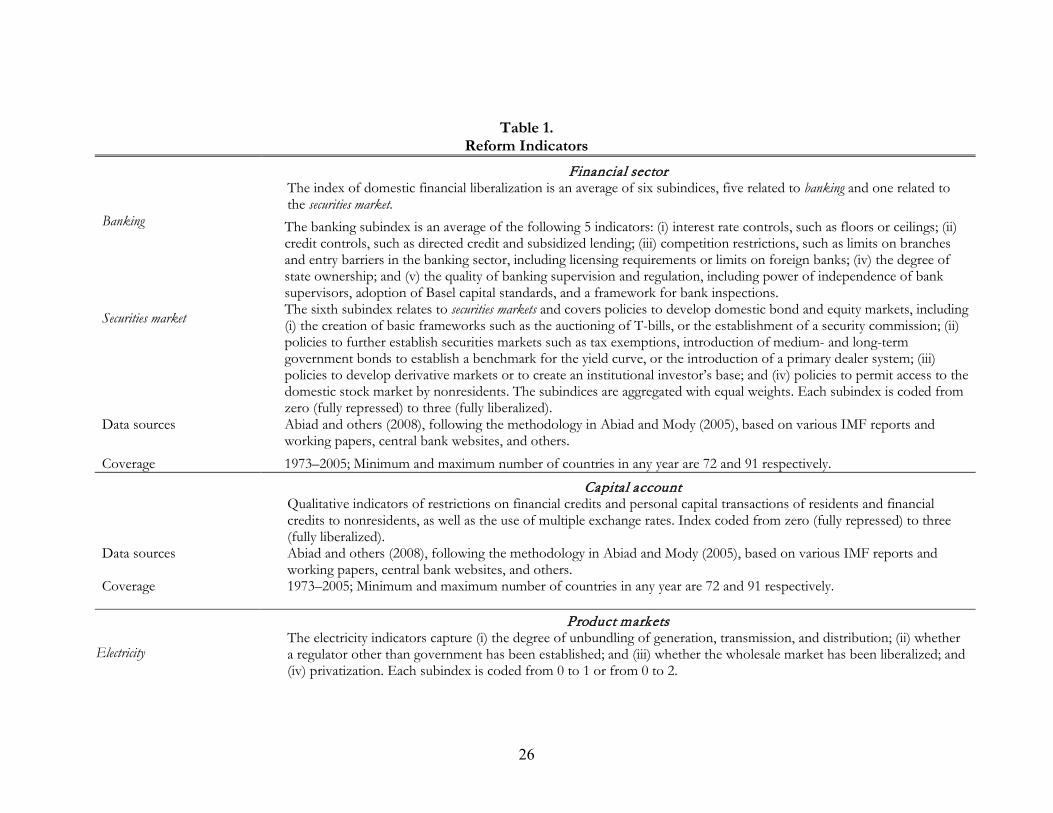
Table 1 presents a brief definition and sources of the reform indicators used in this
paper. IMF (2008) describes all data sources and full details of the construction of the
indicators.
3.1.1. Financial sector reforms in the domestic financial market
The dataset contains two measures of financial sector reforms, one for the domestic
financial sector and the other regarding the extent of capital account liberalization. The
domestic financial sector liberalization indicator in turn includes measures of securities markets
and banking sector reforms. The securities markets subindex assesses the quality of the market
framework, including the existence of an independent regulator and the extent of legal
restrictions on the development of domestic bond and equity markets. The banking subindex
captures reductions or removal of interest rate controls (floors or ceilings), credit controls
(directed credit and subsidized lending), competition restrictions (limits on branches and
entry barriers in the banking market, including licensing requirements or limits on foreign
banks), and public ownership of banks. The banking index also captures a measure of the
quality of banking supervision and regulation, including the power and independence of
bank supervisors, the adoption of Basel capital standards, and the presence of a framework
for bank inspections.
3.1.2. Capital account liberalization
The second measure of reform in the financial sector pertains to the extent of the
external capital account liberalization. The index contains information on a broad set of
restrictions including, for example, controls on external borrowing between residents and
non-residents, as well as approval requirements for foreign direct investment (FDI).
3.1.3. Product market reforms
Turning to the real sector, the product market indicator covers the degree of
liberalization in the telecommunication and electricity markets, including the extent of

9
competition in the provision of these services, the presence of an independent regulatory
authority, and privatization.
3.1.4. Agricultural market reforms
The agricultural sector indicator captures intervention in the market for the main
agricultural export commodity in each country. It measures the extent of public intervention
in the market going from total monopoly or monopsony in production, transportation or
marketing (i.e., the presence of marketing boards), the presence of administered prices,
public ownership of relevant producers or concession requirement to free market.
3.1.5. Trade reforms
Trade reforms are captured by using two different indicators: one based on tariffs
and the other measuring the extent of current account liberalization. The indicator based on
tariff liberalization is meant to capture distortions in international trade and is measured by
average tariffs.
3.1.6. Current account liberalization reforms
The second indicator for measuring reform in the trade sector broadly measures the
extent of current account liberalization. It captures the extent to which a government is
compliant with its obligations under the IMF’s Article VIII to free from government
restriction the proceeds from international trade in goods and services.
Additional details on the sources and specifics of each indicator can be found in IMF
(2008) and Table 1.
3.2. Aggregation and normalization
For each of our six sectors, we construct an aggregate index by averaging the sub-
indices for that particular sector (for the cases in which we do have multiple sub-indices, like
product market or the financial sector). Each sectoral indicator is then normalized between 0
and 1, where 1 indicates a higher degree of liberalization. “Reform” in any sector is then
defined as an annual change in the index. Table 2 reports the pair wise correlations between
different types of reforms. Financial sector, trade, current, and capital account reforms are
strongly correlated among themselves, and less so with agricultural and product market
reforms (with the exception of the financial sector reform which is strongly correlated to
product market reforms). Overall the correlations indicate that once the process of reform in

10
a country starts, it probably spreads over to several sectors.10
3.3. Other data
We run most of our regressions
at the sector-country and year level; however as one of our robustness checks we also
aggregate the six reform indicators using a principal component analysis.
Democracy is measured using the standard, well-established measure of democracy
taken from the Polity IV database. In particular, we use the combined polity2 index ranging
from -10 to 10 (-10=high autocracy; 10=high democracy).11
We also include in our specifications the following controls:
We normalize the index so that
1 indicates the most democratic country and 0 the least democratic regime.
• Initial level of regulation (as measured by the lagged level of the regulation index):
this variable can be a proxy for important incentives in favor and against the
implementation of structural reforms. Excessive government regulation and/or
market failures may be perceived as more costly when the economy is least reformed.
At the same time, the beneficiaries of existing large rents may oppose reforms.
• Economic crisis: According to a widely held view, economic crises foster economic
reforms by making evident the cost of stagnation and backwardness. The opposite
view maintains that it is easier to implement reforms during periods of economic
growth when potential losers can find other opportunities in a booming economy or
when countries become richer and have more resources to compensate the losers. In
order to test this hypothesis, we use several measures of crisis: a dummy equal to 1 if
the country is experiencing inflation larger than 40 percent in that year, a measure for
recession (as summarized by a dummy indicating negative growth in per-capita
GDP), terms of trade shocks, and banking and debt crisis.12
10 This paper does not consider the issue of sequencing among different types of reforms. For an analysis of sequencing see IMF (2008), showing that trade reforms tend to precede financial and capital account reforms.
11 We also check our results using the Freedom House Index and the index proposed by Przeworski, Alvarez, Cheibub, and Limongi (1993). For an exhaustive discussion of these indices, see Przeworski, Alvarez, Cheibub, and Limongi (2000) or Acemoglu and Robinson (2006). Note that the trend toward more democratic regimes has not been linear. Significant retrenchment of democracy has not only been observed in isolated countries but also in several regions of the world. The examples include the general decrease in democracy in Asia in the 1950s and 1960s, the marked decline in Latin America in 1960s and 1970s, and the prolonged stasis in Africa since the 1960s (Acemoglu and Robinson, 2006). 12 The data on banking and debt crises come from Reinhart and Rogoff (2008).

11
• Public expenditures/GDP and real devaluation: Compensation schemes can
offset costs associated with reforms. A large government may compensate losers
from reforms than a very lean government with a small budget. We use public
expenditures/GDP as a proxy of the size of social safety nets. As an alternative
measure of compensation, we also control for real devaluation, which could promote
exports and therefore help compensate losers from reforms.13
• Human capital and effectiveness of bureaucracy could also facilitate reforms
(Besley and Personn, 2007). We use enrollment in tertiary education from Barro and
Lee (2001) as a measure of human capital and bureaucratic quality from the
International Country Risk Guide.
14
• Reforms in neighboring countries or in trading partners may affect the adoption
of domestic reforms through peer pressure and imitational effects. We use the
weighted average of reforms in neighboring countries, where the weights are given
by two concepts of distance defined by geography and trade.
15
• The ideology of the ruling government and the form of government may
determine the adoption of reforms.
16 We capture the ideological orientation of the
executive with the indicator left, which is equal to 1 if the executive belongs to a party
of the left and 0 if it belongs to a right-wing, centrist or other party. The form of
government is proxied by the variable presidential, which takes the value of 1 if the
system is directly presidential and 0 if the president is elected by the assembly or
parliamentary. The source for these two variables is the Database of Political
Institutions from the World Bank.17
13 For instance, some important reforms happened together with large devaluation and in the context of IMF-supported programs.
14 The measure of bureaucratic quality from ICRG is scored between 0-6. High scores indicate “autonomy from political pressure” and “strength and expertise to govern without drastic changes in policy or interruptions in government services”; also existence of an “established mechanism for recruiting and training.” 15 The source for geographic distance is http://www.cepii.fr/anglaisgraph/bdd/distances.htm and for bilateral trade flows, the IMF’s Direction of Trade Statistics. 16 Alesina and Roubini (1992) argue that right-wing governments are normally considered more inclined to market-oriented reforms; Persson and Tabellini (2002) finds that a presidential system facilitates reforms as they are more able to overcome the resistance of small interest groups. 17 We also included in the regressions additional political variables such as number of executive constraints, the presence of legislative or executive elections, the number of years left in the current

12
Table A1 provides the summary statistics for the key variables used in the empirical analysis.
4. Empirical strategy
The unit of analysis is a sector-country-year observation (there are 6 sectors, 150
countries, and 45 years); the resulting dataset is a panel of 20,123 observations. We define
reform as a change over time in the index of regulation for each of the six sectors, s, in
country c at time t:
, , , , , , 1s c t s c t s c treform Index Index −≡ − ,
Our baseline specification is as follows:
𝑟𝑒𝑓𝑜𝑟𝑚𝑠,𝑐,𝑡 = 𝛼 𝐼𝑛𝑑𝑒𝑥𝑠,𝑐,𝑡−1 + 𝛽 𝑑𝑒𝑚𝑜𝑐𝑟𝑎𝑐𝑦𝑐,𝑡−1 + 𝜙 𝑋𝑐,𝑡−1 + 𝛿𝑠 + 𝛾𝑐 +
𝜒𝑡+𝛿𝑠𝛾𝑐 + 𝛿𝑠𝜒𝑡 + 𝜀𝑠,𝑐,𝑡 (1)
where sδ , cγ and tχ are sector, country, and year fixed effects, respectively, and
1−ctX are country-specific and time-varying controls to be described below. 𝛿𝑠𝛾𝑐 and 𝛿𝑠𝜒𝑡
represent the interactions between country and sector; and sector and time fixed effects
respectively. We also control for the lagged level of the index to identify the existence of
convergence toward some possible country specific levels of regulation.
The dependent variable (reform) is highly persistent; for this reason the error terms
in specification (1) may also exibit serial correlation. 18
1ct ct ctuε ρε −= +
We allow for first-order serial
correlation in the error terms: .19 In specifications (2) and (4), we allow the
serial correlation coefficient in the error term to be country-sector specific.20
Our first specification includes only sector, country, and time fixed effects (Table 3,
column 1). The coefficient on the lagged level of the index is negative and significant at the 1
percent level, indicating convergence toward country specific levels of regulation. The
In specification
(3), we allow the serial correlation coefficient to be country specific. In Table 7b we also test
the robustness of our results by clustering the error terms at the country level.
term for the executive and the presence of an absolute majority in the legislature by the party of the executive. The results are robust to the inclusion of these additional political variables. 18 Note, however, that the reform variables do not have a unit root being bounded between zero and one. 19 The Durbin-Watson statistics is 1.94 indicating that there is little evidence of serial correlation in the error terms. 20 Note that specifications (2)–(4) reduce slightly the estimation sample because one observation per country is used to calculate the correlation coefficient of the error terms.

13
coefficient on the lagged level of democracy is significant at the 1 percent level. The
magnitude of the estimated effect implies that a one standard deviation increase in the
democracy index explains 7 percent variability in reforms. In addition, moving to a complete
democracy in the long-run is associated with a 0.22 βα
= −
increase in the index of reform
(using the coefficients of column 1).
We then add country-sector specific effects, and sector-year specific effects and both
of them (column 2, 3 and 4 respectively). The interactions between country and sector fixed
effects take into account that reforms are inherently different across countries, e.g., trade
sector reforms in India have different characteristics than banking reforms in Brazil
(Specification 2). The interactions between sector and year effects account for the possibility
of global reform waves across all countries (Specification 3). Specification 4 is the most
demanding because it includes all the individual fixed effects and possible two-way
interactions. Notice that we cannot control for country-time effects, since the main variable
of interest, which is democracy, tends to be country-time varying. The results are very similar
across specifications. The magnitude of the coefficients on the democracy variable range
from 0.02 to 0.03 in columns 2-4.
The results in Table 3 show that the correlation between (past) democracy level and the
adoption of reforms is not driven by country or sector-fixed characteristics or by the fact
that there was a worldwide movement toward reforms and democracy, or any interactions
between country-sector and sector-time fixed characteristics.
If the correlation between economic reforms and democracy is not due to spurious
correlation owing to a common trend, could it be driven by other country-time varying
omitted variables? The next subsection checks whether this correlation is robust to the
inclusion of several variables, which (current theories suggest) may explain both economic
reforms and democracy, i.e., the possible bias deriving from country-sector-time varying
omitted variables.
4.1. Additional controls
Reforms may be triggered by a wide range of factors other than democracy.
Following the theoretical literature reviewed above, in Table 4 we control for the following
possible determinants of reforms: a measure of crisis (a dummy equal to 1 if the country

14
experiences inflation larger than 40 percent) 21
In many countries, difficult fiscal situations were associated with monetization of
deficit and high inflation. For this reason, we take hyperinflation (defined as inflation larger
than 40 percent) as an indicator of (unresolved) fiscal crisis. Not surprisingly, episodes of
hyperinflation appear to reduce the probability of reforming (Column 1), although the effect
is small and significant only at the 10% level. Moreover, when we include all the controls in
column (6), only initial structural conditions and democracy appear to be significant in
explaining reforms
, public expenditure/GDP and real devaluation,
human capital and bureaucratic quality, reforms in neighbors, and political variables
(columns 1-5).
22
Of all the variables, reforms in neighboring countries appear to spur domestic
reforms.
. Bureaucratic quality and public expenditure/GDP also appear to
matter but with coefficients which are low and only significant at the 10% level.
23
This result, which extends the results of IMF (2004) on OECD countries, is also
in line with Buera, Monge, and Primiceri (2008), who find a spillover effect from beliefs in
neighboring countries. The inclusion of these variables does not decrease the significance of
democracy in explaining the adoption of reforms.
4.2. Endogeneity
Another source of bias derives from the fact that reforms themselves may have an
effect on democracy. In order to deal with this issue we have two approaches: 1) we use
instrumental variables, and 2) we check if reforms cause democracy (in the final section of
the paper).
While an ideal source of exogenous variation of democracy is difficult to find, we use
democracy in neighboring countries as an instrument where we introduce the concept of
21 We include alternative measures of crisis in Table 7b. 22 For each column in Table 4, we also estimate the basic specification (Table 3, column 4) on the restricted sample with fewer observations (not shown) to analyze the effect of adding controls on a consistent sample. The results shown in Table 4 do not appear to be driven by sample selection. We also include additional controls viz. dummies for WTO, EU, and OECD accessions (=1 in years following the accession); and for the existence of an IMF program. Democracy continues to have a positive and statistical effect on reforms, after controlling for these. Accession to EU and OECD; and the existence of an IMF program are significant in explaining reforms; however, they are not significant when included with all the controls in column (6) of Table 4 (results are available upon request). 23 The controls are described in the data section. Note also that the different control variables reduce substantially the sample size.

15
political distance to define the neighbors. The idea behind this instrument is that democracy
in political allies has influence on domestic democracy but no direct impact on a country’s
ability to reform. For instance, the political alliance between the U.S. and Western Europe
had surely an effect on democracy in Western Europe but not a direct effect on the reform
level in Europe. 24
Table 5A shows the regressions using lagged democracy in political neighbors as an
instrumental variable. As expected, the first-stage F statistics confirm the relevance of
democracy in neighbors in promoting the democratic process in the domestic economy (the
first stage of our IV regression is presented in Table 5B). The results in our second stage
show that, consistent with the OLS specification, there is evidence for a strong and positive
effect of democracy on reforms. Notice that the estimated effect is not statistically
significant in the specification which includes all the controls (column 1c). The magnitude of
the estimated effect is, however, not significantly different from Column 1b, which uses a
larger sample and a restricted set of controls suggesting that the statistical insignificance in
specification 1c is likely to be driven by the large standard errors from the smaller sample.
The regression in column 1d, where the sample is the same as column 1c but without the
inclusion of controls, indeed confirms that this is the case.
4.3. Regressions by sector
Does democracy have a differential effect across sectors? Alternatively, are the
results presented above driven by a particular sector? We explore this possibility by looking
at the impact of democracy on different sectors. The results in Table 6 show that, with the
exception of product markets (electricity/telecommunication), democracy promotes reforms
in all other sectors, with the estimated effect being statistically significant at the one percent
level in all sectors. The fact that democracy is not significant in explaining reforms in
electricity/telecommunications may be due to the fact that global waves (which are captured
by year effects) drive the adoptions of reforms in these sectors.
24 The idea underlying this instrument is based on Persson and Tabellini (2009), who use democracy in neighboring countries as a proxy for democratic capital. In addition, building on this concept, we also tried different measures of distance, including geographical distance between countries and commercial distance defined as the (inverse of) trading flows between countries. While these measures are highly correlated, they confirm the result of political distance reported here.

16
We prefer the general specification that encompasses all sectors in order to maximize
the number of observations so that we can control for country, reform, and year fixed
effects and (most importantly) their interactions as shown in Table 3.
4.4 Other robustness checks
In Table 7a, we carry out several robustness checks.25 In columns 1a–1b and 2a–2b,
the sample is restricted to communist and developing countries respectively (we estimate
two regressions for each subsample with and without the inclusion of controls). In columns
3a-3b, we use a zero-one definition of democracy (as in Giavazzi and Tabellini, 2005), where
democracy=1 if polity2 has positive values. Using a zero-one definition of democracy does
not change our results (the results are weaker when we include all the controls, but this is
driven by the fact that the sample size is much smaller, in column 3c we indeed show that
the impact of democracy on reform on the restricted sample but without the inclusion of
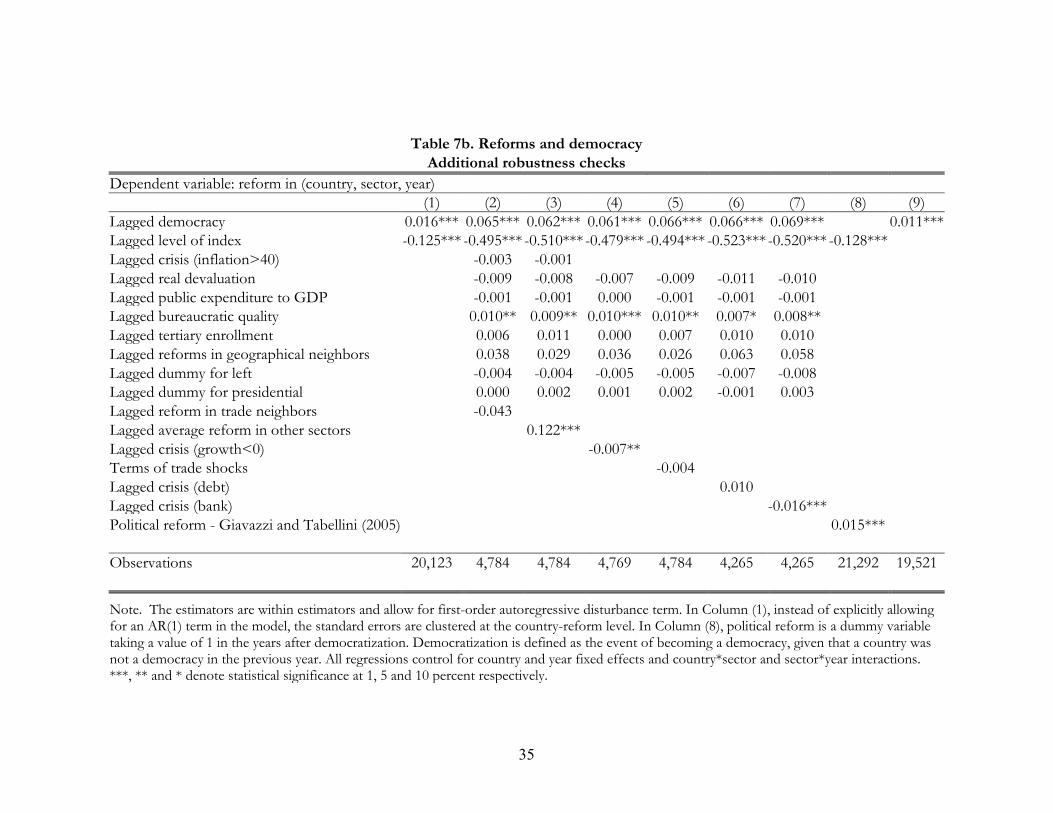
controls is also not significant). Table 7b shows that the results are also robust to different
standard error corrections (instead of explicitly allowing for an AR(1) term in the model, the
standard errors are clustered at the country-reform level) (column 1). Reforms in trading
partners (column 2) and reforms in other sectors (column 3) also do not alter our main
conclusion, and the results are also robust to a variety of crisis definitions (negative per-
capita GDP growth, banking and debt crises and terms-of-trade shocks-columns 4 to 7). We
also find very similar results when we follow Giavazzi and Tabellini (2005) and include a
political reform variable defined as a dummy taking the value of 1 in the years after
democratization (where democratization is defined as the event of becoming a democracy,
given that a country was not a democracy in the previous year)26
By including the lagged level of reform, the specifications so far have assumed that
there is (conditional) convergence in the reform adoption.
.
27
25 For each specification with controls in Table 7a, we also estimated the basic specification (Table 3, column 4) without any controls on the restricted sample (not shown). We do this to analyze the effect of adding controls on a consistent sample. The results in Table 7a are not driven by sample selection.
However, unlike growth
regressions, there is no theoretical reason why we should expect convergence in the level of
26 Results are reported in column 8. 27 Note, however, that we assume a country specific long run level of reforms by putting country fixed effects.

17
regulation. In order to test if our results depend on this assumption, we replicate the
specification in Table 3 without the lagged reform index using the following specification:
∆𝐼𝑛𝑑𝑒𝑥𝑠,𝑐,𝑡 = 𝛽𝑑𝑒𝑚𝑜𝑐𝑟𝑎𝑐𝑦𝑐,𝑡−1 + 𝜙𝑋𝑐,𝑡−1 + 𝛿𝑠 + 𝛾𝑐 + 𝜒𝑡+𝛿𝑠𝛾𝑐 + 𝛿𝑠𝜒𝑡 + 𝜀𝑠,𝑐,𝑡 (2)
Column (9) in Table 7b reports the results from estimating Equation (2). The
estimated coefficient on lagged (democracy) is positive and statistically significant at the
1 percent level. The magnitude of the estimated coefficient (β= 0.011) is smaller than in
Table 3. 28 This coefficient, however, is not exactly comparable to the coefficient in the
previous regressions in Table 3 given that the magnitude of the estimated coefficient on
democracy in this regression can be interpreted only as the effect of democracy on the rate of
adoption of structural reforms rather than on the steady-state level.29
Finally, in Table 8, we find some evidence for non-linear effects of democracy on
reforms: the more democratic the country is initially, the easier it is to reform.
30
4.5. The feedback effect
In this section, we check whether economic reforms could foster the democratic
process in a country. Giavazzi and Tabellini (2005) find evidence of a possible feedback
effect from economic liberalization (when looking only at the trade sector) and the
democratic process. We test for the possibility of a feedback effect from reforms to
democracy by estimating the following regression
Δ𝑑𝑒𝑚𝑜𝑐𝑟𝑎𝑐𝑦𝑐,𝑡 = 𝛼𝑑𝑒𝑚𝑜𝑐𝑟𝑎𝑐𝑦𝑐,𝑡−1 + 𝛽𝑟𝑒𝑓𝑜𝑟𝑚𝑠𝑠,𝑐,𝑡−1 + 𝛿𝑠 + 𝛾𝑐 + 𝜒𝑡 + 𝜀𝑐,𝑡 (3)
Overall, we find that democracy promotes reform, while we do not find any
evidence that reforms promote the democratic process (Table 9a).31
28 This is consistent with a positive correlation between (lagged) democracy and the lagged reform index, and a negative relationship between reform and the lagged reform index.
Our results therefore do
29 Note that unlike Equation (1), the specification in Equation (2) has the drawback that the steady state level of the index is undefined; hence the long-run effect of democracy on the reform index cannot be estimated. In effect , we are assuming that a certain level of democracy is associated only with a rate of growth of the reform index. Column (9) in Table 7b repeats only the final specification in Table 3 without the lagged reform index. The estimated coefficient on lagged democracy is identical when we replicate columns (1)-(3) in Table 3 without the lagged reform index (results available upon request). 30 We also explore whether democracy affects the probability of reversal in reforms (defined as a decrease in the level of index) and do not find any evidence for this hypothesis. 31 For robustness, we also estimate Equation (3) with longer lags; but do not evidence for any feedback effects (results available on request).
18
not support a reverse causality story.32
We also repeat the same exercise reform by reform
and find little evidence of feedback for most reforms with the exception of reforms in
domestic financial sector and current account. Reforms in these sectors seem to reduce the
probability of democratization. The results are qualitatively similar to Giavazzi and Tabellini
(2005), who argue that for trade reforms, “causality is more likely to run from political to
economic liberalizations rather than vice versa”.
4.6. Factor analysis
In this section, we implement a different approach from the panel analysis presented
above. To take into account the possibility that the reform process is one unique process
common to all sectors, we undertake a factor analysis of our measures of reforms in the six
sectors. In particular, we extract the first principal component from the whole dataset with
all the data on reforms for each sector.33
The results are reported in Table 10. The impact of
democracy seems to be relevant for the overall tendency of a country to reform (the
coefficient on the lagged level of democracy is significant at the 1 percent level): moving to a
complete democracy in the long-run is associated with a 0.03 increase in the index of reform
(the magnitude doubles when we instrument for lagged democracy using lagged democracy
in neighboring countries). On the other hand, we do not find any evidence of a feedback
effect from the impact of the overall tendency of a country to reform on democracy.
5. Conclusions
The question of whether democratic countries favor economic reforms is central to
the political economy literature. Political economists study why apparently welfare-enhancing
reforms are postponed or adopted with long delays and the presence (or the absence) of
democracy is one of the main causes investigated. Unfortunately, despite the vast theoretical
literature and limited empirical evidence (restricted to some set of countries, to some
reforms and to some periods), the answer to this question has been tentative because of data
limitations, which has also limited the techniques that can be used.
32 Since income is considered an important determinant of democratization, we also test robustness to including per capita income in the regressions (results available upon request). Including the lagged level of the index, rather than the change as in Table 9a, also does not alter the findings in Table 9a. 33 The variable is then normalized between 0 and 1 to make the results comparable to the remaining part of the paper.

19
This paper answers this question using a novel dataset on structural reforms, which
encompasses several sectors and many countries for several years. This dataset allows us to
control for a set of possible omitted variables, including country and reform fixed effects,
possible two-way interactions between the fixed effects and waves of reforms.
The main conclusions of the papers are that 1) democracy and economic reforms are
positively correlated (after controlling for country and reform-specific characteristics, any
interaction between country and reform characteristics, and global reform waves); 2) this
correlation is robust even after we control for standard factors, which are usually correlated
with reforms and democracy, including bureaucratic quality and education, and political
stability; 3) the correlation is also robust to the variables that are usually associated with
reforms (but not necessarily with democracy) such as crises, neighboring country effects, and
compensation schemes; and 4) there is no evidence that economic reforms pave the way for
political reforms.
The strong correlation between (lagged) democracy and the adoption of economic
reforms, even controlling for many possible omitted factors as well as the finding that past
economic reforms are not associated with the adoption of democracy, point to the fact there
is probably a causal link from democracy to reforms.
These strong results call for an effort to study the precise mechanisms through
which democracy has an impact on economic reforms.

20
References
Abiad, Abdul, and Ashoka Mody, 2005, “Financial Reform: What Shakes It? What Shapes
It?” American Economic Review 95, pp. 66–88.
Abiad, Abdul, Enrica Detragiache, and Thierry Tressel, 2008, “Do Financial Reforms Boost
the Development of Financial Systems? Evidence from a New Database on Financial
Reforms,” IMF Working Paper 08/266 (Washington: International Monetary Fund).
Acemoglou, Daron and James A. Robinson, 2006, Economic Origins of Dictatorship and
Democracy. Cambridge University Press.
Acemoglu, Daron, Simon Johnson, James A. Robinson, and Pierre Yared, “Income and
Democracy”, 2008, American Economic Review, 98 (3), 808-842.
Alesina, Alberto, and Nouriel Rubini, 1992, “Political Cycles in OECD Economies,” Review
of Economic Studies, October, Vol.59, pp.663–88.
Alberto, Alesina, Silvia Ardagna, and Francesco Trebbi, 2005, IMF Staff Papers, 2006, Vol. 53:
Special Issue, pp. 1–29 (2005 Mundell Fleming lecture)
Amin and Djankov, 2009, “Democracy and Reforms”, CEPR Discussion Paper No. 7151.
Banerji, A. and Ghanem, H. (1997). “Does the Type of Political Regime Matter for Trade
and Labor Market Policies?,” World Bank Economic Review 11, 171-194.
Barro, Robert. J., and Jong-Wha Lee, 2001, “International Data on Educational Attainment:
Updates and Implications,” Oxford Economic Paper No. 53, pp. 541–63.
Bassanini Andrea and Romain Duval, 2006, “Employment Patterns in OECD Countries,
Reassessing the Role of Policies and Institutions,” OECD Economics Department
Working Papers No. 486.
Bates, Robert H. and Anne O. Krueger, 1993, Political and Economic Interactions in Economic
Policy Reform: Evidence from Eight Countries, Basil Blackwell Limited, Cambridge, USA.
Besley, Timothy J. and Torsten Personn, 2007, “The Origins of State Capacity: Property
Rights, Taxation, and Politics”, CEPR Discussion Paper No. 6370.
Buera, Paco, Alex Monge, Giorgio Primiceri, 2008, “Learning the Wealth of Nations”
Cambridge, MA: NBER working paper No. 14595.
Clemens, Michael A., and Jeffrey G. Williamson, 2004, “Why Did the Tariff-Growth
Correlation Reverse after 1950?” Journal of Economic Growth, Vol. 9, No. 1, pp. 5-46.

21
Daveri, Francesco, Guido Tabellini, Samuel Bentolila and Harry Huizinga, 2000,
“Unemployment, Growth and Taxation in Industrial Countries”, Economic Policy, Vol.
15, No. 30, pp. 47-104.
Debreu, G., 1951, “The Coefficient of Resource Utilization,” Econometrica, Vol. 19,
pp. 273-92.
Dethier, Jean-Jacques, Ghanem, Hafez and Zoli, Edda, 1999, “Does Democracy Facilitate
the Economic Transition? An Empirical Study of Central and Eastern Europe and
the Former Soviet Union”. World Bank Policy Research Working Paper No. 2194.
Dixon, W. J. and T. Boswell, 1996, “Dependency, Disarticulation and Denominator Effects:
Another Look at Foreign Capital Penetration”, American Journal of Sociology, Volume
102, No. 2, September, pp. 543-62.
Drazen, A. and William Easterly, 2001, “Do Crises Induce Reform? Simple Empirical Tests
of Conventional Wisdom,” Economics and Politics, Vol. 13, No. 2, pp. 129-157.
Eichengreen, B. and M. Bordo, 2003, “Crises Now and Then: What Lessons from the Last
Era of Financial Globalization?” in Paul Mizen (ed.), Monetary History, Exchange Rate
and Financial Markets: Essays in Honor of Charles Goodhard, Cheltenham: Edward Elgar,
vol. 2. pp. 52-91
Eichengreen, B. and D. Leblang, 2008, “Democracy and Globalization”, Economics and Politics,
vol. 20 (3), 289-334.
Färe, R., S. Grosskopf, and C. A. K. Lovell, 1994, Production Frontiers (Cambridge: Cambridge
University Press).
Farrell, M. J., 1957, “The Measurement of Productive Efficiency,” Journal of the Royal
Statistical Society, pp. 253–81.
Fernandez, Raquel and Dani Rodrik, 1991. “Resistance to reform: Status Quo bias in the
Presence of Individual Specific Uncertainty,” American Economic Review, December,
Vol. 81, No.55, pp. 1146–55.
Fidrmuc, Ian, 2003, “Economic Reform, Democracy and Growth during Post-communist
Transition,” European Journal of Political Economy Vol. 19, No. 3, September,
pp. 583-604.
Giavazzi, Francesco; and Guido Tabellini, 2005, “Economic and Political Liberalizations,”
Journal of Monetary Economics Vol. 52, pp. 1297–1330.

22
Grosjean and Senik (forthcoming), “Democracy, Market Liberalization and Political
Preferences”, Review of Economics and Statistics.
Haggard, Stephan, 1990, “Pathways from Periphery. The Politics of growth in the Newly
Industrializing Countries,” Ithaca: Cornell University Press.
Huntington, Samuel P., 1968, Political Order in Changing Societies. New Haven: Yale University
Press.
International Monetary Fund, 2004, World Economic Outlook. Fostering Structural Reforms, April.
IMF, Washington DC. April.
International Monetary Fund, 2008, Structural Reforms and Economic Performance in Advanced and
Developing Countries, forthcoming IMF Occasional Paper (Washington: International
Monetary Fund)
Lora, Eduardo, 1998, “What makes reforms likely? Timing and Sequencing of Structural
Reforms in Latin America,” IADB Working Paper No. W-424.
Koopmans, T. C., 1951, “An Analysis of Production as an Efficient Combination of
Activities,” in Activity Analysis of Production and Allocation, ed. by T. C. Koopmans
(New York: Wiley).
Milner, H.V. and B. Mukherjee, 2009, “Democratization and Economic Globalization”,
Annual Review of Political Science, 163-181
Milner, H.V. and Kubota, K., 2005, “Why Move to Free Trade? Democracy and Trade
Policy in Developing Countries”, International Organization 59, 107-143.
Mulligan C. B., R. Gil and X. Sala-i-Martin, 2004, “Do Democracies Have Different Public
Policies than Non-democracies?” Journal of Economic Perspectives (March).
Olper, Alessandro, Jan Falkowski and Johan Swinnen, 2009, “Political Reforms and Public
Policies: Evidence from Agricultural Protection”, LICOS Discussion Paper No.
251/2009.
McGuire, Martin C. and Mancur Olson, 1996, “The Economics of Autocracy and Majority
Rule: The Invisible Hand and the Use of Force,” Journal of Economic Literature.
Vol. 34, pp. 72–96.
Persson, T. and Guido Tabellini, 2002, “Political Economics: Explainign Economic Policy”,
MIT Press.
Persson, T. and G. Tabellini, 2009, “Democratic Capital: The Nexus of Political and
Economic Change”, American Economic Journal: Macroeconomics 1, 88-126.

23
Polity IV. Political regime characteristics and transitions, 1800–2002 [Data Project]. College Park:
University of Maryland, 2002 _http://www.cidcm.umd.edu/inscr/polity/_.
Przeworski, A., and Limongi, F., 1993, “Political Regimes and Economic Growth,” Journal of
Economic Perspectives Vol. 7, pp. 51–70.
Przeworski, A., and Limongi, F.,, 2000, Democracy and Development: Political Regimes and Well-
Being in the World, 1950–1990. Cambridge (UK), Cambridge University Press.
Quinn, Dennis P., 1997, “The Correlates of Change in International Financial Regulation,”
American Political Science Review, Vol. 91, pp. 531–51.
Quinn, Dennis, 2000, “Democracy and International Financial Liberalization”, mimeo,
Georgetown University
Quinn, Dennis P., and A. Maria Toyoda, “Does Capital Account Liberalization Lead to
Economic Growth?” Forthcoming. Review of Financial Studies.
Rajan, Raghuram, and Luigi Zingales, 2003, “The Great Reversals: The Politics of Financial
Development in the Twentieth Century,” Journal of Financial Economics, Vol. 69, pp. 5–
50.
Reinhart, C. and K. Rogoff, “This Time is Different: a Panoramic View of Eight Centuries
of Financial Crises”, NBER WP 13882
Rodrik , Dani, 1999, “Democracies Pay Higher Wages,” Quarterly Journal of Economics, Vol.
114, No. 3, pp. 707–38.
Sala-i-Martin, X. 2006, “The World Distribution of Income, Falling Poverty and ...
Convergence, Period”, Quarterly Journal of Economics, Vol. 121, No. 2, pp. 351-97.
Schwarz, Gerhard, 1992, “Democracy and Market-Oriented Reform: A Love-Hate
Relationship?” Economic Education Bulletin 32.
Seiford, L. M., and R.M. Thrall, 1990, “Recent Developments in DEA: The Mathematical
Programming Approach to Frontier Analysis,” Journal of Econometrics, Vol. 46,
pp. 7-38.
Wacziarg, Romain, and Karen Horn Welch, 2008, “Trade Liberalization and Growth: New
Evidence", World Bank Economic Review, 22(2), 187-231.

24
Figure 1. Regulation and Democracy Over Time
Notes to Figure 1: This figure shows the correlation over time between the indices of democracy on the y-axis (measured as polity IV and normalized between 0 and 1) and reforms on the x-axis (all the indices are normalized between 0 and 1, with 0 corresponding to the least reformed and 1 to the most reformed) in the following eight sectors (or areas) – (i) domestic financial, (ii) capital account, (iii) product markets (electricity and telecommunications), (iv) agriculture, (v) labor, (vi) trade (based on tariffs) and (vii) current account transactions.
.2.4
.6.8
Finan
ce
.5.6
.7.8
Polity
2
1970 1980 1990 2000 2010year
Polity 2 Finance
.3.4
.5.6
.7.8
Capit
al
.5.6
.7.8
Polity
2
1970 1980 1990 2000 2010year
Polity 2 Capital
0.1
.2.3
.4Pr
oduc
t
.4.5
.6.7
Polity
2
1960 1970 1980 1990 2000year
Polity 2 Product.2
.3.4
.5.6
Agri
.4.5
.6.7
.8Po
lity 2
1960 1970 1980 1990 2000year
Polity 2 Agri
.4.5
.6.7
.8Tr
ade
.5.55
.6.65
.7.75
Polity
2
1960 1970 1980 1990 2000year
Polity 2 Trade
.4.5
.6.7
.8Cu
rrent
.5.6
.7.8
.9Po
lity 2
1960 1970 1980 1990 2000year
Polity 2 Current

25
Figure 2. Democracy and Reforms, 2000
Notes: This figure shows the correlation in 2000 between the indices of democracy on the y-axis (measured as polity IV and normalized between 0 and 1) and reforms on the x-axis (all the indices are normalized between 0 and 1, with 0 corresponding to the least reformed and 1 to the most reformed) in the following eight sectors (or areas) – (i) domestic financial, (ii) capital account, (iii) product markets (electricity and telecommunications), (iv) agriculture, (v) labor, (vi) trade (based on tariffs) and (vii) current account transactions. The country codes and groups used in this figures are described in Tables A2 and A3.
ALB
AZE
BGDBLR
CHN
CRI
DZA
EGY
EST
ETH
FRA
G01
G02
G03 G04
G05
G06
G07
G08
G09
G10
G11
G12
G13
G14
G15
G16
G17
G18
G19
G20
GEO
GHA
GTM
JOR
KAZ
KEN
LVA
MAR MYS
NGA
NPL
SGP
TZA
URY
UZB
VEN
VNM
.2.4
.6.8
1Fin
ance
0 .2 .4 .6 .8 1Polity2
AZE
CIV CRI
DOMETH
G01
G02
G03
G04
G05 G06
G07 G08
G09
G10
G11
G12
G13
G14 G15
MYS
PAK ROMUZB
ZWE
0.2
.4.6
.81
Capit
al
0 .2 .4 .6 .8 1Polity2
ALB
ARG
ARM
AUT
BEL
BRA
BTN
CIV
COL DEU
ECU
EGY
G01 G02 G03
G04
G05
G06
G07 G08 G09
G10
G11
G12
G13
G14
G15
G16
G17
G18
G19
G20
G21
G22
G23
G24
G25
G26
G27
GAB
GEO
GHA
GTM
HRV HUN
IDN
JOR
KGZ
KHM
LKA LVA
MAR
NGA
PAK
SGP
SLE
SLV
THATJK
UGA
UZB
VEN
ZMB
0.2
.4.6
.81
Prod
uct
0 .2 .4 .6 .8 1Polity2
AZE
CAF
ETH
G01
G02
G03
G04
G05
G06
G07
G08 G09 G10
G11
G12
G13
G14
G15
G16
G17
G18
G19
G20
G21
G22
GHA
GMB
LVA
MAR
SLE
VNM
ZMB
0.2
.4.6
.81
Agri
0 .2 .4 .6 .8 1Polity2
ARM
BDI
BFA
BGD
CAF
CHE
EGY ETH
G01
G02 G03
G04
G05
G06
G07
G08
G09
G10
G11
G12
G13 G14 G15
G16
G17
G18
G19
G20
G21
INDIRN
MAR
MMR
MUS
NGAPAK
SGP
SYR
TKM
TUNUZB
ZWE
.2.4
.6.8
1Tr
ade
0 .2 .4 .6 .8 1Polity2
AZE
BGR
BRA
CIV
COL
CZEECU
EGY
G01
G010
G011
G012
G013
G02
G03
G04
G05
G06
G07
G08
G09
GHA
HUN
IND
KEN
MAR
MOZ
MYS
NGA NPL
PAK
SGP
TZA
UGA
VEN
ZAF
.2.4
.6.8
1Cu
rrent
0 .2 .4 .6 .8 1Polity2
26
Table 1. Reform Indicators
Financial sector
The index of domestic financial liberalization is an average of six subindices, five related to banking and one related to the securities market.
Banking
The banking subindex is an average of the following 5 indicators: (i) interest rate controls, such as floors or ceilings; (ii) credit controls, such as directed credit and subsidized lending; (iii) competition restrictions, such as limits on branches and entry barriers in the banking sector, including licensing requirements or limits on foreign banks; (iv) the degree of state ownership; and (v) the quality of banking supervision and regulation, including power of independence of bank supervisors, adoption of Basel capital standards, and a framework for bank inspections.
Securities market
The sixth subindex relates to securities markets and covers policies to develop domestic bond and equity markets, including (i) the creation of basic frameworks such as the auctioning of T-bills, or the establishment of a security commission; (ii) policies to further establish securities markets such as tax exemptions, introduction of medium- and long-term government bonds to establish a benchmark for the yield curve, or the introduction of a primary dealer system; (iii) policies to develop derivative markets or to create an institutional investor’s base; and (iv) policies to permit access to the domestic stock market by nonresidents. The subindices are aggregated with equal weights. Each subindex is coded from zero (fully repressed) to three (fully liberalized).
Data sources Abiad and others (2008), following the methodology in Abiad and Mody (2005), based on various IMF reports and working papers, central bank websites, and others.
Coverage 1973–2005; Minimum and maximum number of countries in any year are 72 and 91 respectively. Capital account Financial sector liberalization
Qualitative indicators of restrictions on financial credits and personal capital transactions of residents and financial credits to nonresidents, as well as the use of multiple exchange rates. Index coded from zero (fully repressed) to three (fully liberalized).
Data sources Abiad and others (2008), following the methodology in Abiad and Mody (2005), based on various IMF reports and working papers, central bank websites, and others.
Coverage 1973–2005; Minimum and maximum number of countries in any year are 72 and 91 respectively.
Product markets
Electricity
The electricity indicators capture (i) the degree of unbundling of generation, transmission, and distribution; (ii) whether a regulator other than government has been established; and (iii) whether the wholesale market has been liberalized; and (iv) privatization. Each subindex is coded from 0 to 1 or from 0 to 2.

27
Telecommunication
The telecommunication indicator captures (i) the degree of competition in local services; (ii) whether a regulator other than government has been established; (iii) the degree of liberalization of interconnection changes; and (iv) privatization. Each subindex is coded from 0 to 1 or from 0 to 2.
Data sources
Electricity: Based on various existing studies and datasets as well as national legislation and other official documents. Telecommunication: Based on IMF commodities data, various existing studies and datasets, and national legislation and other official documents.
Coverage 1960–2003; Minimum and maximum number of countries in any year are 106 and 108 respectively. Agriculture market
The index captures intervention in the market for the main agricultural export commodity in each country. The index can take four values (i) zero (public monopoly or monopsony in production, transportation, or marketing, e.g., export marketing boards); (ii) one-third (administered prices); (iii) two-thirds (public ownership of relevant producers or concession requirements); and (iv) one (no public intervention).
Data sources Based on IMF commodities data, various existing studies and datasets, and national legislation and other official documents.
Coverage 1960–2003; Minimum and maximum number of countries in any year are 96 and 104 respectively. Trade
Trade liberalization is defined by looking at average tariff rates, with missing values extrapolated using implicit weighted tariff rates. Index normalized to be between zero and unity: zero means the tariff rates are 60 percent or higher, while unity means the tariff rates are zero.
Data sources Various sources, including IMF, World Bank, WTO, UN, Clemens and Willamson, 2004. Coverage 1960-2005; Minimum and maximum # of countries in any year are 47 and 142 respectively. Current account
Current account liberalization is defined with an indicator describing how compliant a government is with its obligations under the IMF’s Article VIII to free from government restriction the proceeds from international trade in goods and services. The index represents the sum of two subcomponents, dealing with restrictions on trade in visibles, as well as in invisibles (financial and other services). It distinguishes between restrictions on residents (receipts for exports) and on nonresidents (payments for imports). Although the index measures restrictions on the proceeds from transactions, rather than on the underlying transactions, many countries in practice use restrictions on trade proceeds as a type of trade restriction. The index is scored between zero and 8 in half-integer units, with 8 indicating full compliance.
Data sources Based on the methodology in Quinn (1997) and Quinn and Toyoda (2007), drawing on information contained in the Fund's AREAER database (Annual Reports on Exchange Arrangements and Exchange Restrictions).
Coverage 1960–2005; Minimum and maximum number of countries in any year are 50 and 65 respectively. This table presents brief description of the reform indicators used in the paper. For a full description of all variables, data and sources refer to IMF (2008).

28
Table 2 . Correlation Between Reform Indicators
Agriculture Prod. Mkt Trade Cap. Acc. Curr. Acc. Finance
Agriculture 1 Prod. Mkt 0.30*** 1
Trade 0.32*** 0.35*** 1 Cap. Acc. 0.40*** 0.46*** 0.57*** 1
Curr. Acc. 0.42*** 0.47*** 0.63*** 0.77*** 1 Finance 0.44*** 0.63*** 0.62*** 0.73*** 0.71*** 1
*** denotes statistical significance at the 1 percent level.

29
Table 3 Reforms and democracy
Dependent variable: reform in country, sector, year (1) (2) (3) (4) Lagged democracy 0.016*** 0.017*** 0.033*** 0.017*** Lagged level of index -0.073*** -0.124*** -0.047*** -0.131*** Country FE Y Y Y Y Sector FE Y Y Y Y Year FE Y Y Y Y Country*Sector FE Y Y Sector*Year FE Y Y Observations 20,123 19,521 20,071 19,521
Note. The estimators are within estimators and allow for first-order autoregressive disturbance term. ***, ** and * denote statistical significance at 1, 5 and 10 percent respectively.

30
Table 4
Reforms and democracy, robustness to controls
Dependent variable: reform in (country, sector, year)
(1) (2) (3) (4) (5) (6)
Lagged democracy 0.011*** 0.014** 0.048*** 0.011*** 0.014*** 0.045***
Lagged level of index -0.149*** -0.205*** -0.401*** -0.135*** -0.173*** -0.412***
Lagged crisis (inflation>40) -0.005* -0.003
Lagged real devaluation 0.007 -0.009
Lagged public expenditure to GDP 0.000 -0.001*
Lagged bureaucratic quality 0.003 0.006*
Lagged tertiary enrollment 0.006 -0.003
Lagged reforms in geographical neighbor 0.055*** 0.044
Lagged dummy for left 0.003 -0.004
Lagged dummy for presidential -0.001 0.006
Observations 16,648 9,627 5,564 17,804 14,175 4,784
Note. The estimators are within estimators and allow for first-order autoregressive disturbance term. All regressions control for country sector, year fixed effects and country*sector and sector*year interactions. ***, ** and * denote statistical significance at 1, 5 and 10 percent respectively.

31
Table 5A
Reforms and democracy: Instrumental variables second stage Dependent variable: reform in (country, sector, year) (1a) (1b) (1c) (1d) Lagged democracy 0.078*** 0.151*** 0.19 0.141 Lagged level of index -0.135*** -0.180*** -0.281*** -0.281*** Lagged crisis (inflation>40) -0.005 -0.01 Lagged real devaluation 0.008 0.003 Lagged public expenditure to GDP 0.000 -0.001 Lagged bureaucratic quality 0.004 Lagged tertiary enrollment 0.023 Lagged reforms in geographical neighbors 0.056 0.053 Lagged dummy for left -0.001 -0.001 Lagged dummy for presidential 0.029** 0.049 Observations 18,970 10,007 5,244 5,244 First stage F-stat 764.59 229.09 36.47 50.77 p-value of F test 0.000 0.000 0.000 0.000
Note. Lagged democracy is instrumented by (lagged) democracy in neighboring countries. All regressions control for country sector, year fixed effects and country*sector and sector*year interactions. ***, ** and * denote statistical significance at 1, 5 and 10 percent respectively.

32
Table 5B Reforms and democracy: Instrumental variables first stage
Dependent variable: democracy in (country, year) (1a) (1b) (1c) (1d) Lagged democracy in neighboring countries 0.014*** 0.009*** 0.005*** 0.006*** Lagged level of index 0.022 -0.016 -0.008 -0.005 Lagged crisis (inflation>40) -0.015 0.013 Lagged real devaluation -0.011 0.020** Lagged public expenditure to GDP 0.001 -0.002 Lagged bureaucratic quality -0.003 Lagged tertiary enrollment -0.199*** Lagged reforms in geographical neighbors 0.052 0.198*** Lagged dummy for left 0.001 -0.009* Lagged dummy for presidential -0.226*** -0.238*** Observations 18,970 10,007 5,252 5,252
Note. All regressions control for country sector, year fixed effects and country*sector and sector*year interactions. ***, ** and * denote statistical significance at 1, 5 and 10 percent respectively.

33
Table 6 Reforms and democracy: by reform
Dependent variable: reform in (country, year) (1) (2) (3) (4) (5) (6) Finance Cap. Acc. Prod. Mkt Agricult. Trade Curr. Acc. Lagged democracy 0.067*** 0.182*** -0.026 0.202*** 0.075*** 0.179*** Lagged level of index -0.379*** -0.521*** -0.278*** -0.558*** -0.420*** -0.554*** Lagged crisis (inflation>40) 0.019* -0.042* 0.006 -0.016 0.002 0.021 Lagged real devaluation -0.007 0.024 -0.01 -0.039* 0.006 -0.012 Lagged public expenditure to GDP 0.002 0.002 0.001 0.000 -0.003*** -0.001 Lagged bureaucratic quality 0.014*** 0.022* 0.014* -0.01 0.012** 0.021** Lagged tertiary enrollment -0.038 0.057 0.109 -0.145 -0.007 0.053 Lagged reforms in geographical neighbors -0.01 0.257* -0.188 -0.147 0.228** 0.013 Lagged dummy for left -0.003 -0.008 -0.006 -0.005 -0.001 0.000 Lagged dummy for presidential 0.037* 0.026 0.041 0.042 0.046** -0.005 Observations 786 786 888 807 857 660
Note. The estimators are within estimators and allow for first-order autoregressive disturbance term. All regressions control for country and year fixed effects. ***, ** and * denote statistical significance at 1, 5 and 10 percent respectively.

34
Table 7a. Reforms and democracy Robustness checks
Dependent variable: reform in (country, sector, year) (1a) (1b) (2a) (2b) (3a) (3b) (3c) Lagged democracy 0.007** 0.070*** 0.014*** 0.063*** Lagged level of index -0.130*** -0.463*** -0.149*** -0.565*** -0.135*** -0.495*** -0.497*** Democracy dummy (polty2>0) 0.010*** 0.013 0.013 Lagged crisis (inflation>40) -0.002 -0.002 -0.002 0.009 Lagged real devaluation -0.006 -0.009 -0.009 Lagged public expenditure to GDP 0.000 -0.001 -0.001 Lagged bureaucratic quality 0.009** 0.007 0.010** Lagged tertiary enrollment -0.022 0.024 0.011 Lagged reforms in geographical neighbors 0.063 0.012 0.025 Lagged dummy for left -0.005 -0.003 -0.004 Lagged dummy for presidential 0.010 0.023 -0.007 Observations 16,816 4,347 15,188 3,338 19,521 4,784 4,784
Note. In Columns 1a-1b and 2a-2b, the sample is restricted to communist and developing countries respectively. In Columns 3a-3b, we use a zero-one definition of democracy (as in Giavazzi and Tabellini, 2005), where democracy=1 if polity2 has positive values. The estimators are within estimators and allow for first-order autoregressive disturbance term. All regressions control for country and year fixed effects and country*sector and sector*year interactions. ***, ** and * denote statistical significance at 1, 5 and 10 percent respectively.
35
Table 7b. Reforms and democracy
Additional robustness checks Dependent variable: reform in (country, sector, year) (1) (2) (3) (4) (5) (6) (7) (8) (9) Lagged democracy 0.016*** 0.065*** 0.062*** 0.061*** 0.066*** 0.066*** 0.069***
0.011***
Lagged level of index -0.125*** -0.495*** -0.510*** -0.479*** -0.494*** -0.523*** -0.520*** -0.128*** Lagged crisis (inflation>40)
-0.003 -0.001
Lagged real devaluation
-0.009 -0.008 -0.007 -0.009 -0.011 -0.010 Lagged public expenditure to GDP
-0.001 -0.001 0.000 -0.001 -0.001 -0.001
Lagged bureaucratic quality
0.010** 0.009** 0.010*** 0.010** 0.007* 0.008** Lagged tertiary enrollment
0.006 0.011 0.000 0.007 0.010 0.010
Lagged reforms in geographical neighbors
0.038 0.029 0.036 0.026 0.063 0.058 Lagged dummy for left
-0.004 -0.004 -0.005 -0.005 -0.007 -0.008
Lagged dummy for presidential
0.000 0.002 0.001 0.002 -0.001 0.003 Lagged reform in trade neighbors
-0.043
Lagged average reform in other sectors
0.122*** Lagged crisis (growth<0)
-0.007**
Terms of trade shocks
-0.004 Lagged crisis (debt)
0.010
Lagged crisis (bank)
-0.016*** Political reform - Giavazzi and Tabellini (2005)
0.015***
Observations 20,123 4,784 4,784 4,769 4,784 4,265 4,265 21,292 19,521
Note. The estimators are within estimators and allow for first-order autoregressive disturbance term. In Column (1), instead of explicitly allowing for an AR(1) term in the model, the standard errors are clustered at the country-reform level. In Column (8), political reform is a dummy variable taking a value of 1 in the years after democratization. Democratization is defined as the event of becoming a democracy, given that a country was not a democracy in the previous year. All regressions control for country and year fixed effects and country*sector and sector*year interactions. ***, ** and * denote statistical significance at 1, 5 and 10 percent respectively.

36
Table 8
Reforms and democracy - flexible functional form Dependent variable: reform in (country, sector, year) (1) (2) (3) (4) Lagged democracy (polity2<0.15) 0.014 0.011 -0.005 0.014 Lagged democracy (0.15<=polity2<0.75) 0.012** 0.009 0.036*** 0.01 Lagged democracy (polity2>=0.75) 0.015*** 0.016*** 0.038*** 0.016*** Lagged level of index -0.073*** -0.129*** -0.036*** -0.135*** Country FE Y Y Y Y Sector FE Y Y Y Y Year FE Y Y Y Y Country*Sector FE Y Y Sector*Year FE Y Y Observations 20,123 19,521 19,980 19,521
Note. The estimators are within estimators and allow for first-order autoregressive disturbance term. ***, ** and * denote statistical significance at 1, 5 and 10 percent respectively.

37
Table 9a Reforms and democracy: feedback effects
Dependent variable: change in democracy (country, year) (1) (2) (3) (4) Lagged democracy -0.135*** -0.157*** -0.112*** -0.157*** Lagged reform in (country, sector, year) -0.009 -0.011 0.004 -0.010 Country FE Y Y Y Y Sector FE Y Y Y Y Year FE Y Y Y Y Observations 19,043 18,441 19,262 18,441
Note. The estimators are within estimators and allow for first-order autoregressive disturbance term. ***, ** and * denote statistical significance at 1, 5 and 10 percent respectively.

38
Table 9b Reforms and democracy: feedback effects
Dependent variable: change in democracy (country, year) (1) (2) (3) (4) (5) (6) Finance Cap. Acc. Prod. Mkt Agricult. Trade Curr. Acc. Lagged democracy -0.177*** -0.177*** -0.161*** -0.167*** -0.181*** -0.167*** Lagged reform in (country, year) -0.088** -0.016 -0.018 0.017 0.011 -0.038* Country FE Y Y Y Y Y Y Year FE Y Y Y Y Y Y Observations 3,015 3,913 3,195 2,160 2,431 2,160
Note. The estimators are within estimators and allow for first-order autoregressive disturbance term. ***, ** and * denote statistical significance at 1, 5 and 10 percent respectively.

39
Table 10 Reforms and democracy: Principal component
Dependent variable: change in reform index
(country, year)
Dependent variable: change in democracy (country, year)
(1) (2) (3) OLS IV Lagged democracy 0.001*** 0.006*** -0.218*** Lagged level of index (country, year) -0.029*** -0.096*** Lagged reform in (country, year) -1.775 Country FE Y Y Y Year FE Y Y Y Observations 1,418 1,418 1,303 First stage F-stat 41 p-value of F-stat 0.000
Note. The estimators are within estimators and allow for first-order autoregressive disturbance term. ***, ** and * denote statistical significance at 1, 5 and 10 percent respectively. In Column (2), lagged democracy is instrumented by (lagged) democracy in neighboring countries.

40
Variable Obs Mean Std. Dev. Min Max
Change in reform index 20,123 0.01 0.08 -1 1Lagged democracy 20,123 0.59 0.37 0 1Lagged reform_index 20,123 0.40 0.37 0 1Lagged crisis (inflation>40) 5,252 0.10 0.30 0 1Lagged real devaluation 5,252 0.01 0.17 -1.00 1.30Lagged public expenditure as a percent of GDP 5,252 15.06 5.18 2.98 34.39Lagged bureaucratic quality 5,252 2.54 1.14 0 4Lagged tertiary enrollment 5,252 0.27 0.22 0.00 0.97Lagged reforms in geographical neighbor 5,252 0.02 0.03 -0.21 0.22Lagged dummy for left 5,252 0.33 0.47 0 1Lagged dummy for presidential 5,252 0.55 0.50 0 1Lagged democracy in political neighbors 18,970 1.25 5.12 -9 10Lagged crisis (growth<0) 5,234 0.26 0.44 0 1Terms of trade shocks 5,252 -0.01 0.14 -0.70 0.47Lagged crisis (debt) 4,679 0.01 0.12 0 1Lagged crisis (bank) 4,679 0.05 0.22 0 1Political reform (Giavazzi and Tabellini, 2005) 21,919 0.28 0.45 0 1Lagged reform in trade neighbors 5,252 0.01 0.03 -0.21 0.39Change in reform index (principal component) 1,418 0.02 0.04 -0.18 0.31Lagged reform index (principal component) 1,418 0.50 0.25 0 1.00
The summary statistics correspond to samples used in Tables 4, 5, 8a and 8b.
Appendix Table 1. Summary Statistics

41
Code Country Code Country Code CountryAFG Afghanistan GHA Ghana NLD NetherlandsAGO Angola GIN Guinea NOR NorwayALB Albania GMB Gambia NPL NepalARE UAE GNB Guinea-Bissau NZL New ZealandARG Argentina GNQ Equat Guinea OMN OmanARM Armenia GRC Greece PAK PakistanAUS Australia GTM Guatemala PAN PanamaAUT Austria GUY Guyana PHL PhilippinesAZE Azerbaijan HND Honduras PNG Papua New G.BDI Burundi HRV Croatia POL PolandBEL Belgium HTI Haiti PRT PortugalBEN Benin HUN Hungary PRY ParaguayBFA Burkina Faso IDN Indonesia QAT QatarBGD Bangladesh IND India ROM RomaniaBGR Bulgaria IRL Ireland RUS RussiaBHR Bahrain IRN Iran RWA RwandaBLR Belarus IRQ Iraq SAU Saudi ArabiaBOL Bolivia ISR Israel SDN SudanBRA Brazil ITA Italy SEN SenegalBTN Bhutan JAM Jamaica SGP SingaporeBWA Botswana JOR Jordan SLB Solomon IsCAF CAR JPN Japan SLE Sierra LeoneCAN Canada KAZ Kazakhstan SLV El SalvadorCHE Switzerland KEN Kenya SOM SomaliaCHL Chile KGZ Kyrgyz Rep SVK Slovak RepCHN China KHM Cambodia SVN SloveniaCIV Cote D'Ivoire KOR Korea SWE SwedenCMR Cameroon KWT Kuwait SYR SyriaCOG Congo LAO Lao TCD ChadCOL Colombia LBR Liberia TGO TogoCOM Comoros LBY Libya THA ThailandCRI Costa Rica LKA Sri Lanka TJK TajikistanCUB Cuba LSO Lesotho TKM TurkmenistanCYP Cyprus LTU Lithuania TTO Trinidad TobCZE Czech Rep LVA Latvia TUN TunisiaDEU Germany MAR Morocco TUR TurkeyDJI Djibouti MDA Moldova TWN TaiwanDNK Denmark MDG Madagascar TZA TanzaniaDOM Dominican Rep MEX Mexico UGA UgandaDZA Algeria MKD Macedonia UKR UkraineECU Ecuador MLI Mali URY UruguayEGY Egypt MMR Myanmar USA USERI Eritrea MNG Mongolia UZB UzbekistanESP Spain MOZ Mozambique VEN VenezuelaEST Estonia MRT Mauritania VNM Viet NamETH Ethiopia MUS Mauritius YEM YemenFIN Finland MWI Malawi ZAF South AfricaFJI Fiji MYS Malaysia ZAR ZaireFRA France NAM Namibia ZMB ZambiaGAB Gabon NER Niger ZWE ZimbabweGBR UK NGA NigeriaGEO Georgia NIC Nicaragua
Table A2. Country Codes in Figure 2

42
Country Code Group Country Code Group Country Code GroupBurkina Faso BFA 1 Belarus BLR 1 Bolivia BOL 14Kyrgyz Rep KGZ 1 China CHN 1 India IND 14Indonesia IDN 2 Viet Nam VNM 1 Thailand THA 14Turkey TUR 2 Egypt EGY 2 Chile CHL 15Colombia COL 3 Morocco MAR 2 Jamaica JAM 15Paraguay PRY 3 Cameroon CMR 3 Poland POL 15Ukraine UKR 3 Kazakhstan KAZ 3 Taiwan TWN 15Madagascar MDG 4 Burkina Faso BFA 4 South Afr ZAF 15El Salvador SLV 4 Tunisia TUN 4 Australia AUS 16Bulgaria BGR 5 Jordan JOR 5 Austria AUT 16Dominican Rep DOM 5 Kenya KEN 5 Belgium BEL 16Nicaragua NIC 5 Singapore SGP 5 Canada CAN 16Senegal SEN 5 Ghana GHA 6 Switzerlan CHE 16Korea KOR 6 Tanzania TZA 6 Czech Rep CZE 16Romania ROM 6 Albania ALB 7 Germany DEU 16Argentina ARG 7 Georgia GEO 7 Denmark DNK 16Philippines PHL 7 Mozambique MOZ 8 Spain ESP 16India IND 8 Nepal NPL 8 Finland FIN 16Jamaica JAM 8 Bangladesh BGD 9 UK GBR 16Bolivia BOL 9 Ecuador ECU 9 Greece GRC 16Chile CHL 9 Russia RUS 9 Hungary HUN 16Austria AUT 10 Ukraine UKR 9 Ireland IRL 16Czech Rep CZE 10 Indonesia IDN 10 Israel ISR 16Finland FIN 10 Madagascar MDG 10 Italy ITA 16Greece GRC 10 Colombia COL 11 Japan JPN 16Lithuania LTU 10 Paraguay PRY 11 Lithuania LTU 16Portugal PRT 10 El Salvador SLV 11 Netherland NLD 16Norway NOR 11 Turkey TUR 11 Norway NOR 16Israel ISR 11 Venezuela VEN 11 New Zeala NZL 16Japan JPN 11 Argentina ARG 12 Portugal PRT 16Germany DEU 12 Brazil BRA 12 Sweden SWE 16Hungary HUN 12 Guatemala GTM 12 Uruguay URY 16Italy ITA 12 Philippines PHL 12 US USA 16Belgium BEL 13 Senegal SEN 12Switzerland CHE 13 Bulgaria BGR 13Denmark DNK 13 Korea KOR 13Netherlands NLD 13 Latvia LVA 13New Zealand NZL 13 Mexico MEX 13Sweden SWE 13 Nicaragua NIC 13Australia AUS 14Canada CAN 14Spain ESP 14UK GBR 14Ireland IRL 14US USA 14
FinanceTable A3. Country Groups in Figure 2.
Capital
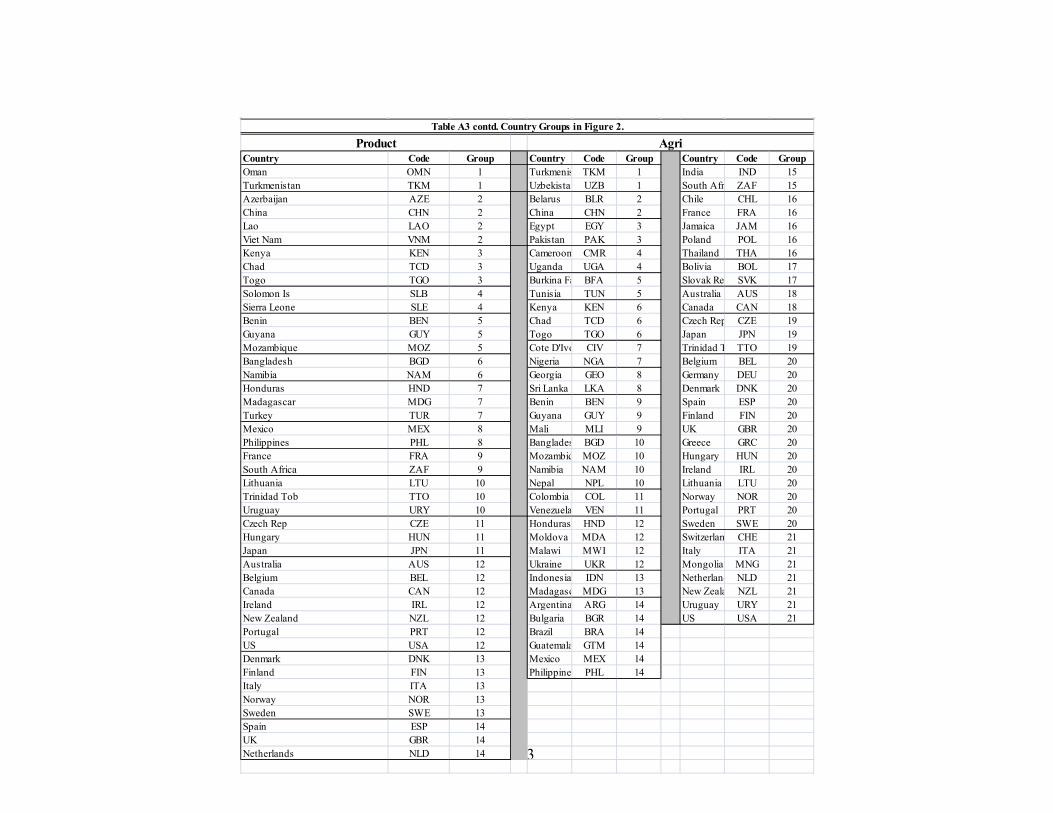
43
Country Code Group Country Code Group Country Code GroupOman OMN 1 Turkmenis TKM 1 India IND 15Turkmenistan TKM 1 Uzbekistan UZB 1 South Afri ZAF 15Azerbaijan AZE 2 Belarus BLR 2 Chile CHL 16China CHN 2 China CHN 2 France FRA 16Lao LAO 2 Egypt EGY 3 Jamaica JAM 16Viet Nam VNM 2 Pakistan PAK 3 Poland POL 16Kenya KEN 3 Cameroon CMR 4 Thailand THA 16Chad TCD 3 Uganda UGA 4 Bolivia BOL 17Togo TGO 3 Burkina Fa BFA 5 Slovak Rep SVK 17Solomon Is SLB 4 Tunisia TUN 5 Australia AUS 18Sierra Leone SLE 4 Kenya KEN 6 Canada CAN 18Benin BEN 5 Chad TCD 6 Czech Rep CZE 19Guyana GUY 5 Togo TGO 6 Japan JPN 19Mozambique MOZ 5 Cote D'Ivo CIV 7 Trinidad T TTO 19Bangladesh BGD 6 Nigeria NGA 7 Belgium BEL 20Namibia NAM 6 Georgia GEO 8 Germany DEU 20Honduras HND 7 Sri Lanka LKA 8 Denmark DNK 20Madagascar MDG 7 Benin BEN 9 Spain ESP 20Turkey TUR 7 Guyana GUY 9 Finland FIN 20Mexico MEX 8 Mali MLI 9 UK GBR 20Philippines PHL 8 Banglades BGD 10 Greece GRC 20France FRA 9 Mozambiq MOZ 10 Hungary HUN 20South Africa ZAF 9 Namibia NAM 10 Ireland IRL 20Lithuania LTU 10 Nepal NPL 10 Lithuania LTU 20Trinidad Tob TTO 10 Colombia COL 11 Norway NOR 20Uruguay URY 10 Venezuela VEN 11 Portugal PRT 20Czech Rep CZE 11 Honduras HND 12 Sweden SWE 20Hungary HUN 11 Moldova MDA 12 Switzerlan CHE 21Japan JPN 11 Malawi MWI 12 Italy ITA 21Australia AUS 12 Ukraine UKR 12 Mongolia MNG 21Belgium BEL 12 Indonesia IDN 13 Netherland NLD 21Canada CAN 12 Madagasc MDG 13 New Zeala NZL 21Ireland IRL 12 Argentina ARG 14 Uruguay URY 21New Zealand NZL 12 Bulgaria BGR 14 US USA 21Portugal PRT 12 Brazil BRA 14US USA 12 Guatemala GTM 14Denmark DNK 13 Mexico MEX 14Finland FIN 13 Philippine PHL 14Italy ITA 13Norway NOR 13Sweden SWE 13Spain ESP 14UK GBR 14Netherlands NLD 14
Product AgriTable A3 contd. Country Groups in Figure 2.