
Demo Version - Italy 2014
32
Edition 2014 - MKG Hospitality - Paris, London, Nicosia, Berlin www.mkg-group.com 1 European Hospitality Report HOTEL INDUSTRY IN ITALY IN 2013 Italie
-
Upload
hospitality-on-think-tank -
Category
Economy & Finance
-
view
311 -
download
0
Transcript of Demo Version - Italy 2014

Edition 2014 - MKG Hospitality - Paris, London, Nicosia, Berlin www.mkg-group.com 1
European Hospitality Report
European Hospitality Report
HOTEL INDUSTRY IN ITALY IN 2013
Ita
lie

Edition 2014 - MKG Hospitality - Paris, London, Nicosia, Berlin www.mkg-group.com 2
European Hospitality Report
European Hospitality Report
Global supply: 30,937 hotels 1,013,566 rooms 1st in the EU Change: -0.3%
Corporate operated chain supply: 624 hotels 79,538 rooms 5th
in the EU Change: +1.6%
Penetration rate: 7.8%, 27th in the EU Change: +0.1 pts
Synthesis: Italy in 2013
An economy that has suffered but shows signs of
improvement
Very low penetration rate for chains: 7.8%
Hospitality industry in Italy boosted in 2013 by the
increase in the occupancy rate (2.2 points), backed
by international demand. Now the occupancy rate
is higher than before the crisis, but still lower than
European standards.
A decade of decline in the ADR made the global
supply competitive.
Activity results have been improving thanks to big
cities and the Upscale segment while the corporate
chain supply shows little change
Key hospitality figures
Occupancy rate 2013
Source : MKG Hospitality Database – Copyright 01/14
ADR in euros VAT incl. 2013
Source : MKG Hospitality Database – Copyright 01/14
RevPAR in euros VAT incl. 2013
Source : MKG Hospitality Database – Copyright 01/14
64,3% 69,2%
62,2% 66,5% 64,4%
67,9%
50%
60%
70%
80%
+2.2 pt
2007 2008 2009 2010 2011 2012 2013 2007 2008 2009 2010 2011 2012 2013
Italy Europe
142,6
95,9 112,2
97,3 112.2
97,4
0
50
100
150
2007 2008 2009 2010 2011 2012 2013 2007 2008 2009 2010 2011 2012 2013
Europe Italy
91,7
66,4 69,7 64,8
72,2 66,1
0
20
40
60
80
100
2007 2008 2009 2010 2011 2012 2013 2007 2008 2009 2010 2011 2012 2013
Italy Europe
Ita
lie

Edition 2014 - MKG Hospitality - Paris, London, Nicosia, Berlin www.mkg-group.com 3
European Hospitality Report
European Hospitality Report
Source : Commission européenne
Source: Eurostat
1. Economic and tourism trends
1.1. Italian economic activity in 2013: new decline, but with a view to improvement
Italy, the third biggest economy in the Euro zone, has been facing the sovereign debt crisis since 2011 that continued to penalize its economy in 2013. Public debt, second in the Euro zone, rose to 132% of the GDP in 2013. This has led the country to apply austerity measures over the recent period to rebalance its economy and bring the country out of debt. This pulled domestic demand down and led to an economic recession. In 2013 Italy’s GDP declined again by -1.9% after -2.4% in 2012. Over the past 6 years GDP fell by close to 10%. Improvement in the GDP by 0.1% in the third quarter put an end to 8 consecutive quarters of contraction. According to the European Commission, growth is expected to resume in 2014 (+0.6%) and to continue in 2015 (+1.2%). European institutions expect economic growth to return after many difficult years driven by austerity. Also notable is that Italy’s current account balance became positive in 2013 for the first time in ten years. This reflects improved external competitiveness and reduces the likelihood of needing to make new structural adjustments with a recessionary effect under the pressure of Brussels authorities or the financial markets. Despite the importance of the Italian debt, the interest rate on sovereign debt was relaxed from 7% in 2011 to 4% at the beginning of 2014. This could galvanize the credit market that decreased sharply over the last years as a result of high tax rates and a need for Italian banks to restore their balance sheets and thus support investments that shrank further in 2013. The recovery of external competitiveness will drive economic growth, but in the short term the impact of strong growth in unemployment, that grew from 10.6% to 12.2% over a year (42% on the 15-24 years of age group, two times higher than in 2008), may continue to weigh on the consumption of households that are waiting for a recovery. Weak domestic demand puts strong downward pressure on the national GDP, destroying the positive effects of the increase in exports. Due to the good performance of the export companies in different sectors (machine tools, fashion, luxury…) the country’s exportations should benefit from implemented competitive measures. Italy is characterized by important regional economic and social disparities, particularly in the traditional North-South separation of the country. Northern regions concentrate almost 75% of national GDP. The economic weight of the region of Milan plus the cities of Turin and Genoa combines with that of Venice, Bologna, Florence and Rome. These major tourist centers and their industrial activity are well developed. Locally, export companies are often located in the industrial districts that are very present in Northern Italy (Lombardy, Piedmont, Emilie-Romagna, Veneto and Friuli). The South and the islands must work with a strong underground economy and lack of infrastructure. The GDP per capita is 40% lower in the South and the unemployment rate is 60% higher. Agriculture, the agro-food industry and leisure tourism are among the main drivers of the local economy, although the economic activity of the major urban centers, especially Naples and Bari, is naturally more diversified.
5
10
15
2007
2008
2009
2010
2011
2012
2013
Italie Zone euro (17 pays)
Unemployment rate
Ita
lie
0
1
2
3
4
2007
2008
2009
2010
2011
2012
2013
Italie Zone euro (17 pays)
Inflation
74%
24%
2%
Sector breakdown
Services Industry Agriculture
Source: Eurostat
Source : Eurostat
Main business sectors
Machine tools, metalworking, luxury goods, chemicals, pharmaceuticals, textile industry
Main macroeconomic
indicators 2013
GDP: -1.9%
Inflation: 1.3%
Private consumption: -2.1%
Unemployment rate: 12.2%
Exports: +0.1%
Gross fixed capital formation: -5.5%
Trade openess rate: 30%

Edition 2014 - MKG Hospitality - Paris, London, Nicosia, Berlin www.mkg-group.com 4
European Hospitality Report
European Hospitality Report 1.2. Tourism industry in Italy
Tourism market supported by international demand in 2013
Italy is the fifth tourist destination in the world. The tourism sector accounts for 10.3% of the GDP in 2013. The country benefits from its tourist appeal as highlighted by its high volume of annual international visitor arrivals (+2.2% in 2013). Tourism is a driver of Italian economic growth that generated 73 billion of euros in 2013. The Italian National Tourism Observatory (INTO) anticipates an increase in volume of international clientele by 2.5% in 2014. Certain regions are should benefit local from measures to improve their supply and their hospitality performance. For example, Milan will host the World Exposition in 2015 where 20 million visitors are expected with 30% from international markets.
The Italian tourism sector relies on various cultural as well as natural advantages like the seaside, islands and the Alps. The cities of northern and central Italy are more characterized by cultural and artistic heritage and attract mostly foreign visitors. Rome is one of the most visited cities in the world and benefits from the Roman ruins, the Vatican and Saint Peter’s that attract more than five million tourists from all over the world every year. Venice and Florence are destinations that offer various cultural riches related to leisure tourism. The expansion of the low-cost airline connections to Italy from many European countries made it possible to develop short stays, and this has become a long-term trend that supports tourist activity in urban areas. In the South of Italy with its favorable climate and many beach resorts (with historical and cultural heritage as well, at sites such as Pompeii) tourism is more oriented toward the shoreline. In Northern Italy the attraction is mountain tourism found at alpine resorts. Leisure tourism is therefore based on quite diverse types of tourism. There are two major types of clientele in Italy: domestic and European as well. Compared to other countries the share of international clients is rather important very diversified. With 24.6% of non-resident nights, Germany is by far the first feeder market in Italy; the country generates close to one quarter of foreign overnights, well ahead of the USA (7.8% or 3.8% of the total overnights). American arrivals increased by +5.7% in 2013; this growth ought to continue in 2014: +6.3% as forecast by the INTO. The strength of international clientele is reflected in the good performance of Venice that, from January to August 2013, received 11.9 million tourists – 1.8% of total compared to 2012 despite a 1.9% decrease in number of Italian visitors. This is because international tourism in the City of Doges is less affected by the Italian domestic economy and more responsive to the non-European growth of the tourist market. However, in the country in general, domestic tourists remain important (52% of overnights). In 2013 residents of Italy decreased their travel causing Italian hotels to suffer from a decrease in number of resident nights (especially at independent hotels in the budget and economy segments where the share of domestic clients is very significant). This trend began in 2009 after five consecutive years of a drop in domestic consumption related to the contraction in national GDP and to the competitive measures that were implemented. The destinations that tend to be visited most by Italians,
52,0%
34,4%
Overnights by nationality
Domestic 52.0%
Europe (excluding France) 34.4%
North America 4.4%
Asia 3.5%
Russia, Ukraine, Turkey 2.6%
South America 1.4%
Other countries 1.8%
43,7 46,1 46,4
30
40
50
2007 2008 2009 2010 2011 2012
International arrivals (in million)
Ita
lie
Main feeder markets
% of nights
spent by non-residents
% of total number of
nights
Germany 24.6% 11.8%
USA 7.8% 3.8%
United Kingdom
7.3% 3.5%
France 7.0% 3.4%
Switzerland 4.8% 2.3%
Source: OMT
Source: Eurostat
Source: Eurostat

Edition 2014 - MKG Hospitality - Paris, London, Nicosia, Berlin www.mkg-group.com 5
European Hospitality Report
European Hospitality Report whether for leisure or professional reasons, are mainly in the northern regions of Italy (Lombardy, Tuscany, Lazio, Emilia-Romagna). Italy suffers from the lack of national policy measures concerning the coordination of different actors and establishing competitive infrastructures. In the 2000s the country registered slower growth in the number of arrivals than its European competitors due to high prices for accommodations. After a decade of decreases in prices, Italy now offers competitive prices on the similar products. International tourism in Italy finds itself competing with its neighbor region the Balkans, where tourist activity has been developing strongly.
Ita
lie

Edition 2014 - MKG Hospitality - Paris, London, Nicosia, Berlin www.mkg-group.com 6
European Hospitality Report
European Hospitality Report
2. Global supply
2.1. Global hotel supply in global accommodation supply
Italy is the largest market in Europe and the third worldwide in terms of hotel volume after the USA and China with more than 1 million rooms. This market is rather fragmented with more than 31,000 hotels with average capacities of 33 rooms, and is strongly influenced by and independent hotel industry of small structures. Average capacity of chain hotels is 4 times higher: corporate chains are still less present in Italy but they are bigger properties, especially in big cities. At the same time, after many years Italy offers a wide agro tourism range that grew by 57% between 2003 and 2012. For several years the global hotel supply has been stagnating: -0.5% in 2012 and -0.3% in 2013, while corporate operated chains have been developing: +3.4% in 2012, +1.6% in 2013. The Italian hotel market is dominated by the midscale and upscale segments which represent about a half of the global supply, but decrease over many years (-8,600 rooms since 2010 and -0.8% over the year 2013). The supply has only grown in the upscale segment in 2013 with almost 6,300 additional rooms, +1.7% compared to 2012. The supplies on the budget and economy segments continue to follow a downtrend since 2003, with a decline by about one third of their supply over a decade. This trend goes is opposite that in other European countries and is related to a very low presence of corporate chains in this segment and their lower visibility to international clients in contrast to the upscale segment that benefits from the dynamics of international arrivals in Italy.
For several years Italy’s supply has followed an uptrend with an upmarket shift in its supply, new growth recorded in 2013. This growth is related to that of independent hotel industry: over the last 5 years the independent hotel supply has grown by 26% on the upscale and luxury segments while the independent hotel supply has decreased by 2.4% in midscale and about 20% on the Economy segments. According to the Istat (National institute for statistics), in 2013 the hotel capacity (in number of beds) accounts for 43% of the supply of commercial tourist accommodations in Italy. Only 4.1% of the supply is provided by alternative commercial accommodations (residences). Campgrounds are another important category in terms of capacity (28.5% of beds).
Ita
lie
1st European hotel supply: more than 1 million rooms
Stagnation of hotel supply, but chain hotels and the Upscale segment are dynamic
Edition 2014 - MKG Hospitality - Paris, London, Nicosia, Berlin www.mkg-group.com 7
European Hospitality Report
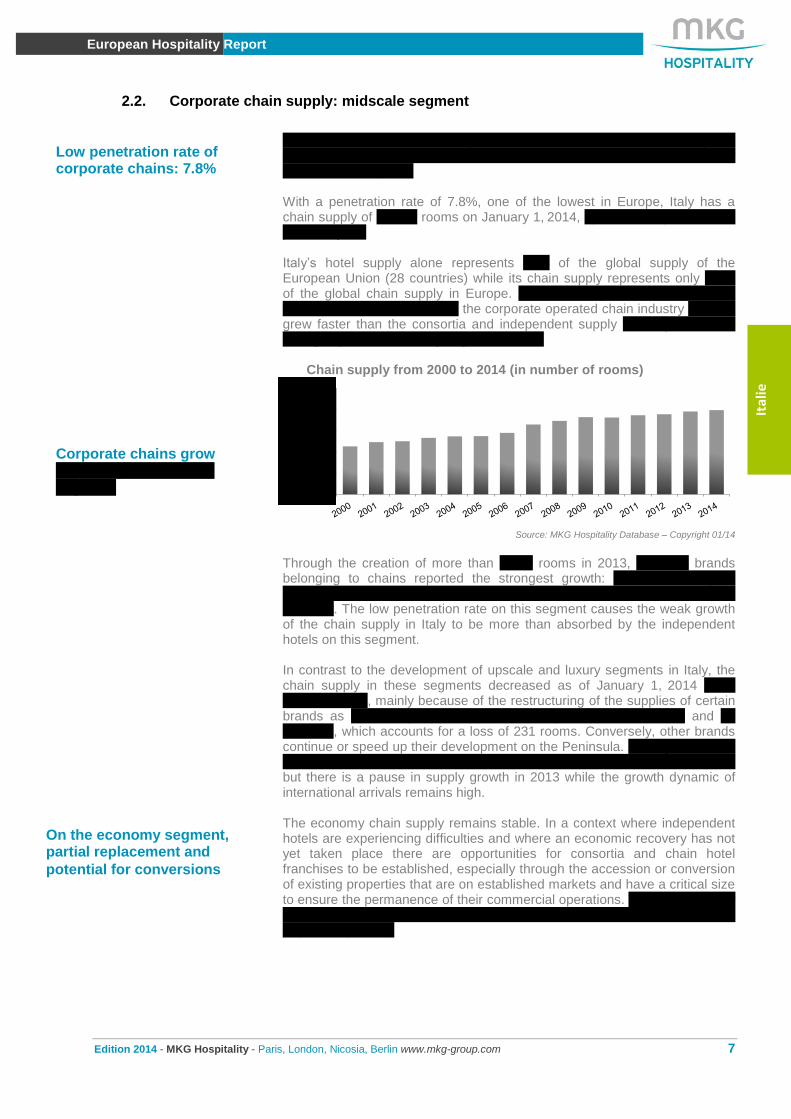
European Hospitality Report 2.2. Corporate chain supply: midscale segment
While the Italian market may be characterized as dominated by an independent supply, corporate operated chains have been developing slowly over the last 10 years. With a penetration rate of 7.8%, one of the lowest in Europe, Italy has a chain supply of 79,538 rooms on January 1,
2014, up 1.6% compared to the
previous year. Italy’s hotel supply alone represents 18% of the global supply of the European Union (28 countries) while its chain supply represents only 4.9% of the global chain supply in Europe. This under-representation of chains means that in the last 5 years the corporate operated chain industry (+9.1%) grew faster than the consortia and independent supply which grew +2.3% through upscale and luxury segments alone.
Chain supply from 2000 to 2014 (in number of rooms)
Source: MKG Hospitality Database – Copyright 01/14
Through the creation of more than 1,700 rooms in 2013, midscale brands belonging to chains reported the strongest growth: +7% over the year against a net loss of 5,600 rooms (-1.2%) in the independent supply on this segment. The low penetration rate on this segment causes the weak growth of the chain supply in Italy to be more than absorbed by the independent hotels on this segment. In contrast to the development of upscale and luxury segments in Italy, the chain supply in these segments decreased as of January 1,
2014 (-500
rooms or -1%), mainly because of the restructuring of the supplies of certain brands as Boscolo (whose supply shrank by almost 900 rooms) and Le Méridien, which accounts for a loss of 231 rooms. Conversely, other brands continue or speed up their development on the Peninsula. Among chains the upscale segment was more dynamic in 2012 (net creation of 1,400 rooms), but there is a pause in supply growth in 2013 while the growth dynamic of international arrivals remains high. The economy chain supply remains stable. In a context where independent hotels are experiencing difficulties and where an economic recovery has not yet taken place there are opportunities for consortia and chain hotel franchises to be established, especially through the accession or conversion of existing properties that are on established markets and have a critical size to ensure the permanence of their commercial operations. This is particularly true since the economy segment has the highest occupancy rate across all segments (67.2%).
0
20 000
40 000
60 000
80 000
100 000
Ita
lie
Low penetration rate of corporate chains: 7.8%
Corporate chains grow especially on midscale segment
On the economy segment, partial replacement and
potential for conversions
Edition 2014 - MKG Hospitality - Paris, London, Nicosia, Berlin www.mkg-group.com 8
European Hospitality Report
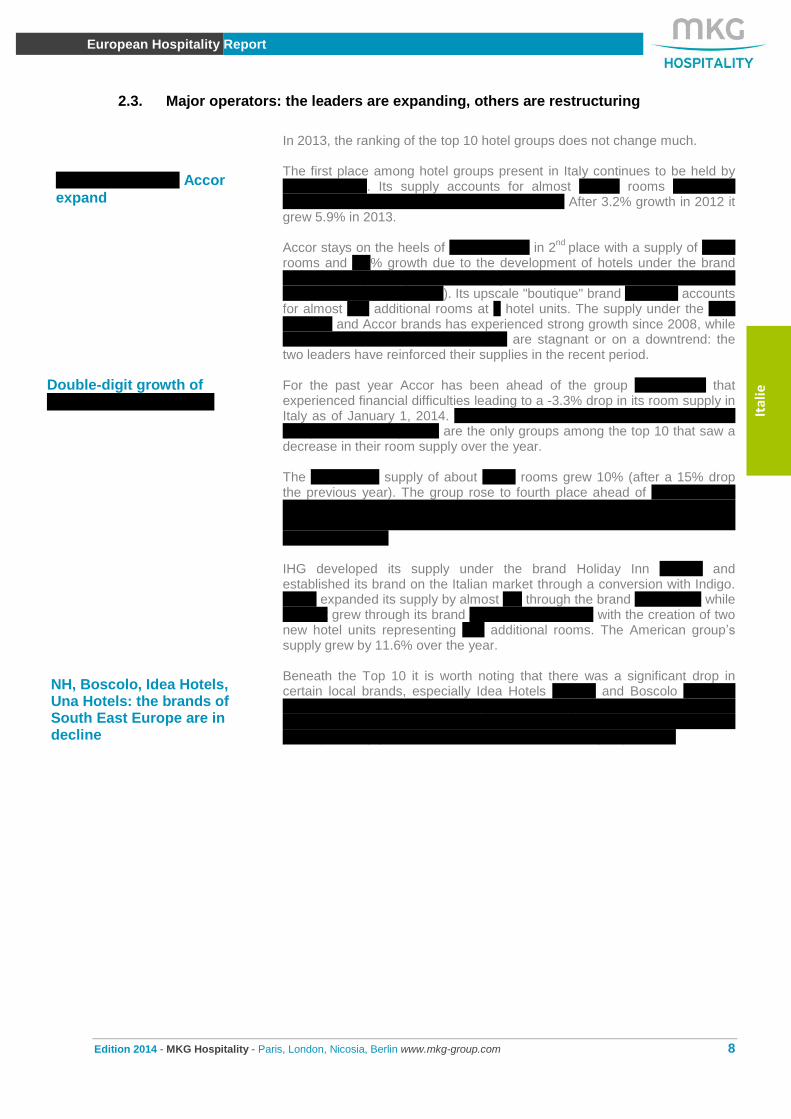
European Hospitality Report 2.3. Major operators: the leaders are expanding, others are restructuring
In 2013, the ranking of the top 10 hotel groups does not change much. The first place among hotel groups present in Italy continues to be held by Best Western. Its supply accounts for almost 13,000 rooms due to its structure as a federation of independent hotels. After 3.2% growth in 2012 it grew 5.9% in 2013. Accor stays on the heels of Best Western in 2
nd place with a supply of 9,000
rooms and 5.4% growth due to the development of hotels under the brand Ibis Styles (a range of the megabrand Ibis that is best suited to reconversions of properties). Its upscale "boutique" brand MGallery accounts for almost 240 additional rooms at 2 hotel units. The supply under the Best Western and Accor brands has experienced strong growth since 2008, while NH Hoteles, Atahotels and Starwood are stagnant or on a downtrend: the two leaders have reinforced their supplies in the recent period.
For the past year Accor has been ahead of the group NH Hoteles that experienced financial difficulties leading to a -3.3% drop in its room supply in Italy as of January 1, 2014. The Spanish brand NH Hoteles and the Italian group UNA Hotels (-0.8%) are the only groups among the top 10 that saw a decrease in their room supply over the year. The ATA Hotels supply of about 4,500 rooms grew 10% (after a 15% drop the previous year). The group rose to fourth place ahead of Starwood that had low growth by 0.4%, with the increase in its supply under the brand Luxury Collection more than compensating for Le Méridien’s withdrawal from the Italian market. IHG developed its supply under the brand Holiday Inn (+10%) and established its brand on the Italian market through a conversion with Indigo. Hilton expanded its supply by almost 5% through the brand Garden Inn while Marriott grew through its brand Autograph Collection with the creation of two new hotel units representing 386 additional rooms. The American group’s supply grew by 11.6% over the year. Beneath the Top 10 it is worth noting that there was a significant drop in certain local brands, especially Idea Hotels (-8.1%) and Boscolo (-45% in 2013, or 1,134 fewer rooms in Italy as of January 1, 2014). Several Boscolo hotels went to the brand Marriott Luxury Collection over the last several years providing growth of that brand and the Marriott group overall.
Ita
lie
Best Western and Accor
expand
Double-digit growth of
Marriott and ATA Hotels
NH, Boscolo, Idea Hotels, Una Hotels: the brands of South East Europe are in decline

Edition 2014 - MKG Hospitality - Paris, London, Nicosia, Berlin www.mkg-group.com 9
European Hospitality Report
European Hospitality Report 3. Hospitality performance indicators in 2013
3.1. The year 2013 over the recent period
Italian hotels experienced a strong decline in RevPAR between 2007 and 2012: nearly -24% through a sharp decline in 2008-2009, followed by a slight recovery in 2010 that was reversed in 2010 and 2012. Nevertheless, growth was resumed in 2013 suggesting the possibility of a positive change for the future of the Italian hospitality industry. The RevPAR grew by 3.6% to reach 72.2€ VAT incl. While the RevPAR is 9% higher than the European average it should be observed that the corporate chain supply in Italy is centered on the midscale and upscale segments. On like segments the RevPAR and the ADR are now lower than European standards, reflecting the country’s current enhanced competitiveness, whereas it was much more expensive than other European countries at the beginning of the 2000s. A positive change of the RevPAR in 2013 is driven by the occupancy rate (+2.2 points) which is mostly due to international demand while the ADR remains the same. A strong rebound in occupancy recorded in 2013 allowed Italy to reach 64.4%, a level unheard of since 2007 and 4.7 points higher than it was in 2010. Growth in occupancy is observed across all segments, but first on the most upscale that rely on international clientele that was more dynamic in 2013. Italy is slowly catching up in terms of occupancy compared to the rest of Europe (67.9% on average in 2013). The stabilization of the ADR and the end of a shrinking trend since the beginning of the economic crisis in 2007 are noteworthy. The Italian market’s weak occupancy rate is lower than the European average (67.9%) and pulled down the ADR that had been on a strong decline over the last decade. Stabilization of the ADR in 2013 and especially the rebound of the occupancy rate could brighten the future for Italy’s hospitality industry, as hotels will gradually be able to improve their margins. Although Italy shows a 3.6% increase in its RevPAR in 2013, the result differs among categories. With +3.9% growth, the upscale segment remains Italy’s growth engine. Although it grew less, the economy segment maintains a high occupancy rate of 67.2% in 2013. Conversely, the midscale segment registers a lower occupancy rate of 62.3% despite 2.3 points growth over the year. The RevPAR spread between these two segments is shrinking. The difference was more than 17€ in 2007, while in 2013 it is 7.4€. This phenomenon may be explained by the ADR that dropped more significantly in the midscale segment due to a decrease in occupancy; average prices have not yet recovered (-1.2% in 2013 on the midscale segment). After a significant drop in the RevPAR in 2012, hotels located along the coast took off again in 2013 with 2% growth to reach 92.4€ VAT incl. driven mostly by occupancy (+1.6 points) that compensated for the ADR (-0.7%). The RevPAR of hotels near airports continued to progress (+5.4%), driven exclusively by their occupancy (+3.8 points) to achieve an occupancy rate higher than the national average (69.3%). In 2013 the RevPAR of hotels in city-centers grew by 3.5% thanks to an increase in the occupancy rate (66.4%, or +2 points); the ADR stabilized (+0.3%)
Ita
lie
A small variation in RevPAR between Economy and Midscale segments
Occupancy rate 64.4% up by 2.2 points and higher
than pre-crisis levels
End of a downtrend for the
ADR
+3.8 points of the occupancy rate in airport hotels

Edition 2014 - MKG Hospitality - Paris, London, Nicosia, Berlin www.mkg-group.com 10
European Hospitality Report
European Hospitality Report 3.2. Growth in GDP and RevPAR
Monthly change (%) in occupancy rate, ADR and RevPAR in Italy since 2011
Source: MKG Hospitality Database – Copyright 01/14
Whereas growth accelerated in 2011, it plunged again in 2012 with a decrease of GDP. This drop in activity, caused by a simultaneous decrease in the occupancy rate and ADR, was observed from October 2011 until October 2012. Activity recovered from November 2012 through the occupancy rate, but this was insufficient to compensate for a decrease in the ADR that continued until 2013. From Mars/April the ADR stabilized and the hotel sector benefited from a rebound of the RevPAR in the summer and second semester. The Italian hotel industry entered the year 2014 with a very positive monthly trend despite the fragile situation of the Italian economy especially considering domestic consumption penalized by unemployment and weak investments (decline in Gross fixed capital formation by 5.5% in 2013). The Italian bank Unicredit announced their aim to support the hotel industry development and investments whether by national groups or international groups for the purpose of their development and repositioning. Change in RevPAR and GDP since 2000
Source: MKG Hospitality Database – Copyright 01/14
Due to the high price positioning (and significant contribution of American and Japanese clients at the beginning of the decade that fell sharply after 911 and the SARS crisis) which led to a drastic shift during the years of crisis, the Italian RevPAR decreased since the year 2000. While the RevPAR had rebounded during the cycle of expansion, the hotel market has preceded the economic recovery, which is expected in 2014 following 3.6% growth in 2013.
-10%
-5%
0%
5%
10%
15%
20%
Occupancy rate ADR RevPAR
-6%
-4%
-2%
0%
2%
4%
6%
-18%
-12%
-6%
0%
6%
12%
18%
2000 2001 2002 2003 2004 2005 2006 2007 2008 2009 2010 2011 2012 2013 2014
RevPAR GDP
Ita
lie
Hotel activity recovers from mid-2013

Edition 2014 - MKG Hospitality - Paris, London, Nicosia, Berlin www.mkg-group.com 11
European Hospitality Report
European Hospitality Report 4. Major markets
RevPAR growth in major Italian cities In general, major Italian cities improved their performance in 2013. Florence shows the highest growth (11.3%) in its RevPAR, followed by Venice that posted 9.1% growth, which is higher than the national average. Naples is the only city that registered a decline in RevPAR in 2013 (-3.2%) after a great increase in 2012 (+9.4%) when other cities and Italy in general faced difficulties. RevPAR growth between 2012 and 2013
Source: MKG Hospitality Database – Copyright 01/14 Rome Administrative capital of Italy, Rome is above all a major cultural destination thanks to its wealth of monuments, museums and archeological sites. Although the city is situated outside the economic center of the country (the North) it still plays a very important economic role and remains a decision-making center. There are two airports in the city Roma Fiumicino (the 1
st
national airport, 25% of passenger flows, -2.2% in 2013) and Roma Ciampino (9
th national airport, 3.3% of passenger flows, +5.7% in 2013).
Rome and its surrounding area has a supply of about 15,000 chain rooms on January 1, 2014, up significantly by 9% over the previous year. Overall, the Italian capital hosts one-fifth of the chain supply in the country. Best Western is the first brand on Rome’s market with about 2,000 rooms. Alongside this growth, Rome registered a substantial increase in number of arrivals in 2013, up by more than 5% over the year according to the regional statistics agency (Ente Bilaterale Territoriale della Regione Lazio). As in London or Paris the BRIC countries are the major feeder markets for the Italian capital with growth in arrivals of Russians (+16.7%), Chinese (+17.3%), Indians (+25.1%), and Latin Americans (+18.7%), especially Brazilians. Rome plans to work in partnership with Milan which will host the World Expo in 2015 to give another boost to the city’s good performance. Other events could have a beneficial effect on hotel indicators such as the organization of the Cardiology congress. In addition, religious tourism is always popular and the current Pope’s good image enhances Rome’s appeal.
0,2%
4,2%
5,5%
11,3%
-3,2%
9,1%
-8% -3% 2% 7% 12%
Rome
Milan
Turin
Florence
Naples
Venise
Ita
lie
Rome: a rise in chain supply, stabilization of the performance indicators

Edition 2014 - MKG Hospitality - Paris, London, Nicosia, Berlin www.mkg-group.com 12
European Hospitality Report
European Hospitality Report Some of the ongoing work to extend metro lines and create two new ones (C and D) will be completed in 2014: the extension of Conca d’Ono-Jonio (line B), and the new line C between Monte Compatri-Pantano and Lodi (17 km). The enhanced attractiveness of hotels that will be served by those lines will support their performance growth in the coming years. In terms of performance, the RevPAR has grown by 0.2% in 2013; the occupancy rate and the ADR are almost unchanged, but the supply increased significantly. Despite stability in 2013, performance indicators are higher than the national average, although lower than in Milan and Venice in some segments such as the upscale segment. Milan Milan, the economic capital of the country, has many activity poles and is also an important destination for business tourism. The fashion and design industries, and also the automotive industry, chemical industry, pharmacy, banking and insurance, media and industrial machinery, are important activity sectors. The city has cultural and tourist interests as well, especially through fashion, but it is dominated by business symbolized by the "Piazza degli Affari" where the Italian Stock exchange is situated. The MICE segment plays an important role too particularly through the presence of Fieramilano. Milan is a city that is open to the rest of the world due to the presence of 3 airports: Malpensa 52 km outside the city for international flights, Linate airport 12 km away for national and European flights and a low-cost airport located Bergamo 50 km away. These three airports are among the top 5 Italian airports in number of passengers after Rome’s airport. The airports registered 35 million passengers in all in 2013 down 6 points from 2012. The city has also the railway stations, the main station being Stazione Centrale which was recently renovated and accommodates the high-speed lines. The station handles 120 million passengers per year. The capital of Lombardy, 1
st economic region in Italy, will host the World
Exposition in 2015: this should attract an important volume of international arrivals. The mix of tourists' nationalities is already quite diverse with 7% of arrivals from Russia (with strong growth), 7% from France, followed by Americans, Germans and Chinese who present 6% of the arrivals to Milan. Special feature of Milan – 9 out of 10 clients come for business unlike other big Italian cities such as Rome and Venice where tourists travel for leisure. The World Expo will bring various hotel projects, especially in on the luxury and palace segment, with different projects that were launched recently (Palazzo Parigi, Hotel Pierre) and others that are in the pipeline (hotels Excelsior, W and Mandarin Oriental). A village will be created (Villagio Expo) for the World Expo in the area of Cascina Merlata not far from Fieramilano. Different important buildings will be delivered in 2015 in the area of Porta Nuova, where Unicredit has built its headquarters. Other major urban projects including hotels will open for the World Expo in Milan. After several years of decline, the chain hotel supply stabilized in 2013 and grew by almost 16,000 rooms in the area of Milan. Ata Hotels is the first brand with 2,800 rooms in the area, representing almost half of the global supply of the group in the country. Italian group Idea Hotels has a very strong presence in Milan as well (39% of its supply in Italy).
Ita
lie
Milan: RevPAR in increase of 4.2% in 2013
Important local players

Edition 2014 - MKG Hospitality - Paris, London, Nicosia, Berlin www.mkg-group.com 13
European Hospitality Report
European Hospitality Report Milan registered good results in 2013 with a 4.2% increase in the RevPAR of the hotel groups due to a 0.7% increase in rise of prices and an occupancy rate up by 2.3 points. The performance of chain hotels is higher than the national average. The upscale segment made an important contribution and saw growth in its performance (+4.2% for the RevPAR in 2013). The RevPAR of chain hotels on the economy segment is higher compared to the RevPAR on the midscale segment (50.1€) thanks to a high occupancy rate. The chain supply on the economy segment represents less than 1,000 rooms in all of Milan.
Venice Famous for Saint Mark's Square, its canals, its lagoon and carnival week, the city of the Doges benefits from very strong tourist dynamics and its reputation as a "romantic" destination for international visitors. Due to a land shortage and the heritage character of the city, growth in the supply is obviously limited and usually results from conversions of independent hotels or other accommodations. Moreover, due to the low number of residents in Venice’s historic neighborhoods local authorities would like to restrict the conversions of accommodations. Within these limitations, the major projects for infrastructures with an economic vocation (excluding tourism) are mostly situated in the area of Mestre and Marco Polo airport; in the lagoon the primary urban development project is for Tronchetto. Due to very good performances recorded in upscale and luxury segment, many hotel projects are under consideration on these segments in Venice, but the specific architectural constraints of the city make any hotel project complex. The airport of Venice (5
th at the national level) records more than 8 million
passengers in 2013 (+2.2%). 80% of passengers come from abroad. Best Western is the leading brand (with nearly 800 rooms), because of the structure of the supply in Venice’s urban area that continues to be dominated by independent hotels. Venice nonetheless has more than 4,200 chain-operated rooms out of a total of 15,000 rooms including both chains and the independent supply (Mestre and Lido included). 2013 is the year of recovery in economic activity while GDP continues to decrease, Venice shows strong progress with growth of its RevPAR (+9.1%) driven mainly by a strong increase in prices (+6.8%) as well as a slight increase in arrivals (+1.5%). Results are, as usual, higher than the national average. RevPAR growth is supported by Biennale in odd years, but the 9.1% increase in 2013 follows a 2% decline in 2012, the trend change may thus be considered positive over the last two years. Florence
Jewel of the Italian Renaissance, the city of Florence is a favorite among the tourists. Its economy largely depends on tourism and consists of various cultural activities and events, the city benefits from strong international demand. Tuscany, the region where Florence is located, is one of the most touristed regions, it has very rich cultural, wine-making, urban and coastal heritage.
Ita
lie
In chain hotel industry the RevPAR is higher in Economy than on the Midscale segment, and solid on the Upscale segment
Venice climbs higher and higher

Edition 2014 - MKG Hospitality - Paris, London, Nicosia, Berlin www.mkg-group.com 14
European Hospitality Report
European Hospitality Report Tourism in Florence produced more than 3 billion euros in 2013, +8% compared to 2008. The first half of 2013 showed an increase in number of international arrivals by 2.2% thanks to the increase in number of tourists from BRIC countries, especially from Russia and China, even if French, British and German clientele remain dominant in the city. Florence’s airport registered about 2 million passengers in 2013, a 7.1% increase in passenger arrivals. More than 80% of passengers are from abroad. With 3,709 chain rooms on January 1
st 2014 (-0.4% compared to 2013),
Florence is fragmented market: there are various brands but their number of properties is very small. No international brand has more than 500 rooms in its supply. After a strong increase in RevPAR over the last two years, and especially in 2011 with an 11.2% increase, hotels in Florence experienced a 3.8% decline in 2013. The activity rises in 2013 with strong growth in the RevPAR by 11.3% driven by the occupancy rate (+4.8%) but also the ADR (+3.9). This growth is seen in all segments: economy segment (+5.9%), midscale segment (+8.1%) and upscale segment (+12.3%). Demand is driven by international arrivals as it is on a national level, and upscale hotels benefit thanks to their good locations. Turin An important industrial and economic center of Italy, Turin relies on export, especially the automotive industry, machinery, mechanical equipment and electric products. Hotel activity strongly depends on economic activity, leisure tourism is less important in Turin compared to other major Italian agglomerations despite the presence of industrial sites and its proximity to the Alps. However, Turin will be European capital of Sport in 2015 which is supposed to enhance tourist arrivals. On the long term, a project for high-speed train rails is expected between Lyon and Turin that should improve activity in the city. At present, the railway station of Turin Porta Nuova is the third biggest Italian station with 70 million of passengers each year. Porta Susa station will be renovated in the future in light of the high-speed rails to France (Turin is already integrated in the high-speed railway network of Italy). The chain hotel supply decreased slightly in 2013 (-2.6%), falling to 3,000 rooms. Despite a reorganization of NH Hotels over the last few years, this chain remains a leader on Turin’s hotel market. Among Italian agglomerations, Turin is one of the most sensitive to changes in the economic situation. After strong decreases in recent years, the city’s economy registers a rebound in its performance in 2013. The RevPAR shows growth by 5.5% supported by the occupancy rate (+3.8%) while the ADR continues to decrease (-0.9% compared to the previous year). Naples Located on the west coast of Italy and one hour from Rome by train since 2007, the economy of the city of Naples is based on tourism and port activities, but also on agriculture, trade, industry and handcrafts. The gap in economic activity and unemployment with big Northern cities is historically very big, however, it has shrunk significantly over the last years.
Ita
lie
Florence: +11.3% in 2013, a demand maintained by international arrivals
Turin, the capital of the automotive industry rises up

Edition 2014 - MKG Hospitality - Paris, London, Nicosia, Berlin www.mkg-group.com 15
European Hospitality Report
European Hospitality Report The tourist appeal of Naples is based on its historical and cultural heritage and on its proximity to various archeological and volcanic sites as well, its beaches and its favorable climate. Development of Mediterranean cruises also plays a big role in the city’s seasonal tourist appeal: over a 10 year period the number of cruise passengers has increased by more than 30%. Naples is the seventh port in the country with more than 1.09 million passengers in 2013, but this figure is down compared to the previous year (1.22 million of passengers). Naples’ airport (8
th national airport) handled 5,400,000 passengers in 2013
but this figure is down compared to 2012 (-6.2%). In addition, the city developed its airlines to Russia (Moscow and Saint-Petersburg) which enhanced passenger traffic to and from this new market-source. The seaside area (Amalfi Coast) attracts mostly Russian, German, British and tourists from the Eastern countries. However, Naples’ chain hotel supply remains small with 1,875 rooms. Contrary to the Italian trend overall and in keeping with the drop in number of international arrivals by airlines and by sea, Naples shows a decrease in its performance: -3.2% for the RevPAR in 2013 after being the only major destination that posted growth in 2012 (+9.4%).
Ita
lie
Naples, against national
trends

Edition 2014 - MKG Hospitality - Paris, London, Nicosia, Berlin www.mkg-group.com 16
European Hospitality Report
European Hospitality Report
STATISTICAL BOOK
ITALY
Ita
lie

Edition 2014 - MKG Hospitality - Paris, London, Nicosia, Berlin www.mkg-group.com 17
European Hospitality Report
European Hospitality Report
Statistical book
1. Global supply
Global supply as of 01/01/2014
Hotels 2013 Rooms 2013 Hotels 2014 Rooms 2014 Change in no.
of rooms
Change in % of no. of rooms
Budget 3,612 45,777 3,438 43,455 -2,322 -5.1%
Economy 6,654 113,102 6,509 110,327 -2,775 -2.5%
Midscale 15,289 484,318 15,243 480,438 -3,880 -0.8%
Upscale / Luxury 5,607 373,050 5,747 379,346 6,296 1.7%
Total 31,162 1,016,247 30,937 1,013,566 -2,681 -0.3%
Source: MKG Hospitality Database – Copyright 01/14
Corporate chain supply as of 01/01/2014
Hotels 2013 Rooms 2013 Hotels 2014 Rooms 2014 Change in no.
of rooms
Change in % of no. of rooms
Economy 33 3,855 34 3,890 35 0.9%
Midscale 264 24,656 280 26,383 1 727 7.0%
Upscale / Luxury 314 49,767 310 49,265 -502 -1.0%
Total 611 78,278 624 79,538 1,260 1.6%
Source: MKG Hospitality Database – Copyright 01/13
2014/2013 change in chain hotel and independent supply
Change in chain rooms Change in independent
rooms Change in
global supply
Budget 0 -2,322 -2,322
Economy 35 -2,810 -2,775
Midscale 1,727 -5,607 -3,880
Upscale / Luxury -502 6,798 6,296
Total 1,260 -3,941 -2,681
Source: MKG Hospitality Database – Copyright 01/14
Supply breakdown by category (rooms)
Change in chain rooms Change in independent
rooms Change in
global supply
Budget 0.0% 4.7% 4.3%
Economy 4.9% 11.4% 10.9%
Midscale 33.2% 48.6% 47.4%
Upscale / Luxury 61.9% 35.3% 37.4%
Total 100.0% 100.0% 100.0%
Source: MKG Hospitality Database – Copyright 01/14
Ita
lie

Edition 2014 - MKG Hospitality - Paris, London, Nicosia, Berlin www.mkg-group.com 18
European Hospitality Report
European Hospitality Report Penetration rate of corporate operated chains
Hotels 2013 Rooms 2013 Hotels 2014 Rooms 2014
Change in no. of rooms
Change in % of no. of rooms
Budget 0.0% 0.0% 0.0% 0.0% - -
Economy 0.5% 3.4% 0.5% 3.5% 0.0 0.1
Midscale 1.7% 5.1% 1.8% 5.5% 0.1 0.4
Upscale / Luxury 5.6% 13.3% 5.4% 13.0% -0.2 -0.4
Total 2.0% 7.7% 2.0% 7.8% 0.0 0.1
Source: MKG Hospitality Database – Copyright 01/14
Average hotel size in 2014
Global supply Corporate chain supply Corporate chain and
consortia supply
Budget 13 - 13
Economy 17 114 16
Midscale 32 94 30
Upscale / Luxury 66 159 61
Total 33 127 31
Source: MKG Hospitality Database – Copyright 01/14
Ita
lie
Edition 2014 - MKG Hospitality - Paris, London, Nicosia, Berlin www.mkg-group.com 19
European Hospitality Report
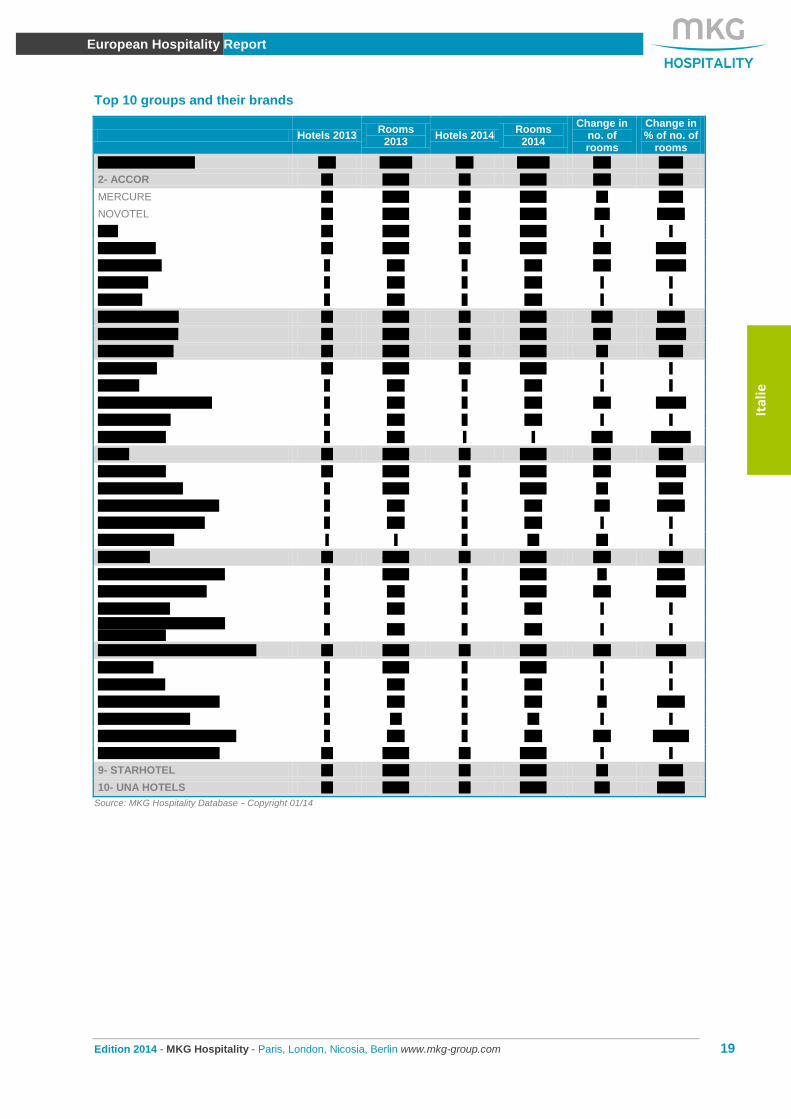
European Hospitality Report Top 10 groups and their brands
Hotels 2013 Rooms
2013 Hotels 2014
Rooms 2014
Change in no. of rooms
Change in % of no. of
rooms
1- BEST WESTERN 174 12,917 183 13,680 763 5.9%
2- ACCOR 64 8,591 69 9,046 455 5.3%
MERCURE 24 2,603 25 2,667 64 2.5%
NOVOTEL 13 2,289 13 2,200 -89 -3.9%
IBIS 10 1,738 10 1,738 - -
MGALLERY 10 1,087 12 1,325 238 21.9%
IBIS STYLES 5 495 7 737 242 48.9%
PULLMAN 1 275 1 275 - -
SOFITEL 1 104 1 104 - -
3- NH HOTELES 52 8,239 49 7,968 -271 -3.3%
4- ATA HOTELS 20 5,472 20 6,021 549 10.0%
5- STARWOOD 25 5,740 25 5,762 22 0.4%
SHERATON 11 3,464 11 3,464 - -
WESTIN 4 899 4 899 - -
LUXURY COLLECTION 6 703 8 956 253 36.0%
FOUR POINTS 2 443 2 443 - -
LE MERIDIEN 2 231 - - -231 -100.0%
6- IHG 33 5,124 35 5,433 309 6.0%
HOLIDAY INN 16 2,474 17 2,722 248 10.0%
CROWNE PLAZA 8 1,616 8 1,626 10 0.6%
HOLIDAY INN EXPRESS 8 842 8 829 -13 -1.5%
INTERCONTINENTAL 1 192 1 192 - -
HOTEL INDIGO - - 1 64 64 -
7- HILTON 18 4,043 19 4,242 199 4.9%
HILTON INTERNATIONAL 7 2,219 7 2,211 -8 -0.4%
HILTON GARDEN INN 7 993 8 1,200 207 20.8%
DOUBLETREE 3 461 3 461 - -
THE WALDORF ASTORIA COLLECTION
1 370 1 370 - -
8- MARRIOTT INTERNATIONAL 21 3,297 23 3,679 382 11.6%
MARRIOTT 3 1,078 3 1,078 - -
COURTYARD 3 449 3 449 - -
RENAISSANCE HOTELS 2 406 2 402 -4 -1.0%
BULGARI HOTELS 1 58 1 58 - -
AUTOGRAPH COLLECTION 2 159 4 545 386 242.8%
AC HOTELS MARRIOTT 10 1,147 10 1,147 - -
9- STARHOTEL 20 3,401 20 3,411 10 0.3%
10- UNA HOTELS 29 2,825 29 2,802 -23 -0.8%
Source: MKG Hospitality Database – Copyright 01/14
Ita
lie

Edition 2014 - MKG Hospitality - Paris, London, Nicosia, Berlin www.mkg-group.com 20
European Hospitality Report
European Hospitality Report Top 30 major brands
2013 2014 Hotels
2013 Rooms
2013 Hotels 2014
Rooms 2014
Change in no. of rooms
Change in % of no. of
rooms
1 1 BEST WESTERN 174 12,917 183 13,680 763 5.9%
2 2 NH HOTELES 52 8,239 49 7,968 -271 -3.3%
3 3 ATAHOTELS 20 5,472 20 6,021 549 10.0%
4 4 SHERATON 11 3,464 11 3,464 - -
5 5 STARHOTEL 20 3,401 20 3,411 10 0.3%
6 6 UNA HOTELS & RESORT 29 2,825 29 2,802 -23 -0.8%
9 7 HOLIDAY INN 29 2,474 29 2,722 248 10.0%
7 8 MERCURE 24 2,603 25 2,667 64 2.5%
8 9 IDEA HOTEL 21 2,499 20 2,297 -202 -8.1%
11 10 HILTON INTERNATIONAL 16 2,219 17 2,211 -8 -0.4%
10 11 NOVOTEL 13 2,289 13 2,200 -89 -3.9%
13 12 IBIS 10 1,738 10 1,738 - -
14 13 CROWNE PLAZA 8 1,616 8 1,626 10 0.6%
19 14 BARCELO HOTELES 4 1,062 6 1,608 546 51.4%
17 15 MGALLERY 10 1,087 12 1,325 238 21.9%
20 16 B&B 11 1,046 14 1,251 205 19.6%
15 17 QUALITY INN / QUALITY HOTEL
12 1,326 11 1,250 -76 -5.7%
22 18 HILTON GARDEN INN 7 993 8 1,200 207 20.8%
- 19 AC HOTELS MARRIOTT 10 1,147 10 1,147 - -
12 20 BOSCOLO 14 2,066 9 1,134 -932 -45.1%
21 21 DOMINA HOTELS 10 1,032 11 1,123 91 8.8%
18 22 MARRIOTT 3 1,078 3 1,078 - -
28 23 LUXURY COLLECTION 6 703 8 956 253 36.0%
24 24 WESTIN 4 899 4 899 - -
25 25 HOLIDAY INN EXPRESS 8 842 8 829 -13 -1.5%
26 26 MELIA 4 773 5 792 19 2.5%
27 27 TURIN HOTEL 5 745 5 746 1 0.1%
32 28 IBIS STYLES 5 495 7 737 242 48.9%
23 29 GOLDEN TULIP/TULIP INN 9 911 7 687 -224 -24.6%
- 30 RADISSON BLU 3 689 3 579 -110 -16.0%
Source: MKG Hospitality Database – Copyright 01/14
Supply of 5 major groups since 2008
Source: MKG Hospitality Database – Copyright 01/14
13,680
9,046 7,968
6,021 5,762
0
2000
4000
6000
8000
10000
12000
14000
16000
BEST WESTERN ACCOR NH HOTELES ATAHOTELS STARWOOD
2008 2009 2010 2011 2012 2013 2014
Ita
lie

Edition 2014 - MKG Hospitality - Paris, London, Nicosia, Berlin www.mkg-group.com 21
European Hospitality Report
European Hospitality Report 2. Performances
Performance indicators in 2013 (ADR and RevPAR in € VAT incl.)
OR
Change in OR ADR
Change in RevPAR
Change in RevPAR (%) (Pts) ADR (%)
Economy 67.2% 0.7 60.1 0.5% 40.4 1.6%
Midscale 62.3% 2.3 76.7 -1.2% 47.8 2.6%
Upscale / Luxury 65.2% 2.3 133.2 0.2% 86.8 3.9%
Total 64.4% 2.2 112.2 0.0% 72.2 3.6%
Source: MKG Hospitality Database – Copyright 01/14
Occupancy rate, ADR and RevPAR by type of site
OR 2013 Change 13/12 ADR 2013 Change 13/12 RevPAR 2013 Change 13/12
City-center 66.4% 2.0 125.6 0.3% 83.4 3.5%
Airport 69.3% 3.8 96.0 -0.4% 66.5 5.4%
Seaside 62.4% 1.6 148.2 -0.7% 92.4 2.0%
Source: MKG Hospitality Database – Copyright 01/14
Occupancy rate, ADR and RevPAR according the hotel size on the Economy segments
OR 2013 Change 13/12 ADR 2013 Change 13/12 RevPAR 2013 Change 13/12
More than 100 rooms 67.7% -0.9 60.8 0.5% 41.2 1.6%
Source: MKG Hospitality Database – Copyright 01/14
Occupancy rate, ADR and RevPAR according the hotel size on the Midscale and Upscale segments
OR 2013 Change 13/12 ADR 2013 Change 13/12 RevPAR 2013 Change 13/12
Less than 100 rooms 65.0% 2.5 116.8 -0.6% 75.9 3.4%
From 100 to 249 rooms 64.5% 2.5 116.6 0.2% 75.2 4.2%
More than 249 rooms 65.1% 1.3 141.4 -0.3% 92.1 1.8%
Source: MKG Hospitality Database – Copyright 01/14
Ita
lie

Edition 2014 - MKG Hospitality - Paris, London, Nicosia, Berlin www.mkg-group.com 22
European Hospitality Report
European Hospitality Report Seasonality 2012 & 2013 and occupancy rate trend by category since 2007
Source: MKG Hospitality Database – Copyright 01/14
Seasonality 2012 & 2013 and ADR trend by category since 2007
Source: MKG Hospitality Database – Copyright 01/14
Seasonality 2012 & 2013 and RevPAR trend by category since 2007
Source: MKG Hospitality Database – Copyright 01/14
40
50
60
70
80
%
2012 2013
65,0%
61,1%
65,8% 64,3%
66,5%
60,0%
62,9% 62,2%
50%
60%
70%
80%
Economy Midscale Upscale / Luxury
TOTAL
%
70
80
90
100
110
120
130
140
€ VAT Inc.
2012 2013
70,8
104,0
165,7
142,6
59,8 77,6
132,9
112,2
0
20
40
60
80
100
120
140
160
180
Economy Midscale Upscale / Luxury
TOTAL
€ VAT Inc.
30
40
50
60
70
80
90
100
€ VAT Inc.
2012 2013
46,1
63,5
109,0
91,7
39,81 46,59
83,59
69,7
0
20
40
60
80
100
120
Economy Midscale Upscale / Luxury
TOTAL
€ VAT Inc.
Ita
lie

Edition 2014 - MKG Hospitality - Paris, London, Nicosia, Berlin www.mkg-group.com 23
European Hospitality Report
European Hospitality Report 3. Statistics by agglomeration Rome
The following cities are included in the analysis perimeter 2013-2014: ROME, FIUMICINO. FIANO ROMANO
Corporate operated chain supply
Hotels Rooms Hotels Rooms Change in no. of rooms
Change in % of no. of rooms 2013 2013 2014 2014
Corporate chain supply 80 14,159 89 15,434 1 275 9.0%
Source: MKG Hospitality Database – Copyright 01/14
Occupancy rate, ADR and RevPAR (ADR and RevPAR in € VAT incl.)
Category
OR Change in OR ADR Change in RevPAR Change in RevPAR (%)
2013 (Pts) 2013 ADR (%) 2013
Economy 69.9% 1.0 63.1 -3.6% 44.1 -2.2%
Midscale 63.3% -0.1 85.2 -1.2% 54.0 -1.4%
Upscale 65.0% -0.1 147.2 -1.1% 95.7 -1.2%
All categories 65.0% 0.2 135.2 -0.1% 87.9 0.2%
Source: MKG Hospitality Database – Copyright 01/14
Top brands by number of rooms in Budget and Economy segments
Brand Groups Hotels Rooms Brand market
share on its local segment
Share of the destination in the brands’ supply in
the country
HOLIDAY INN EXPRESS IHG 2 206 29.9% 24.8%
IBIS STYLES ACCOR 1 191 27.8% 25.9%
IBIS ACCOR 1 140 20.3% 8.1%
B&B B&B HOTELS 1 81 11.8% 6.5%
COMFORT CHOICE 2 70 10.2% 43.2%
TOTAL 7 688 100%
Top brands by number of rooms on the Midscale segment
Brand Groups Hotels Rooms Brand market
share on its local segment
Share of the destination in the brands’
supply in the country
BEST WESTERN BEST WESTERN 21 1,933 30.3% 14.1%
NH HOTELES NH HOTELES 5 1,151 18.1% 14.4%
HOLIDAY INN IHG 2 783 12.3% 28.8%
MERCURE ACCOR 3 600 9.4% 22.5%
QUALITY INN / QUALITY HOTEL
CHOICE 2 403 6.3% 32.2%
HILTON GARDEN INN HILTON WORLDWIDE 2 375 5.9% 31.3%
COURTYARD MARRIOTT INTERNATIONAL
1 349 5.5% 77.7%
IDEA HOTEL IDEA HOTEL 2 346 5.4% 15.1%
NOVOTEL ACCOR 2 265 4.2% 12.0%
GOLDEN TULIP/TULIP INN LOUVRE HOTELS 1 104 1.6% 15.1%
HOTEL INDIGO IHG 1 64 1.0% 100.0%
TOTAL 42 6,373 100%
Ita
lie

Edition 2014 - MKG Hospitality - Paris, London, Nicosia, Berlin www.mkg-group.com 24
European Hospitality Report
European Hospitality Report Top brands by number of rooms on the Upscale segment
Brand Groups Hotels Rooms Brand market
share on its local segment
Share of the destination in the brands’
supply in the country
SHERATON STARWOOD HOTELS & RESORTS
2 1,476 17.6% 71.1%
MARRIOTT MARRIOTT INTERNATIONAL
3 757 9.0% 70.2%
BARCELO HOTELES BARCELO 4 716 8.6% 44.5%
HILTON INTERNATIONAL HILTON WORLDWIDE 1 517 6.2% 23.4%
BOSCOLO BOSCOLO 2 430 5.1% 37.9%
EUROSTARS HOTUSA 3 420 5.0% 76.5%
STARHOTEL STARHOTEL 3 415 5.0% 12.2%
MELIA MELIA HOTELS INTERNATIONAL
3 386 4.6% 48.7%
THE WALDORF ASTORIA COLLECTION
HILTON WORLDWIDE 2 370 4.4% 100.0%
AUTOGRAPH COLLECTION MARRIOTT INTERNATIONAL
2 325 3.9% 59.6%
WESTIN HOTELS STARWOOD HOTELS & RESORTS
1 316 3.8% 35.2%
CROWNE PLAZA IHG 1 308 3.7% 18.9%
ATAHOTELS ATAHOTELS 1 247 2.9% 4.1%
RADISSON BLU CARLSON REZIDOR HOTEL GROUP
1 232 2.8% 40.1%
UNA HOTELS & RESORT UNA HOTELS 1 197 2.4% 7.0%
INTERCONTINENTAL IHG 1 192 2.3% 100.0%
H10 H10 1 181 2.2% 100.0%
LUXURY COLLECTION STARWOOD HOTELS & RESORTS
1 161 1.9% 16.8%
BAGLIONI HOTELS BAGLIONI HOTELS 1 130 1.6% 36.4%
MGALLERY ACCOR 1 123 1.5% 9.3%
ROCCO FORTE ROCCO FORTE HOTELS 1 122 1.5% 28.6%
JUMEIRAH JUMEIRAH HOTELS 1 116 1.4% 100.0%
SOFITEL ACCOR 1 104 1.2% 100.0%
WARWICK WARWICK INTERNATIONAL
1 89 1.1% 24.8%
CLARION CHOICE 1 43 0.5% 12.0%
TOTAL 40 8,373 100%
Source: MKG Hospitality Database – Copyright 01/14
Ita
lie

Edition 2014 - MKG Hospitality - Paris, London, Nicosia, Berlin www.mkg-group.com 25
European Hospitality Report
European Hospitality Report Milan
The following cities are included in the analysis perimeter 2013-2014: MILAN, PERO, LEGNANO, PESCHIERA BORROMEO, ASSAGO, OPERA, PIEVE EMANUELE, SEGRATE, TREZZANO SUL NAVIGLIO, CORSICO, SAN DONATO MILANESE, SESTO SAN GIOVANNI, CARDANO AL CAMPO, SOMMA LOMBARDO Corporate operated chain supply
Hotels Rooms Hotels Rooms Change in no. of rooms
Change in % of no. of rooms 2013 2013 2014 2014
Corporate chain supply 93 15,358 94 15,722 364 2.4%
Source: MKG Hospitality Database – Copyright 01/14
Occupancy rate, ADR and RevPAR (ADR and RevPAR in € VAT incl.)
Category OR Change in OR
ADR Change in ADR
(%)
RevPAR Change in
RevPAR (%) 2013 (Pts) 2013 2013
Midscale 57.9% 1.3 87.9 -1.7% 50.9 0.4%
Upscale 69.5% 2.8 146.3 0.6% 101.7 4.7%
All categories 68.9% 2.3 132.1 0.7% 91.0 4.2%
Source: MKG Hospitality Database – Copyright 01/14
Top brands by number of rooms on the Economy segment
Brand Groups Hotels Rooms Brand market
share on its local segment
Share of the destination in the brands’ supply in
the country
IBIS ACCOR 3 757 86.2% 43.6%
HOLIDAY INN EXPRESS
IHG 1 121 13.8% 14.6%
TOTAL 4 878 100%
Top brands by number of rooms on the Midscale segment
Brand Groups Hotels Rooms Brand market
share on its local segment
Share of the destination in the brands’ supply in
the country
NH HOTELES NH HOTELES 10 1,748 29.6% 21.9%
BEST WESTERN BEST WESTERN 17 1,741 29.5% 12.7%
IDEA HOTEL IDEA HOTEL 7 898 15.2% 39.1%
NOVOTEL ACCOR 3 586 9.9% 26.6%
HOLIDAY INN IHG 3 474 8.0% 17.4%
HILTON GARDEN INN HILTON WORLDWIDE
1 207 3.5% 17.3%
RAMADA HOTEL WYNDHAM HOTEL GROUP
1 166 2.8% 38.1%
MERCURE ACCOR 2 91 1.5% 3.4%
TOTAL 44 5,911 100%
Ita
lie

Edition 2014 - MKG Hospitality - Paris, London, Nicosia, Berlin www.mkg-group.com 26
European Hospitality Report
European Hospitality Report Top brands by number of rooms on the Upscale segment
Brand Groups Hotels Rooms Brand market
share on its local segment
Share of the destination in the brands’ supply in
the country
ATAHOTELS ATAHOTELS 11 2,824 31.6% 46.9%
STARHOTEL STARHOTEL 6 1,163 13.0% 34.1%
CROWNE PLAZA IHG 3 678 7.6% 41.7%
UNA HOTELS & RESORT
UNA HOTELS 6 631 7.1% 22.5%
MGALLERY ACCOR 3 405 4.5% 30.6%
MARRIOTT MARRIOTT INTERNATIONAL
1 321 3.6% 29.8%
HILTON INTERNATIONAL
HILTON WORLDWIDE
1 319 3.6% 14.4%
MELIA MELIA HOTELS INTERNATIONAL
1 288 3.2% 36.4%
BARCELO HOTELES BARCELO 1 280 3.1% 17.4%
FOUR POINTS STARWOOD HOTELS & RESORTS
1 254 2.8% 57.3%
RADISSON BLU CARLSON REZIDOR HOTEL GROUP
1 250 2.8% 43.2%
DOUBLETREE HILTON WORLDWIDE
1 240 2.7% 52.1%
WESTIN HOTELS STARWOOD HOTELS & RESORTS
1 227 2.5% 25.3%
AC HOTELS MARRIOTT
MARRIOTT INTERNATIONAL
1 158 1.8% 13.8%
AUTOGRAPH COLLECTION
MARRIOTT INTERNATIONAL
1 154 1.7% 28.3%
BOSCOLO BOSCOLO 1 154 1.7% 13.6%
WARWICK WARWICK INTERNATIONAL
1 131 1.5% 36.5%
FOUR SEASONS FOUR SEASONS HOTELS AND RESORTS
1 118 1.3% 50.2%
PARK HYATT HYATT HOTELS & RESORTS
1 112 1.3% 100.0%
SHERATON STARWOOD HOTELS & RESORTS
1 106 1.2% 5.1%
BAGLIONI HOTELS BAGLIONI HOTELS 1 62 0.7% 17.4%
BULGARI HOTELS MARRIOTT INTERNATIONAL
1 58 0.6% 100.0%
TOTAL 46 8,933 100%
Source: MKG Hospitality Database – Copyright 01/14
Ita
lie

Edition 2014 - MKG Hospitality - Paris, London, Nicosia, Berlin www.mkg-group.com 27
European Hospitality Report
European Hospitality Report Venice
The following cities are included in the analysis perimeter 2013-2014: VENICE, MESTRE Corporate operated chain supply
Hotels Rooms Hotels Rooms Change in no. of rooms
Change in % of no. of rooms 2013 2013 2014 2014
Corporate chain supply 36 4,085 36 4 223 138 3.4%
Source: MKG Hospitality Database – Copyright 01/14
Occupancy rate, ADR and RevPAR (ADR and RevPAR in € VAT incl.)
Category OR Change in OR
ADR Change in RevPAR Change in
RevPAR (%) 2013 (Pts) 2013 ADR (%) 2013
Midscale 76.1% 3.1 75.4 5.9% 57.4 10.5%
Upscale 69.7% 0.7 236.7 7.7% 164.9 8.9%
All categories 71.8% 1.5 180.7 6.8% 129.7 9.1%
Source: MKG Hospitality Database – Copyright 01/14
Top brands by number of rooms on the Economy segment
Brand Groups Hotels Rooms Brand market
share on its local segment
Share of the destination in the brands’ supply in
the country
APOGIA APOGIA 1 122 81.3% 100.0%
COMFORT CHOICE 1 28 18.7% 17.3%
TOTAL 2 150 100%
Top brands by number of rooms on the Midscale segment
Brand Groups Hotels Rooms Brand market
share on its local segment
Share of the destination in the brands’ supply in
the country
BEST WESTERN BEST WESTERN 11 795 38.3% 5.8%
NH HOTELES NH HOTELES 2 420 20.2% 5.3%
NOVOTEL ACCOR 1 215 10.3% 9.8%
HOLIDAY INN IHG 1 187 9.0% 6.9%
HILTON GARDEN INN HILTON WORLDWIDE 1 136 6.5% 11.3%
QUALITY INN / QUALITY HOTEL
CHOICE 1 126 6.1% 10.1%
COURTYARD MARRIOTT INTERNATIONAL
1 100 4.8% 22.3%
MERCURE ACCOR 1 99 4.8% 3.7%
TOTAL 19 2,078 100%
Ita
lie

Edition 2014 - MKG Hospitality - Paris, London, Nicosia, Berlin www.mkg-group.com 28
European Hospitality Report
European Hospitality Report Top brands by number of rooms on the Upscale segment
Brand Groups Hotels Rooms Brand market
share on its local segment
Share of the destination in the brands’ supply in
the country
HILTON INTERNATIONAL
HILTON WORLDWIDE 1 379 19.0% 17.1%
LUXURY COLLECTION STARWOOD HOTELS & RESORTS
2 298 14.9% 31.2%
MGALLERY ACCOR 2 215 10.8% 16.2%
TURIN HOTEL TURIN HOTEL 1 200 10.0% 26.8%
WESTIN STARWOOD HOTELS & RESORTS
1 185 9.3% 20.6%
BOSCOLO BOSCOLO 2 181 9.1% 16.0%
STARHOTEL STARHOTEL 1 165 8.3% 4.8%
BAGLIONI HOTELS BAGLIONI HOTELS 1 104 5.2% 29.1%
ORIENT EXPRESS ORIENT EXPRESS 1 104 5.2% 26.5%
AUTOGRAPH COLLECTION
MARRIOTT INTERNATIONAL
1 66 3.3% 12.1%
EUROSTARS HOTUSA 1 61 3.1% 11.1%
UNA HOTELS & RESORT UNA HOTELS 1 37 1.9% 1.3%
TOTAL 15 1,995 100%
Source: MKG Hospitality Database – Copyright 01/14
Ita
lie

Edition 2014 - MKG Hospitality - Paris, London, Nicosia, Berlin www.mkg-group.com 29
European Hospitality Report
European Hospitality Report Florence
The following cities are included in the analysis perimeter 2013-2014: FLORENCE, CAMPI BISENZIO, BAGNO A RIPOLI, SESTO FIORENTINO Corporate operated chain supply
Hotels Rooms Hotels Rooms Change in no. of rooms
Change in % of no. of rooms 2013 2013 2014 2014
Corporate chain supply 34 3,725 34 3,709 -16 -0.4%
Source: MKG Hospitality Database – Copyright 01/14
Occupancy rate, ADR and RevPAR (ADR and RevPAR in € VAT incl.)
Cities OR Change in OR ADR Change in RevPAR Change in
RevPAR (%)
2013 (Pts) 2013 ADR (%) 2013
Midscale 73.3% 4.8 75.0 1.1% 55.0 8.1%
Upscale 72.4% 5.3 155.1 4.0% 112.4 12.3%
All categories 72.1% 4.8 120.9 3.9% 87.2 11.3%
Source: MKG Hospitality Database – Copyright 01/14
Top brands by number of rooms in Budget and Economy segments
Brand Groups Hotels Rooms Brand market
share on its local segment
Share of the destination in the brands’ supply in
the country
IBIS ACCOR 2 347 53.1% 20.0%
B&B GROUPE B&B HOTELS 3 307 46.9% 24.5%
TOTAL 5 654 100%
Top brands by number of rooms on the Midscale segment
Brand Groups Hotels Rooms Brand market
share on its local segment
Share of the destination in the brands’ supply in
the country
BEST WESTERN BEST WESTERN 6 402 28.8% 2.9%
NH HOTELES NH HOTELES 3 339 24.3% 4.3%
NOVOTEL ACCOR 1 180 12.9% 8.2%
HILTON GARDEN INN HILTON WORLDWIDE 1 121 8.7% 10.1%
GOLDEN TULIP/TULIP INN
GROUPE DU LOUVRE 1 111 8.0% 16.2%
IDEA HOTEL IDEA HOTEL 1 72 5.2% 3.1%
TOTAL 14 1,225 100%
Ita
lie

Edition 2014 - MKG Hospitality - Paris, London, Nicosia, Berlin www.mkg-group.com 30
European Hospitality Report
European Hospitality Report Top brands by number of rooms on the Upscale segment
Brand Groups Hotels Rooms Brand market
share on its local segment
Share of the destination
in the brands’
supply in the country
SHERATON STARWOOD HOTELS & RESORTS
1 325 17. 8% 8.8%
STARHOTEL STARHOTEL 3 301 16.4% 8.8%
HILTON INTERNATIONAL HILTON WORLDWIDE 1 208 11.4% 9.4%
WESTIN STARWOOD HOTELS & RESORTS
1 171 9.3% 4.6%
UNA HOTELS & RESORT UNA HOTELS 2 154 8.4% 5.5%
MGALLERY ACCOR 2 145 7.9% 10.9%
AC HOTELS MARRIOTT MARRIOTT INTERNATIONAL
1 118 6.4% 10.3%
FOUR SEASONS FOUR SEASONS HOTELS AND RESORTS
1 117 6.4% 49.8%
ROCCO FORTE ROCCO FORTE HOTELS
1 102 5.6% 23.9%
BOSCOLO BOSCOLO 1 98 5.4% 8.6%
WARWICK WARWICK INTERNATIONAL
1 67 3.7% 18.7%
BAGLIONI HOTELS BAGLIONI HOTELS 1 24 1.3% 6.7%
TOTAL 14 1,830 100%
Source: MKG Hospitality Database – Copyright 01/14
Ita
lie

Edition 2014 - MKG Hospitality - Paris, London, Nicosia, Berlin www.mkg-group.com 31
European Hospitality Report
European Hospitality Report Turin
The following cities are included in the analysis perimeter 2013-2014: TURIN, MONCALIERI, BORGARO
Corporate operated chain supply
Hotels Rooms Hotels Rooms Change in no. of rooms
Change in % of no. of rooms 2013 2013 2014 2014
Corporate chain supply 28 3,020 27 2,942 -78 -2.6%
Source: MKG Hospitality Database – Copyright 01/14
Occupancy rate, ADR and RevPAR (ADR and RevPAR in € VAT incl.)
Category
OR Change in
OR ADR Change in RevPAR
Change in RevPAR (%)
2013 (Pts) 2013 ADR (%) 2013
Midscale 61.9% 1.0 63.9 -3.9% 39.5 -2.4%
Upscale 64.8% 4.7 107.9 -1.0% 69.8 6.7%
All categories 62.4% 3.8 90.4 -0.9% 56.4 5.5%
Source: MKG Hospitality Database – Copyright 01/14
Top brands by number of rooms in Budget and Economy segments
Brand Groups Hotels Rooms Brand market
share on its local segment
Share of the destination in the brands’ supply in
the country
B&B B&B HOTELS 1 83 59.3% 6.6%
IBIS STYLES ACCOR 1 57 40.7% 7.7%
TOTAL 2 140
Top brands by number of rooms on the Midscale segment
Brand Groups Hotels Rooms Brand market
share on its local segment
Share of the destination in the brands’ supply in
the country
NH HOTELES NH HOTELES 4 704 32.9% 8.8%
BEST WESTERN BEST WESTERN 6 449 21.0% 3.3%
GOLDEN TULIP/TULIP INN LOUVRE HOTELS 2 213 10.0% 31.0%
HOLIDAY INN IHG 2 187 8.7% 6.9%
IDEA HOTEL IDEA HOTEL 2 180 8.4% 7.8%
NOVOTEL ACCOR 1 162 7.6% 7.4%
MERCURE ACCOR 1 135 6.3% 5.1%
QUALITY INN / QUALITY HOTEL
CHOICE 2 108 5.1% 8.6%
TOTAL 20 2,138 100%
Top brands by number of rooms on the Upscale segment
Brand Groups Hotels Rooms Brand market
share on its local segment
Share of the destination in the brands’ supply in
the country
TURIN HOTEL TURIN HOTEL 2 315 47.4% 42.2%
STARHOTEL STARHOTEL 1 161 24.2% 4.7%
ATAHOTELS ATAHOTELS 1 99 14.9% 1.6%
AC HOTELS MARRIOTT MARRIOTT INTERNATIONAL
1 89 13.4% 7.8%
TOTAL 5 664 100%
Source: MKG Hospitality Database – Copyright 01/14
Ita
lie
Edition 2014 - MKG Hospitality - Paris, London, Nicosia, Berlin www.mkg-group.com 32
European Hospitality Report
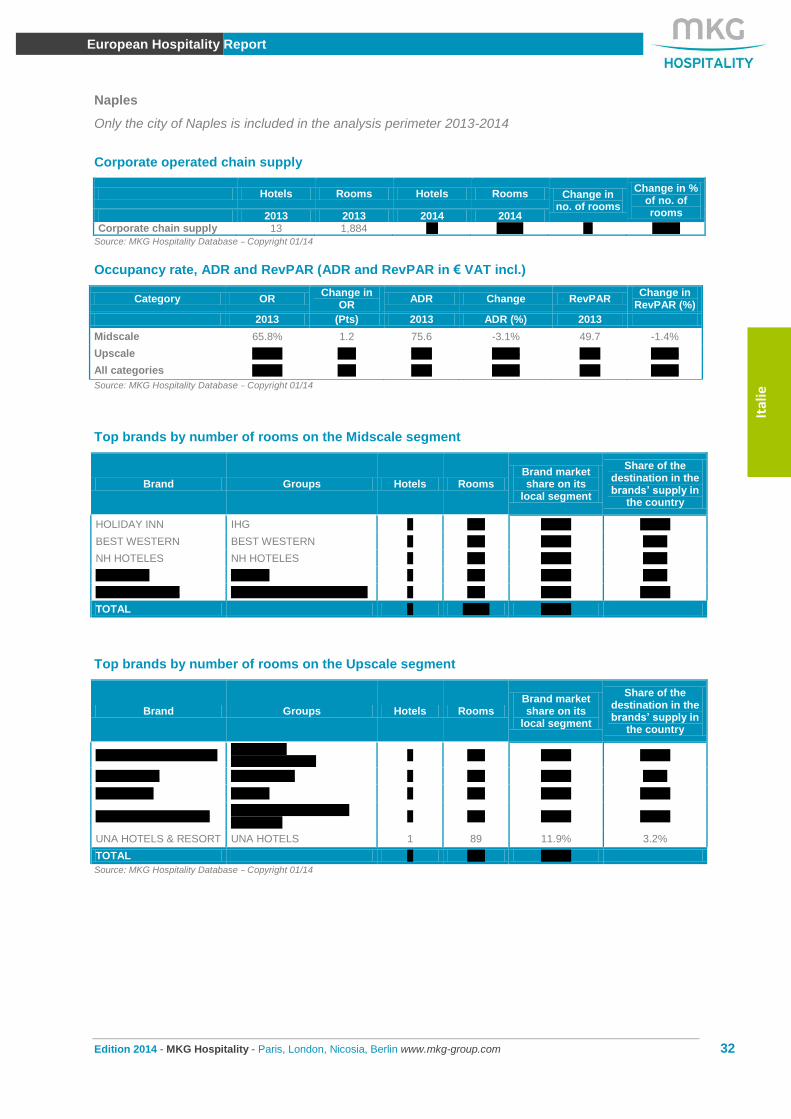
European Hospitality Report Naples
Only the city of Naples is included in the analysis perimeter 2013-2014
Corporate operated chain supply
Hotels Rooms Hotels Rooms Change in no. of rooms
Change in % of no. of rooms 2013 2013 2014 2014
Corporate chain supply 13 1,884 13 1,875 -9 -0.5%
Source: MKG Hospitality Database – Copyright 01/14
Occupancy rate, ADR and RevPAR (ADR and RevPAR in € VAT incl.)
Category OR Change in
OR ADR Change RevPAR
Change in RevPAR (%)
2013 (Pts) 2013 ADR (%) 2013
Midscale 65.8% 1.2 75.6 -3.1% 49.7 -1.4%
Upscale 61.3% -1.7 93.1 -1.4% 57.1 -4.1%
All categories 63.0% -0.6 86.0 -2.3% 54.2 -3.2%
Source: MKG Hospitality Database – Copyright 01/14
Top brands by number of rooms on the Midscale segment
Brand Groups Hotels Rooms Brand market share on its
local segment
Share of the destination in the brands’ supply in
the country
HOLIDAY INN IHG 1 325 28.8% 11.9%
BEST WESTERN BEST WESTERN 3 234 20.7% 1.7%
NH HOTELES NH HOTELES 1 231 20.5% 2.9%
MERCURE ACCOR 2 187 16.6% 7.0%
RAMADA HOTEL WYNDHAM HOTEL GROUP 1 152 13.5% 34.9%
TOTAL 8 1,129 100%
Top brands by number of rooms on the Upscale segment
Brand Groups Hotels Rooms Brand market share on its
local segment
Share of the destination in the brands’ supply in
the country
RENAISSANCE HOTELS MARRIOTT INTERNATIONAL
1 222 29.8% 55.2%
STARHOTEL STARHOTEL 1 173 23.2% 5.1%
MGALLERY ACCOR 1 139 18.6% 10.5%
LUXURY COLLECTION STARWOOD HOTELS & RESORTS
1 123 16.5% 12.9%
UNA HOTELS & RESORT UNA HOTELS 1 89 11.9% 3.2%
TOTAL 5 746 100%
Source: MKG Hospitality Database – Copyright 01/14
Ita
lie


![Lorongzine #0 [demo version]](https://static.fdocuments.in/doc/165x107/568c52de1a28ab4916b87408/lorongzine-0-demo-version.jpg)