demnan manuf
18
Ž . Energ y E conomics 22 2000 569 586 The demand for energy in Greek manufacturing Dimitris K. Christopoulos U Department of Economics and Regional De ¨ elopment, Panteion Uni ¨ ersity, Syngrou A ¨ e. 136, 17671 Athens, Greece Abstract This paper considers an econometric approach to measuring substitutability of three types of energy, i.e. crude oil, electricity and diesel with capital and labour in the manufacturing sector of Greek industry during the period 1970 1990. A general dynamic framework is dev elo ped unde r the ass ump tio n tha t the str uct ure of the production pro ces s is wea kly separable in capital, labour and energy aggregates. The translog total cost function is used to rep resent the pr odu cti on tec hno log y. The mai n adv ant age s of the pro pos ed dyn amic structure are that it is both disaggregated in energy components and consistent with the neo-classical theory of production. 2000 Elsevier Science B.V. All rights reserved. JEL classifications: C51; D24; Q41 Keywords: Energy; Separability; Dynamic structure 1. Introduction Greek industr y has undergone considera ble res tructuring dur ing the las t two decades, bringing great changes in the inputs used, especially of energy. On the one hand, the cost share of capi tal dr opped in ever y two -digit indust ry under Ž . considerat ion Palaskas et al., 1999 . On the other hand, the problem of labour Ž . scarcit y that emerg ed in the late 1960s and earl y 1970s see Lianos, 1975 has bee n U Fax: 30-1-9229-315. Ž . E-mail address: Chris tod@pa nteio n.gr D.K. Chris topoul os . 0140-9883 99 $ - see front matter 2000 Elsevier Science B.V. All rights reserved. Ž . PII: S 0 1 4 0 - 9 8 8 3 9 9 0 0 0 4 1 - 9
-
Upload
giannis-alyfantis -
Category
Documents
-
view
223 -
download
0
Transcript of demnan manuf

8/7/2019 demnan manuf
http://slidepdf.com/reader/full/demnan-manuf 1/18
Ž .Energy Economics 22 2000 569586
The demand for energy in Greekmanufacturing
Dimitris K. ChristopoulosU
Department of Economics and Regional De¨ elopment, Panteion Uni ersity, Syngrou A e.
136, 17671 Athens, Greece
Abstract
This paper considers an econometric approach to measuring substitutability of three typesof energy, i.e. crude oil, electricity and diesel with capital and labour in the manufacturingsector of Greek industry during the period 19701990. A general dynamic framework is
developed under the assumption that the structure of the production process is weaklyseparable in capital, labour and energy aggregates. The translog total cost function is used torepresent the production technology. The main advantages of the proposed dynamicstructure are that it is both disaggregated in energy components and consistent with theneo-classical theory of production. 2000 Elsevier Science B.V. All rights reserved.
JEL classifications: C51; D24; Q41
Keywords: Energy; Separability; Dynamic structure
1. Introduction
Greek industry has undergone considerable restructuring during the last twodecades, bringing great changes in the inputs used, especially of energy. On theone hand, the cost share of capital dropped in every two-digit industry under
Ž .consideration Palaskas et al., 1999 . On the other hand, the problem of labourŽ .scarcity that emerged in the late 1960s and early 1970s see Lianos, 1975 has been
U
Fax: 30-1-9229-315.Ž . E-mail address: [email protected] D.K. Christopoulos .
0140-9883 99 $ - see front matter 2000 Elsevier Science B.V. All rights reserved.Ž .PII: S 0 1 4 0 - 9 8 8 3 9 9 0 0 0 4 1 - 9

8/7/2019 demnan manuf
http://slidepdf.com/reader/full/demnan-manuf 2/18
( ) D.K. Christopoulos Energy Economics 22 2000 569 586570
Ž .eliminated see Christopoulos, 1995 . The rate of unemployment in 1972 was 1.8%and the emigration rate was still quite high. At the same time, energy emerged asan important input in the production process of Greek manufacturing. The shareof the three main sources of energy, crude oil, diesel and electricity, increasedsignificantly during the last two decades, as a percentage of the total cost in the
Ž .sector Palaskas et al., 1999 .Given these changes in the Greek industrial sector in recent years a number of
Žauthors Samouilidis and Mitropoulos, 1982; Vlachou and Samoulidis, 1986; Do-natos and Mergos, 1989; Kintis and Panas, 1989; Caloghirou et al., 1997; Palaskas
.et al., 1999 have focused attention on the degree of substitution among energyŽ .sources and primary inputs of production capital and labour . The question of the
degree of energy substitutability is of great importance in predicting economic
disruptions arising from energy shortages and it has important implications forpublic policy. For example, higher energy prices induce cost-minimising firms tosubstitute toward capital and labour, and higher electricity prices induce firms tosubstitute towards some combination of capital, labour and alternative energytypes. This will have important industrial effects and it will affect capital utilisation,employment, etc. In addition, energy substitutability can assist in addressingimportant issues, including the feasibility of various energy demand profiles, theevaluation of alternative environmental policies, and the impact of carbon orenergy-use taxes.
All previous empirical studies of energy substitution in Greek manufacturing
suggest that energy and labour, and energy and capital are substitutes, with theŽ .exception of Kintis and Panas 1989 who found that energy and capital are
complements. However, these studies have some shortcomings. All approaches arestatic and hold only in equilibrium. More specifically, none of the previous studiestakes into account the static misspecification errors that arise when an instanta-neous adjustment process is not appropriate. The static versions of the modelsneglect the dynamics of adjustment, which results in inadequate knowledge of theadjustment path and the long-run structure. Knowledge of the adjustment processis important in addressing policy issues arising from alternative tax structures or
exogenous energy price shocks. Therefore, under the static specification theestimators will not provide reliable computed elasticity for policy design and policymaking. Thus, by assuming a static production model the applied researcher maybe led to misguided conclusions.
Given the drawbacks of the static models in terms of estimation, hypothesisŽ .testing and analysis, a different approach is adopted here. Following Fuss 1977
Ž .and Pindyck 1979 we assume that the structure of production is weakly separablein capital, labour and energy aggregates. With this restriction it is possible toestimate a production structure with producers choosing cost-minimising factorinputs in two stages. First, an energy sub-model is derived from the separability
restrictions, and is estimated optimising the mix of crude oil, diesel and electricityand generating an aggregate energy price index. Second, the model optimising thecost of aggregate inputs and explaining the demand for those inputs is estimated.

8/7/2019 demnan manuf
http://slidepdf.com/reader/full/demnan-manuf 3/18
( ) D.K. Christopoulos Energy Economics 22 2000 569 586 571
To incorporate dynamic adjustments, a general dynamic demand framework isconstructed using the translog cost-function. Thus, a dynamic structure of thedemand for energy in Greek manufacturing is obtained, which is both disaggre-
gated in energy components, consistent with the neo-classical theory of production,and flexible enough to accommodate a rich pattern of dynamic behaviour.
The paper is organised as follows. In Section 2 the theoretical model is pre-sented. The dynamic formulation of the adopted model is contained and analysedin Section 3. In Section 4 the statistical estimation is presented and the empiricalresults are analysed. Also, in Section 4 we examine whether or not the estimatedrelationships are structural or spurious. Section 5 concludes the paper.
2. The theoretical model
The specification of the model starts with the assumption that the technologyapplied in the production process can be described by a twice differentiableproduction function which relates the flow of output to various inputs of produc-tion. In algebraic terms it can be expressed as
Ž . Ž .Y F X ,T j 1,2,3, . . . . . . 1 j
where Y is the output, X is the u dimensional vector of inputs j, j 1,2, . . . n: j
Ä 4 Ž . N 1 , . . . ,u and T is an index of technological progress. It is assumed in Eq. 1 that
Ž . F X ,T is finite for every X and T and continuous for all non-negative Y and X . j
Ž .It is also assumed that monotonicity is valid for F X ,T and that the production j
Ž . Ž .function is strictly convex, see for example, Diewert 1971 and Hall 1973 .Ž .Next it is assumed that the production function 1 is weakly separable with
Ä 4respect to partition N , . . . . . . N . This means that the marginal rate of substitu-1 s
Ž . Ä 4tion MRS between any two inputs i and j from any subset N 1, . . . . . . m is s
independent of the quantities of inputs outside N , see Berndt and Christensen s
Ž .1973a . In other words,
f i
Ž .0 for all i , j N and kf N . 2 s s
ž / X f k j
f Ž . where f is the first derivative of F X ,T .i j
X jŽ . Ä 4The assumption of weak separability 2 with respect to partition N , . . . . . . N 1 s
ensures that the aggregates exist and permits us to write the production functionŽ .1 in the following form:
Ä 1 Ž i . 2 Ž j . s Ž s .4Y F X X , X X , . . . . . . X X i 1, . . . . . . r , j 1, . . . . . . l ,
Ž .S 1, . . . . . . m. 31 Ž i. 2 Ž j . sŽ s . where X X , X X , . . . . . . X X are aggregated functions with elements
labelled by indices i, j and S and X 1, X 2, X s are aggregate inputs.

8/7/2019 demnan manuf
http://slidepdf.com/reader/full/demnan-manuf 4/18
( ) D.K. Christopoulos Energy Economics 22 2000 569 586572
Ž .Furthermore, we assume that aggregated functions in 3 are homothetic in theircomponents. This assumption provides a necessary and sufficient condition for an
Ž .underlying two stage optimisation procedure see Denny and Fuss, 1977 : optimise
the mix of components within each aggregate and then optimise the level of eachaggregate. The existence of homothetic aggregation functions does not imply that
Ž .the overall production process is homothetic Apostolakis, 1988 .Ž .Given the production function 1 and the associated assumptions, the cost
Ž .function can be derived. According to duality principles, Samuelson 1947 , UzawaŽ . Ž .1964 and Shephard 1970 , there is a cost function equivalent to the productionfunction that can represent the technology of production and vice versa.
To start with, it is assumed that the cost function that corresponds to theproduction function can be written as
Ž . Ž .C P ,Y ,T min P) X TC 4 j
where C stands for total cost, P is the vector of input prices, and TC is the total j
Ž . Ž .cost. The cost function 2 is considered, similarly to 1 , to be twice differentiablein P and T , finite for every P , Y 0 and T , continuous in Y and P , linear j j j
homogeneous in P and Y 0, non-decreasing in Y and P and concave in P . j j, j
Ž . Also the dual cost function 4 will be weakly separable if the aggregation inŽ . Ž .production function 1 exists and the aggregate functions in 3 are homothetic in
Ž .their components see Berndt and Christensen, 1973b .
Ž .Finally it is assumed that the specifiable factors of production are capital K ,Ž . Ž . Ž . Ž . Ž .labour L , electricity EL , diesel D and crude oil M . So the cost function 4can be written as follows:
Ž . Ž .C g P P , P , P , P , P , Y , T 5E M EL D K L
where P is the price of capital, P is the price of labour, P is the price of crudeK L M
oil, P is the price of electricity, P is the price of diesel and P is an aggregateEL D E
price index of energy, i.e. a function that aggregates the energy prices of threecomponents types. As assumed previously, this aggregator function is homothetic in
the mix of energy types.1
Ž .Eq. 5 can be estimated in two stages: First a sub energy homothetic model withconstant returns to scale will be considered to construct an instrumental variablefor the price of energy. Second an aggregate non-homothetic cost function associ-ated with Hicks non-neutral technological progress. So, the firms first minimise theenergy cost and then the total cost of production.
Ž . Ž .Under the hypothesis of minimisation of total cost TC the cost function 5 mayŽtake various forms. The translog form is one, it can be expressed as Christensen et
.al., 1973
1 Analogous aggregate functions can be formulated for the other aggregate inputs: capital and labour.However, the lack of disaggregated data for capital and labour for Greek manufacturing make thisprocedure inapplicable.

8/7/2019 demnan manuf
http://slidepdf.com/reader/full/demnan-manuf 5/18
( ) D.K. Christopoulos Energy Economics 22 2000 569 586 573
21 1 Ž .lnTC a a ln P y ln P ln P a lnY a lnY Ý Ý Ý o i i i j i j Y Y Y 2 2
i i j
21
Ž . Ž .a T a T lnY ln P ln P T lnYT 6Ý ÝT T T Y i i T i i T Y 2
i i
where i, j K,L,E.Under conditions of perfect competition the logarithmic differentiation of Eq.
Ž .6 with respect to input prices P , P , P yields expressions for the demandedK L E
Ž .quantity of the corresponding inputs in terms of cost shares Shephard’s Lemma ,i.e.
TC Ž . Ž . M lnTC ln P P X TC a y ln P lnY T 7Ýi i i i i i j j i Y T i
j
where X is the quantity demanded of the production input i and M is the costi i
share of the input i demanded.
Ž . TCFor the cost function 6 to satisfy the adding-up criterion M 1, i K,L,EÝ i
iand the properties of the neo-classical production theory, the following linearrestrictions must be satisfied,
Ž . a 1, y y , y 0 8Ý Ý Ý Ýi i j ji i j i Y T i i
i i i i
for i, j K,L,E.Ž .The restrictions 8 are necessary and sufficient conditions ensuring TC is
linearly homogeneous in input prices.Ž .However, the price of energy P is considered also to be an aggregateE
2 Ž .function see function 5 . This aggregate function can be represented by ahomothetic translog cost function with constant returns to scale
1 Ž .ln P a ln P y ln P ln P 9Ý Ý ÝE o i i i j i j2
i i j
The following energy cost share equations are implied by Shephard’s Lemma:
E Ž . M y ln P 10Ýi i i j j
j
where i, j EL,D,M. Again the adding-up criterion and the properties of neo-classical production
theory require the parameter restrictions
2 P it is not a consistent aggregate price index if it is a simple weighted average of the P ,E i
i EL,D,M unless the energy components are perfectly substitutable or complements in the productionŽ .process see Berndt and Christensen, 1974 .

8/7/2019 demnan manuf
http://slidepdf.com/reader/full/demnan-manuf 6/18
( ) D.K. Christopoulos Energy Economics 22 2000 569 586574
Ž . 1, y y , y 0 11Ý Ýi i j ji i j
i i
to be satisfied by the aggregate function.Let us now review the steps involved in estimating the proposed model: first theŽ . Ž .sub-energy model 10 is estimated subject to the constraints 11 . The estimated
Ž . Ž .parameters in 10 are substituted into 9 to obtain an aggregate price index forŽ . Ž .energy. Next the factor share Eq. 7 is estimated subject to the restrictions 8
using the estimated energy price index as an instrumental variable.
3. Modelling the dynamic structure of production using the translog cost function
Ž . Ž .The factor demand system 7 derived from the translog total cost function 6 isstatic and holds only in equilibrium. This happens because the existence of convexadjustment costs and the imperfections involved in obtaining information implythat there is some delay in adjusting instantaneously actual capital, labour andenergy to their desired level following exogenous price and demand shifts. Analyti-
Ž .cally, the cost share Eq. 7 describes long-run structure. According to AndersonŽ . TCand Blundell 1982 changes in the share in total cost M of input i are responsesi
to anticipated and unanticipated changes in capital, energy and labour prices in anŽ .attempt to maintain a long-run relationship of the form 6 in the sense that,
should capital, energy and labour prices stabilise to some constant value over time,
Ž TC .then so would the expected share of capital, energy and labour in total cost M .i
Furthermore, in the short-run there is uncertainty about the future course of capital, energy and labour prices and output. Therefore, following an exogenousshock the firms do not adjust instantaneously the three inputs, capital, energy and
Ž .labour to the desired level Nissim, 1984 . Thus, ignoring the dynamic element would lead to inadequate knowledge of the adjustment process and of the long-runstructure.
Ž .3To model the dynamic form of total cost share Eq. 7 the transformationŽ . Ž .proposed by Wickens and Breusch 1988 and Kesavan et al. 1993 is used. This
transformation identifies the long-run structure together with the short-run dy-
namics in demand for capital, labour and energy which it merges the long-runsteady-state theory with short-run time series properties of data and produceselasticities that are robust for policy implication. In addition one more generaldynamic framework is obtained which achieves the desirable aspects of flexibility,simplicity and identification of long-run parameters which can be considered as
Žlong side alternative transformations see Anderson and Blundell, 1982; Nissim,.1984; Banerjee et al., 1990 .
A way to incorporate the dynamic structure of production in the total cost shareŽ .Eq. 7 is to write the system in the following form:
3 The short-run total cost function remains unspecified in our model because the total cost share Eq.Ž .6 contains all the information necessary to derive estimates for the long-run demand for energy andinput energy and non energy substitution.

8/7/2019 demnan manuf
http://slidepdf.com/reader/full/demnan-manuf 7/18
( ) D.K. Christopoulos Energy Economics 22 2000 569 586 575
L L L LTC M M a ln P lnY T Ý Ý Ý Ýi i k i ,t k i i j j ,t k i j t k T i t k
i , k 1 j , k 0 j , k 0 j , k 0
Ž .12
where in our application only the lag structure, k 1 will be used. L
Ž .The equations in the system 12 can be transformed by subtracting M Ý k t
k 1Ž . Ž .from both sides of 12 Wickens and Breusch, 1988; Kesavan et al., 1993 . By
algebrical manipulation we obtain
L LTC TC M M a ln P lnY T ln PÝ Ý Ýi i k k i i i j j iY T i i j k j
i , k 1 j j , k 1
Ž . lnY T 13i Y k iT k
where refers to annual differences and i K,L,E.Ž .In a similar way we transform the share Eq. 10 derived from the aggregator
energy function, obtaining
L LE E Ž . M M ln P ln P 14Ý Ý Ýi i ,K K i i i j j i j K j
i , k 1 j j, k 1
i EL,D,M.
4. Statistical estimation
4.1. The estimation of the sub-energy model
Ž .Empirical implementation requires that the energy share Eq. 14 should bestatistically specified. Consequently, an error term is added to each equationbecause of lags of cost in response to the changes in exogenous variables. Since the
Ž . Žshares of the three energy inputs EL,D,M always sum to unity adding-upE .criterion M 1, i EL,D,M the sum of the disturbances across the threeÝ i
ishare energy equations is zero at each observation. This implies a singulardisturbance covariance matrix. Therefore, in order to avoid singularity, one share
Ž .equation must be dropped the equation of crude oil is deleted . FollowingŽ . Anderson and Blundell 1982 for the invariance of results due to arbitrary
deletion of one equation the restriction that the adjustment coefficients must beequal across equations together with the one for long-run symmetry is considered
Ž .for the general dynamic form 14 .Ž .Non-linear iterative Zellner estimation see Zellner, 1962, 1963 is used to
Ž .estimate the parameters of the dynamic model 14 . This procedure, which isŽ .equivalent to maximum likelihood estimation Kmenta and Gilbert, 1968 , assures

8/7/2019 demnan manuf
http://slidepdf.com/reader/full/demnan-manuf 8/18
( ) D.K. Christopoulos Energy Economics 22 2000 569 586576
Table 1Tests of dynamic structure for the energy-sub model
2 2 2 2
Number of 0.95 0.90 0.75rest tion
Partial adjustment 13.890 4 9.488 7.779 5.385Static 12.428 5 11.070 9.236 6.625
that the estimates will be invariant to which the equation is deleted only under theŽacceptance of null hypothesis of error correlations across equations see Berndt
.and Savin, 1975; Christopoulos, 1995 .For the reasons presented above, the IZEF method is adopted for estimating the
Ž .two dynamic equations in 14 , using annual data from the Greek manufacturingsector for the period 19701990.4 Also, its partial adjustment and the static
Ž .specifications of the general dynamic form 14 are estimated and comparedŽ . 5against the general specification 14 .
Starting with the statistical comparison between the general dynamic, the partialŽ .adjustment and the static specification of the dynamic share energy system 14 , the
likelihood ratio test of its dynamic structure is computed. The results are presentedin Table 1.
The 2 results in the second column of Table 1 reveal that the general dynamicŽ .specification of the model 14 is superior to its corresponding partial adjustment.
Also, the general dynamic specification nests that of static at the 5% level of significance. Therefore, the dynamic specification is adopted to estimate andanalyse the own and cross price elasticities of demand for energy components.Parameter estimates for this model are presented in Table 2.
Next the own and cross price elasticities are estimated to measure the priceŽ .responsiveness. It can be shown, that for the translog energy cost function 9
Ž .under the dynamic specification of share Eq. 14 , these estimates can be calcu-lated as follow:
i i Eˆ E s M 1 i EL,D,Mi i iEˆ M i
Ž .15i j Eˆ E s M i , j EL,D,Mi j jEˆ M i
where i j
4
For the nature and the structure of the variables see Appendix A.5The partial adjustment specification results from the imposition of the restrictions 0 on thei j
parameters of the dynamic specification. The restrictions required to obtain the static model are thepartial adjustment restriction with the addition of 1.i K

8/7/2019 demnan manuf
http://slidepdf.com/reader/full/demnan-manuf 9/18
( ) D.K. Christopoulos Energy Economics 22 2000 569 586 577
Table 2Parameter estimates of translog-energy sub model for Greek manufacturing with homogeneity and
asymmetry imposed in the long-run: 19701990
Ž . Ž .Equation I electricity Equation II diesel
Parameters Coefficients Parameters Coefficients
U UY 0.669 Y 0.038EL D
Ž . Ž .0.031 0.004UY 0.232 Y 0.0126EL EL DD
Ž . Ž .0.057 0.0110U U U UY 0.0205 Y 0.0205EL D DEL
Ž . Ž .0.0104 0.0104U U 0.807 0.807EL D
Ž . Ž .0.186 0.186
0.029 0.004EL EL DD
Ž . Ž .0.130 0.018 0.164 0.008EL D DEL
Ž . Ž .0.149 0.016
2 2 R 0.404 R 0.565SSR 0.103 SSR 0.002OBS 19 OBS 19
Ž . Ž .Q 5 10.042 Q 5 1.151Ž . Ž .Q 10 13.348 Q 10 1.947
a The numbers in parentheses are the standard errors. U ,U U U Indicate statistical significance at 1%
and 10%, respectively. Q denotes the BoxPierce Q statistic for serial correlation in the residuals. Thefigures in parentheses are the degrees of freedom for 2 statistics. The 5% critical values are 11.070and 18.307, respectively, for 5 and 10 d.f.s.
Ž . Ž . 6The estimates of own E and cross price E elasticities evaluated at thei i i j
mean values in the period 19701990 are presented in Table 3.It can be seen from Table 3 that all long-run own price elasticites are negative
except for crude oil. However, the only result that appears to be statisticallydifferent from zero is that for diesel. For this energy component the estimated
Table 3aEstimates of own and cross long-run price elasticities
Ž . Ž . Ž .Electricity EL Diesel D Crude oil M
UŽ . Ž . Ž . Ž .Electricity EL 0.02 0.10 1.12 0.27 0.07 0.15U UŽ . Ž . Ž . Ž .Diesel D 0.08 0.02 1.29 0.29 0.02 0.03
Ž . Ž . Ž . Ž .Crude oil M 0.05 0.11 0.19 0.32 0.05 0.15
a The effect of a change in the price of electricity on each of the components is contained in the firstrow, etc. The figures in parentheses are the standard errors. U , denotes significance at 1%.
6 The long-run own and cross price elasticities for energy components are derived under theassumption that the total energy cost is held constant.

8/7/2019 demnan manuf
http://slidepdf.com/reader/full/demnan-manuf 10/18
( ) D.K. Christopoulos Energy Economics 22 2000 569 586578
long-run own price elasticity is higher, in absolute value, than unity. This meansthat the demand for diesel is very responsive to a change in its own price. So, anincrease in the price of diesel by 10% will decrease the amount of diesel demanded
by 12.9%.Turning to long-run cross price elasticities, the results suggest that they are
positive but statistically zero, apart from cross price elasticities of diesel andelectricity which also exhibit a positive sign but, are statistically different from zeroat the 1% level. The size of substitution between electricity and diesel is high7 withrespect to the price of electricity and low with respect to the price of diesel. Thismeans that a 5% increase in price of electricity, given the price of other inputs, willlead to a 5.6% increase in the relative share of diesel whereas a 5% increase inprice of diesel, given the price of other inputs, will lead to a 0.4% increase in therelative share of electricity.
Overall the results suggest that the demand for diesel, holding constant the totalenergy cost, is highly sensitive to price movement, while for electricity and crude oilthe high standard errors make it impossible to draw any conclusion about theirprice responsiveness. Finally, there is no evidence for inter-energy substitutionexcept for high level of substitutability of diesel for electricity.
Next the aggregate total cost is considered in order to determine the demand fortotal energy.
4.2. Estimation of the total cost function
Before proceeding to the estimation of the general dynamic system of share Eq.Ž .13 the aggregate price index for energy has to be generated. For this reason the
Ž .estimated long-run parameters from 14 are used as starting values for the energyŽ . Ž .cost function 9 and then the energy cost function 9 is estimated using maximum
ˆŽ .likelihood techniques. Thus, an aggregate price index P is obtained which servesE
Ž .as an instrumental variable for the price of energy P in the estimation of theE
Ž .dynamic system 13 of the shares of total cost.Ž .The test for dynamic structure of 13 is shown in Table 4.
The results in Table 4 suggest that the general dynamic specification nests such
of partial adjustment as the static at the 25% level of significance while the staticspecification is also nested by the general dynamic at the 10% level of significance.
Table 4Tests of dynamic structure for the total cost share equations
2 2 2 2 Number of 0.95 0.90 0.75
rest tions
Partial adjustment 9.187 6 12.592 10.644 7.841Static 12.173 7 14.067 12.017 9.037
7 Ž .This result is in accordance with the findings of a previous paper see Palaskas et al., 1999a .

8/7/2019 demnan manuf
http://slidepdf.com/reader/full/demnan-manuf 11/18
( ) D.K. Christopoulos Energy Economics 22 2000 569 586 579
Table 5Parameter estimates of translog total cost function for the Greek manufacturing with homogeneity and
asymmetry imposed in the long-run: 19701990
Ž . Ž .Equation I capital Equation II labour
Parameters Coefficients Parameters Coefficients
U U 0.652 0.289K L
Ž . Ž .0.013 0.010U UY 0.169 Y 0.162KK LL
Ž . Ž .0.014 0.021U UY 0.128 Y 0.128KL LK
Ž . Ž .0.014 0.014U U U U 0.107 0.051YK LY
Ž . Ž .0.036 0.027U U 0.009 0.006TK LT
Ž . Ž .0.001 0.001U U 0.559 0.559K L
Ž . Ž .0.141 0.141U U 0.116 0.099KK LL
Ž . Ž .0.038 0.029U U U 0.080 0.105KL LK
Ž . Ž .0.031 0.031 0.012 0.028KY LY
Ž . Ž .0.077 0.059
2 2 R 0.962 R 0.944SSR 0.002 SSR 0.0009OBS 19 OBS 19
Ž . Ž .Q 5 3.345 Q 5 5.149Ž . Ž .Q 10 5.778 Q 10 7.766
a The numbers in parentheses are the standard errors. U , U U , U U U Indicate statistical significance at1%, 5% and 10%, respectively. Q denotes the BoxPierce Q statistic for serial correlation in theresiduals. The figures in the parentheses are the degrees of freedom for 2 statistics. The critical valuesat the 5% level are 11.070 and 18.307, respectively, for 5 and 10 d.f.s.
Parameter estimates using the IZEF method for the general dynamic specificationare presented in Table 5.
Ž . Ž .Using the parameter estimates from 13 and the formulas 15 the long-run ownand cross price elasticities for the total cost function were computed. The resultsare tabulated in Table 6.
As seen from Table 6 all own point elasticities for the aggregate factors arenegative, as one would expect theoretically. However, only the capital and labourelasticities are significant at conventional levels of statistical significance. Thecommon feature of these elasticities is that they are inelastic with the price of labour more elastic than the price elasticity of capital, as would be expected, given
the gestation period required for capital investment. The estimated own demandprice elasticity for aggregate energy is not statistical different from zero. Anobvious interpretation of this result is that the demand for aggregate energy

8/7/2019 demnan manuf
http://slidepdf.com/reader/full/demnan-manuf 12/18
( ) D.K. Christopoulos Energy Economics 22 2000 569 586580
Table 6aOwn and cross long-run price elasticity estimates
Ž . Ž . Ž .Capital K Labour L Energy E
U U U UŽ . Ž . Ž . Ž .Capital K 0.15 0.03 0.17 0.04 0.14 0.07U UŽ . Ž . Ž . Ž .Labour L 0.13 0.03 0.19 0.06 0.02 0.10
Ž . Ž . Ž . Ž .Energy E 0.03 0.02 0.005 0.03 0.19 0.17
a The effect of a change in the price of capital on each of the other inputs is contained in the firstrow, etc. The figures in parentheses are the standard errors. U , U U denote significance at 1% and 5%,respectively.
remains invariant to change in its price. This might be attributed to the fact that
the share of energy did not gain a dominant share in the total cost of production.Regarding the cross price elasticities, our results strongly suggest that the
possibilities of substitution between capital, labour and energy in Greek manufac-turing are extremely limited. This finding is also confirmed by the computed Allen-Uzawa partial elasticities of substitution. These are 0.33, 0.25KL KE
and 0.05. It can therefore be concluded that the Greek entrepreneur isLE
faced with difficulties in obtaining the best combination of inputs, which minimisetotal cost. For example an increase in the price of aggregate energy will not
Ždecrease considerably the amount of energy the own price elasticity of energy is
.statistically zero and as a result will not increase considerably the demand forŽ . Ž .labour E 0.005 and the demand for capital E 0.03 .LE KE
Finally to complete our analysis the total own and cross price elasticity areŽ .calculated for each energy component see Fuss, 1977 .
Y E E Y Ž . E E M E i , j K,L,E. 16i j i j j EE
where EY the cross price elasticity of demand for energy component i with respecti jE Ž . Žto P Y held constant; E is the elasticity with energy cost E constant fromE j i j
.E Y
Table 3 ; M is the defined share in the energy-sub model, and E is the own j EEprice elasticity of aggregate energy.
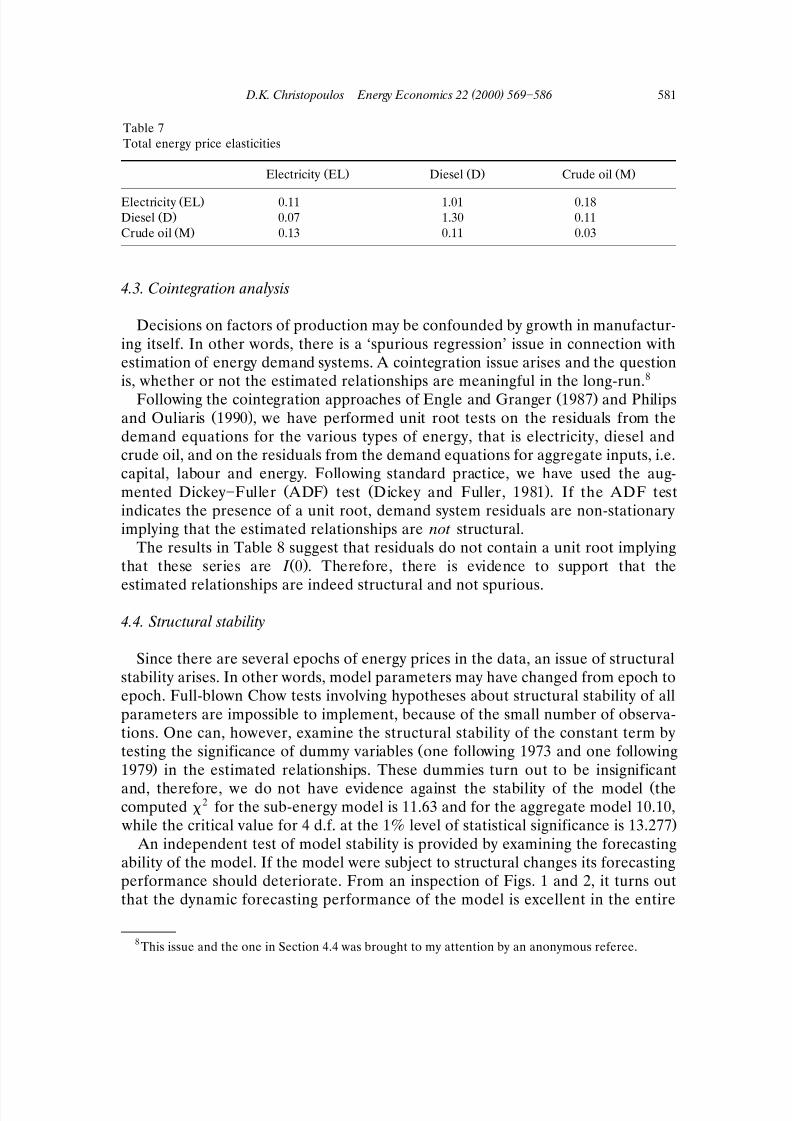
The results are presented in Table 7. It is noteworthy that these total own andcross price elasticities take into account that a change in the price of an energy
ˆŽ .component also causes a change in the aggregate price energy index P . ThisE
results in substitution between energy and other aggregate factors which affects theŽ .demand for the energy component Fuss, 1977 .
The results in Table 7 suggest that changes in the price of energy componentsand to some extent in the price of aggregate energy do not affect substantially thedemand for energy component, apart from diesel. It can therefore be concluded
that in Greek manufacturing the level of substitution among energy components islow and is associated with a low substitution of aggregate energy for othernon-energy aggregate inputs.
8/7/2019 demnan manuf
http://slidepdf.com/reader/full/demnan-manuf 13/18
( ) D.K. Christopoulos Energy Economics 22 2000 569 586 581
Table 7Total energy price elasticities
Ž . Ž . Ž .Electricity EL Diesel D Crude oil M
Ž .Electricity EL 0.11 1.01 0.18Ž .Diesel D 0.07 1.30 0.11
Ž .Crude oil M 0.13 0.11 0.03
4.3. Cointegration analysis
Decisions on factors of production may be confounded by growth in manufactur-ing itself. In other words, there is a ‘spurious regression’ issue in connection with
estimation of energy demand systems. A cointegration issue arises and the questionis, whether or not the estimated relationships are meaningful in the long-run.8
Ž .Following the cointegration approaches of Engle and Granger 1987 and PhilipsŽ .and Ouliaris 1990 , we have performed unit root tests on the residuals from the
demand equations for the various types of energy, that is electricity, diesel andcrude oil, and on the residuals from the demand equations for aggregate inputs, i.e.capital, labour and energy. Following standard practice, we have used the aug-
Ž . Ž .mented DickeyFuller ADF test Dickey and Fuller, 1981 . If the ADF testindicates the presence of a unit root, demand system residuals are non-stationaryimplying that the estimated relationships are not structural.
The results in Table 8 suggest that residuals do not contain a unit root implyingŽ .that these series are I 0 . Therefore, there is evidence to support that the
estimated relationships are indeed structural and not spurious.
4.4. Structural stability
Since there are several epochs of energy prices in the data, an issue of structuralstability arises. In other words, model parameters may have changed from epoch toepoch. Full-blown Chow tests involving hypotheses about structural stability of allparameters are impossible to implement, because of the small number of observa-tions. One can, however, examine the structural stability of the constant term by
Žtesting the significance of dummy variables one following 1973 and one following.1979 in the estimated relationships. These dummies turn out to be insignificant
Žand, therefore, we do not have evidence against the stability of the model thecomputed 2 for the sub-energy model is 11.63 and for the aggregate model 10.10,
. while the critical value for 4 d.f. at the 1% level of statistical significance is 13.277 An independent test of model stability is provided by examining the forecasting
ability of the model. If the model were subject to structural changes its forecastingperformance should deteriorate. From an inspection of Figs. 1 and 2, it turns out
that the dynamic forecasting performance of the model is excellent in the entire
8 This issue and the one in Section 4.4 was brought to my attention by an anonymous referee.

8/7/2019 demnan manuf
http://slidepdf.com/reader/full/demnan-manuf 14/18
( ) D.K. Christopoulos Energy Economics 22 2000 569 586582
Table 8aUnit root test
Equation residual AugmentedDickeyFuller test
Sub-energy model
Electricity 3.197Diesel 3.334Crude oil 2.811
Aggregate model
Capital 5.033Labour 3.752Energy 3.275
a Ž .The critical value of the ADF statistic with no constant and no time trend is 1.96 at the 5%level. Number of lags was selected optimally using the Schwarz criterion. The ADF regression isperformed without constant term because it is known that residuals have mean zero.
sample. This provides additional evidence in favour of the model’s structuralstability
5. Concluding observations
The present paper investigates the demand for different types of energy, namely,electricity, diesel and crude oil, and the elasticities of substitution among energy
Fig. 1. Dynamic forecasting performance: equation of capital.

8/7/2019 demnan manuf
http://slidepdf.com/reader/full/demnan-manuf 15/18
( ) D.K. Christopoulos Energy Economics 22 2000 569 586 583
Fig. 2. Dynamic forecasting performance: equation of labour.
components and the substitution among aggregate energy and aggregate non-en-Ž .ergy inputs capital and labour , in Greek manufacturing, for the period 19701990.
A dynamic two-stage optimisation procedure for the derived demand for each type
of energy and for aggregate energy, capital and labour is adopted. In particular, itis assumed that an aggregate energy cost function exists that is weakly separable inits components. Thus, we aggregated a sub-energy model in order to construct anaggregate energy price index. In the second stage the computed instrumental
ˆŽ . variable P from this stage is substituted in the aggregate cost function in theE
place of P . In both stages the translog cost function is used under a generalE
dynamic specification. The dynamic specification is derived using a transformationsuggested in the error correction literature. The partial adjustment and the staticformulations are tested against the general dynamic framework. Therefore, thedynamic specification is tested rather than arbitrarily imposed. The main character-istic of the dynamic model is that it merges the long-run steady-state theory withshort-run time series properties of data and produces elasticities that are robust forpolicy implications.
The empirical evidence can be summarised as follows:
Inter-energy substitution is limited in the case of Greek manufacturing. Anexception is the high degree of substitution of diesel for electricity. Also, our
Žresults provide support for inelastic demand for crude oil and electricity their. Žcomputed values are close to zero and elastic demand for diesel EDD
.1.36 .Under the hypothesis that firms minimise total cost, our findings suggest that
aggregate energy is not substitutable for aggregate capital and aggregate labour.
8/7/2019 demnan manuf
http://slidepdf.com/reader/full/demnan-manuf 16/18
( ) D.K. Christopoulos Energy Economics 22 2000 569 586584
Also, there is little evidence that capital and labour substitute each other in theŽproduction process of Greek manufacturing the Alien-Uzava partial elasticity of
.substitution is 0.33 . This conclusion is also partly confirmed by a previousKL
Ž .paper Christopoulos, 1995 where a total cost function approach was used toestimate technological progress in Greek two-digit industry. For regardless of theown price elasticities for aggregate inputs capital and labour those are inelastic with the labour responsiveness to a change in its own price to be higher than thecorresponding capital responsiveness of capital. The own price elasticity for aggre-gate energy is statistically insignificant and no conclusions can be drawn. Finally,our total own and cross price elasticities estimates suggest that an increase in theprice of aggregate energy does not affect substantially the demand for energycomponents apart from the demand for diesel. Therefore, the degree of substitu-
tion among energy components and among aggregate energy is low except forsubstitution of electricity by diesel.
Acknowledgements
The author wishes to acknowledge the helpful comments of Professor PanayiotisReppas, Professor Clive Richardson, Dr Efthymios Tsionas and an anonymousreferee. Any remaining errors are my own.
Appendix A
The data used in this analysis consist of annual time-series data for two-digitindustry of the Greek economy employing more than 10 individuals, for the years19701990.
Ž .Output Y is measured in value added terms. Value added in 1970 constant
prices is obtained by value added deflators. The data on value added are publishedŽ .in the Annual Industrial Surveys AIS of the National Statistical Service of GreeceŽ .NSSG
Ž .VA W SŽ .The price series of capital P was calculated as P whereK K NFC
VA is the value added, W and S the wages and salaries, respectively, and NFC isthe net fixed capital. The data on wages and salaries are published in the Annual
Ž . Ž .Industrial Surveys AIS of the National Statistical Service of Greece NSSG whilethe deflator was taken from the National Accounts of NSSG. The data on capital
Ž .stock for the period 19701980 were provided by Kintis 1986 . For the period
19811990 his approach was followed for the calculation of these data. All figuresare expressed in 1970 constant prices. Value added deflators were used to deflate
Ž .total labour compensation salaries and wages variables.

8/7/2019 demnan manuf
http://slidepdf.com/reader/full/demnan-manuf 17/18
( ) D.K. Christopoulos Energy Economics 22 2000 569 586 585
Ž . Ž .Following the procedure outlined by Lianos 1975 and Panas 1986 the priceW L
Ž .series of labour P was estimated by P where W L is the wage billL L Hand H is the total number of hours worked by paid workers and employees. The wage bill is expressed by means of value added deflators in 1970 constant prices.The necessary data on hours and on the number of employees were taken from the AIS of NSSG and from the ‘Year Book of Labour Statistics’ of the InternationalLabour Office, respectively.
DieselCrude OilElectricity: The prices series for the three types of energy were calculated by dividing expenditures by consumption in physical units for eachtype of energy input. The physical unit for each type of energy is expressed in
Ž . Ž .equivalent tons of oil TOE see Samouilidis, 1982 . All the data are expressed in1970 constant prices and are taken from the AIS of NSSG. The deflation was madeby value added deflators.
The annual series for the total cost was constructed as follows:C Value Added Total Value of Three Types of Energy.The NSSG did not undertake an industrial survey in 1978 1979. The mean of
the series was used to fill the gap for these 2 years
References
Anderson, G., Blundell, R., 1982. Estimation and hypothesis testing in dynamic singular equations.Econometrica 50, 15591571.
Apostolakis, B., 1988. Translogarithmic production and cost function: a synopsis. Econ. Stud. Q. 39,4163.
Banerjee, A., Galbraith, J., Dolado, J., 1990. Dynamic specification and linear transformations of theautoregressive distribution lag model. Oxf. Bull. Econ. Stat. 52, 95 104.
Berndt, E., Christensen, L., 1973a. The internal structure of functional relationship: separability,substitution, and aggregation. Rev. Econ. Stud., 403410.
Berndt, E., Christensen, L., 1973b. The translog function and the substitution of equipment, structuresand labour in the US manufacturing 1929 1968. J. Econom. 1, 81114.
Berndt, E., Christensen, L., 1974. Testing for the existence of a consistent aggregate index of labourinput. Am. Econ. Rev. 64, 391404.
Berndt, E., Savin, E., 1975. Estimation hypothesis testing in singular equation systems with autoregres-sive disturbance. Econometrica 43, 937959.
Caloghirou, Y.D., Mourelatos, G.A., Thompson, H., 1997. Industrial energy substitution during the1980s in the Greek economy. Energy Econ. 19, 476 491.
Christensen, L., Jorgenson, D., Lau, L., 1973. Transcendental logarithmic production frontiers. Rev.Econ. Stat. 55, 2845.
Christopoulos, D. 1995. Technical Progress and Returns to Scale in Greek Industry: an Inter-IndustryŽ . Analysis 19701990 . PhD Thesis, the Department of Economics and Regional Development,
Panteion University, Athens.
Denny, M., Fuss, M., 1977. The use of approximation analysis to test for separability and the existenceof consistent aggregates. Am. Econ. Rev. 67, 404 418.
Dickey, D.A., Fuller, W.A., 1981. Likelihood ratio statistics for auto regressive time series with unit root.Econometrica 49, 10571072.
Diewert, W., 1971. An application of Shephard duality theorem: a generalised Leontief productionfunction. J. Pol. Econ. 79, 481 507.

8/7/2019 demnan manuf
http://slidepdf.com/reader/full/demnan-manuf 18/18
( ) D.K. Christopoulos Energy Economics 22 2000 569 586586
Donatos, G.S., Mergos, P.R., 1989. Energy demand in Greece: the impact of the two energy crises.Energy Econ. 11, 147152.
Engle, R., Granger, C.W., 1987. Co-integration and error correction: representation, estimation and
testing. Econometrica 55, 251276.Fuss, M., 1977. The demand for energy in Canadian manufacturing. J. Econom. 5, 89 116.Hall, R., 1973. The specification of technology with several kinds of output. J. Pol. Econ., 878 891.Kesavan, T., Hassan, Z., Jensen, H., Johnson, S. 1993. Dynamics and long-run structure in US meat
demand. Can. J. Agri. Econ., 139 153.Kintis, A., 1986. The Estimation of Net Fixed Capital. Mimeo.Kintis, A., Panas, E., 1989. The capital energy controversy: further results. Energy Econ., 201 212.Kmenta, J., Gilbert, R., 1968. Small sample properties of alternative estimators of seemingly unrelated
regressions. J. Am. Stat. Ass. 63, 1180 1200.Lianos, T., 1975. Capitallabour substitution in a developing country: the case of Greece. Eur. Econ.
Rev., 129141.Nissim, J., 1984. The price responsiveness of the demand for labour by skill: British mechanical
engineering: 19631978. Econ. J. 94, 812825.Palaskas, T., Reppas, P., Christopoulos, D., 1999. The Role of Capital, Labour and Main Energy Inputs
in the Performance of Greek Manufacturing Sector. Spoudai, forthcoming.Panas, E., 1986. Biased technological progress and the theories of induced innovation: the case of
Greek manufacturing, 19581975. Greek Econ. Rev. 8, 95119.Philips, P.C.B., Ouliaris, S., 1990. Asymptotic properties of residual based tests for cointegration.
Econometrica 58, 165193.Pindyck, R., 1979. Inter fuel substitution and the industrial demand for energy: an international
comparison. Rev. Econ. Stat., 169179.Samouilidis, J.E., 1982. Analysis of Energy needs in Greek Economy, Center for Planning and
Economic Research, Athens.Samouilidis, J.E., Mitropoulos, C.S., 1982. An aggregate model for energy costs: national product
interdependence. Energy Econ. 4, 199206.Samuelson, P.A., 1947. Foundations of Economic Analysis. Athenaeum, NY.Shephard, W., 1970. The Theory of Cost and Production Function. Princeton University Press,
Princeton, NJ.Uzawa, H., 1964. Duality principles in the theory of cost and production. Int. Econ. Rev. 4, 216 220.Vlachou, A.S., Samoulidis, J.E., 1986. Interfuel substitution: results from several sectors of the Greek
economy. Energy Econ. 8, 3545.Wickens, M.R., Breusch, T.S., 1988. Dynamic specifications, the long-run and the estimation of
transformed regression models. Econ. J. 98, 189208.Zellner, A., 1962. An efficient method of estimating seemingly unrelated regressions tests for aggrega-
tion bias. J. Am. Stat. Ass. 57, 585 612.Zellner, A., 1963. Estimators for seemingly unrelated regression equations: some exact finite results. J.
Am. Stat. Ass. 58, 977992.