DEMAND MANAGEMENT PILOT FOR PLUG-IN · PDF fileT t RAV4EVPToyota RAV4 EV Program Ford Ranger...
16
DEMAND MANAGEMENT PILOT FOR FOR PLUG-IN VEHICLE CHARGING IN MARYLAND Maryland Electric Vehicle Infrastructure Council Meeting Presented by: William Gausman, Sr VP, Strategic Initiatives October 1, 2013
Transcript of DEMAND MANAGEMENT PILOT FOR PLUG-IN · PDF fileT t RAV4EVPToyota RAV4 EV Program Ford Ranger...

DEMAND MANAGEMENT PILOT FORFORPLUG-IN VEHICLE CHARGING IN MARYLAND
Maryland Electric Vehicle Infrastructure Council MeetingPresented by: William Gausman, Sr VP, Strategic InitiativesOctober 1, 2013

Pepco History with Electric Vehicles
Member of DOE Site Operator Program• Maintained a fleet of 6 all-electric
conversion vehiclesFounding Member of EV America • Developed first utility standards for electric
vehicles• Later turned over to DOE / INEL
GM PrEView Drive ProgramGM PrEView Drive Program• 60 customer drivers for two weeks at a time
• Installed over 75 Level 2 chargers
T t RAV4 EV PToyota RAV4 EV ProgramFord Ranger EV Program
22

Plug-In Vehicles are coming….Here
Penetration projections are inconsistentCustomers favor Level 2 charging at
He e
home.Significant penetration is still years awayWashington, DC region is an early target g , g y gmarket for several manufacturers
• Ford Transit Connect 2010
OEM Deployment in the Washington, DC Region
EPRI National Projection for Plug‐In Vehicle Penetration
• Ford Transit Connect 2010
• Chevy Volt 2011
• Nissan Leaf 2011
• Ford Focus 2011
• Ford Fiesta 2012
• Tesla “S” 2012
• Ford PHEV 2013
3
• Fisker Atlantic 2013?
• BMW Megacity 2013

Calculating PEV Demand
Total Expected Vehicles in Each Jurisdiction
In order to estimate demand for PEVs, population and number of vehicles per capita of the PHI service territories was used as a proxy for actual car sales.
Hybrid Sales 2007-2009Average 0.25%
State Sales Percent of Total Population Hybrids per Capita Premium/DiscountCA 199958 24.71% 36,962,000 12.30% 0.54% 1.15
Regional Demand Premiums
Jurisdiction Population PHI Customers
Vehicles per Capita Vehicles
Pepco MD 1,774,000 531,000 0.79 419,490
Pepco DC 209,880 256,000 0.35 89,600
CA 199958 24.71% 36,962,000 12.30% 0.54% 1.15 VT 2994 0.37% 621,000 0.21% 0.48% 0.92 OR 17403 2.15% 3,687,000 1.23% 0.47% 0.88 WA 29676 3.67% 6,664,000 2.22% 0.45% 0.77 DC 2597 0.32% 599,617 0.20% 0.43% 0.72 CT 14503 1.79% 3,518,000 1.17% 0.41% 0.64 NH 5444 0.67% 1,325,000 0.44% 0.41% 0.63 VA 30397 3.76% 7,883,000 2.62% 0.39% 0.53 MD 20798 2.57% 5,699,000 1.90% 0.36% 0.45 CO 17598 2.17% 5,025,000 1.67% 0.35% 0.39 AZ 22148 2.74% 6,596,000 2.20% 0.34% 0.34
Delmarva 840,856 498,000 0.95 473,100
ACE 1,629,231 547,000 0.69 377,430
From total vehicle count to plug-in vehicle count. Two data sources were used to derive PEV vehicle counts for each
AZ 22148 2.74% 6,596,000 2.20% 0.34% 0.34 ME 4095 0.51% 1,318,000 0.44% 0.31% 0.24 HI 3926 0.49% 1,295,000 0.43% 0.30% 0.21 RI 3191 0.39% 1,053,000 0.35% 0.30% 0.20 NM 6063 0.75% 2,010,000 0.67% 0.30% 0.20 DE 2472 0.31% 885,122 0.29% 0.28% 0.11 NJ 23332 2.88% 8,708,000 2.90% 0.27% 0.07
8%
10%
12%
Light Vehicle Sales Deloitte
CEC
Deutsche Bank
CEC
UMTRI
Market Share Forecast
jurisdiction:1. Aggregate PEV market share forecasts were used to determine a range of possibilities2. The number of hybrid sales per state over the 2007-2009 time frame was used to determine the premium or discount that
h PHI d t t t h d t th 0%
2%
4%
6%
EV Market Share of all US L UMTRI
McKinsey
KEMA
BCG
Booz
CARB
TIAX
each PHI served state can expect when compared to the national average level of PEV market share
0%
2011 2012 2013 2014 2015 2016 2017 2018 2019 2020
Average
2012 2013 2014 2015 2016 2017 2018 2019 2020 2021
10th 3,460 5,124 7,273 9,123 13,632 15,174 19,640 20,147 23,257 23,982
ryla
nd
PL
&
epco
)
4
Likely 5,636 8,859 11,672 14,738 17,947 20,531 26,652 27,056 31,887 32,847
90th 8,233 13,572 17,187 20,852 22,145 25,555 33,035 33,271 39,873 41,064
Mar (DP
Pe

Plug-In Vehicles and Impact on LoadMD Service Territory Data60,000 Maryland – Number of PEVs (2012-2021) 31,887
20,000
40,000 10thLikely90th
14,738
02012 2013 2014 2015 2016 2017 2018 2019 2020 2021
90th
S f Maryland kW Demand Impact
50 000 00060,000,000 70,000,000 80,000,000
Maryland Yearly kWhr Sales from PEVs: Likely Case
100 000
150,000
200,000
W
Maryland kW Demand Impact Likely Case
-10,000,000 20,000,000 30,000,000 40,000,000 50,000,000
kWhr
0
50,000
100,000
2012 2013 2014 2015 2016 2017 2018 2019 2020 2021
kW
Plug-in electric vehicles (PEVs) / consumption:
2012 2013 2014 2015 2016 2017 2018 2019 2020 2021
Likely Case: Yearly kWhr Sales from PEVs
Likely Case ON-PEAK demand (kW)
Likely Case OFF-PEAK demand (kW)
Chargers/Demand:Th d d f L l 2 h i
Other assumptions:80% of chargers are Le el 2
Assumptions:
5
•An individual PEV will use 7 kWhr per day per charge•Each PEV will charge 320 days per year
•The demand of a Level 2 charger is 7.68 kW•The demand of a Level 1 charger is 1.4 kW
•80% of chargers are Level 2 chargers, 20% are Level 1•90% of charging is done off-peak, 10% on-peak

Unmanaged EV charging can create reliability problems for utilities…..
• EV load is equivalent to ½ of full home load, so adding EVs may overload local transformers
• Older more established neighborhoods with higher
2 EV = 1 house’s load
Local Distribution System Impact
• Older, more established neighborhoods with higher concentrations of EVs will be particularly at risk (e.g., Montgomery County and Prince Georges’s County Suburbs)
Local Peak Load IncreaseResidentialWashington, DC1
• Most drivers will return home and plug in between 4-8 PM, resulting in an increase to the normal afternoon peak
• Uncontrolled charging will create the need for additional Infrastructure and result in longer and higher peak demandPotential for Impact to Distribution System reliability
297 Vehicles
• Potential for Impact to Distribution System reliability
Operational Needs• Metering EVSE as separate load for Innovative Rates• Back-office integration of EVSE for control, billing
Residential San Diego, CA1
725 Vehicles g , g• Remote diagnostics for lower maintenance costs• Ability to manage charging in pockets to prevent stress on the
Distribution System• Need to validate the accuracy of on-board metering in EVSE in
order to eliminate the need for a second AMI meter
6
order to eliminate the need for a second AMI meter
The EV Project Report, Q1 2013, US DOE1

Recent LegislationRecent State Sponsored Activities prompting the development of Pepco’s Pilot program:
1 M l d S Bill 1791. Maryland Senate Bill 179
Goals– Increase reliability & efficiency of the electric distribution system
– Lower electricity use at time of high demand (peak)
IncentivesTOU Pricing
Credits on Distribution Charges
Rebates on the Costs of Charging Systems
Demand Response Programs
Other Programs as approved
2. Maryland PSC Case No. 9261– Created a Working Group with major g p jstakeholders
– Issued the Final Report (Feb 13, 2012)• Focused on reliability and promoting “off peak”
charging
7
• Developed consensus for desirable elements of a pilot (Pilot Framework)
Source: Maryland Energy Administration
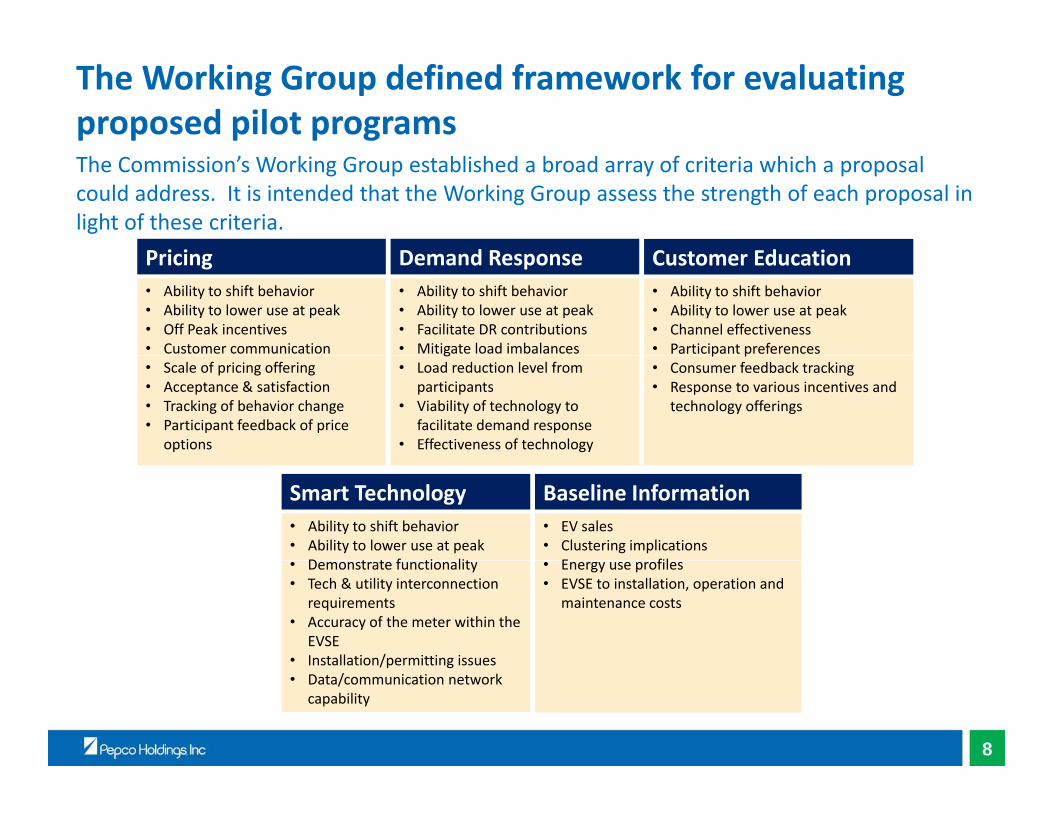
The Working Group defined framework for evaluating proposed pilot programs
P i i D d R C t Ed ti
The Commission’s Working Group established a broad array of criteria which a proposal could address. It is intended that the Working Group assess the strength of each proposal in light of these criteria.
Pricing• Ability to shift behavior• Ability to lower use at peak• Off Peak incentives• Customer communication
Demand Response• Ability to shift behavior• Ability to lower use at peak• Facilitate DR contributions• Mitigate load imbalances
Customer Education• Ability to shift behavior• Ability to lower use at peak• Channel effectiveness• Participant preferences
• Scale of pricing offering• Acceptance & satisfaction• Tracking of behavior change• Participant feedback of price
options
g• Load reduction level from
participants• Viability of technology to
facilitate demand response• Effectiveness of technology
p p• Consumer feedback tracking• Response to various incentives and
technology offerings
Smart Technology• Ability to shift behavior• Ability to lower use at peak
D t t f ti lit
Baseline Information• EV sales• Clustering implications
E fil• Demonstrate functionality• Tech & utility interconnection
requirements• Accuracy of the meter within the
EVSE• Installation/permitting issues
• Energy use profiles• EVSE to installation, operation and
maintenance costs
8
Installation/permitting issues• Data/communication network
capability

Pilot Proposal OverviewPepco is proposing to implement a Voluntary Demand Management Pilot for Plug‐In Vehicle (PIV) Charging in the Pepco’s Maryland service territory.
Pepco has developed a proposal focused on reliability and the framework developed by the working group. The proposal is centered around a mix of infrastructure offerings. A summary of the proposal is as follows:
A Whole House time of use rate (TOU) for SOS residential customers with a PIV.( )A PIV Only TOU rate for those customers that only want a vehicle rate (customers with existing Electric Vehicle Supply Equipment or EVSE will require a second meter).The installation of 50 smart level II charging stations to provide to customers along with a PIV Only TOU rate This will allow for Pepco to test active Demand Response where the time andOnly TOU rate. This will allow for Pepco to test active Demand Response, where the time and output of the EVSE can be remotely managed.(This solution will also require a second meter). Customers selecting a PIV Only TOU rate will have the option of receiving 100% renewable energy (PIV Green) in the form of an “Adder” to the PIV specific rateenergy (PIV-Green) in the form of an Adder to the PIV specific rate.
Scope and Scale:The Program will begin accepting customer applications within two month after approval and operate until the end of the third quarter of 2014.This experimental program will cover up to 250 total customers for at least one year. The whole house rate offering will be applicable for up to 1,000 customers.
Measurement:Pepco will use customer load data comparisons surveys and Pilot learnings to evaluate the
9
Pepco will use customer load data comparisons, surveys and Pilot learnings to evaluate the success of the Pilot based on the requirements set forth in the Legislation.

Pepco Pilot Offers at a glanceWhole House TOU SOS
Charger can be either L1 or
M1
L1 / L2
be either L1 or L2
1
Pricing
PIV Only Rate Existing Tariff PIV Tariff
M1
L2M2
Existing Tariff PIV TariffCharger is existing
L2
2
ider Customer
keeps
Demand Response
Pricing
1
PIV Only + EVSE Existing Tariff
Customer is billed separately for Charger
usage l Gre
en R keeps
existing supplier, residential rate and
M1
L2M2
y Existing TariffPIV Tariff
g
3 Opt
iona
l
program offerings for their home.
Demand Response
Smart Technology
Pricing
10
1 2
Charger is NEW L2

Proposed Experimental RatesPepco has developed the following rates for residential customers with Plug‐in Vehicles:
Whole House Time of UsePIV Only – Time of Use rate for the PIVPIV Green Renewable Energy Adder for PIV OnlyPIV Green – Renewable Energy Adder for PIV Only
1PIV Only Rate will require the installation of a separate AMI meter to measure the charger
11
PIV Only Rate will require the installation of a separate AMI meter to measure the charger consumption

Proposed rates evaluation under different scenariosPepco assessed the financial benefits that could be gained by Volt and Leaf owners by enrolling in either the PIV specific rate or the whole house TOU rate.
Assumptions:Nissan Leaf:
L l II Ch i
Potential Annual SavingsNissan Leaf a/
As Compared to Existing Residential Rate Schedule R (SOS)• Level II Charging• Daily energy use: 23.1 kWh• Days driven per week: 5• Weeks per month: 4
M thl E U 462 kWh
Charging Hours 12AM‐8AM 6 AM‐2 PM 2 PM‐10 PM75% Off‐Peak 75% On‐Peak
100% Off‐Peak 25% On‐Peak 25% Off‐Peak
PIV Only $ 276 10 $ 134 07 $ (149 99) • Monthly Energy Use: 462 kWhThis assumes that the vehicle is charged from zero to a full charge on a daily basis.Ch l t V lt
PIV Only $ 276.10 $ 134.07 $ (149.99)
Whole House TOU $ 93.32 $ (3.01) $ (195.68)
Potential Annual SavingsChevrolet Volt: Level II Charging• Daily energy use: 12.9 kWh• Days driven per week: 5
W k th 4
Chevy Volt b/As Compared to Existing Residential Rate Schedule R (SOS)
Charging Hours 12AM‐8AM 6 AM‐2 PM 2 PM‐10 PM75% Off‐Peak 75% On‐Peak
• Weeks per month: 4• Monthly Energy Use: 258 kWhThis assumes that the vehicle is charged from zero to a full charge on d il b i
100% Off‐Peak 25% On‐Peak 25% Off‐Peak
PIV Only $ 154.19 $ 74.87 $ (83.76)
Whole House TOU $ 52.11 $ (1.68) $ (109.28)
12
a daily basis.a/ Based on annual consumption estimate of 5,544 kWh = 462 kWh*12b/ Based on annual consumption estimate of 3,096 kWh = 258 kWh*12

Proposed Renewable Adder to PIV Only RateAs an option, we are providing our customers a “Green” choice,
% SolarREC Cost
StateCents/kWhComponent Wind SREC
100% Wind 0.0% 3.5 190 0.35
MD RPS Blend (2012) 1.56% 3.5 190 (MD) 0.64
MD RPS Blend (Out‐of‐State SRECS) 1.56% 3.5 45 (DE) 0.41
PIV Only
■ The purpose of this option is to test whether customers will be willing to apply savings to y
Summer WinterOn‐Peak $0.18230 $0.15782
Off‐Peak $0.07268 $0.06045
claim zero tailpipe emissions■ It will reduce annual savings by $20 - $30
PIV Green
Summer Winter
On‐Peak $0.18870 $0.16422
Adds $.0064 / KWh to proposed PIV rate
13
Off‐Peak $0.07908 $0.06685

Customer Outreach & EnrollmentC t d th V hi l Ch i C t• Created the Vehicle Charging Customer Advisory Council
• One‐on‐one relationship• Customers want a dialog, not a monolog. g, g• Listen to the voice of the customer, seek
their feedback and work together to overcome barriers.
• Company Website InformationCompany Website Information• General vehicle and charging levels
information• Program Enrollment tool
l i l l• Developing a PIV Calculator • Estimated cost to charge based on selected
vehicle• Fuel comparison vs. current vehicle• Carbon Foot Print Reductions
• Bill Inserts• Community Events• Social Media
SAMPLE
14
• Social Media

Proposed Metrics
• Number of participants• Demand contribution• Effectiveness of incentives
• Number of participants for each tariff
• Analysis of EV use Profile• Degree of Behavior Change
PricingPricing DemandDemandResponseResponse
• Effectiveness of incentives • Potential for new tariffs• Participant satisfaction
• Degree of Behavior Change• Feedback on
communication• Participant satisfaction
SmartSmartTechnologyTechnology
CustomerCustomerEducationEducation
• Effectiveness• Viability• Accuracy of EVSE metrology
• Number of participants by channel
• Effectiveness of enrollment• Consumer acceptance y gy
• Potential for tariffs• Participant satisfaction
Consumer acceptance• Level of incentive for proactive
Customer communication• Track Turn-downs w/ reason
Pepco proposes to utilize an outside consultant to ensure accuracy and timeliness f d t ll ti d ti
15
of data collection and reporting

PHI Next Steps with EVsD d R Pil t P l dDemand Response Pilot Proposal : approved 8/12/13RFP for EVSE has been developed and has b l dbeen releasedRFPs for Installers has been developed and releasedReconvene the 9261 Working Group to review proposed metricsLaunch Program Late OctoberContinue established EV Leadership• Board Member of Electric Drive Transportation
Association• MD Electric Vehicle Infrastructure Council• MD PSC EV Working GroupContinue to support standards as well as State
16
regulatory and legislative efforts to prepare for PEVs