Demand forecasting - National Grid · PDF fileDemand Forecasting Incentive Scheme Incentives...
16
Demand forecasting Jeremy Caplin Energy Forecasting Manager
Transcript of Demand forecasting - National Grid · PDF fileDemand Forecasting Incentive Scheme Incentives...
Demand forecasting
Jeremy Caplin
Energy Forecasting Manager
Introduction
Review of recent forecasting performance
Initiatives currently underway to improve forecasts
Overview of Demand Forecasting Incentive
Recent Forecasting Performance

Demand Forecast Error – day ahead
0
100
200
300
400
500
600
700
800
900
1000
Jan
-14
Feb
-14
Ma
r-1
4
Ap
r-1
4
Ma
y-1
4
Jun
-14
Jul-
14
Au
g-1
4
Sep
-14
Oct
-14
No
v-1
4
De
c-1
4
Jan
-15
Feb
-15
Ma
r-1
5
Ap
r-1
5
Ma
y-1
5
Jun
-15
Jul-
15
Au
g-1
5
Sep
-15
Oct
-15
No
v-1
5
De
c-1
5
Jan
-16
Feb
-16
Ma
r-1
6
Ap
r-1
6
Ma
y-1
6
Jun
-16
Jul-
16
Au
g-1
6
Sep
-16
Oct
-16
No
v-1
6
Rolling 365 Day Average Mean Absolute Error - Day Ahead Forecast
1B
3B
4B

Impact of growth in PV
300
400
500
600
700
800
900
1000
3000
4000
5000
6000
7000
8000
9000
10000
11000
12000
1
32
63
94
12
5
15
6
18
7
21
8
24
9
28
0
31
1
34
2
37
3
40
4
43
5
46
6
49
7
52
8
55
9
59
0
62
1
65
2
68
3
71
4
74
5
77
6
80
7
83
8
86
9
90
0
93
1
96
2
99
3
10
24
10
55
10
86
Rolling 365 Day Average 3B MAE vs PV Capacity
PV Capacity
3B

Current Innovations
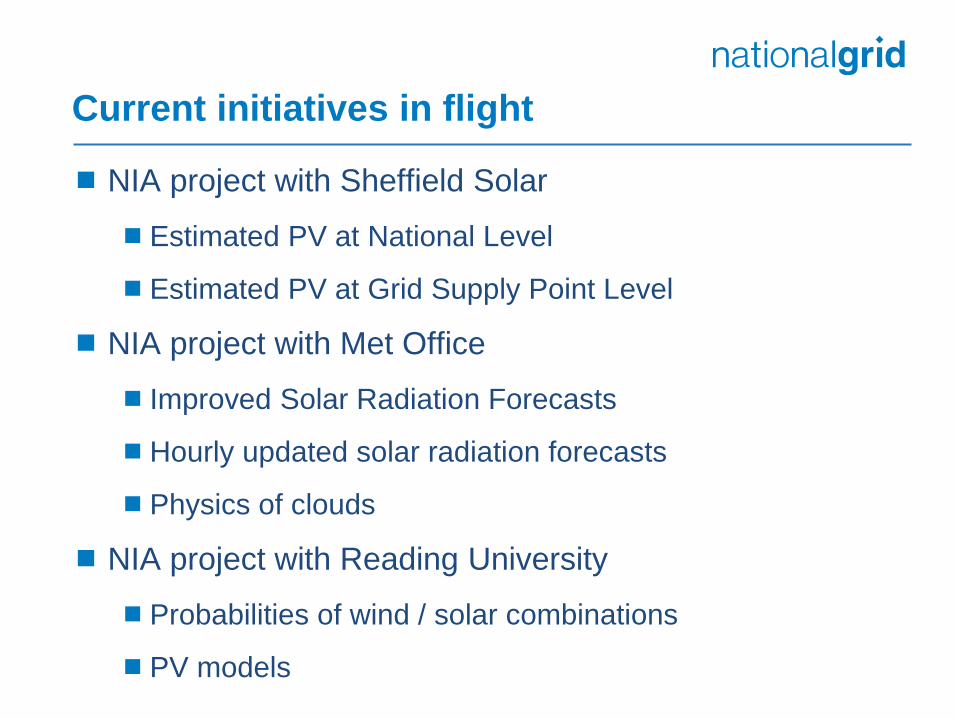
Current initiatives in flight
NIA project with Sheffield Solar
Estimated PV at National Level
Estimated PV at Grid Supply Point Level
NIA project with Met Office
Improved Solar Radiation Forecasts
Hourly updated solar radiation forecasts
Physics of clouds
NIA project with Reading University
Probabilities of wind / solar combinations
PV models
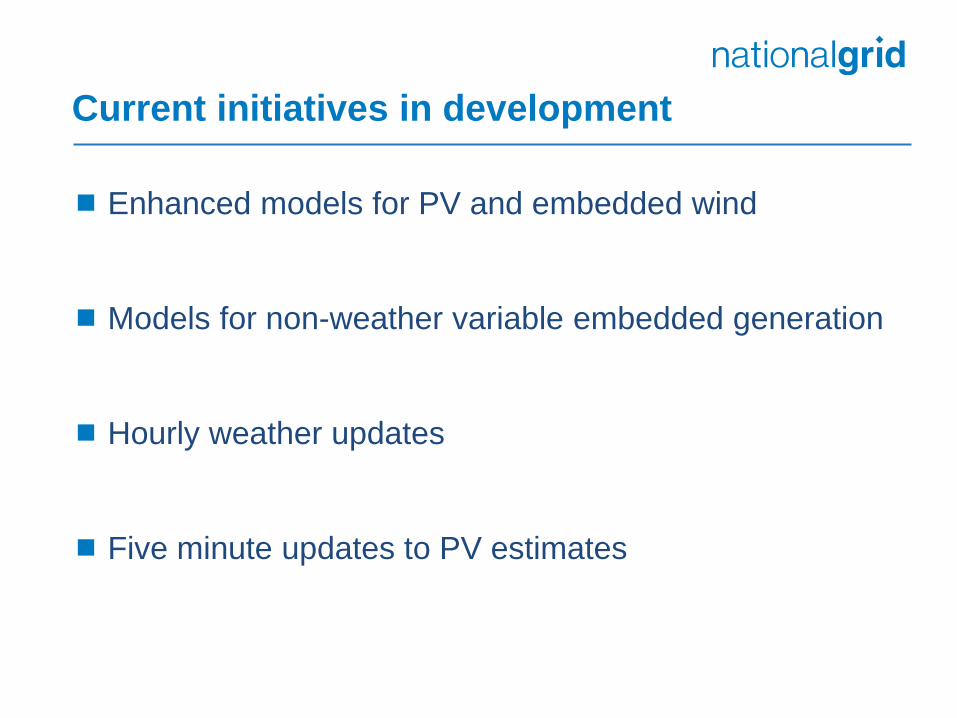
Current initiatives in development
Enhanced models for PV and embedded wind
Models for non-weather variable embedded generation
Hourly weather updates
Five minute updates to PV estimates
Incentive Scheme

Demand forecasting incentive scheme
Four separate schemes, each±£1m
Wind forecast as this year, except by half hour rather
than by hour. Publish by 5 am for Day Ahead
Day Ahead Demand Forecast, publish by 9am
Two Day Ahead Demand Forecast, publish by 5pm
Seven Day Ahead Demand Forecast, publish by 5pm
25% of each scheme on forecast bias
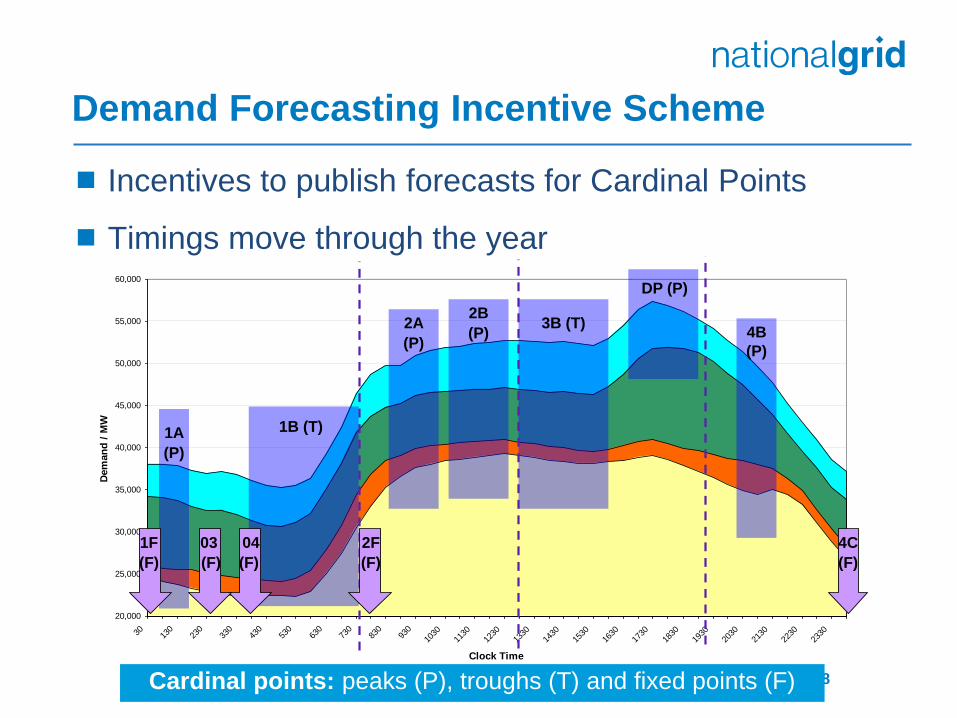
Demand Forecasting Incentive Scheme
Incentives to publish forecasts for Cardinal Points
Timings move through the year
8
20,000
25,000
30,000
35,000
40,000
45,000
50,000
55,000
60,000
30 130
230
330
430
530
630
730
830
930
1030
1130
1230
1330
1430
1530
1630
1730
1830
1930
2030
2130
2230
2330
Clock Time
Dem
an
d /
MW 1B (T)1A
2A2B
3B (T)
DP (P)
4B
04 2F 4C1F
(P)
(P)(P)
(P)
(F) (F) (F) (F)
03
(F)
Cardinal points: peaks (P), troughs (T) and fixed points (F)
20000
25000
30000
35000
40000
45000
1F 1S 1A 1B 2F 2A 2B 3B 3C 4A 4B 4C
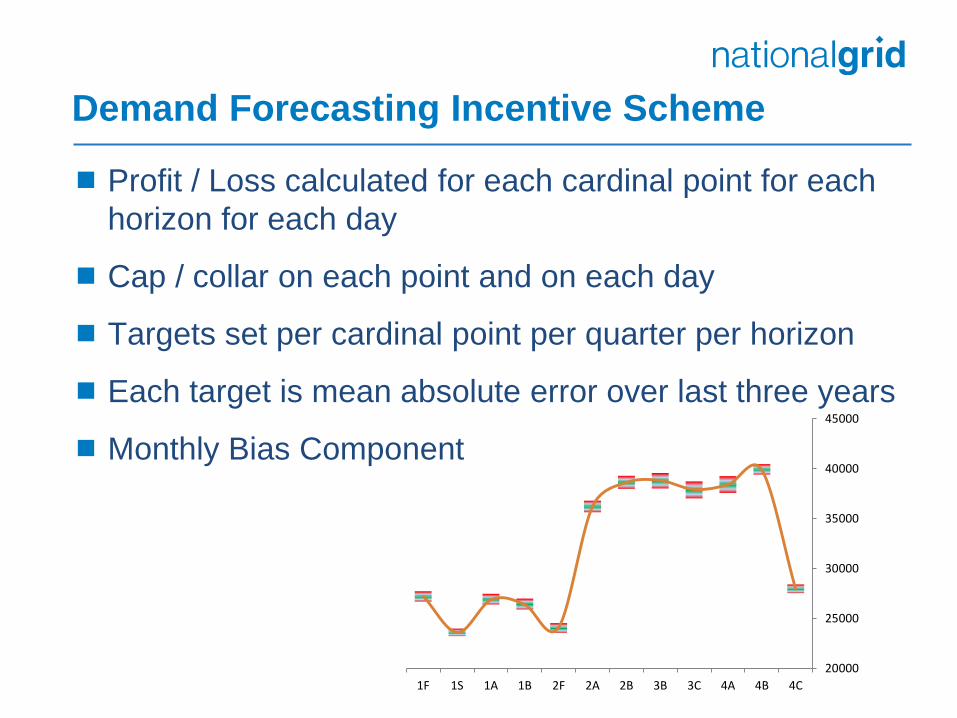
Demand Forecasting Incentive Scheme
Profit / Loss calculated for each cardinal point for each
horizon for each day
Cap / collar on each point and on each day
Targets set per cardinal point per quarter per horizon
Each target is mean absolute error over last three years
Monthly Bias Component
0 3 7
10
13
17
20
23
27
30
33
37
40
43
47
50
53
57
60
63
67
70
73
77
80
83
87
90
93
97
10
0
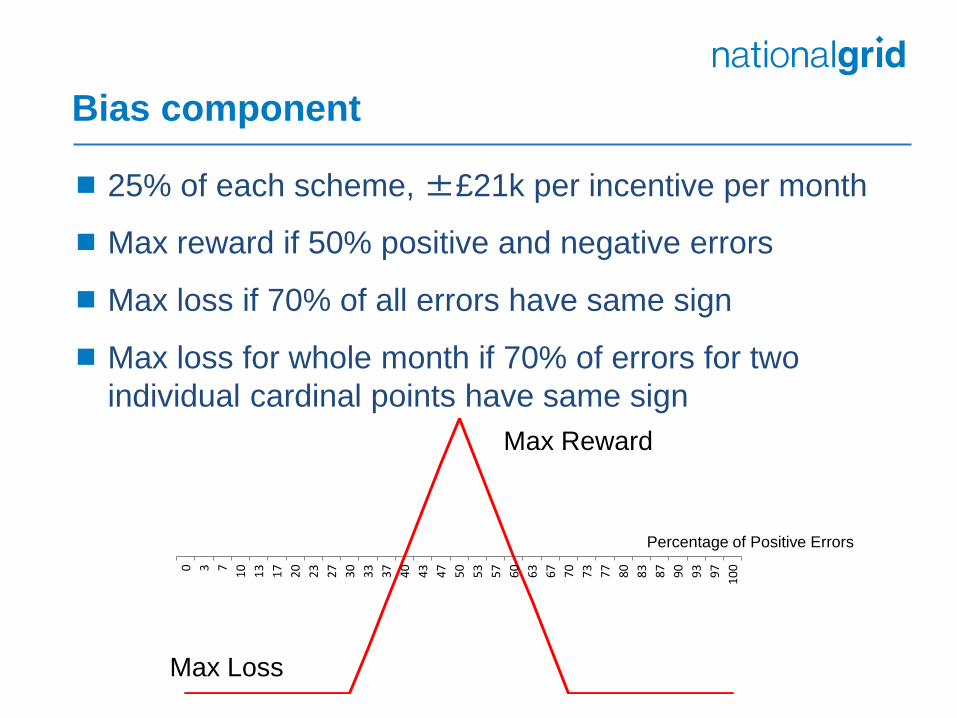
Bias component
25% of each scheme, ±£21k per incentive per month
Max reward if 50% positive and negative errors
Max loss if 70% of all errors have same sign
Max loss for whole month if 70% of errors for two
individual cardinal points have same sign
Max Reward
Max Loss
Percentage of Positive Errors

Impact
Incentives allow us to invest and innovate, which helps
us to forecast more accurately and efficiently, driving
errors down
More accurate and efficient forecasts will
reduce/stabilise BSUoS

Forecast publication
Forecasts will be sent out by email
To subscribe, email [email protected]
Forecasts and background information will be published
on National Grid’s website, under Data Explorer
http://www2.nationalgrid.com/UK/Industry-
information/Electricity-transmission-operational-
data/Data-Explorer/
Scroll down to Demand Forecasting Incentive Area

Place your chosen
image here. The four
corners must just
cover the arrow tips.
For covers, the three
pictures should be the
same size and in a
straight line.
Q&A Please provide
feedback
via www.sli.do
#5800