Demand for STEM Workers: Past Job Trends, Outside Job Demand, and Uncertain Futures November 13,...
20
Demand for STEM Workers: Past Job Trends, Outside Job Demand, and Uncertain Futures November 13, 2007 B. Lindsay Lowell Institute for the Study of International Migration Georgetown University [email protected] Presentation at The “Roundtable Series on Technology, Innovation, and American Primacy and the High-Level Roundtable Series on American Competitiveness,” Council on Foreign Relations, New York City, November 13, 2007.
-
Upload
reginald-webb -
Category
Documents
-
view
214 -
download
0
Transcript of Demand for STEM Workers: Past Job Trends, Outside Job Demand, and Uncertain Futures November 13,...

Demand for STEM Workers:Past Job Trends, Outside Job Demand, and
Uncertain Futures
November 13, 2007
B. Lindsay LowellInstitute for the Study of International Migration
Georgetown [email protected]
Presentation at The “Roundtable Series on Technology, Innovation, and American Primacy and the High-Level Roundtable Series on American Competitiveness,” Council on Foreign Relations, New York City, November 13, 2007.

Gauging Demand:Long-Term Trend
• STEM labor force has grown more rapidly than all workers since 1950
• Information technology has been a major growth engine since the 1990s
• But yearly rate of growth has slowed over time, recent growth has been below long-term, linear trend; and structural shift in unemployment may signal softening demand in STEM jobs proper.

Exhibit 1. Total and STEM Labor Force (in thousands)
0
1,000
2,000
3,000
4,000
5,000
6,000
1950 1960 1970 1980 1990 2000
Source: U.S. Census microdata, see note on data.
0
20,000
40,000
60,000
80,000
100,000
120,000
140,000
160,000
STEM core, nosocial scientistsor technicians
STEM socialscientists &technicians
All workersreporting anoccupation

Science and Engineering Employment, 1950-2000
0
500,000
1,000,000
1,500,000
2,000,000
2,500,000
3,000,000
3,500,000
4,000,000
4,500,000
5,000,000
1950 1960 1970 1980 1990 2000
Source: Lowell and Regets, 2006 (Census microdata)
S&E Total (life, physcial, eng, mit,soc sci)
Life sciences
Physical sciences
Engineers
Mathematicians and informationtechnology
Social sciences
Technicians, science andengineering

Average annual growth rates by decade
0.0
2.0
4.0
6.0
8.0
10.0
12.0
14.0
16.0
18.0
20.0
1950's 1960's 1970's 1980's 1990's
STEM Total
All workers, age18 and older

Total STEM Employment and Linear Trend, 1983 to 2004
4,000,000
5,000,000
6,000,000
7,000,000
8,000,000
1983 1985 1987 1989 1991 1993 1995 1997 1999 2001 2003
Source: CPS(MORG) and author's estimate
Actual (CPS)
Linear Trend

Unemployment All US and S&E Workers; and Ratio of the Two, 1983-2004
0.0
2.0
4.0
6.0
8.0
10.0
12.0
1 1 1 1 1 1 1 1 2 2 2
Source: CPS (MORG)
Une
mpl
oym
ent
rate
0%
10%
20%
30%
40%
50%
60%
70%
80%
90%
S&
E /
All
All U.S.
All S&E
S&E, All %

Generalized demand:S&E outside of S&E occupations
• Large proportion of S&E educated persons work in non-S&E type jobs
• How to measure S&E job content?– Substantial share of non-S&E jobholders use
S&E education, but– Surprising share of S&E jobholders do not
• The number of S&E educated individuals is greater than broadly-defined S&E jobs

Figure X. Percent of Degree Recepients by S&E Status One to Two Years After Graduation, Average of Cohorts 1993 to 2001
0%
10%
20%
30%
40%
50%
60%
70%
80%
90%
100%
Bachelor's Master'sSource: S&E Indicators 2006, Appendix table 2-12 (http://www.nsf.gov/statistics/seind06/pdf_v2.htm).
Studying, S&E
Studying, Not-S&E
Working, Unemployed
Working, S&E
Working, Not-S&E

Workers with S&E as highest degree employed in non-S&E occupations whose degree is closely
related, 2003
0%
10%
20%
30%
40%
50%
60%
All degreelevels
Bachelor’s Master’s Doctoral
Source: S&E Indicators, 2006, T3.3

Percentage of Workers with S&E or Related Highest Degree and Job Closely Related to Degree, 2003
0 10 20 30 40 50 60 70 80
S&E fields
Computer and mathematical sciences
Biological, agricultural, and environmental lifesciences
Physical and related sciences
Social and related sciences
Engineering
S&E-related fields
Source: S&E Indicators, 2006
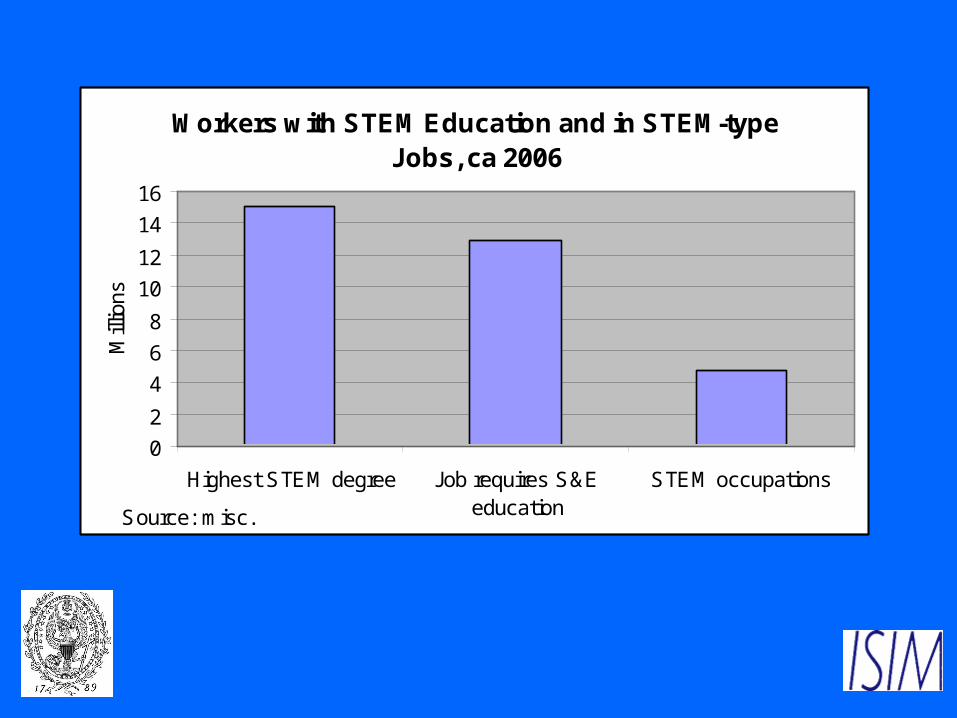
Workers with STEM Education and in STEM-type Jobs, ca 2006
0
2
4
6
8
10
12
14
16
Highest STEM degree Job requires S&Eeducation
STEM occupations
Source: misc.
Mill
ions

Future Demand?• Recall that recent trends suggest slowing
growth
• The BLS projections are for high STEM growth, primarily computer occupations,– STEM not only hi/large growth workforce
• Foreign born are a substantial presence

Projected Growth in Percent, Selected Occupations, 2004 to 2014
0 5 10 15 20 25 30 35
00-0000 Total, all occupations
11-1300 Management,business, and financial occupations2
15-2900 Professional andrelated occupations3
15-0000 Computer andmathematical science occupations
17-2000 Engineers
19-1000 Life scientists
19-2000 Physical scientists
19-3000 Social scientistsand related occupations
19-4000 Life, physical, andsocial science technicians
25-1000 Postsecondaryteachers
Source: Bureau of Labor Statistics


Growth of College Educated Residents
80
100
120
140
160
180
200
220
240
260
1994 1995 1996 1997 1998 1999 2000 2001 2002 2003 2004
Source: MORG/CPS tabulations
India
Philippines
China
Mexico
Korea/ SouthKorea
Canada
Germany
Russia

Figure 8. Past and Projected Size of Population Ages 0 to 39
0
250,000
500,000
750,000
1,000,000
1,250,000
1,500,000
1,750,000
2,000,000
2,250,000
1950 1955 1960 1965 1970 1975 1980 1985 1990 1995 2000 2005 2010 2015 2020 2025 2030 2035 2040 2045 2050
Source: UN 2006
More developed
Less developed
Least developed

Appendix Figure 1. Projection of Immigrant Share of Host Population: At Today's Rates of Emigration and
Destinations
0
2
4
6
8
10
12
14
2010 2015 2020 2025 2030 2035 2040 2045 2050
Source: Author's estimates
Imm
igra
nt P
erce
nt o
f H
ost
Pop
ulat
ion
More developedLess developedLeast developed

STRONG OR WEAKENING DEMAND? … decline in home-grown brain power, difficulty in attracting overseas scholars, and a looming shortage of scientists and engineers National Science Board, 2004 … With an estimated 25 million Americans set to retire by 2020 across all industries — and mass retirements of baby boomers predicted in other Western nations — Forrester Research says IT job seekers will have the upper hand when dealing with hiring managers eager to replenish lost expertise. http://computerworld.co.nz/news.nsf/care/A8E0FED72144FD5FCC2573170012988F … Steps could be taken to improve the outlook for U.S. science and technology. The most obvious move is to address the disconnects in federal STEM policy, which has yet to come to grips with issues like offshoring and the use of “guest workers.” R.A. Ellis, Commission on Professionals in Science and Technology … leaders warn of a labor shortage in the U.S., but indicators point to an oversupply Richard Monastersky Chronicle of Higher Education, 2004 … Despite recurring concerns about potential shortages of STEM personnel in the U.S. workforce, particularly in engineering and information technology, we did not find evidence that such shortages have existed at least since 1990, nor that they are on the horizon. RAND Corporation, 2004