Demand for Accessible Type A Apartment Units in...
57
Demand for Accessible Type A Apartment Units in the City of El Paso, Texas Prepared By: Roberto Tinajero, M.S. David Ramirez, B.B.A. Lisa Tomaka, M.P.A. with Dennis L. Soden, Ph.D. GIS Assistance Provided by: Mario Caire, Ph.D. Technical Report No. 2012-03 November 2012
Transcript of Demand for Accessible Type A Apartment Units in...

DDeemmaanndd ffoorr AAcccceessssiibbllee TTyyppee AA AAppaarrttmmeenntt UUnniittss iinn tthhee CCiittyy ooff EEll PPaassoo,, TTeexxaass
Prepared By:
Roberto Tinajero, M.S. David Ramirez, B.B.A. Lisa Tomaka, M.P.A.
with
Dennis L. Soden, Ph.D.
GIS Assistance Provided by:
Mario Caire, Ph.D.
Technical Report No. 2012-03
November 2012

i
KKeeyy FFiinnddiinnggss
City Comparison
• The percentage of persons with ambulatory difficulties with respect to El Paso’s total population has
remained relatively stable at about seven percent.
• The three percent accessibility Type A requirement for multi-family apartment units is higher and
more stringent than its counterparts when compared to similar urban centers in the Southwest.
Focus Groups
• Community Stakeholder focus groups highlighted costs and affordability as the main drivers for the
demand of accessible Type A apartment units.
• Community Advocates and Community Stakeholders expressed concerns about limited availability of
units and the overall lack of accessibility.
Stakeholder Survey
• Most respondents (68%) reported a yearly household income of $20,000 or less, half of the median
household income $40,702 for the City of El Paso.
• Of those respondents not currently living in a Type A unit, 61 percent would like to live in one and 39
percent would not. Home ownership was the main reason for not being interested in living in a Type
A apartment unit.
• A two or more bedroom apartment unit would best meet the needs of 78 percent of respondents
interested in a Type A unit.
• Most respondents would like to live in the same area where they currently live; in order of preference,
East, Central, Mission Valley, Northeast, and West area.
• On average, respondents are able and willing to pay $474 for a Type A unit, below the estimated
median rent ($706) and average rent ($827) in the City of el Paso.
Demand and Forecast Estimates
• The population in the City of El Paso is expected to increase at an average annual rate of over one
percent.

Institute for Policy and Economic Development Demand for Accessible Type A Apartment Units
ii
• Total population with an ambulatory difficulty is expected to surpass 52,000 by 2022.
• On average, potential need of accessible Type A units by 2022 is estimated at 8,754 while potential
demand is estimated at 525 units.
Supply and Forecast Estimates
• A total of 637 accessible Type A units are estimated; 245 are in public housing and 392 are in
privately-owned properties.
• On average, potential supply of commercial accessible Type A units is estimated at 530 by 2022.
Final Analysis
• Supply and demand for commercial accessible Type A apartment units seem not far apart
considering levels of rent, apartment size needs, family roles, and household income levels.
• Affordability appears to be the main driver in the demand (and supply) for commercial accessible
Type A apartment units in the City of El Paso.
• Market conditions for commercial accessible Type A apartments are expected to remain stable. To
that effect, the current Type A accessibility requirement of three percent seems appropriate to meet
the estimated potential demand for this type of units.
• Efforts to provide better information about the availability of accessible Type A units as well as other
accessible housing options may prove beneficial for both suppliers and demanders.
• Policymakers, suppliers, demanders, advocates, and other interested parties should engage in
discussing different avenues that may help to reduce the potential need for accessible housing.

1
IInnttrroodduuccttiioonn
The Institute for Policy and Economic Development (IPED) at the University of Texas at El Paso (UTEP)
was contracted by the Department of Community and Human Development of the City of El Paso to
conduct a series of analyses designed to assist the City in determining future policies related to
accessible (Type A) multi-family rental housing (five or more units). Accordingly, the purpose of this study
is to evaluate the current market conditions for accessible multi-family dwellings by estimating the
potential demand and supply of Type A multi-family units in the City of El Paso through 2022.
There are many factors to consider when it comes to accessible housing. The public sector, the private
sector, and the needs of the general public, all come into play. In general, the City of El Paso has
multiple demand vectors for accessible Type A housing. These demand vectors range from high regional
rates of disease that contribute to disabilities such as diabetes, soldiers returning to Fort Bliss with
warfare related long-term disabilities, as well as the regional demand from the general population and, to
a lesser degree, from Mexico and other Latin American countries whose residents with disabilities seek
the medical and support services provided in this border location. Therefore, in order to accurately
assess the supply and demand for Type A accessible housing in the City of El Paso, IPED conducted an
analysis implementing multiple approaches. The components of this analysis are as follows:
• A brief overview of statutes and guidelines that covers the technical and scoping requirements for
accessible dwellings, as well as definitions that will be used through this report.
• A comparison of Type A accessible housing unit requirements in multi-family developments and the
percentage of the population with ambulatory difficulties in a set of comparable or nearby cities in the
Southwest.
• An initial assessment regarding the perceptions of Consumer Advocates and Community
Stakeholders on supply and demand, accessibility, and related cost via exploratory focus groups.
• Sample characteristics and needs of the target population (individuals with an ambulatory difficulty)
based on survey responses.
• Forecast estimates of the number of persons with ambulatory difficulties in the City of El Paso for the
next ten years (2022).
• Potential need and potential demand estimates for accessible Type A apartment units based on
secondary data, forecast estimates, and collected survey data.

Institute for Policy and Economic Development Demand for Accessible Type A Apartment Units
2
• The current supply of Type A apartment units in multi-family properties (more than four units) within
the City of El Paso determined by conducting a review of publically available data.
• Potential supply estimates of accessible Type A apartment units based on secondary data and
forecast estimates.
• Final analysis and concluding remarks.
• Appendices containing focus groups questions, survey instruments, survey frequency tables, and
multi-family property data.
LLaawwss aanndd CCooddeess
Over the years several statutes have been enacted across various levels of government with the purpose
of ensuring nondiscrimination against people with disabilities. These laws, and their respective
standards, serve as the guidelines and provide scoping and technical requirements for any entity
concerned with meeting accessibility requirements. In general, these requirements normally fall under
one or more of these statutes subject to funding sources, type of dwelling/facility, public and/or common
use areas, etc. However, this study concentrates on those standards that apply to multi-family units. In
this regards, the most important pieces of legislation concerning accessibility are the following:
• The Architectural Barriers Act (1960) This Act states that all Federal and federally-funded buildings must be physically accessible for
people with disabilities. The Uniform Federal Accessibility Standards (UFAS) is the
corresponding standard for this Act.
• Section 504 of the Rehabilitation Act This Act concerns itself with eliminating discrimination toward people with disabilities and
providing physical accessibility to ensure that people with disabilities have an equal opportunity in
federally funded programs. This includes modification and construction of new facilities to ensure
compliance. UFAS is the standard for this Act, although on some occasions other similar
standards may be applicable.
• The Fair Housing Act of 1968 (including 1988 amendments) The U.S. Department of Housing and Urban Development’s (HUD) Fair Housing Act (FHA) calls
for equality in housing. It includes all new public and privately funded multi-family housing

Institute for Policy and Economic Development Demand for Accessible Type A Apartment Units
3
complexes consisting of four or more units built for first occupancy after March 13, 1991. The
FHA Design Manual is the standard for this act.
• The Americans with Disabilities Act (1990) This is a civil rights act that guarantees equal opportunities for individuals in employment, public
accommodation, local government services, and telecommunications. With respect to housing,
this applies to public housing and state boarding facilities. However, since multi-family properties
are typically regarded as commercial entities, ADA guidelines apply to certain areas of these
properties, such as sidewalks, clubhouses, and public spaces within the property. The ADA
Accessibility Guidelines for Buildings and Facilities (ADAAG) are the corresponding standards for
this Act.
• State and Local Codes States and cities typically develop their own building codes. These are based on national or
international standards, and amended accordingly. In most cases, it is some version of The
International Building Code (IBC) and/or the American National Standards Institute requirements
(ANSI), specifically section 117.1.
All these laws and codes provide the scoping and technical requirements for accessibility, but in order to
define what an accessible unit is, it is necessary to consult the FHA Design Manual. This manual
provides seven basic design and construction requirements that must be met in order for a dwelling unit
to be in compliance with accessibility standards. These requirements are as follows: 1) An accessible building entrance on an accessible route
− An accessible route is defined as continuous, unobstructed path connecting accessible elements
and spaces within a building or site that can be negotiated by a person with a disability who uses
a wheelchair, and which is also safe for and usable by people with other disabilities.
− An accessible entrance is a building entrance connected by an accessible route to public transit
stops, passenger loading zones, and public streets and sidewalks.
2) Accessible public and common use areas
− Public and common use areas must be readily accessible to and usable by people with
disabilities.
3) Usable doors
− All doors designed to allow passage into and within the premises must be sufficiently wide to
allow passage by persons in wheelchairs.
Institute for Policy and Economic Development Demand for Accessible Type A Apartment Units
4
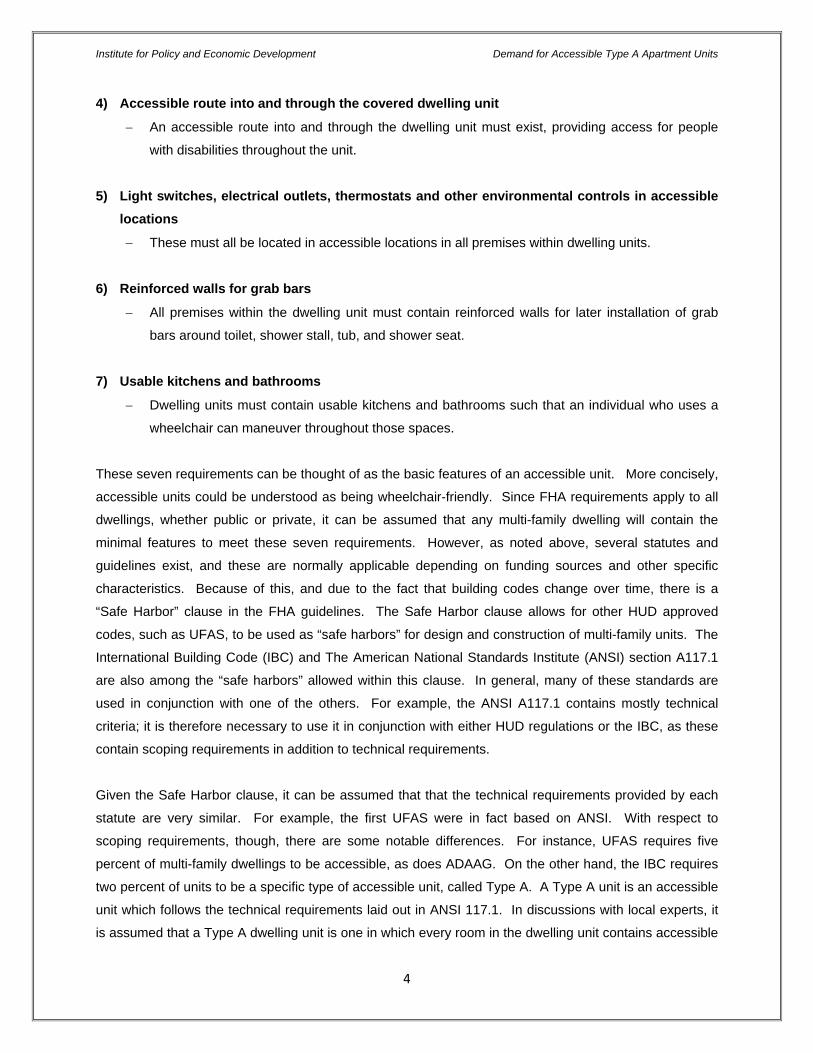
4) Accessible route into and through the covered dwelling unit
− An accessible route into and through the dwelling unit must exist, providing access for people
with disabilities throughout the unit.
5) Light switches, electrical outlets, thermostats and other environmental controls in accessible locations
− These must all be located in accessible locations in all premises within dwelling units.
6) Reinforced walls for grab bars
− All premises within the dwelling unit must contain reinforced walls for later installation of grab
bars around toilet, shower stall, tub, and shower seat.
7) Usable kitchens and bathrooms
− Dwelling units must contain usable kitchens and bathrooms such that an individual who uses a
wheelchair can maneuver throughout those spaces.
These seven requirements can be thought of as the basic features of an accessible unit. More concisely,
accessible units could be understood as being wheelchair-friendly. Since FHA requirements apply to all
dwellings, whether public or private, it can be assumed that any multi-family dwelling will contain the
minimal features to meet these seven requirements. However, as noted above, several statutes and
guidelines exist, and these are normally applicable depending on funding sources and other specific
characteristics. Because of this, and due to the fact that building codes change over time, there is a
“Safe Harbor” clause in the FHA guidelines. The Safe Harbor clause allows for other HUD approved
codes, such as UFAS, to be used as “safe harbors” for design and construction of multi-family units. The
International Building Code (IBC) and The American National Standards Institute (ANSI) section A117.1
are also among the “safe harbors” allowed within this clause. In general, many of these standards are
used in conjunction with one of the others. For example, the ANSI A117.1 contains mostly technical
criteria; it is therefore necessary to use it in conjunction with either HUD regulations or the IBC, as these
contain scoping requirements in addition to technical requirements.
Given the Safe Harbor clause, it can be assumed that that the technical requirements provided by each
statute are very similar. For example, the first UFAS were in fact based on ANSI. With respect to
scoping requirements, though, there are some notable differences. For instance, UFAS requires five
percent of multi-family dwellings to be accessible, as does ADAAG. On the other hand, the IBC requires
two percent of units to be a specific type of accessible unit, called Type A. A Type A unit is an accessible
unit which follows the technical requirements laid out in ANSI 117.1. In discussions with local experts, it
is assumed that a Type A dwelling unit is one in which every room in the dwelling unit contains accessible

Institute for Policy and Economic Development Demand for Accessible Type A Apartment Units
5
features. This is in contrast to Type B units, which only requires one accessible room and bathroom in a
dwelling unit. Both Type A and Type B units could be adaptable, meaning that certain spaces and
elements, such as sinks, cabinets, and grab bars, can be added or altered in order to accommodate the
needs of either disabled or nondisabled persons. Type A units, however, must be already accessible,
that is, all grab bars must be in place, as well as lower counters, sinks, etc.
The City of El Paso’s Municipal Building Code is based on the 2009 IBC, which in turn uses technical
requirements contained in ANSI. However, the City is able to make amendments to the accessible
dwelling unit requirements. The current City Ordinance (number 17414) regarding accessibility for multi-
family dwelling units reads as follows:
In Group R-2 occupancies containing more than four (4) dwelling units or sleeping units, at least three (3)
percent but not less than one of the units shall be a type A unit. All units on a site shall be considered to
determine the total number of units and the required number of Type A units. Type A units shall be
dispersed among the various classes of units. All Type A units shall be provided with a roll-in shower and
a permanent mounted folding seat meeting the specifications and requirements for roll-in showers and
mounted folding shower seats in ACC/ANSI 1171.1 – 2003 Section 608.
In summary, an accessible unit is defined as a unit that can be approached, accessed, and used by any
person with a disability. In addition, it must contain the seven features found in the FHA. Moreover,
federally-funded dwelling units must comply with UFAS, while all privately owned multifamily properties
with more than four units must comply with the City of El Paso’s Municipal Building Code. As previously
stated, this code calls for three percent of the total number of units to be Type A units. This ordinance
took effect in January 2011, before that, the municipal building code required that five percent of the total
number of units be Type A units.
DDeeffiinniittiioonnss
The following terms, which are used throughout the report, were defined using information from the
Uniform Federal Accessibility Standards, The Fair Housing Act Design Manual, the American National
Standards Institute 117.1 in conjunction with The International Building Code, El Paso’s Municipal
Building Code, the U.S Census Bureau American Community Survey, as well as local expertise.
− Accessible - describes a site, area, building, or dwelling unit that abides by certain standards which
allow for it to be approached, entered, and used by someone with a disability.

Institute for Policy and Economic Development Demand for Accessible Type A Apartment Units
6
− Adaptable - The ability of certain spaces and elements, such as sinks, cabinets, and grab bars, to be
added or altered to accommodate the needs of either disabled or nondisabled persons, or to
accommodate different degrees of disabilities. In other words, readily adjustable.
− Ambulatory Difficulty - This is based on the American Community Survey and relates to having
serious difficulty walking or climbing stairs.
− Dwelling Unit - a single unit of residence which provides a kitchen or food preparation area, in
addition to rooms and spaces for living, bathing, sleeping, and such.
− Multifamily Dwelling - Any building containing five or more dwelling units.
− Type A Dwelling Unit - A specific type of accessible unit in which all the rooms and bathrooms in the
dwelling unit follow the technical requirements in ANSI 117.1. In addition, in compliance with the El
Paso Municipal Building Code which requires all Type A units to provide a roll-in shower and a
permanent mounted folding shower seat. A Type A dwelling unit may be adaptable, but must initially
have all the features required for accessibility in place.
− Type B Dwelling Unit - A specific unit in which at least one bedroom and one bathroom in the dwelling
unit follow the technical requirements in ANSI 117.1. A Type B unit does not need to initially have all
the features required for accessibility in place, but must be adaptable.
DDeemmaanndd
HHiissttoorriiccaall DDaattaa aanndd CCoommppaarraattiivvee OOvveerrvviieeww According to the American Community Survey of the U.S Census Bureau, the total civilian non-
institutionalized population with ambulatory difficulties (over five years old) in the City of El Paso
increased from 41,119 in 2008 to 45,206 in 2011 (Table 1). This increment represents nearly a ten
percent increase over a three-year period; slightly over the nine percent growth of the total population in
the City of El Paso during the same timeframe. As a percentage of the total population, individuals with
ambulatory difficulties have remained relatively constant, at about seven percent. As depicted in Table 1,
most age cohorts have also remained steady with the exception of 18 to 34 years old which almost
doubled from 2010 to 2011. This increment could be explained by the Fort Bliss expansion and soldiers
returning with warfare related disabilities.

Institute for Policy and Economic Development Demand for Accessible Type A Apartment Units
7
Table 1. City of El Paso Historical Data (2008-2011)
With the purpose to provide a benchmark for decision-making, data from the U.S. Census Bureau
(American Community Survey and Population Estimates) were also utilized to develop a comparative
overview of the total population and the population with an ambulatory difficulty in El Paso and across
nine similar or nearby southwest urban areas. In addition, information from their respective municipal
building codes was incorporated to reference accessibility Type A requirements for commercial multi-
family dwelling units. As illustrated in Table 2 below, the City of El Paso has an estimated population of
665,568 in 2011, which is comparable to Tucson, Arizona (525,796) and Albuquerque, New Mexico
(552,804); the two cities that are most similar in size to El Paso.
Table 2. Comparison of Similar Southwest Cities in 2011
2008 2009 2010 2011Total Population 609,248 620,456 651,881 665,568
Total 41,119 42,305 43,884 45,2065 to 17 913 825 807 899
18 to 34 3,204 2,156 2,362 4,490
35 to 64 16,721 16,978 18,796 17,465
65 to 74 6,695 8,492 8,663 8,816
75 + 13,586 13,854 13,256 13,536
Source: U.S. Census Bureau, Population Estimates and American Community Survey
Population with Ambulatory Difficulties
City Total PopulationPersons with Ambulatory Difficulties
Percentage of Population with
Ambulatory Difficulties
Type A Requirement
San Antonio 1,359,758 103,575 7.6% 2%
Phoenix 1,469,471 69,000 4.7% 2% & 6%
Dallas 1,223,229 65,413 5.3% 2%
El Paso 665,568 45,206 6.8% 3%Tucson 525,796 38,839 7.4% 2%
Albuquerque 552,804 36,492 6.6% 2%
Austin 820,611 34,084 4.2% 2%Laredo 241,935 14,513 6.0% 2%
Brownsville 178,430 13,234 7.4% 2%
Las Cruces 99,665 4,465 4.5% 2%
Source: U.S. Census Population Estimates; American Community Survey; Municipal Building Codes.

Institute for Policy and Economic Development Demand for Accessible Type A Apartment Units
8
In terms of the number of persons with ambulatory difficulties, Tucson, Arizona (38,839) and
Albuquerque, New Mexico (36,492) are also the most similar cities when compared to El Paso (45,206).
In line with total population estimates, San Antonio, Texas, Phoenix, Arizona and Dallas, Texas are the
top three cities with respect to the number of persons with ambulatory difficulties across the selected
cities. In addition, the cities with the highest percentage of ambulatory difficulties with respect to their
total population are San Antonio (7.6%) followed by Brownsville (7.4%) and Tucson (7.4%). The city of El
Paso is fourth with 6.8 percent of the population estimated to have an ambulatory difficulty.
Accessible Type A requirements across cities indicates that El Paso has the highest requirement for
accessible Type A multi-family commercial units (3%) with the exception of Phoenix, Arizona which
requires that six percent of multi-family commercial housing units constructed within 1,320 feet of the
city’s light rail system must be Type A accessible. However, construction of commercial apartment units
in the remainder areas of the City of Phoenix is required to meet a two percent requirement. Overall, as
Table 2 suggests, El Paso is not much different than other cities with similar population and with similar
number of persons with ambulatory difficulties. Accordingly, it appears that the three percent Type A
accessibility requirement for multi-family commercial units in the City of El Paso is in line, and even
higher, when compared with the requirements of similar urban centers in the Southwest region.
FFooccuuss GGrroouuppss MMeetthhooddoollooggyy In addition to the City comparative overview, exploratory focus groups were implemented to begin
exploring the need for accessible Type A multi-family units in the City of El Paso and with the objective of
gathering input from the community of persons with disabilities (Community Stakeholders) as well as their
advocates (Community Advocates). The groups were facilitated in a manner that encouraged individuals
to share and discuss perceptions, common opinions and beliefs regarding current housing issues, and
antidotal experiences related to securing adequate accessible housing. The content of the focus group
discussions was analyzed for dominate themes and was used to develop the basis of a survey instrument
that was later distributed to the targeted population.
Thirty-five individuals (17 males and 18 females) participated in four focus groups consisting of four,
eight, nine, and fourteen participants. Two focus groups were facilitated in English, one group was
facilitated in Spanish, and the smallest group was facilitated in both English and Spanish. It is important
to note that focus group participants were not randomly selected given that a list of potential participants
could not be obtained beforehand as a consequence of the Privacy Rule Standards of the Health

Institute for Policy and Economic Development Demand for Accessible Type A Apartment Units
9
Insurance Portability and Accountability Act of 1996 (HIPAA).1 Accordingly, a flyer in English and
Spanish distributed via email was used to recruit focus group participants. Email distribution was
facilitated by area organizations that provide support services to persons with disabilities residing in the
City of El Paso. Three of the four focus groups consisted mainly of individuals who attend weekly
independent living and support groups (Community Stakeholders) at Volar Center for Independent Living
and who volunteered to participate. The fourth focus group was recruited by Mr. Luis Chew, Executive
Director of Volar, and consisted exclusively of Community Advocates for persons with disabilities. All
focus groups were conducted at Volar Center for Independent Living’s facilities to ensure there were no
barriers to access.
A moderator and co-moderated facilitated each focus group. Focus group discussion was prompted by a
previously developed set of pre-vetted stimulus questions (see Appendix A). The discussions lasted
approximately one to 1.5 hours and the individuals participating in the three community stakeholder
groups were compensated $20 for their time. All focus group sessions were recorded and then
transcribed. Constant comparison analysis was used to analyze the content within and across groups.
Specifically, the data from all focus groups was reviewed and separated into smaller units, a label was
given to each of these units and categories were formed based on similar labels. A theme was later
developed that expressed the content of each of the categories. It should be noted that a review of the
data upon completion of the four focus groups suggested that additional focus groups would not identify
any new themes.
AAnnaallyyssiiss ooff FFooccuuss GGrroouuppss Eight themes immerged from the focus group data. Each theme is discussed in more detail below.
Themes are ordered based on supporting content. Those with the greatest amount of content, or content
that occurred most frequently are reviewed first. Six of the eight themes were present to some extent in
all four focus groups. Two themes were exclusive to the Community Advocate focus group. These
themes are reviewed last.
Theme 1. The Impact of Affordability/Cost and Waiting Lists on Accessibility Housing Analysis of the focus group data indicated that the largest amount of content fell within this thematic area
suggesting the importance of cost/affordability on the demand for accessible Type A apartment units.
Differing perspectives on this issue existed between the Community Advocate focus group and the
Community Stakeholder focus groups. Community Advocate statements appeared to be attempting to
dispel the idea that persons with disabilities were not adequate wage earners and could not afford 1 In general, the Privacy Rule Standards, issued by the U.S. Department of Health and Human Services, address the use and disclose of individuals’ health information as well as standards for individuals’ privacy rights to understand and control how their health information is used. For more information see Public Law 104-191.

Institute for Policy and Economic Development Demand for Accessible Type A Apartment Units
10
housing in the private sector. On the other hand, statements made by Community Stakeholders
suggested that cost was a key driver in their decisions regarding apartment selection and could require
them to renounce on accessibility. Moreover, focus group members discussed fears that their rent would
be raised or further charges would be levied if accessibility modifications were requested. In addition,
focus group members in the Community Stakeholder groups discussed the fact that the waiting lists for
public, affordable and accessible units is between two and four years; hence, leaving persons with
disabilities in housing options that did not adequately meet their needs.
Theme 2. Currently Living with Family or in a Family Home (Owned or Rented) Similar to the first theme, two perspectives also emerged during discussions related to living with family or
in a family home. Members of the Community Advocacy group identified the culture in El Paso as a
primary factor that keeps people with disabilities and elderly persons at home with their families. They
also noted that many of these homes are not adapted for accessibility, but that families made them work.
In contrast, members of the three Community Stakeholder groups did not identify community culture as
the reason they remained with their families. Their comments suggested that they viewed their current
living situation as a personal choice that was based on individual and/or family need. These reasons
included the fact that the parental/familial home is accessible, expenses are shared, it is convenient,
there are collective household chores and responsibilities, there is an emotional connection, and a feeling
of reassurance.
Theme 3. Accessibility Issues Related to Finding and Renting an Apartment In this theme, Community Advocates and Community Stakeholders expressed a common set of
concerns, opinions and perspectives when discussing issues related to finding an accessible apartment.
In all groups, members disclosed personal anecdotes and discussed a number of the difficulties they
have encountered in their current living situation or when they were looking for an accessible living
arrangement. Issues identified included lack of ramps, height of cabinets, inaccessibility of closets, the
limited availability of first story units, carpets as a safety issue, and lack of appropriate/accessible baths.
Groups’ discussion also addressed the fact that many apartment complexes were unwilling to make
changes until move-in and that many of the complex managers lacked knowledge with respect to ADA
requirements.
Theme 4. Perceptions Related to Supply and Demand Issues of inequitable treatment, discrimination and segregation surfaced in connection with supply and
demand. The majority of comments and discussions linked to this theme were derived from the
Community Advocate group. However, the Community Stakeholder discussion did touch on these
concerns. Mirroring the comments of the Community Advocate group, Community Stakeholders voiced

Institute for Policy and Economic Development Demand for Accessible Type A Apartment Units
11
the belief that able bodied people are occupying accessible apartments and that apartment complex
managers will “rent to anybody” to fill a vacant apartment.
Theme 5. Neighborhood Accessibility The number of comments and concerns voiced regarding the accessibility of the area surrounding an
apartment unit warranted separating it from the theme of apartment accessibility. Lack of access to
shopping facilities, public transportation stops, common facilities (e.g. laundry facilities, pools, etc), and
safety concerns (lack of sidewalks) were identified as some of the reasons that precluded rental of
accessible apartments.
Theme 6. Issues Regarding the Rental of Private Homes Several issues related to the rental of private homes were discussed in the Community Stakeholder
groups. These included increased charges or rent hikes in response to requested modifications
(accessible) and property up-keep.
Theme 7. Definition of Disability and U.S. Census Bureau Data The definition of a disability and its relationship to U.S. Census Bureau data was discussed exclusively in
the Community Advocate group. Group members voiced concerns that Census data does not include the
majority of persons with disabilities in this community such as veterans and the elderly. Therefore, their
belief was that the Census data is not reflective of the total population of disabled persons as a whole.
Group members noted that differences among disabilities and individuals further complicate this issue.
Theme 8. Community Education Regarding Accessible Supply and its Impact on Demand The theme of Community Education was also addressed solely by the Community Advocate group.
Group members discussed the need to educate the community on accessibility standards, universal
design, and the advantages of an accessible home. Group suggestions included the education of civil
engineering and architect students on accessible design as well as the development of an “ADA at a
glance” check list that includes important municipal building codes and laws in addition to State and
Federal regulations.
TTaarrggeett PPooppuullaattiioonn SSuurrvveeyy MMeetthhooddoollooggyy A survey instrument was developed by IPED (see Appendix B) in collaboration with the Department of
Community and Human Development of the City of El Paso, the City Fair Housing Task Force
Committee, Consumer Advocates and Community Stakeholders. Given the high percentage of bilingual
and Spanish-only speakers in this border region, the survey instrument was also translated from English

Institute for Policy and Economic Development Demand for Accessible Type A Apartment Units
12
to Spanish (see Appendix C). As previously discussed, the Privacy Rule Standards of the Health
Insurance Portability and Accountability Act of 1996 (HIPAA) prevented the development of a list of
potential respondents in advance. Therefore, a purposive sampling technique was implemented with the
objective of obtaining a representative sample of the target population, in this case, persons with
ambulatory difficulties.
To distribute the survey instrument among the target population, a total of 35 area agencies and
organizations that provide services to the target population were contacted and asked to assist in
distributing the survey instrument. Of those contacted, fourteen organizations and four events agreed to
assist in the distribution of the survey instrument (Table 3). IPED provided to the agencies noted below
the questionnaires in both English and Spanish to be distributed among the persons they serve. A total of
5,300 survey questionnaires were distributed from September 17 to November 12, 2012.
After screening the raw responses for incomplete surveys, a preliminary sample of usable survey
responses totaled 748. However, since the target population was persons with ambulatory difficulties,
122 responses were excluded from the analysis given that this number of respondents reported not
having an ambulatory difficulty. Therefore, the final sample of survey responses totaled 626, all of them
assumed to be from individuals with an ambulatory difficulty. These 626 responses provided a response
rate of 11.8 percent. In addition, this sample of responses provided a margin of error of ± 3.89 percent at
the 95 percent confidence level.2
Table 3. Organizations/Events that Distributed the Survey Instrument
2 Margin of error assumes that the total population of persons with an ambulatory difficulty in the City of El Paso is 45,206.
Aging Disability Transportation Resource Center Emergence Health Network
Centro San Vicente Muscular Dystrophy Association
Community Options Project Bravo
Disabled American Veterans Chapter 187 Rio Grande Legal Aid
EPCC - Center for Students with Disabilities United Access
El Paso del Norte Children’s Development Center UTEP - Center for Accommodations and Support Services
El Paso’s City / County Nutrition Program Volar Center for Independent Living
Abilities Awareness Employment Fair - UTEP Our Lives Our Disabilities Conference - Camino Real
Fair Housing Fair - El Paso Convention Center Walk and Roll - UTEP
Organization / Agency Name
Event Name

Institute for Policy and Economic Development Demand for Accessible Type A Apartment Units
13
AAnnaallyyssiiss ooff SSuurrvveeyy RReessppoonnsseess
The following section summarizes the sample characteristics of the survey respondents. In addition, a
summary of the survey findings is presented in the form of response frequencies. Frequency tables for
each question are presented in Appendix D.
Sample Characteristics Respondents’ age appeared to be normally distributed with the great majority of respondents (73.1%)
indicating that they are between 25 and 64 years old (Figure 1). In addition, only 6.5 percent of
respondents are between 18 and 24 years of age while nearly 20 percent are older than 65. After
recoding zip codes into City areas, the highest proportion of respondents reported to live in the East side
area followed by Central, Mission Valley, Northeast, and West side areas (Figure 2).
Figure 1. Age
Figure 2. Area of Residence
Moreover, almost 60 percent of the individuals that responded reported they live in a house or a single-
family residence while 33 percent reported to live in an apartment (Figure 3). The remainder seven
percent mentioned that they currently live in a mobile home, condominium, townhouse or duplex.
Respondents were also asked about how many persons live in their household, nine percent responded
to live alone, 66 percent reported a household size between two and four, and 25 percent mentioned that
their household is assembled for five or more individuals (Figure 4).
In terms of household income, nearly 70 percent of individuals reported a yearly household income before
taxes of $20,000 or less (Figure 5). This figure is half of the estimated household income for the City of
19.8%
39.1%
34.0%
6.5%
> 65
45 - 64
25 - 44
18 - 24
28.2%
23.6%21.7%
17.1%
9.4%
East Central Mission Valley Northeast West

Institute for Policy and Economic Development Demand for Accessible Type A Apartment Units
14
El Paso in 2011 ($40,702) according to the U.S. Census Bureau American Community Survey. In
addition, only eight percent of respondents reported having a household income of over $50,000 a year.
Figure 3. Type of Residency
Figure 4. Household Size
Figure 5. Household Income
Survey Findings and Analysis First, respondents were asked if they (or someone they care for) currently live in an accessible Type A
apartment unit. Most respondents, or 80 percent, reported that they do not live in one while the other 20
percent stated that they currently live in a Type A unit (Figure 6). Those respondents who reported not
living in a Type A unit were then asked if they (or someone they care for) would like to live in one. Sixty-
one percent said they would and 39 percent mentioned that they would not like to live in a Type A
59.8%
33.2%
4.2% 2.8%
House / Single Family
Residence
Apartment Mobile Home Condominium / Townhouse /
Duplex
9.0%
22.0%
25.3%
18.6%
12.4% 12.7%
I Live Alone
Two Three Four Five Six or More
7.7%
8.3%
15.5%
27.2%
41.3%
Don't Know
Over $50,000
$20,001 to $50,000
$10,001 to $20,000
$10,000 or Less

Institute for Policy and Economic Development Demand for Accessible Type A Apartment Units
15
apartment unit (Figure 7). The main reason noted by those respondents who would not like to live in an
accessible Type A apartment unit was homeownership with almost 70 percent of responses (Figure 8). In
this regards, it is important to note that this percentage of homeownership is consistent with previous
findings reported at the state and national levels which mentioned that among household with disabilities,
homeownership is about 70 percent and 74 percent, respectively.3
Figure 6. Currently Living in a Type A Apartment Figure 7. Would Like to Live in a Type A Apartment
Figure 8. Why Would Not Like to Live in a Type A Apartment?
The majority of respondents (74%) that would like to live in an accessible Type A apartment unit
mentioned that their household was comprised by three or more individuals (Figure 9); accordingly, a
similar percentage of respondents (78%) indicated that the kind of unit that would best meet their needs is
3 See “Disability and American Families: 2000,” 2005, Census 2000 Special Reports, U.S. Census Bureau; and “The Housing Needs of Texans with Disabilities,” 2005, Texas Department of Housing and Community Affairs.
Yes20%
No80%
Yes61%
No39%
1.0%
2.9%
8.7%
8.7%
9.6%
69.2%
Have No Reason
Would not Like
Happy where they Live
Inconvenient (space, costs, moving, etc)
Other
Home Owner/Living in a House

Institute for Policy and Economic Development Demand for Accessible Type A Apartment Units
16
an apartment with two or more bedrooms (Figure 10). Additionally, individuals were asked in which zip
code they would like to live. After recoding zip codes into City areas, the areas where respondents would
like to live practically mirrored the areas where they currently live. The East side, Central, and Mission
Valley areas were the top three most frequently mentioned in both instances (Figure 11). City maps
representing the demand by these areas and by zip codes are presented in Appendix I.
Figure 9. Household Size Figure 10. Apartment Size Needs
Figure 11. Area of Town
Currently Living at
Would Like to Live at
The amount of rent that respondents are able and willing to pay for an accessible Type A apartment is
presented in Figure 12. Sixty-nine percent indicated that they are able and willing to pay less than $600.
On average, it is estimated that respondents could pay $474 for an accessible Type A apartment. This
figure is in line with the yearly household income levels reported in Figure 13 and the general affordability
housing definition which states that a household should not pay more than 30 percent of its annual
1 - 226%
3 +74%
1 BR22%
2 + BRs78%
25.6%23.4% 23.4%
16.5%
11.0%
East Central Mission Valley Northeast West
26.0%
21.4%20.3%
16.4% 16.0%
East Central Mission Valley West Northeast

Institute for Policy and Economic Development Demand for Accessible Type A Apartment Units
17
income in housing.4 Based on this general affordability definition and the income levels reported below,
67 percent of respondents should not pay more than $500 for housing. Overall, these figures are below
the 2011 median gross rent in the City of El Paso of $706,5 likely an indication of affordability issues.
Figure 12. Ability to Pay for a Type A Apartment Figure 13. Household Income
DDeemmaanndd FFoorreeccaasstt EEssttiimmaatteess MMeetthhooddoollooggyy A forecast estimate of the total population in El Paso County was developed using IPED’s Regional
Economic Modeling, Inc. (REMI) model. This model is a dynamic forecasting and policy analysis tool that
incorporates the strengths of four different modeling approaches: 1) Econometrics, 2) Input-Output, 3)
General Equilibrium, and 4) Economic Geography. First, the model was calibrated to reflect the most
recent data available from the U.S. Census Bureau and the U.S. Bureau of Economic Analysis. Once the
model was adjusted with these data updates, data from the Fort Bliss Transformation Office along with
IPED estimates were integrated into the REMI model to produce three different population forecast
estimates (LOW, MEDium and HIGH) for El Paso County up to 2022.
After the County estimates were developed, data from the U.S. Census Population Estimates were
utilized to estimate the total population of the City of El Paso employing a top-down approach. Historical
4 The U.S. Department of housing and Urban Development considers that families who pay more than 30 percent of their income for housing may have difficulties in affording other necessities like food, clothing, transportation, and medical care. 5 See “Selected Housing Characteristics,” 2011 American Community Survey 1-Year Estimates.
3.3%
1.9%
0.0%
4.3%
8.1%
13.4%
25.8%
15.3%
13.9%
8.1%
4.3%
1.4%
Don't Know
$1,000 or More
$900 - $999
$800 - $899
$700 - $799
$600 - $699
$500 - $599
$400 - $499
$300 - $399
$200 - $299
$100 - $199
Less than $100
6.8%
7.5%
18.1%
27.9%
39.6%
Don't Know
Over $50,000
$20,001 to $50,000
$10,001 to $20,000
$10,000 or Less

Institute for Policy and Economic Development Demand for Accessible Type A Apartment Units
18
data indicated that the percent of the City population has remained steady at about 80 percent of the
County population. Therefore, it is assumed that a comparable proportion will continue in subsequent
years. Correspondingly, data from the U.S. Census American Community Survey were employed to
estimate a benchmark of the total number of persons with ambulatory difficulties in the City of El Paso.
Essentially, the proportion of persons with ambulatory difficulties to the total City population was
implemented to develop the forecast estimates for the next ten years. Given that this proportion has
remained relatively constant (at about seven percent) for the past four years, it is also assumed that this
proportion will continue during the forecast horizon. In addition, the potential need and potential demand
for accessible Type A apartment units were also estimated using a top-down approach. For this purpose,
the anticipated yearly projections developed for individuals with ambulatory difficulties were employed
and incorporated with national and state data from previous studies in addition to the survey findings
presented above and other secondary data. In line with the rest of the estimates, these projections were
forecasted for the next ten years.
EEssttiimmaatteess As illustrated in Figure 14, it is anticipated a steady growth for the population in the City of El Paso during
the forecast period. The expected growth is estimated to increase the City population at an average
annual rate of over one percent for the next ten years. This translates to an increase between 12 percent
and 14 percent (depending on the different scenarios) between 2012 and 2022. It is estimated that the
most likely scenario will be defined by the trend of the MEDium scenario; accordingly, it is projected that
by 2022 the total population in the City of El Paso will be over 760,000.
Figure 14. City of El Paso Population Forecast
600
650
700
750
800
09 10 11 12 13 14 15 16 17 18 19 20 21 22
Thou
sand
s
Year
LOW MED HIGH
Source: Institute for Policy and Economic Development (IPED)

Institute for Policy and Economic Development Demand for Accessible Type A Apartment Units
19
As previously mentioned, the total number of non-institutionalized individuals with ambulatory disabilities
is benchmarked to historical trends with respect to the total City population. Correspondingly, Table 4
below presents the estimated figures for each of the scenarios developed. Specifically for 2012, the total
population with an ambulatory difficulty is expected to increase between 45,344 (1.4%) and 46,769
(1.6%) from the previous year. This annual trend is projected to continue, however, at a decreasing rate.
Using the most likely scenario (MED), the population with ambulatory disabilities is estimated to total over
52,000 at the end of the forecast period.
Table 4. City and Ambulatory Disabled Population Forecasts
Forecast estimates regarding individuals with ambulatory difficulties served as the basis to develop the
potential need and potential demand for accessible Type A apartment units. Additionally, data from
previous findings at the national and state levels and the survey findings discussed above are
incorporated in the estimated figures. For instance, according to previous findings, about 70 percent of
households with a disabled member are homeowners.6 This is in line with the survey responses
discussed above; therefore, this proportion is subtracted assuming that it would be difficult for
homeowners to leave their actual homes in order to move to an accessible Type A unit. Moreover, the
potential demand was further reduced (30 percent based on survey responses) to consider those
individuals that would not like to move to a Type A apartment due to different factors including
inconveniences such as space and costs, because they are happy with their current housing
accommodations, and/or because they simply would not like to live in one. Based on these estimates
and assumptions, Table 5 presents the potential need for Type A apartment units in the City of El Paso.
6 See “Disability and American Families: 2000,” 2005, Census 2000 Special Reports, U.S. Census Bureau; and “The Housing Needs of Texans with Disabilities,” 2005, Texas Department of Housing and Community Affairs.
2011 2012 2017 2022 City LOW 658,407 667,595 709,263 750,540
City MED 665,568 675,881 724,421 767,207
City HIGH 677,982 688,581 740,497 785,435
PwAD LOW 44,720 45,344 48,174 50,977
PwAD MED 45,206 45,906 49,203 52,109
PwAD HIGH 46,049 46,769 50,295 53,347
Source: U.S. Census Bureau, Population Estimates/American Community Survey; IPED Estimates
Population with Ambulatory Difficulties

Institute for Policy and Economic Development Demand for Accessible Type A Apartment Units
20
Table 5. Potential Need for Type A Units
Several data were further incorporated into the potential need figures to estimate the potential demand.
Specifically, data from the income levels reported in the survey responses, average rents from the El
Paso Apartment Association, apartment rent data from the UTEP Border Region Modeling Project, and
Type A apartment size needs along with the amount of rent respondents are able and willing to pay are
all incorporated for this purposes. Accordingly, two figures of the potential demand are estimated based
on different rent levels.
For instance, the 2011 median gross rent in the City of El Paso estimated by the American Community
Survey is $706; based on survey responses, only 14 percent of individuals would be able and willing to
pay this amount. This percentage is aligned with the income levels reported when assuming affordability
standards which likely require an income of above $30,000. As a result, this proportion is decreased from
the potential need. Alternatively, it is assumed that the current level of rents through the City of El Paso
is, on average, above $800. This assumption is based on data from the El Paso Apartment Association
which provided an estimate of current rents between $950 and $1,050, on average. In addition, data from
the UTEP Border Region Modeling Project indicated that average rents in 2011 for apartment units in El
Paso were $827. According to survey responses, about six percent of individuals would be able and
willing to pay a rent higher than $800. Therefore, this proportion is considered to estimate the potential
demand at this level of rents. Table 6 shows the figures of potential demand based on these two different
levels of rent.
Table 6. Potential Demand for Type A Units
2012 2017 2022 LOW 7,618 8,093 8,564
MED 7,712 8,266 8,754
HIGH 7,857 8,450 8,962
Source: Institute for Policy and Economic Development (IPED)
At $700 + 2012 2017 2022 LOW 1,066 1,133 1,199
MED 1,080 1,157 1,226
HIGH 1,100 1,183 1,255
At $800 + 2012 2017 2022 LOW 457 486 514
MED 463 496 525
HIGH 471 507 538
Source: Institute for Policy and Economic Development (IPED)

Institute for Policy and Economic Development Demand for Accessible Type A Apartment Units
21
As depicted in Table 6, the level of rents and household income play a significant role in the demand for
accessible Type A apartment units, among other things. Considering that 78 percent of respondents that
were interested in an accessible Type A apartment reported that the unit that would best meet their needs
is at least a two-bedroom apartment, it is contemplated that the potential demand will be more in line with
the second scenario; where it is assumed that rents in the City of El Paso for this type of units are higher
than $800.
SSuuppppllyy
EEssttiimmaatteedd SSuuppppllyy aanndd FFoorreeccaasstt As previously defined, a Type A dwelling unit is one in which all the rooms and bathrooms follow the
technical requirements for accessibility contained in ANSI 117.1. A roll-in shower and a permanent
mounted folding shower seat must also be provided, as per the current City Ordinance number 17414.
To that effect, it is important to note that only the supply of accessible Type A apartment units across the
City of El Paso is estimated. Therefore, Type B and other accessible dwelling units were not considered
for this analysis.
MMeetthhooddoollooggyy Initially, a list of 347 multi-family properties within the City of El Paso was compiled using public
information and secondary data sources. A survey instrument was then developed targeting managers of
those complexes and with the objective of quantifying the total number of accessible and Type A units in
each complex. The survey instrument was a one-page survey containing questions about the year the
complex was built, the number of accessible units that the complex had, the total number of Type A units
along with the number of these units that were occupied, and average rents (Appendix G and H). The
survey instrument was mailed to each property’s leasing office in two waves; the first wave was mailed in
May 2012, while the second wave was mailed in June 2012. Unfortunately, a low response rate coupled
with a high margin of error made these responses unusable for inference, reference, and comparison
purposes.
A second attempt to utilize the survey instrument was made with the assistance of the El Paso Apartment
Association (EPAA) in August 2012. The hope was that the EPAA may be able to obtain a better
response rate from its members; however, similar results were achieved. According to the EPAA,
property managers are typically apprehensive about releasing this type of information. Accordingly, this
may explain the low response rates obtained in the various distribution attempts.

Institute for Policy and Economic Development Demand for Accessible Type A Apartment Units
22
Alternatively, it was necessary to rely on various secondary sources. These include an audit of Type A
units conducted by the City of El Paso in 2009 and a UFAS unit audit provided by The Housing Authority
of the City of El Paso (HACEP). HACEP’s inventory is from July 30, 2012 and provides all accessible
units (according to UFAS standards) in addition to classifying them into Type A or Type B units. On the
other hand, the 2009 City audit only inventoried Type A units, however, it has not been updated. Given
that HACEP’s audit only covers public housing and that subsequent City audits have not taken place after
2009, commercial units built after 2009 were estimated using building permits for the years 2009 through
2012. The estimation procedure included the addition of secondary data sources to estimate the total
number of units by apartment complex multiplied by the applicable Type A requirement at the time. For
instance, the corresponding percentage of Type A requirements for properties that had begun
construction prior to 2011 is assumed to be five percent or no less than one unit. However, the five
percent requirement was reduced to three percent beginning January 2011. Accordingly, the three
percent requirement (or no less than one unit) is assumed for properties that began construction after
2011.
After estimating the number of accessible Type A apartment units in the City of El Paso, data from the
U.S. Census American Community Survey were employed to estimate a benchmark of the total number
of units in structures (greater than four units) with the objective of developing a forecast estimate of these
units. Historical data indicated that the proportion of this type of units with respect to City population has
been relatively stable at about seven percent. Accordingly, it is assumed that this trend will continue in
subsequent years considering that the construction of multi-family complexes should be closely related to
population changes. Correspondingly, the City of El Paso population forecasts were incorporated to
estimate the supply of accessible Type A units for the next ten years. For this purposes, it is also
assumed that the Type A requirements for new multi-family complexes will remain at three percent.
EEssttiimmaatteess A total of 637 accessible Type A units are estimated within the City of El Paso (see Appendix E and F for
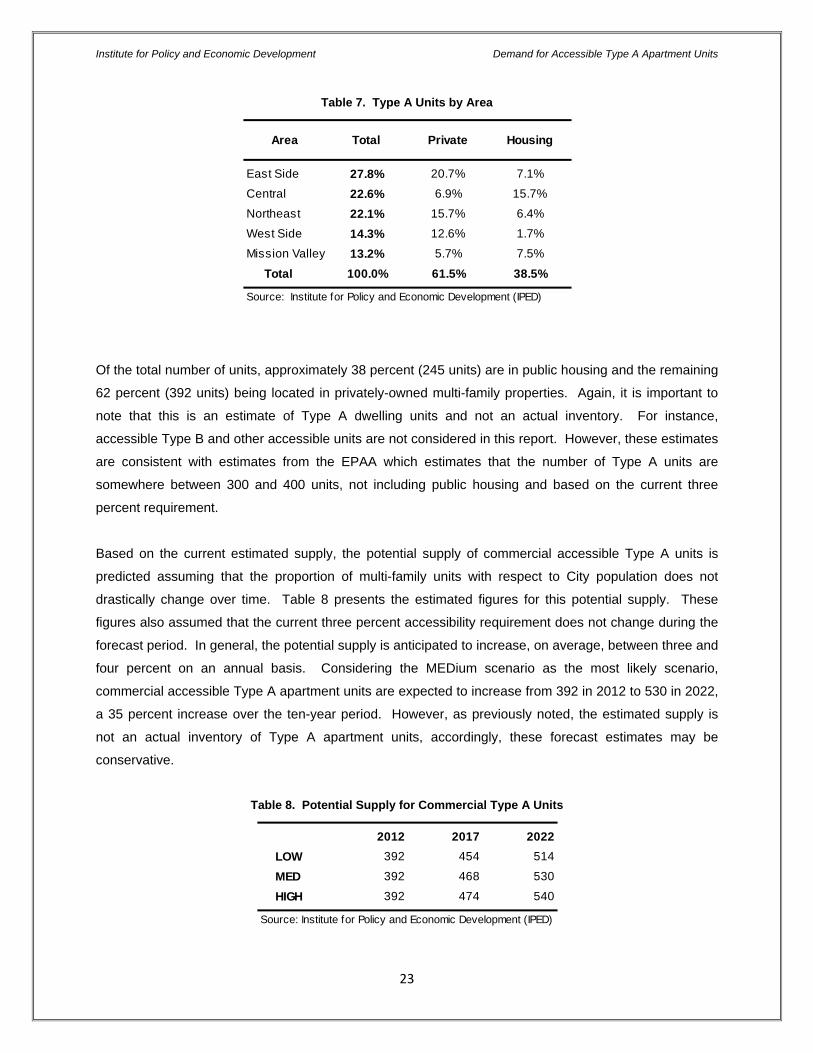
detailed information). As shown in Table 7, these units are dispersed uniformly across the different City
areas. The East side has the largest concentration of Type A units, accounting for nearly 28 percent of
the total. This concentration is followed by Central El Paso, Northeast, and the West side with 23
percent, 22 percent, and 14 percent, respectively. The Mission Valley area has the lowest concentration
of Type A units with 13 percent of the total units located there. Maps representing these supply
percentages by City areas and zip codes can be found in Appendix J.
Institute for Policy and Economic Development Demand for Accessible Type A Apartment Units
23
Table 7. Type A Units by Area
Of the total number of units, approximately 38 percent (245 units) are in public housing and the remaining
62 percent (392 units) being located in privately-owned multi-family properties. Again, it is important to
note that this is an estimate of Type A dwelling units and not an actual inventory. For instance,
accessible Type B and other accessible units are not considered in this report. However, these estimates
are consistent with estimates from the EPAA which estimates that the number of Type A units are
somewhere between 300 and 400 units, not including public housing and based on the current three
percent requirement.
Based on the current estimated supply, the potential supply of commercial accessible Type A units is
predicted assuming that the proportion of multi-family units with respect to City population does not
drastically change over time. Table 8 presents the estimated figures for this potential supply. These
figures also assumed that the current three percent accessibility requirement does not change during the
forecast period. In general, the potential supply is anticipated to increase, on average, between three and
four percent on an annual basis. Considering the MEDium scenario as the most likely scenario,
commercial accessible Type A apartment units are expected to increase from 392 in 2012 to 530 in 2022,
a 35 percent increase over the ten-year period. However, as previously noted, the estimated supply is
not an actual inventory of Type A apartment units, accordingly, these forecast estimates may be
conservative.
Table 8. Potential Supply for Commercial Type A Units
Area Total Private Housing
East Side 27.8% 20.7% 7.1%
Central 22.6% 6.9% 15.7%
Northeast 22.1% 15.7% 6.4%
West Side 14.3% 12.6% 1.7%
Mission Valley 13.2% 5.7% 7.5%
Total 100.0% 61.5% 38.5%
Source: Institute for Policy and Economic Development (IPED)
2012 2017 2022 LOW 392 454 514
MED 392 468 530
HIGH 392 474 540
Source: Institute for Policy and Economic Development (IPED)

Institute for Policy and Economic Development Demand for Accessible Type A Apartment Units
24
FFiinnaall AAnnaallyyssiiss aanndd CCoonncclluuddiinngg RReemmaarrkkss
In general, these series of analyses indicated that, in terms of Type A accessibility requirements for multi-
family commercial units, El Paso is not much different than other cities with similar population and with
similar number of persons with ambulatory difficulties. Moreover, data suggested that the potential need
of accessibility Type A apartment units is very different from the potential demand. While the current
potential demand is estimated to be at 463 units, the potential need is estimated at 7,712 units. This
difference is understandable when current market conditions are considered; specifically, current levels of
rent, apartment size needs, family roles, and general household income levels.
Affordability seems clearly an issue and a key driver with respect to the demand (and supply) of
accessible Type A apartment units. When current market conditions are incorporated, potential demand
and potential supply are not far apart. Currently, it is estimated as a market shortage of 71 units (392
units supplied minus 463 units demanded); however, this gap is estimated to get smaller through time
and progress into a surplus at the end of the forecast period. In addition, this apparent shortage may in
fact be non-existent taking into account that the current number of Type A units was not inventoried or
audited and since most of these estimates relied on secondary data sources. Accordingly, an actual
inventory/audit of accessible Type A apartments would provide a clearer picture of this market.
Another indication that the estimated shortage may be non-existent is that, according to the El Paso
Apartment Association (EPAA), there is a vacancy rate of around five percent for accessible Type A units.
However, as indicated by EPAA, this vacancy rate could be in fact higher given that not every rented
accessible Type A unit in private multi-family dwellings is occupied by someone with an ambulatory
difficulty. According to EPAA, property managers have indicated that apartments find it difficult to lease
accessible Type A units to persons with an ambulatory difficulty because, in general, these persons
cannot afford it. Consequently, property managers tend to lease unoccupied accessible Type A units to
individuals who do not necessarily have an ambulatory difficulty; obviously, in an attempt to occupy the
vacant units. Even though we could not confirmed nor disconfirmed the information received by EPAA, it
mirrors some of the comments received from Consumer Advocates and Community Stakeholders which
mentioned that individuals without ambulatory difficulties are occupying accessible apartments and that
managers at apartment complexes “rent to anybody” to fill a vacant apartment.
Based on these series of analyses, it can be determined that the current market for commercial
accessible Type A apartment units is likely at equilibrium or very close to it. Potential demand and
potential supply forecasts seem to remain about this equilibrium during the forecast horizon when market
conditions and the three percent accessibility requirement are considered. Accordingly, it appears that
the current City ordinance with respect to Type A accessibility requirements for commercial multi-family
dwelling units at three percent is appropriate to meet the estimated potential demand.

Institute for Policy and Economic Development Demand for Accessible Type A Apartment Units
25
On the other hand, even though the commercial market seems to be in equilibrium, there are other issues
that may need to be addressed regarding accessible housing needs. For instance, there seems to be a
lack of communication/information between demanders of accessible Type A units and suppliers with
respect to the availability of units. While demanders mentioned that there are not enough units available,
suppliers have indicated that they normally have vacant units. Hence, efforts should be made to provide
better information about the availability of accessible Type A units in addition to better connecting
demanders of this type of units with suppliers that have them available for rent. Similarly, attempts to
provide better information regarding other accessible housing options to individuals with ambulatory
difficulties may prove beneficial. Even though Type A units can be thought of as the most wheelchair-
friendly units, there are certainly other types of accessible and/or adaptable units (such as Type B units)
that may help to reduce the gap with respect to the potential need.
Overall, these series of analyses clearly suggested that there is a substantial need for accessible Type A
apartment units. However, data also indicated that the potential demand for accessible Type A units is
relatively low and very different from the potential need. This is likely a consequence of current market
conditions, preferences, and household income levels which appear to play a significant role in the
demanders’ ability to afford this type of units. As a result, policymakers, suppliers, demanders,
advocates, and other interested parties should engage in discussing different avenues (e.g. incentive
programs, public-private partnerships, etc.) that may help to reduce the potential need for accessible
housing.
Institute for Policy and Economic Development Demand for Accessible Type A Apartment Units
26
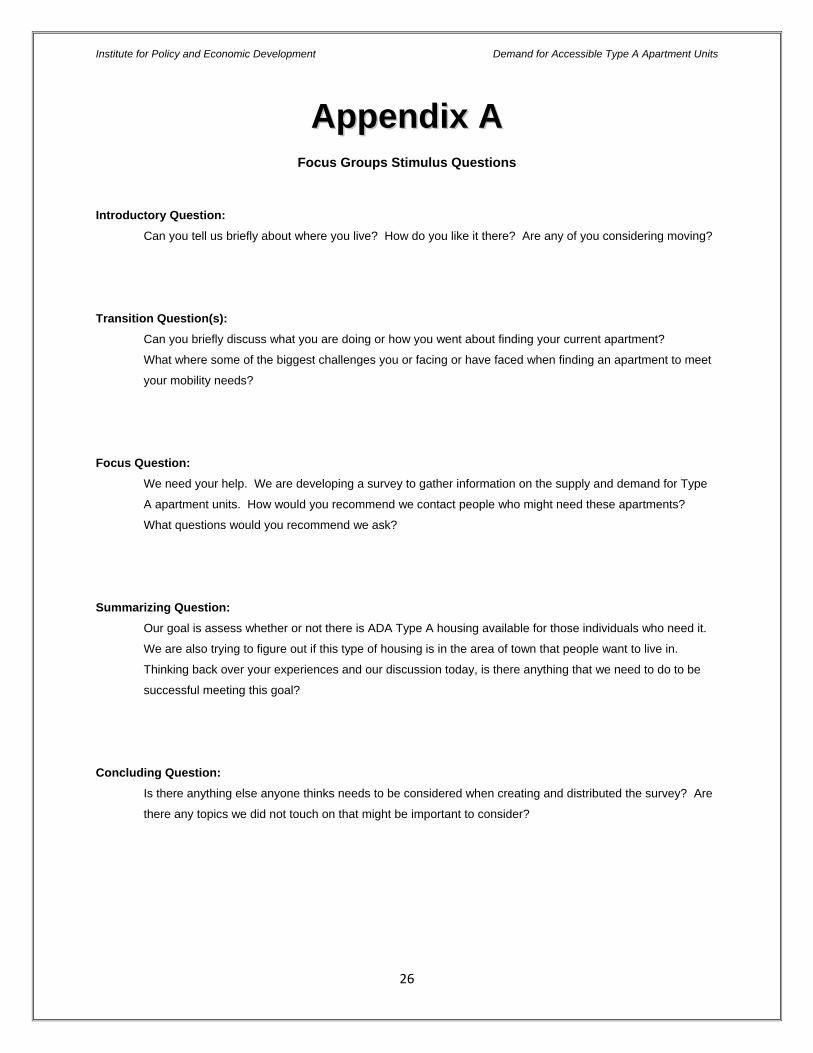
AAppppeennddiixx AA Focus Groups Stimulus Questions
Introductory Question:
Can you tell us briefly about where you live? How do you like it there? Are any of you considering moving?
Transition Question(s):
Can you briefly discuss what you are doing or how you went about finding your current apartment?
What where some of the biggest challenges you or facing or have faced when finding an apartment to meet
your mobility needs?
Focus Question:
We need your help. We are developing a survey to gather information on the supply and demand for Type
A apartment units. How would you recommend we contact people who might need these apartments?
What questions would you recommend we ask?
Summarizing Question:
Our goal is assess whether or not there is ADA Type A housing available for those individuals who need it.
We are also trying to figure out if this type of housing is in the area of town that people want to live in.
Thinking back over your experiences and our discussion today, is there anything that we need to do to be
successful meeting this goal?
Concluding Question:
Is there anything else anyone thinks needs to be considered when creating and distributed the survey? Are
there any topics we did not touch on that might be important to consider?

Institute for Policy and Economic Development Demand for Accessible Type A Apartment Units
27
AAppppeennddiixx BB Demand for Accessible Type A Apartment Units: 2012 Survey - English
The Institute for Policy and Economic Development at UTEP is conducting a short survey about the demand for accessible Type A apartment units. Your feedback is very valuable and will help us develop a better understanding of the need for accessible Type A apartment units. Your participation in this survey is completely voluntary and all answers will be kept confidential. This survey takes about ten minutes of your time to complete. Please complete this survey and return it in the postage-paid envelope provided as soon as possible. If you have any questions regarding this survey, please contact Roberto Tinajero at 747-5096 or at [email protected]
Your time and participation in this effort are greatly appreciated!
IMPORTANT: You may receive this questionnaire numerous times; PLEASE RESPOND ONLY ONCE! The next questions refer to accessible Type A apartment units. An accessible Type A apartment is a unit equipped with ALL of the following characteristics: - Wider doors and wider hallways - Lower counters/cabinets - Bathrooms with roll-in showers that have a permanent folding seat, grab bars, and a handheld
showerhead. 1. Do you (or someone you care for) currently live in a Type A apartment unit as described above?
Yes Skip to Question 7 No 2. Would you (or someone you care for) like to live in a Type A apartment unit as described above?
Yes No Skip to Question 6 3. If you would like to live in a Type A apartment unit, what kind of unit would best meet your needs (or the
needs of someone you care for)?
Studio / One Bedroom Two Bedrooms Three or More Bedrooms 4. If you would like to live in a Type A apartment unit, in which zip code would you (or someone you care for)
prefer to live?
Preferred ZIP Code ____________________
5. How much rent would you be able and willing to pay for a Type A apartment unit?
Rent ____________________ Please Skip to Question 7

Institute for Policy and Economic Development Demand for Accessible Type A Apartment Units
28
6. What is the MAIN REASON you would NOT like to live in an apartment unit with wider doors and hallways, lower counters/cabinets, and a bathroom with a roll-in shower that has a permanent folding seat, grab bars, and a handheld showerhead? ________________________________________________________________________________________________________________________________________________________________________________________________________________________________________________________________________
7. Please select the option below that best describes where you currently live.
House/Single Family Residence
Apartment
Condominium or Townhouse
Mobile Home
Other _____________________________ (Please specify)
8. Please provide the zip code in which you currently live. _________________________
9. Besides yourself, how many persons live in your household?
1 4
2 5 or more
3 I live alone
10. Please provide the year in which you were born (If you are answering for someone you care for, please provide the year in which he/she was born). ____________________
11. Please indicate your YEARLY HOUSEHOLD income before any taxes (gross).
$10,000 or Less $60,001 to $70,000
$10,001 to $20,000 $70,001 to $80,000
$20,001 to $30,000 $80,001 to $90,000
$30,001 to $40,000 $90,001 to $100,000
$40,001 to $50,000 Over $100,000
$50,001 to $60,000 Don’t Know
This Concludes the Questionnaire.
Thank you for your participation!

Institute for Policy and Economic Development Demand for Accessible Type A Apartment Units
29
AAppppeennddiixx CC Demand for Accessible Type A Apartment Units: 2012 Survey - Spanish
El Instituto para Políticas y Desarrollo Económico (IPED) de UTEP está llevando a cabo una breve encuesta sobre la demanda de apartamentos accesibles Tipo A (ADA Type A). Su opinión es muy valiosa y nos ayudara a entender mejor la necesidad de apartamentos accesibles Tipo A. Su participación en esta encuesta es completamente voluntaria y todas las respuestas se mantendrán confidenciales. Esta encuesta le tomara alrededor de 10 minutos de su tiempo. Por favor conteste esta encuesta y regréselo en el sobre pre-pagado lo antes posible. Si usted tiene alguna pregunta acerca de esta encuesta, por favor contacte a Roberto Tinajero al 747-5096 o en [email protected]
¡Le agradecemos ampliamente su tiempo y su participación!
IMPORTANTE: Quizá reciba este cuestionario varias veces; POR FAVOR RESPONDA SOLO UNA VEZ!
Las siguientes preguntas se refieren a apartamentos accesibles Tipo A. Un apartamento accesible Tipo A es una unidad equipada con TODAS las siguientes características: - Puertas más anchas y pasillos más amplios - Mostradores/gabinetes más bajos - Baños adaptados para una silla de ruedas con un asiento plegable permanente en el área de la regadera,
barras de apoyo y una regadera de mano. 1. ¿Usted (o alguien que usted cuida) vive actualmente en un apartamento Tipo A como se describe arriba?
Sí Pase a la Pregunta 7 No 2. ¿Le gustaría a usted (o a alguien que usted cuida) vivir en un apartamento Tipo A como se describe arriba?
Sí No Pase a la Pregunta 6 3. Si a usted le gustaría vivir en un apartamento Tipo A, ¿qué clase de unidad podría mejor satisfacer sus
necesidades (o las de alguien que usted cuida)?
Estudio / Una Recamara Dos Recamaras Tres o Más Recamaras 4. Si a usted le gustaría vivir en un apartamento Tipo A, ¿en cuál código postal preferiría usted (o alguien que
usted cuida) vivir?
Código Postal ____________________
5. ¿Cuánta renta estaría usted disponible y dispuesto a pagar por un apartamento Tipo A?
Renta ____________________ Por favor pase a la Pregunta 7

Institute for Policy and Economic Development Demand for Accessible Type A Apartment Units
30
6. ¿Cuál es la RAZÓN PRINCIPAL por la que a usted NO le gustaría vivir en un apartamento con puertas más anchas y pasillos más amplios, mostradores/gabinetes más bajos, y un baño adaptado para una silla de ruedas con un asiento plegable permanente en el área de la regadera, barras de apoyo y una regadera de mano? ___________________________________________________________________________________________________________________________________________________________________________________________________________________________________________________________________________
7. Por favor seleccione la opción que mejor describa donde vive actualmente.
Casa
Apartamento
Condominio o Unifamiliar
Casa Móvil
Otra _____________________________ (Por favor especifique)
8. Por favor proporcione el código postal donde vive actualmente. _________________________
9. Además de usted, ¿cuántas personas viven en su vivienda?
1 4
2 5 o mas
3 Vivo solo(a) 10. Por favor proporcione el año en que nació (Si usted está contestando por alguien que usted cuida, por
favor proporcione el año en el que ella/el nació). ____________________
11. Por favor indique el ingreso ANUAL de su HOGAR antes de cualquier impuesto (ingresos brutos).
$10,000 o Menos $60,001 a $70,000
$10,001 a $20,000 $70,001 a $80,000
$20,001 a $30,000 $80,001 a $90,000
$30,001 a $40,000 $90,001 a $100,000
$40,001 a $50,000 Más de $100,000
$50,001 a $60,000 No Sabe
Esto Concluye el Cuestionario.
¡Gracias por su participación!

Institute for Policy and Economic Development Demand for Accessible Type A Apartment Units
31
AAppppeennddiixx DD Demand for Type A Apartment Units 2012 Survey Frequencies
Demographics for All Disabled Respondents
Frequency Valid PercentHouse/Single Family Residence 357 59.8
Apartment 198 33.2
Condominium or Townhouse 25 4.2
Mobile Home 17 2.8Total 597 100.0Missing 29Total 626
Q7. Please select the option below that best describes where you currently live_Recode.
Frequency Valid PercentWest 55 9.4
Central 138 23.6East 165 28.2
Mission Valley 127 21.7Northeast 100 17.1Total 585 100.0Missing 41Total 626
Q8. Current Area_Recode
Frequency Valid PercentI live alone 53 9.0
Two 130 22.0
Three 149 25.3
Four 110 18.6
Five 73 12.4
Six or more 75 12.7Total 590 100.0Missing 36Total 626
Q9. How many persons live in your household?_Recode
Frequency Valid Percent18 - 24 33 6.5
25 - 44 173 34.0
45 - 64 199 39.1
> 65 101 19.8Total 509 100.0Missing 117Total 626
Q10. Selected Age Cohorts
Frequency Valid Percent$10,000 or Less 235 41.3
$10,001 to $20,000 155 27.2
$20,001 to $50,000 88 15.5Over $50,000 47 8.3
Don't Know 44 7.7Total 569 100.0Missing 57Total 626
Q11. Please indicate your YEARLY HOUSEHOLD income before any taxes (gross)_Recode.

Institute for Policy and Economic Development Demand for Accessible Type A Apartment Units
32
If Respondent Indicated Already Living in a Type A Apartment
Frequency Valid PercentYes 121 19.6No 497 80.4Total 618 100.0Missing 8Total 626
Q1. Do you (or someone you care for) currently live in a Type A apartment
Frequency Valid PercentHouse/Single Family Residence 36 31.0
Apartment 68 58.6
Condominium or Townhouse 7 6.0
Mobile Home 5 4.3Total 116 100.0Missing 5Total 121
Q7. Please select the option below that best describes where you currently live_Recode.
Frequency Valid PercentWest 11 9.6
Central 25 21.7
East 28 24.3
Mission Valley 29 25.2
Northeast 22 19.1Total 115 100.0Missing 6Total 121
Q8. Current Area_Recode
Frequency Valid PercentI live alone 8 7.0
Two 36 31.6
Three 28 24.6
Four 20 17.5Five 12 10.5
Six or more 10 8.8Total 114 100.0Missing 7Total 121
Q9. How many persons live in your household_Recode?
Frequency Valid Percent14 - 17 2 1.9
18 - 24 7 6.5
25 - 44 29 27.1
45 - 64 44 41.1
> 65 25 23.4Total 107 100.0Missing 14Total 121
Selected Age Cohorts
Frequency Valid Percent$10,000 or Less 52 44.8
$10,001 to $20,000 37 31.9
$20,001 to $50,000 11 9.5
Over $50,000 8 6.9Don't Know 8 6.9Total 116 100.0Missing 5Total 121
Q11. Please indicate your YEARLY HOUSEHOLD income before any taxes (gross)_Recode.

Institute for Policy and Economic Development Demand for Accessible Type A Apartment Units
33
If Respondent Indicated NOT Living in a Type A Apartment
If Respondent Would NOT Like to Live in a Type A Apartment Unit
Q6. What is the MAIN REASON you would NOT like to live in an apartment unit with wider doors and hallways, lower counters/cabinets, and a bathroom with a roll-in shower that has a permanent folding seat, grab bars, and a handheld showerhead.
Frequency Valid Percent
70 38.5
already live in apartment. Comfortable 1 .5
Ayuda de mi mama 1 .5
Because I already have a home - I would like all that in my home 1 .5
because I have my own home 1 .5
Because I'm fine where I am living right now 1 .5
because O think I'm good right now with the one i have 1 .5
buying my own home 1 .5
can't afford it 1 .5
cause people smoke too much 1 .5
client comfortable at her own home 1 .5
client owns his home don't have to paid rent. 1 .5
Cost of rent 1 .5
Disable 1 .5
Duena de mi casa 1 .5
Efficiency of space 1 .5
Estoy encapacitada 1 .5
Got a home already 1 .5
happy in townhome that io live in 1 .5
Have a home 1 .5
have house 1 .5
Frequency Valid PercentYes 289 61.4
No 182 38.6Total 471 100.0Missing 26Total 497
Q2. Would you (or someone you care for) like to live in a Type A apartment unit as described above?

Institute for Policy and Economic Development Demand for Accessible Type A Apartment Units
34
Have kids and rather live in a house 1 .5
have my home 2 1.1
have my own home 1 .5
Have never lived in an apartment have 2 girls 1 .5
Have to move 1 .5
housing very happy 1 .5
I currently live in a house 1 .5
I don't have an apartment of my own 1 .5
I don't need it. I live at home. 1 .5 I don't need one right now. My main need was a first-floor apartment and I cannot climb stairs and I have that already. 1 .5
I have a house here in El Paso 1 .5
I have a house rental 1 .5 I have home currently. if I would ever need to I would have to obtain that help 1 .5
I have my home 1 .5
I have my own home 1 .5
I have my own house 1 .5
I have several properties 1 .5
I live at my family's house and I had been at El Paso for 10 years. 1 .5
I live in my own home 2 1.1 i live in my own home equipped w/an ADA shower and my son has extra wide doors 1 .5
I live with my parents and they are fine with me living with them, but maybe a lot to ten or in the future 1 .5
I'm scheduled to graduate in Dec 2012 1 .5
In wheel chair my own home 1 .5
like where i am at 1 .5
live in own home with my family husband and son 1 .5
mi casa 13 7.1
mi casa propia 2 1.1
Mi hija cuidara a mi hijo si falto yo 1 .5
More amenities are great. I have no reason for not living in one. 1 .5
my home 2 1.1
n/a 1 .5
N/A 3 1.6
No me gusta vivir en apartamentos 1 .5
No me gustaria 1 .5
No no me gustaria vivir en un apartamento yo siempre e vivido en casa. 1 .5
no reason all is exaptable 1 .5
no reson 1 .5
No tengo intencion de dejar mi casa 1 .5
No vivo en apat 1 .5
own home 1 .5
Own home 2 1.1
own home comfortable (no rent) 1 .5

Institute for Policy and Economic Development Demand for Accessible Type A Apartment Units
35
Own home does not paid rent. 1 .5
own house (no rent) 1 .5
own my home 1 .5
Own my home, don't have to paid rent. 1 .5
Own my house 1 .5
owns her home 1 .5
Owns home. No rent to pay 1 .5
owns the house - no rent only taxes 1 .5
por que pueda que la renta suba mas 1 .5
porque 1 .5
porque asi esta bien todo 1 .5
Porque estoy pagando casa 1 .5
Porque tengo movile home 1 .5
Porque vivo en casa 1 .5
Porque vivo en una casa propia 1 .5
property owner 1 .5
propia casa 1 .5
Si me gustaria 1 .5
Si, pero no me lo van a dar 1 .5
Tenemos casa propia 1 .5
Tengo casa propia 1 .5
Tengo me casa propia 1 .5
Tengo mi casa 2 1.1
The move 1 .5
There is no reason I would not live in an apartment 1 .5
Tiene casa 1 .5
very happy in my rental now 1 .5
We live in a house and very comfortable surrounding 1 .5
We live in our own home 1 .5
wouldn't mind. 1 .5
Total 182 100.0
Frequency Valid PercentHave No Reason 1 1.0
Would not Like 3 2.9
Happy where they Live 9 8.7
Inconvenient (spece, costs, moving, etc) 9 8.7
Other 10 9.6
Home Owner/Living in a House 72 69.2Total 104 100.0
Q6._Recode
Frequency Valid PercentHouse/Single Family Residence 137 80.6
Apartment 24 14.1
Condominium or Townhouse 3 1.8
Mobile Home 6 3.5Total 170 100.0Missing 12Total 182
Q7. Please select the option below that best describes where you currently live.
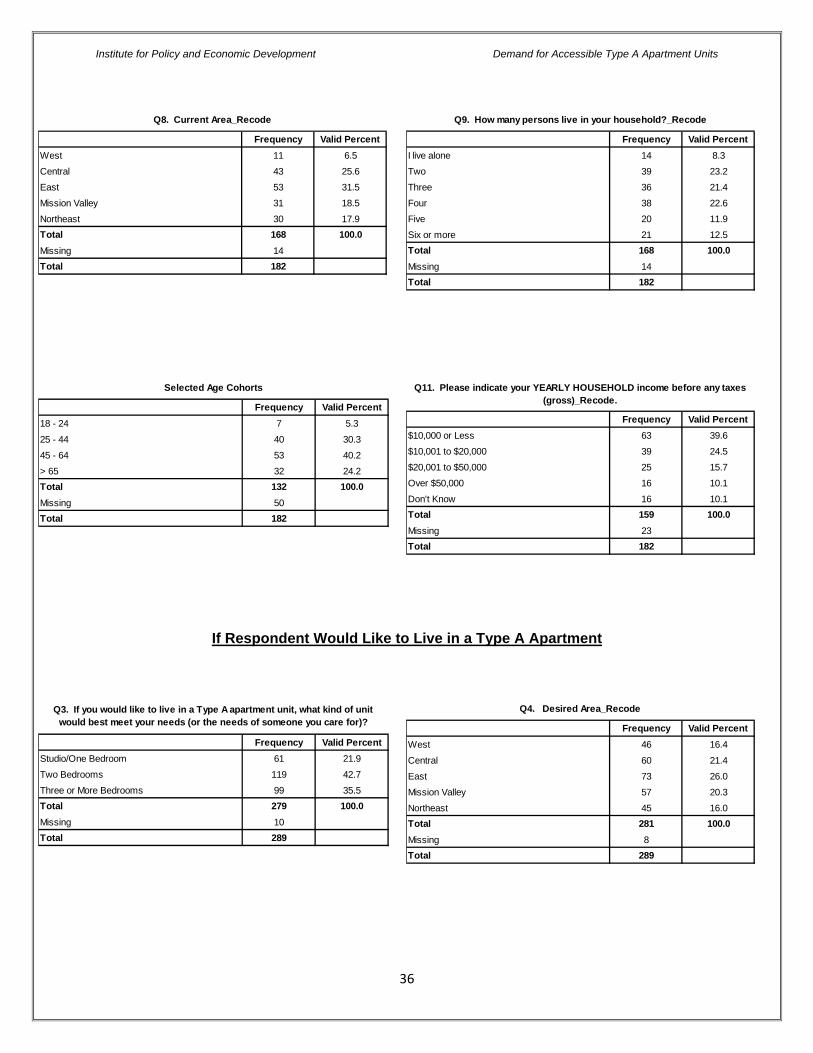
Institute for Policy and Economic Development Demand for Accessible Type A Apartment Units
36
If Respondent Would Like to Live in a Type A Apartment
Frequency Valid PercentWest 11 6.5
Central 43 25.6
East 53 31.5
Mission Valley 31 18.5
Northeast 30 17.9Total 168 100.0Missing 14Total 182
Q8. Current Area_Recode
Frequency Valid PercentI live alone 14 8.3
Two 39 23.2
Three 36 21.4
Four 38 22.6Five 20 11.9
Six or more 21 12.5Total 168 100.0Missing 14Total 182
Q9. How many persons live in your household?_Recode
Frequency Valid Percent18 - 24 7 5.3
25 - 44 40 30.3
45 - 64 53 40.2
> 65 32 24.2Total 132 100.0Missing 50Total 182
Selected Age Cohorts
Frequency Valid Percent$10,000 or Less 63 39.6
$10,001 to $20,000 39 24.5
$20,001 to $50,000 25 15.7
Over $50,000 16 10.1
Don't Know 16 10.1Total 159 100.0Missing 23Total 182
Q11. Please indicate your YEARLY HOUSEHOLD income before any taxes (gross)_Recode.
Frequency Valid PercentStudio/One Bedroom 61 21.9
Two Bedrooms 119 42.7
Three or More Bedrooms 99 35.5Total 279 100.0Missing 10Total 289
Q3. If you would like to live in a Type A apartment unit, what kind of unit would best meet your needs (or the needs of someone you care for)? Frequency Valid Percent
West 46 16.4
Central 60 21.4
East 73 26.0
Mission Valley 57 20.3
Northeast 45 16.0Total 281 100.0Missing 8Total 289
Q4. Desired Area_Recode

Institute for Policy and Economic Development Demand for Accessible Type A Apartment Units
37
Frequency Valid PercentLess than $100 3 1.4
$100 - $199 9 4.3$200 - $299 17 8.1
$300 - $399 29 13.9
$400 - $499 32 15.3
$500 - $599 54 25.8$600 - $699 28 13.4
$700 - $799 17 8.1
$800 - $899 9 4.3$1,000 or More 4 1.9
Don't Know 7 3.3Total 209 100.0Missing 80Total 289
How much rent would you be able and willing to pay for a Type A apartment unit?
Frequency Valid PercentHouse/Single Family Residence 161 57.9
Apartment 96 34.5
Condominium or Townhouse 7 2.5
Mobile Home 14 5.0Total 278 100.0Missing 11Total 289
Q7. Please select the option below that best describes where you currently live_Recode
Frequency Valid PercentWest 30 11.0
Central 64 23.4
East 70 25.6
Mission Valley 64 23.4
Northeast 45 16.5Total 273 100.0Missing 16Total 289
Q8. Area_Recode
Frequency Valid PercentI live alone 25 9.1
Two 48 17.4
Three 76 27.5
Four 50 18.1
Five 35 12.7
Six or more 42 15.2Total 276 100.0Missing 13Total 289
Q9. How many persons live in your household?_Recode
Frequency Valid Percent5 - 13 1 .4
18 - 24 19 7.8
25 - 44 95 38.8
45 - 64 90 36.7
> 65 40 16.3Total 245 100.0Missing 44Total 289
Selected Age Cohorts
Frequency Valid Percent$10,000 or Less 105 39.6
$10,001 to $20,000 74 27.9
$20,001 to $50,000 30 11.3
Over $50,000 14 5.3
Don't Know 18 6.8Total 265 100.0Missing 24Total 289
Q11. Please indicate your YEARLY HOUSEHOLD income before any taxes (gross)_Recode.

Institute for Policy and Economic Development Demand for Accessible Type A Apartment Units
38
AAppppeennddiixx EE Estimate of Type A Units in Private Multi-family Properties
Property Name Address City State Zip Code Estimated Type A Units
513 S Piedras St 513 S Piedras St El Paso TX 79905 16262 Trans Mountain Rd 6262 Trans Mountain Rd El Paso TX 79924 1
910 Texas Ave 910 Texas Ave El Paso TX 79901 1Acacia Park 5848 Acacia Cir El Paso TX 79912 10
Arrowhead Place 5051 Trojan Dr El Paso TX 79924 2Cambria 7990 Artcraft Dr El Paso TX 79932 3
Canyon Square 8622 North Loop El Paso TX 79907 5Castilleja 1531 George Dieter Dr El Paso TX 79936 13Cedar Oak Townhomes 1480 Cedar Oak El Paso TX 79936 8
Corona Del Valle 5453 Ridge St El Paso TX 79932 5Coronado Springs 5801 Silver Springs El Paso TX 79912 1
Desert Village at Brook Hollow 6027 Brook Hollow El Paso TX 79925 1Desert Villas 173 Coronado Rd El Paso TX 79915 4
Dieter Pines 3650 George Dieter Dr El Paso TX 79936 8Fairbanks Apartment Complex 5030 Fairbanks El Paso TX 79924 1Falvey Silva Senior Citizen 8615 San Juan Ln El Paso TX 79907 4
Franklin Place 600 Belvidere St El Paso TX 79912 5Huntington Park 12121 Pellicano Dr El Paso TX 79936 7
Independence Place 4011 Alabama El Paso TX 79930 19Jacquez 11275 Pebble Hills El Paso TX 79936 1
La Jolla Place 9010 Betel El Paso TX 79907 1Las Mansiones 1500 Bob Hope Dr El Paso TX 79936 10Las Norias 2170 Trawood El Paso TX 79938 5
Las Torres Apartments 12130 Pebble Hills Blvd El Paso TX 79936 5Las Ventanas 2000 Saul Kleinfiled El Paso TX 79936 11
Magoffin Park Villas 900 Myrtle El Paso TX 79901 5Mccombs Apartments 10626 McCombs St El Paso TX 79924 1
Meadowbrook TH 11520 Vista del Sol El Paso TX 79936 2Mesa Place 5450 Suncrest El Paso TX 79912 7Montecillo 5001 N Mesa El Paso TX 79912 9
Mountain Heights 3575 Lincoln El Paso TX 79930 4Mountain Vista Apartments 5757 Will Ruth El Paso TX 79924 8
NCDO II 5250 Wren El Paso TX 79924 2North Hill Village 4495 Jon Cunningham El Paso TX 79934 6
North Mountain Village 9435 Diana El Paso TX 79924 10Paseo Palms 910 Sunfire St El Paso TX 79938 1Patriot Hills 5725 Fairbanks El Paso TX 79924 3
Project Vida Cd 3501 E San Antonio Ave El Paso TX 79905 1Project Vida Cd (Alameda) 3319 Alameda El Paso TX 79905 2
Project Vida Cd (Durazno) 4325 Durazno El Paso TX 79905 2Project Vida Cd (Frutas) 3030 Frutas El Paso TX 79905 1Project Vida Cd (Maxwell) 4703 Maxwell El Paso TX 79904 1
Project Vida Cd (Rivera) 3608 Rivera El Paso TX 79905 2Project Vida Cd (Sambrano) 6719 Sambrano El Paso TX 79905 1

Institute for Policy and Economic Development Demand for Accessible Type A Apartment Units
39
Estimate of Type A Units in Private Multi-family Properties (Continued)
Project Vida Cd (Stevens) 176 S Stevens El Paso TX 79905 4
Project Vida Cd (Valencia) 111 N Valencia El Paso TX 79905 1Puerta Villa 12220 Pellicano El Paso TX 79936 15Puerta Villa at Cimarron 1600 N Resler El Paso TX 79911 13
Spanish Creek Townhomes 610 Lee Trevino El Paso TX 79907 7Stiles Gardens 7130 North Loop El Paso TX 79915 1
Summerstone 1411 Bob Hope El Paso TX 79936 4The Bungalows at Hueco Estates 3700 Hueco Valley Dr El Paso TX 79938 25The Bungalows At North Hills 4649 Loma del Sur El Paso TX 79934 17
The Cottages At Edgemere 14363 Edgemere Blvd El Paso TX 79938 8The Legends Of El Paso 200 Desert Pass El Paso TX 79912 12The Meridian 2140 N Zaragoza El Paso TX 79936 7
The Patriot 4600 Fairbanks El Paso TX 79924 16The Phoenix 7401 Phoenix El Paso TX 79915 13
The Reserve At Sandstone Ranch 11200 Sean Haggerty Dr El Paso TX 79934 12The Tuscany 415 S Mesa Hills Dr El Paso TX 79912 12Title 811 Apartments 2155 Wedgewood Dr El Paso TX 79925 1
Van Horne Estates 11610 Dyer El Paso TX 79934 20Villas At Helen Of Troy 1325 Northwestern El Paso TX 79912 3
Villas At Spanish Creek 620 Lee Trevino El Paso TX 79907 1
Total 392Sources: "ADA Audit," 2009, City of El Paso; "Public Housing UFAS Unit Audit List," July 2012, Housing Authority of the City of El Paso; "Apartment Boom in El Paso Continues", Kolenc, Vic, El Paso Times, 2011; Building Permits Data (2009 - Sep 2012), City of El Paso.

Institute for Policy and Economic Development Demand for Accessible Type A Apartment Units
40
AAppppeennddiixx FF Estimate of Type A Units in Public Housing
Property Name Address City State Zip Code Estimated Type A Units
Alamito 508 South Virginia El Paso TX 79901 15Aloysius A. Ochoa, S.J. 8820 Old County Road El Paso TX 79907 4
Ambrosio Guillen 1108 S Campbell El Paso TX 79901 1Bienvivir Parkside Sr C 11530 Vista del Sol Dr El Paso TX 79936 3
Chas E. Graham 8640 San Juan El Paso TX 79907 3Chelsea Plaza 600 Chelsea El Paso TX 79905 16
Dwight D. Eisenhower 5628 Eisenhower El Paso TX 79924 9Edward M. Pooley 201 Cortez El Paso TX 79905 6
Everett Alvarez, Jr. 8247 North Loop El Paso TX 79907 1Father Carlos Pinto Memorial 1001 South Ochoa El Paso TX 79901 5
Franklin D. Roosevelt 4647 Maxwell El Paso TX 79904 2Fred Hervey 4949 Alps El Paso TX 79904 5George W. Baines 10700 Vista Del Sol El Paso TX 79935 4
George Webber Memorial 110 Whittier El Paso TX 79907 1Haymon Krupp Memorial 10200 Hedgerow El Paso TX 79925 2
Henry Cisneros 5200 Lou Brock El Paso TX 79934 2Herb Tio Cooper 5301 Suncrest El Paso TX 79912 3
Hillary J. Sandoval, Jr. 5353 Ridge El Paso TX 79932 3John C. Cramer 184 Barker Road El Paso TX 79915 7
Juan Hart Memorial 4861 Atlas El Paso TX 79904 2Judson Williams 314 Resler El Paso TX 79912 3Kathy White Memorial 2500 Mobile Avenue El Paso TX 79930 1
Kennedy Brothers Memorial 447 S. Schutz El Paso TX 79907 12Kennedy Estates Subdivision 400 South Zaragoza El Paso TX 79907 7
Lee Seniors 2965 Lee Blvd El Paso TX 79935 4Lt. Palmer Baird Memorial 4747 Atlas Drive El Paso TX 79904 2
Lyndon B. Johnson 9000 Roanoke El Paso TX 79904 5Munoz Manor 10040 Audobon El Paso TX 79924 8
Paisano Apartments 4000 E Paisano Dr El Paso TX 79905 9Peter Dewetter 212 Lisbon El Paso TX 79905 6Peter Dewetter Estates 617 Feliz El Paso TX 79905 1
Rafael Marmolejo, Jr. 600 North Carolina El Paso TX 79915 6Raymond Telles Manor 8791 Buena Park Dr El Paso TX 79907 1
Rio Grande 212 Lisbon El Paso TX 79905 2Ruben Salazar 311 South Eucalyptus El Paso TX 79905 3
Rudy G. Henderson 9401 Stonewall El Paso TX 79924 6Sherman Plaza 4528 Blanco El Paso TX 79905 11
Sitgraves Manor 10100 Hedgerow El Paso TX 79925 6Sun Plaza 1221 San Antonio El Paso TX 79901 10Tays 2174 Magoffin El Paso TX 79901 11
Thomas Westfall 10661 Vista del Sol El Paso TX 79935 6Valle Verde 224 Ascarate El Paso TX 79905 3

Institute for Policy and Economic Development Demand for Accessible Type A Apartment Units
41
Estimate of Type A Units in Public Housing (Continued)
Villa Alegre Apartments 6412 Edgemere El Paso TX 79925 18
Western Eastside 2975 Lee Blvd El Paso TX 79936 2
Western Redd 610 E Redd El Paso TX 79912 2
Western Yarbrough 625 S Yarbrough El Paso TX 79915 6
Total 245Sources: "ADA Audit," 2009, City of El Paso; "Public Housing UFAS Unit Audit List," July 2012, Housing Authority of the City of El Paso;

Institute for Policy and Economic Development Demand for Accessible Type A Apartment Units
42
AAppppeennddiixx GG 2012 Survey of Type A Accessible Multi-family Dwelling Units – English
The Institute for Policy and Economic Development at UTEP is conducting a short survey about the availability of ADA Type A accessible dwelling units in apartment complexes. Your participation in this survey is completely voluntary and all answers will be kept confidential. This questionnaire should be answered by the apartment manager or decision maker. Your feedback is very valuable to better understand the current market conditions of ADA Type A accessible dwelling units. This survey should take less than five minutes of your time to complete. Please complete this survey and return it in the postage-paid envelope. If you have any questions regarding this survey, please contact Roberto Tinajero at 747-5096 or at [email protected]
Your time and participation in this effort are greatly appreciated!
1. Please indicate the year in which this apartment complex was built. __________________
2. Please indicate the total number of units in this apartment complex. __________________
3. In general, an apartment unit is considered “accessible” if it has routes and doorways throughout that are usable by a person in a wheelchair, grab bars or reinforced walls in the bathrooms, lower counters, and reachable light switches, outlets, and controls. Please indicate the number of units in this apartment complex that you consider to be accessible. _________
4. In general, Type A accessible apartment units must have bathtubs and showers with a permanent seat against the wall or a removable in-tub or in-shower seat. In addition, they must have showerheads mounted on an adjustable vertical bar with a hose.
Please provide the following information about the units in this apartment complex that meet the Type A characteristics described above.
Number of Type A Units in
this Complex Number of Type A Units
Rented/Occupied Average Monthly Rent
for these Units
Studio / One bedroom
__________________
__________________
__________________
Two Bedrooms
__________________
__________________
__________________
Three or more Bedrooms
__________________
__________________
__________________
Thank you for your participation!
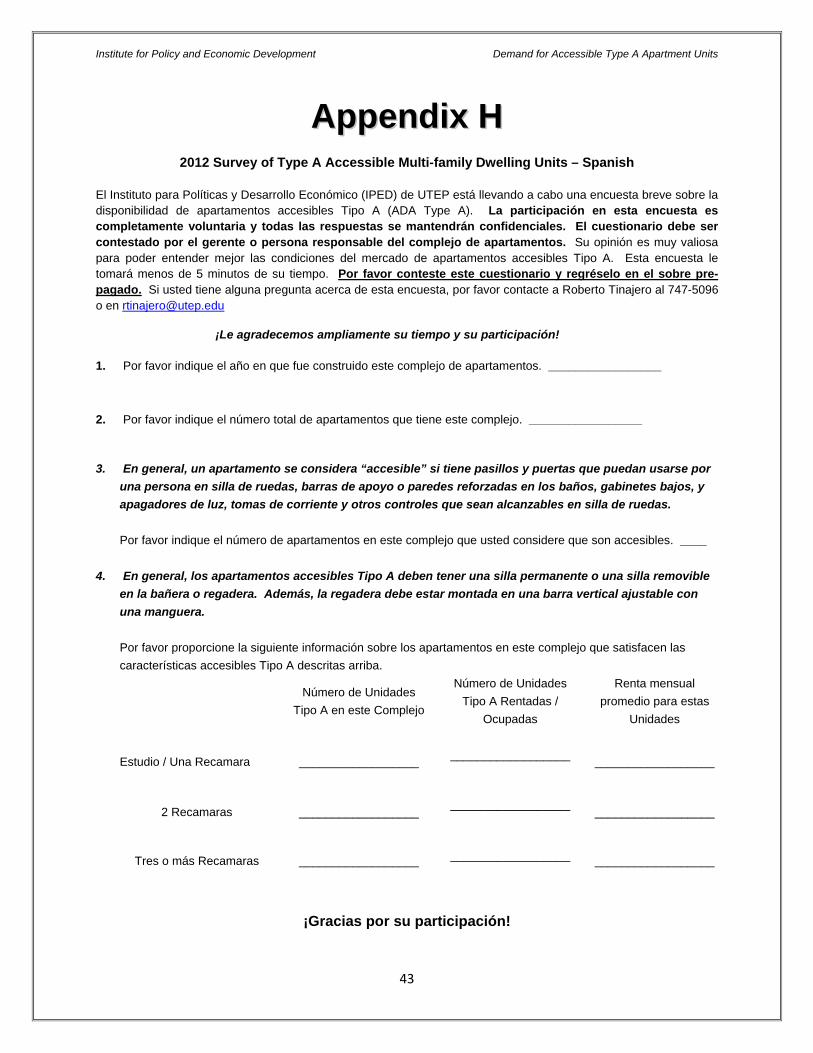
Institute for Policy and Economic Development Demand for Accessible Type A Apartment Units
43
AAppppeennddiixx HH 2012 Survey of Type A Accessible Multi-family Dwelling Units – Spanish
El Instituto para Políticas y Desarrollo Económico (IPED) de UTEP está llevando a cabo una encuesta breve sobre la disponibilidad de apartamentos accesibles Tipo A (ADA Type A). La participación en esta encuesta es completamente voluntaria y todas las respuestas se mantendrán confidenciales. El cuestionario debe ser contestado por el gerente o persona responsable del complejo de apartamentos. Su opinión es muy valiosa para poder entender mejor las condiciones del mercado de apartamentos accesibles Tipo A. Esta encuesta le tomará menos de 5 minutos de su tiempo. Por favor conteste este cuestionario y regréselo en el sobre pre-pagado. Si usted tiene alguna pregunta acerca de esta encuesta, por favor contacte a Roberto Tinajero al 747-5096 o en [email protected]
¡Le agradecemos ampliamente su tiempo y su participación!
1. Por favor indique el año en que fue construido este complejo de apartamentos. _________________
2. Por favor indique el número total de apartamentos que tiene este complejo. _________________
3. En general, un apartamento se considera “accesible” si tiene pasillos y puertas que puedan usarse por una persona en silla de ruedas, barras de apoyo o paredes reforzadas en los baños, gabinetes bajos, y apagadores de luz, tomas de corriente y otros controles que sean alcanzables en silla de ruedas. Por favor indique el número de apartamentos en este complejo que usted considere que son accesibles. ____
4. En general, los apartamentos accesibles Tipo A deben tener una silla permanente o una silla removible en la bañera o regadera. Además, la regadera debe estar montada en una barra vertical ajustable con una manguera. Por favor proporcione la siguiente información sobre los apartamentos en este complejo que satisfacen las características accesibles Tipo A descritas arriba.
Número de Unidades
Tipo A en este Complejo
Número de Unidades Tipo A Rentadas /
Ocupadas
Renta mensual promedio para estas
Unidades
Estudio / Una Recamara
__________________
__________________
__________________
2 Recamaras
__________________
__________________
__________________
Tres o más Recamaras
__________________
__________________
__________________
¡Gracias por su participación!

Institute for Policy and Economic Development Demand for Accessible Type A Apartment Units
44
AAppppeennddiixx II
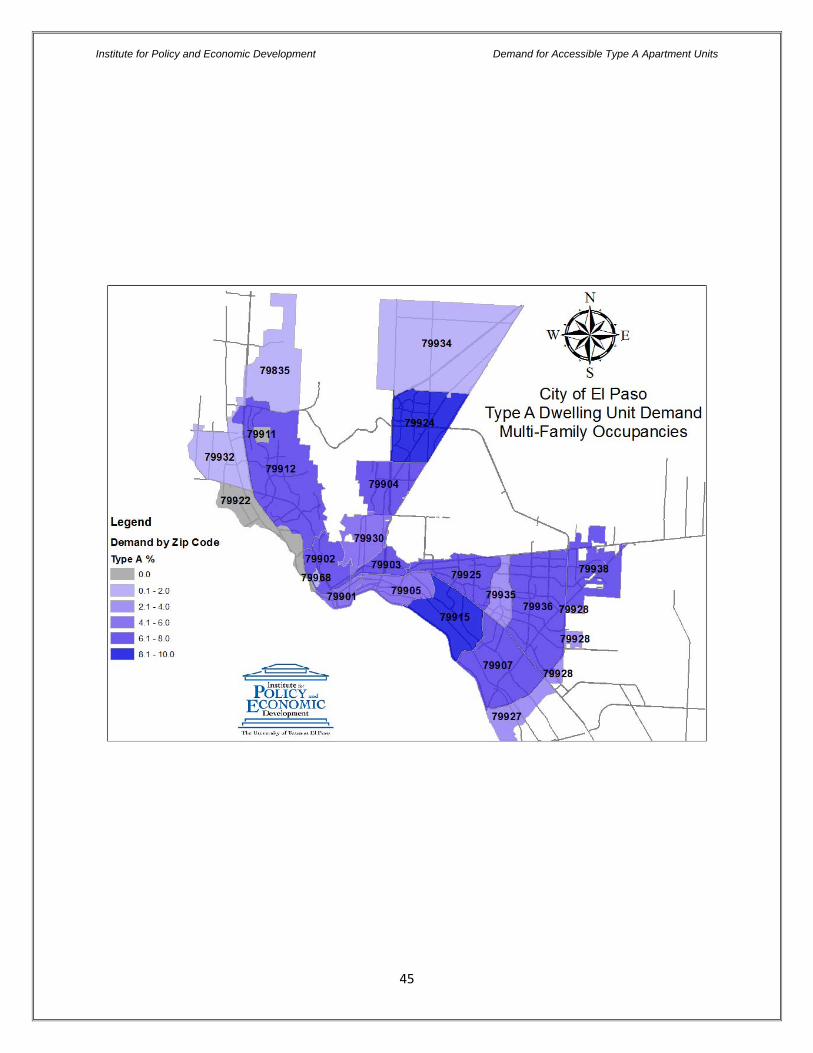
Institute for Policy and Economic Development Demand for Accessible Type A Apartment Units
45

Institute for Policy and Economic Development Demand for Accessible Type A Apartment Units
46
AAppppeennddiixx JJ

Institute for Policy and Economic Development Demand for Accessible Type A Apartment Units
47

City Development Department
International Building Code
Title 18.08 Amendment
Accessibility Requirements
May, 2013

City Development Department
Background
• April 2011 City Council was presented an
Analysis of Impediments (AI) – Council to seek
agency to determine availability and gap of Type
A units
• March 13, 2012 Contract awarded to IPED
• February 26, 2013 Presentation by IPED to City
Council

City Development Department
Title 18.08 - Section 1107.6.2.1.1 Type A units
(Amended).
In Group R-2 occupancies containing more than four
(4) dwelling units or sleeping units, at least three (3)
percent but not less than one of the units shall be a
Type A unit. All units on a site shall be considered to
determine the total number of units and the required
number of Type A units.
City Development Department
IBC - Section 1107.6.2.1.1 Type A units.
In Group R-2 occupancies containing more than 20
dwelling units or sleeping units, at least 2 percent but
not less than one of the units shall be a Type A unit.
All R-2 units on a site shall be considered to
determine the total number of units and the required
number of Type A units. Type A units shall be
dispersed among the various classes of units.

City Development Department
IPED Summary
• The three percent accessibility Type A requirement
for multi-family apartment units is higher and more
stringent than its counterparts when compared to
similar urban centers in the Southwest.
• Supply and demand for commercial accessible Type
A apartment units seem not far apart considering
levels of rent, apartment size needs, family roles, and
household income levels.

City Development Department
• Based on these series of analyses, it appears that the
current Type A accessibility requirement of three percent
is appropriate to meet the estimated potential demand.

City Development Department
Questions