DEM Pre Processing for Efficient Watershed Delineation
14
DEM Preprocessing for Efficient Watershed Delineation Dean Djokic and Zichuan Ye Esri Redlands, California Abstract GIS is widely used to support water quantity and quality studies. GIS and digital elevation models (DEM) can be used to perform watershed delineation to a point, a reach, or an area of interest, which is usually one of the first steps in such studies. This paper presents the methodology that preprocesses the DEM in order to facilitate interact ive watershed delineation. As a result, watersheds can be delineated quickly and with consistent time response, regardless of the DEM size, or the size of the resulting watershed. This methodology is used as a basis for interactive basin development in GIS tools for HMS model support. Introduction Watershed delineation is one o f the most co mmonly performed activities in hydrologic and environmental analyses. Digital elevation models (DEM) provide good terrain representation from which the watersheds can be derived automatically using GIS technology. The techniques for automated watershed delineation have been available since mid-eighties and have been implemented in various GIS systems and custom applications (Garbrecht and Martz, 1999). These techniques are independent of the DEM resolution and their use is becoming more popular with the advent of higher resolution DEMs that allow more and more detailed terrain representat ion and analysis. Another important role in attractiveness of these techniques is the increase in desktop co mputing power that allows complex operations involved in this process to be performed locally and fast enough. These two factors together with the increased emphasis in industry for watershed-wide solutions are placing increasing demands on the automated systems to provide the results quickly. In general, the traditional approach in automated watershed delineation required high-end GIS and often resulted in long processing times (hours) and times that varied with respect to the location of the point of interest (Perez, 1999). For example, if the point o f interest was close to the overall watershed boundary, the processing time would be faster than if that point was close to the watershed outlet. This was not conducive to interactive use of the methodology and limited its use to GIS shops. It also limited overall use of the methodology since the end users (people needing the watershed boundaries) were not willing to wait sometimes for days to get results from the GIS group (and then realize that some other points would be of interest and then have to wait for few more days for the results). This paper presents the methodology for DEM preprocessing that provides the basis for fast (sub -minute) and consistent watershed delineation on DEMs of any resolution and size using desktop GIS te chnology. This methodology will be referred to as Fast Watershed Delineation method (FWD). It has been initially developed in 1997 (Djokic et al., 1997) as part of the watershed delineation project developed for the Texas Natural Resource Conservation Commission.
-
Upload
vikaskamal -
Category
Documents
-
view
225 -
download
0
Transcript of DEM Pre Processing for Efficient Watershed Delineation
8/3/2019 DEM Pre Processing for Efficient Watershed Delineation
http://slidepdf.com/reader/full/dem-pre-processing-for-efficient-watershed-delineation 1/14
DEM Preprocessing for Efficient Watershed Delineation
Dean Djokic and Zichuan Ye
Esri
Redlands, California
Abstract
GIS is widely used to support water quantity and quality studies. GIS and digital elevation models (DEM) can be
used to perform watershed delineation to a point, a reach, or an area of interest, which is usually one of the first steps
in such studies. This paper presents the methodology that preprocesses the DEM in order to facilitate interactive
watershed delineation. As a result, watersheds can be delineated quickly and with consistent time response,
regardless of the DEM size, or the size of the resulting watershed. This methodology is used as a basis for
interactive basin development in GIS tools for HMS model support.
Introduction
Watershed delineation is one of the most commonly performed activities in hydrologic and environmental analyses.
Digital elevation models (DEM) provide good terrain representation from which the watersheds can be derived
automatically using GIS technology. The techniques for automated watershed delineation have been available since
mid-eighties and have been implemented in various GIS systems and custom applications (Garbrecht and Martz,
1999).
These techniques are independent of the DEM resolution and their use is becoming more popular with the advent of
higher resolution DEMs that allow more and more detailed terrain representation and analysis. Another importantrole in attractiveness of these techniques is the increase in desktop computing power that allows complex operations
involved in this process to be performed locally and fast enough. These two factors together with the increased
emphasis in industry for watershed-wide solutions are placing increasing demands on the automated systems to
provide the results quickly.
In general, the traditional approach in automated watershed delineation required high-end GIS and often resulted in
long processing times (hours) and times that varied with respect to the location of the point of interest (Perez, 1999).
For example, if the point of interest was close to the overall watershed boundary, the processing time would be
faster than if that point was close to the watershed outlet. This was not conducive to interactive use of the
methodology and limited its use to GIS shops. It also limited overall use of the methodology since the end users
(people needing the watershed boundaries) were not willing to wait sometimes for days to get results from the GIS
group (and then realize that some other points would be of interest and then have to wait for few more days for the
results).
This paper presents the methodology for DEM preprocessing that provides the basis for fast (sub-minute) and
consistent watershed delineation on DEMs of any resolution and size using desktop GIS technology. This
methodology will be referred to as Fast Watershed Delineation method (FWD). It has been initially developed in
1997 (Djokic et al., 1997) as part of the watershed delineation project developed for the Texas Natural Resource
Conservation Commission.
8/3/2019 DEM Pre Processing for Efficient Watershed Delineation
http://slidepdf.com/reader/full/dem-pre-processing-for-efficient-watershed-delineation 2/14
FWD Methodology
The FWD methodology is based on the following key factors:
1. The derived terrain properties (flow direction, flow accumulation, etc.) do not change unless the DEM
changes, and are not a function of watershed delineation for any particular point, but rather of the DEM
itself and thus do not have to (and should not) be linked to the individual watershed delineation operation.2. The time needed to delineate a watershed is a function of the grid (DEM) size – the more cells in a grid, the
longer will be the processing time, and vice versa.
3. The key property of a watershed boundary is that it completely and uniquely defines the area from which
the (surface) water drains to the watershed outlet. Any point outside of that area does not contribute to the
flow at the outlet point, and thus is not of direct interest for problems related to that watershed.
The FWD methodology consists of two preprocessing steps and a technique for using the preprocessed data. They
will be described in the following sections.
Step 1 - Determination of derived DEM properties
In this step the key terrain derivatives (flow direction and flow accumulation grids based on the elevatioin grid) arecomputed and saved, so when needed for individual watershed delineation they do not have to be computed again,
but are directly accessed. This means that these operations need to be performed only once for a given DEM (if
DEM changes, then these operations need to be repeated). This also allows the computations to be performed at a
different computer than the one on which the watershed delineation will be performed. Since these computations are
some of the most resource intensive, they can be delegated to the most powerful (or dedicated) machines. Once the
processing is done, the results can be sent to other machines where the less intensive (and more interactive)
operations will be performed.
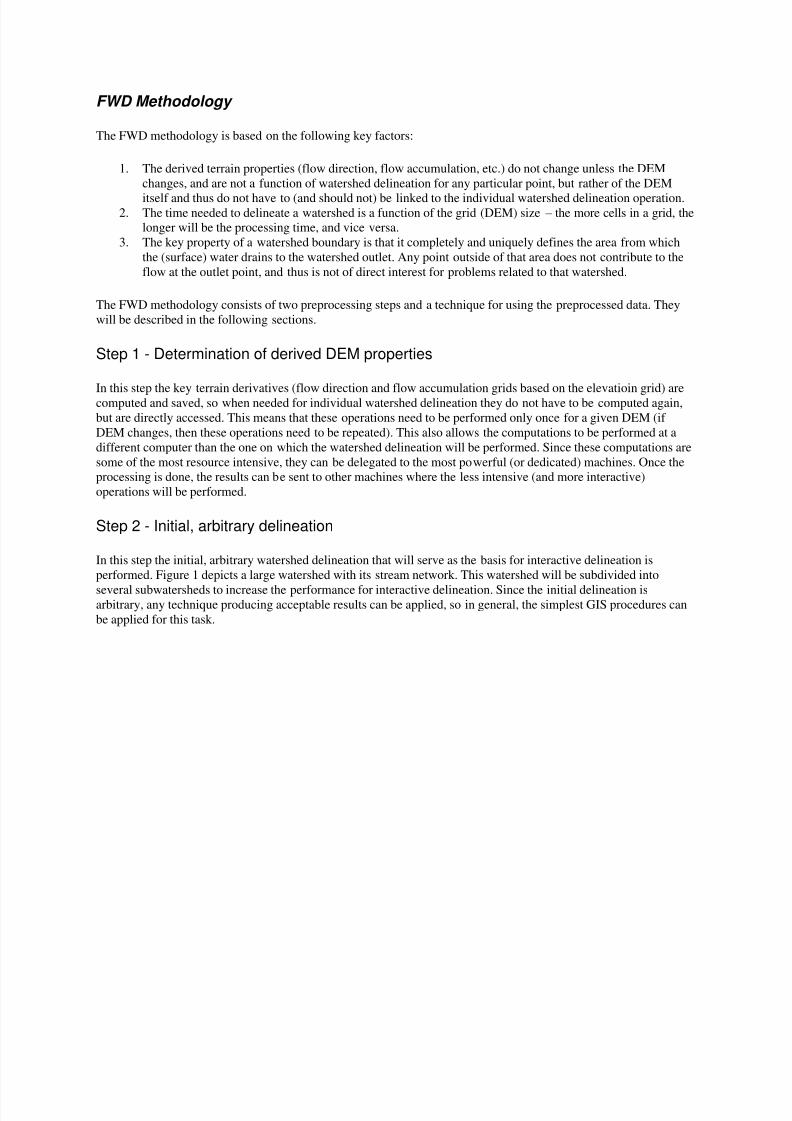
Step 2 - Initial, arbitrary delineation
In this step the initial, arbitrary watershed delineation that will serve as the basis for interactive delineation is
performed. Figure 1 depicts a large watershed with its stream network. This watershed will be subdivided into
several subwatersheds to increase the performance for interactive delineation. Since the initial delineation isarbitrary, any technique producing acceptable results can be applied, so in general, the simplest GIS procedures can
be applied for this task.
8/3/2019 DEM Pre Processing for Efficient Watershed Delineation
http://slidepdf.com/reader/full/dem-pre-processing-for-efficient-watershed-delineation 3/14
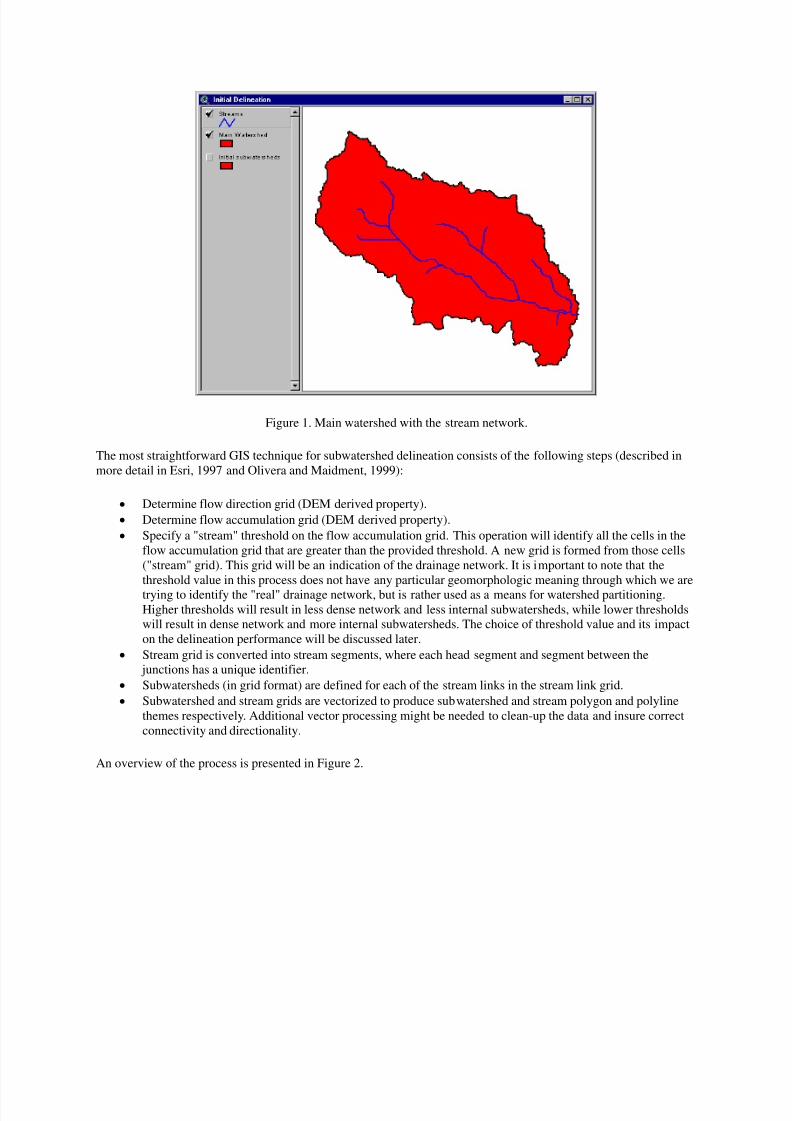
Figure 1. Main watershed with the stream network.
The most straightforward GIS technique for subwatershed delineation consists of the following steps (described in
more detail in Esri, 1997 and Olivera and Maidment, 1999):
Determine flow direction grid (DEM derived property).
Determine flow accumulation grid (DEM derived property).
Specify a "stream" threshold on the flow accumulation grid. This operation will identify all the cells in the
flow accumulation grid that are greater than the provided threshold. A new grid is formed from those cells
("stream" grid). This grid will be an indication of the drainage network. It is important to note that the
threshold value in this process does not have any particular geomorphologic meaning through which we are
trying to identify the "real" drainage network, but is rather used as a means for watershed partitioning.
Higher thresholds will result in less dense network and less internal subwatersheds, while lower thresholds
will result in dense network and more internal subwatersheds. The choice of threshold value and its impact
on the delineation performance will be discussed later.
Stream grid is converted into stream segments, where each head segment and segment between the
junctions has a unique identifier.
Subwatersheds (in grid format) are defined for each of the stream links in the stream link grid.
Subwatershed and stream grids are vectorized to produce subwatershed and stream polygon and polyline
themes respectively. Additional vector processing might be needed to clean-up the data and insure correct
connectivity and directionality.
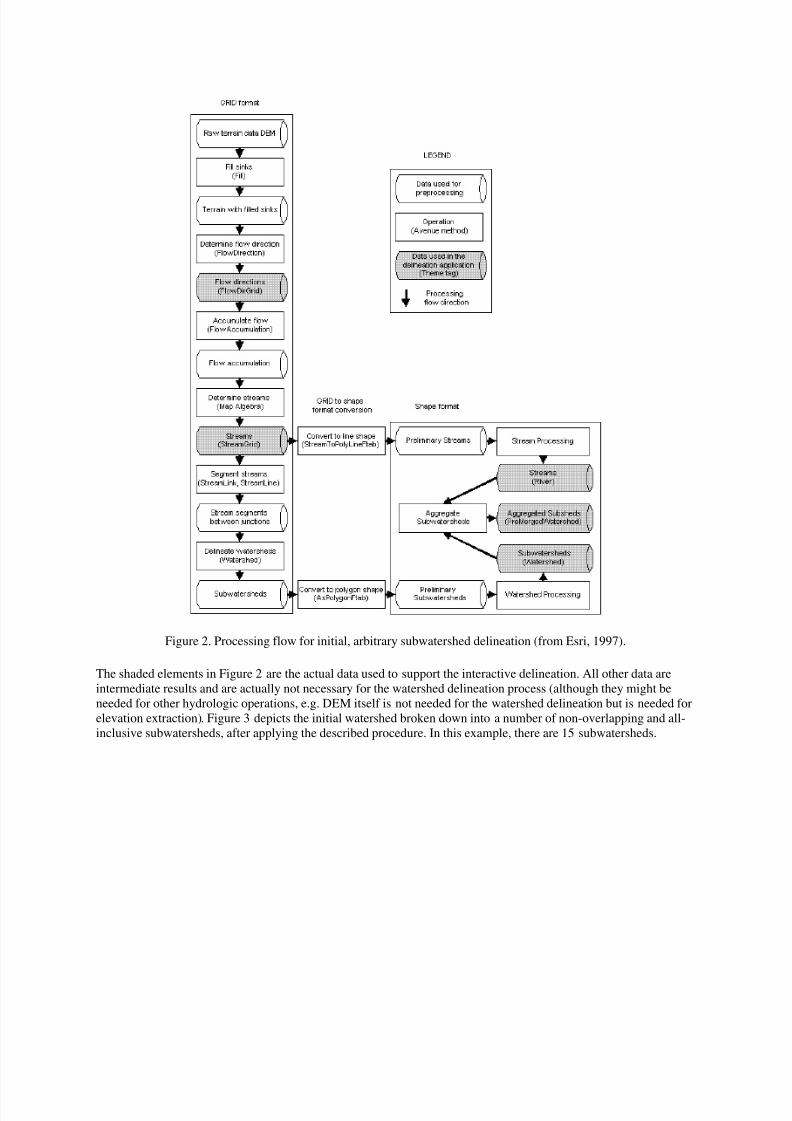
An overview of the process is presented in Figure 2.
8/3/2019 DEM Pre Processing for Efficient Watershed Delineation
http://slidepdf.com/reader/full/dem-pre-processing-for-efficient-watershed-delineation 4/14
Figure 2. Processing flow for initial, arbitrary subwatershed delineation (from Esri, 1997).
The shaded elements in Figure 2 are the actual data used to support the interactive delineation. All other data are
intermediate results and are actually not necessary for the watershed delineation process (although they might be
needed for other hydrologic operations, e.g. DEM itself is not needed for the watershed delineation but is needed for
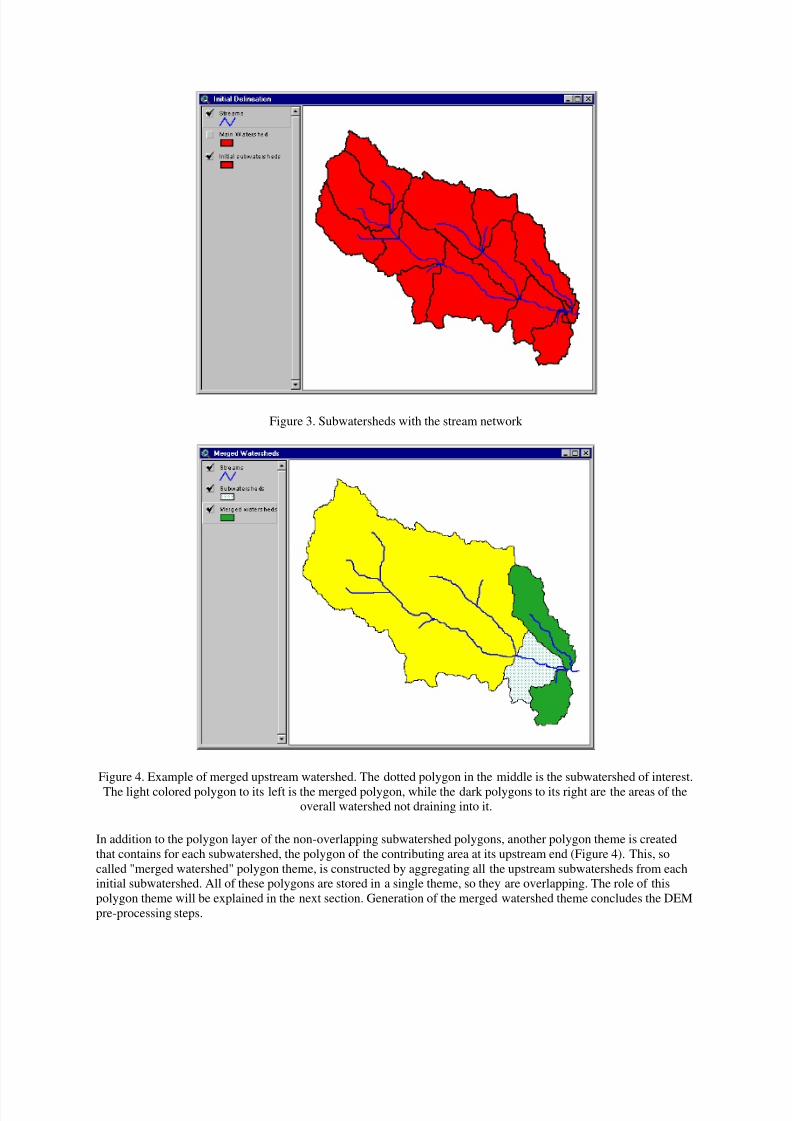
elevation extraction). Figure 3 depicts the initial watershed broken down into a number of non-overlapping and all-
inclusive subwatersheds, after applying the described procedure. In this example, there are 15 subwatersheds.
8/3/2019 DEM Pre Processing for Efficient Watershed Delineation
http://slidepdf.com/reader/full/dem-pre-processing-for-efficient-watershed-delineation 5/14
Figure 3. Subwatersheds with the stream network
Figure 4. Example of merged upstream watershed. The dotted polygon in the middle is the subwatershed of interest.
The light colored polygon to its left is the merged polygon, while the dark polygons to its right are the areas of the
overall watershed not draining into it.
In addition to the polygon layer of the non-overlapping subwatershed polygons, another polygon theme is created
that contains for each subwatershed, the polygon of the contributing area at its upstream end (Figure 4). This, so
called "merged watershed" polygon theme, is constructed by aggregating all the upstream subwatersheds from each
initial subwatershed. All of these polygons are stored in a single theme, so they are overlapping. The role of this
polygon theme will be explained in the next section. Generation of the merged watershed theme concludes the DEM
pre-processing steps.
8/3/2019 DEM Pre Processing for Efficient Watershed Delineation
http://slidepdf.com/reader/full/dem-pre-processing-for-efficient-watershed-delineation 6/14
Both the initial delineation and the upstream watershed merging are a one-time operation, and can be performed
independently from the actual watershed delineation similarly to the determinations of derived DEM properties. It is
suggested that these operations (or at least the grid processing operations) be performed at GIS shops that are
equipped for large data processing and have extensive experience in DEM manipulation for hydrologic purposes.
The processed data can then be published for use by general users who can skip many of the preprocessing tasks and
be assured of the quality of the published work. Examples of such datasets are the Oklahoma 1:100,000 scale DEM
(Cederstrand and Rea, 1995) and HYDRO 1K Elevation Derivative Database (USGS, et al.).
The preprocessed data can be hidden from the end user if necessary. Usually at least the stream network and the
overall watershed boundary is displayed to provide the user with a visual reference, but other sources can be used
for that purpose as well (such as DOQQs or scanned and georeferenced topo maps).
Technique for individual watershed delineation
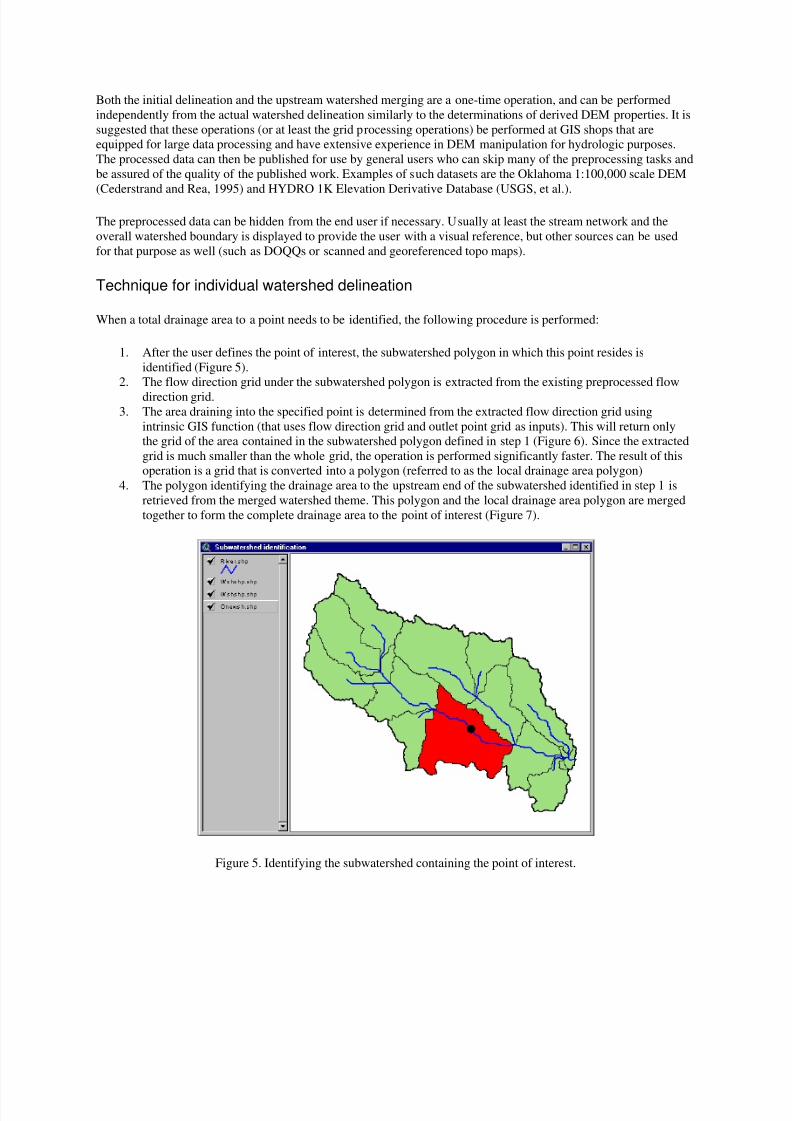
When a total drainage area to a point needs to be identified, the following procedure is performed:
1. After the user defines the point of interest, the subwatershed polygon in which this point resides is
identified (Figure 5).
2. The flow direction grid under the subwatershed polygon is extracted from the existing preprocessed flow
direction grid.3. The area draining into the specified point is determined from the extracted flow direction grid using
intrinsic GIS function (that uses flow direction grid and outlet point grid as inputs). This will return only
the grid of the area contained in the subwatershed polygon defined in step 1 (Figure 6). Since the extracted
grid is much smaller than the whole grid, the operation is performed significantly faster. The result of this
operation is a grid that is converted into a polygon (referred to as the local drainage area polygon)
4. The polygon identifying the drainage area to the upstream end of the subwatershed identified in step 1 is
retrieved from the merged watershed theme. This polygon and the local drainage area polygon are merged
together to form the complete drainage area to the point of interest (Figure 7).
Figure 5. Identifying the subwatershed containing the point of interest.
8/3/2019 DEM Pre Processing for Efficient Watershed Delineation
http://slidepdf.com/reader/full/dem-pre-processing-for-efficient-watershed-delineation 7/14
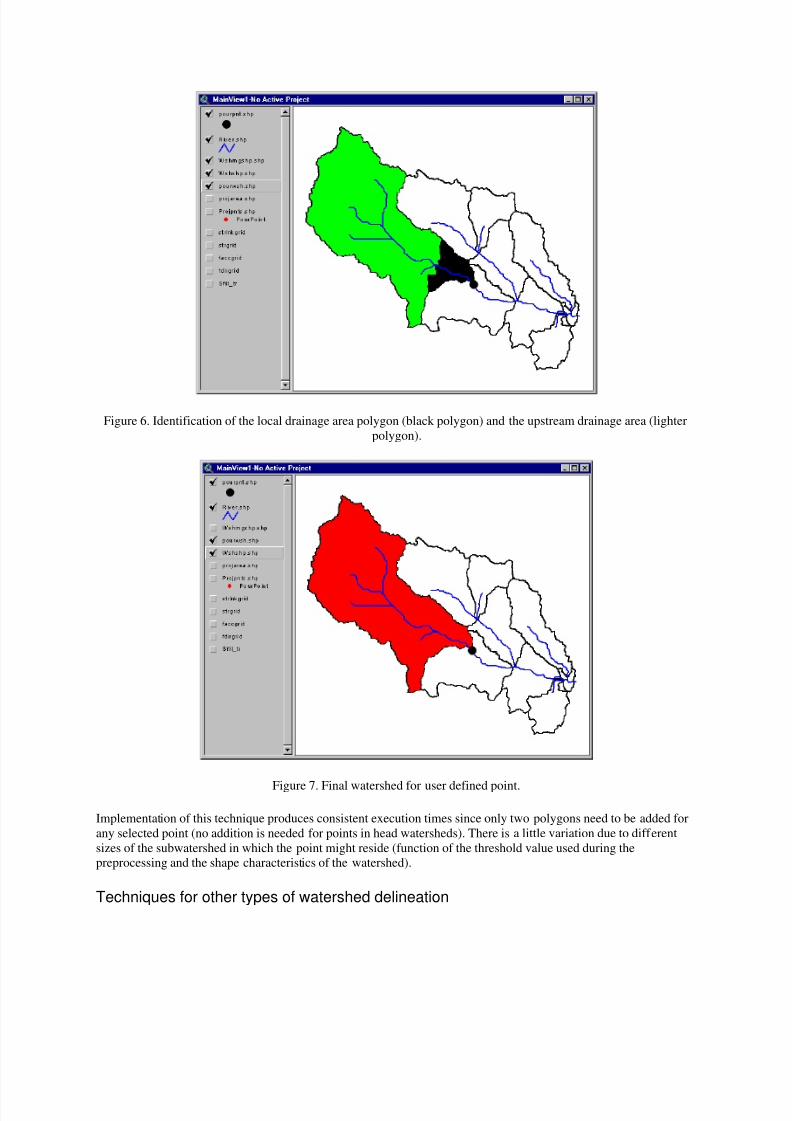
Figure 6. Identification of the local drainage area polygon (black polygon) and the upstream drainage area (lighter
polygon).
Figure 7. Final watershed for user defined point.
Implementation of this technique produces consistent execution times since only two polygons need to be added for
any selected point (no addition is needed for points in head watersheds). There is a little variation due to different
sizes of the subwatershed in which the point might reside (function of the threshold value used during the
preprocessing and the shape characteristics of the watershed).
Techniques for other types of watershed delineation
8/3/2019 DEM Pre Processing for Efficient Watershed Delineation
http://slidepdf.com/reader/full/dem-pre-processing-for-efficient-watershed-delineation 8/14
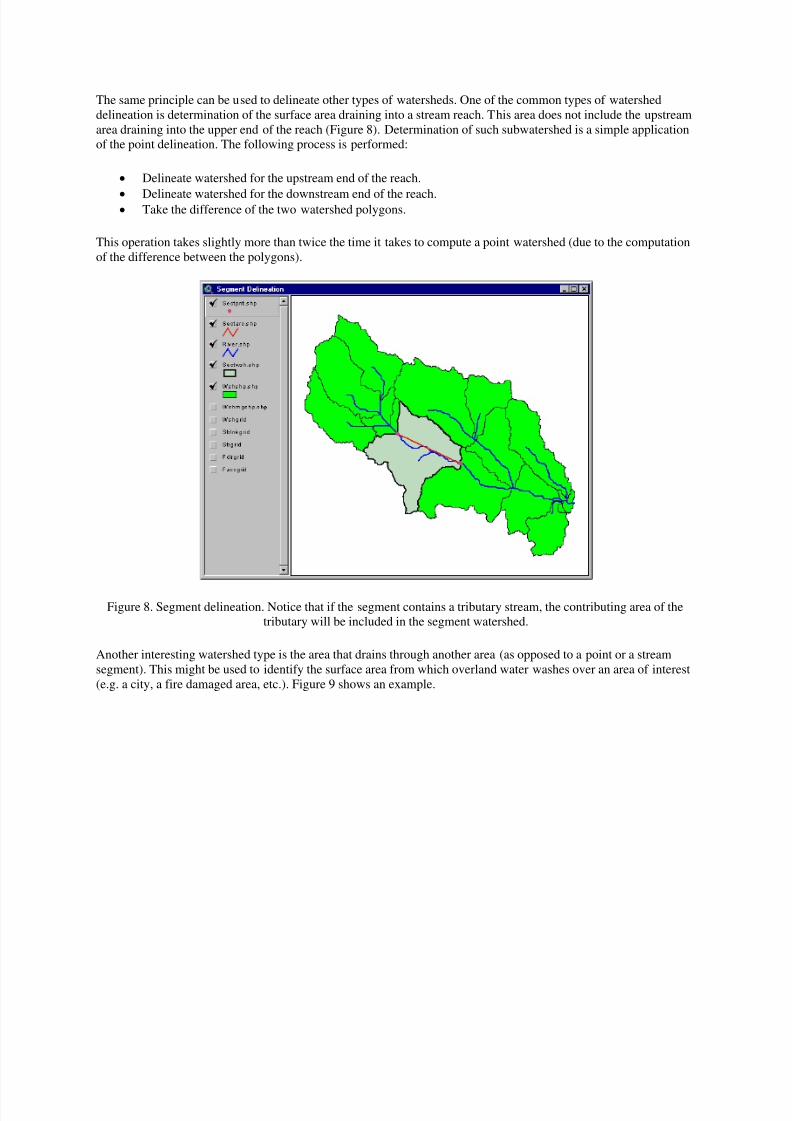
The same principle can be used to delineate other types of watersheds. One of the common types of watershed
delineation is determination of the surface area draining into a stream reach. This area does not include the upstream
area draining into the upper end of the reach (Figure 8). Determination of such subwatershed is a simple application
of the point delineation. The following process is performed:
Delineate watershed for the upstream end of the reach.
Delineate watershed for the downstream end of the reach. Take the difference of the two watershed polygons.
This operation takes slightly more than twice the time it takes to compute a point watershed (due to the computation
of the difference between the polygons).
Figure 8. Segment delineation. Notice that if the segment contains a tributary stream, the contributing area of the
tributary will be included in the segment watershed.
Another interesting watershed type is the area that drains through another area (as opposed to a point or a stream
segment). This might be used to identify the surface area from which overland water washes over an area of interest
(e.g. a city, a fire damaged area, etc.). Figure 9 shows an example.
8/3/2019 DEM Pre Processing for Efficient Watershed Delineation
http://slidepdf.com/reader/full/dem-pre-processing-for-efficient-watershed-delineation 9/14
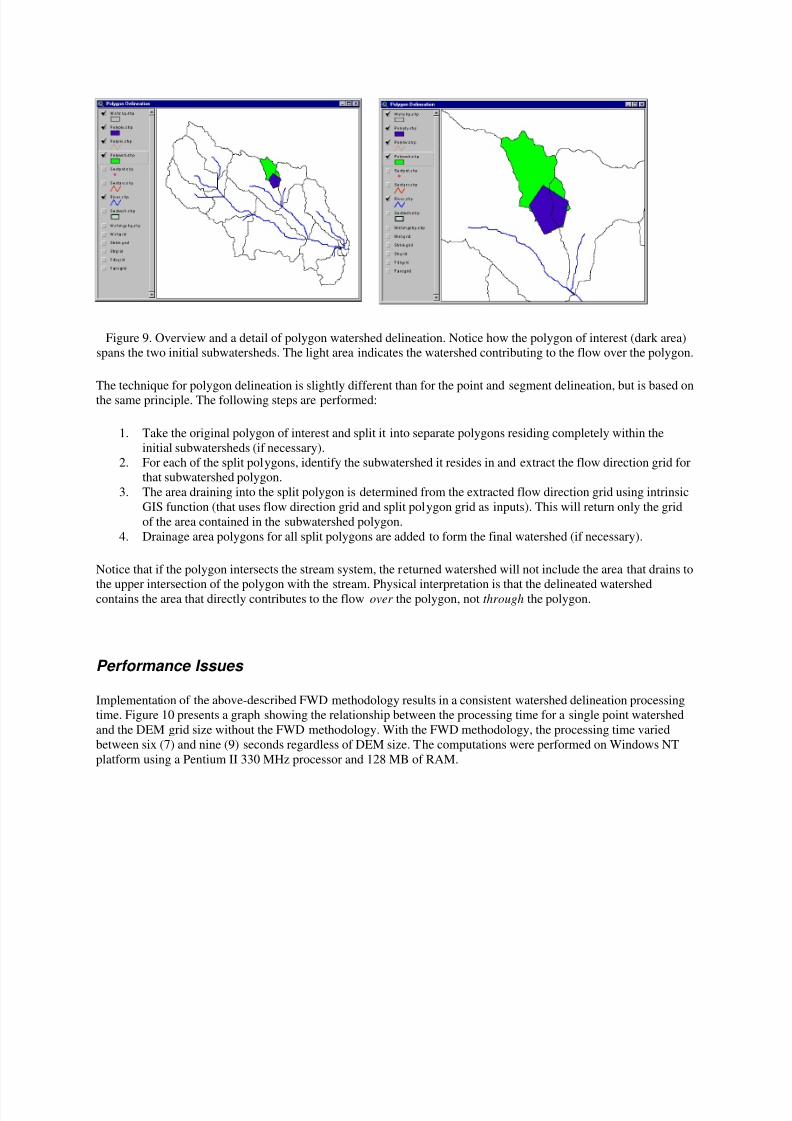
Figure 9. Overview and a detail of polygon watershed delineation. Notice how the polygon of interest (dark area)
spans the two initial subwatersheds. The light area indicates the watershed contributing to the flow over the polygon.
The technique for polygon delineation is slightly different than for the point and segment delineation, but is based on
the same principle. The following steps are performed:
1. Take the original polygon of interest and split it into separate polygons residing completely within the
initial subwatersheds (if necessary).
2. For each of the split polygons, identify the subwatershed it resides in and extract the flow direction grid for
that subwatershed polygon.
3. The area draining into the split polygon is determined from the extracted flow direction grid using intrinsic
GIS function (that uses flow direction grid and split polygon grid as inputs). This will return only the grid
of the area contained in the subwatershed polygon.
4. Drainage area polygons for all split polygons are added to form the final watershed (if necessary).
Notice that if the polygon intersects the stream system, the returned watershed will not include the area that drains to
the upper intersection of the polygon with the stream. Physical interpretation is that the delineated watershedcontains the area that directly contributes to the flow over the polygon, not through the polygon.
Performance Issues
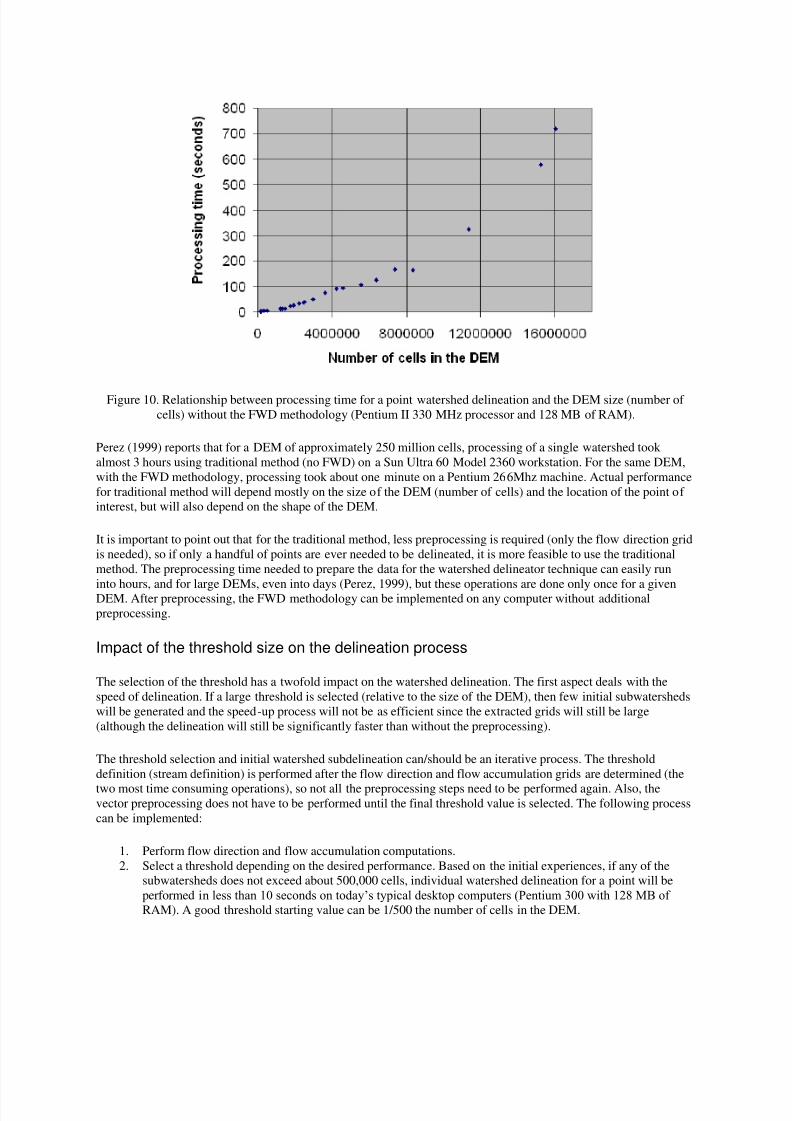
Implementation of the above-described FWD methodology results in a consistent watershed delineation processing
time. Figure 10 presents a graph showing the relationship between the processing time for a single point watershed
and the DEM grid size without the FWD methodology. With the FWD methodology, the processing time varied
between six (7) and nine (9) seconds regardless of DEM size. The computations were performed on Windows NT
platform using a Pentium II 330 MHz processor and 128 MB of RAM.
8/3/2019 DEM Pre Processing for Efficient Watershed Delineation
http://slidepdf.com/reader/full/dem-pre-processing-for-efficient-watershed-delineation 10/14
Figure 10. Relationship between processing time for a point watershed delineation and the DEM size (number of
cells) without the FWD methodology (Pentium II 330 MHz processor and 128 MB of RAM).
Perez (1999) reports that for a DEM of approximately 250 million cells, processing of a single watershed took
almost 3 hours using traditional method (no FWD) on a Sun Ultra 60 Model 2360 workstation. For the same DEM,
with the FWD methodology, processing took about one minute on a Pentium 266Mhz machine. Actual performance
for traditional method will depend mostly on the size of the DEM (number of cells) and the location of the point of
interest, but will also depend on the shape of the DEM.
It is important to point out that for the traditional method, less preprocessing is required (only the flow direction grid
is needed), so if only a handful of points are ever needed to be delineated, it is more feasible to use the traditional
method. The preprocessing time needed to prepare the data for the watershed delineator technique can easily run
into hours, and for large DEMs, even into days (Perez, 1999), but these operations are done only once for a givenDEM. After preprocessing, the FWD methodology can be implemented on any computer without additional
preprocessing.
Impact of the threshold size on the delineation process
The selection of the threshold has a twofold impact on the watershed delineation. The first aspect deals with the
speed of delineation. If a large threshold is selected (relative to the size of the DEM), then few initial subwatersheds
will be generated and the speed-up process will not be as efficient since the extracted grids will still be large
(although the delineation will still be significantly faster than without the preprocessing).
The threshold selection and initial watershed subdelineation can/should be an iterative process. The threshold
definition (stream definition) is performed after the flow direction and flow accumulation grids are determined (the
two most time consuming operations), so not all the preprocessing steps need to be performed again. Also, thevector preprocessing does not have to be performed until the final threshold value is selected. The following process
can be implemented:
1. Perform flow direction and flow accumulation computations.
2. Select a threshold depending on the desired performance. Based on the initial experiences, if any of the
subwatersheds does not exceed about 500,000 cells, individual watershed delineation for a point will be
performed in less than 10 seconds on today’s typical desktop computers (Pentium 300 with 128 MB of
RAM). A good threshold starting value can be 1/500 the number of cells in the DEM.
8/3/2019 DEM Pre Processing for Efficient Watershed Delineation
http://slidepdf.com/reader/full/dem-pre-processing-for-efficient-watershed-delineation 11/14
3. Using this threshold, perform other grid preprocessing steps until the grid of initial subwatersheds is
obtained.
4. Check the watershed grid’s VAT table to see how many cells are there in each subwatershed. If the values
are consistently and significantly over 500,000, reduce the threshold value and repeat steps 2-4.
5. Once the satisfactory threshold number is determined, finish the preprocessing tasks (vector processing).
The smaller threshold will result in a larger number of subwatersheds. This will speedup the delineation for a point(as the extracted flow direction grid is smaller), but will increase the time to perform all the required preprocessing
steps, and will increase the size of the preprocessed themes (but not significantly). Since preprocessing is done only
once, this is not a major issue. At some point, reducing the size of the subwatersheds will not return any benefits, as
the overhead of grid extraction and polygon addition will become larger than the actual delineation within the
subwatershed.
The second aspect of the threshold selection deals with issues related to the coastal and inner drainage basins. Using
the current methodology, in order to define an initial subwatershed, a stream link needs to be present for that
subwatershed. The stream link is a derivative of the stream, which in turn is defined by the threshold. For a large
threshold, it is possible that smaller areas draining directly into the sea or a lake will not be identified (areas that
drain less than the threshold value).
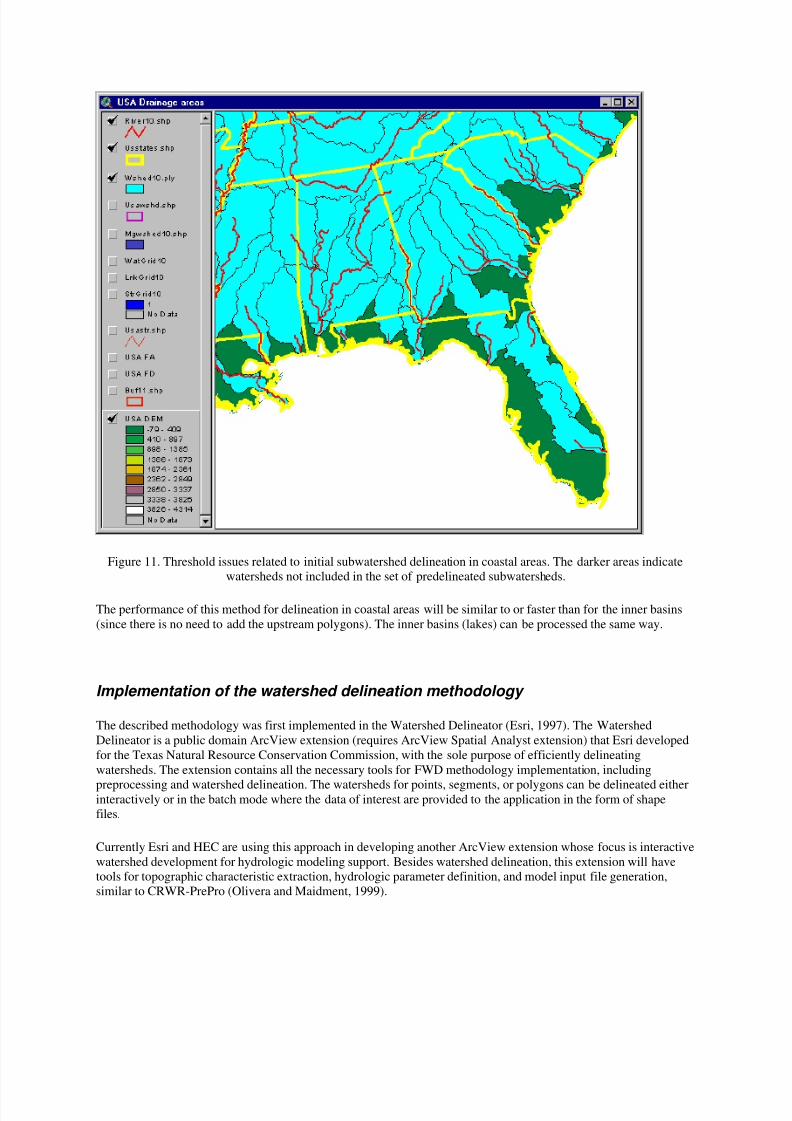
Figure 11 shows this issue on a North American HYDRO 1K dataset (USGS et al.). The cell size for the DEM is1km. The DEM covering conterminous US contains 3184 rows by 4650 columns, for a total of about 14,800,000
cells. The selected threshold had 10,000 cells corresponding to 10,000 square kilometers (before a "stream" was
identified). The DEM to threshold size ratio is about 1/1480 (significantly larger than the recommended starting
point – resulting in a denser subwatershed theme) producing 411 subwatersheds, ranging in size from 10 to 120,000
cells. The time to perform point delineation is about four seconds.
Figure 11, focusing on the SE USA, shows that large portions of the coastal areas have not been predelineated. In
these areas, the watershed delineation methodology can not be used, but rather the traditional method must be
applied. To speed-up the delineation in those areas, a hybrid approach to watershed delineation can be implemented
(using the same principle of limiting the extent of the grid that needs to be processed):
As a preprocessing step, form a subwatershed theme that contains both the predelinieated subwatershed
polygons and the polygons for areas that fall under to threshold size. Note that by definition the "left-out"polygons will be small (less than the threshold), and in general non-contiguous.
When performing the delineation:
If the point falls in one of the preprocessed watersheds, perform delineation following the FWD
methodology already described.
If the point falls in one of the "left-out" polygons, extract the flow direction grid and perform the
delineation using GIS intrinsic functions. Since we know that these areas are not connected to the upstream
drainage area, there is no need to connect the resulting watershed to the pre-merged upstream polygon, and
the delineation is completed (similar to the operations on head basins).
8/3/2019 DEM Pre Processing for Efficient Watershed Delineation
http://slidepdf.com/reader/full/dem-pre-processing-for-efficient-watershed-delineation 12/14
Figure 11. Threshold issues related to initial subwatershed delineation in coastal areas. The darker areas indicate
watersheds not included in the set of predelineated subwatersheds.
The performance of this method for delineation in coastal areas will be similar to or faster than for the inner basins
(since there is no need to add the upstream polygons). The inner basins (lakes) can be processed the same way.
Implementation of the watershed delineation methodology
The described methodology was first implemented in the Watershed Delineator (Esri, 1997). The Watershed
Delineator is a public domain ArcView extension (requires ArcView Spatial Analyst extension) that Esri developed
for the Texas Natural Resource Conservation Commission, with the sole purpose of efficiently delineating
watersheds. The extension contains all the necessary tools for FWD methodology implementation, including
preprocessing and watershed delineation. The watersheds for points, segments, or polygons can be delineated eitherinteractively or in the batch mode where the data of interest are provided to the application in the form of shape
files.
Currently Esri and HEC are using this approach in developing another ArcView extension whose focus is interactive
watershed development for hydrologic modeling support. Besides watershed delineation, this extension will have
tools for topographic characteristic extraction, hydrologic parameter definition, and model input file generation,
similar to CRWR-PrePro (Olivera and Maidment, 1999).
8/3/2019 DEM Pre Processing for Efficient Watershed Delineation
http://slidepdf.com/reader/full/dem-pre-processing-for-efficient-watershed-delineation 13/14
From the watershed delineation point of view, the key difference is that the final result of the application is a set of
non-overlapping subwatersheds, of which each one will be modeled as a hydrologic unit. The described watershed
delineation methodology is used to identify the area of interest for which the hydrologic modeling will be
performed. Once this area is identified, a set of interactive tools are made available for refinement of the initial
delineation (merge and split current subwatershed, add sub-basin outlet points from a file, etc.). The core delineation
functions (point, segment, and polygon) will also be included with this application to provide a full set of delineation
tools.
Conclusion
The FWD methodology described in this paper allows efficient and consistent watershed delineation on DEMs of
any size. The speed of delineation can be controlled by the user during the preprocessing stages, and can be in the
order of five to ten seconds per watershed on most of today’s desktop systems, allowing for a truly interactive
operation. The required preprocessing needs to be done only once for a given DEM and can be done at a different
location from the one where the actual delineation work will be performed. This allows preprocessing of regional
datasets that are then distributed to the end users who can immediately apply to delineation tools on that dataset.
The FWD methodology and the tools developed for its implementation are only effective if a good quality DEM isavailable. The "quality" of a DEM is a function of the scale and the task at hand. The described methodology
promotes development of quality data as these issues have to be addressed sooner (during the preprocessing stages)
rather than later (during watershed delineation). These issues can then be focused on a group of experienced
analysts, instead of end users who are not versed in intricacies of terrain representation using DEM structures.
Acknowledgments
The Watershed Delineation application that prompted initial development of FWD methodology was built by Esri
for the Texas Natural Resource Conservation Commission (Austin, TX) under the WIPS grant from the
Environmental Protection Agency.
The current implementation of the methodology is under the CRADA agreement between Esri and US Army Corps
of Engineers Hydrologic Engineering Center (Davis, CA).
References
Cederstrand, J.R., and A. Rea. (1995), Watershed boundaries and digital elevation model of Oklahoma derived from
1:100,000-scale digital topographic maps, U.S. Geological Survey Open-File Report 95-727
Djokic, D., Z. Ye, and A. Miller. (1997), Efficient Watershed Delineation Using ArcView and Spatial Analyst , Proc.17th Annual Esri User Conference, San Diego, CA.
Esri. (1997), Watershed Delineator Application - User's Manual, Environmental Systems Research Institute,
Redlands, CA.
Garbrecht, J., and L.W. Martz. (1999), Digital Elevation Model Issues in Water Resources Modeling, Proceedings of
the 19th Esri Users Conference, San Diego, CA (this issue).
8/3/2019 DEM Pre Processing for Efficient Watershed Delineation
http://slidepdf.com/reader/full/dem-pre-processing-for-efficient-watershed-delineation 14/14
Olivera, F., and D.R. Maidment. (1999), GIS Tools for HMS Modeling Support , Proceedings of the 19th Esri Users
Conference, San Diego, CA (this issue).
Perez, A. (1999), Source Water Protection Project: A comparison of Watershed Delineation Methods in ARC/INFO
and ArcView, Proceedings of the 19th Esri Users Conference, San Diego, CA (this issue).
USGS EROS Data Center, HYDRO 1K Elevation Derivative Database, http://edcwww.cr.usgs.gov/landdaac/gtopo30/hydro/
Author Information
Dean Djokic
Senior Applications Programmer and Consultant
Esri
380 New York St.
Redlands, CA 92373
Tel. 909-793-2853 ext. 1072
Fax. 909-307-3014
Email. [email protected]
Zichuan Ye
Applications Programmer
Esri
380 New York St.
Redlands, CA 92373
Tel. 909-793-2853 ext. 1505
Fax. 909-307-3014
Email. [email protected]