Delta Airlines (D AL) April 21, 2015 Stock...
26
Important disclosures appear on the last page of this report. The Henry Fund Henry B. Tippie School of Management Alec Davis [[email protected]] Delta Airlines (DAL) April 21, 2015 Industrials - Airlines Stock Rating Buy Investment Thesis Target Price $60-$66 Delta Airlines Inc. is a market leader in on-time performance, customer satisfaction, and revenue per available seat mile (PRASM), and is well positioned to take advantage of the new positive economic outlook for the airlines industry. We believe Delta has a strong upside with improving margins over the next few years before oil prices stabilize. Delta remains better positioned than its peers to weather any sudden increase in the price of oil due to an improving balance sheet and strong operational metrics, and thus deserving of a “buy” rating. Drivers of Thesis The dramatic fall in oil prices will improve operating margins excluding hedge losses from 11.9% to 15% in 2016 before stabilizing at 12.75% as oil returns above $70/barrel. Industry consolidation has reduced competition and allowed airlines to increase both load factors and yields (revenue per seat available): strong load factors will continue to increase to 86% by 2016 as Delta remains disciplined about capacity management. Strong cash flows from operations will allow Delta to achieve its $5B net debt target by 2016. Risks to Thesis Low fuel prices will allow discount competitors to expand aggressively and attempt to take market share. A strong US dollar and weak international economies has caused Delta to initiate 15% capacity reductions in the Pacific for 2014. A shortage of pilots could impact labor costs especially for regional partners, and threatens management’s goal of maintaining non-fuel cost growth at 2%. Henry Fund DCF $65.26 Henry Fund DDM $54.57 Relative Multiple EPS $54.04 Price Data Current Price $45.35 52 Week Range $30.12-$51.06 Consensus 1 yr Target $64.85 Key Statistics Market Cap (B) $36.1 Shares Outstanding (M) Institutional Ownership Five Year Beta 824.3 86.1% 1.26 Dividend Yield .8% Price/Earnings (ttm) 23.41 Price/Earnings (FY1) 8.94 Price/Sales (ttm) 1.03 Price/Book (mrq) 4.61 Profitability Operating Margin 11.85% Profit Margin 1.64% Return on Assets (ttm) 1.16% Return on Equity (ttm) 6.4% Source: Factset Earnings Estimates Year 2013 2014 2015E 2016E 2017E 2018E EPS $2.98* $3.43* $4.17 $4.75 $4.31 $4.49 growth 62.0% 15.1% 21.6% 13.9% -9.3% 4.2% 12 Month Performance Industry Description Delta Airlines is a domestic based air carrier providing passenger and cargo service throughout the US and international destinations. It has hubs in Atlanta, Minneapolis, Detroit, JFK, Amsterdam, Tokyo-Narita and others as well as partnerships with regional airlines. It is a member of the SkyTeam Alliance global network of airline carriers and owns a 49% stake in Virgin Atlantic Airways LTD. *adjusted EPS for tax-loss carryforward 8.9 6.4 9.7 14.6 14.0 8.7 16.1 20.7 11.2 0 5 10 15 20 25 P/E ROE EV/EBITDA DAL Industry Sector -10% 0% 10% 20% 30% 40% 50% M A M J J A S O N D J F DAL S&P 500 Source: Factset Source: Yahoo Finance
Transcript of Delta Airlines (D AL) April 21, 2015 Stock...

Important disclosures appear on the last page of this report.
The Henry FundHenry B. Tippie School of ManagementAlec Davis [[email protected]]
Delta Airlines (DAL) April 21, 2015Industrials - Airlines Stock Rating Buy
Investment Thesis Target Price $60-$66
Delta Airlines Inc. is a market leader in on-time performance, customersatisfaction, and revenue per available seat mile (PRASM), and is well positionedto take advantage of the new positive economic outlook for the airlinesindustry. We believe Delta has a strong upside with improving margins over thenext few years before oil prices stabilize. Delta remains better positioned thanits peers to weather any sudden increase in the price of oil due to an improvingbalance sheet and strong operational metrics, and thus deserving of a “buy”rating.
Drivers of Thesis The dramatic fall in oil prices will improve operating margins excluding
hedge losses from 11.9% to 15% in 2016 before stabilizing at 12.75% as oilreturns above $70/barrel.
Industry consolidation has reduced competition and allowed airlines toincrease both load factors and yields (revenue per seat available): strongload factors will continue to increase to 86% by 2016 as Delta remainsdisciplined about capacity management.
Strong cash flows from operations will allow Delta to achieve its $5B netdebt target by 2016.
Risks to Thesis Low fuel prices will allow discount competitors to expand aggressively and
attempt to take market share.
A strong US dollar and weak international economies has caused Delta toinitiate 15% capacity reductions in the Pacific for 2014.
A shortage of pilots could impact labor costs especially for regionalpartners, and threatens management’s goal of maintaining non-fuel costgrowth at 2%.
Henry Fund DCF $65.26Henry Fund DDM $54.57Relative Multiple EPS $54.04Price DataCurrent Price $45.3552 Week Range $30.12-$51.06Consensus 1 yr Target $64.85Key StatisticsMarket Cap (B) $36.1Shares Outstanding (M)Institutional OwnershipFive Year Beta
824.386.1%
1.26Dividend Yield .8%Price/Earnings (ttm) 23.41Price/Earnings (FY1) 8.94Price/Sales (ttm) 1.03Price/Book (mrq) 4.61ProfitabilityOperating Margin 11.85%Profit Margin 1.64%Return on Assets (ttm) 1.16%Return on Equity (ttm) 6.4%
Source: Factset
Earnings EstimatesYear 2013 2014 2015E 2016E 2017E 2018EEPS $2.98* $3.43* $4.17 $4.75 $4.31 $4.49
growth 62.0% 15.1% 21.6% 13.9% -9.3% 4.2%12 Month Performance Industry Description
Delta Airlines is a domestic based air carrierproviding passenger and cargo service throughoutthe US and international destinations. It has hubsin Atlanta, Minneapolis, Detroit, JFK, Amsterdam,Tokyo-Narita and others as well as partnershipswith regional airlines. It is a member of theSkyTeam Alliance global network of airlinecarriers and owns a 49% stake in Virgin AtlanticAirways LTD.
*adjusted EPS for tax-loss carryforward
8.96.4
9.7
14.6 14.0
8.7
16.1
20.7
11.2
0
5
10
15
20
25
P/E ROE EV/EBITDA
DAL Industry Sector
-10%
0%
10%
20%
30%
40%
50%
M A M J J A S O N D J F
DAL S&P 500
Source: Factset
Source: Yahoo Finance

Page 2
EXECUTIVE SUMMARY
Delta airlines has focused on improving company metricsand financials in the midst of a period of recentprofitability in the airline industry driven by mergers andthe declining price of oil. The company has committedtowards repairing its balance sheet through driving netdebt down from $15B in 2010 to a target of $5B by 2016and the updating and upgrading of its fleet and facilities.
Delta is an industry leader in customer performancemetrics such as on-time delivery and baggage delivery5, aswell as industry metrics such as passenger revenue peravailable seat mile (PRASM) and % utilization of seats oneach plane (load factor).
The recent sudden drop in the price of oil has hurt Deltarelative to some of its peers due to its active hedgingstrategies; however should oil prices remain low, Delta willbe positioned to fully take advantage of lower fuel costs bythe second half of 2015.
We feel that Delta continues to trade at a discount relativeto its industry leading position in PRASM, operationalperformance and ability to generate strong year-over-yearoperating cash flows. The US airline industry is wellpositioned to benefit from the fall in oil prices, and Deltarepresents a strong opportunity to capitalize on this upsidepotential as a top industry performer that is bettershielded than its peers against any rise in the price of oildue to its proactive fuel strategies and improved balancesheet.
Company Description
Delta Airlines Inc. operates a network of scheduled airtransportation services for passengers and cargo. Itoperates service from hubs in Atlanta, Boston, Cincinnati,Detroit, LA, Minneapolis, NYC, Salt Lake and Seattle, aswell as Amsterdam and Tokyo Narita. The company serves326 destinations in 59 countries with its fleet of over 750aircraft and its regional partnerships as part of the DeltaConnections program.3
The company operates mainline flights domestically withinthe United States as well as service to Atlantic, Pacific, andLatin American destinations. Through its partnerships withregional carriers it serves domestic secondary and tertiarymarkets in the United States.
Source: Delta.com
Delta is a founding member of the SkyTeam Alliance, aninternational partnership of 20 airlines across the globethat allows customers to share benefits such as access tolounges and frequent flyer programs among memberairlines.9
Source: Delta 2014 10K
Passenger revenues account for 88% of all Delta revenuesand are the primary driver for business operations. Pointof sale for ticketed passengers are primarily driventhrough online purchases, both through the company’sown sales channel at Delta.com and third party travelsites.3
Delta operates a customer loyalty program Skymiles® thatallows customers to earn mileage credit when flying onDelta, its regional carriers, and other participating airlines.Reward miles from this program constituted 7.4% of allrevenue miles in 2014.
The other sources of income are generated throughancillary revenue charges such as baggage fees andonboard purchases, as well as minor business units such asairport maintenance, repair and overhaul, aviation staffingsolutions, wholesale vacation packages, and private jet
MainlinePassenger,
$28,688
RegionalCarriers,$6,266
Cargo, $934
Other Revenue,$4,474
2014 REVENUE BY SEGMENT ($M)

Page 3
operations. Additional revenue by these segmentsaccounts for approximately 10% of Delta’s revenue.
Revenue in cargo generated by selling cargo spaceavailable on regularly scheduled passenger aircraft bothdomestically and internationally. Through its membershipin the SkyTeam cargo alliance, Delta is able to offer cargodelivery solutions on 6 different continents.3
Company Analysis
In 2008 Delta Airlines announced its merger withNorthwest Airlines, forming at the time the largest airlinein the world. The merger, a catalyst for subsequentconsolidation within the industry, has been a starting pointfor the drastic changes in operations and profitability thathave taken place over the past several years at Delta.
2014 Total Passenger Revenue (MM) - $34,954Source: Delta 2014 10K
Domestic and regional revenues account for 67% of allpassenger revenues, compared to 67% for AAL, 57% forUAL, and 99% for LUV respectively. International revenueis expected to increase for LUV as Southwest continues itsexpansion, however we do not forecast Southwestbecoming a major international carrier any time in theforeseeable future.
The fastest growing segments for Delta are domesticmainline and Latin America. Growth in Latin America,which has averaged 11% over the past 3 years has beendriven by increased service to Mexico and Brazil andcommercial partnerships with Aeroméxico and GOL.4
Growth in Asia is expected to be minimal due torestructuring of the pacific fleet to smaller more costeffective planes and the devaluation of the Japanese yen.
Over the past 6 years the company has focused heavily onincreasing operational efficiency, upgrading facilities, andgenerating additional sources of revenue. At the mergerclose, Delta had over 1,300 aircraft (including aircraftowned and operated by regional partners) with an averagegauge of 103 seats, including nearly 500 regional 50-seatjets. Of the 772 aircraft operated by Delta, 587 (76%) areowned and 185 (24%) are leased.
Current commitments are for additional purchases of 192aircraft and lease commitments for 72 aircraft. Given thestate of financial stability in the industry, we expect Deltaand competitor airlines to increase the number of aircraftpurchases versus leases as part of their capital deploymentplans.
Through new purchases and retirements, the projected2015 fleet will have under 1,100 aircraft with an averagegauge of 122 seats, and fewer than 150 50-seat regionaljets remaining.10 Many of these upgrades and fleetreductions will occur at the regional carrier level, includingwholly owned subsidiary Endeavor Air.
Regional restructuring will not be reflected on Delta’sbalance sheet, but will contribute towards reducingregional carrier expense. These restructurings has allowedDelta to increase available seat miles while reducingdepartures, a significant achievement in operationalefficiency.
Delta Airlines is one of the 3 remaining major US carriersoffering a global network of destinations. Internationally,Delta and its SkyTeam Alliance compete against UnitedAirlines and the Star Alliance, and American Airlines andthe Oneworld Alliance, all of which are roughly similar insize. Because of this alliance and its large domesticnetwork, Delta competes primarily with both United andAmerican for the majority of business travel in the UnitedStates.
Delta’s superior service in operations and customersatisfaction make it a best in class airline compared to itsprimary domestic competition. In addition, Delta hasproven best capable of maximizing revenue through itscapacity, leading its major US competitors in passengerrevenue per available seat mile (PRASM). This figure was14.58 cents for Delta in 2014, higher than all major
Domestic,$17,017
49%
Atlantic,$5,826
16%
Pacific,$3,421
10%
Latin America,$2,424
7%
RegionalCarriers, $6,266
18%
PASSENGER SEGMENTS

Page 4
domestic competition. We forecast moderate growth inPRASM at 1-2% over the 5 year forecast period, rising to15.63 cents by 2019. Current pricing pressures from lowercost carriers and the strength of the US dollar will likelymake any growth above this difficult to achieve.
Source: Bloomberg
The cost structure for most major US airlines is relativelysimilar, with the primary points of variability coming in thetop two costs: fuel and labor. Delta, along with Southwestand United, has been proactive in attempting to mitigatethe high cost of oil in recent years with a fuel hedgingprogram.
Source: DAL, LUV, AAL, UAL 2014 10K Filings
Fuel has overtaken labor as the number one expense forDelta and its competitors over the recent years, andremains a significant driver for profitability in the industry.If the price of fuel remains low into 2015 and 2016 thistrend could reverse itself.
2014 Operating Expense Breakdown ($MM)Aircraft fuel and related taxes 11,668 30.6%Salaries and related costs 8,120 21.3%Regional carrier expense 5,237 13.7%Aircraft maintenance 1,828 4.8%Depreciation andamortization
1,771 4.6%
Contracted Services 1,749 4.6%Passenger Commissions &Other Selling Expenses
1,700 4.5%
Landing fees and other rents 1,442 3.8%Profit sharing 1,085 2.8%Passenger service 810 2.1%Aircraft rent 233 0.6%Restructing and other items 716 1.9%Other 1,797 4.7%Total Operating Expense 38,156 100.0%
Source: Delta 2014 10K
Organized labor is a major part of operations for thedomestic airlines industry. Delta has the lowest unionmembership of the major US airlines, with approximately18% of its 80,000 employees represented by unions, over11,000 of which are members of the Delta Pilots union.3
The union membership numbers for Delta are significantlylower than the other 3 major carriers, which havememberships in the 80% and above range. Delta is the onlyone of the four that does not have unionized flightattendants, a major driver in the percentage difference.
There is a current attempt to organize a unionization votefor later in 2015 for the Delta flight attendants. Althoughthis does represent a risk towards higher organized laborgoing forward, given the past history of failed votes andwithout any information to indicate a different outcome atthis point we have not included a successful vote in ourmodel.
Labor relations with unions, especially the pilots, iscritically important for the airline, as a pilot strike has theability to cripple the company’s cash flow generating. Thecompany last experienced a pilot strike in 2006.Negotiations with the Delta pilots union will begin laterthis year for the contract which becomes amendableDecember 31st, 2015. Little information has been releasedindicating any potential issues with negotiations thus far,and given Delta’s current profit sharing program, we do

Page 5
not forecast potential work stoppages. Likely, the mostserious issue will be the recent acquisition of Delta’s stakein Virgin Atlantic and the fear amongst the pilots unionthat this could allow Delta to staff international expansionwith Virgin pilots and flight crews.
We project labor costs to rise slightly from 4.21% to 4.47%of sales for 2015 and remain at this level over the forecastperiod reflecting increased profit-sharing expenses andhigher expenses for pilots under the new collectivebargaining agreement.
The cost structure for the 4 major domestic carriers differsfrom the rest of the market in the cost of labor. Regionalpartners provide low cost flight crews for smaller marketsby selling their entire inventory to their major partnerssuch as Delta but owning the aircraft and labor.7 Low costcarriers such as Spirit Air, Allegiant Air, and JetBlue airwaysalso attempt to compete on price by employing cheaperlabor.
Delta’s unfunded pension plan remains a significantliability for the company, one that it is actively working toaddress through additional contributions beyondminimum requirements over the past several years. Thecompany maintains a stated goal of 80% funded by 20204,however significant headwinds such as the declininginterest rate environment and actuarial losses have madethis a difficult goal. The pension and other post retirementobligations currently stands as a $15B liability ($18 pershare) on the Delta balance sheet.3
Despite this obligation, Delta remains one of the bestpositioned domestic airlines regarding debt to assets, andhas reduced its net debt level from $17B in 2009 to $7B in2014.6 The current low interest rate environment has hurtDelta more relative to its peers due to higher pensionobligations, but our consensus estimate for rising yield ofthe 10 year bond rising from 1.89% to 3.27% will havemulti-billion dollar positive effect on this liability as each.5% increase in discount rates for pension accounting willdecrease Delta’s liability by $1.4 billion.3
Recent Developments
Higher Fuel Expense for Delta
The most impactful recent development has been theprecipitous drop in the price of oil and therefore jet fuelover the past 6 months. This has impacted the airlines in
different ways, depending on each individual airlines fuelhedging strategy. Delta employs an active fuel hedgingstrategy to guard against spikes in the price of fuel, andthus has not been able to fully participate in the decline inoil prices.
While this program has been successful over the span ofseveral years, the recent drop in the price of oil has causedDelta to incur a significant expense related to losses on itsfuel hedging contracts. The fuel expense for Delta was up24% in 2014 relative to 2013 due to these losses. ThroughQ1 of 2015 has incurred $1.1 billion in hedging lossesincluded early settlements of contracts for the second halfof the year as the company works to restructure its hedgebooks. The current Q1 2015 fuel price for Delta is$2.93/gallon including losses from settled hedgecontracts, compared to Q4 fuel prices of $2.52 forAmerican, $2.63 for Southwest, and $2.88 for United, thelatest publicly available information.
Source: Delta 2015 JP MorganIndustrials Conference Presentation
In Q1 2015 Delta restructured its hedge book to reflect therevised outlook on the price of oil, and will now beapproximately 20% hedged through the second half of2015, down from nearly 60% prior to the beginning of theyear. This will result in approximately $500-$600 millionloss for the year if oil remains in the $45-75$/bbl range.6
We expect fuel expense for Delta to bottom out in the backhalf of 2015 as the remaining hedge contracts are settledand the company is able to fully participate in downside
Page 6
prices. We project all in fuel prices for 2015 estimated at$2.40/gallon and $2.20/gallon for 2016 with moderateincreases of 10/15 cents per gallon in the following yearsas oil returns above $70/barrel once again. Overall this willhave a significant drop in cost of operations with operatingmargin peaking in 2016 at 15.41% before returning to12.4% by 2019.
A second part of Delta’s fuel expense managementstrategy was the 2012 purchase of the Trainer,Pennsylvania refinery facility from Phillips 66. Delta runsthe refinery through its subsidiary Monroe Energy in orderto help supply its northeast operations with jet fuel. Whilethe recent drop in oil prices has caused Delta to recognizefuel hedging loses, these have been partially off-set by aprofit from the refinery business, the first time thesegment has been in the black. This profit was drivenprimarily by the falling price of oil and rising “crack spread”between crude oil and the cost of jet fuel. The refinery hascontinued to post a profit as of Q1 2015.
We do not foresee the profitability trend at the previouslyshuttered refinery to continue, however the operation hashelped the airline, and the industry overall, maintain asupply of jet fuel in the United States. This tactic hasarguably helped its competitors more than it has helpeditself, but the refinery does provide a hedge againstdisruptions in oil supply and volatility in crack spread of jetfuel for Delta.
Customer Segmentation Increasing
In order to drive revenue growth outside of capacityexpansion, Delta has initiated a customer segmentationstrategy that offers more services to customers selectingtickets above the base economy fare. Going into 2015 thecompany will employ 4 tier options, Delta One/First Class,Delta Comfort +, Main Cabin, and Basic Economy.
Delta Passenger Class Layout 2015
Source: Delta 2014 Investor Day Presentation
Delta does not publish a breakdown of margins bypassenger class, but management has stated a
commitment to driving growth in the premium seatcategory, in line with the strategy of being a best-in-classservice provider and key partner for business travel. Thecompany is targeting over $1B in revenue from premiumseats in 2015, an increase of $250M from the prior year.5
The execution of this strategy will be key to drivingrevenue growth and margins for Delta, which risks losingeconomy customers to lower cost competitions as itfocuses on premium and business travelers. Delta hasincreased corporate profits by 7% over 20135 however ascompetition increases for the more profitable businessclass travelers, we expect that growth will slow in this area.
Changes in International Strategy
Revenues from international flights account forapproximately 33% of Delta’s total passenger revenues.Several initiatives are underway to better optimize theinternational services going forward.
The main focus for international expansion is in the LatinAmerican market, with revenues up 14% from 2013. Thishas been driven by increased capacity and commercialpartnerships in Mexico and Brazil. Some of the growth inLatin America however has been offset by reductions incapacity to Venezuela and the Venezuelan currencydevaluation. Due to ongoing economic concerns in thecountry, Delta has reduced its daily flight to Caracas to aone-a-week schedule.4
In 2013 Delta purchased a 49% stake in Virgin AtlanticAirways, allowing it to establish a strategic partnershipwith the British airline. Growth on the popular US-UKroutes through Virgin’s Heathrow slots is expected to be10% for 2015 as Virgin reallocates flights from its Pacificand Africa networks.6
Delta continues to restructure Seattle into a west coasthub as well as operational arrangements in Tokyo’s Naritaairport and optimizing of the pacific fleet by replacing747’s with smaller more cost efficient A330s and A350s,continuing with management’s directives of valuing costsavings and operational efficiency over revenue increases.The replacement of each Boeing 747 will yield at 15-20%operating cost improvement for the routes.5
Weakness in the Japanese market and the yen causedDelta to announce a 15% reduction in capacity to thePacific in April 2015. Weak demand and currencyheadwinds are not positive news, but we view the capacity
Page 7
reductions as a good sign that the airline is maintainingdiscipline in trying to accurately pair supply with demandand keep PRASM up in the weak Pacific network.
We expect international revenues to remain flat or slightlyincrease over the next 5 years due to several of the factorsmentioned earlier. Given the current strength of the USeconomy and dollar relative to its international markets,we project international revenue to decrease from 33% to30% of total revenues, with gains in Latin America beingoffset by capacity reductions in the Pacific and stagnantperformance in the Atlantic.
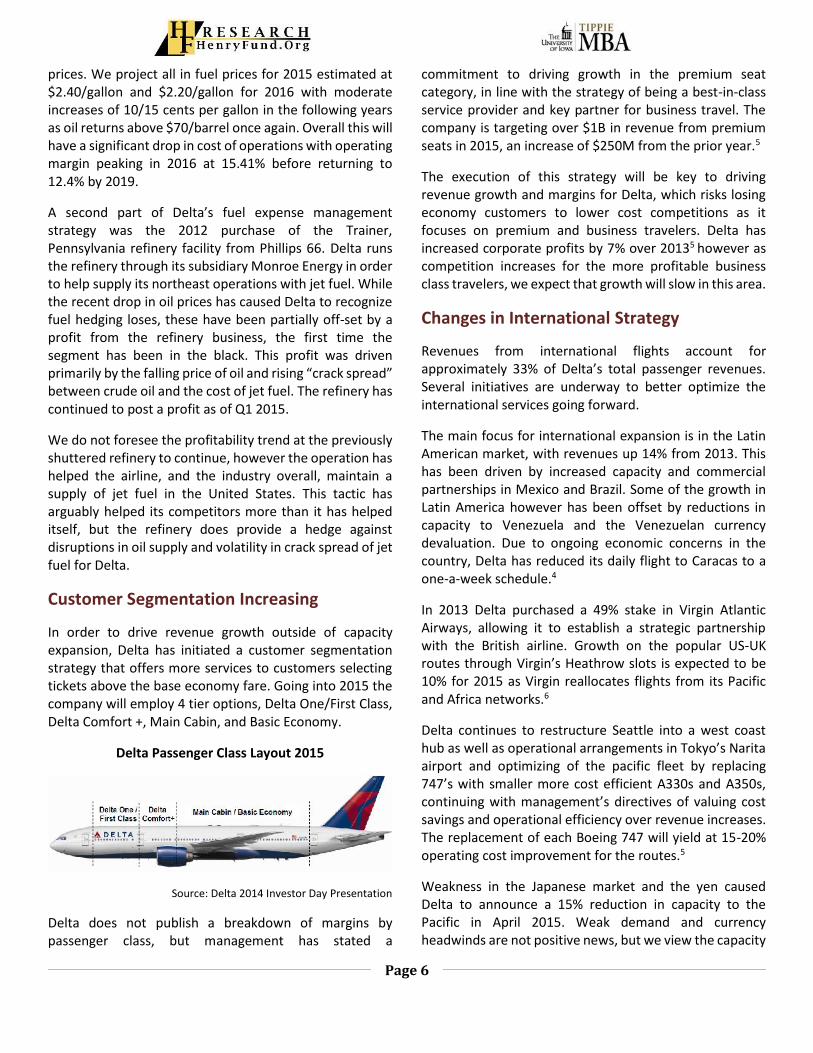
Putting Cash to Work
Free cash flow for 2014 topped $3 billion, whichrepresents one of its best years in recent times.4
Management’s objectives are to apply 50% of operatingfree cash flow reinvested in the business with a targeted$2-3 billion in capital expenditures each of the next 5years. We forecast capital expenditures to be on the highend or slightly above this range over the 5 year forecastperiod, given that we expect increased pressure forupgrades and modifications to fleets/facilities with lowerfuel expenses across the industry.
Source: Delta Investor Day Presentation 2014
The targeted aircraft deliveries are in line with objectivesof growing capacity 3-5% per year and retiring aging planesfrom the fleet. Most new deliveries will be to replace agingplanes and a small increase in the number of planes to feedcapacity increases. We expect the Delta mainline fleet togrow by 10-15 aircraft per year over the forecast horizonto approximately 825. Due to the strong performance andskill base of its tech ops, Delta has been able to operatewith an older than average fleet relative to its peers16,helping to boost ROIC.
Delta has reduced its net debt levels from nearly $17B in2009 to $7.3B in 2014, and has contributed $500 million inexcess of required to its pension liability to date and haspledged to achieve a goal of 80% funded by 2020.4
Significant headwinds have occurred in this area due toactuarial changes and a falling interest rate environment.
Over the past 18 months the company has returned $1.7Bto shareholders in the form of dividends and stockbuybacks, and intends to complete a $2B share repurchaseauthorization by the end of 2015, one year ahead ofschedule.4
INDUSTRY TRENDS
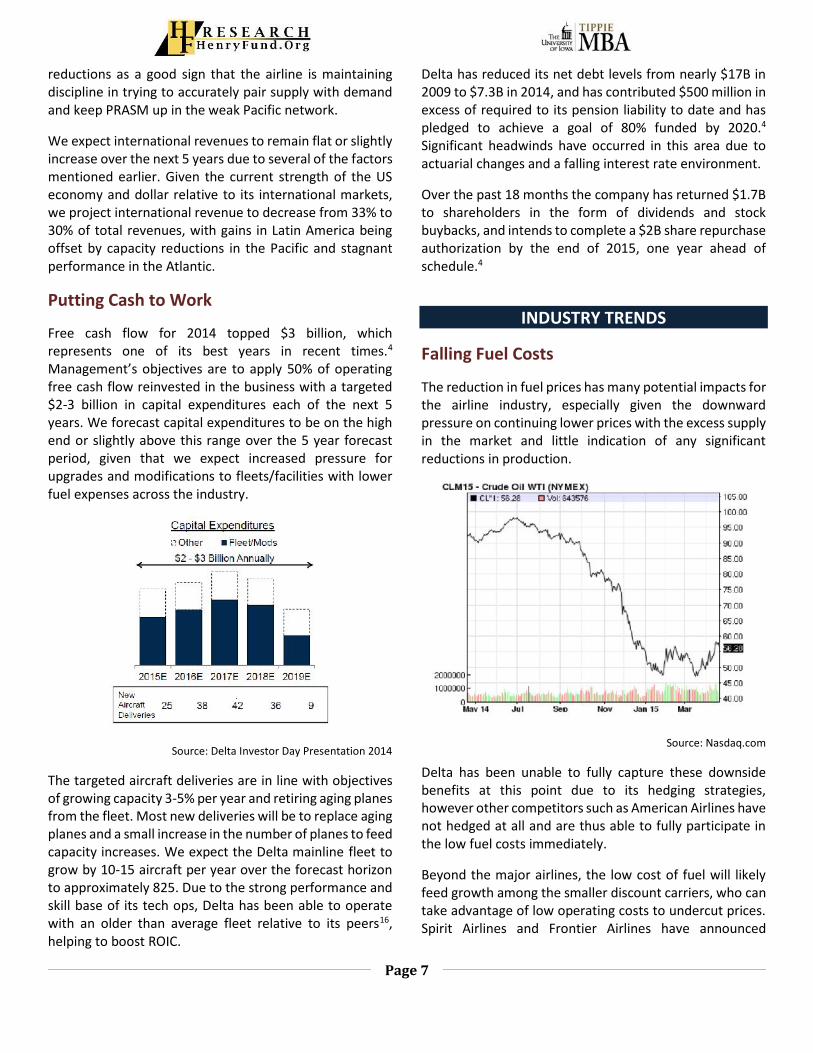
Falling Fuel Costs
The reduction in fuel prices has many potential impacts forthe airline industry, especially given the downwardpressure on continuing lower prices with the excess supplyin the market and little indication of any significantreductions in production.
Source: Nasdaq.com
Delta has been unable to fully capture these downsidebenefits at this point due to its hedging strategies,however other competitors such as American Airlines havenot hedged at all and are thus able to fully participate inthe low fuel costs immediately.
Beyond the major airlines, the low cost of fuel will likelyfeed growth among the smaller discount carriers, who cantake advantage of low operating costs to undercut prices.Spirit Airlines and Frontier Airlines have announced

Page 8
planned capacity increases of approximately 30% and 20%respectively for 2015.12
Historically the threat from discount carriers has beensmall for the major airlines, as they operate on a muchsmaller footprint and primarily siphon away the leastvaluable customers. However, the current low costenvironment and aggressive expansion plans could lead toa big enough impact that the major airlines will be forcedto respond. We view Delta’s recent capacity adjustmentsin the US and Pacific as a positive sign that management iscommitted towards maintaining higher load factors andPRASM to drive profitability over total revenue increases.
Source: Airlines 4 America IndustryReview and Outlook 2014
In the near term the low cost of fuel has helped returnairlines to profitability and allowed many to beginrepairing their balance sheets and paying downobligations.
Source: Bloomberg
Should fuel prices remain low, this will provide anadvantage to more highly levered companies such asAmerican and discount carriers JetBlue and Allegiant, andcontinue to put pressure on pricing due to expansion
efforts from low cost carriers. Ultimately we believe Deltais best positioned with oil in the $70-75/barrel range thatwill allow for lower expenses but will temper industrycapacity expansion.
Reduced Competition and Capacity
The string of mergers that has occurred since theDelta/Northwest merger of 2008 has left the industry withfewer major players and tempered capacity increases dueto restructuring and fleet optimization.
These changes occurred not only because of, but duringthe slow economic growth period of 2008-2013 which alsoreduced demand for air travel. The forward outlookhowever has seen demand increasing over the past severalyears due to a stronger US economy and healthiercorporate profits. The result has been higher load factors,passenger yields, and therefore profits across the industry.
This new competition landscape has been a positivechange for an industry that had adopted a “market shareat any cost” for decades7 and seemed incapable forrestricting capacity increases enough to remain profitable.
The 2010 change in flight training requirements for newpilots to 1500 hours in fact could be a potential benefit forthe major US carriers as it is likely to exacerbate theshortage of new pilots entering the workforce13, thereforemaking significant increases in capacity more difficult andcostly for both the major and discount US carriers.
Source: FAA Forecast Aerospace 2014-2034
The forecast for system wide growth in the US Commercialairline industry is expected to remain strong over the next5 and even 20 years. Total system enplanements areexpected to top 800 million per year by 2017.14 Thenumber of enplanements is expected to grow at 2-3%
-1,000
0
1,000
2,000
3,000
4,000
5,000
6,000
Oper
atin
g In
com
e ($
mill
ions
)
Operating Income (adjusted)
American
Delta
United
Southwest

Page 9
annually over the 5 year forecast period, driven by GDPand population increases and capping off a strong decadeof growth following the financial crisis.
The current capacity structure and strong demand in themarket will allow carriers to easily maintain load factorsabove the traditional 80% threshold for profitability.Beyond the 5 year outlook, this lower competitionenvironment could be threatened if smaller discount andregional carriers are able to continue aggressive doubledigit year over year growth.
Changing Fee Structure
Starting in 2008 with American Airlines announcement ofa $15 fee for checked luggage, the industry has embarkedon a trend of an increasing pay-for-service model foradditional items once included in ticket purchases. All ofthe major carriers except for Southwest have now adopteda fee for checked luggage, and charges for additional itemssuch as priority boarding, WIFI, and food/beverages is nowbecoming the norm. Increases in the types of fees is nowbeing driven by discount carriers such as Spirit, that haveadded charges such as carry-on luggage and fees forbooking through other websites.
Ancillary revenue now makes up a noticeable portion ofrevenue for all major airlines. Delta currently ranks #2 inancillary revenue for US carriers with approximately $2.5Bin 2014, second only to United’s $5.7B.11 In the mostrecent quarter Q4 2014, this ancillary revenue was up 16%for Delta.4
This new fee structure comes as airlines must increasinglycompete on base fare prices as online travel searchaggregators have allowed customers to easily comparecompetitive prices across all airlines. The industrycontinues to move to a more segmented pricing model,allowing airlines to squeeze extra margin out of customersthat it can while still maintaining low base fares in order tofill planes.
Markets and Competition
The four major US Airlines (American, Delta, Southwest,and United) account for approximately 70% of thedomestic air travel market, currently estimated at $143B.Although Southwest has gained significant market shareand has recently made incursions into the internationalmarket, it is not a member of one of the major
international alliances detailed earlier and thereforeremains a competitor primarily only in the domesticmarket.
Source: S&P Capital IQ
Included in the “Others” category of the domestic marketare regional airlines such as Alaska Air, JetBlue, andHawaiian Airlines, as well as discount carriers Spirit,Allegiant, and Frontier (privately held).
The discount carriers operate along select routes andattempt to steal passengers from the major carriers byoffering a “no frills” transportation alternative withextremely low costs. While the likelihood of one of thesediscount carriers growing large enough to significantlythreaten the current breakdown of market share amongstthe major players is low, they do pose a threat to marginson certain routes within the US.
The competitive landscape for the international air travelmarket is one dominated by the 3 major alliances. Thesealliances incorporate a significant number of the majorairlines across the globe. Competition between the 3alliances is strong, with little differentiation between eachexcept for the geographic breakdowns of the memberairlines. The SkyTeam (Delta) controls approximately 8.6%of the international market, while Star Alliance (United)and OneWorld (American) control approximately 8% and6.6% respectively.
There are a select number of significant airlines thatremain unaffiliated, most notably the gulf based carriersEtihad Airways and Emirates Airways. Given the lack ofglobal major unaffiliated carriers, especially in the UnitedStates, we do not expect the formation of any future newalliances.
Delta,16.6%
Southwest16.3%
United,15.4%
American,21.0%
Others,30.7%
2014 MAJOR AIRLINESMARKET SHARE (U.S.)

Page 10
Recently, the major US carriers including Delta have begunpressuring US legislators to respond to violations of OpenSkies acts from gulf based carriers that offer low fares onroutes to/from the United States that are alleged to be theresult of illegal subsidies under the agreement.15 While wehave not forecasted any changes to international routesdue to action by US legislators, any agreement reachedwith the gulf states could provide a potential benefit tointernational revenues and margins for Delta.
Peer Comparison
Delta competes against many different airlines within itsscope of operations, however its major competitors areAmerican Airlines, United Airlines, and to a lesser extentSouthwest Airlines.
Over the past decade Southwest has performed strongestamongst the 4 major carriers, maintaining profitability andavoiding the bankruptcies that have plagued several of theother major carriers. With its low cost structure and lowerdebt levels, Southwest has proven to be an industry leaderfinancially throughout the turbulent past decade.
Delta airlines has recently been able to pare its debt to alevel more on par with that of Southwest, and given itsinternational network and premium pricing capabilities, itcan also be considered a market leader and deserving of ahigher multiple. Legacy pension obligations still continueto weigh on the balance sheet however and could prove adrag on earnings and valuation as Delta works to reducethis major liability.
2014 Delta Southwest American UnitedMk Cap ($B) 35.8 29.0 32.6 24.9Revenue ($B) 40.4 18.6 42.7 38.9P/E (ttm) 23.41 21.19 9.08 17.7P/E (FY1) 8.93 12.24 4.48 5.8Debt/Assets 18.1 13.3 41.7 32.4PensionLiability ($B)
15.1 .2 7.6 4.2
EBIT Margin (%) 11.85 12.57 11.84 7.11Load Factor 84.7 82.5 82.0 83.6PRASM (cents) 14.58 13.48 13.97 13.72
Source: Bloomberg & Factset
United and American, both with weaker financials andoperational results are riskier stocks, but have strongupside potential should the price of oil remain low.American, most notably, does not maintain a fuel hedging
program, and therefore is poised to quickly reap thebenefits of the lower cost of fuel.
2014 Spirit Allegiant Alaska JetBlueMk Cap (B) 5.4 3.3 8.5 5.3Revenue (B) 1.9 1.1 5.4 5.8P/E (ttm) 24.3 9.10 4.2 .8P/E (FY1) 14.3 16.7 10.49 10.2Debt/Assets 9.3 47.9 13.0 28.5Pension Liability($B)
0 0 .2 0
EBIT Margin (%) 18.4 17.6 18.1 9.3Load Factor 86.7 87.5 85.1 84.0PRASM 7.0 8.4 12.7 11.9
Source: Bloomberg & Factset
Outside of the major carriers, the discount airlines operatemuch smaller networks that do not offer the sameservices, destinations or operational complexity of themajor carriers, but can steal market share and have theability to drive down pricing on select routes. Theseairlines tend to operate with lower cost structures andcompete on price alone.
ECONOMIC OUTLOOK
Our overall outlook for the airline industry is positive, withlow fuel prices, a strong US economy and limited supplyhelping to drive all US airlines into the black. Higherdiscretionary income and corporate profits relative to thepast several years should also contribute towards higherrevenues and sales of premium seats. Our consensusoutlook for the US GDP growth is 3.1%. Industry revenuegrowth will be tied primarily to this number, and we expecttotal growth to be 3-4% annually based on GDP growthand inflation over the next 5 years.
While demand is forecasted to remain strong over the next2 years and beyond, overall industry revenues could behurt by increasing supply, which could lead to a fall inprices. A stronger US dollar and weaker internationaleconomies will also have a negative effect on the industry.
The price of oil is the number one driver for profitability inthe airline industry. Our consensus 6 month and 2 yearoutlook for the price of oil are $51 and $71 a barrelrespectively, numbers that would represent significantsavings over the past 2 year average. We forecast thesesavings to help maximize operating margins for Delta in2015 and 2016 before oil returns above $70/barrel, butgiven the current status of global supply and demand we

Page 11
do not forecast oil returning to $100+/barrel prices in the2-5 year window.
A projected rise in the US interest rate, still forecasted forthe latter half of the year 2015 could impact the airlinesability to obtain cheap capital, something that would bemore significant for the more highly levered companies inthe industry. Delta has paid down a significant portion ofits debt since 2009 and will approach targeted debt levelsin 2016 given current maturity schedules. Forecastingfuture capital deployment is difficult; however, should themarket and fuel prices remain favorable, we expect Deltato move to use free cash or debt issuances to increaseshare repurchases and dividend payments.
A rising interest rate environment would have the benefitfor companies with large unfunded pension obligationssuch as Delta in helping to reduce the present value ofthose future obligations.
Across the board the economic outlook for all US airlinesis favorable given strong demand and a lowering coststructure. We believe Delta will be able to capture thisupside of this growth cycle in the industry, while remainingbetter positioned against secondary economic factorssuch as the uncertainty in the price of oil and a risinginterest rate environment in the United States.
CATALYSTS FOR GROWTH
Low fuel costs, consolidated competition, and a strong USeconomy are all driving revenues and margins in theindustry. Load factors have increased, allowing airlines toachieve better utilization of their assets, and fleets arebeing updated and optimized with more cost effectiveplanes for each route.
Within the industry, Delta remains a market leader ingenerating passenger revenue and premium pricing, andoperates a lower cost and better run network than its twomost direct competitors United and American. Thisefficiency will allow it to best maximize revenuegeneration without over expanding capacity and togenerate strong operating cash flows.
The continued low price of oil will allow Delta to generatestrong free cash flow to pay down debt, upgrade fleets andfacilities, and return value to shareholders. The companyis well positioned with its premiere service and domesticand international network to capture growth in this spaceand meet targeted minimum ROIC of 18%.5
INVESTMENT POSITIVES
A strong US economy will drive demand andconsolidation has reduced capacity, allowing Delta tooperate at or above 85% load factors.
Delta has generated $3B in free cash flow for 2014 andwill improve upon this as oil continues to fall.
Management has diligently worked to reduce debt levelsand moved company to within 2 ratings of investmentgrade.
Delta operates the best run and best reviewed networkamong the major carriers and has the strongest pricingpower amongst its competitors.
INVESTMENT NEGATIVES
Low oil prices could fuel expansive growth by smallerdiscount carriers, threatening margins and profitabilityacross the industry.
A strong US dollar and competition from subsidizedcarriers (primarily from the Gulf States) hurtsinternational routes.
The price of oil is the number one driver for profitabilityand is an unpredictable and volatile commodity.
Valuation
Total passenger revenue was forecasted to grow by 5.5%for the next 2 years, and 4.5% for the 3 years followingbefore settling at a terminal growth value of 3%. Thisgrowth is driven by a forecasted 3.5% annual growth ratein capacity and a projected rise of load factors up to 86%.
Cost of Goods Sold, which is primarily driven by changes infuel prices, is expected to drop significantly from 80.7%down to 72% and 71% over the next two years due tolower costs of oil. The long term outlook for oil is expectedto move slightly up from today’s levels, and operatingmargins are expected to compress slightly to a continuingvalue of 12.3% from a high of 15.4% in 2016. We believemanagement should be reasonably successful in itstargeted goal of keeping non-fuel related expense growthbelow 2%.
Capital Expenditures were maintained in line withmanagement guidance for the 5 year forecast period, aswere dividends and stock buybacks, including thecompletion of the remaining portion of a $2B sharebuyback program by the end of 2015.

Page 12
Although management has stated its intention ofachieving 80% funding on its pension liability by 2020, wehave forecasted the liability decreasing by 5% a year overthe period, yielding a 56% funded status by 2019, short ofthe goal.
Our DCF valuation price is $63 based on a WACC of 6.8%and a beta of 1.3 computed using the weekly beta for DALand averaging the 1-5 year values.
DDM target price is $54 based on management maintain a30% payout ratio and an ROE of 16%. Our relative P/Emultiple valuation is $44, lower than both DCF and DDMtarget price, however when excluding low forwardmultiples for AAL and UAL the target price of $54.04 ismore in line with our target price range. While we arepositive on the industry overall, we believe analystestimates for earnings regarding these two companies areover inflated and not reflective of the companiesoperating environments.
We have set our target price range at $60-$66, whichrepresents the higher end of the valuation range betweenthe DCF and DDM models based on dividend paymentshaving only restarted at Delta in 2013. This current rangerepresents a 33-46% upside over the current trading price,and therefore DAL is deserving of a BUY recommendation.
KEYS TO MONITOR
In the mature and consolidated US airlines industry, thekey economic driver for demand is a strong US economyand GDP growth. Forecasted demand growth is based ona positive outlook for US GDP growth, thus any slowing inthe US growth or a strong pullback in the global economyhas the potential to impact revenue increases for Deltaand the industry.
The price of oil is the major driver on the costs side of theincome statement in the industry. Our model is based onoil eventually returning closer to the $70-$80/bbl range,given that low prices will likely squeeze out some of theglobal production over the next 12-18 months. While lowoil prices are good for the industry overall, we believeDelta is best positioned against its peers with oil tradingslightly higher than its current 5 year lows.
Finally, PRASM will remain a key operational statistic tomonitor. As low oil prices allow carriers, especiallydiscount and smaller carriers to fuel rapid expansion,Delta’s ability to grow its passenger revenue through fare
and fee increases will be important to maintaining itsmargins and its place as the number one airline for PRASM.
Through Q1 of 2015 Delta has experienced 1.7% decline inPRASM, of which 1.5% has been driven by negative foreignexchange impact. In light of these developments, Delta hasbegun announced reductions in international capacity toselect markets. The strength of the dollar relative to theEuro and the Yen will be important towards recovery ofgrowth in international markets, and Delta’s ability to limitcapacity and costs internationally as well as boost revenuein the US will be key to maintaining PRASM growth.
REFERENCES
1. Bloomberg Terminal2. Factset.com3. Delta 2014 10K Report – retrieved from Delta.com4. Transcript of Delta Q4 2014 earnings call –
retrieved from Delta.com5. Delta Airlines 2014 Investor Day Combined
Presentation 12/11/2014 – retried fromDelta.com
6. J.P. Morgan Aviation, Transportion and IndustrialsConference presentation 3/3/15 – retrieved fromDelta.com
7. S&P Capital IQ Industry Survey: “Airlines”December 2014
8. IBISWORLD Industry Report 48111b: “DomesticAirlines in the United States” December 2014
9. Skyteam Alliance Website - www.skyteam.com10. Goldman Sachs Industrials Conference
Presentation 11/13/14 – retrieved from Delta.com11. Ideaworkscompany.com press release October
2013 “Airline Ancillary Revenue Projected toReach $42.6 billion Worldwide in 2013”http://www.ideaworkscompany.com/wp-content/uploads/2014/07/Press-Release-89-Ancillary-Revenue-Top-10.pdf
12. Airlines for America, Industry Review and Outlook2014 presentation - http://airlines.org/data/a4a-presentation-industry-review-and-outlook/
13. http://www.bloomberg.com/bw/articles/2014-02-11/yes-theres-a-pilot-shortage-salaries-start-at-21-000US Stocks Fall after Delta reports declinein key January revenue figure
14. http://www.foxbusiness.com/markets/2015/02/03/us-airline-stocks-fall-after-delta-reports-decline-in-key-january-revenue/

Page 13
15. http://www.bloomberg.com/news/articles/2015-03-04/u-s-airlines-said-to-lobby-congress-in-push-against-gulf-rivals
16. http://www.wsj.com/articles/delta-flight-attendants-request-union-vote-1421177667
IMPORTANT DISCLAIMER
Henry Fund reports are created by student enrolled in theApplied Securities Management (Henry Fund) program atthe University of Iowa’s Tippie School of Management.These reports are intended to provide potential employersand other interested parties an example of the analyticalskills, investment knowledge, and communication abilitiesof Henry Fund students. Henry Fund analysts are notregistered investment advisors, brokers or officiallylicensed financial professionals. The investment opinioncontained in this report does not represent an offer orsolicitation to buy or sell any of the aforementionedsecurities. Unless otherwise noted, facts and figuresincluded in this report are from publicly available sources.This report is not a complete compilation of data, and itsaccuracy is not guaranteed. From time to time, theUniversity of Iowa, its faculty, staff, students, or the HenryFund may hold a financial interest in the companiesmentioned in this report.

Delta AirlinesRevenue Decomposition
Fiscal Years Ending Dec. 31 2012 2013 2014 2015E 2016E 2017E 2018E 2019EGeographic BreakdownPassengerDomestic 14,050 15,204 17,017 18,390 19,925 21,156 22,450 23,811
7.0% 8.2% 11.9% 8.1% 8.3% 6.2% 6.1% 6.1%Atlantic 5,645 5,657 5,826 5,972 6,091 6,213 6,337 6,464
1.0% 0.2% 3.0% 2.5% 2.0% 2.0% 2.0% 2.0%Pacific 3,645 3,561 3,421 3,250 3,315 3,381 3,449 3,518
8.2% -2.3% -3.9% -5.0% 2.0% 2.0% 2.0% 2.0%Latin America 1,897 2,112 2,424 2,647 2,779 2,918 3,064 3,217
6.8% 11.3% 14.8% 9.2% 5.0% 5.0% 5.0% 5.0%Total Mainline 25,237 26,534 28,688 30,259 32,110 33,668 35,300 37,010
5.8% 5.1% 8.1% 5.5% 6.1% 4.9% 4.8% 4.8%Regional Carriers 6,570 6,408 6,266 6,454 6,648 6,847 7,052 7,264
2.8% -2.5% -2.2% 3.0% 3.0% 3.0% 3.0% 3.0%Total Passenger Revenue 31,807 32,942 34,954 36,713 38,758 40,516 42,353 44,274
5.1% 3.6% 6.1% 5.0% 5.6% 4.5% 4.5% 4.5%
Available Seat Miles (millions) 230,415 232,740 239,676 246,866 255,507 264,449 273,705 283,285-1.8% 1.0% 3.0% 3.0% 3.5% 3.5% 3.5% 3.5%
Revenue Passenger Miles (millions) 192,974 194,988 202,925 210,141 218,584 227,365 235,934 244,1910.1% 1.0% 4.1% 3.6% 4.0% 4.0% 3.8% 3.5%
Passenger Revenue per available seat mile (cents) 13.80 14.15 14.58 14.87 15.17 15.32 15.47 15.637.1% 2.5% 3.0% 2.0% 2.0% 1.0% 1.0% 1.0%
Passenger Load Factor 83.8% 83.8% 84.7% 85.1% 85.5% 86.0% 86.2% 86.2%2.1% 0.0% 1.1% 0.5% 0.5% 0.5% 0.3% 0.0%
Cargo 990 937 934 962 991 1,021 1,051 1,083-3.6% -5.4% -0.3% 3.0% 3.0% 3.0% 3.0% 3.0%
Other 3,873 3,894 4,474 4,608 4,746 4,889 5,036 5,1871.1% 0.5% 14.9% 3.0% 3.0% 3.0% 3.0% 3.0%
Total Operating Revenue 36,670 37,773 40,362 42,283 44,495 46,425 48,440 50,5434.4% 3.0% 6.9% 4.8% 5.2% 4.3% 4.3% 4.3%

Delta AirlinesIncome Statement
1 2 3 4 5Fiscal Years Ending Dec. 31 2012 2013 2014 2015E 2016E 2017E 2018E 2019ETotal passenger revenue 31,807 32,942 34,954 36,713 38,758 40,516 42,353 44,274Cargo revenue 990 937 934 962 991 1,021 1,051 1,083Other operating revenue 3,873 3,894 4,474 4,608 4,746 4,889 5,036 5,187Total operating revenue 36,670 37,773 40,362 42,283 44,495 46,425 48,440 50,543
4.43% 3.01% 6.85% 4.76% 5.23% 4.34% 4.34% 4.34%
COGS 29,904 29,592 32,991 30,444 31,592 33,890 35,361 37,402Depreciation & amortization 1,565 1,658 1,771 1,797 1,878 1,963 2,051 2,143SG&A 1,590 1,603 1,700 1,889 1,987 2,074 2,164 2,258Other operating expense 1,592 1,520 1,797 1,914 2,015 2,102 2,193 2,288Total operating expense 34,495 34,373 38,156 36,044 37,472 40,028 41,769 44,091
Operating income (loss) 2,175 3,400 2,206 6,239 7,024 6,397 6,671 6,452
Interest expense, net 812 698 650 511 491 457 468 455Amortization of debt discount, net 193 154 0 0 0 0 0 0Interest income - - - 0 0 0 0 0Gain (loss) on extinguishment of debt (118) 0 (268) 0 0 0 0 0Miscellaneous, net (27) (21) (216) (76) (80) (83) (87) (90)Total other income (expense), net (1,150) (873) (1,134) (587) (570) (540) (555) (545)
Income (loss) before income taxes 1,025 2,527 1,072 5,652 6,453 5,856 6,116 5,907
Income tax provision (benefit) 16 (8,013) 413 2,312 2,639 2,395 2,502 2,416
Net income (loss) (GAAP) 1,009 10,540 659 3,340 3,814 3,461 3,615 3,491
Year end shares outstanding (millions) 851.402 851.443 825.258 801 803 804 805 807Net earnings (loss) per share - basic (GAAP) 1.20 12.41 0.79 4.17 4.75 4.31 4.49 4.33Dividends per share - 0.12 0.3 0.45 1.13 1.24 1.42 1.57Payout Ratio 0.01 0.46 0.45 0.24 0.29 0.32 0.36

Delta AirlinesBalance Sheet ($ millions)
Fiscal Years Ending Dec. 31 2012 2013 2014 2015E 2016E 2017E 2018E 2019ECurrent AssetsCash & cash equivalents 2,416 2,844 2,088 1,798 3,989 7,265 9,743 11,670Short-term investments 958 959 1,217 1,278 1,342 1,409 1,479 1,553Accounts receivable, net 1,693 1,609 2,297 1,996 2,101 2,192 2,287 2,386Hedge margin receivable 0 0 925 0 0 0 0 0Fuel inventory 619 706 534 688 724 755 788 822Expendable parts & supplies inventories, net 404 357 318 398 413 430 447 465Deferred income taxes, net 463 1,736 3,275 3,723 4,251 3,858 4,029 3,891Hedge derivatives asset - - 1,078 0 0 0 0 0Prepaid expenses & other current assets 1,344 1,318 733 768 808 843 880 918Total current assets 8,272 9,651 12,465 10,648 13,627 16,751 19,653 21,705
Gross Property, Plant & Equipment 27,369 29,646 31,269 32,676 34,147 35,683 37,289 38,967Less: accumulated depreciation & amortization 6,656 7,792 9,340 11,137 13,015 14,978 17,029 19,172Property & equipment, net 20,713 21,854 21,929 21,539 21,131 20,705 20,260 19,795
Goodwill 9,794 9,794 9,794 9,794 9,794 9,794 9,794 9,794Indentifiable intangibles, gross 5,349 5,396 5,396 5,396 5,396 5,396 5,396 5,396Less: accumulated amortization - indentifiable intangibles 670 738 793 848 903 958 1,013 1,068Indentifiable intangibles, net 4,679 4,658 4,603 4,548 4,493 4,438 4,383 4,328Deferred income taxes, net 0 4,992 4,320 4,656 4,488 4,572 4,530 4,551Other noncurrent assets 1,092 1,303 1,010 1,271 1,338 1,396 1,456 1,519Total other assets 15,565 20,747 19,727 20,269 20,113 20,200 20,163 20,192Total assets 44,550 52,252 54,121 52,456 54,871 57,656 60,076 61,693
Current maturities of long-term debt & capital leases 1,627 1,547 1,216 1,111 1,326 2,137 2,028 1,158Air traffic liability 3,696 4,122 4,296 4,394 4,624 4,824 5,034 5,252Accounts payable 2,293 2,300 2,622 2,435 2,562 2,673 2,789 2,910Accrued salaries & related benefits 1,680 1,926 2,266 1,987 2,091 2,182 2,277 2,376Frequent flyer deferred revenue 1,806 1,861 1,580 2,060 2,167 2,261 2,359 2,462Hedge derivatives liability - - 2,772 0 0 0 0 0Taxes payable 585 673 0 0 0 0 0 0Other accrued liabilities 1,128 1,121 2,127 1,595 1,678 1,751 1,827 1,906Total current liabilities 13,270 14,152 16,879 13,581 14,448 15,828 16,314 16,064Total long-term debt 10,599 9,396 8,270 7,805 7,092 6,615 6,551 6,543Capital leases 483 399 291 464 323 202 116 72Long-term debt & capital leases 11,082 9,795 8,561 8,269 7,415 6,817 6,667 6,615Pension, postretirement & related benefits 16,005 12,392 15,138 14,381 12,943 11,649 10,484 9,435Frequent flyer deferred revenue 2,628 2,559 2,602 2,874 3,024 3,155 3,292 3,435Other noncurrent liabilities 1,649 1,711 2,128 1,959 2,062 2,151 2,244 2,342Total noncurrent liabilities 33,411 26,457 28,429 27,483 25,444 23,772 22,687 21,827
Additional paid-in capital 14,069 13,982 12,981 12,999 13,017 13,035 13,053 13,071Retained earnings (accumulated deficit) (7,389) 3,049 3,456 6,436 9,347 11,813 14,282 16,510Accumulated other comprehensive income (loss) (8,577) (5,130) (7,311) (6,580) (5,922) (5,330) (4,797) (4,317)Treasury stock, at cost 234 258 313 1,463 1,463 1,463 1,463 1,463Total stockholders' equity (deficit) (2,131) 11,643 8,813 11,392 14,979 18,056 21,076 23,801
Total Liabilities and Stockholders Equity 44,550 52,252 54,121 52,456 54,871 57,656 60,076 61,693

Delta AirlinesCash Flow Statement
Fiscal Years Ending Dec. 31 2010 2011 2012 2013 2014Cash Flows from Operating Activities:Net income (loss) 593 854 1,009 10,540 659Adjustments to reconcile net income to net cash from operating activities:Depreciation & amortization 1,511 1,523 1,565 1,658 1,771Amortization of debt discount (premium), net 216 193 193 154 59Loss (gain) on extinguishment of debt 391 68 56 - 268Fuel hedge derivative instruments (136) 135 (209) (114) -Deferred income taxes 9 (2) 17 (7,991) 414Pension, postretirement & postemployment expense in excess of (less than) payments(301) (308) (208) (624) (723)Equity-based compensation expense 89 72 54 - -Restructuring & other items 182 142 184 285 758SkyMiles used pursuant to advance purchase under American Express Agreements- - (333) (333) -Changes to certain assets and liabilities:Receivables (141) (76) (116) 90 -Hedge margin receivables - (24) - - -Restricted cash & cash equivalents 16 153 (51) 231 62Fuel inventory - - (451) (87) 172Prepaid expenses & other current assets (105) (16) (134) 28 58Air traffic liability 232 174 216 426 174Frequent flyer deferred revenue (345) 82 (115) (121) (238)Accounts payable & accrued liabilities 516 303 899 213 228Other assets & liabilities - (373) (66) (36) -Other operating activities, net 105 (66) (34) 185 217Net cash flows from operating activities 2,832 2,834 2,476 4,504 4,947
Cash flows from investing activities:Property & equipment additions - flight equipment, including advance payments(1,055) (907) (1,196) (2,117) (1,662)Property & equipment additions - ground property & equipment, including technology(287) (347) (772) (451) (587)Decrease (increase) in restricted cash & cash equivalents (2) - - - -Decrease (increase) in short-term investments - - - - -Purchase of Virgin Atlantic shares - - - (360) -Purchase of investments (730) (1,078) (958) (959) (1,795)Redemption of investments - 844 1,019 1,117 1,533Proceeds from sales of flight equipment 36 - - - -Proceeds from sales of investments - - - - -Other investing activities, net 12 (10) (55) 14 48Net cash flows from investing activities (2,026) (1,498) (1,962) (2,756) (2,463)
Cash flows from financing activities:Payments on long-term debt & capital lease obligations (3,722) (4,172) (2,864) (1,461) (2,928)Cash dividends - - - (102) (251)Proceeds from long-term obligations 1,130 2,395 1,965 268 1,020Repurchase of common stock - - - (250) (1,100)Fuel card obligation - 318 137 147 -Debt issuance costs - (63) (41) - -Restricted cash & cash equivalents - (51) - - -Other financing activities, net 71 2 48 78 19Net cash flows from financing activities (2,521) (1,571) (755) (1,320) (3,240)
Net increase (decrease) in cash & cash equivalents (1,715) (235) (241) 428 (756)Cash & cash equivalents at beginning of year 4,607 2,892 2,657 2,416 2,844Cash & cash equivalents at end of year 2,892 2,657 2,416 2,844 2,088

Delta AirlinesForecasted Cash Flow Statement
Fiscal Years Ending Dec. 31 2015E 2016E 2017E 2018E 2019ECash Flows from Operating Activities:Net income (loss) 3,340 3,814 3,461 3,615 3,491Adjustments to reconcile net income to net cash from operating activities:
Depreciation & Amortization (PPE) 1,797 1,878 1,963 2,051 2,143Amortization of Identifiable Intangibles 55 55 55 55 55
Depreciation & Amortization 1,852 1,933 2,018 2,106 2,198Changes in Asset Accounts
Accounts receivable, net 301 (104) (91) (95) (99)Hedge margin receivable 925 0 0 0 0
Fuel inventory (154) (36) (31) (33) (34)Expendable parts & supplies inventories, net (80) (16) (17) (17) (18)
Hedge derivatives asset 1,078 0 0 0 0Current Deffered Tax Asset (448) (528) 393 (171) 138
Prepaid expenses & other current assets (35) (40) (35) (37) (38)Deferred income taxes, net (336) 168 (84) 42 (21)
Other noncurrent assets (261) (66) (58) (61) (63)Changes in Liability Accounts
Air traffic liability 98 230 201 209 219Accounts payable (187) 127 111 116 121
Accrued salaries & related benefits (279) 104 91 95 99Frequent flyer deferred revenue (current) 480 108 94 98 102
Hedge derivatives liability (2,772) 0 0 0 0Other accrued liabilities (532) 83 73 76 79
Frequent flyer deferred revenue (non-current) 272 150 131 137 143Other noncurrent liabilities (169) 102 89 93 97
Net cash flows from operating activities 3,093 6,029 6,346 6,174 6,414
Cash flows from investing activities:Gross PP&E Additions (1,407) (1,470) (1,537) (1,606) (1,678)
Short-term investments (61) (64) (67) (70) (74)
Net cash flows from investing activities (1,468) (1,534) (1,604) (1,676) (1,752)
Cash flows from financing activities:Current maturities of long-term debt & capital leases (105) 215 811 (109) (870)
Long-term debt & capital leases (292) (854) (598) (150) (52)Pension, postretirement & related benefits (757) (1,438) (1,294) (1,165) (1,048)
Proceeds from Common Stock 18 18 18 18 18Repurchase of Common Stock (1,150) 0 0 0 0
Payment of Dividends (360) (903) (995) (1,146) (1,263)Accumulated other comprehensive income (loss) 731 658 592 533 480
Net cash flows from financing activities (1,915) (2,304) (1,466) (2,019) (2,735)
Net increase (decrease) in cash & cash equivalents (290) 2,191 3,276 2,479 1,927Cash & cash equivalents at beginning of year 2,088 1,798 3,989 7,265 9,743Cash & cash equivalents at end of year 1,798 3,989 7,265 9,743 11,670

Delta AirlinesCommon Size Income Statement
1 2 3 4 5Fiscal Years Ending Dec. 31 2012 2013 2014 2015E 2016E 2017E 2018E 2019ETotal operating revenue 100.00% 100.00% 100.00% 100.00% 100.00% 100.00% 100.00% 100.00%
COGS 81.55% 78.34% 81.74% 72.00% 71.00% 73.00% 73.00% 74.00%Depreciation & amortization 4.27% 4.39% 4.39% 4.25% 4.22% 4.23% 4.23% 4.24%Gross Margin 14.18% 17.27% 13.87% 23.75% 24.78% 22.77% 22.77% 21.76%
SG&A 4.34% 4.24% 4.21% 4.47% 4.47% 4.47% 4.47% 4.47%Other operating expense 4.34% 4.02% 4.45% 4.53% 4.53% 4.53% 4.53% 4.53%Total operating expense 94.07% 91.00% 94.53% 85.24% 84.21% 86.22% 86.23% 87.23%Operating Margin (EBIT) 5.51% 9.00% 5.21% 14.76% 15.79% 13.78% 13.77% 12.77%
Operating income (loss) 5.93% 9.00% 5.47% 14.76% 15.79% 13.78% 13.77% 12.77%
Interest expense, net 2.21% 1.85% 1.61% 1.21% 1.10% 0.98% 0.97% 0.90%Amortization of debt discount, net 0.53% 0.41% 0.00% 0.00% 0.00% 0.00% 0.00% 0.00%Interest income - - -Gain (loss) on extinguishment of debt -0.32% 0.00% -0.66% 0.00% 0.00% 0.00% 0.00% 0.00%Miscellaneous, net -0.07% -0.06% -0.54% -0.18% -0.18% -0.18% -0.18% -0.18%Total other income (expense), net -3.14% -2.31% -2.81% -1.39% -1.28% -1.16% -1.15% -1.08%Income (loss) before reorganization items, net - - -Income (loss) before income taxes 2.80% 6.69% 2.66% 13.37% 14.50% 12.61% 12.63% 11.69%Income tax provision (benefit) 0.04% -21.21% 1.02% 5.47% 5.93% 5.16% 5.16% 4.78%
Net income (loss) 2.75% 27.90% 1.63% 7.90% 8.57% 7.46% 7.46% 6.91%

Delta AirlinesCommon Size Balance Sheet ($ millions)
Fiscal Years Ending Dec. 31 2012 2013 2014 2015E 2016E 2017E 2018E 2019ECurrent AssetsCash & cash equivalents 6.59% 7.53% 5.17% 4.25% 8.97% 15.65% 20.11% 23.09%Short-term investments 2.61% 2.54% 3.02% 3.02% 3.02% 3.03% 3.05% 3.07%Accounts receivable, gross 4.72% 4.32% 5.74% 4.84% 4.84% 4.84% 4.84% 4.84%Less: allowance for uncollectible accounts 0.10% 0.06% 0.05% 0.10% 0.10% 0.10% 0.10% 0.10%Accounts receivable, net 4.62% 4.26% 5.69% 4.74% 4.74% 4.74% 4.74% 4.74%Fuel inventory 1.69% 1.87% 1.32% 1.63% 1.59% 1.55% 1.51% 1.47%Expendable parts & supplies inventories, net 1.10% 0.95% 0.79% 0.94% 0.93% 0.93% 0.92% 0.92%Deferred income taxes, net 1.26% 4.60% 8.11% 8.80% 9.55% 8.31% 8.32% 7.70%Prepaid expenses & other current assets 3.67% 3.49% 1.82% 3.28% 3.28% 3.28% 3.28% 3.28%Total current assets 22.56% 25.55% 30.88% 25.18% 30.63% 36.08% 40.57% 42.94%
Gross Property Plant and Equipment 70.07% 72.46% 73.45% 73.95% 73.44% 73.55% 73.67% 73.78%Less: accumulated depreciation & amortization 18.15% 20.63% 23.14% 26.34% 29.25% 32.26% 35.15% 37.93%Property & equipment, net 56.48% 57.86% 54.33% 50.94% 47.49% 44.60% 41.83% 39.16%
Goodwill 26.71% 25.93% 24.27% 24.27% 23.16% 22.01% 21.10% 20.22%Indentifiable intangibles, net 12.76% 12.33% 11.40% 10.48% 9.55% 8.62% 7.70% 6.77%Deferred income taxes, net - 13.22% 10.70% 11.01% 10.09% 9.85% 9.35% 9.00%Other noncurrent assets 2.98% 3.45% 2.50% 3.01% 3.01% 3.01% 3.01% 3.01%Total other assets 42.45% 54.93% 48.88% 47.94% 45.20% 43.51% 41.63% 39.95%Total assets 121.49% 138.33% 134.09% 124.06% 123.32% 124.19% 124.02% 122.06%
Current maturities of long-term debt & capital leases 4.44% 4.10% 3.01% 3.85% 3.65% 3.50% 3.67% 3.61%Air traffic liability 10.08% 10.91% 10.64% 10.39% 10.39% 10.39% 10.39% 10.39%Accounts payable 6.25% 6.09% 6.50% 5.76% 5.76% 5.76% 5.76% 5.76%Accrued salaries & related benefits 4.58% 5.10% 5.61% 4.70% 4.70% 4.70% 4.70% 4.70%Frequent flyer deferred revenue 4.93% 4.93% 3.91% 4.87% 4.87% 4.87% 4.87% 4.87%Taxes payable 1.60% 1.78% 0.00% 0.00% 0.00% 0.00% 0.00% 0.00%Fuel card obligation 1.24% 1.59% 0.00% 0.94% 0.94% 0.94% 0.94% 0.94%Other accrued liabilities 3.08% 2.97% 5.27% 3.77% 3.77% 3.77% 3.77% 3.77%Total current liabilities 36.19% 37.47% 41.82% 34.28% 34.09% 33.94% 34.10% 34.04%
Total long-term debt 28.90% 24.87% 20.49% 18.46% 15.94% 14.25% 13.52% 12.95%Capital leases 1.32% 1.06% 0.72% 1.10% 0.73% 0.44% 0.24% 0.14%Long-term debt & capital leases 30.22% 25.93% 21.21% 19.56% 16.67% 14.68% 13.76% 13.09%Pension, postretirement & related benefits 43.65% 32.81% 37.51% 34.01% 29.09% 25.09% 21.64% 18.67%Frequent flyer deferred revenue 7.17% 6.77% 6.45% 6.80% 6.80% 6.80% 6.80% 6.80%Deferred income taxes, net 5.58% - - 5.81% 5.81% 5.81% 5.81% 5.81%Other noncurrent liabilities 4.50% 4.53% 5.27% 4.63% 4.63% 4.63% 4.63% 4.63%Total noncurrent liabilities 91.11% 70.04% 70.44% 90.36% 79.65% 71.69% 66.40% 62.08%
Additional paid-in capital 38.37% 37.02% 32.16% 30.74% 29.25% 28.08% 26.95% 25.86%Retained earnings (accumulated deficit) -20.15% 8.07% 8.56% 15.22% 21.01% 25.45% 29.48% 32.67%Accumulated other comprehensive income (loss) -23.39% -13.58% -18.11% -15.56% -13.31% -11.48% -9.90% -8.54%Treasury stock, at cost 0.64% 0.68% 0.78% 3.46% 3.29% 3.15% 3.02% 2.89%Total stockholders' equity (deficit) -5.81% 30.82% 21.83% 26.94% 33.66% 38.89% 43.51% 47.09%

Delta AirlinesValue Driver Estimation($ millions)Fiscal Years Ending Dec. 31 2012 2013 2014 2015E 2016E 2017E 2018E 2019ENOPLATNet Sales 36,670 37,773 40,362 42,283 44,495 46,425 48,440 50,543Operating Expenses (34,495) (34,373) (38,156) (36,044) (37,472) (40,028) (41,769) (44,091)Implied Interest on operating leases 556 536 455 516 502 491 503 499EBITA 2,731 3,936 2,661 6,755 7,526 6,888 7,174 6,951
Tax Provision 16 (8,013) 413 2,312 2,639 2,395 2,502 2,416Marginal Tax Rate 42.3% 37.6% 40.9% 40.9% 40.9% 40.9% 40.9% 40.9%Tax Shield on Interest Expense 343 262 266 209 201 187 192 186Tax Shield Amortization of debt discount, net 82 58 0 0 0 0 0 0
Tax Shield on (loss) on extinguishment of debt 50 0 110 0 0 0 0 0Tax on Miscellaneous, net 11 8 88 31 33 34 35 37Tax Shield on Implied Lease Interest 235 202 186 211 205 201 206 204Total Adjusted Taxes 738 (7,483) 1,063 2,763 3,078 2,817 2,934 2,843
Change in Deferred Tax Liability 17 (8,312) (867) (784) (360) 309 (129) 117
NOPLAT 2,010 3,107 731 3,208 4,088 4,380 4,111 4,225
Invested CapitalNormal Cash (Ave cash 7.7%) 2,824 2,909 3,108 3,256 3,426 3,575 3,730 3,892Accounts Receivable 1,693 1,609 2,297 1,996 2,101 2,192 2,287 2,386Fuel Inventory 619 706 534 688 724 755 788 822Expendable parts & supplies inventories, net 404 357 318 398 413 430 447 465Prepaid Expenses & other current assets 1,344 1,318 733 768 808 843 880 918Operating Current Assets 6,884 6,899 6,990 7,105 7,472 7,795 8,131 8,483
Air traffic liability 3,696 4,122 4,296 4,394 4,624 4,824 5,034 5,252Accounts payable 2,293 2,300 2,622 2,435 2,562 2,673 2,789 2,910Accrued salaries & related benefits 1,680 1,926 2,266 1,987 2,091 2,182 2,277 2,376Frequent flyer deferred revenue 1,806 1,861 1,580 2,060 2,167 2,261 2,359 2,462Taxes payable 585 673 0 0 0 0 0 0Fuel card obligation 455 602 0 0 0 0 0 0Other accrued liabilities 1,128 1,121 2,127 1,595 1,678 1,751 1,827 1,906Operating Current Liabilities 11,643 12,605 12,891 12,470 13,122 13,691 14,286 14,906
Gross PP&E 27,369 29,646 31,269 32,676 34,147 35,683 37,289 38,967Less: Accumulated Depreciation 6,656 7,792 9,340 11,137 13,015 14,978 17,029 19,172Net PP&E 20,713 21,854 21,929 21,539 21,131 20,705 20,260 19,795
PV of Operating Leases 10,254 8,697 9,693 9,520 9,340 9,152 8,955 8,749Indentifiable intangibles, net 4,679 4,658 4,603 4,548 4,493 4,438 4,383 4,328Other noncurrent assets 1,092 1,303 1,010 1,271 1,338 1,396 1,456 1,519Net Other Operating Assets 16,025 14,658 15,306 15,339 15,170 14,985 14,794 14,597
Frequent flyer deferred revenue 2,628 2,559 2,559 2,559 2,559 2,559 2,559 2,559Other noncurrent liabilities 1,649 1,711 1,711 1,711 1,711 1,711 1,711 1,711Net Other Operating Liabilities 4,277 4,270 4,270 4,270 4,270 4,270 4,270 4,270
Invested Capital 27,702 26,535 27,063 27,243 26,381 25,524 24,630 23,699
DriversNOPLAT 2,010 3,107 731 3,208 4,088 4,380 4,111 4,225Beginning Invested Capital 27,787 27,702 26,535 27,063 27,243 26,381 25,524 24,630Return on Invested Capital (ROIC) 7.24% 11.22% 2.75% 11.85% 15.01% 16.60% 16.11% 17.15%Free Cash Flow (FCF) 2,096 4,274 203 3,028 4,950 5,237 5,005 5,156Economic Profit (EP) 106 1,209 (1,088) 1,353 2,221 2,572 2,361 2,537
Net Income 1,009 10,540 659 3,340 3,814 3,461 3,615 3,491Average Equity (1,764) 4,756 10,228 10,103 13,186 16,518 19,566 22,438ROE (Net Income/Average Equity) -57.22% 221.61% 6.44% 33.07% 28.93% 20.95% 18.47% 15.56%

Delta Airlines Equity Weight (billions)Weighted Average Cost of Capital (WACC) Estimation Mkt Cap 38,980Cost of Equity 8.71%Cost of Debt 5.23% Debt Weight (billions)WACC 6.85% Mkt Debt 19,179
WACC Calculation 6.85% Value of Total DebtFair Value of Debt 9,486PV Operatings Leases 9,693
19,17930 year Treasury Yield 2.70%
D/E Ratio 0.49
Ave of Implied and Historical 4.85%
Beta BloombergBloomberg 1.2382 Weekly Monthly
1 yr 1.384 1.0562 yr 1.425 1.17
Delt Air Lines 2007-1 Class B Pass Through Trust5.23% 3 yr 1.224 0.5644 yr 1.098 0.9875 yr 1.06 0.785
5 yr ave 1.2382
Risk Free Rate
Equity Premium
Beta
Cost of Debt

Delta AirlinesDiscounted Cash Flow (DCF) and Economic Profit (EP) Valuation Models
Key Inputs: CV Growth 3.00% CV ROIC 17.2% WACC 6.85% Cost of Equity 8.71%
Fiscal Years Ending Dec. 31 2015E 2016E 2017E 2018E 2019EDCF Model 1 2 3 4 4NOPLAT 3,208 4,088 4,380 4,111 4,225Begin IC 27,063 27,243 26,381 25,524 24,630Ending IC 27,243 26,381 25,524 24,630 23,699∆ Invested Capital 180 (862) (858) (894) (931)Free Cash Flow 3,028 4,950 5,237 5,005 5,156ROIC 11.9% 15.0% 16.6% 16.1% 17.2%
FCF 3,028 4,950 5,237 5,005 5,156Continuing Value 90,451
2,834 4,335 4,293 3,839 69,383
Value of Operating Assets 84,684+ST Investments 1,217+Excess Cash 1,281- Total Debt (9,486)- PV of Operating Leases (9,693)-PV of ESOP (260)Underfunded Pension & Retirement Liabilities (15,138)Value of Equity 52,605Shares Outstanding 825.258Intrinsic Value (per share) 12/31/2014 $63.74Price Today 4/21/15 $65.26EP Model
NOPLAT 3,208 4,088 4,380 4,111 4,225Beginning IC 27,063 27,243 26,381 25,524 24,630Ending IC 27,243 26,381 25,524 24,630 23,699ROIC 11.9% 15.0% 16.6% 16.1% 17.2%Economic Profit 1,353 2,221 2,572 2,361 2,537Continuing Value 65,821
1,266 1,945 2,108 1,811 50,490
Present Value of EP 57,620Beginning IC 27,063Value of Operationg Assets 84,684+ST Investments 1,217'+Excess Cash 1,281- Total Debt (9,486)-PV of Operating Leases (9,693)-PV of ESOP (260)-Underfunded Pension & Retirement Liabilities (15,138)Value of Equity 52,605Shares Outstanding 825.258Intrinsic Value (per share) 12/31/2014 $63.74Price Today 4/21/15 $65.26
Presevent Value of FCF discounted by WACC
Present Value of EP discounted by WACC

Delta AirlinesDividend Discount Model (DDM) or Fundamental P/E Valuation Model
Fiscal Years Ending Dec. 31 2015E 2016E 2017E 2018E 2019E
EPS 4.17$ 4.75$ 4.31$ 4.49$ 4.33$
Key Assumptions CV growth 3.00% CV ROE 15.56% Cost of Equity 8.71%
Future Cash Flows P/E Multiple (CV Year) 14.15 EPS (CV Year) 4.33$ Future Stock Price 61.23 Future Cash Flows 2.73 3.11 2.82 2.94 2.84$
Discounted Cash Flows 2.51 2.64 2.20 2.11 43.85
Intrinsic Value 12/31/2014 53.30$Price as of Today (4/21/15) 54.57$

Delta AirlinesRelative Valuation ModelsEPS (GAAP) EPS EPSTicker Company Price 2015E 2016E P/E 15 P/E 16AAL American Airlines $51.52 $10.00 $9.15 5.2 5.6UAL United Continental $70.89 $10.95 $10.32 6.5 6.9LUV Southwest Airlines $45.35 $3.55 $3.66 12.8 12.4ALK Alaska Airlines $64.43 $6.22 $6.24 10.4 10.3JBLU JetBlue Airlines $18.07 $1.70 $1.78 10.6 10.2SAVE Spirit Airlines $75.98 $5.18 $5.65 14.7 13.4ALGT Allegiant Airlines $186.06 $11.37 $11.65 16.4 16.0
Average 13.0 12.5
DAL Delta Airlines $45.35 $4.17 $4.75 10.9 9.5$4.86 $5.66
Implied Value: Relative P/E (EPS15) $ 54.04 Relative P/E (EPS16) 59.20$
Analyst Estimate (EPS GAAP)

Delta AirlinesKey Management Ratios
Fiscal Years Ending Dec. 31 2012 2013 2014 2015E 2016E 2017E 2018E 2019E
Liquidity RatiosCash Ratio (Cash + ST)/Current L 0.25 0.27 0.20 0.23 0.37 0.55 0.69 0.82Current Ratio 0.62 0.68 0.74 0.78 0.94 1.06 1.20 1.35Operating Cash Flows/Current L 0.19 0.32 0.29 0.23 0.42 0.40 0.38 0.40
Activity or Asset-Management RatiosAsset Turnover Ratio (sales/ave assets) 0.83 0.78 0.76 0.79 0.83 0.83 0.82 0.83Receivables Turnover (sales/ave rec) 22.52 22.88 20.67 19.70 21.72 21.63 21.63 21.63Fixed Asset Turnover (Sales/ave PPE) 1.79 1.77 1.84 1.95 2.09 2.22 2.36 2.52
Financial Leverage RatiosDebt Ratio (total assets/total liabilities) 0.95 1.29 1.19 1.28 1.38 1.46 1.54 1.63Debt/Equity Ratio (Total liabilities/total equity) (21.91) 3.49 5.14 3.60 2.66 2.19 1.85 1.59
2.68 4.87 3.39 12.20 14.32 13.99 14.25 14.19
Profitability RatiosEBIT Margin 2.8% 6.7% 2.7% 13.4% 14.5% 12.6% 12.6% 11.7%ROA (Net Income/Ave Assets) 2.3% 21.8% 1.2% 6.3% 7.1% 6.2% 6.1% 5.7%ROE (Net Income/Ave Equity) -57.2% 221.6% 6.4% 33.1% 28.9% 21.0% 18.5% 15.6%
Payout Policy RatiosPayout Ratio - 0.01 0.46 0.45 0.24 0.29 0.32 0.36
Interest Coverage Ratio (operating income/interestexpense)