Delivering Positive Energy - Adaro · Persada (BEP) Coal mining, E Kalimantan 100% 75% 75% 61% 25%...
34
Delivering Positive Energy September 2013
Transcript of Delivering Positive Energy - Adaro · Persada (BEP) Coal mining, E Kalimantan 100% 75% 75% 61% 25%...
Delivering Positive Energy
September 2013

Disclaimer
2
These materials have been prepared by PT Adaro Energy (the “Company”) and have not been
independently verified. No representation or warranty, expressed or implied, is made and no reliance
should be placed on the accuracy, fairness or completeness of the information presented or contained in
these materials. The Company or any of its affiliates, advisers or representatives accepts no liability
whatsoever for any loss howsoever arising from any information presented or contained in these materials.
The information presented or contained in these materials is subject to change without notice and its
accuracy is not guaranteed.
These materials contain statements that constitute forward-looking statements. These statements include
descriptions regarding the intent, belief or current expectations of the Company or its officers with respect
to the consolidated results of operations and financial condition of the Company. These statements can be
recognized by the use of words such as “expects,” “plan,” “will,” “estimates,” “projects,” “intends,” or words
of similar meaning. Such forward-looking statements are not guarantees of future performance and
involve risks and uncertainties, and actual results may differ from those in the forward-looking statements
as a result of various factors and assumptions. The Company has no obligation and does not undertake to
revise forward-looking statements to reflect future events or circumstances.
These materials are for information purposes only and do not constitute or form part of an offer,
solicitation or invitation of any offer to buy or subscribe for any securities of the Company, in any
jurisdiction, nor should it or any part of it form the basis of, or be relied upon in any connection with, any
contract, commitment or investment decision whatsoever. Any decision to purchase or subscribe for any
securities of the Company should be made after seeking appropriate professional advice.
Agenda
I. Corporate Information
II. Adaro’s Strategy
III. Industry Outlook
3

I. Corporate Information
4

5
Adaro Energy Snapshot
• Largest single-location coal
producer in southern hemisphere
• Top 5 thermal coal exporter globally
• Largest supplier to domestic market
• One of the world’s lowest cost coal
producers
• Envirocoal among world’s most
environmentally friendly coal
• Vertically integrated business model
• Strong credit profile
• High visibility of future earnings
• Reputable and experienced
management and controlling
shareholders
Production
2010A: 42.2 Mt
2011A: 47.7 Mt
2012A: 47.2 Mt (5 year CAGR 6%)
Envirocoal
Sub-bituminous, medium calorific
value, ultra-low pollutants
Trademark registered in many
jurisdictions
Customers 53 customers in 15 countries
Blue-chip power generation utilities
Pricing Fixed price and index-linked
Adjustment for heat content
JORC reserves
/ resources
Reserves: 1.1 Bt as of YE2012
Resources: 12.3 Bt (includes option to
control 7 Bt) as of YE2012
Location South, East, Central Kalimantan,
South Sumatra
License First generation Coal Cooperation
Agreement valid until 2022 (AI)

Key Messages
• On track to deliver on our long-term strategy to create maximum value from Indonesian coal.
• Focus on core business, operational excellence, risk reduction and customers.
• Monitor and reduce expenses and capital expenditures to preserve cash.
• Continue to improve efficiency and create reliable, safe, long-term growth.
• Maintain strong capital structure and margins.
• Continue to maintain diversified customer base with long-term contracts mostly with sovereign backed power companies. Our exposure to China was only 5% in 1H13.
6

7
Recent Performance: On Track
• EBITDA US$413 million for 1H13 with
an EBITDA margin of 26.2%,
amongst the best in the industry.
• Adaro Energy coal cash cost of
US$35.51 per tonne in 1H13 was in-
line with guidance of US$35 to US$38
per tonne and 7% lower y-o-y.
• Liquidity and our Balance Sheet
remain strong with access to cash of
nearly US$1 billion and net debt to
EBITDA of 2.14x at the end of 1H13.
• We achieved record quarterly
production volume in 2Q13 of
13.52 Mt, bringing 1H13 total to
24.94 Mt. On track to achieve 2013
production guidance of 50 to 53 Mt.
• Production volume of E5000 from
Paringin increased more than four
times y-o-y in 1H13 to 2.52 Mt.
• Overburden removal was 142.07
million bank cubic meters (Mbcm) in
1H13, 9% lower y-o-y.
Adaro’s Operational and Financial Highlights
8
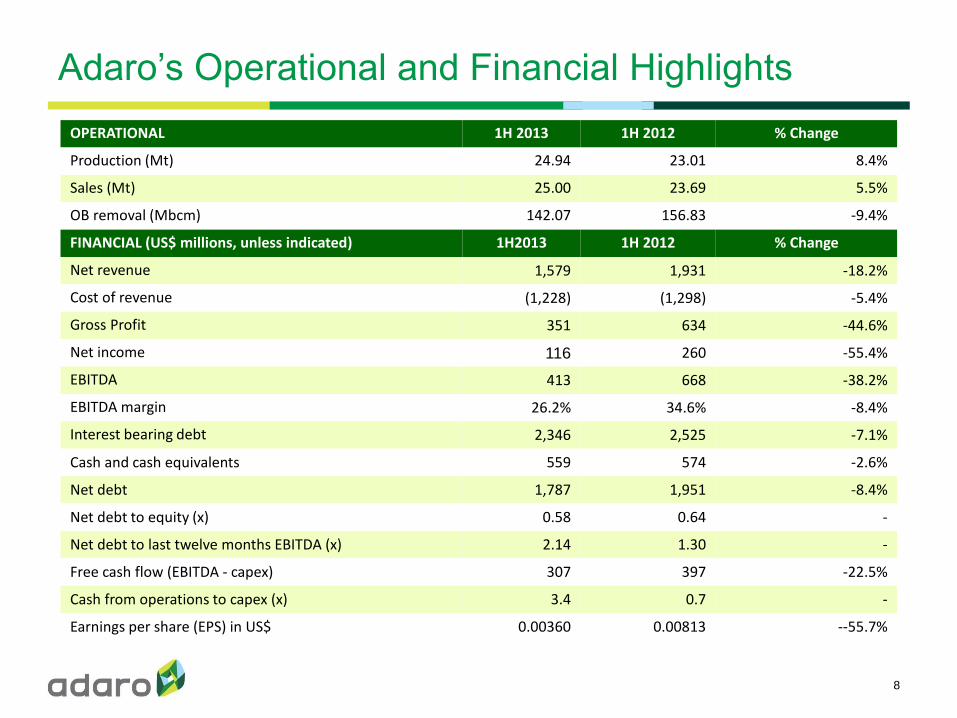
OPERATIONAL 1H 2013 1H 2012 % Change
Production (Mt) 24.94 23.01 8.4%
Sales (Mt) 25.00 23.69 5.5%
OB removal (Mbcm) 142.07 156.83 -9.4%
FINANCIAL (US$ millions, unless indicated) 1H2013 1H 2012 % Change
Net revenue 1,579 1,931 -18.2%
Cost of revenue (1,228) (1,298) -5.4%
Gross Profit 351 634 -44.6%
Net income 116 260 -55.4%
EBITDA 413 668 -38.2%
EBITDA margin 26.2% 34.6% -8.4%
Interest bearing debt 2,346 2,525 -7.1%
Cash and cash equivalents 559 574 -2.6%
Net debt 1,787 1,951 -8.4%
Net debt to equity (x) 0.58 0.64 -
Net debt to last twelve months EBITDA (x) 2.14 1.30 -
Free cash flow (EBITDA - capex) 307 397 -22.5%
Cash from operations to capex (x) 3.4 0.7 -
Earnings per share (EPS) in US$ 0.00360 0.00813 --55.7%
2013 Guidance
9
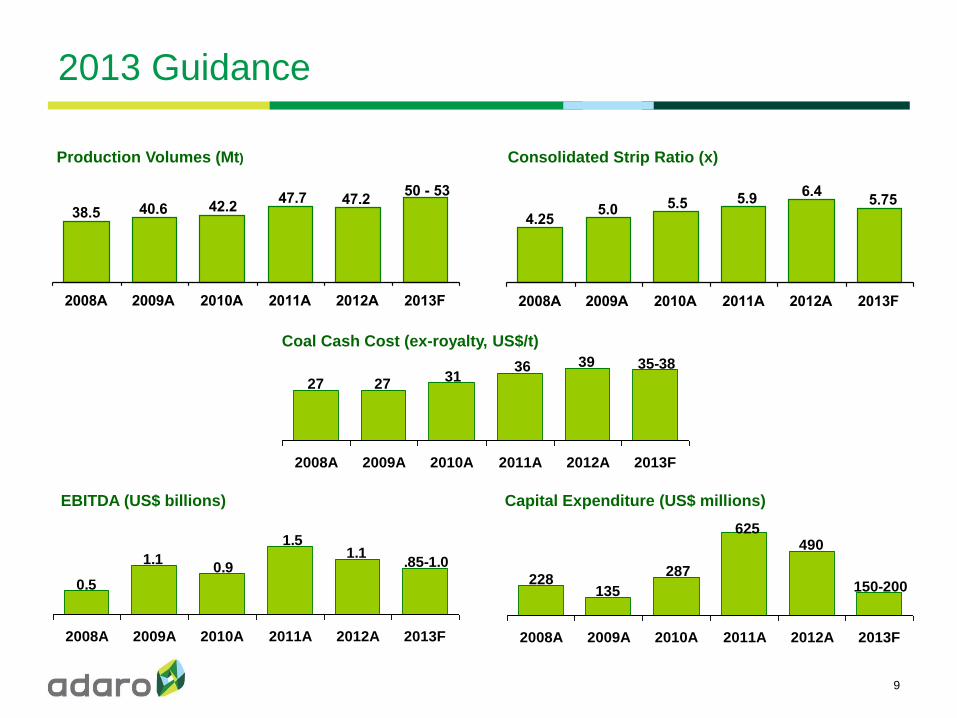
Production Volumes (Mt)
50 - 53
38.5 40.6 42.247.7 47.2
2008A 2009A 2010A 2011A 2012A 2013F
6.45.95.55.0
4.25
5.75
2008A 2009A 2010A 2011A 2012A 2013F
393631
2727
35-38
2008A 2009A 2010A 2011A 2012A 2013F
Consolidated Strip Ratio (x)
Coal Cash Cost (ex-royalty, US$/t)
Capital Expenditure (US$ millions) EBITDA (US$ billions)
150-200228
135
287
625490
2008A 2009A 2010A 2011A 2012A 2013F
.85-1.0
0.5
1.10.9
1.51.1
2008A 2009A 2010A 2011A 2012A 2013F
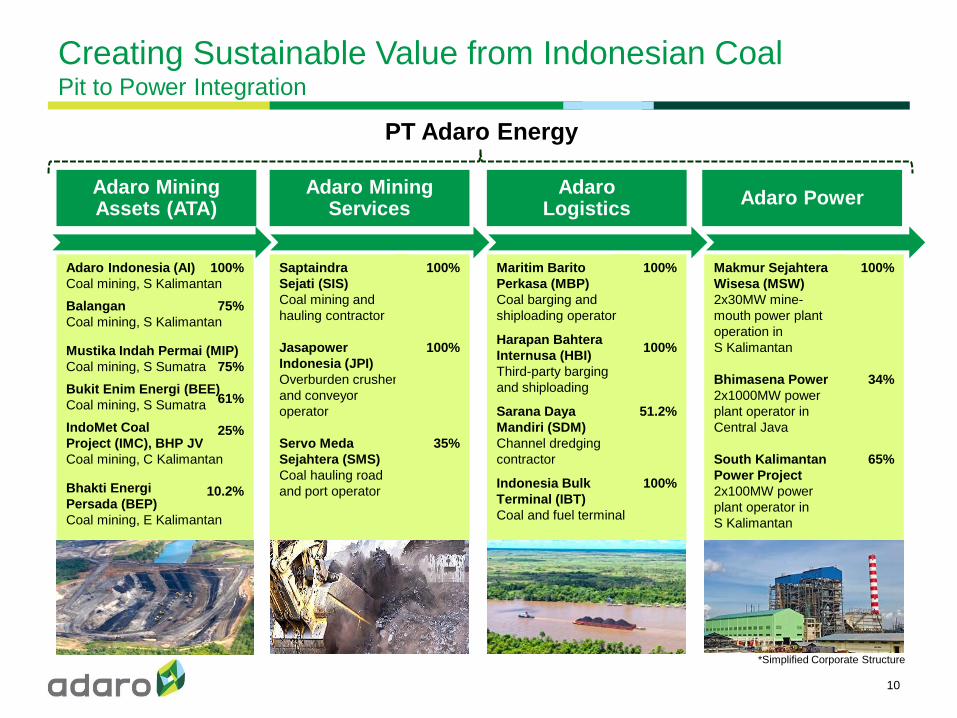
Adaro Indonesia (AI)
Coal mining, S Kalimantan
Balangan
Coal mining, S Kalimantan
Mustika Indah Permai (MIP)
Coal mining, S Sumatra
Bukit Enim Energi (BEE)
Coal mining, S Sumatra
IndoMet Coal
Project (IMC), BHP JV
Coal mining, C Kalimantan
Bhakti Energi
Persada (BEP)
Coal mining, E Kalimantan
100%
75%
75%
61%
25%
10.2%
Saptaindra
Sejati (SIS)
Coal mining and
hauling contractor
Jasapower
Indonesia (JPI)
Overburden crusher
and conveyor
operator
Servo Meda
Sejahtera (SMS)
Coal hauling road
and port operator
100%
100%
35%
100%
100%
51.2%
100%
Makmur Sejahtera
Wisesa (MSW)
2x30MW mine-
mouth power plant
operation in
S Kalimantan
Bhimasena Power
2x1000MW power
plant operator in
Central Java
South Kalimantan
Power Project
2x100MW power
plant operator in
S Kalimantan
100%
34%
65%
Maritim Barito
Perkasa (MBP)
Coal barging and
shiploading operator Harapan Bahtera
Internusa (HBI)
Third-party barging
and shiploading Sarana Daya
Mandiri (SDM)
Channel dredging
contractor Indonesia Bulk
Terminal (IBT)
Coal and fuel terminal
Creating Sustainable Value from Indonesian Coal Pit to Power Integration
10
PT Adaro Energy
Adaro Mining Assets (ATA)
Adaro Mining Services
Adaro Logistics
Adaro Power
*Simplified Corporate Structure
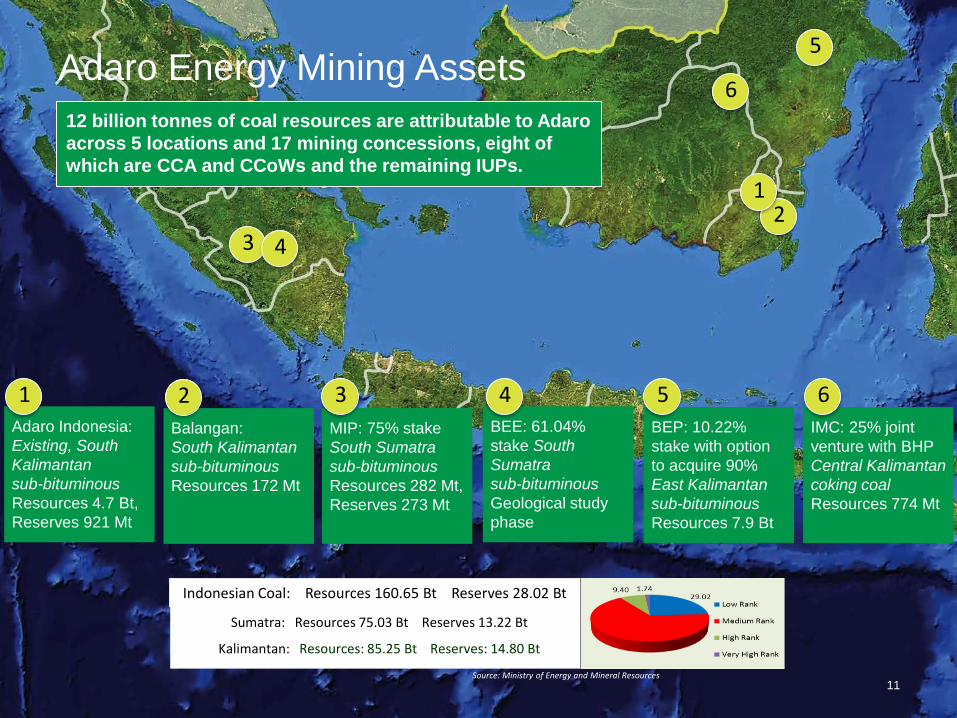
Adaro Energy Mining Assets
11
Sumatra: Resources 75.03 Bt Reserves 13.22 Bt
Kalimantan: Resources: 85.25 Bt Reserves: 14.80 Bt
Indonesian Coal: Resources 160.65 Bt Reserves 28.02 Bt
Source: Ministry of Energy and Mineral Resources
12 billion tonnes of coal resources are attributable to Adaro
across 5 locations and 17 mining concessions, eight of
which are CCA and CCoWs and the remaining IUPs.
Adaro Indonesia:
Existing, South
Kalimantan
sub-bituminous
Resources 4.7 Bt,
Reserves 921 Mt
MIP: 75% stake
South Sumatra
sub-bituminous
Resources 282 Mt,
Reserves 273 Mt
BEE: 61.04%
stake South
Sumatra
sub-bituminous
Geological study
phase
IMC: 25% joint
venture with BHP
Central Kalimantan
coking coal
Resources 774 Mt
3 4
5
6
1 3 4 6
BEP: 10.22%
stake with option
to acquire 90%
East Kalimantan
sub-bituminous
Resources 7.9 Bt
5
Balangan:
South Kalimantan
sub-bituminous
Resources 172 Mt
2
2 1
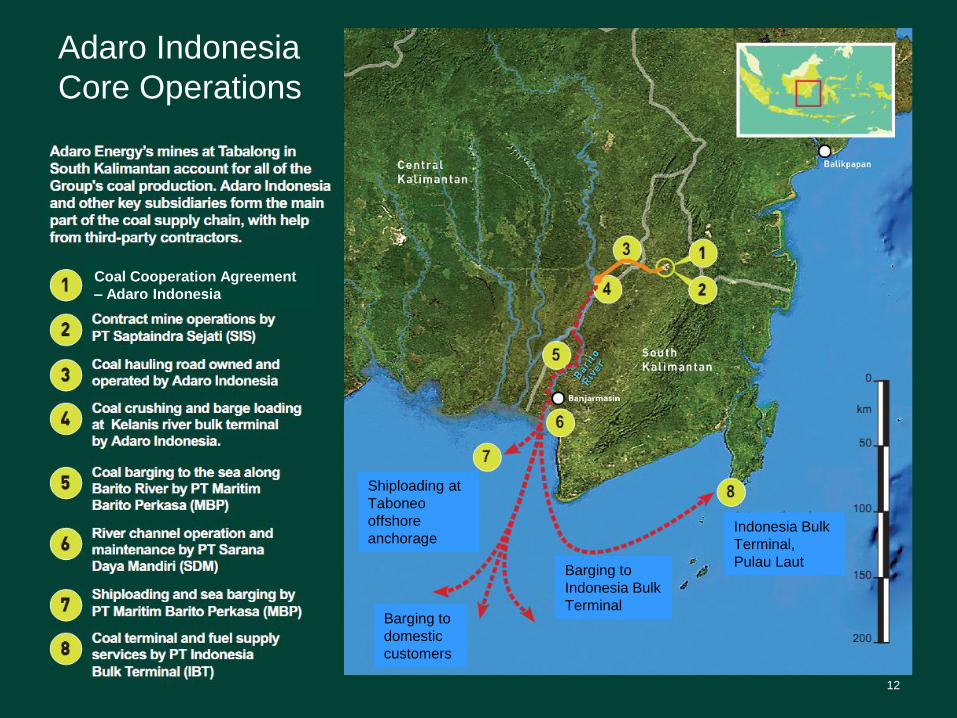
Adaro Indonesia
Core Operations
12
Barging to
Indonesia Bulk
Terminal
Indonesia Bulk
Terminal,
Pulau Laut
Coal Cooperation Agreement
– Adaro Indonesia
Shiploading at
Taboneo
offshore
anchorage
Barging to
domestic
customers
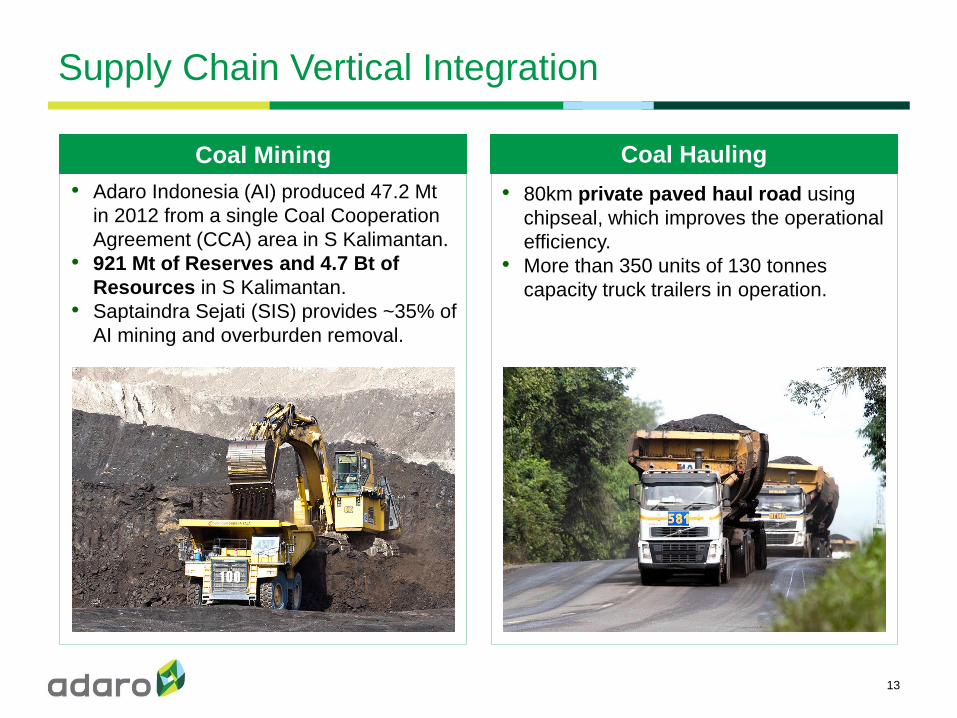
Supply Chain Vertical Integration
13
• Adaro Indonesia (AI) produced 47.2 Mt
in 2012 from a single Coal Cooperation
Agreement (CCA) area in S Kalimantan.
• 921 Mt of Reserves and 4.7 Bt of
Resources in S Kalimantan.
• Saptaindra Sejati (SIS) provides ~35% of
AI mining and overburden removal.
Coal Mining
• 80km private paved haul road using
chipseal, which improves the operational
efficiency.
• More than 350 units of 130 tonnes
capacity truck trailers in operation.
Coal Hauling

Supply Chain Vertical Integration
14
At Kelanis river terminal:
• Expanding to reach 70 Mt
coal-handling capacity per year.
• 450,000 tonne stockpile + 80,000 tonnes
ROM capacity.
• 2 barge loading jetties with a loading
rate of 5,000 tonnes/hr each.
Coal Processing & Barge Loading Barging
• Supported by our subsidiary,
PT Maritim Barito Perkasa (MBP).
• 55 sets of tugs and barges used by
Adaro with an average capacity of
11,750dwt, including three sets of
18,000dwt units.
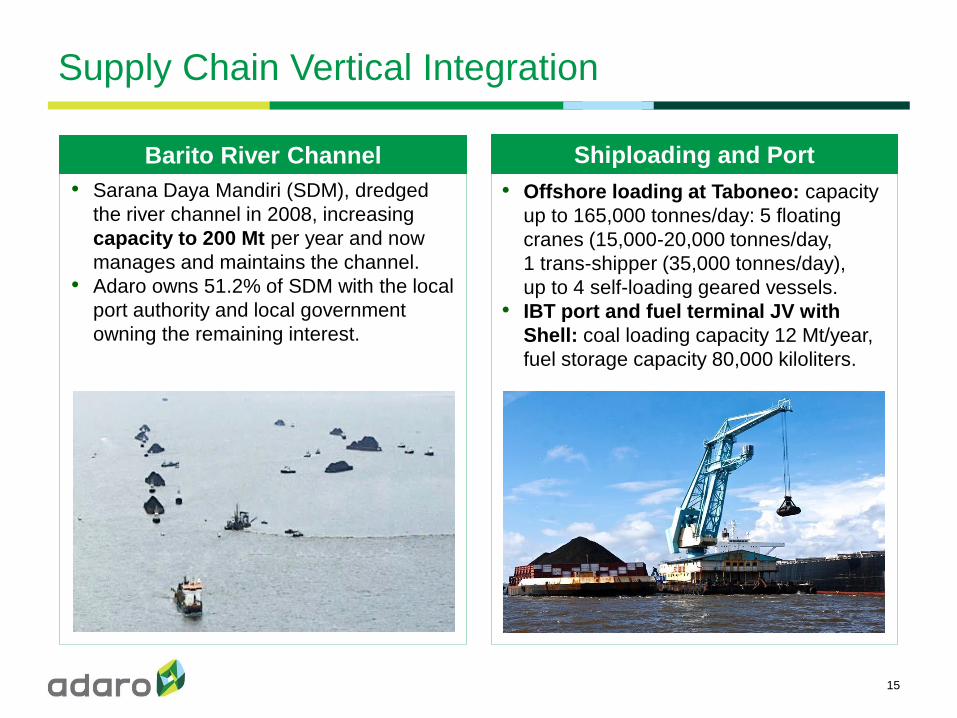
Shiploading and Port
Supply Chain Vertical Integration
15
• Offshore loading at Taboneo: capacity
up to 165,000 tonnes/day: 5 floating
cranes (15,000-20,000 tonnes/day,
1 trans-shipper (35,000 tonnes/day),
up to 4 self-loading geared vessels.
• IBT port and fuel terminal JV with
Shell: coal loading capacity 12 Mt/year,
fuel storage capacity 80,000 kiloliters.
• Sarana Daya Mandiri (SDM), dredged
the river channel in 2008, increasing
capacity to 200 Mt per year and now
manages and maintains the channel.
• Adaro owns 51.2% of SDM with the local
port authority and local government
owning the remaining interest.
Barito River Channel

Diversified Customer Base with Long-term Contracts
16
Mostly sovereign backed power companies, over 50% have relationship more than 10 years
Customer type by % volume (1H13) Geographical breakdown of customers (1H13)
0
2
4
6
8
11
13
2005 2006 2007 2008 2009 2010 2011 2012
Domestic sales (Mt)
0
5
10
15
20
25
30
35
2005 2006 2007 2008 2009 2010 2011 2012
Exports to Asia (Mt)
Indonesia & Asia are key sales destinations; Europe & Americas accounted for 16% in 2012
0
10
20
30
40
50
60
2013 2014 2015 2016 2017-
2022
Contracted tonnage (Mt)
91%
1%
7%
Power
Cement
Others
Indonesia,
20%
India, 22%
Japan, 12% Hong Kong
9%
Korea,
8%
Spain, 7%
Malaysia,
7%
China, 5%
America,
3%
Taiwan, 2% Others, 4%
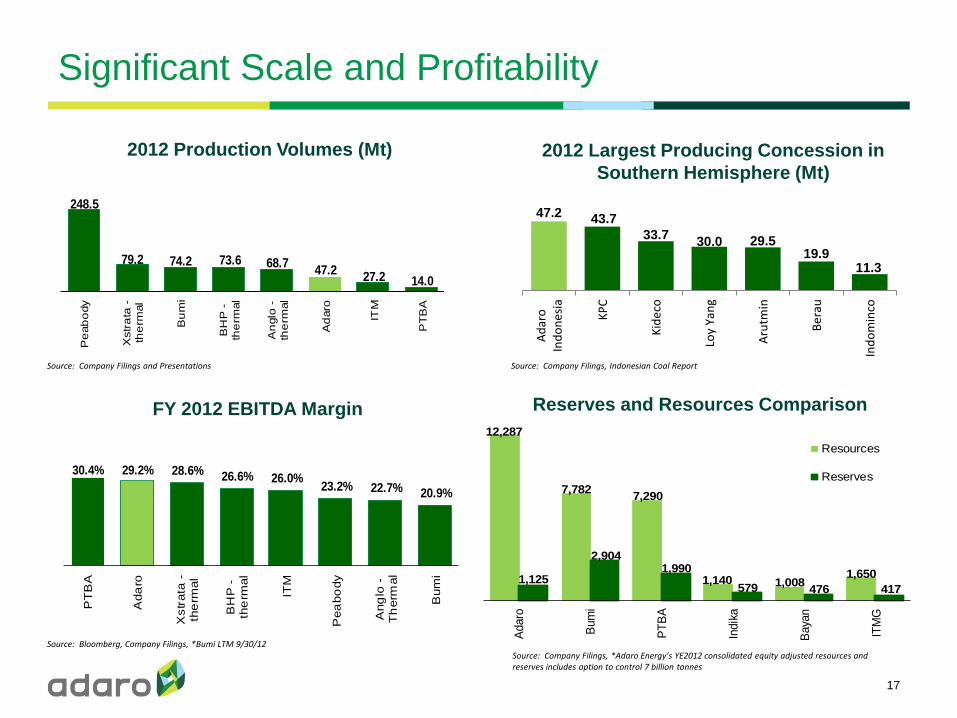
1,125
2,9041,990
579 476 417
7,7827,290
1,140 1,0081,650
Adaro
Bum
i
PT
BA
Indik
a
Baya
n
ITM
G
Resources
Reserves
12,287
Significant Scale and Profitability
17
2012 Production Volumes (Mt)
248.5
79.2 74.2 73.6 68.727.2 14.0
47.2
Pe
ab
ody
Xstr
ata
-th
erm
al
Bu
mi
BH
P -
the
rmal
An
glo
-th
erm
al
Ad
aro
ITM
PT
BA
29.2% 28.6% 26.6% 26.0%23.2% 22.7% 20.9%
30.4%
PT
BA
Ada
ro
Xstr
ata
-th
erm
al
BH
P -
the
rmal
ITM
Pea
bo
dy
Ang
lo -
Th
erm
al
Bum
i
Source: Company Filings and Presentations
FY 2012 EBITDA Margin Reserves and Resources Comparison
2012 Largest Producing Concession in
Southern Hemisphere (Mt)
Source: Bloomberg, Company Filings, *Bumi LTM 9/30/12
Source: Company Filings, Indonesian Coal Report
Source: Company Filings, *Adaro Energy’s YE2012 consolidated equity adjusted resources and reserves includes option to control 7 billion tonnes
47.2 43.7
33.7 30.0 29.5
19.9 11.3
Ad
aro
Ind
on
esi
a
KP
C
Kid
eco
Loy
Yan
g
Aru
tmin
Be
rau
Ind
om
inco
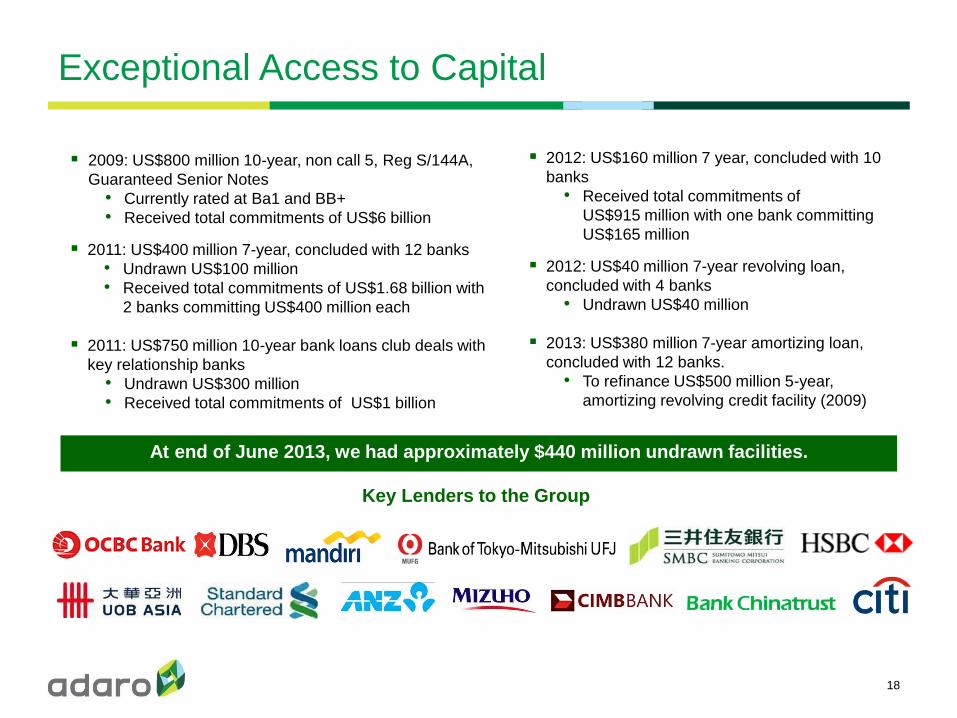
Exceptional Access to Capital
18
Key Lenders to the Group
At end of June 2013, we had approximately $440 million undrawn facilities.
2009: US$800 million 10-year, non call 5, Reg S/144A,
Guaranteed Senior Notes
• Currently rated at Ba1 and BB+
• Received total commitments of US$6 billion
2011: US$400 million 7-year, concluded with 12 banks
• Undrawn US$100 million
• Received total commitments of US$1.68 billion with
2 banks committing US$400 million each
2011: US$750 million 10-year bank loans club deals with
key relationship banks
• Undrawn US$300 million
• Received total commitments of US$1 billion
2012: US$160 million 7 year, concluded with 10
banks
• Received total commitments of
US$915 million with one bank committing
US$165 million
2012: US$40 million 7-year revolving loan,
concluded with 4 banks
• Undrawn US$40 million
2013: US$380 million 7-year amortizing loan,
concluded with 12 banks.
• To refinance US$500 million 5-year,
amortizing revolving credit facility (2009)

Reputable Shareholders and Experienced Management
19
• Edwin Soeryadjaya
• Teddy Rachmat
• Boy Garibaldi Thohir
• Benny Subianto
• Sandiaga Uno
together
hold 64%
Reputable and Supportive Shareholders Management Team with Proven Track Record
Strong Corporate Governance Structure
In Line with International Best Practices
• No family has outright control
• Two of six Commissioners are independent
• Audit Committee consists of all independent
members
• Conduct regular internal audit of operations
• Disclosure exceeds international standards
47.2
26.7
2005 2012
Production (Mt)
76%
714
84
2005 2012
PBT (US$ millions) 1094%
1.8x
6.3x
2005 2012
Net Debt/EBITDA
(71)%
• More than 100 years of combined industry experience
• Combined 64 years at Adaro Energy

PROPER Gold Award for the year 2012 Adaro Indonesia received the highest level
PROPER award for environmental rehabilitation
excellence. The only Indonesian mining company
to receive this award. Presented by Minister of
Environment of Republic of Indonesia.
CSR Commitment has been Recognized
20
PROPER Green Award for the years 2006,
2008, 2010 and 2011 Adaro Indonesia is the only Indonesian mining
company to receive this award for four times.
Platinum Category in Indonesian Corporate
Social Responsibility Awards 2008 and 2011 This award is presented every three years. In 2011,
we received two platinum awards for free cataract
eradication and clean water programs. Presented by
Minister of Social Affairs of Republic of Indonesia.
Platinum Category in GKPM Awards 2010,
2011 and 2012 In 2012, we received three platinum awards for high-
yield rubber plantations development program,
microfinance programs and empowerment of poor
households program. Presented by Minister of
People’s Welfare of Republic of Indonesia.
Primaniyarta Award in 2007, 2010 and 2011 Best performing exporters from the Ministry of
Trade. Presented by Indonesia’s Vice President
Boediono.
Aditama Gold Award in 2010, 2011 and 2012 For environmental excellence in the coal sector.
Presented by Director General of Mineral Coal
and Geothermal (ESDM).
Platts Top 250 Global Energy Awards
in 2011 and 2012 No 9 in Coal and Consumables Energy in
Asia and No 12 in Coal and Consumable
Energy Globally.
One of the largest Taxpayers in
2008 and 2009 Presented by the Indonesian
Government Tax Office.
II. Adaro’s Strategy
21

Our Strategy to Create Long-term Value
22
Improve
efficiency of our coal supply
chain and focus
on cost control
• Our overburden
crusher and
conveyor (OPCC)
and 2x30MW mine-
mouth power plant
will be operational in
2013, creating cost
savings.
• Focus on improving
the cycle time in coal
hauling, similar to
how we reduced
barging cycle time by
more than one day.
Deepen
integration by moving
downstream into
power generation
• Full integration of
our coal supply
chain from pit to
port to power.
• Partnered with
blue chip power
utilities on
projects, including
a 2x1000MW in
Central Java and
a 2x100MW in
South Kalimantan.
Organic
growth from our current
reserve base
• Organic growth in
South Kalimantan
from our three pits of
operation.
• Focus on long-term,
reliable production
from Tutupan and
Paringin.
Increase
reserves
and diversify products, locations
and licenses
• Focus on mine
readiness for new
coal concessions
in Kalimantan and
Sumatra.
• Expect mining to
begin in 2H13 at
IMC, our coking
coal JV with BHP.

2003 2004 2005 2006
56.1
66.0
85.6122.8 119.9
159.3
208.5
225.9
299.3
331.5*
22.5
24.3
36.1
42.2
26.7
38.5
47.7
34.4
40.6
47.2
2007 2008 2009 2010 2011 2012
E5000 coal from Tutupan
E4000 coal from Wara
E5000 coal from Paringin
Overburden removed
1993 1994 1995 1996 1997 1998 1999 2000 2001 20021992
1.01.0 1.0 2.1 5.4
12.9
30.1 26.8 22.7 24.6
40.448.2
9.4
20.8
1.4
10.9
2.4
13.6
5.5
15.5
8.6
17.7
Coal production volume (Mt) and overburden stripping (Mbcm) by Adaro Indonesia at its South Kalimantan concession mines
Proven Track Record of Production Growth
23
Units
2013
Guidance
2012
Actual
2011
Actual
2010
Actual
Production volume Mt 50 – 53 47.2 47.7 42.2
E5000 Mt 37 39.5 42.3 39.7
E4700 Mt 8 n.a. n.a. n.a.
E4000 Mt 8 7.6 5.4 2.5
Strip ratio bcm/tonne 5.75 6.4 5.9 5.5

Improving Efficiency and Cost Control
24
MSW steam turbine generator buildings Barge loading at Kelanis River Terminal
Adaro has consistently engaged in cost-reduction projects, including sealing the haul road,
dredging the Barito River channel and pioneering the Taboneo offshore anchorage
Engineering works for overburden conveyor
Project Purpose Budget Spend to 1H13 Completion
Overburden Crusher
Conveyor (OPCC)
Transport 34 Mbcm of
overburden annually
US$240m US$219.8m 2013
Mine-mouth Power Plant
2 x 30MW
Power operations in
S Kalimantan and our OPCC
US$160m US$169m 2013
Kelanis River Terminal Expand our capacity to 70 Mt
from 55 Mt
US$55m US$45.6m 2013
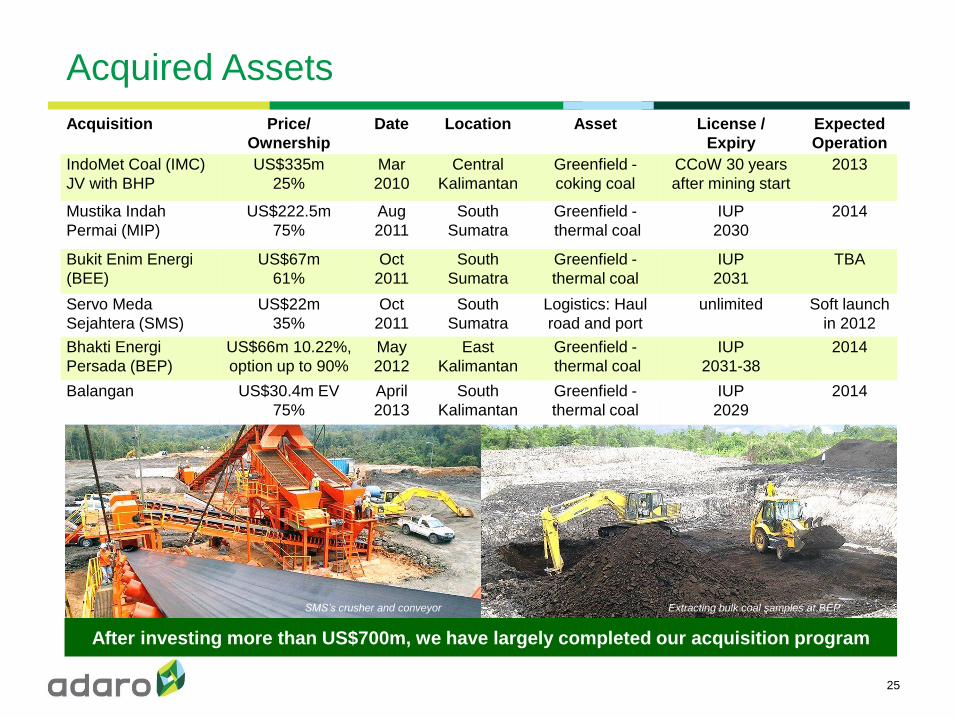
Acquired Assets
25
Acquisition Price/
Ownership
Date Location Asset License /
Expiry
Expected
Operation
IndoMet Coal (IMC)
JV with BHP
US$335m
25%
Mar
2010
Central
Kalimantan
Greenfield -
coking coal
CCoW 30 years
after mining start
2013
Mustika Indah
Permai (MIP)
US$222.5m
75%
Aug
2011
South
Sumatra
Greenfield -
thermal coal
IUP
2030
2014
Bukit Enim Energi
(BEE)
US$67m
61%
Oct
2011
South
Sumatra
Greenfield -
thermal coal
IUP
2031
TBA
Servo Meda
Sejahtera (SMS)
US$22m
35%
Oct
2011
South
Sumatra
Logistics: Haul
road and port
unlimited Soft launch
in 2012
Bhakti Energi
Persada (BEP)
US$66m 10.22%,
option up to 90%
May
2012
East
Kalimantan
Greenfield -
thermal coal
IUP
2031-38
2014
Balangan US$30.4m EV
75%
April
2013
South
Kalimantan
Greenfield -
thermal coal
IUP
2029
2014
After investing more than US$700m, we have largely completed our acquisition program
SMS’s crusher and conveyor Extracting bulk coal samples at BEP

Balangan Acquisition
26
Purchased 75% for US$30.4
million enterprise value in 1Q13
• Strategically located 11 km
southeast from Adaro’s
concession in S. Kalimantan
• Initial capex plan to get up
and running is US$15 million
and will use our contractor
SIS for mining services
• We expect the project to
begin production in 2014 with
future potential of up to 8 Mt
per year
Total (Mt)
Total
Moisture %
Ash %
(GAR)
Total Sulfur %
(GAR)
Calorific Value
(kcal/kg, GAR)
Resources 172.3 31.9 1.9 .08 4,436
JORC Compliant Coal Resources and Reserves (Millions of ROM Tonnes)

Deepen Integration by Moving into Power
27
Bhimasena Power
2 x 1000 MW
South Kalimantan
2 x 100 MW
Stake Acquired 34% 65%
Partner(s) J-Power (34%) and Itochu (32%) Korea EWP (35%)
Location Central Java South Kalimantan
Rationale
• Commercially and financially attractive with solid IRR and low-cost
long-term project financing
• Creates a new captive market and helps meet our DMO
• Helps to lessen volatility in Adaro’s business model
• Contributes to the development of our country’s energy needs
Development Progress • Signed 25 years PPA with PLN
• Total Capex: US$4 billion
• Consortium announced as
the sole qualified bidder
• PPA pending signing
Financing Combination of ECA and commercial loan
Expected Debt vs. Equity 80:20 75:25
Diversify and Secure Predictable Long-term Demand for Our Coal
III. Industry Outlook
28
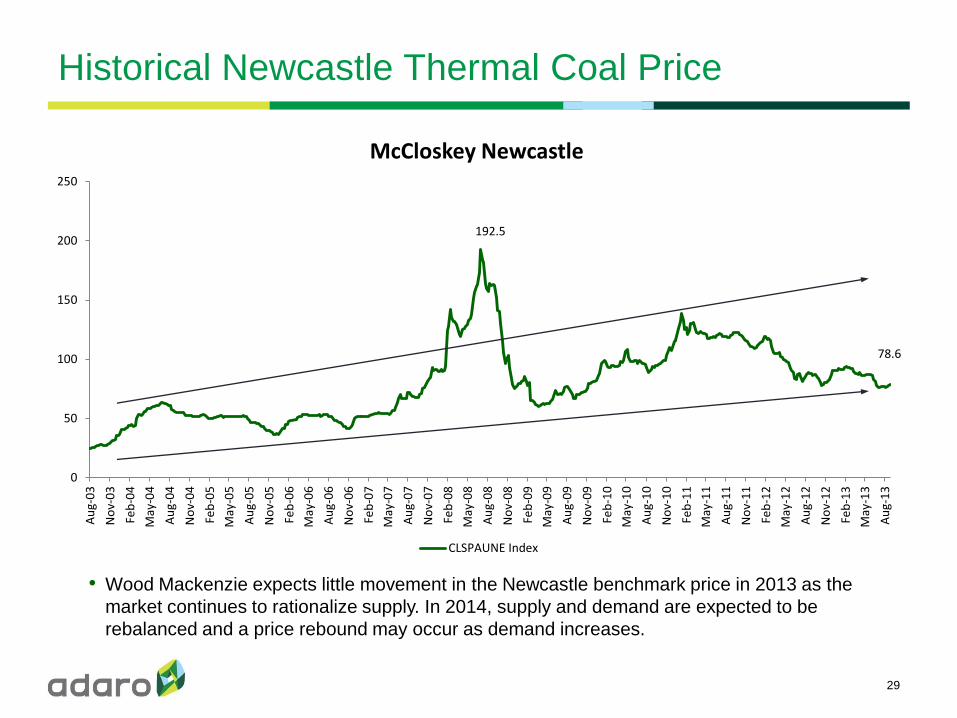
Historical Newcastle Thermal Coal Price
• Wood Mackenzie expects little movement in the Newcastle benchmark price in 2013 as the
market continues to rationalize supply. In 2014, supply and demand are expected to be
rebalanced and a price rebound may occur as demand increases.
29
192.5
78.6
0
50
100
150
200
250
Au
g-0
3
No
v-0
3
Feb
-04
May
-04
Au
g-0
4
No
v-0
4
Feb
-05
May
-05
Au
g-0
5
No
v-0
5
Feb
-06
May
-06
Au
g-0
6
No
v-0
6
Feb
-07
May
-07
Au
g-0
7
No
v-0
7
Feb
-08
May
-08
Au
g-0
8
No
v-0
8
Feb
-09
May
-09
Au
g-0
9
No
v-0
9
Feb
-10
May
-10
Au
g-1
0
No
v-1
0
Feb
-11
May
-11
Au
g-1
1
No
v-1
1
Feb
-12
May
-12
Au
g-1
2
No
v-1
2
Feb
-13
May
-13
Au
g-1
3
McCloskey Newcastle
CLSPAUNE Index
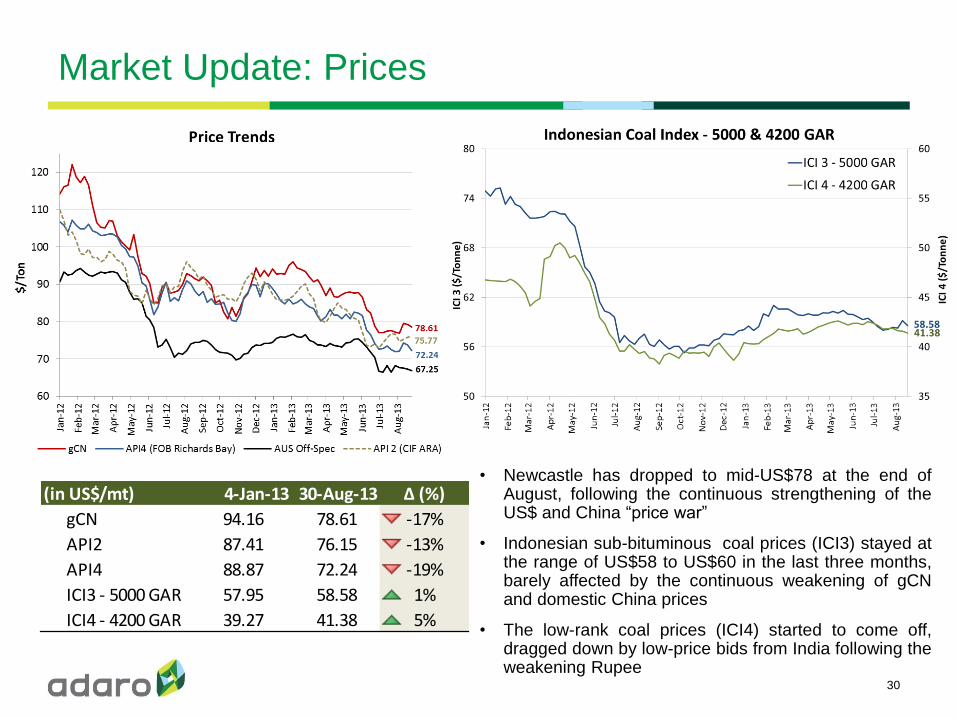
• Newcastle has dropped to mid-US$78 at the end of August, following the continuous strengthening of the US$ and China “price war”
• Indonesian sub-bituminous coal prices (ICI3) stayed at the range of US$58 to US$60 in the last three months, barely affected by the continuous weakening of gCN and domestic China prices
• The low-rank coal prices (ICI4) started to come off, dragged down by low-price bids from India following the weakening Rupee
Market Update: Prices
(in US$/mt) 4-Jan-13 30-Aug-13 ∆ (%)
gCN 94.16 78.61 -17%
API2 87.41 76.15 -13%
API4 88.87 72.24 -19%
ICI3 - 5000 GAR 57.95 58.58 1%
ICI4 - 4200 GAR 39.27 41.38 5%
30
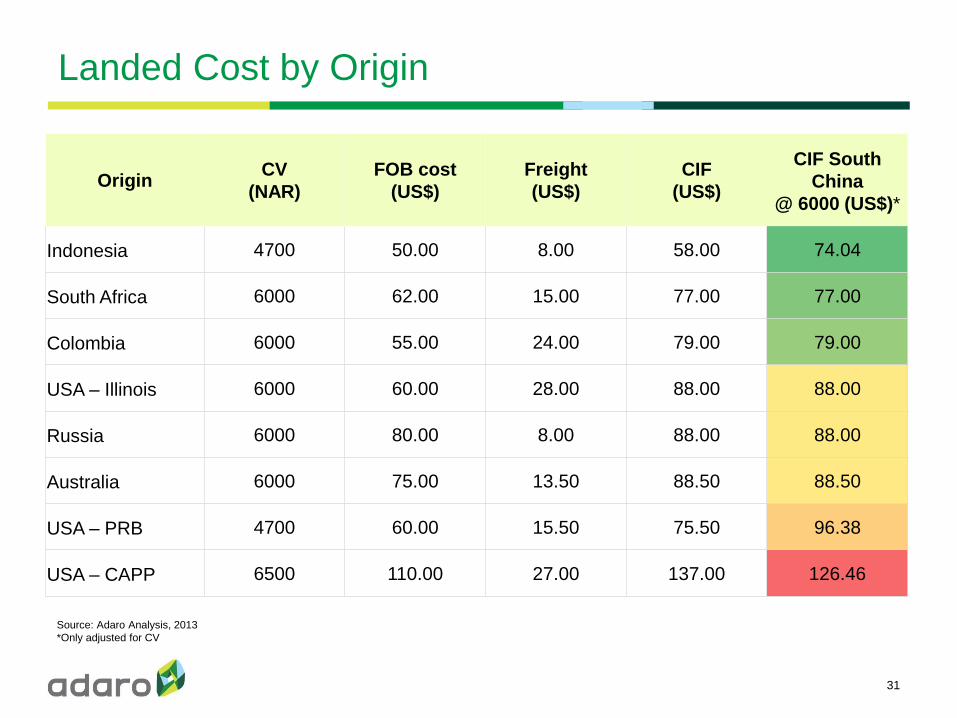
Landed Cost by Origin
31
Source: Adaro Analysis, 2013
*Only adjusted for CV
Origin CV
(NAR)
FOB cost
(US$)
Freight
(US$)
CIF
(US$)
CIF South
China
@ 6000 (US$)*
Indonesia 4700 50.00 8.00 58.00 74.04
South Africa 6000 62.00 15.00 77.00 77.00
Colombia 6000 55.00 24.00 79.00 79.00
USA – Illinois 6000 60.00 28.00 88.00 88.00
Russia 6000 80.00 8.00 88.00 88.00
Australia 6000 75.00 13.50 88.50 88.50
USA – PRB 4700 60.00 15.50 75.50 96.38
USA – CAPP 6500 110.00 27.00 137.00 126.46
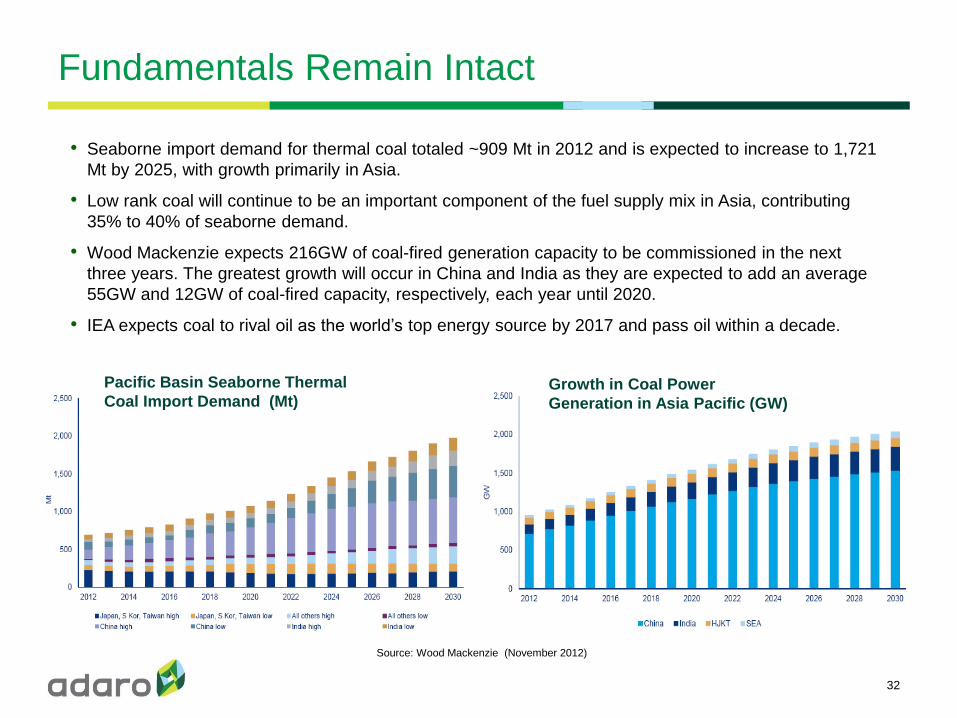
Fundamentals Remain Intact
• Seaborne import demand for thermal coal totaled ~909 Mt in 2012 and is expected to increase to 1,721
Mt by 2025, with growth primarily in Asia.
• Low rank coal will continue to be an important component of the fuel supply mix in Asia, contributing
35% to 40% of seaborne demand.
• Wood Mackenzie expects 216GW of coal-fired generation capacity to be commissioned in the next
three years. The greatest growth will occur in China and India as they are expected to add an average
55GW and 12GW of coal-fired capacity, respectively, each year until 2020.
• IEA expects coal to rival oil as the world’s top energy source by 2017 and pass oil within a decade.
32
Source: Wood Mackenzie (November 2012)
Growth in Coal Power
Generation in Asia Pacific (GW)
Pacific Basin Seaborne Thermal
Coal Import Demand (Mt)
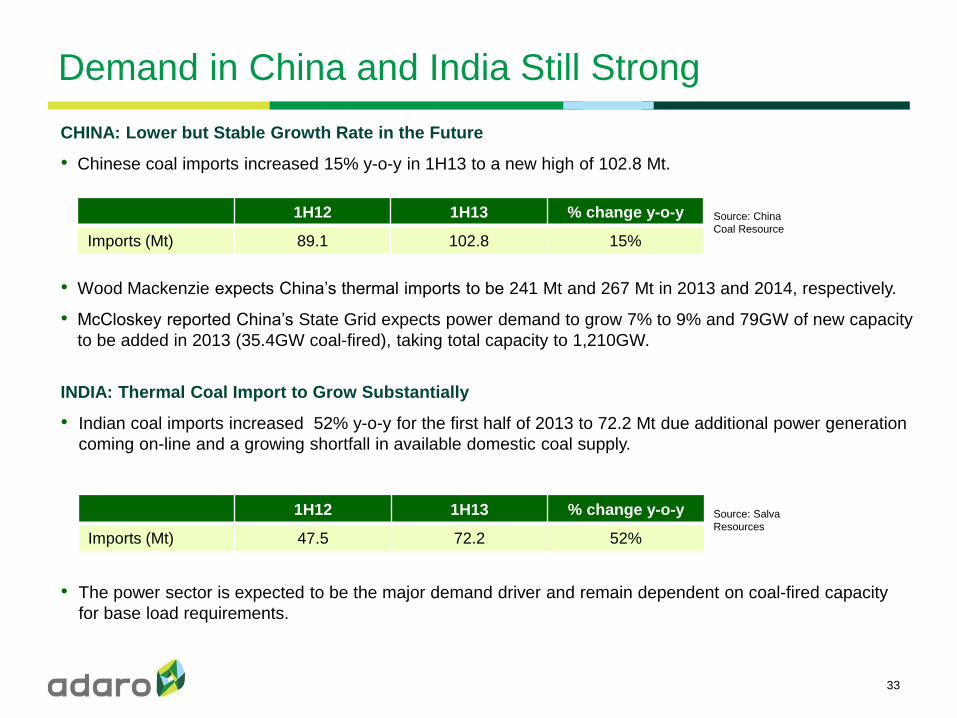
Demand in China and India Still Strong
33
CHINA: Lower but Stable Growth Rate in the Future
• Chinese coal imports increased 15% y-o-y in 1H13 to a new high of 102.8 Mt.
• Wood Mackenzie expects China’s thermal imports to be 241 Mt and 267 Mt in 2013 and 2014, respectively.
• McCloskey reported China’s State Grid expects power demand to grow 7% to 9% and 79GW of new capacity
to be added in 2013 (35.4GW coal-fired), taking total capacity to 1,210GW.
INDIA: Thermal Coal Import to Grow Substantially
• Indian coal imports increased 52% y-o-y for the first half of 2013 to 72.2 Mt due additional power generation
coming on-line and a growing shortfall in available domestic coal supply.
• The power sector is expected to be the major demand driver and remain dependent on coal-fired capacity
for base load requirements.
1H12 1H13 % change y-o-y
Imports (Mt) 89.1 102.8 15%
Source: China
Coal Resource
1H12 1H13 % change y-o-y
Imports (Mt) 47.5 72.2 52%
Source: Salva
Resources
Thank You
Delivering Positive Energy
34