ENERGY FOR CHANGE Presentation Mar 2018.pdfCoal mining, C Kalimantan E Kalimantan 65% Bhakti Energi...
25
ENERGY FOR CHANGE March 2018 1
Transcript of ENERGY FOR CHANGE Presentation Mar 2018.pdfCoal mining, C Kalimantan E Kalimantan 65% Bhakti Energi...

ENERGY FOR CHANGE
March 2018 1

Key questions:
• What is Adaro Energy guidance for 2018?
• What is the outlook for coal industry?
• What is the progress of Adaro Energy’s projects?
• What is Adaro Energy’s strategy and future plans?
2

Adaro Energy 2018 guidance
52.3
56.2
51.5
52.5
51.8
54 - 56
2013A 2014A 2015A 2016A 2017A 2018F
5.6 5.7 5.2
4.5 4.6 4.9
2013A 2014A 2015A 2016A 2017A 2018F
0.8 0.9
0.7
0.9
1.3 1.3 – 1.5
2013A 2014A 2015A 2016A 2017A 2018F
185 165 98
146
229
750 – 900
2013A 2014A 2015A 2016A 2017A 2018F
Coal production (Mt) Consolidated planned strip ratio (bcm/t)
Operational EBITDA (US$ billions) Capital expenditure (US$ million)
3
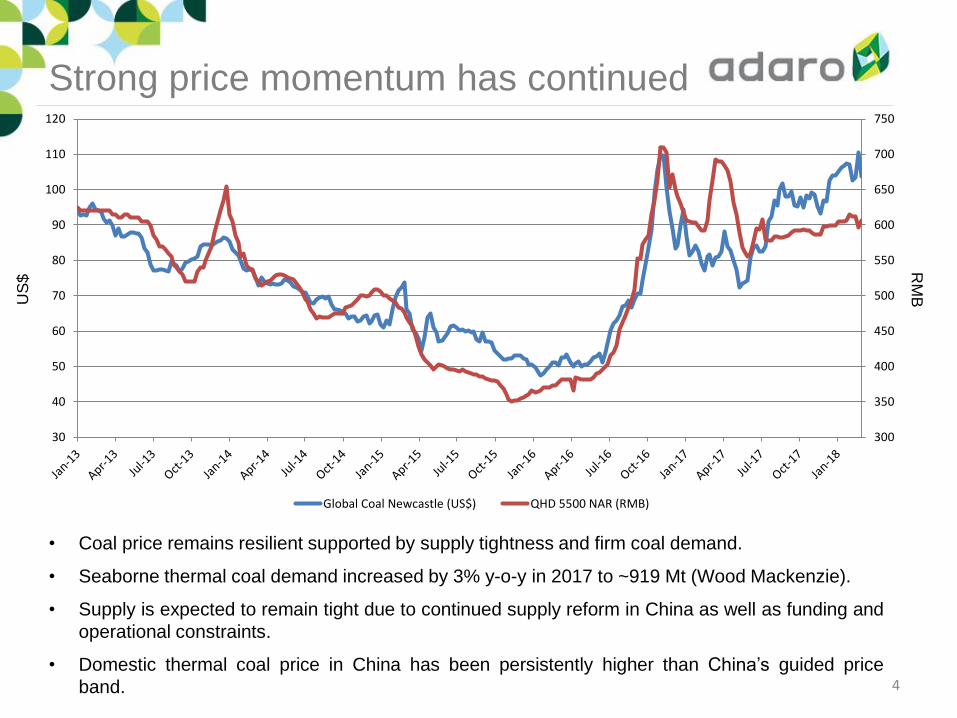
Strong price momentum has continued
US
$ R
MB
• Coal price remains resilient supported by supply tightness and firm coal demand.
• Seaborne thermal coal demand increased by 3% y-o-y in 2017 to ~919 Mt (Wood Mackenzie).
• Supply is expected to remain tight due to continued supply reform in China as well as funding and
operational constraints.
• Domestic thermal coal price in China has been persistently higher than China’s guided price
band. 4
300
350
400
450
500
550
600
650
700
750
30
40
50
60
70
80
90
100
110
120
Global Coal Newcastle (US$) QHD 5500 NAR (RMB)
Long term coal demand outlook
remains robust…
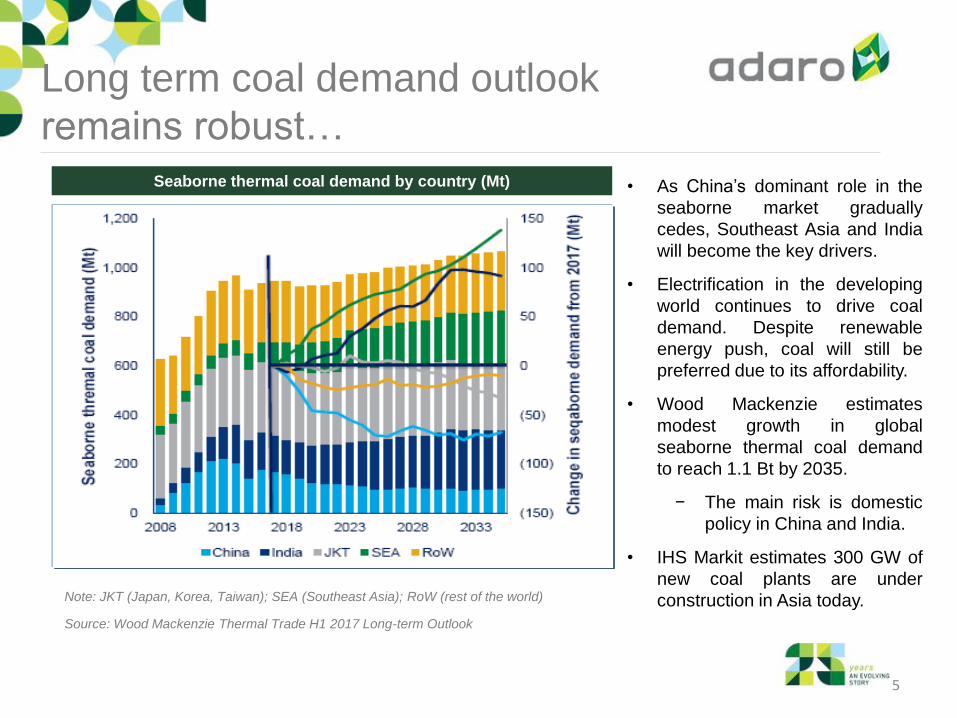
Seaborne thermal coal demand by country (Mt)
Source: Wood Mackenzie Thermal Trade H1 2017 Long-term Outlook
• As China’s dominant role in the
seaborne market gradually
cedes, Southeast Asia and India
will become the key drivers.
• Electrification in the developing
world continues to drive coal
demand. Despite renewable
energy push, coal will still be
preferred due to its affordability.
• Wood Mackenzie estimates
modest growth in global
seaborne thermal coal demand
to reach 1.1 Bt by 2035.
− The main risk is domestic
policy in China and India.
• IHS Markit estimates 300 GW of
new coal plants are under
construction in Asia today. Note: JKT (Japan, Korea, Taiwan); SEA (Southeast Asia); RoW (rest of the world)
5
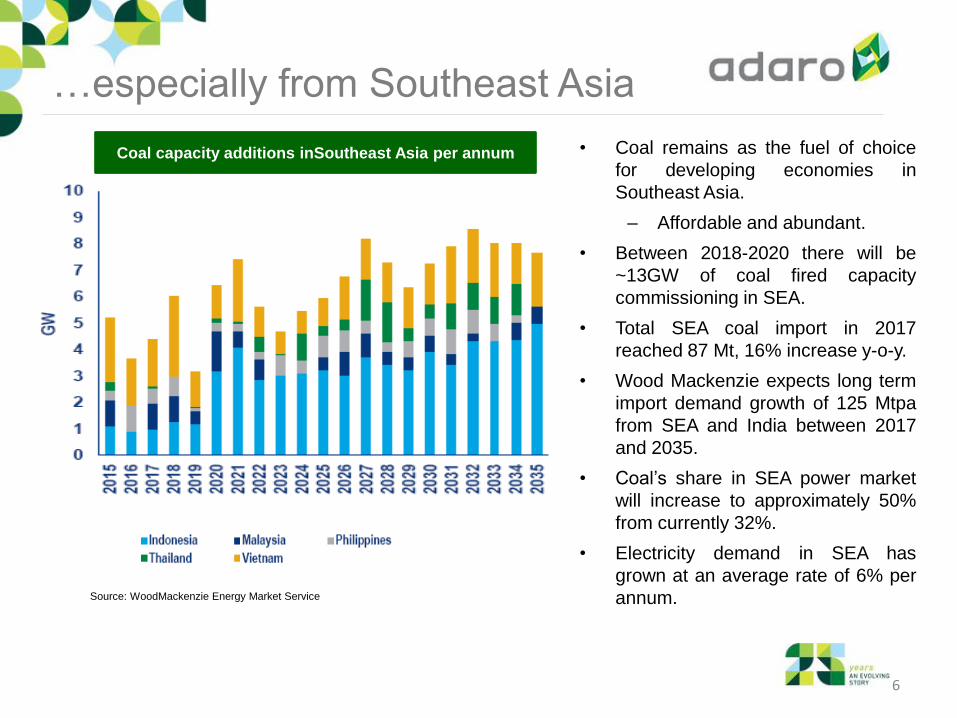
…especially from Southeast Asia
• Coal remains as the fuel of choice
for developing economies in
Southeast Asia.
– Affordable and abundant.
• Between 2018-2020 there will be
~13GW of coal fired capacity
commissioning in SEA.
• Total SEA coal import in 2017
reached 87 Mt, 16% increase y-o-y.
• Wood Mackenzie expects long term
import demand growth of 125 Mtpa
from SEA and India between 2017
and 2035.
• Coal’s share in SEA power market
will increase to approximately 50%
from currently 32%.
• Electricity demand in SEA has
grown at an average rate of 6% per
annum. Source: WoodMackenzie Energy Market Service
Coal capacity additions inSoutheast Asia per annum
6
Quick look on Indonesia
7
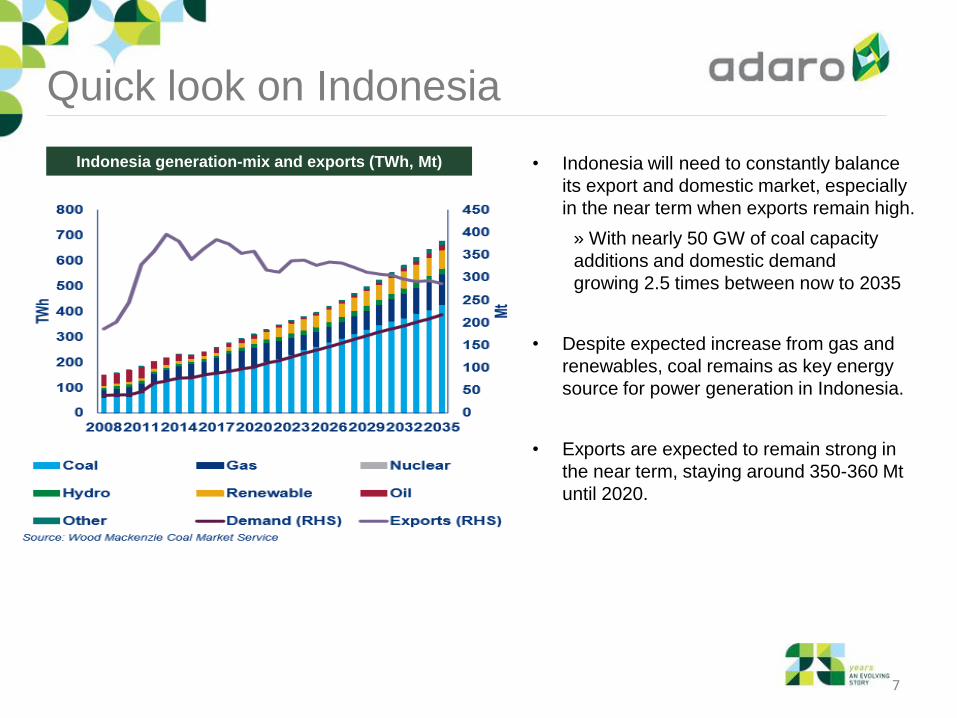
Indonesia generation-mix and exports (TWh, Mt) • Indonesia will need to constantly balance
its export and domestic market, especially
in the near term when exports remain high.
» With nearly 50 GW of coal capacity
additions and domestic demand
growing 2.5 times between now to 2035
• Despite expected increase from gas and
renewables, coal remains as key energy
source for power generation in Indonesia.
• Exports are expected to remain strong in
the near term, staying around 350-360 Mt
until 2020.

Performance of Adaro Energy 8
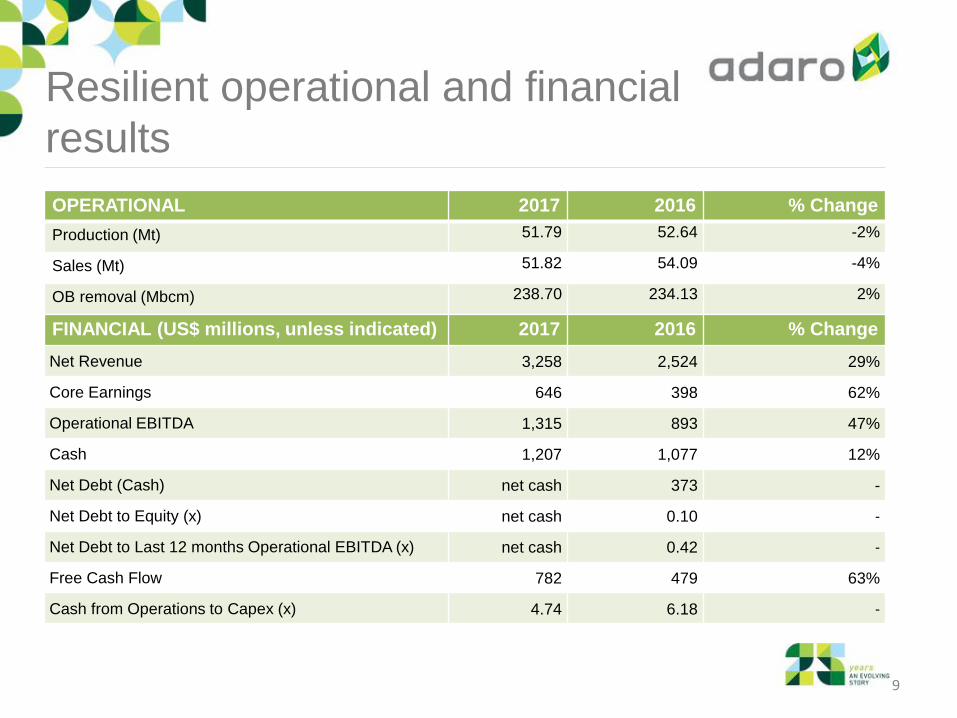
Resilient operational and financial
results
OPERATIONAL 2017 2016 % Change
Production (Mt) 51.79 52.64 -2%
Sales (Mt) 51.82 54.09 -4%
OB removal (Mbcm) 238.70 234.13 2%
FINANCIAL (US$ millions, unless indicated) 2017 2016 % Change
Net Revenue 3,258 2,524 29%
Core Earnings 646 398 62%
Operational EBITDA 1,315 893 47%
Cash 1,207 1,077 12%
Net Debt (Cash) net cash 373 -
Net Debt to Equity (x) net cash 0.10 -
Net Debt to Last 12 months Operational EBITDA (x) net cash 0.42 -
Free Cash Flow 782 479 63%
Cash from Operations to Capex (x) 4.74 6.18 -
9

Solid balance sheet and strong cash generation
Strong cash balance and free cash flow
generation Reduced debt and achieved net cash
• Discipline debt repayment, combined with higher operating cash flow enabled us to
achieve net cash position.
• Investment grade rating (BBB-) from Japan Credit Rating Agency with a POSITIVE
outlook.
0
200
400
600
800
1000
1200
1400
2012 2013 2014 2015 2016 2017
Cash (million US$) Free cash flow (million US$)
10
-0.4
0.0
0.4
0.8
1.2
1.6
2.0
-500
0
500
1,000
1,500
2,000
2,500
2012 2013 2014 2015 2016 2017
Net debt (cash) (million US$) Net debt to equity (x)
Net debt to EBITDA (x)
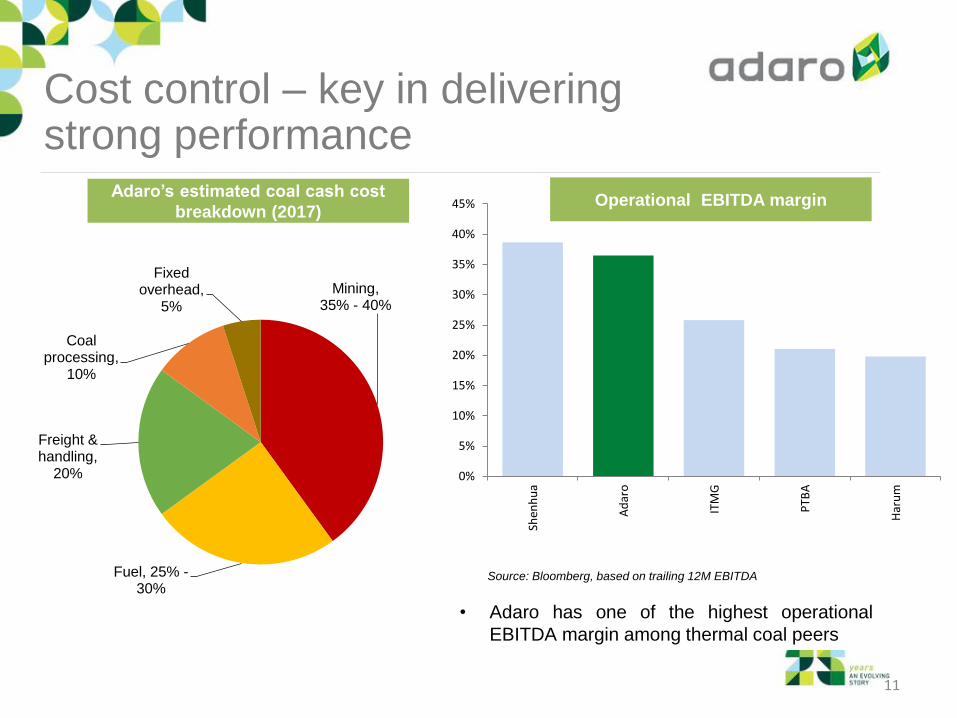
Cost control – key in delivering strong performance
Mining, 35% - 40%
Fuel, 25% - 30%
Freight & handling,
20%
Coal processing,
10%
Fixed overhead,
5%
Source: Bloomberg, based on trailing 12M EBITDA
• Adaro has one of the highest operational
EBITDA margin among thermal coal peers
0%
5%
10%
15%
20%
25%
30%
35%
40%
45%
Shen
hu
a
Ad
aro
ITM
G
PTB
A
Har
um
Adaro’s estimated coal cash cost
breakdown (2017) Operational EBITDA margin
11
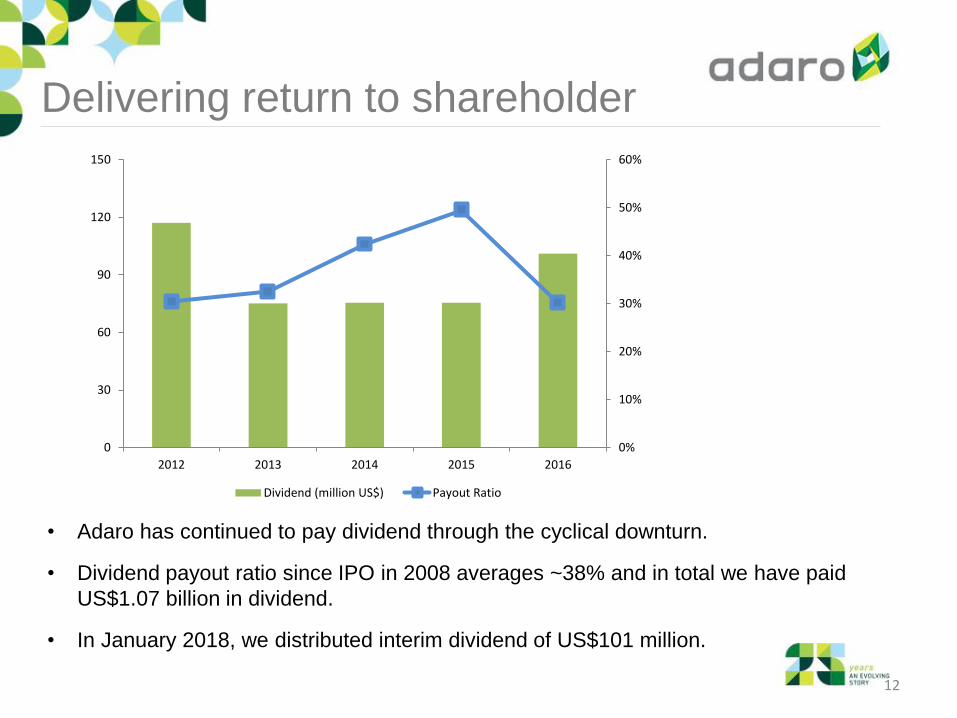
Delivering return to shareholder
• Adaro has continued to pay dividend through the cyclical downturn.
• Dividend payout ratio since IPO in 2008 averages ~38% and in total we have paid
US$1.07 billion in dividend.
• In January 2018, we distributed interim dividend of US$101 million.
0%
10%
20%
30%
40%
50%
60%
0
30
60
90
120
150
2012 2013 2014 2015 2016
Dividend (million US$) Payout Ratio
12
Snapshot of Adaro Energy 13

Business model that creates sustainable value
Adaro Indonesia (AI)
Coal mining, S Kalimantan Balangan Coal
Coal mining, S Kalimantan
Mustika Indah Permai
(MIP)
Coal mining, S Sumatra
Bukit Enim Energi (BEE)
Coal mining, S Sumatra
Adaro MetCoal (AMC),
Coal mining, C Kalimantan
E Kalimantan
Bhakti Energi
Persada (BEP)
Coal mining, E Kalimantan
88.5%
75%
75%
61%
100%
10.2%
Makmur Sejahtera
Wisesa (MSW) Operator of 2x30MW
mine-mouth power
plant in S. Kalimantan
Bhimasena Power
(BPI)
Partner in 2x1000MW
power generation
project in Central
Java
Tanjung Power
Indonesia (TPI)
Partner in 2x100MW
power plant project in
S. Kalimantan
100%
34%
65%
Adaro Mining Power
*Simplified Corporate Structure
Adaro Mining Services
Saptaindra Sejati
(SIS)
Coal mining and hauling
contractor
Jasapower Indonesia
(JPI)
Operator of overburden
crusher and conveyor
Adaro Eksplorasi
Indonesia (AEI)
Mining exploration
Adaro Mining
Technologies (AMT)
Coal research &
development
100%
100%
100%
100%
Maritim Barito
Perkasa (MBP)
Barging & shiploading
Sarana Daya
Mandiri (SDM) Dredging & maintenance
in Barito River mouth
Indonesia Multi
Purpose Terminal
(IMPT)
Port management &
terminal operator
Indonesia Bulk
Terminal (IBT)
Coal terminal & fuel
storage
100%
51.2%
100%
100%
PT Adaro Energy, Tbk (AE)
14
Adaro Logistics

Adaro Mining
15
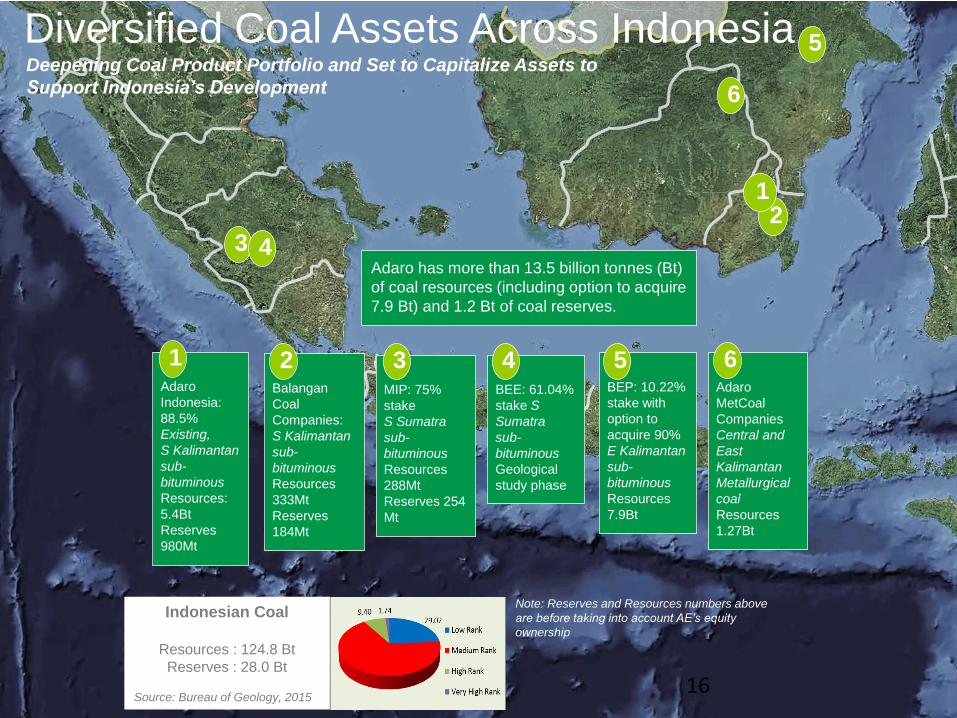
Diversified Coal Assets Across Indonesia
Indonesian Coal
Resources : 124.8 Bt
Reserves : 28.0 Bt
Source: Bureau of Geology, 2015
Adaro has more than 13.5 billion tonnes (Bt)
of coal resources (including option to acquire
7.9 Bt) and 1.2 Bt of coal reserves.
Adaro
Indonesia:
88.5%
Existing,
S Kalimantan
sub-
bituminous
Resources:
5.4Bt
Reserves
980Mt
MIP: 75%
stake
S Sumatra
sub-
bituminous
Resources
288Mt
Reserves 254
Mt
BEE: 61.04%
stake S
Sumatra
sub-
bituminous
Geological
study phase
Adaro
MetCoal
Companies
Central and
East
Kalimantan
Metallurgical
coal
Resources
1.27Bt
3 4
5
6
1 3 4 6
BEP: 10.22%
stake with
option to
acquire 90%
E Kalimantan
sub-
bituminous
Resources
7.9Bt
5
Balangan
Coal
Companies:
S Kalimantan
sub-
bituminous
Resources
333Mt
Reserves
184Mt
2
2 1
Note: Reserves and Resources numbers above
are before taking into account AE’s equity
ownership
Deepening Coal Product Portfolio and Set to Capitalize Assets to
Support Indonesia’s Development
16

Over two decades of solid production performance
Units 2018 2017 2016
Guidance Actual Actual
Production volume
Mt 54 – 56 51.8 52.6
Strip ratio bcm/tonne 4.9 4.61 4.45
• Produce low to medium heat value coal with low pollutant content, ideal for power
generation.
• Control over supply chain ensures timely delivery to customers.
• Continued focus on productivity, safety and sustainability will support value
creation for shareholder. 17
0
50
100
150
200
250
300
350
0
10
20
30
40
50
60
19
92
19
93
19
94
19
95
19
96
19
97
19
98
19
99
20
00
20
01
20
02
20
03
20
04
20
05
20
06
20
07
20
08
20
09
20
10
20
11
20
12
20
13
20
14
20
15
20
16
20
17
Overb
urd
en R
em
oval (M
bcm
)
Pro
duction (
Mt)
Adaro’s historical production
Tutupan Wara Paringin Balangan AMC Overburden Removal

Strong customer base with focus on Indonesia
Indonesia, 20%
Malaysia, 15%
China, 12%
South Korea, 11%
Japan, 10%
India, 8%
Hong Kong, 7%
Taiwan, 6%
Spain, 4%
Philippines, 3%
Others, 4%
* Others include Thailand, Singapore, New Zealand, The Netherlands and Vietnam * Others include cement, pulp & paper, and industrial
90%
10%
Power
Others
Customer type by volume (2017) Geographical breakdown of customers (2017)
• Most customers are sovereign backed power companies, with over 50% have had a
relationship for more than a decade
• Average length of coal supply agreement is 3 to 5 year.
• Many of our contracts are reset annually, with a combination of negotiated, fixed and
index-linked pricing.
• Strong relationship with many blue-chip investment-grade clients mitigates risk 18
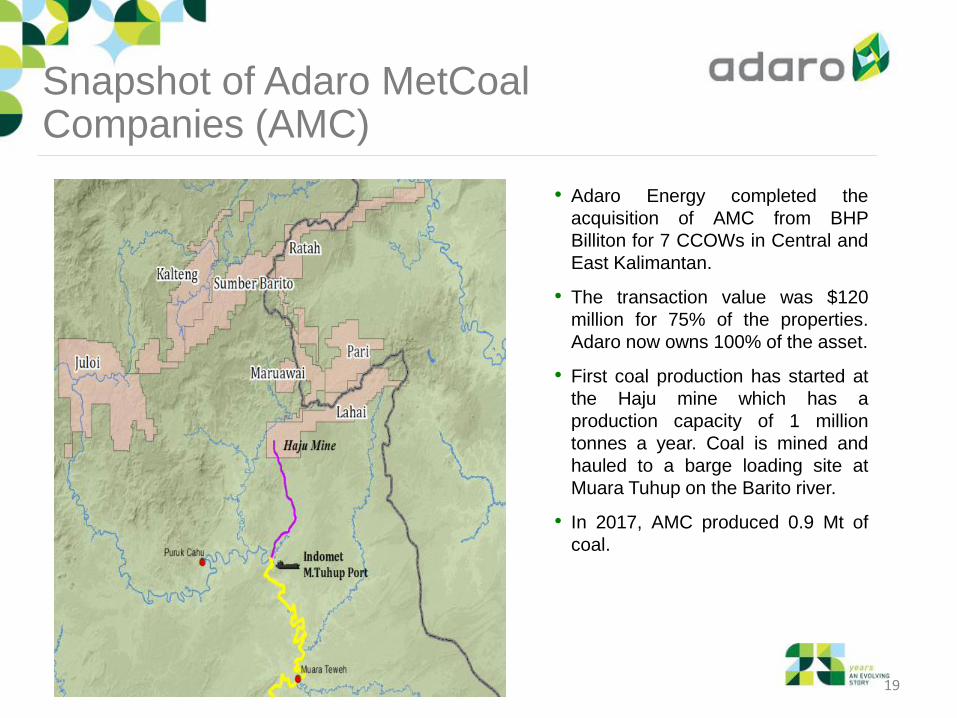
Snapshot of Adaro MetCoal Companies (AMC)
• Adaro Energy completed the
acquisition of AMC from BHP
Billiton for 7 CCOWs in Central and
East Kalimantan.
• The transaction value was $120
million for 75% of the properties.
Adaro now owns 100% of the asset.
• First coal production has started at
the Haju mine which has a
production capacity of 1 million
tonnes a year. Coal is mined and
hauled to a barge loading site at
Muara Tuhup on the Barito river.
• In 2017, AMC produced 0.9 Mt of
coal.
19
Adaro Services
and Logistics
20

Ensuring operational excellence Strengthens Adaro’s Earnings Profile as Contribution to Parent Co Increases
• Key part of our vertical integration.
• Ensures operational excellence,
productivity improvement and timely
reliable delivery to customers.
• Non coal mining business accounted
for 20% of Adaro Energy EBITDA in
2017. This contribution is expected to
grow going forward.
• Actively pursue third-party revenue
growth from these businesses.
21

Adaro Power
22

Building the foundation of Adaro’s future
Bhimasena Power Indonesia Tanjung Power Indonesia
Capacity 2x1000 MW 2x100 MW
Stake
Acquired 34% 65%
Partner(s) J-Power (34%), Itochu (32%) Korea EWP (35%)
Location Central Java South Kalimantan
Development
Progress
• Signed 25 years PPA with PLN
• Total Capex: US$4.2 billion
• Concluded financing close on June 6th, 2016.
• Expected COD: 2020
• Expected coal requirement: 7 Mtpa
• Signed PPA with PLN
• Total Capex: $545 million
• Concluded financing close in Jan 2017
• Expected COD: 2019
• Expected coal requirement: 1 Mtpa
Financing Non-recourse project debt financing.
Combination of ECA and commercial loan
Non-recourse project debt financing.
Combination of ECA and commercial loan
Debt vs.
Equity 80:20 75:25
• Commercially and financially attractive with solid IRR and low-cost long-term project financing.
• Creates captive demand for Adaro’s coal and helps meet our domestic market obligation.
• Provides a stable revenue stream and helps to lessen volatility in Adaro’s business model.
• Contributes to the development of Indonesia’s energy needs.
• Extending beyond coal to gas and renewables to replicate Indonesia’s energy mix. 23

Conclusions and takeaways
• Coal market is poised towards supply and demand balance.
• Indonesia to lessen coal export and focus on the domestic market.
• Long term fundamental for coal remains promising.
- Indonesia, Southeast Asia and India will be the main drivers.
• Our resilient business model is geared up to take the opportunity.
- Multiple opportunities across the value chain.
- Each engine of growth is expected to grow along with the
growth of coal fired power generations in Indonesia and
Southeast Asia.
• Adaro’s financials is the strongest in its history.
- Discipline debt repayment and strong cash flow generation
enabled us to achieve net cash position in 2017.
24

Thank you
This presentation is also available at http://www.adaro.com/pages/read/10/45/Presentation 25